netalyzr: illuminating edge network and performance …€ international computer science...
TRANSCRIPT

†International Computer Science Institute, 1947 Center St., Ste. 600, Berkeley, CA 94704 * Helsinki Institute for Information Technology, PO Box 19800, 00076 Aalto, Finland This work was partially supported by funding provided to ICSI through National Science Foundation grants CNS: 0722035 (“Architectural Support for Network Trouble‐Shooting”), NSF: 0433702 (“CCIED: Center for Internet Epidemiology and Defenses”), and CNS: 0905631 (“Invigorating Empirical Network Research via Mediated Trace Analysis”), and also by funding provided by Amazon.com. Any opinions, findings, and conclusions or recommendations expressed in this material are those of the authors or originators and do not necessarily reflect the views of the National Science Foundation. We are deeply grateful to the Netalyzr users for enabling this study and to our beta testers for the insightful comments and feedback. We would particularly like to thank Mark Allman, Paul Barford, Scott Bradner, John Brzozowski, Randy Bush, Niels Bakker, Richard Clayton, Chris Cowart, Keith Dawson, Adrian Dimcev, Holger Dreger, Brandon Enright, Kevin Fall, Carrie Gates, Andrei Gurtov, Mark Handley, Theodore Hong, Kelly Kane, Matthew Kogan, Keith Medcalf, Thomas Narten, Michael Ross, Wooter Wijngaards, and Richard Woundy.
Netalyzr: Illuminating Edge Network Neutrality, Security, and Performance
Christian Kreibich†, Nicholas Weaver†, Boris Nechaev*, and Vern Paxson†
TR‐10‐006
May 2010
Abstract
In this paper we present Netalyzr, a network measurement and debugging service that evaluates the functionality provided by people's Internet connectivity. The design aims to prove both comprehensive in terms of the properties we measure and easy to employ and understand for users with little technical background. We structure Netalyzr as a signed Java applet (which users access via their Web browser) that communicates with a suite of measurement‐specific servers. Traffic between the two then probes for a diverse set of network properties, including outbound port filtering, hidden in‐network HTTP caches, DNS manipulations, NAT behavior, path MTU issues, IPv6 support, and access‐modem buffer capacity. In addition to reporting results to the user, Netalyzr also forms the foundation for an extensive measurement of edge‐network properties. To this end, along with describing Netalyzr's architecture and system implementation, we present a detailed study of 112,000 measurement sessions that the service has recorded since we made it publicly available in June 2009.

1. INTRODUCTIONFor most Internet users, their network experience—
perceived service availability, connectivity constraints, re-sponsiveness, and reliability—is largely determined by theconfiguration and management of their edge network, i.e.,the specifics of what their Internet Service Provider (ISP)gives them in terms of Internet access. While conceptu-ally we often think of users receiving a straight-forward “bitpipe” service that transports traffic transparently, in reality amyriad of factors affect the fate of their traffic.
It then comes as no surprise that this proliferation of com-plexity constantly leads to troubleshooting headaches fornovice users and technical experts alike, leaving providersof web-based services uncertain regarding what caliber ofconnectivity their clients possess. Only a few tools exist toanalyze even specific facets of these problems, and fewerstill that people with limited technical understanding of theInternet will find usable. Similarly, the lack of such tools hasresulted in the literature containing few measurement studiesthat characterize in a comprehensive fashion the prevalenceand nature of such problems in the Internet.
In this work we seek to close this gap. We present thedesign, implementation, and evaluation of Netalyzr,1 a pub-licly available service that lets any Internet user obtain a de-tailed analysis of the operational envelope of their Internetconnectivity, serving both as a source of information for thecurious as well as an extensive troubleshooting diagnosticshould users find anything amiss with their network experi-ence. Netalyzr tests a wide array of properties of users’ In-ternet connections, starting at the network layer, including IPaddress use and translation, IPv6 support, DNS resolver fi-delity and security, TCP and UDP service reachability, prox-ying and firewalling, anti-virus intervention, content-baseddownload restrictions, content manipulation, HTTP cachingprevalence and correctness, latencies, and access-link buffer-ing.
We believe the breadth and depth of analysis Netalyzr pro-vides is unique among tools available for such measurement.In addition, as of this writing we have recorded 112,000 runsof the system from 86,000 different public IP addresses, al-lowing us to construct a large-scale picture of many facetsof Internet edge behavior. The measurements have found awide range of behavior, on occasion even revealing trafficmanipulation that the network operators themselves did notknow about. More broadly, we find chronic over-buffering oflinks, a significant inability to handle fragmentation, numer-ous incorrectly operating HTTP caches, common NXDO-MAIN wildcarding, impediments to DNSSEC deployment,poor DNS performance, and deliberate manipulation of DNSresults.
We begin by presenting Netalyzr’s architecture and im-plementation (§ 2) and the specifics of the different typesof measurements it conducts (§ 3). We have been operating
1http://netalyzr.icsi.berkeley.edu
Netalyzr publicly and continuously since June 2009, and in§ 4 report on the resulting data collection, including flashcrowds, their resulting measurement biases, and our exten-sive calibration tests to assess the correct operation of Net-alyzr’s test suite. In § 5 we present a detailed analysis of theresulting dataset and some consequences of our findings. Wedefer our main discussion of related work to § 6 in order tohave the context of the details of our measurement analysisto compare against. Finally, we summarize in § 7.
2. SYSTEM DESIGNWhen designing Netalyzr we had to strike a balance be-
tween a tool with sufficient flexibility to conduct a widerange of measurement tests, yet with a simple enough in-terface that unsophisticated users would run it—giving usaccess to a much larger (and less biased towards “techies”)end-system population than possible if the measurements re-quired the user to install privileged software. To this end,we decided to base our approach on using a Java applet todrive the bulk of the tests, since (i) Java applets run auto-matically within most major web browsers, (ii) applets canengage in raw TCP and UDP flows to arbitrary ports (thoughnot with altered IP headers), and, if the user approves trust-ing the applet, contact hosts outside the same-origin policy,(iii) Java applets come with intrinsic security guarantees forusers (e.g., no host-level file system access allowed by de-fault runtime policies), and (iv) Java’s fine-grained permis-sions model allows us to adapt gracefully if a user declinesto fully trust our applet.
The resulting system includes about 5,000 lines of Javafor the applet (as well as some JavaScript to implement theclient side of some test connections) and 12,000 lines ofPython for the different servers. Figure 1 shows the concep-tual Netalyzr architecture, whose components we now dis-cuss in turn.
Application Flow. Users initiate a test session by visit-ing the Netalyzr website and clicking Start Analysis on thewebpage with the embedded Java test applet. Once loaded,the applet conducts a large set of measurements probes, in-dicating test progress to the user. When testing completes,the applet redirects to a summary page that shows the resultsof the tests in detail and with explanations (Figure 2). Theusers can later revisit a session’s results via a permanent linkassociated with each session. We also save the session state(and server-side packet traces) for subsequent analysis.
Front- and Back-end Hosts. The Netalyzr system in-volves three distinct locations: (i) the user’s machine run-ning the test applet in a browser, (ii) the front-end machineresponsible for dispatching users and providing DNS ser-vice, and (iii) multiple back-end machines that each hostboth a copy of the applet and a full set of test servers. Allback-end machines run identical configurations and Netalyzrconducts all tests in a given client’s session using the sameback-end machine.
The front-end machine runs Linux 2.6 on a 2.5 GHz Intel
1
HTTPServer
DNSServers
LatencyServer
MTUServer
EchoServers
Storage
Front-end Back-ends
1 2 3 4 5 6 7 8
9 10 11 12 13 14 15 16
HTTPServer
DNSServer
Storage
1
4
5
2
10
6
3
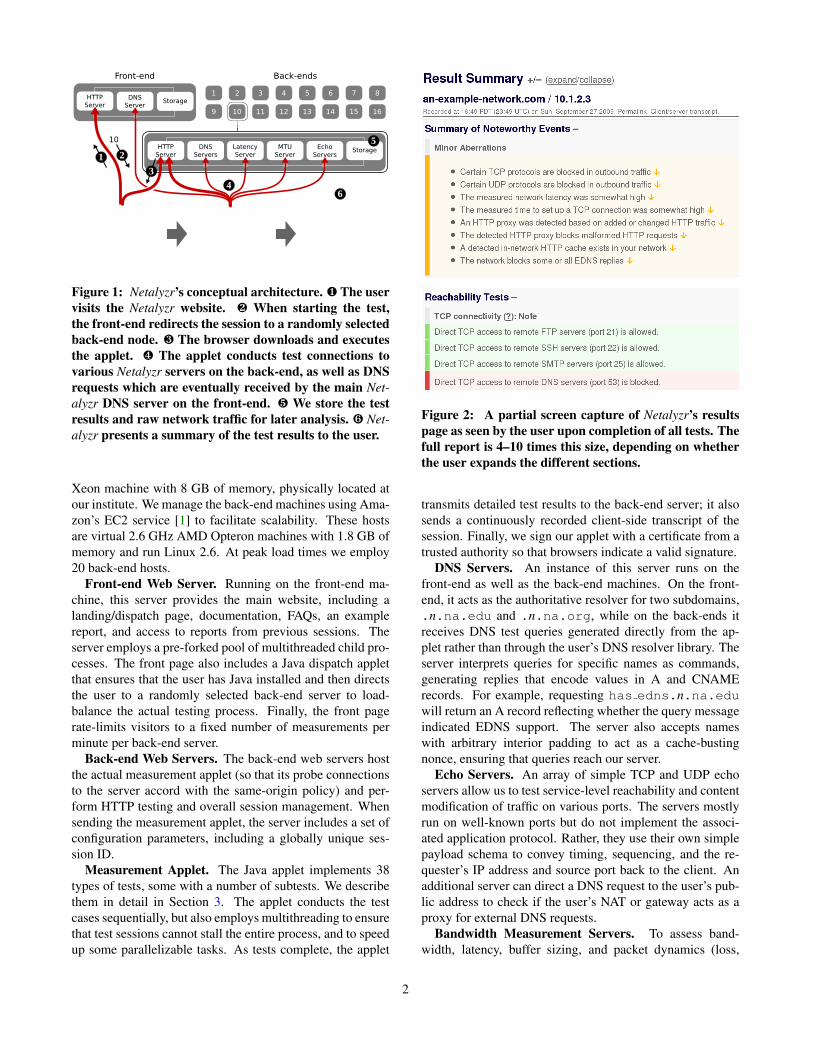
Figure 1: Netalyzr’s conceptual architecture. ¶ The uservisits the Netalyzr website. · When starting the test,the front-end redirects the session to a randomly selectedback-end node. ¸ The browser downloads and executesthe applet. ¹ The applet conducts test connections tovarious Netalyzr servers on the back-end, as well as DNSrequests which are eventually received by the main Net-alyzr DNS server on the front-end. º We store the testresults and raw network traffic for later analysis. » Net-alyzr presents a summary of the test results to the user.
Xeon machine with 8 GB of memory, physically located atour institute. We manage the back-end machines using Ama-zon’s EC2 service [1] to facilitate scalability. These hostsare virtual 2.6 GHz AMD Opteron machines with 1.8 GB ofmemory and run Linux 2.6. At peak load times we employ20 back-end hosts.
Front-end Web Server. Running on the front-end ma-chine, this server provides the main website, including alanding/dispatch page, documentation, FAQs, an examplereport, and access to reports from previous sessions. Theserver employs a pre-forked pool of multithreaded child pro-cesses. The front page also includes a Java dispatch appletthat ensures that the user has Java installed and then directsthe user to a randomly selected back-end server to load-balance the actual testing process. Finally, the front pagerate-limits visitors to a fixed number of measurements perminute per back-end server.
Back-end Web Servers. The back-end web servers hostthe actual measurement applet (so that its probe connectionsto the server accord with the same-origin policy) and per-form HTTP testing and overall session management. Whensending the measurement applet, the server includes a set ofconfiguration parameters, including a globally unique ses-sion ID.
Measurement Applet. The Java applet implements 38types of tests, some with a number of subtests. We describethem in detail in Section 3. The applet conducts the testcases sequentially, but also employs multithreading to ensurethat test sessions cannot stall the entire process, and to speedup some parallelizable tasks. As tests complete, the applet
Figure 2: A partial screen capture of Netalyzr’s resultspage as seen by the user upon completion of all tests. Thefull report is 4–10 times this size, depending on whetherthe user expands the different sections.
transmits detailed test results to the back-end server; it alsosends a continuously recorded client-side transcript of thesession. Finally, we sign our applet with a certificate from atrusted authority so that browsers indicate a valid signature.
DNS Servers. An instance of this server runs on thefront-end as well as the back-end machines. On the front-end, it acts as the authoritative resolver for two subdomains,.n.na.edu and .n.na.org, while on the back-ends itreceives DNS test queries generated directly from the ap-plet rather than through the user’s DNS resolver library. Theserver interprets queries for specific names as commands,generating replies that encode values in A and CNAMErecords. For example, requesting has edns.n.na.eduwill return an A record reflecting whether the query messageindicated EDNS support. The server also accepts nameswith arbitrary interior padding to act as a cache-bustingnonce, ensuring that queries reach our server.
Echo Servers. An array of simple TCP and UDP echoservers allow us to test service-level reachability and contentmodification of traffic on various ports. The servers mostlyrun on well-known ports but do not implement the associ-ated application protocol. Rather, they use their own simplepayload schema to convey timing, sequencing, and the re-quester’s IP address and source port back to the client. Anadditional server can direct a DNS request to the user’s pub-lic address to check if the user’s NAT or gateway acts as aproxy for external DNS requests.
Bandwidth Measurement Servers. To assess band-width, latency, buffer sizing, and packet dynamics (loss,
2

reordering, duplication) we employ dedicated UDP-basedmeasurement servers. Like the echo servers, these use a cus-tom payload schema that includes timing information, se-quence numbers, instructions regarding future sending, andaggregate counters.
Path MTU Measurement Server. To measure direc-tional path MTUs, we use a server that can capture and trans-mit raw packets, giving us full access to and control over allpacket headers.
Storage. To maintain a complete record of server-sidesession activity, we record all relevant network traffic on thefront- and back-end machines, except for the relatively high-volume bandwidth tests. Since Java applets do not have theability to record packets, we cannot record such traces on theclient side.
Session Management. The back-end web servers es-tablish and maintain session state as test sessions progress,identifying sessions via RFC 4122 UUIDs. We serializecompleted session state to disk on the back-end hosts andperiodically archive it on the front-end. When viewing a ses-sion summary, the front-end web server redirects the requestto the appropriate back-end (encoded in the session ID) if itdoes not have the state locally, and the back-end web serverdoes the opposite, with cycle detection to avoid looping.
3. MEASUREMENTS CONDUCTEDWe now describe the types of measurements Netalyzr con-
ducts and the particular methodology used. We begin withlayer 3 measurements (addressing, fragmentation, MTU,raw performance, IPv6 support) and then progress to higherlayers (general service reachability, DNS, HTTP), finishingwith a discussion of user feedback and tests we chose toomit.
3.1 Network-layer InformationAddressing. We obtain the client’s local IP address via
the Java API, and use a set of raw TCP connections and UDPflows to our echo servers to learn the client’s public address.From this set of connections we can identify the presenceof NAT, and if so how it renumbers addresses and ports. Ifacross multiple flows we observe more than one public ad-dress, then we assess whether the address flipped from oneto another—indicating the client changed networks while thetest was in progress—or alternates back and forth. This lat-ter implies either the use of load-balancing, or that the NATdoes not attempt to associate local systems with a single con-sistent public address but simply assigns new flows out of apublic address block as convenient. (Only 1% of sessionsincluded an address change from any source.)
IP Fragmentation. We test for proper support of IP frag-mentation (and also for MTU measurement; see below) bysending UDP payloads to our test servers. We first checkfor the ability to send and receive fragmented UDP data-grams. In the applet → server direction, we send a 2 KBdatagram which, if received, generates a small confirmation
response. Due to the prevalence of Ethernet framing, wewould expect most clients to send this packet in fragments,but it will always be fragmented by the time it reaches theserver. We likewise test the server → applet direction byour server transmitting (in response to a small query fromthe client) a 2 KB message to the client. This direction willdefinitely fragment, as the back-end nodes have an interfaceMTU of 1500 bytes.
If either of the directional tests fails, the applet performsbinary search to find the maximum packet size that it cansuccessfully send/receive unfragmented.
The applet also tries to send and receive packets with 1471bytes of UDP payload (normally yielding a 1499-byte IPpacket) which would maximize the payload on an Ethernetnetwork without fragmentation. This checks for the exis-tence of an “MTU hole”, where packets can be sent unfrag-mented by the endpoint but cannot be refragmented prop-erly when passing through a path MTU bottleneck, eitherbecause the bottleneck is functioning incorrectly or the hostsent the packet with DF set.
Path MTU. A related set of tests conducts path MTUprobing. The back-end server for this test supports twomodes, one for each direction. In the applet → server di-rection, the applet sends a large UDP datagram, resulting infragmentation. The server monitors arriving packets and re-ports the IP datagram size of the entire original message (ifreceived unfragmented) or of the original message’s initialresulting fragment. This represents a lower bound on MTUin the applet → server direction, since the first fragment’ssize is not necessarily the full path MTU. (Such “runts” oc-curred in only a handful of sessions).
In the server→ applet direction, the applet conducts a bi-nary search beginning with a request for 1500 bytes. Theserver responds by sending datagrams of the requested sizewith DF set. In each iteration one of three cases occurs. First,if the applet receives the DF-enabled response, its size is nomore than the path MTU. Second, if the response exceedsthe path MTU, the server processes any resulting ICMP“fragmentation required” messages and sends to the appletthe attempted message size, the offending location’s IP ad-dress, and the next-hop MTU conveyed in the ICMP mes-sage. Finally, if no messages arrive at the client, the appletinfers that the ICMP “fragmentation required” message wasnot generated or did not reach the server, and thus a pathMTU problem exists.
Latency, Bandwidth, and Buffering. We measurepacket delivery performance in terms of round-trip latencies,directional bandwidth limits, and buffer sizing. With these,our primary goal is not to measure capacity itself (which nu-merous test sites already address [31]), but as a means tomeasure the sizing of bottleneck buffers, which can signifi-cantly affect user-perceived latency. We do so by measuringthe increase in latency between quiescence and that experi-enced during the bandwidth test, which in most cases willbriefly saturate the path capacity in one direction and thus
3

fill the buffer at the bottleneck.Netalyzr conducts these measurements in two basic ways.
First, early in the measurement process it starts sending inthe background small packets at a rate of 5 Hz. We use thistest to detect transient outages, such as those due to a poorwireless signal.
Second, it conducts an explicit latency and bandwidth test.The test begins with a 10 Hz train of 200 small UDP pack-ets, for which the back-end’s responses provide the base-line mean latency used when estimating buffer sizing ef-fects. The test next sends a train of small UDP packets thatelicit 1000-byte replies, with exponentially ramping up (over10 seconds) the size in slow-start fashion: for each packetreceived, the applet sends two more. In the second half ofthe interval, the applet measures the sustained rate at whichit receives packets, as well as the average latency. (It alsonotes duplicated and reordered packets over the entire run.)After waiting 5 seconds for queues to drain, it repeats withsizes reversed, sending large packets to the server that trig-ger small responses. Note that most Java implementationswill throttle sending rates to ≤ 20 Mbps, imposing an upperbound on the speed we can measure.
IPv6 Adoption. To measure IPv6 connectivity we haveto rely on an approximation because neither our institutionnor Amazon EC2 supports IPv6. However, on JavaScript-enabled hosts the analysis page requests a small logo fromipv6.google.com, reachable only over IPv6. We reportthe outcome of this request to our HTTP server. Since wecannot prevent this test from possibly fetching a cached im-age, we could overcount IPv6 connectivity if the user’s sys-tem earlier requested the same resource (perhaps due to aprevious Netalyzr run from an IPv6-enabled network).
3.2 Service ReachabilityTo assess any restrictions the user’s connectivity may im-
pose on the types of services they can access, we attemptto connect to 25 well-known services along with a few ad-ditional ports on the back-end. For 80/tcp and 53/udpconnectivity, the applet speaks proper HTTP and DNS, re-spectively. We test all other services using our echo serverprotocol as described in Section 2.
In addition to detecting static blocking, these probes alsoallow us to measure the prevalence of proxying. In the ab-sence of a proxy, our traffic will flow unaltered and the re-sponse will include our public IP address as expected. Onthe other hand, protocol-specific proxies will often transformthis non-protocol-compliant response into an error, or sim-ply abort the connection. Such proxies can reside on the endhost (e.g., as part of an AV system) or in the network, withadditional protocol information such as banners or headersoften suggesting the source.
3.3 DNS MeasurementsNetalyzr performs extensive measurements of DNS be-
havior, since DNS manipulations and subtle errors can have
a major impact on a user’s network experience. We imple-ment two levels of measurement, restricted and unrestricted.Restricted measurements comply with Java’s default same-origin policy, which for most JVMs allows the lookup ofarbitrary names but only ever returns the IP address of theorigin server, or throws an exception if the result is not theorigin server’s address. If however the user trusts the applet,then we can look up arbitrary names through the system’sDNS resolver unrestrictedly, allowing us to conduct substan-tially more comprehensive testing. We refer to names corre-sponding to Netalyzr’s actual domain as internal, and anyothers as external. We can only look up the latter if unre-stricted.
As mentioned earlier, our DNS authority server interpretsrequests for specific names as commands telling it what sortof response to generate. We encode Boolean results by re-turning the IP address of the back-end service for true andthe address of an unrelated host in our institution for false.For results that return names, we indicate failure with thehostname return false.
In our discussion, we abbreviate the fullyqualified hostname of the back-end nodeas follows. First, n.na.edu stands fornode.netalyzr.icsi.berkeley.edu (likewisen.na.org stands for node.netalyzr.icir.org).Second, if we give only a hostname name, it standsfor name.node.netalyzr.icsi.berkeley.edu.Finally, we indicate the presence of a pseudo-random noncevalue (to ensure cache penetration) using “nonce” in thename.
Glue Policy. One important but subtle aspect of the DNSresolution process concerns the acceptance and promotionof response data in the Authoritative or Additional recordsof a response, commonly referred to as “glue” records. Ac-ceptance of such records can boost performance by avoid-ing future lookups, but also risk cache poisoning attacks [6].Assessing the acceptance of these records is commonly re-ferred to as “bailiwick checking,” but the guidelines on theprocedure allow latitude in how to conduct it [11]. Netalyzrleverages glue acceptance to enable tests of the DNS resolveritself.
We first check acceptance of arbitrary A records in theAdditional section by sending lookups of special names(made distinct with nonces) that return particular additionalA records. We then look up those additional names directlyto see whether the resolver issues new queries for the names(which would return false when those names are queried di-rectly) or answers them from its cache (returning true), in-dicating that the resolver accepted the glue. We then like-wise check for caching of Authority A records. Finally, wecheck whether the server will automatically follow CNAMEaliases. In this test, the response provides an Answer of aCNAME for return false, with an Additional recordencoding return false as true. Thus, the query eval-uates as true only if the resolver accepts the A record asso-
4

ciated with the CNAME.DNS Server Identification and Properties. We next
probe more general DNS properties, including resolver iden-tity, IPv6 support, 0x20 support [8], respect for short TTLs,port randomization for DNS requests, and whether the user’sNAT, if present, acts as a DNS proxy on its external IP ad-dress.
When able to conduct unrestricted DNS measurements,we identify the resolver’s IP address (as seen by our server)by returning it in an A record in response to a query forserver.nonce.n.na.edu. This represents the addressof the final server sending the request, not necessarily theone the client uses to generate the request. During our beta-testing we changed the applet code to conduct this querymultiple times because we observed that some hosts willshift between DNS resolvers, and some DNS resolvers ac-tually operate as clusters.
We test IPv6 AAAA support by resolvingipv6 set.nonce. We expect the resolver to requestat least an A record for this name, and if it supports IPv6then also a AAAA record. We discard the server’s reply forthe A record and then then resolve ipv6 check.nonce.When the A record request for this name arrives, the serverchecks whether it saw a AAAA request for the previousname (which might have arrived after the original A request,and thus could not have been reported initially), which itindicates by whether it returns true for the second A request.By proceeding in this fashion, we can assess resolversupport for IPv6 even if the client itself does not support it.
Queries for the name 0x20 return true if the capitalizationin a mix-cased request retains the original mix of casing.This detects non-0x20-compliant resolvers that change thecapitalization of requested names.
If the DNS resolver accepts glue records for nameservers(NS responses in Authority or Additional), we leverage thisto check whether the resolver respects short TTLs. Re-sponses to the name ttl0 or ttl1 place a glue record forreturn false in the Authoritative section with a TTLof 0 or 1 seconds, respectively. A subsequent fetch ofreturn false reveals whether the short TTLs were re-spected. (We can’t simply use A records for this test becauseboth the browser and end host may cache these records in-dependently.)
We also use lookups of glue ns.nonce to measure re-quest latency. If the DNS resolver accepts glue records,it then also looks up return false.nonce to check thelatency for a cached lookup. We repeat this process tentimes and report the mean value to the server, and also val-idate that return false.nonce was fetched from the re-solver’s cache rather than generating a new lookup.
Finally, we test DNS port randomization. For unrestrictedmeasurements, we perform queries for port.nonce, whichthe server answers by encoding in an A record the sourceport of the UDP datagram that delivered the request. Forrestricted measurements, the applet sends several queries for
dns rand set and then checks the result by a query fordns rand check, with the latter resolving as true if theports seen by our DNS server appeared non-monotone.
EDNS, DNSSEC, and actual DNS MTU. DNS resolverscan advertise the ability to receive large responses usingEDNS [29], though they might not actually be capable ofdoing so. For example, some firewalls will not pass IP frag-ments, creating a de-facto DNS MTU of 1478 bytes for Eth-ernet framing. Other firewall devices may block all DNSreplies greater than 512 bytes under the out-of-date assump-tion that DNS replies cannot be larger. While today smallreplies predominate, a lack of support for large replies posesa significant concern for DNSSEC deployment, as it will re-sult in unpredictable performance degradation when DNSreplies exceed unstated and hidden limits.
We measure the prevalence of this limitation by issuinglookups (i) to determine whether requests arrive indicatingEDNS support, (ii) to measure the DNS MTU (for unre-stricted measurements), and (iii) to check whether the re-solver requests DNSSEC records. For the first, we look uphas edns, which returns true if the request contained anEDNS OPT pseudo-record. Responses for edns mtu en-code the advertised EDNS MTU in the lower 16 bits of anA record, and wants dnssec returns true if the DO (“useDNSSEC”) flag is set in an EDNS pseudo-record.
That a DNS resolver advertises (via EDNS) the ability toreceive large responses does not guarantee that it actuallycan. We test its ability by requesting names edns mediumand edns large, padded to 1300 and 1700 bytes, respec-tively. (We pad the replies to those sizes by adding Addi-tional CNAME records.) Their arrival at the client indicatesthe resolver an indeed receive larger DNS replies.
During beta-testing we made this test more precise: theserver answers requests for ednspadding X with a re-sponse padded to exactly X bytes of DNS payload. We usethis mechanism and binary search to determine the actualmaximum supported by the resolver (whether or not it ad-vertises EDNS).
NXDOMAIN Wildcarding. Some DNS operators con-figure their resolvers to perform “NXDOMAIN wildcard-ing”, where they rewrite hostname lookups that fail with a“no such domain” error to instead return an A record forthe IP address of a web server. The presumption of suchblanket rewriting is that the original lookup reflected websurfing, and therefore returning the impostor address willlead to the subsequent HTTP traffic coming to the opera-tor’s web server, which then typically offers suggestions re-lated to the presumed intended name. Such rewriting—oftenmotivated by selling advertisements on the landing page—corrupts the web browsers’ URL auto-complete features,and, worse, breaks protocol semantics for any non-HTTPapplication looking a hostname.
If unrestricted, the applet checks for this behaviorby querying for a series of names in our own do-main namespace, and which do not exist. We first
5

look up www.nonce.com. If this yields an IP ad-dress, we have detected NXDOMAIN wildcarding, andproceed to probe the behavior in more detail, in-cluding simple transpositions (www.yahoo.cmo), othertop-level domains (www.nonce.org), non-web domains(fubar.nonce.com), and domain internal to our site(nxdomain.n.na.edu). The applet also attempts to con-tact the host returned for www.nonce.com on 80/tcp toobtain the imposed web content, which we log.
DNS proxies, NATs, and Firewalls. Another set of DNSproblems arise not due to ISP interference but misconfiguredor misguided NATs and firewalls. If the applet operates un-restricted, it conducts the following tests to probe for thesebehaviors. First, it measures DNS awareness and proxy-ing. Our servers answer requests for entropy.n.na.eduwith a CNAME encoding the response’s parameters, includ-ing the public address, UDP port, DNS transaction ID, andpresence of 0x20 encoding. The applet sends such DNSrequests directly to the back-end server, bypassing the con-figured resolver. If it observes any change in the response(e.g., a different transaction ID or public address), thenwe have found in-path DNS proxying. The applet makesanother request directly to the back-end server, now withdeliberately invalid format, to which our server generatesa similarly broken reply. If blocked, we have detected aDNS-aware middlebox that prohibits non-DNS traffic on53/udp. The applet then issues direct queries for the namesedns large and edns medium (discussed above), andnow also edns small (a 400-byte response with EDNS),to check whether the NAT or firewall has problems handlingeither EDNS replies or large DNS responses.
During beta-testing we added a series of tests for the pres-ence of DNS proxies in NAT devices. NATs often includesuch a proxy, returning via DHCP its local address to clientsas the DNS resolver location if the NAT has not yet itself ac-quired an external DNS resolver.2 Upon detecting the pres-ence of a NAT, the applet assumes the gateway’s local ad-dress is the a.b.c.1 address in the same /24 as the local IPaddress3 and sends it a query for entropy.n.na.edu.Any reply indicates with high probability that the NAT im-plements a DNS proxy. In addition, we can observe to whereit forwards the request based on the client IP address seen byour server.
During our beta-testing we became aware of the possi-bility that some in-gateway DNS resolvers act as open re-lays for the outside (i.e., for queries coming from externalsources), enabling amplification attacks [22] and other mis-chief. We thus added a test in which the the applet instructsthe back-end DNS server to send a UDP datagram contain-ing a DNS request for entropy.n.na.edu to the publicIP address of the client to see if it elicits a resulting response
2Once the NAT obtains its external DHCP lease, it then forwardsall DNS requests to the remote resolver.3 We assume this is the address, rather than probe for it, to avoidcreating any apparent scanning activity.
at our DNS server.Name Lookup Test. Finally, if unrestricted the applet
looks up a list of 70+ common names, including majorsearch engines, advertisement providers, financial institu-tions, email providers, and e-commerce sites. It uploads theresults to our server, which then performs reverse lookupsto test the forward lookups for consistency. This testing un-earthed numerous aberrations, as discussed below.
3.4 HTTP Proxying and CachingFor analyzing HTTP behavior, the applet employs two
different methods: using Java’s high-level API, or its low-level TCP sockets (for which we implement our own HTTPlogic). The first allows us to assess behavior imposed onthe user by their browser (such as proxy settings), while thelatter reflects behavior imposed by their access connectiv-ity. (For the latter we take care to achieve the same HTTP“personality” as the browser by having our server mirror thebrowser’s HTTP request headers to the applet so it can em-ulate them in subsequent low-level requests.) In general, theapplet co-ordinates measurement tasks with the server usingURL-encoded commands that instruct the server to deliverspecific kinds of content (such as cache-sensitive images),report on properties of the request (e.g., specific header val-ues), and establish and store session state.
Proxy Detection. We detect proxy configuration settingsby monitoring request and result headers, as well as theserver-perceived client address of a test connection. Dif-ferences when using the high-level API versus the socketAPI indicate the presence of a configured proxy. We firstsend a low level message with specific headers to the webserver. The server mirrors the headers back to the applet, al-lowing the applet to conduct a comparison. Added, deleted,or modified headers flag the presence of an in-path proxy. Toimprove the detectability of such proxies, we use eccentriccapitalization of header names (e.g. User-AgEnt) and ob-serve whether these arrive with the same casing. A secondtest relies on sending an invalid request method (as opposedto GET or POST). This can confuse proxies and cause themto terminate the connection. A final test sets the Host re-quest header to www.google.com instead of Netalyzr’sdomain. Some proxies use this header’s value to direct theoutgoing connection [13]. The applet monitors for unex-pected content—either Google’s HTML banner, or a 302redirect to a country-specific Google page. If seen, this rep-resents a significant security vulnerability, as such proxieswill allow Java and Flash to violate same-origin policies ar-bitrarily. However, we saw only a handful of instances ofsuch behavior.
Caching policies, Content Transcoding, and File-typeBlocking. We next test for in-network HTTP caching. Forthis testing, our server provides two test images of identicalsize (67 KB) and dimensions (512·512 pixels), but each thecolor-inverse of the other. Consecutive requests for the im-age result in alternating images returned to the applet. We
6

can thus reliably infer when the applet receives a cached im-age based on the unchanged contents (or an HTTP 304 statuscode, “Not Modified”). We conduct four such request pairs,varying the cacheability of the images via various requestand response headers, and including a unique identifier ineach request URL to ensure each session starts uncached.
The applet can also identify image transcoding or block-ing by comparing the received image’s size to the expectedone. In the post-beta codebase, the applet uploads anychanged content for off-line analysis.
Finally, we test for content-based filtering. The ap-plet downloads (i) an innocuous Windows PE executable(notepad.exe), (ii) a small MP3 file, (iii) a bencoded BitTor-rent download file (for a Linux distribution’s DVD image),and (iv) the EICAR test “virus”,4 a benign file that AV ven-dors recognize as malicious for testing purposes.
3.5 User FeedbackBecause we cannot readily measure the physical context
in which the user runs Netalyzr, we include a small, optionalquestionnaire in the results page. Some 19% of the usersprovided feedback. Of those, 57% reported using a wiredrather than a wireless network; 17% reported running Net-alyzr at work, 79% from home, 2% on public networks, and2% on “other” networks.
3.6 Intentional OmissionsWe considered several tests for inclusion but decided not
to do so for one of two reasons. First, some tests can re-sult in potentially destructive or abusive effects, particu-larly if run frequently or by multiple users. In this regardwe decided against tests to measure the NAT’s connectiontable size (which could disrupt unrelated network connec-tions purged from the table), fingerprint NATs by connect-ing to its internal web-administration interface (which mightexpose sensitive information), general scanning either lo-cally or remotely, and sustained high-bandwidth tests (suchas BitTorrent throttling, for which alternative, bandwidth-intensive tests exist [10]). Another reason to omit a testconcerns potential long-term side-effects for the users them-selves. These could occur for technical reasons (e.g., wecontribute towards possible upload/download volume caps)or legal/political ones (e.g., tests that attempt to determinewhether access to certain sites suffers from censorship). Fi-nally, we do not store tracking cookies in the user’s browsers,since we do not aim to collect mobility profiles and can man-age sessions using state on our servers.
4. DATA COLLECTIONWe began running Netalyzr publicly in June 2009 and
have kept it available continuously. We initially offeredthe service as a “beta” release (termed BETA), and for themost part did not change the operational codebase until
4http://www.eicar.org/anti_virus_test_file.htm
January 2010, when we rolled out a substantial set of ad-justments and additional tests (RELEASE). These compriseabout 68% and 32% of the measurements, respectively. Un-less otherwise specified, discussion refers to the combinationof both datsets.
Website Operation. To date we have collected 112,239sessions from 86,252 public IP addresses. The peak rateof data acquisition occurred during the June roll-out, with amaximum of 1,452 sessions in one hour. This spike resultedfrom mention of our service on several web sites. A simi-lar but smaller spike occurred during the January relaunch,resulting in a peak load of 373 sessions in one hour.
Calibration. We undertook extensive calibration of themeasurement results to build up confidence in the coherenceand meaningfulness of our data. A particular challenge inrealizing Netalyzr has been that it must operate correctly inthe presence of a wide range of failure modes. While we putextensive effort into anticipating these problems during de-velopment, subsequent calibration served as a key techniqueto validate our assumptions and learn how the tests actuallywork on a large scale. In addition, it proved highly benefi-cial to employ someone for this task who was not involved indeveloping the tests, as doing so avoided incorporating nu-merous assumptions implicitly present in the code. Finally,we emphasize the importance of capturing subtle flaws inthe data and uncovering inconsistencies that would other-wise skew the analysis results or deflate the scientific valueof the data.
We based our calibration efforts on the BETA dataset, us-ing it to identify and remedy sources of errors before begin-ning the RELEASE data collection. To do so, we assesseddata consistency individually for each of the tests mentionedin § 3. We emphasized finding missing or ambiguous valuesin test results, checking value ranges, investigating outliers,confirming that each test’s set of result variables exhibitedconsistency (e.g., examining that mutual exclusiveness washonored, or that fractions added up to a correct total), en-suring that particular variable values complied with corre-sponding preconditions (e.g., availability of raw UDP capa-bility reliably enabling certain DNS tests), and searching forsystematic errors in the data.
To our relief, this process did not uncover any major flawsin the codebase or the data. The most common problems weuncovered were ambiguity (for example, in distinguishingsilent test failures from cases when a test was not executed atall) and inaccuracies in the process of importing the data intoour session database. The RELEASE version of the codebaseonly differs from BETA in the presence of more unambigu-ous and extensive result reporting (along with the additionof new tests).
Identified Measurement Biases. A disadvantage ofwebsite-driven data collection is vulnerability to sudden re-ferral surges from specific websites—in particular if theseentail a technologically biased user population that can skewour dataset. In addition, our Java runtime requirement could
7

discourage non-technical users whose systems do not havethe runtime installed by default. It also precludes the use ofNetalyzr on many smartphone platforms. We now analyzethe extent to which our dataset contains such bias.
The five sites referring the most users to Netalyzrare: stumbleupon.com (25%), lifehacker.com (14%), slash-dot.org (13%), google.com (7%), and heise.de (7%). Thecontext of these referrals affects the number of sessions werecord for various ISPs. For example, most users arrivingfrom slashdot.org did so in the context of an article on al-leged misbehavior by Comcast’s DNS servers, likely con-tributing to making their customers the biggest share of ourusers (10.9% of our sessions originate from Comcast’s IPaddress ranges). Coverage in Germany via heise.de likelydrove visits from customers of Deutsche Telekom, account-ing for 2.6% of the sessions. We show a summary of thedominant ISPs in our dataset in Table 3 below.
The technical nature of our service introduced a “geekbias” in our dataset, which we can partially assess by us-ing the User-Agent HTTP request headers of our usersto infer browser type and operating system. Here we com-pare against published “typical” numbers [33, 34], which wegive in parentheses. 39.8% (90%) of our users ran Windows,8.1% (1.0%) used Linux, and 14.3% (5.9%) used MacOS.We find Firefox over-represented with 60.9% (28.3%) ofsessions, followed by 18.8% (59.2%) for Internet Explorer,15.6% (4.5%) for Safari, and 2.9% (1.7%) for Opera. Thisbias also extends to the choice of DNS resolver, with 12% ofusers selecting OpenDNS as their DNS provider.
While such bias is undesirable, it can be difficult to avoidin a study that requires user participation. We can at leastameliorate distortions from it because we can identify itspresence. Its primary effect concerns our characterizationsacross ISPs, where we endeavor to normalize accordingly, asdiscussed below. We also note that technically savvy usersmay be more likely to select ISPs with fewer connectivitydeficiencies, which would mean the prevalence of problemswe observe may reflect underestimates.
5. DATA ANALYSISWe now turn to an assessment of the data gathered from
Netalyzr measurements to date. In our discussion we fol-low the presentation of the different types of tests above, be-ginning with layer 3 measurements and then progressing togeneral service reachability and specifics regarding DNS andHTTP behavior.
5.1 ISP and Geographic DiversityWe estimate the ISP and location of Netalyzr users by in-
specting reverse (PTR) lookups of their public IP address,if available; or else the final Start-of-Authority record in theDNS when attempting the PTR lookup. We found these re-sults available for 97% of our sessions.
To extract a meaningful organizational name, we startedwith a database of “effective TLDs,” i.e., domains for
Figure 3: Global locations of Netalyzr runs.
which the parent is a broad, undifferentiated domain suchas gouv.fr [19], to identify the relevant name precedingthese TLDs. Given this approach, our dataset consists ofsessions from 6,868 organizations (see Table 3 below for the15 most frequent) across 182 countries, as shown in Fig-ure 3. Activity however was dominated by users in the USA(48.2%), the EU (31.3%, with Germany accounting for 9.7%and Great Britain for 7.9%), and Canada (5.4%). 10 coun-tries contributed sessions from more than 1,000 addresses,46 from more than 100, and 97 from more than 10.
5.2 Network-Layer InformationNetwork Address Translation. Unsurprisingly, we find
NATs very prevalent among Netalyzr users (90% of all ses-sions). 79% of these sessions used the 192.168/16 ad-dress range, 16% used 10/8, and 4% used 172.16/12.2% of the address-translated sessions employed some formof non-private address (either public or not allocated for pri-vate use). We did not discern any particular pattern in thesesessions or their addresses; some were quite bizarre.
Port sequencing behavior. For more recent Netalyzrruns we have tracked potential NAT port renumbering ex-plicitly, recording port numbers as seen by both the clientand the server for a batch of 10 TCP connections. Of19,510 sessions, 33% exhibit port renumbering. Of these,8.9% appear random,5 while 89.0% renumber in a strictlymonotone-increasing fashion. We find a median “spread”for this sequence (range from smallest port to largest, inclu-sively) of 10, indicating renumbering that exactly reflects thetests we generated. A number of sessions have much higherspread, however (with a mean of 102). For these we haveruled out little-endian increments (i.e., by 256 rather thanby 1) for other than a handful of sessions, but have not atthis point assessed whether sessions with higher means con-tain significant forward jumps. Such jumps could occur dueto effects other than the NAT concurrently processing addi-tional connections separate from our measurements. Identi-fying and removing these would then enable us to estimatethe level of multiplexing apparently present in the user’s ac-cess link.
5We use a Wald-Wolfowitz test with sequence threshold 4 to mea-sure randomness.
8

64Kb/s 128Kb/s 256Kb/s 512Kb/s 1Mb/s 2Mb/s 4Mb/s 8Mb/s
256Kb/s
512Kb/s
1Mb/s
2Mb/s
4Mb/s
8Mb/s
16Mb/s
Upload Bandwidth
Dow
nloa
d B
andw
idth
JPUS
SE
LTILPL
NL
SD
DZ
CZ
FICA
IT
RS
GBDE
ES
PH
BR
MX
IN
AR
BD
KR
GT
IR
256Kb/s 512Kb/s 1Mb/s 2Mb/s 4Mb/s
4Mb/s
8Mb/s
16Mb/s
comcast.net
rr.com
verizon.net
t−dialin.net
sbcglobal.net
cox.net
charter.com
qwest.net
bethere.co.uk
alicedsl.de
arcor−ip.net
bellsouth.net
telecomitalia.it
shawcable.net
btcentralplus.com
optonline.netrogers.com
telefonica.es
virginmedia.com
comcastbusiness.net
Upload Bandwidth
Dow
nloa
d B
andw
idth
Figure 4: Average up/downstream bandwidths for countries with ≥ 10 sessions (left) and the 20 most prevalent ISPs(right). Circle areas are proportional to prevalence in the dataset, and diagonal lines mark symmetric upload anddownload capacity.
IPv6. We found IPv6 support to be rare but non-negligible: 4.5% of sessions fetched the logo from ipv6.
google.com. As discussed above, this represents an upperbound due to possible caching effects.
Fragmentation. Overall, we find that fragmentation isnot as reliable as desired [16, 26]. The RELEASE includeda significant evaluation of UDP fragmentation behavior, forwhich we found 8% of the sessions unable to send 2 KBUDP packets, and likewise 8% unable to receive them.
We also found that 3% of the sessions which could send2 KB packets could not send 1500 B packets. We find that88% of these sessions come from Linux systems, stronglysuggesting the likely cause to be Linux’s arguably incorrectapplication of Path MTU discovery to UDP traffic, sendingunfragmented UDP with DF set unless the system previouslyreceived an ICMP “fragmentation required” message fromthe recipient’s path. Java, likewise, does not appear to re-transmit in the face of such ICMP feedback, instead raisingan exception which Netalyzr reports as a failure.
Regarding the path MTU from our server to the client,80% of the sessions exhibited a path MTU of 1500 B, fol-lowed by 1492 B (15%) which suggests a prevalence of PPPover Ethernet (PPPoE). We also observe small clusters at1480 B, 1476 B, 1460 B, and 1458 B, but these are rare.Only 1% reported an MTU less than 1450 bytes.
For sessions with an MTU < 1500 B, only 58% had apath that successfully sent a proper “fragmentation required”ICMP message back to our server. This finding reinforcesthat systems should avoid PMTU for UDP, and for TCPshould provide robustness in the presence of MTU blackholes [18].
Latency and Bandwidth. Figure 4 illustrates the bal-ance of upstream vs. downstream capacities for countriesand ISPs. Figure 5 shows the distribution of download band-
Download Bandwidth
Pro
babi
lity
Den
sity
64Kb/s 256Kb/s 1Mb/s 4Mb/s 16Mb/s 64Mb/s
0.0
0.2
0.4
0.6
0.8
ComcastRoadRunnerVerizon
Figure 5: PDF of download bandwidths for the threemost prominent ISPs in our dataset.
widths for particularly prominent ISPs. Two years after thestudy by Dischinger et al. [9] our results still partially matchtheirs, particularly for RoadRunner.
From the most aggregated perspective, we observed anaverage download bandwidth of 6.7 Mbps and for up-load 2.7 Mbps. We find far more symmetric band-widths for sessions that users self-reported as at work(10 Mbps/8.2 Mbps), and reported home connectionsexhibited far more asymmetry and lower bandwidth(6.3 Mbps/1.6 Mbps). Public networks exhibited less down-load bandwidth but more symmetry (3.4 Mbps/2.3 Mbps).
9

We saw less variation in the aggregate perspective for qui-escent latency. Sessions reported as run at work had an av-erage latency of 100 ms, while home networks experienced120 ms and public networks 180 ms of latency.
Network Uplink Buffering. A known problem [9] con-firmed by Netalyzr concerns the substantial over-bufferingpresent in the network, especially in end-user access devices.Netalyzr attempts to measure this by recording the amount ofdelay induced by the high-bandwidth burst of traffic once itexceeds the actual bandwidth obtained. We then infer thebuffer capacity as equal to the sustained sending rate mul-tiplied by the additional delay induced by this test. Sincethe test uses UDP, no back-off comes into play to keep thebuffer from completely filling, though we note that Netalyzrcannot determine whether the buffer did indeed actually fillto capacity.
When plotting measured upload bandwidth vs. inferredupload buffer capacity (Figure 6), several features stand out.First, we note that because we keep the test short in orderto not induce excessive load on the user’s link, sometimesNetalyzr cannot completely fill the buffer, leading to noise,which also occurs when the bandwidth is quite small (so wedo not have a good “quiescence” baseline). Next, horizontalbanding in the figure reflects commonly provided levels ofservice.
Most strikingly, we observe frequent instances of verylarge buffers. Vertical bands reflect common buffer sizes,which we find fall into powers of two, with many sessionsexhibiting buffers of 128 KB or 256 KB in size. Even with arelatively fast 8 Mbps uplink, such buffers can easily induce250 ms of additional latency during file transfers. For a notatypical 1 Mbps uplink, such buffers translate into well over1 sec queueing delays.
We can leverage the biases in our data to partially val-idate these results. By examining only Comcast cus-tomers, we would naturally expect only one or two buffersizes to predominate, due to more homogeneous hardwaredeployments—and indeed the Ruthann figure for just Com-cast manifests sizes mainly at 128 KB and 256 KB. In thisfigure, another more subtle feature stands out with the smallcluster that lies along a diagonal. Its presence suggests thata small number of customer have access modems that sizetheir buffers directly in terms of time, rather than memory.
In both plots, the scattered values above 256 KB that lackany particular power-of-two alignment suggest the possi-ble existence of other buffering processes in effect for largeUDP transfers. For example, we have observed that some ofour notebook wireless connections occasionally experiencelarger delays during this test apparently because the note-book buffers packets at the wireless interface (perhaps dueto use of ARQ) to recover from wireless congestion.
Yet even given noise introduced by other sources, the con-clusion is inescapable: over-buffering is endemic in accessdevices, and they would significantly benefit from dynami-cally sized buffers that introduce only a fixed delay before
dropping packets.Packet Duplication, Reordering, Outages, and Cor-
ruption. The bandwidth tests deliberately stress the net-work, not only to test the buffer capacity but to induce du-plication or reordering. For these tests, the bottleneck pointreceives 1000 B packets at up to 2x the maximum rate of thebottleneck. Only 1% of the uplink tests exhibited packet du-plication, while 16% included some reordering. For down-link tests, 2% exhibited duplication and 33% included re-ordering. The prevalence of reordering qualitatively matchesconsiderably older results [2]; more direct comparisons aredifficult because the inter-packet spacing in our tests varies,and reordering rates fundamentally depend on this spacing.
In addition, the RELEASE data includes the backgroundmonitoring process that enables us to check for transientoutages. We define an outage as a period with a loss of≥ 3 background test packets (sent at 5 Hz) in a row. Wefind fairly frequent outages, with 9% of sessions experienc-ing one or more such events (45% of these reflect single lossbursts, while 28% included≥ 5 bursts). These burst are gen-erally short, with 48% of sessions with losses having outages≤ 1 sec.
We also find a significant correlation between such burstsand whether the user reported use of a wireless vs. wirednetwork, with 10% of the former sessions exhibiting at leastone outage, versus only 5% of the wired sessions.
Finally, analysis of the server-side packet traces finds noinstances of TCP or IP checksum errors. We do see UDPchecksum errors at an overall rate of about 1.6 · 10−5, butthese are heavily dominated by bursts experienced by just afew systems. The presence of UDP errors but not TCP mightsuggest use of selective link-layer checksum schemes suchas UDP Lite.
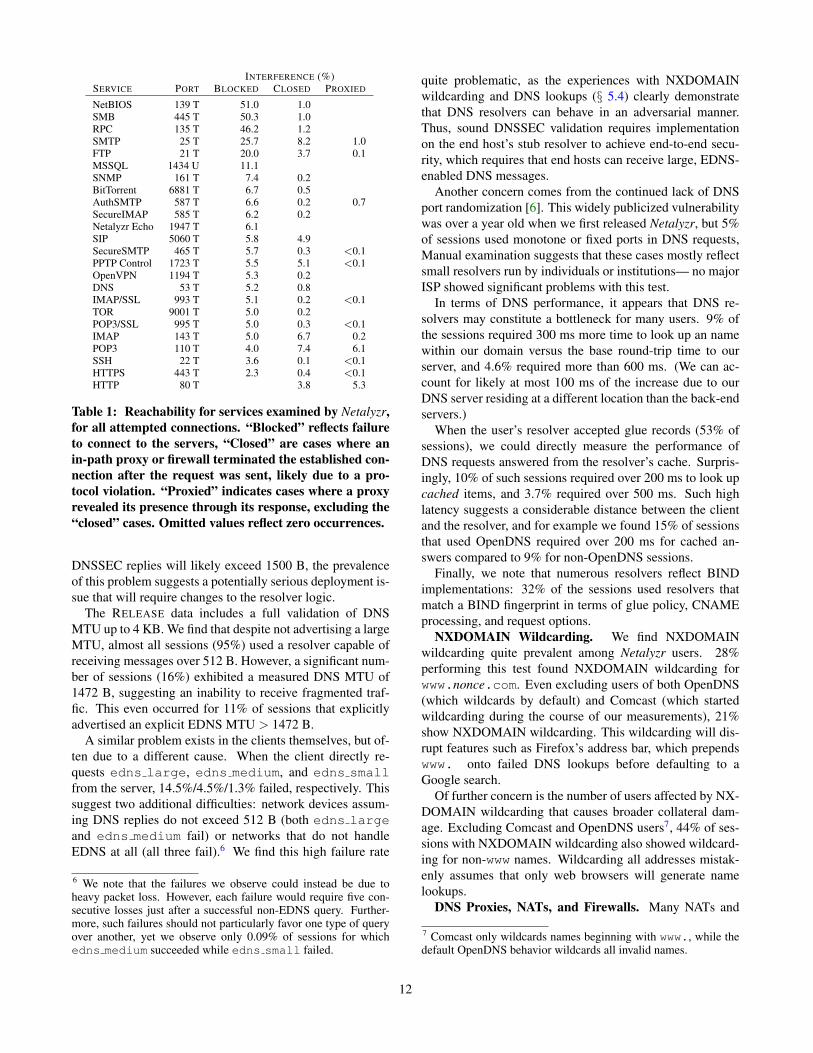
5.3 Service ReachabilityTable 1 summarizes the prevalence of service reachability
for the application ports Netalyzr measures. As explainedabove, for TCP services we can distinguish between block-ing (no successful connection), application-aware connec-tivity (established connection terminated when our server’sreply violates the protocol), and proxying (we observe al-tered requests/responses). For UDP services we cannot ingeneral distinguish the second case due to the lack of ex-plicit connection establishment.
The first four entries likely reflect ISP security policies interms of limiting exposure to services well-known for vul-nerabilities and not significantly used across the wide-area(first three) or to thwart some forms of email spam (SMTP).For this latter, the fraction of blocking in fact appears lowerthan expected, suggests that many ISPs may employ dy-namic blocking for SMTP or other methods to fight bot in-fections, rather than wholesale blocking of all SMTP.
The prevalence of blocking and termination(“BLOCKED”) for FTP, however, likely arises as an ar-tifact of NAT usage: because FTP uses a separate data
10

Inferred Buffer Capacity
Upl
oad
Ban
dwid
th
1KB 4KB 16KB 64KB 256KB 1MB 4MB
16Kb/s
64Kb/s
256Kb/s
1Mb/s
4Mb/s
16Mb/s
Inferred Buffer Capacity
Upl
oad
Ban
dwid
th
1KB 4KB 16KB 64KB 256KB 1MB 4MB
16Kb/s
64Kb/s
256Kb/s
1Mb/s
4Mb/s
16Mb/s
Figure 6: Inferred upload packet-buffer capacity (x-axis) vs. bandwidth (y-axis), for all sessions (left) and Comcast(right).
channel, many NATs implement FTP proxies, whichpresumably terminate our FTP probing when observing aprotocol violation in the response from our server.
Somewhat surprising is the prevalence of blocking for1434/udp, used by the Slammer worm of 2003. Likelythese blocks reflect legacy countermeasures that have re-mained in place for years even though Slammer no longerposes a significant threat.
The large fraction of terminated or proxied POP3 connec-tions appears due to in-host anti-virus software that attemptsto relay all email requests. In particular, we can identify al-most all of the proxying as due to AVG anti-virus becauseit alters the banner in the POP3 dialog. We expect that thelarge number of terminated IMAP connections has a similarexplanation.
We found the prevalence of terminated SIP connectionssurprising. Apparently numerous NATs and Firewalls areSIP-aware and take umbrage out our echo server’s proto-col violation. We learned that this blocking can even occurwithout the knowledge of the network administrators—a Ne-talyzr run at a large university flagged the blockage, whichcame as a surprise to the operators, who removed the restric-tion once we reported it.
Finally, services over TLS (particularly HTTPS,443/tcp) are generally unmolested in the network, asexpected given the end-to-end security properties that TLSprovides. Thus clearly if one wishes to construct a networkservice resistant to network disruption, tunneling it overover HTTPS should prove effective.
5.4 DNS MeasurementsSelected DNS Server Properties. We measured sev-
eral DNS server properties of interest, including glue policy,IPv6 queries, EDNS, and MTU. Regarding the first, mostresolvers behave conservatively, with only 22% accepting
any glue records present in the Additional field, and thoseonly doing so for records for subdomains of the authoritativeserver. Similarly, only 25% accept A records correspondingto CNAMEs contained in the reply. On the other hand, re-solvers much more readily (63%) accept glue records whenthe glue records refer to authoritative nameservers.
We find 0x20 usage scarce amongst resolvers (1.8%of sessions). However, only 4% removed capitalizationsfrom requests, which bodes well for 0x20’s deployability.Similarly, only a minuscule number of sessions incorrectlycached a 0-TTL record, and none cached a 1 sec TTL recordfor two seconds.
We quite commonly observe requests for AAAA (IPv6)records (12% of sessions), perhaps largely due to a com-mon Linux default rather than a resolver property, as 38% ofsessions with a Linux-related User-Agent requested AAAArecords.
The prevalence of EDNS and DNSSEC in requests is sig-nificant but not universal, due to BIND’s default behavior ofrequesting DNSSEC data in replies even in the absence of aconfigured root of trust. 51% of sessions used EDNS-awareDNS resolvers, with 48% of sessions DNSSEC-enabled.Most cases where we observe an advertised MTU show theBIND default of 4096 B (94%), but some other MTUs alsooccur, notably 512 B (3.4%), 2048 B (1.7%) and 1280 B(0.3%)
The prevalence of DNSSEC-enabled resolvers does notmean transition to broad use of DNSSEC will prove pain-less, however. For EDNS sessions with an advertised MTUof ≥ 1800 B, 14% failed to fetch the large EDNS-enabledreply and 2.1% for the medium-sized one. This finding sug-gests a common failure where the DNS resolver is connectedthrough a network that either won’t carry fragmented UDPtraffic or assumes that DNS replies never exceed 1500 B(since edns medium is unlikely to be fragmented). Since
11
INTERFERENCE (%)SERVICE PORT BLOCKED CLOSED PROXIED
NetBIOS 139 T 51.0 1.0SMB 445 T 50.3 1.0RPC 135 T 46.2 1.2SMTP 25 T 25.7 8.2 1.0FTP 21 T 20.0 3.7 0.1MSSQL 1434 U 11.1SNMP 161 T 7.4 0.2BitTorrent 6881 T 6.7 0.5AuthSMTP 587 T 6.6 0.2 0.7SecureIMAP 585 T 6.2 0.2Netalyzr Echo 1947 T 6.1SIP 5060 T 5.8 4.9SecureSMTP 465 T 5.7 0.3 <0.1PPTP Control 1723 T 5.5 5.1 <0.1OpenVPN 1194 T 5.3 0.2DNS 53 T 5.2 0.8IMAP/SSL 993 T 5.1 0.2 <0.1TOR 9001 T 5.0 0.2POP3/SSL 995 T 5.0 0.3 <0.1IMAP 143 T 5.0 6.7 0.2POP3 110 T 4.0 7.4 6.1SSH 22 T 3.6 0.1 <0.1HTTPS 443 T 2.3 0.4 <0.1HTTP 80 T 3.8 5.3
Table 1: Reachability for services examined by Netalyzr,for all attempted connections. “Blocked” reflects failureto connect to the servers, “Closed” are cases where anin-path proxy or firewall terminated the established con-nection after the request was sent, likely due to a pro-tocol violation. “Proxied” indicates cases where a proxyrevealed its presence through its response, excluding the“closed” cases. Omitted values reflect zero occurrences.
DNSSEC replies will likely exceed 1500 B, the prevalenceof this problem suggests a potentially serious deployment is-sue that will require changes to the resolver logic.
The RELEASE data includes a full validation of DNSMTU up to 4 KB. We find that despite not advertising a largeMTU, almost all sessions (95%) used a resolver capable ofreceiving messages over 512 B. However, a significant num-ber of sessions (16%) exhibited a measured DNS MTU of1472 B, suggesting an inability to receive fragmented traf-fic. This even occurred for 11% of sessions that explicitlyadvertised an explicit EDNS MTU > 1472 B.
A similar problem exists in the clients themselves, but of-ten due to a different cause. When the client directly re-quests edns large, edns medium, and edns smallfrom the server, 14.5%/4.5%/1.3% failed, respectively. Thissuggest two additional difficulties: network devices assum-ing DNS replies do not exceed 512 B (both edns largeand edns medium fail) or networks that do not handleEDNS at all (all three fail).6 We find this high failure rate
6 We note that the failures we observe could instead be due toheavy packet loss. However, each failure would require five con-secutive losses just after a successful non-EDNS query. Further-more, such failures should not particularly favor one type of queryover another, yet we observe only 0.09% of sessions for whichedns medium succeeded while edns small failed.
quite problematic, as the experiences with NXDOMAINwildcarding and DNS lookups (§ 5.4) clearly demonstratethat DNS resolvers can behave in an adversarial manner.Thus, sound DNSSEC validation requires implementationon the end host’s stub resolver to achieve end-to-end secu-rity, which requires that end hosts can receive large, EDNS-enabled DNS messages.
Another concern comes from the continued lack of DNSport randomization [6]. This widely publicized vulnerabilitywas over a year old when we first released Netalyzr, but 5%of sessions used monotone or fixed ports in DNS requests,Manual examination suggests that these cases mostly reflectsmall resolvers run by individuals or institutions— no majorISP showed significant problems with this test.
In terms of DNS performance, it appears that DNS re-solvers may constitute a bottleneck for many users. 9% ofthe sessions required 300 ms more time to look up an namewithin our domain versus the base round-trip time to ourserver, and 4.6% required more than 600 ms. (We can ac-count for likely at most 100 ms of the increase due to ourDNS server residing at a different location than the back-endservers.)
When the user’s resolver accepted glue records (53% ofsessions), we could directly measure the performance ofDNS requests answered from the resolver’s cache. Surpris-ingly, 10% of such sessions required over 200 ms to look upcached items, and 3.7% required over 500 ms. Such highlatency suggests a considerable distance between the clientand the resolver, and for example we found 15% of sessionsthat used OpenDNS required over 200 ms for cached an-swers compared to 9% for non-OpenDNS sessions.
Finally, we note that numerous resolvers reflect BINDimplementations: 32% of the sessions used resolvers thatmatch a BIND fingerprint in terms of glue policy, CNAMEprocessing, and request options.
NXDOMAIN Wildcarding. We find NXDOMAINwildcarding quite prevalent among Netalyzr users. 28%performing this test found NXDOMAIN wildcarding forwww.nonce.com. Even excluding users of both OpenDNS(which wildcards by default) and Comcast (which startedwildcarding during the course of our measurements), 21%show NXDOMAIN wildcarding. This wildcarding will dis-rupt features such as Firefox’s address bar, which prependswww. onto failed DNS lookups before defaulting to aGoogle search.
Of further concern is the number of users affected by NX-DOMAIN wildcarding that causes broader collateral dam-age. Excluding Comcast and OpenDNS users7, 44% of ses-sions with NXDOMAIN wildcarding also showed wildcard-ing for non-www names. Wildcarding all addresses mistak-enly assumes that only web browsers will generate namelookups.
DNS Proxies, NATs, and Firewalls. Many NATs and
7 Comcast only wildcards names beginning with www., while thedefault OpenDNS behavior wildcards all invalid names.
12

ALL LOOKUPS (%) OPENDNS (%)DOMAIN FAILED BLOCKED FAILED CHANGED
www.nationwide. 2.3 <0.01 1.6 0.01co.ukad.doubleclick.net 1.5 1.99 1.6 1.27www.citibank.com 1.3 <0.01 0.9 0.03windowsupdate. 0.7 0.02 0.5 0.01microsoft.comwww.microsoft.com 0.7 <0.01 0.4 0.01mail.yahoo.com 0.6 0.02 0.4 0.17mail.google.com 0.4 0.02 0.3 0.13www.paypal.com 0.4 0.04 0.1 0.03www.google.com 0.3 0.01 0.2 76.71www.meebo.com 0.3 0.03 0.2 0.79
Table 2: Reliability of DNS lookups for 10 selectednames (reflecting 107,000 sessions, 11,000 of which usedOpenDNS).
firewalls are DNS-aware and may act as DNS proxies. Al-though we find 99% able to perform direct DNS queries,11% of these sessions show evidence of a DNS-aware net-work device, where a non-DNS test message destined for53/udp failed (but proper DNS messages succeeded). Farfewer networks contain mandatory DNS proxies, with only1.2% of DNS-capable sessions indicating such in the formof changed DNS transaction ID.
Although most NATs don’t automatically proxy DNS,most contain DNS proxies. We found 67% of the NATswould forward a DNS request to the server (with this mea-surement restricted to the cases where Netalyzr correctlyguessed the gateway IP address). Of these, only 1.8% ofthe sessions contained their own recursive resolver, ratherthan forwarding the request to a different recursive re-solver. Finally, although rare the number of NATs providingopen DNS resolution externally accessible is still significant.When queried by our server, 4.4% of the NATed sessionsforwarded the query to our DNS servers. Such systems canbe used both for DNS amplification attacks and to probe theISP’s resolver.
DNS Reliability of Important Names. DNS lookups canfail for a variety of reasons, including an unreliable localnetwork, problems in the DNS resolver infrastructure, andfailures in the DNS authorities or paths between the resolverand authority. Table 2 characterizes some failure modes for10 common domain names. For general lookups, “failure”reflects a negative result or an exception returned to the ap-plet by InetAddress.getByName(), or a 20 sec time-out expiring. “Blocked” denotes the return of an obviouslyinvalid address (such as a loopback address).
We explored reliability for OpenDNS users in more de-tail. OpenDNS not only performs NXDOMAIN wildcard-ing, but also wildcards SERVFAIL (for the latter, return-ing the IP address of hit-servfail.opendns.com).Thus for queries generated by OpenDNS users we can dis-tinguish between failures which occur between the clientand OpenDNS, and server failures due to problems betweenOpenDNS and the DNS authority for the domain. OpenDNS
also includes powerful features to change other names. Forwww.google.com, OpenDNS will act as a proxy by de-fault, redirecting users transparently through an OpenDNSserver. For other domains, OpenDNS allows users or do-main administrators to block “undesirable” names, withOpenDNS instead returning the address of various blockingservers.
Some behavior immediately stands out. First, regardlessof resolver, we observe significant unreliability of DNS tothe client, due to packet loss and other issues. Caching alsohelps, as highly popular names have a failure rate substan-tially less than that for less common names. For example,compare the failure rate of www.nationwide.co.uk tothat of mail.google.com, for which we presume re-solvers will have the latter cached significantly more often.
Second, we observe high reliability for the DNS authori-ties of the names we tested. Only 14 sessions had OpenDNSreturning the SERVFAIL wildcard in response to a legiti-mate query. (One such session showed many names failingto resolve, obviously due to a problem with OpenDNS’s re-solver rather than the authority servers.)
Third, we can see the acceptance of DNS as a toolfor network management and control. All but thewww.google.com case for OpenDNS represent useror site-admin configured redirections. For domains likemail.yahoo, the common change is to return a pri-vate Internet address, most likely configured in the institu-tion’s DNS server, while blocking of ad.doubleclickcommonly uses nonsense addresses (such as 0.0.0.0),which may reflect resolution directly from the user’s hostsfile (as suggested on some forum discussions on blockingad.doubleclick).
The DNS results also included two strains of mali-ciousness. The first concerns an ISP (Wide Open West)that commonly returned their own proxy as an answer forwww.google.com or search.yahoo.com (but not sites such asmail.google.com or www.yahoo.com). Deliberately invalidrequests to these proxies return a reference to “phishing-warning-site.com”, a domain parked with GoDaddy. Wealso observed similar behavior for customers of sigecom.net,cavtel.net, rcn.net, fuse.net, and o1.com.
Second, in a few dozen sessions we observed mali-cious DNS resolvers due to malcode having reconfiguredan infected user’s system settings. These servers ex-hibit two signatures: (i) malicious resolution for window-supdate.microsoft.com, which instead returns an arbitraryGoogle server to disable Windows Update, and (ii) some-times a malicious result for ad.doubleclick.net. In these lat-ter (less frequent) instances, these ad servers insert maliciousadvertisements that replace the normal ads a user sees withones for items like “ViMax Male Enhancement” [12].
5.5 HTTP Proxying and Caching8.6% of all sessions show evidence of HTTP proxying. Of
these, 32.4% had the browser explicitly configured to use an
13

HTTP proxy, as the server recorded a different client-side IPaddress only for HTTP connections made via Java’s HTTPAPI. More interestingly, 90.8% of proxied sessions showedevidence of a mandatory in-path proxy for all HTTP traf-fic. (These are not mutually exclusive—the overlap is ex-plained by users that are double-proxied.) We detect suchproxies by several mechanisms, including changes to head-ers or expected content, requests from a different IP address,or in-network caching. A proxy may announce its locationthrough Via or X-Cache-Lookup response headers. Theapplet follows such clues by attempting a direct connectionto such potential proxies with instructions to connect to ourback-end server, which succeeded in 11.0% of proxied ses-sions. The reported names can be net-local hostnames (suchas “CLT-PRXY-04” or “Bastion”) or fully qualified do-main names. Of the announced proxies, 25.2% used a do-main matching that of the client’s PTR record.
We rarely observed caching of our 67 KB image (5.3% ofsessions cached at least one version of it). Manual exami-nation reveals that such caching most commonly occurredin wireless hotspots and corporate networks. Two SouthAfrican ISPs used in-path caching throughout, presumablyto reduce bandwidth costs and improve latency.
The infrequency of such caches perhaps represents ablessing in disguise, as they often get it wrong. A mi-nor instance concerns the 55.8% of caches that cachedthe image we specified it as weakly uncacheable (nocache-specific HTTP headers). More problematic arethe 37.8% that cached the image despite strong un-cacheability (use of headers such as Cache-control:no-cache,no-store, a fresh Last-Modified times-tamp expiring immediately). Finally, 5.3% of these bro-ken caches failed to cache a highly cacheable version of theimage (those with Last-Modified well in the past andExpires well into the future, or with an ETag identifier).Considering that 41.5% of all HTTP-proxied connectionsdid not gain the benefits of caching legitimately cacheablecontent, we identify considerable unrealized savings.
Network proxies seldom transcode the raw images duringthis test, but it does occur. 0.05% of the sessions showedtranscoding of one or more of the fetched images, detectedas a returned result smaller than the expected length but> 10 KB. Manual examination of a few cases verified thatthe applet received a proper HTTP response for the imagewith a reduced Content-Length header, and thus thenetwork did indeed change the image rather than merelytruncate.
In-path processes also only rarely interrupt file trans-fers. Only 0.7% of all sessions failed to correctly fetch the.mp3 file and 1.0% for the .exe. Slightly more, 1.3%,failed to fetch the .torrent file, suggesting that some net-works filter on file type. However, 10% filtered the EICARtest “virus”, suggesting significant deployment of either in-network or host-based AV. As only 0.36% failed to fetch allfour test-files, these results do not reflect proxies that block
all of the tests.
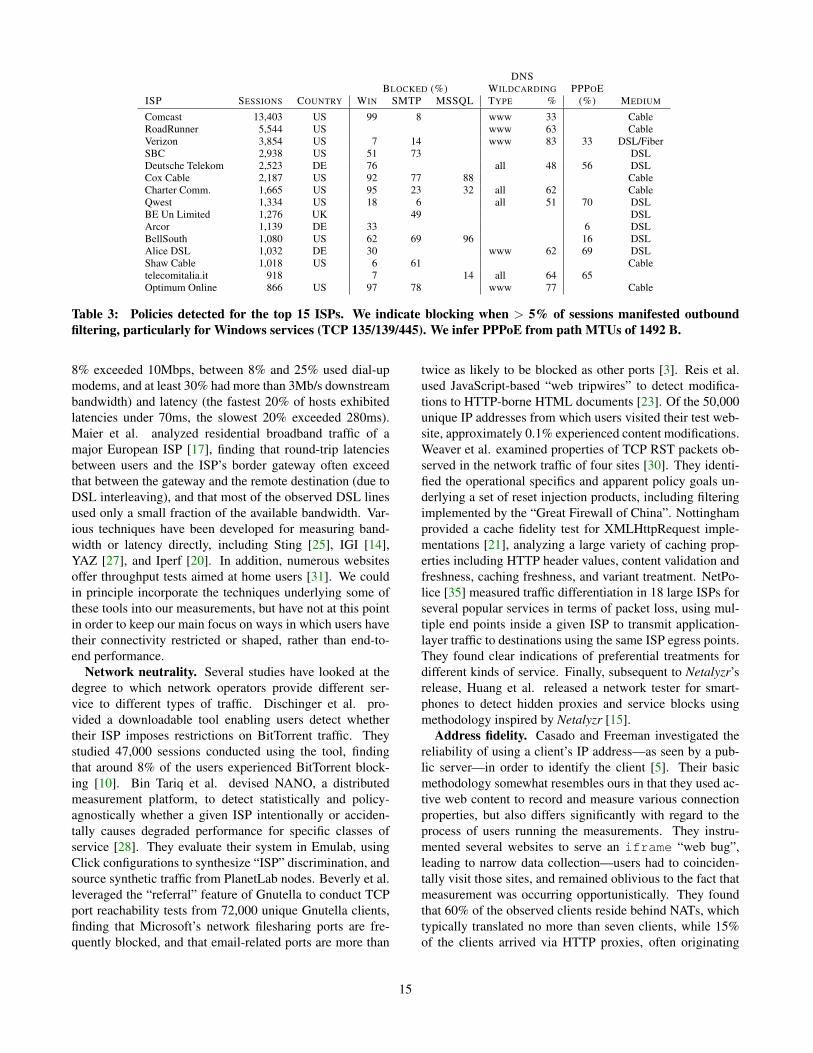
5.6 ISP ProfilesTable 3 illustrates some of the policies that Netalyzr ob-
served for the 15 most common ISPs. As mentioned above,the relative lack of SMTP blocking amongst several majorISPs could reflect that some IPS perform dynamic responseto block spam-bots in their network. Likewise, a few ISPsdo not appear to filter Windows traffic outbound from cus-tomer connections. They might however block these portsinbound, which we cannot determine since Netalyzr does notperform inbound scanning. cannot determine if these portsare unblocked on inbound traffic.
Another characteristic we see reflects early design deci-sions still in place today. Although DSL always offered theability to provide direct Ethernet connections, many DSLproviders initially offered PPPoE connections rather than IPover Ethernet [32]. DOCSIS-based cable-modems, however,always used IP-over-Ethernet. We can see the effects of thistransition for Verizon customers, as only 9% of Verizon cus-tomers whose reverse name suggests they are FiOS (fiber tothe home) customers manifest the PPPoE MTU, while 69%of the others do.
A final trend concerns the growth of NXDOMAIN wild-carding, especially ISPs wildcarding all names rather thanjust www names. During Netalyzr’s initial release, Comcasthad yet to implement NXDOMAIN wildcarding, but beganwildcarding during Fall 2009.
We also confirmed that the observed policies for Comcastmatch their stated policies. Comcast has publicly stated thatthey will block outbound traffic on the Windows ports, andmay block outbound SMTP with dynamic techniques [7].When they began widespread deployment of their wildcard-ing, they also stated that they would only wildcard www ad-dresses, but we did observe the results of an early test de-ployment that wildcarded all addresses for a short period oftime.
6. RELATED WORKThere is a substantial existing body of work on approaches
for measuring various aspects of the Internet. Here we focuson those related to our study in the nature of the measure-ments conducted or how data collection occurred.
Network performance. Dischinger et al. studiednetwork-level performance characteristics, including linkcapacities, latencies, jitter, loss, and packet queue manage-ment [9]. They used measurement packet trains similar toours, but picked the client machines by scanning ISP addressranges for responding hosts, subsequently probing 1,894such hosts autonomously. In 2002 Saroiu et al. studied sim-ilar access link properties as well as P2P-specific aspectsof 17,000 Napster file-sharing nodes and 7,000 Gnutellapeers [24]. They identified probe targets by crawling the P2Poverlays, and identified a large diversity in bandwidth (only35% of hosts exceeded an upload bandwidth of 100Kb/s,
14
DNSBLOCKED (%) WILDCARDING PPPOE
ISP SESSIONS COUNTRY WIN SMTP MSSQL TYPE % (%) MEDIUM
Comcast 13,403 US 99 8 www 33 CableRoadRunner 5,544 US www 63 CableVerizon 3,854 US 7 14 www 83 33 DSL/FiberSBC 2,938 US 51 73 DSLDeutsche Telekom 2,523 DE 76 all 48 56 DSLCox Cable 2,187 US 92 77 88 CableCharter Comm. 1,665 US 95 23 32 all 62 CableQwest 1,334 US 18 6 all 51 70 DSLBE Un Limited 1,276 UK 49 DSLArcor 1,139 DE 33 6 DSLBellSouth 1,080 US 62 69 96 16 DSLAlice DSL 1,032 DE 30 www 62 69 DSLShaw Cable 1,018 US 6 61 Cabletelecomitalia.it 918 7 14 all 64 65Optimum Online 866 US 97 78 www 77 Cable
Table 3: Policies detected for the top 15 ISPs. We indicate blocking when > 5% of sessions manifested outboundfiltering, particularly for Windows services (TCP 135/139/445). We infer PPPoE from path MTUs of 1492 B.
8% exceeded 10Mbps, between 8% and 25% used dial-upmodems, and at least 30% had more than 3Mb/s downstreambandwidth) and latency (the fastest 20% of hosts exhibitedlatencies under 70ms, the slowest 20% exceeded 280ms).Maier et al. analyzed residential broadband traffic of amajor European ISP [17], finding that round-trip latenciesbetween users and the ISP’s border gateway often exceedthat between the gateway and the remote destination (due toDSL interleaving), and that most of the observed DSL linesused only a small fraction of the available bandwidth. Var-ious techniques have been developed for measuring band-width or latency directly, including Sting [25], IGI [14],YAZ [27], and Iperf [20]. In addition, numerous websitesoffer throughput tests aimed at home users [31]. We couldin principle incorporate the techniques underlying some ofthese tools into our measurements, but have not at this pointin order to keep our main focus on ways in which users havetheir connectivity restricted or shaped, rather than end-to-end performance.
Network neutrality. Several studies have looked at thedegree to which network operators provide different ser-vice to different types of traffic. Dischinger et al. pro-vided a downloadable tool enabling users detect whethertheir ISP imposes restrictions on BitTorrent traffic. Theystudied 47,000 sessions conducted using the tool, findingthat around 8% of the users experienced BitTorrent block-ing [10]. Bin Tariq et al. devised NANO, a distributedmeasurement platform, to detect statistically and policy-agnostically whether a given ISP intentionally or acciden-tally causes degraded performance for specific classes ofservice [28]. They evaluate their system in Emulab, usingClick configurations to synthesize “ISP” discrimination, andsource synthetic traffic from PlanetLab nodes. Beverly et al.leveraged the “referral” feature of Gnutella to conduct TCPport reachability tests from 72,000 unique Gnutella clients,finding that Microsoft’s network filesharing ports are fre-quently blocked, and that email-related ports are more than
twice as likely to be blocked as other ports [3]. Reis et al.used JavaScript-based “web tripwires” to detect modifica-tions to HTTP-borne HTML documents [23]. Of the 50,000unique IP addresses from which users visited their test web-site, approximately 0.1% experienced content modifications.Weaver et al. examined properties of TCP RST packets ob-served in the network traffic of four sites [30]. They identi-fied the operational specifics and apparent policy goals un-derlying a set of reset injection products, including filteringimplemented by the “Great Firewall of China”. Nottinghamprovided a cache fidelity test for XMLHttpRequest imple-mentations [21], analyzing a large variety of caching prop-erties including HTTP header values, content validation andfreshness, caching freshness, and variant treatment. NetPo-lice [35] measured traffic differentiation in 18 large ISPs forseveral popular services in terms of packet loss, using mul-tiple end points inside a given ISP to transmit application-layer traffic to destinations using the same ISP egress points.They found clear indications of preferential treatments fordifferent kinds of service. Finally, subsequent to Netalyzr’srelease, Huang et al. released a network tester for smart-phones to detect hidden proxies and service blocks usingmethodology inspired by Netalyzr [15].
Address fidelity. Casado and Freeman investigated thereliability of using a client’s IP address—as seen by a pub-lic server—in order to identify the client [5]. Their basicmethodology somewhat resembles ours in that they used ac-tive web content to record and measure various connectionproperties, but also differs significantly with regard to theprocess of users running the measurements. They instru-mented several websites to serve an iframe “web bug”,leading to narrow data collection—users had to coinciden-tally visit those sites, and remained oblivious to the fact thatmeasurement was occurring opportunistically. They foundthat 60% of the observed clients reside behind NATs, whichtypically translated no more than seven clients, while 15%of the clients arrived via HTTP proxies, often originating
15

from a diverse geographical region. Maier et al. [17] foundthat DHCP-based address reuse is frequent, with 50% of alladdresses being assigned at least twice per day. Finally, Bev-erly and Bauer’s Spoofer Project [4] employed a download-able measurement client to measure the extent to which endsystems can spoof IP source addresses. They analyzed anextensive longitudinal dataset, finding that through the pe-riod of study a significant minority of clients could performarbitrary spoofing.
7. SUMMARYThe Netalyzr system demonstrates the possibility of de-
veloping a browser-based tool that provides detailed diag-nostics, discovery, and debugging for end-user network con-nectivity. Visitors who ran the Netalyzr applet conducted112,000 measurement sessions from 86,000 public IP Ad-dresses. Netalyzr both reveals specific problems to individ-ual users and forms the foundation for a broad survey ofedge-network behavior. Some systemic problems revealedinclude difficulties with fragmentation, the unreliability ofpath MTU discovery, restrictions on DNSSEC deployment,legacy network blocks, frequent over-buffering of access de-vices, poor DNS performance for many clients, and deliber-ate manipulations of DNS results. The tool remains in activeuse and we aim to support it indefinitely as an ongoing ser-vice for illuminating edge network neutrality, security, andperformance.
8. ACKNOWLEDGEMENTSWe are deeply grateful to the Netalyzr users for enabling
this study and to our beta testers for the insightful commentsand feedback. We would particularly like to thank Mark All-man, Paul Barford, Scott Bradner, John Brzozowski, RandyBush, Niels Bakker, Richard Clayton, Chris Cowart, KeithDawson, Adrian Dimcev, Holger Dreger, Brandon Enright,Kevin Fall, Carrie Gates, Andrei Gurtov, Mark Handley,Theodore Hong, Kelly Kane, Matthew Kogan, Keith Med-calf, Thomas Narten, Michael Ross, Wooter Wijngaards, andRichard Woundy. We thank Amazon.com for supporting ourEC2 deployment. This work was supported by the NationalScience Foundation under grants NSF CNS-0722035, NSF-0433702, and CNS-0905631.
9. REFERENCES[1] Amazon.com. Amazon Elastic Compute Cloud
(Amazon EC2). http://aws.amazon.com/ec2/,August 2006.
[2] J. Bennett, C. Partridge, and N. Shectman. Packetreordering is not pathological network behavior.IEEE/ACM Transactions on Networking (TON),7:789–798, 1999.
[3] R. Beverly, S. Bauer, and A. Berger. The Internet’sNot a Big Truck: Toward Quantifying NetworkNeutrality. In Proc. PAM, 2007.
[4] R. Beverly, A. Berger, Y. Hyun, and k claffy.Understanding the efficacy of deployed internet sourceaddress validation filtering. In Proc. IMC, 2009.
[5] M. Casado and M. Freedman. Peering through theShroud: The Effect of Edge Opacity on IP-basedClient Identification. In Proc. NSDI, 2007.
[6] Chad R. Dougherty. CERT Vulnerability Note VU800113: Multiple DNS implementations vulnerable tocache poisoning, July 2008.
[7] What ports are blocked by Comcast High-SpeedInternet? http://lite.help.comcast.net/content/
faq/What−ports−are−blocked−by−Comcast−High−Speed−Internet.
[8] D. Dagon, M. Antonakakis, P. Vixie, T. Jinmei, andW. Lee. Increased DNS Forgery Resistance Through0x20-bit Encoding. In Proc. CCS, 2008.
[9] M. Dischinger, A. Haeberlen, K. P. Gummadi, andS. Saroiu. Characterizing Residential BroadbandNetworks. In Proc. IMC, 2007.
[10] M. Dischinger, A. Mislove, A. Haeberlen, andK. Gummadi. Detecting BitTorrent Blocking. In Proc.IMC.
[11] R. Erzs and R. Bush. Clarifications to the DNSSpecification. RFC 2181, IETF, July 1997.
[12] M. Fauenfelder. How to get rid of Vimax ads.http://boingboing.net/2009/01/16/how−to−get−rid−of−vi.html, January 2009.
[13] R. Giobbi. CERT Vulnerability Note VU 435052:Intercepting proxy servers may incorrectly rely onHTTP headers to make connections, February 2009.
[14] N. Hu and P. Steenkiste. Evaluation andcharacterization of available bandwidth probingtechniques. IEEE Journal on Selected Areas inCommunications, 21(6):879–894, 2003.
[15] J. Huang, Q. Xu, B. Tiwana, and M. Mao. The UMichSmartphone 3G Test.http://www.eecs.umich.edu/3gtest/.
[16] C. Kent and J. Mogul. Fragmentation consideredharmful. ACM SIGCOMM Computer CommunicationReview, 25(1):87, 1995.
[17] G. Maier, A. Feldmann, V. Paxson, and M. Allman.On dominant characteristics of residential broadbandinternet traffic. In Proc. IMC, 2009.
[18] M. Mathis and J. Heffner. Packetization Layer PathMTU Discovery. RFC 4821, IETF, March 2007.
[19] Mozilla. Effective TLD names. http://mxr.mozilla.org/mozilla−central/source/netwerk/dns/src/effective_tld_names.dat.
[20] NLANR/DAST. Iperf.http://iperf.sourceforge.net/, March 2008.
[21] M. Nottingham. XMLHttpRequest Caching Tests.http://www.mnot.net/javascript/
xmlhttprequest/cache.html, December 2008.[22] V. Paxson. An analysis of using reflectors for
distributed denial-of-service attacks. ACM SIGCOMM
16

Computer Communication Review, 31(3):38–47, 2001.[23] C. Reis, S. Gribble, T. Kohno, and N. Weaver.
Detecting In-Flight Page Changes with WebTripwires. In Proc. NSDI, 2008.
[24] S. Saroiu, P. Gummadi, S. Gribble, et al. Ameasurement study of peer-to-peer file sharingsystems. In Proceedings of Multimedia Computingand Networking, volume 2002, page 152, 2002.
[25] S. Savage. Sting: a TCP-based network measurementtool. In Proc. USITS, 1999.
[26] P. Savola. MTU and Fragmentation Issues withIn-the-Network Tunneling. RFC 4459, 2006.
[27] J. Sommers, P. Barford, and W. Willinger.Laboratory-based calibration of available bandwidthestimation tools. Microprocessors and Microsystems,31(4):222–235, 2007.
[28] M. Tariq, M. Motiwala, N. Feamster, and M. Ammar.Detecting network neutrality violations with causalinference. In Proc. Emerging Networking Experimentsand Technologies, 2009.
[29] P. Vixie. Extension Mechanisms for DNS (EDNS0).RFC 2671, IETF, August 1999.
[30] N. Weaver, R. Sommer, and V. Paxson. DetectingForged TCP Reset Packets. In Proc. NDSS, 2009.
[31] Web resources. Bandwidth/latency measurement sites.http://www.speedtest.net,http://helpme.att.net/dsl/speedtest/,http://www2.verizon.net/micro/speedtest/hsi/,http://www.dslreports.com/stest.
[32] Wikipedia. Point-to-point protocol over ethernet.http://en.wikipedia.org/wiki/Point−to−Point_Protocol_over_Ethernet, January 2010.
[33] Wikipedia. Usage share of operating systems.http://en.wikipedia.org/wiki/Usage_share_of_
operating_systems, January 2010.[34] Wikipedia. Usage share of web browsers.
http://en.wikipedia.org/wiki/Usage_share_of_
web_browsers, January 2010.[35] Y. Zhang, Z. M. Mao, and M. Zhang. Detecting traffic
differentiation in backbone ISPs with NetPolice. InProc. IMC, 2009.
17