network-based auto-probit modeling for protein function
TRANSCRIPT

Biometrics xx, 1–?? DOI: 10.1111/j.1541-0420.2005.00454.x
xxx 2009
Network-based auto-probit modeling for protein function prediction
Xiaoyu Jiang1, David Gold2, Eric D. Kolaczyk3∗
1Boehringer Ingelheim Pharmaceuticals, Inc.
900 Ridgebury Road, Ridgefield CT 06877 USA
2Department of Biostatistics, School of Public Health and Health Professions
University at Buffalo,the State University of New York, Buffalo NY 14214 USA
3Department of Mathematics and Statistics, Boston University
111 Cummington Street, Boston MA 02215 USA
*email: [email protected]
Summary: Predicting the functional roles of proteins based on various genome-wide data, such
as protein-protein association networks, has become a canonical problem in computational biology.
Approaching this task as a binary classification problem, we develop a network-based extension
of the spatial auto-probit model. In particular, we develop a hierarchical Bayesian probit-based
framework for modeling binary network-indexed processes, with a latent multivariate conditional
autoregressive (CAR) Gaussian process. The latter allows for the easy incorporation of protein-
protein association network topologies – either binary or weighted – in modeling protein functional
similarity. We use this framework to predict protein functions, for functions defined as terms
in the Gene Ontology (GO) database, a popular rigorous vocabulary for biological functionality.
Furthermore, we show how a natural extension of this framework can be used to model and correct for
the high percentage of false negative labels in training data derived from GO, a serious short-coming
endemic to biological databases of this type. Our method performance is evaluated and compared
with standard algorithms on weighted yeast protein-protein association networks, extracted from
a recently developed integrative database called STRING. Results show that our basic method is
competitive with these other methods, and that the extended method – incorporating the uncertainty
in negative labels among the training data – can yield nontrivial improvements in predictive accuracy.
Key words: Auto-probit; Bayesian hierarchical model; Gene Ontology annotation uncertainty;
MCMC algorithm; Protein function prediction; STRING
1

Network-based auto-probit modeling for protein function prediction 1
1. Introduction
Inferring the functional role of proteins is a primary task in biology, for purposes ranging
from general knowledge to drug discovery and diagnostic development. Protein functions are
commonly taken as terms from the Gene Ontology (GO) database, a controlled vocabulary
which describes gene and gene product attributes in organisms (www.geneontology.org).
Whether or not a given protein has a certain GO function can be encoded using a binary
variable, with 1 indicating that the protein has the function and 0 indicating that it does not.
Proteins can have multiple functional annotations in GO, in part because of their ability to
perform multiple biological roles and in part because GO terms are structured as hierarchies,
ranging from general to more specific. On the other hand, protein-term annotations in GO
must follow a true-path rule, which states that if a protein is categorized into a more specific
functional class, it must also be categorized into all the less specific ancestor functional
classes.
Protein-protein interaction (PPI) networks are one of the most commonly used sources
of information for predicting protein functions. PPI networks are routinely modeled by
functional linkage graphs, with vertices corresponding to proteins and edges indicating
interactions between a pair of proteins. For a given protein function, the corresponding binary
variables describing protein annotation statuses can be thought of as constituting a binary
binomial model of local neighbor function annotation probability stochastic process indexed
on the PPI network. Protein function prediction is then viewed as a task of predicting binary
labels at locations in the network where they are unknown, given the labels observed at other
nearby locations. Classifiers are usually built for this purpose and various methodologies of
this sort have been proposed, frequently based on the principle of “guilt-by-association”.
“Guilt-by-association” is a widely adopted principle in system biology, supported by empiri-
cal experience. In the present context, “guilt-by-association” suggests that a protein is likely

2 Biometrics, xxx 2009
to share the functions of the majority of its neighbors. The principle has been primarily used
for prediction of biological processes, and in special cases for prediction of molecular function
and cellular locazation.
Note that protein function prediction has been extensively researched; a comprehensive
summary of various methods is provided by Sharan, Ulitsky and Shamir (2007). Examples of
methodologies based on the “guilt-by-association” principle include Nearest-Neighbor(NV)
algorithm, methods introduced in Schwikowski, Uetz and Fields (2000); Hishigaki et al.
(2001); Lanckriet et al. (2004); Chua, Sung and Wong (2006), and many, particularly Markov
Random Field-based probabilistic approaches. For example, Letovsky and Kasif (2003) pro-
posed a binomial model of local neighbor function annotation probability combined with a
Markov Random Field (MRF) propagation algorithm to assign function probability. Deng
et al. (2003) developed a Bayesian approach that uses Markov Random Field model on
the protein neighborhood to infer predictive probabilities. Most recent work combines PPI
data with other data sources, such as DNA binding motifs, protein localization, and gene
expression data. For instance, Deng, Chen and Sun (2004) modified their MRF model to
combine protein domain information with PPI. In Nariai, Kolaczyk and Kasif (2007), Jiang
et al. (2008) and Jiang et al. (2008), the binomial model in Letovsky and Kasif (2003) was
generalized to integrate the Gene Ontology hierarchical structure, gene microarray, protein
motif and cell localization data.
In this paper, we pursue two avenues towards improvement in protein function prediction
that differ notably from what has been consider in the literature to date. First, we wish
to incorporate weighted – rather than binary – protein-protein association networks in a
seamless fashion into a probabilistic framework. An example of a weighted PPI network, and
one which we shall use later in the data analysis described in this paper, is that derived from
the STRING database in Mering et al. (2005), which contains a combination of known and

Network-based auto-probit modeling for protein function prediction 3
predicted protein-protein associations and corresponding scores. The scores express increased
confidence when an association is supported by several types of evidence, which can be highly
informative in inferring proteins’ functional characteristics. Taking advantage of the scores
in databases such as STRING has become a new challenge as well as an opportunity to
improve function prediction accuracy. However, it is not obvious how this challenge can be
met by simple adaptations of the “guilt-by-association” principle governing methods like
those mentioned earlier.
Second, we wish to model and account for uncertainty in annotations in the Gene Ontology
database, which is a critically important issue in functional genomics and proteomics. Most
methods using annotations in the GO database for training classifiers assume that a protein
being annotated or not annotated with a function accurately reflects whether or not that
protein truly has that function or not. However, while positive annotations – which tradi-
tionally have reflected experimentally confirmed protein functions – are generally reliable,
negative annotations can be much less so. The reason for this disparity in reliability comes
from the fact that negative annotation for a given GO term can reflect either a known lack of
positive annotation (perhaps logically implied by certain positive annotations on other GO
terms) or simply an absence of knowledge as to the protein status with respect to this term.
This observation suggests that, instead of treating the task of protein function prediction as
a binary classification problem, we actually have three classes - “having the function”, “not
having the function” and “status unknown”. This observation has been made by Letovsky
and Kasif (2003), but otherwise does not appear to have been widely acknowledged in the
literature. However, results in this paper show that acknowledging and, moreover, accounting
for it appropriately can yield nontrivial improvements in predictive accuracy.
In this paper we develop a network-based hierarchical Bayesian auto-probit model that
allows for us to address both of the issues described above i.e., seamless incorporation of

4 Biometrics, xxx 2009
weighted networks and accounting for uncertainty in negative associations. The incorporation
of weighted networks is facilitated by our use of a latent Gaussian process to encode functional
similarity, and the accounting for annotation uncertainty is accomplished by including an
additional layer of probabilistic error. The paper is organized as follows. In Section 2 we
develop our model under the assumption that there is no annotation uncertainty in GO. We
then generalize this model to tackle the annotation uncertainty problem in Section 3. Results
for model fitting, prediction and model comparison on two yeast networks are presented in
Section 4. Some discussion follows in Section 5.
2. Bayesian hierarchical model for protein function prediction
2.1 Network-based auto-probit model
Suppose we have a collection of N proteins, n 6 N of which have functional annotations in
the Gene Ontology database, and N − n > 0 for which we wish to predict functionality. Let
the binary variable yiG denote the functional annotation of protein i for the GO term G.
That is, yiG = 1 if protein i is annotated with term G in the database; yiG = 0 otherwise,
for i = 1, . . . , n. Since protein functions are predicted independently, we simplify yiG as yi in
the following sections, to avoid making equations too busy.
Motivated by Weir and Pettitt (2000), who develop a spatial auto-probit model for lattice
data, we employ a latent Gaussian process z to represent the true functional status of
proteins for the term of interest. That is, zi > 0 means that protein i actually has the
function; and zi < 0, otherwise, for i = 1, . . . , N . Note that the Gaussian process z is
a modeling device that reflects protein’s’ functional status. In principle, if we had all the
information, annotations should reflect the true protein functional status; however, due to our
limitation on knowledge and technology, annotations are incomplete and in some instances
incorrect.

Network-based auto-probit modeling for protein function prediction 5
To begin our process of model construction, in this section, we assume that there is no
annotation error in the GO database; in other words, the sign of zi fully determines yi,
yi =
1, if zi > 0;
0, if zi < 0.
(1)
It is commonly assumed that proteins with the same or similar functions tend to inter-
act more frequently than others. This assumption underlies, for example, the local density
enrichment assumption in Letovsky and Kasif (2003). Therefore, we want to encode protein-
protein association network structure into the model to aid in inferring the functional labels.
Let A be the N ×N adjacency matrix for a protein network. For a binary (i.e., unweighted)
network, aij = 1 for interacting neighbors i and j, and 0 otherwise. For a weighted network,
aij takes on the value of the weight for the edge {i, j}, with a weight of aij = 0 indicating
no edge. For each i, let di =∑
j 6=i aiv be the degree of protein i. If the network is binary, di
simply counts the number of neighbors of protein i. Denote by D = diag{di} the diagonal
degree matrix.
The N × 1 latent Gaussian process vector z is assumed to follow a multivariate normal
distribution
z|µ, β ∼ MV N(µ, (I − βD1
2 AD1
2 )−1) ∼ MV N(µ, (I − βB)−1), (2)
where I is the identity matrix, µ is the location vector for proteins, and B = D1
2 AD1
2 .
We constrain the value of β to ensure that the precision matrix I − βB is positive definite.
First, we assume that neighbor proteins tend more often than not to agree with each other,
according to the local density enrichment assumption, and thus restrict β to be non-negative.
Second, writing the determinant of the precision matrix as
|I − βD1
2 AD1
2 | = ΠNi=1(1 − βλi), (3)
where λi is the i-uh eigenvalue of matrix D1
2 AD1
2 , we note that a sufficient condition for this
determinant to be positive is that β < λ−1max, where λmax = maxi λi. Hence, we constrain β

6 Biometrics, xxx 2009
such that 0 < β < λ−1max, which is similar to Weir and Pettitt (2000) in the context of spatial
auto-probit modeling. The parameter β measures the spatial dependence in probability
between neighbors, of carrying the function G, over the global network topology. When
β = 0, a protein’s functional status is independent of its neighbors’; larger positive values of
β are indicative of functional similarity between immediate graph neighbors.
To understand the manner in which this model incorporates the network topology, we note
that the partial correlation coefficient ρiv for zi and zj on two neighbor proteins takes the
form
ρij =
β√
didjaij , if i ∼ j,
1, if i = j,
0, otherwise .
(4)
This expression indicates that proteins with more neighbors should be more likely to be
consistent with the majority of the neighbors; in other words, a protein with a larger
neighborhood and hence a bigger di would be more closely correlated with its neighbors
controlling other proteins outside the neighborhood. We call this the “one-hop neighborhood
effect.” On the other hand, a neighbor of protein i that itself has more neighbors will likely
have greater influence on protein i than other of i’s neighbors, which we refer to as the
“two-hop neighborhood effect.”
2.2 Prior and posterior distributions for the network auto-probit model
In conducting inferences with our network auto-probit model, we will utilize the joint pos-
terior probability distribution, conditional on the observed annotations y, i.e.,
P (z, µ, β|y) ∝ P (y|z) · P (z|µ, β) · P (µ) · P (β), (5)
where P (y|z) = Πni=1P (yi|zi) = 1, since we assume for now that the GO annotation is correct
and the sign of zi fully determines the value of yi. To fully specify this posterior, we need to
equip the parameters µ and β with appropriate prior distributions.

Network-based auto-probit modeling for protein function prediction 7
We assign a conditional autoregressive (CAR) prior distribution with a hyperparameter τ 2
to µ which models the spatial dependence on the network and smooths individual µi locally.
More specifically, we define a (singular) joint prior distribution on µ of the form
P (µ|τ 2) ∝ exp {−1
2τ 2µ
T Lµ} ∝ exp {−1
2
∑
i∼j
(µi − µj)2
τ 2}. (6)
The conditional distribution for individual µi is therefore
µi|µ[−i], τ2 ∼ N(
∑
j∼i aijµj
di
,τ 2
di
), (7)
where L = D − A is the so-called graph Laplacian matrix and µ[−i] is all of µ except the
iuh element µi. The Laplacian matrix L leads to the prior conditional mean of µi being a
weighted average on protein i’s neighbors, i.e.,P
j∼i aijµj
di=
P
j∼i aijµjP
j∼i aij.
The hyperparameter τ 2 can be interpreted as the variance of the difference in expected
latent characteristics for two neighbor proteins. To better understand the effect of the τ 2,
we derive the posterior distribution of µ, given the Gaussian process z and β
P (µ|z, β) ∝ P (z|µ, β) · P (µ)
∼ MV N(zT (I − βB)(I − βB +L
τ 2)−1, (I − βB +
L
τ 2)−1). (8)
The parameter τ 2 controls the extent to which the prior influences the posterior distribu-
tion. Therefore, the choice of τ 2 is important in identifying the location vector µ. We discuss
this issue further below.
Due to the constraint on β for obtaining a valid precision matrix, we apply a truncated
normal prior to β,
β ∼ TN(β0, σβ; 0, βmax), (9)
where β0 and σβ are the prior mean and standard deviation, respectively; βmax is the maximal
possible value for β, as dictated by the largest eigenvalue of B in our implementation. We
simply set β0 as the midpoint of 0 and βmax; σβ is chosen to be small so that the truncated
normal posterior distribution for β could be comfortably fit on the tight constraint.

8 Biometrics, xxx 2009
2.3 Complexity of Smoothing Variances
Proper tuning of the prior distributions in this Bayesian auto-probit model is critical to
obtaining useful posterior distributions of the location parameter µ and the neighborhood
effect parameter β, as discussed earlier. Identification of the location vector µ in this over-
parameterized model would be difficult without strong spatial smoothing. We develop a
degree of freedom for µ as a function of τ 2 to have a better idea of balancing model fitting
and smoothing to this end.
For the Gaussian process z, we have
z ∼ MV N(µ, (I − βD1
2 AD1
2 )−1) ∼ MV N(µ, (I − βB)−1). (10)
Since the parameter β is chosen to guarantee the positive definiteness of the matrix (I−βB),
there exists a full-rank matrix V such that (I − βB) = V V T , or V (I − βB)V T = I. Thus,
V z ∼ MV N(V µ, I). (11)
Recalling that the CAR prior distribution for µ has the form
µ|τ 2 ∼ exp {−1
2τ 2µ
TLµ}, or µ ∼ MV N(0, (L
τ 2)−1), (12)
we propose an effective degrees of freedom, in analogy to the degrees of freedom for the
smoother matrix in the smoothing splines (e.g., Hastie, Tibshirani and Friedman (2001)),
ρ(τ 2) = trace[(V T V +L
τ 2)−1V T V ]
= trace[(I − βB +L
τ 2)−1(I − βB)], (13)
where L = D − A, as defined earlier. The degree of freedom for µ is monotonely increasing
and is confined between 0 and N . In applications, such as those shown later in this paper, we
have found it useful to specify τ 2 so as to impose a fairly low number of degrees of freedom,
forcing µ to be fairly smooth.

Network-based auto-probit modeling for protein function prediction 9
2.4 Markov chain Monte Carlo algorithm
In the applications to follow, we use Markov chain Monte Carlo algorithms to draw samples
from the joint posterior distribution. We update the individual zi, µi, and the parameter β
one at a time, which requires access to the fully conditional distributions.
The Gibbs sampler is used to update the zi’s, based on the conditional probability
P (zi|z[−i], µ, β, y) =
1√2πΦ(zi)
exp {−12(zi − zi)
2}, zi > 0, yi = 1,
0, zi < 0, yi = 1,
1√2π(1−Φ(zi))
exp {−12(zi − zi)
2}, zi < 0, yi = 0,
0, zi > 0 yi = 0,
(14)
where z[−i] is all of z except the iuh element zi, zi = µi + β∑
j∼i
√
didjaij(zj − µj), and Φ
is the standard normal cumulative density function.
The Metropolis-Hasting algorithm is used to update the µi’s and β. The proposal change
from µi to a new µ′
i (or from β to a new β′
) is drawn from a normal distribution centered at
the current value with a pre-defined standard deviation.
3. Incorporating uncertainty of functional annotation in Gene Ontology
In previous sections, we assume that the annotations from the Gene Ontology database
reflect the actual protein functional status, that is, observing an annotation in the database
(yi = 1) means that the protein carries the function (zi > 0), while not observing such an
annotation (yi = 0) means that the protein does not have that function (zi < 0). Again, the
Gaussian process z in our work is a modeling device that reflects proteins’ true functional
status.
However, in reality, it is incorrect to assume that a protein which is not annotated with a
particular function does not have the function. Instead, it is frequently the situation where
the functional status is simply unknown to the best of our knowledge (Letovsky and Kasif

10 Biometrics, xxx 2009
(2003)). Since the present annotations cannot be “completely” trusted, our hypothesis is
that accounting for annotation uncertainty may improve predictive performance.
While we do not account for uncertainty in positive annotations, we acknowledge that
positive annotations might be incorrect as well, a point we take up in Discussion. However,
it is less likely where annotations are derived from experimentally confirmed evidence from
literature. Since there is an arguably greater interest among scientists in discovering previ-
ously unknown functions of proteins, rather than confirming known function, we build up
our framework under the assumption stated in the previous paragraph.
Therefore, we modify our model, writing
P (y|z, g) = Πni=1P (yi|zi, g), (15)
where
P (yi = 0|zi, g) =
1, zi < 0,
g, zi > 0.
(16)
This extended version of our network auto-probit model thus incorporates the probability of
being “incorrectly nun-annotated”. The device employed here is analogous to that used in
Weir and Pettitt (2000), in modeling the spatial distribution of toads, to account for the fact
that spatial regions for which no toads were observed are not necessarily devoid of toads.
The joint posterior distribution including g is given by
P (z, µ, β, g|y) ∝ P (y|z, g) · P (z|µ, β) · P (µ) · P (β) · P (g), (17)
where we let P (g) be the uniform prior distribution for g, P (g) ∼ U(0, 1), P (y|z, g) is as
described above, and all other terms are the same as mentioned earlier.
3.1 Markov Chain Monte Carlo algorithm with the GO annotation uncertainty
When we consider the Gene Ontology annotation uncertainty and include the probability of
being “incorrectly un-annotated”, g, it can be shown that the fully conditional distribution

Network-based auto-probit modeling for protein function prediction 11
for updating individual zi’s is different from before, being expressed as
P (zi|z[−i], µ, β, g, y) =
1√2πΦ(zi)
exp {−12(zi − zi)
2}, zi > 0, yi = 1,
0, zi < 0, yi = 1,
g√2π[1−Φ(zi)+gΦ(zi)]
exp {−12(zi − zi)
2}, zi > 0, yi = 0,
1√2π[1−Φ(zi)+gΦ(zi)]
exp {−12(zi − zi)
2}, zi < 0, yi = 0,
(18)
where zi = µi + β∑
j∼i
√
didjaij(zj − µj), and Φ is the standard normal cumulative density
function. The derivation of the conditional probability is included in the supplementary
material.
The Gibbs sampler can be used to update g. It can be derived that the fully conditional
distribution for g follows a beta distribution,
P (g|z, µ, β, y) ∝ P (y|z, g) · P (g) ∝ gN−+(1 − g)N++, (19)
where N−+ = #{i : yi = 0, zi > 0}, N++ = #{i : yi = +1, zi > 0}.
In our algorithm, when updating for one protein at each iteration, we only need to know
the local neighborhood information. Therefore, users do not need to store the entire network
matrix in memory. All protein predictions are updated at each step. For computational
efficiency, one might want to employ modified methods that update at longer numbers of
steps (e.g., every one pass through the network). In this case, the computations could be
parallelized and substantial efficiencies could be gained on a computer cluster. However, this
is beyond our scope and is for future research to explore.
4. Results
4.1 Data
We have implemented our network-based auto-probit models on two yeast protein-protein
association (sub)networks extracted from the STRING database, introduced in Mering et al.

12 Biometrics, xxx 2009
(2005). STRING contains known and predicted protein-protein associations, where “associ-
ation” refers to both direct physical binding and indirect interaction such as participation in
the same metabolic pathway or cellular process. Information for associations is obtained from
seven evidence sources: database imports1, high-throughput experiments, co-expression, ho-
mology based on phylogenetic co-occurrence, homology based on gene fusion events, homology
based on conserved genomic neighborhood, and text mining.
STRING simplifies the access to protein-protein associations by providing a comprehensive
collection of such associations for a large number of organisms. A score S is assigned to each
interacting pair of proteins by bench-marking against the KEGG pathway from Kanehisa et
al. (2004). The score is calculated by 1 − S = Πi(1 − Si), where i indicates the individual
evidence type described at the end of the previous paragraph, and Si is the score from
the i-uh source. As a result, STRING database provides users with weighted undirected
protein-protein association networks.
For purposes of illustration, we extract two such networks of different sizes from the yeast
genome and study different functions for them. The smaller one contains N = 211 genes,
all of which are annotated with the term GO:0007154, cell communication (CC) from the
Gene Ontology database, updated as of November 2007. To ease exposition we name this the
“CC network”. The term we wish to predict for this network is GO:0007242, intracellular
signaling cascade (ISC), a grandchild term of cell communication. The larger network,
named the “OOB network”, consists of N = 975 genes, all annotated with GO:0006996,
organelle organization and biogenesis (OOB). We study one of its child terms, GO:0051276,
chromosome organization and biogenesis (COB). Note that according to the GO annotation
in November 2007, there are 226 and 1290 proteins annotated with cell communication
and organelle organization and biogenesis, respectively. We only use the largest connected
1PPI and pathway databases

Network-based auto-probit modeling for protein function prediction 13
components, neglecting small connected neighborhoods and isolated proteins, therefore, the
network sizes in this paper are smaller than the actual numbers of proteins.
4.2 Parameter estimation by the auto-probit model
Using the model in Section 2.2 and 2.3, we first take the observed annotation y as known
for all N proteins, and examine the issue of fitting the model. The hyperparameters for the
two networks are listed in Table 1. We discard the first 1000 iterations as burn-in and run
9000 iterations to get posterior samples. Convergence diagnostics by standard approaches
indicate that all chains reach equilibrium. For trace plots and histograms of the posterior
samples of β, please refer to Web Figures 1 and 2.
[Table 1 about here.]
Estimates of the posterior means of some parameters are given in Tables 2 and 3, together
with 95% credibility intervals. It can be seen that there is statistically significant positive
spatial dependence on both networks. The small estimates for β are a result of the large
eigenvalues λmax (312.9047 and 4297.8 for CC and OOB networks, respectively), and hence
a small βmax (0.0032 and 0.0002 for CC and OOB networks, respectively).
Additional model fitting results, including histograms of the posterior estimates of µ
and the posterior predictive probabilities can be found in the supplementary material.
These histograms are colored according to the proteins’ annotations, i.e., being or not being
annotated with the target function. Interestingly enough, the histograms for the two classes of
proteins are well separated, indicating that the auto-probit model is capable of distinguishing
proteins with different functional statuses, by utilizing network topology and estimating
parameters in a globally coherent fashion.
[Table 2 about here.]
[Table 3 about here.]

14 Biometrics, xxx 2009
4.3 Prediction performance comparison by 10-fold cross-validation studies
We perform a sanity check to study the predictive performance of the auto-probit model.
We compare the network-based auto-probit model with Nearest-Neighbor (NV) algorithm,
a standard algorithm representing typical methods using local neighborhood information
based on the guilt-by-association principle, and the kernel logistic method in Zhu and Hastie
(2005), which builds a Laplacian kernel matrix with the weighted network by L = D − A
and produces predictive probabilities. Since NN does not use the weights on the edges, we
use the induced binary networks. It produces a number between 0 and 1 (i.e., the fraction
of a protein’s neighbors in the binary network possessing the term in question).
One of the advantages of the auto-probit model is that it provides a natural platform of
incorporating the weights on the edges in the networks. Conversely, it is not straightforward
for methods based on the neighborhood counting principle. To show such an advantage, we
apply the auto-probit model on both the weighted and binary versions of the two networks,
and compare the performances by ROC curves.
To evaluate and compare method performances, we plot the standard Receiver Operating
Characteristic (ROC) curves based on 10-fold cross validation on both networks. More
specifically, we calculate true positives (TP), false positives (FP), true negatives (TN) and
false negatives (FN) for varying predictive thresholds based on the proteins in each fold, and
then average across folds. The comparisons are presented in Figure 1. On the CC network,
the area under curve (AUC) for the auto-probit method with weighted STRING network,
logistic kernel method, NN algorithm and auto-probit on binary STRING network are 0.8321,
0.8371, 0.8022 and 0.7817, respectively; for the OOB network, the AUC’s are 0.8839, 0.8437,
0.8502 and 0.6397. To have a better sense of how the proposed method compares with the
others, we performed a two-sided t-test based on the ten folds to test if the AUC from our
method is significantly larger. On the CC network, the p-values for comparing with logistic

Network-based auto-probit modeling for protein function prediction 15
kernel method, NN and auto-probit model on binary network are 0.8677, 0.205 and 0.2314,
respectively; for the OOB network, the p-values are 0.3791, 0.1131 and 0.0030.Hence, our
proposed auto-probit network with weighted STRING network is seen to perform at least as
well as representative competitors. As we will see later, however, our method also extends
naturally to incorporate annotation uncertainty, while these competing methods do not.
The ROC curves show that the auto-probit model works at least equally well for both
networks as the simple nearest-neighbor algorithm, and the more sophisticated logistic kernel
method. The similarity in performance of these three rather different methods is most likely
due, at least in part, to the fact that sequence similarity is the dominating information
source for the protein-protein association. As pointed out in Pena-Castillo et al. (2008), it
is hard to distinguish methods relying on protein-protein association data when this is the
case. In both cases, there is a clear jump from using only the embedded binary networks (the
purple curves in Figure 1) to the weighted networks (the red curves in Figure 1), where the
improvement from the auto-probit model on weighted OOB network is significant (p-value
= 0.0030) .
[Figure 1 about here.]
An important question is whether predictions from our model are stable with respect
to natural variation in the training data. As an exploration of this issue, we performed a
100-trial simulation study on the CC network. A 10-fold cross-validation was conducted for
each trial and ROC curves were generated. The results demonstrate good reproducibility of
predictive accuracy. Please refer to the supplementary material for details.
4.4 Analysis of the Gene Ontology annotation uncertainty
What significantly distinguishes our network-based auto-probit model for gene function
prediction from most other methods is the ease with which uncertainty information can
16 Biometrics, xxx 2009
be incorporated, which allows us, in particular, to explore the problem of GO annotation
uncertainty.
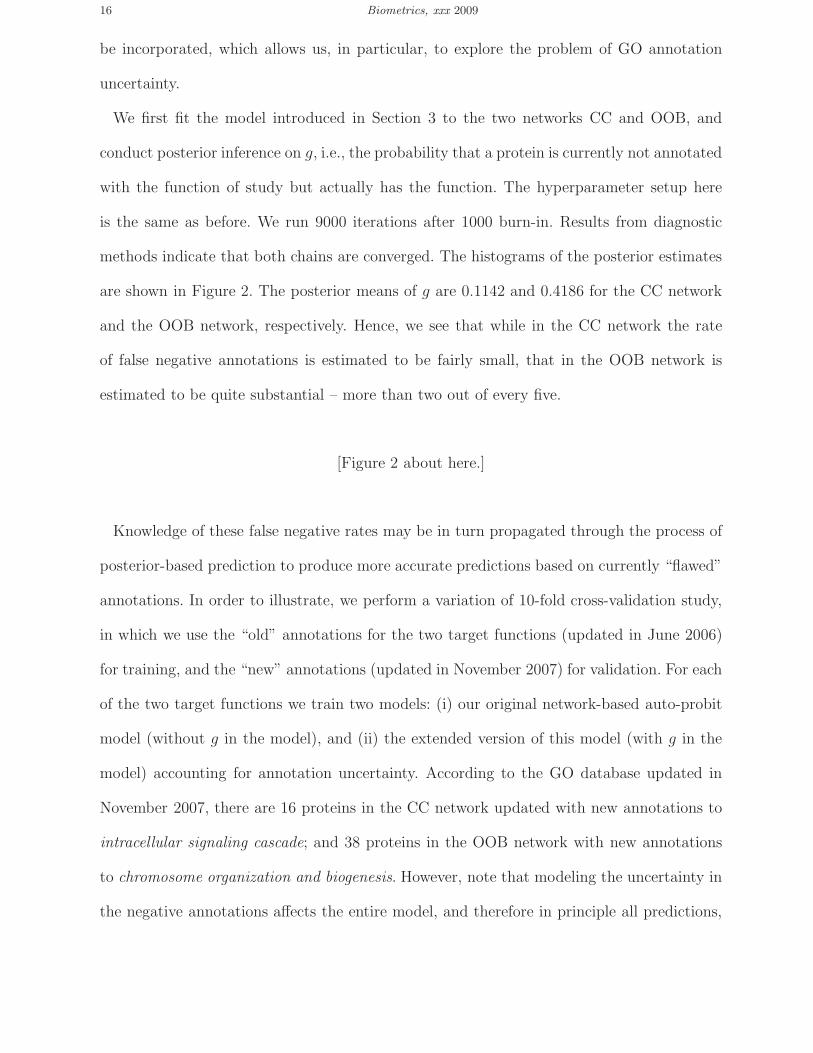
We first fit the model introduced in Section 3 to the two networks CC and OOB, and
conduct posterior inference on g, i.e., the probability that a protein is currently not annotated
with the function of study but actually has the function. The hyperparameter setup here
is the same as before. We run 9000 iterations after 1000 burn-in. Results from diagnostic
methods indicate that both chains are converged. The histograms of the posterior estimates
are shown in Figure 2. The posterior means of g are 0.1142 and 0.4186 for the CC network
and the OOB network, respectively. Hence, we see that while in the CC network the rate
of false negative annotations is estimated to be fairly small, that in the OOB network is
estimated to be quite substantial – more than two out of every five.
[Figure 2 about here.]
Knowledge of these false negative rates may be in turn propagated through the process of
posterior-based prediction to produce more accurate predictions based on currently “flawed”
annotations. In order to illustrate, we perform a variation of 10-fold cross-validation study,
in which we use the “old” annotations for the two target functions (updated in June 2006)
for training, and the “new” annotations (updated in November 2007) for validation. For each
of the two target functions we train two models: (i) our original network-based auto-probit
model (without g in the model), and (ii) the extended version of this model (with g in the
model) accounting for annotation uncertainty. According to the GO database updated in
November 2007, there are 16 proteins in the CC network updated with new annotations to
intracellular signaling cascade; and 38 proteins in the OOB network with new annotations
to chromosome organization and biogenesis. However, note that modeling the uncertainty in
the negative annotations affects the entire model, and therefore in principle all predictions,

Network-based auto-probit modeling for protein function prediction 17
thus we are showing the predictive performance evaluation on all proteins, not just those
proteins with updated annotations.
We show the ROC curves from our model with and without g. For both networks, the
auto-probit model with g (modeling missing annotations) outperforms the auto-probit model
without g. For the CC network, the AUC’s for our model with g and without g are 0.7539
and 0.6641, respectively. The p-value for AUC comparison based on the ten folds is 0.0335,
indicating a significant prediction improvement from incorporating the uncertainty in neg-
ative annotations. For the OOB networks, the AUC’s for the model with g and without g
are 0.7259, 0.6616, respectively; and the p-value is 0.1224. These results demonstrate that
our method is able to model and correct for missing annotations by producing improved
predictions. While the improvement is modest in the OOB network, it is substantial in the
CC network.
[Figure 3 about here.]
We note that there is an important aspect of the overall modeling process implicit in the
way that we have set up our prediction problems. That is, we have exploited our knowledge
of the parent functions of the functions that we seek to predict. This decision is motivated
by the fact that often when predicting a given protein some background knowledge may
be available (either of a current but less specific GO annotation, for example, or of related
biological information suggestive of such an annotation), allowing us to effectively restrict
the prediction problem to a sub-network. If such knowledge is not available, then prediction
would in principle need be based on the a model fit to the full network.
We have explored the effect of this modeling issue on predicting our two terms, in the CC
and OOB networks, respectively. Specifically, we fit our model to the full PPI network in both
cases, both with and without modeling for mis-annotations, and evaluated the performance
on the CC and OOB sub-networks. The AUC under the corresponding ROC curves is given

18 Biometrics, xxx 2009
in Table 4 (the ROC curves themselves may be found in the Web Figures 6 and 7). We
see that (a) the best results are achieved when we both model mis-annotations and restrict
training to the respective sub-networks, but (b) whether modeling mis-annotations or not,
on both datasets both methods perform similarly, and on par with the best results, when
training on the full network. Since the sub-networks here are substantially smaller than the
full PPI network, and the computational gains obtained by using smaller sub-networks will
be only more critical for prediction in higher-level organisms (e.g., in human cell lines), it is
clear that the modeling of mis-annotation proposed here has a fundamental role to play in
successful prediction.
On a related note we point out that, given the hierarchical nature of GO, the choice of
parent function can matter when deciding on the definition of a relevant sub-network. For
example, for the function ISC, there are two non-trivial terms above it: cell communication
(CC), which we have used in our work above, and regulation of cellular process (RCP). If
we use RCP in place of CC and train our two models on the resulting sub-network, we
again find that by modeling mis-annotation we outperform our original model. However,
the performance of both models is noticeably worse than when using CC, with an AUC of
0.6297 and 0.3976, respectively. This change is possibly due to the fact that RCP defines a
substantially larger sub-network than CC, and yet since both contain CC, the proportion of
proteins annotated in RCP is much smaller than in CC (i.e., 6.11% versus 56.87%).
Together the above results suggest that some care is needed in choosing sub-networks upon
which to fit our proposed models. A more detailed investigation of these issues is merited,
but is beyond the scope of this paper.
[Table 4 about here.]

Network-based auto-probit modeling for protein function prediction 19
5. Discussion
This paper introduces a network-based fully Bayesian auto-probit model for protein function
prediction. It takes protein-protein association networks as input and employs a latent Gaus-
sian process z to encode proteins functional similarity. Using a hierarchical Bayesian model,
we assign a conditional autoregressive (CAR) prior distribution with a single hyperparameter
τ 2 to the location vector µ of the Gaussian process. There are various extensions that may
be of interest.
The incorporation of uncertainty in negative GO term annotations was shown here to yield
substantial improvements in predictive accuracy. This observation has powerful implications,
since the tendency toward emphasis on “positive results” in science, and the manner in which
modern biological databases encode those results, means that this issue is not restricted to
the Gene Ontology database alone, but rather is likely endemic to the area as a whole.
Although annotations that are derived from experimentally confirmed evidence are unlikely
to be incorrect, it is still possible for positive annotations to be false. As genomic function
prediction becomes more and more of a focus, many databases are starting to incorporate
larger fractions of predicted annotations, where this issue is more common. As such, one may
soon want to include the possibility of incorrect annotations in a model like ours, presumably
accounting them in a similar fashion as what we proposed for the uncertainty in negative
annotations.
In our work, protein annotations are predicted by conditioning on the protein-protein
association network topology. However, it is known that protein-protein association data is
traditionally noisy, in other words, the protein functional linkage graphs may lack of edges
and contain false edges. There are two natural ways to address this - one is to use more
confident networks, such as the one used in our paper extracted from The STRING database,
rather than networks based on a single source of information. Another more sophisticate way

20 Biometrics, xxx 2009
is to account for the uncertainty in edges in the modeling process. Our network auto-probit
model is structured in such a way that it should facilitate such modeling.
Note that our proposed model predicts protein function independently, without considering
the relationship among functional terms. In fact, GO terms are structured as a directed
acyclic graph (DAG), reflecting their ontological relationships with each other. Recent work
has shown that some improvement in protein function prediction can be obtained by ex-
ploiting the structure among GO terms. See Jiang et al. (2008), for example, and references
therein. In principle, the network auto-probit model proposed here can be extended in an
analogous manner.
Acknowledgments
The authors thank Brian Reich for helpful discussion at the start of this project. This work
was supported in part by NIH grant R01 HG003367-01A1, NSF ITF 0428715, NSF DMS-
0602204 (EMSW21-RTG, BioDynamics at Boston University), and ONR award N00014-06-
1-0096.
Supplementary Materials
Web Figures referenced in Section 4 is available under the Paper Information link at the
Biometrics website http://www.tibs.org/biometrics.
References
Besag JE, York J and Mollie A. (1991). Bayesian image restoration with applications in
spatial statistics (with discussion). Annuals of the Institute of Statistical Mathematics
43, 21-59.
Chua HN, Sung WK and Wong L. (2006). Exploiting indirect neighbours and topological

Network-based auto-probit modeling for protein function prediction 21
weight to predict protein function from proteinCprotein interactions. Bioinformatics 22,
1623-1630.
Cressie NAC. (c1991). Wiley Series in Probability and Statistics. New York: J Wiley.
Deng M, Chen T and Sun F. (2004). An integrated analysis of protein function prediction.
Journal of Computational Biology 11, 463-475.
Deng M, Zhang K, Mehta S, Chen T and Sun F. (2003). Prediction of protein function using
protein-protein interaction data. Journal of Computational Biology 10, 947-960.
Friedman JH. (1997). On bias, variance, 0/1-loss, and the curse-of-dimensionality. Data
Mining and Knowledge Discovery 1, 55-77.
Gelman A and Rubin DB. (1992). Inference from iterative simulation using multiple
sequences. Statistical Science 7, 457-472.
Hastie T, Tibshirani R and Friedman J. (2001). The Elements of Statistical Learning: Data
Mining, Inference, and Prediction Springer.
Hishigaki H, Nakai K, Ono T, Tanigami A and Takagi T. (2001).) Assessment of prediction
accuracy of protein function from proteinCprotein interaction data. Yeast 18, 523-531.
Hodges JS and Sargent DJ. (2001). Counting degrees of freedom in hierarchical and other
richly-parameterised models. Biometrika 88, 367-379.
Jiang X, Nariai N, Steffen M, Kasif S, Gold D and Kolaczyk ED. (2008b). Combining
hierarchical inference in ontologies with heterogeneous data sources improves gene
function prediction. Proceedings of the IEEE International Conference on Bioinformatics
and Biomedicine.
Jiang X, Nariai N, Steffen M, Kasif S and Kolaczyk ED. (2008a). Integration of relational and
hierarchical network information for protein function prediction. BMC Bioinformatics 9,
350.
Kanehisa M, Goto S, Kawashima S, Okuno Y and Hattori M. (2004). The KEGG resource

22 Biometrics, xxx 2009
for deciphering the genome. Nucleic Acids Research 32, D277-D280.
Lanckriet GRC, Cristianini N, Jordan MI and Nobel WS. (2004). A statistical framework
for genomic data fusion. Bioinformatics, 20, 2626-2635.
Letovsky S and Kasif S. (2003). Predicting protein function from protein/protein interaction
data: a probabilistic approach. Bioinformatics 19, i197-i204.
Mering CV et al. (2005). STRING: known and predicted protein-protein associations,
integrated and transferred across organisms. Nucleic Acids Research 33, D433-D437.
Nariai N, Kolaczyk ED and Kasif S. (2007). Probabilistic protein function prediction from
heterogeneous genome-wide data. PLoS ONE 2(3),e337.
Pena-Castillo et al. (2008). A critical assessment of Mus musculus gene function prediction
using integrated genomic evidence Genome Biology 9, S2.
Raftery AE and Lewis SM. (1992). How many iterations in the Gibbs sampler? Bayesian
Statistics 4, Oxford University Press, 763-773.
Reich BJ and Hodges JS. (2008). Modeling longitudinal spatial periodontal data: A spatially-
adaptive model with tools for specifying priors and checking fit. Biometrics 64, 790-799.
Schwikowski B, Uetz P and Fields S. (2000). A network of protein-protein interactions in
yeast. Nature Biotechnology 18, 1257-1261.
Sharan R and Ulitsky I and Shamir R (2007). Network-based prediction of protein function
Molecular Systems Biology 3, 88.
Weir IS and Pettitt AN, (2000). Binary Probability Maps Using a Hidden Conditional
Autoregressive Gaussian Process with an Application to Finnish Common Toad Data.
Applied Statistics 49, 473-484.
Zhu J and Hastie T. (2005). Kernel logistic regression and the import vector machine. Journal
of Computational and Graphical Statistics 14, 185-205.

Network-based auto-probit modeling for protein function prediction 23
0 0.2 0.4 0.6 0.8 10
0.1
0.2
0.3
0.4
0.5
0.6
0.7
0.8
0.9
1
1 − Specificity
Sen
sitiv
ity
ROC Curve
Auto−probit: weighted STRINGLogistic kernel methodNearest−NeighborAuto−probit: binary STRING
0 0.2 0.4 0.6 0.8 10
0.1
0.2
0.3
0.4
0.5
0.6
0.7
0.8
0.9
1
1 − Specificity
Sen
sitiv
ity
ROC Curve
Auto−probit: weighted STRINGLogistic kernel methodNearest−NeighborAuto−probit: binary STRING
Figure 1. Comparing the auto-probit model with the logistic kernel method and NNalgorithm by ROC curves based on a 10-fold cross-validation. [Top]: predicting intracellularsignaling cascade in the CC network; [Bottom]: predicting chromosome organization andbiogenesis in the OOB network.

24 Biometrics, xxx 2009
0 0.1 0.2 0.3 0.4 0.5 0.6 0.70
200
400
600
Posterior estimate of g for CC network
Fre
quen
cy
0.35 0.4 0.45 0.5 0.550
100
200
300
400
Posterior estimate of g for OOB network
Fre
quen
cy
Figure 2. Histograms of the posterior estimates of g, the probability of being incorrectlyun-annotated. [Top]: target function of intracellular signaling cascade in the CC network;[Bottom]: target function of chromosome organization and biogenesis in the OOB network.

Network-based auto-probit modeling for protein function prediction 25
0 0.2 0.4 0.6 0.8 10
0.1
0.2
0.3
0.4
0.5
0.6
0.7
0.8
0.9
1
1−Specificity
Sen
sitiv
ity
Auto−Probit: with gAuto_Probit: without g
0 0.2 0.4 0.6 0.8 10
0.1
0.2
0.3
0.4
0.5
0.6
0.7
0.8
0.9
1
1−Specificity
Sen
sitiv
ity
Auto−Probit: with gAuto_Probit: without g
Figure 3. Comparing the auto-probit model with and without annotation uncertaintyby ROC curves based on 10-fold cross-validation. [Top]: predicting intracellular signalingcascade in the CC network; [Bottom]: predicting chromosome organization and biogenesis inthe OOB network.

26 Biometrics, xxx 2009
Table 1
Hyperparameter setup
CC network OOB network
τ 2 0.30 1.00σµ in proposal 0.4 0.4
βmin 0 0βmax 0.0032 0.0002
σβ in proposal 0.0001 0.0001

Network-based auto-probit modeling for protein function prediction 27
Table 2
Estimated posterior means, Monte Carlo standard errors and 95% credibility intervals for the CC network with the modelin Section 2
CC network
Parameter Degree Estimate 95% credibility interval
β − 0.0017 (0.0015, 0.0019)µY CR026C 1 −0.212 (−0.227,−0.197)µY CR038C 15 0.158 (0.153, 0.162)µGB035C 25 0.082 (0.078, 0.086)
µY MR037C 40 0.136 (0.132, 0.139)µY LR229C 58 0.157 (0.154, 0.160)

28 Biometrics, xxx 2009
Table 3
Estimated posterior means, Monte Carlo standard errors and 95% credibility intervals for the OOB network with the modelin Section 2
OOB network
Parameter Degree Estimate 95% credibility interval
β − 1.4764 × 10⁻⁴ (1.2608 × 10⁻⁴, 1.6921× 10⁻⁴)µY BR172C 1 0.434 (0.374, 0.495)µY AL010C 15 −0.062 (−0.125, 0.000)µY LR068W 50 0.129 (0.072, 0.186)µY BL002W 100 −0.351 (−0.411,−0.292)µY LR175W 202 0.221 (0.161, 0.282)

Network-based auto-probit modeling for protein function prediction 29
Table 4
Summary of AUC for predictions on CC and OOB networks
Predicting ISC on CC Predicting COB on OOB
Train model on subnetwork and
evaluate performance on subnetworka 0.7539,0.6641b 0.7259, 0.6616
Train model on large network andevaluate performance on subnetwork 0.8061, 0.7766 0.6541, 0.6417
aThis is the analysis in Section 4.4bThe first number is AUC from the auto-probit model with g; the second number is AUC from the auto-probit model without g.