network imprinting and the variability of venture capital ... · network imprinting and the...
TRANSCRIPT

Network Imprinting and the Variability of
Venture Capital Firm Performance
Demetrius Lewis
Stanford Graduate School of Business
Abstract
This paper develops and tests a theory of firm entry and network imprinting. Socio-
logical theory of networks indicates that firms positioned in the center of a market’s
social network are more capable and have better access to resources. What results is
a Matthew effect where the more central firms have access to better resources and can
thus sustain outstanding performance for new firms entering a network. The closer
to the center firms enter, the better they should perform. In this paper, I posit
that new firms entering at the center of a pre-existing network are not necessarily
better off, nor are the firms that enter at the periphery strictly worse off. Instead,
firms that enter into the center are subject to both middle status conformity and
learning myopia that leads to exploitation. On the other hand, firms that enter into
the periphery develop an orientation toward external search that motivates them to
be explorers. I test this theory using data on the co-investment networks of venture
capital firms collected from 1981 to 2014. My results indicate that venture capital
firms that enter into the center of the network experience are less likely to die, but
also less likely to have extreme success. The converse is true for firms that enter into
the periphery. I supplement my empirical analysis with qualitative interviews with
venture capitalists to better understand the micro mechanisms at work.
1

Does occupying the center of the interfirm network result in better firm outcomes?
Research on interfirm networks has suggested that there are there are benefits as-
sociated with the core of the network (Podolny, 1993). The center affords firms
more status and influence (Brass & Burkhardt, 1993; Ibarra, 1993), more positive
perceptions about the rest of the network (Ibarra & Andrews, 1993), and access to
better resources (Tsai & Ghoshal, 1998). The center affords access to higher quality
resources and exchange partners and is the most desired location in the network
(Tsai, 2001).
The main findings of this work have stood up to a variety of empirical specifi-
cations and tests. However, one characteristic of this research is that it often treats
the pool of network actors as static over time (for a review, see Hoang and Anton-
cic (2003)). This research follows a selected group of actors and observes how they
perform. This analytic approach is useful for thinking about how current network
positions impact firm outcomes. However, the static assumption treats the network
growth of all firms the same (Hite & Hesterly, 2001). Thus, even when the complete
network is used, it is only possible to draw inferences about outcomes insofar as they
relate to the actors included in the initial survey at the time of observation. In actu-
ality, most new entrants in the network emerge and form ties to existing players in
the market. When a new firm enters the network, it inherits the social surroundings
of the firms it first forms ties to.
Excluding a time dimension from network analysis can obscure important pat-
terns of social influence. For example, a firm that has just entered the network
might have the same pattern of ties as a firm whose tenure in that position is longer.
Under the static approach, collapsing across the whole network implies structural
equivalence between the two firms. However, the newer firm has not yet established
the performance record to yield status and resources of its own. Instead, it is likely
to be more dependent on its ties than the established firm with the same set of ties.
This illustrates that considering the dynamic aspect of the network is critical for
thinking about the effect of network positions at various stages of firm life. As an
artifact of collapsing, the static perspective suggests that occupying the center of the
2

network should result in uniformly better outcomes for firms that reside there, all
else equal. But, thinking dynamically reframes the opening question: does entering
into the center of the network result in better firm outcomes?
In this paper, I argue that the social surroundings a new firm is initially exposed
to form the basis of a social-structural imprint for the newly entered firm. I theo-
rize that the same characteristics of the center that prevent bad outcomes for firms
also demotivate external search for new firms. For firms entering into the center,
the modest status boost afforded by association with existing firms benefits initial
operations but also induces constraint through middle status conformity (Phillips
& Zuckerman, 2001). Because early success is more likely in the center, firms that
enter here encounter a kind of competency trap that demotivates additional search
(Levinthal & March, 1993; Levitt & March, 1988). On the other hand, the periphery
is not necessarily a good place to be, because it cannot confer status as easily, but
it is freeing. Like Simmel’s “strangers,” firms in the outside of the network are not
subject to the social constraints of the center and are free to pursue the opportu-
nities they wish (1950). Search under adverse conditions can lead to failure, but it
may also bring success from far afield (Fleming, 2001). Firms that find success this
way escape the competency trap by learning that they must be more resourceful,
more creative, and more pioneering or else they will fail. These social and cognitive
processes influence firms towards a tradeoff between core and periphery that cor-
responds with the tradeoff between exploitation and exploration (March, 1991). I
build these arguments into a theory of firm entry and network imprinting. I argue
that the exploitative tendencies of the center that protect firms entering here from
very bad outcomes also demotivate behaviors that lead to very good ones. In the
periphery, firms are more likely to fail, but are free to carry out innovative search
that leads to unforeseen success.
I test this theory in the context of venture capital co-investment networks.
There are many industries where strategic collaboration between firms is just as
important as interfirm competition. Firms often pool together resources to em-
bark on joint endeavors in biotechnology, manufacturing, and investing (Faems, Van
3

Looy, & Debackere, 2005; Powell, Koput, & Smith-Doerr, 1996; Li & Rowley, 2002).
Similarly, venture capital firms share information, trade complementary skills, and
depend on each other for financial support (Bygrave, 1987). The network determi-
nant of performance for venture capital firms is important (Hochberg, Ljungqvist,
& Lu, 2007). A venture capital firm forms a tie with another when they jointly
invest in a portfolio company as a part of a syndicate group. A focal firm enters
into the center of the network by making its first investment with existing firms that
are more centrally connected. The firm enters into the periphery of the network
by making its first investment with existing firms that occupy sparse regions of the
network. I propose that entering into the center promotes a set of strategies and
behaviors that shrink the variance of performance outcomes. Firms that enter into
the center are less likely to experience left-tail outcomes, which I define as becoming
defunct. However, they are also less likely to experience right-tail outcomes, which I
define as a notable acquisition or IPO. Conversely, firms that enter into the periph-
ery will be more likely to fail, but also consistently more likely to experience notable
acquisitions and IPOs. I analyze approximately 54,000 funding events over almost
thirty-five years of data to build a venture capital investment network. As the net-
work evolves over time, new firms enter and attach themselves to existing firms by
engaging in investments with them. I find that the firms that enter into more central
locations remain in operation longer. However, they are also less likely to experience
extremely positive success in the investments they make. The opposite is true of
firms whose first investment places them in the periphery. At face value, a review of
the current research suggests that entering into different parts of the network might
suggest only a divergence in mean outcomes. But, the results indicate that a critical
shift in performance trajectory occurs in the variance of outcomes.
Firm Entry and Network Imprinting
Firms that enter an existing network inherit most of their position from the extant
ties of the firms to which they attach. Many of the conditions that firms face at
birth are imprinted on them for life (Stinchcombe 1965). I argue that the initial
4

network position is one such imprint. The prevailing social structure a firm enters
into influences the opportunities, resources, and strategies it has access to (Carroll
& Hannan, 2000). An important way of conceiving of this social structure is the
interfirm network. Network theory is a useful lens for thinking about how social po-
sitions affect performance in many domains. These include learning, innovation, and
other strategic behaviors (Ahuja, 2000; Powell et al., 1996; Uzzi, 1996). Networks
provide an opportunity structure of social, financial, and technical resources that
are particularly useful for facilitating entrepreneurial behavior (Aldrich & Zimmer,
1986). At the individual level, entrepreneurs rely on contacts in their network to
discuss how to plan their business and implement these plans (Greve & Salaff, 2003).
At the firm level, interfirm networks help a burgeoning firm to uncover new strate-
gic opportunities, provide a stream of resources, and confer reputation and status
(Hoang & Antoncic, 2003).
The key claim of much of this research is that the center of the network contains
the richest clusters of exchange partners, strategic opportunities, and resources. At
the individual level, employees located closer to the center of the network are treated
as if they have more power (Brass & Burkhardt, 1993; Ibarra, 1993). At the firm
level, occupying the center of the network builds access to social capital and a consis-
tent stream of resources (Tsai & Ghoshal, 1998). Organizational units located closer
to the center of the network have greater access to informational spillovers from other
units, and are able to leverage these into generating more innovations of their own
and improving their own performance (Tsai, 2001). The ties a firm maintains not
only provide it with resources and information, but also signal its merit (Podolny,
2001). Firms that are located in the center signal that they are higher status and
more legitimate, and thus are more attractive exchange partners (Podolny, 1993).
By contrast, peripheral actors are usually relatively unknown, have less status,
and also have lower access to potential exchange partners and resources (Borgatti
and Foster, 2003). The films of movie producers in the Hollywood film industry who
are more peripheral in their network of earn less money in the box office (Ferriani,
Cattani, & Baden-Fuller, 2009). Similarly, joining a less accomplished filmmak-
5

ing group confers a cumulative disadvantage that persists over time for receiving
Academy Award nominations (Rossman, Esparza, & Bonacich, 2010). Individuals
who were less central the advice network of a firm suffer in job evaluations from their
group leaders (Sparrowe, Liden, Wayne, & Kraimer, 2001). At the organizational
level, service organizations who were more peripheral in inter-organizational flows of
communication and joint activities are granted less influence in inter-organizational
meetings and transactions (Boje & Whetten, 1981). Firms that are located in the
periphery have a more difficult time perceiving the network and trusting potential
exchange partners (Krackhardt, 1990). Their resulting exchange relationships are
less reliable (Powell et al., 1996). These results suggest that for a group of potential
entrants who are otherwise equal, entering into the center should produce better
outcomes. Similarly, firms that enter into the periphery should perform worse.
Up to this point, firms are treated as having equal propensities to enter the
network at any location. This is unlikely to be the case. There may be entrants
with pre-existing connections or prior stocks of capital that exert greater influence
on their starting location. However, this variability actually suggests another reason
that better outcomes should be observed for firms in the center: a disproportionate
share of better-endowed firms are granted entry here. When firms enter the network,
they jostle to obtain the positions that are most advantageous. The center of the
network is more resource rich than the periphery (Tsai & Ghoshal, 1998). However,
it is not possible for every firm to set up in the center. Firms that have greater
initial endowments of social, financial, and technical capital can leverage these to
outmaneuver less capable firms in order to occupy these positions. Firms that are
less endowed to begin with do not get this head start. They are often marginalized
and shouldered into the periphery. Second, firms that occupy the center tend to have
more status and influence in the network (Brass & Burkhardt, 1993; Ibarra, 1993).
This influence gives central firms a greater deal of power in choosing what other
firms they would like to have as exchange partners. Because the locus of control is
in central firms’ hands, they act as gatekeepers in deciding who gets to connect with
firms in the center of the network. Firms with larger initial endowments make for
6

more attractive exchange partners to existing firms because they bring a greater pool
of resources and capabilities to the relationship. At the same time, they are new
and have not gained a great deal of status and influence in their own right. Thus,
they pose less of an initial competitive threat and may be more easily cowed. Thus,
better-endowed firms are more likely to be chosen by existing central firms. Less
endowed firms do not receive these invitations or have their own refused. Combined,
jostling for position by entering firms and gatekeeping by existing firms suggests that
there is differential selection into the center: more capable firms are the ones that
are allowed into the center of the network.
Better firms sort into the center and worse ones sort into the periphery, on
average, and the center of the network contains the myriad benefits chronicled by
networks research. This suggests that there is a Matthew effect for firms that enter
into the center. Not only should they be better off due to their higher initial endow-
ments, but they also have access to better resources going forward. The distribution
of performance outcomes for firms that enter into the center should be unilaterally
better than the distribution of performance outcomes for firms that enter into the
periphery. Figure 1 represents this visually.
[insert Figure 1 about here]
Entering into the center of the network gives firms an initial resource advan-
tage and may improve mean outcomes, as suggested by Figure 1. However, there
are other dynamics that, over time, could make the center less advantageous. An
important dynamic is the process of search and learning. Operating in the cen-
ter of the network promotes a predictable pattern of behavior. It influences the
expectation of reciprocal exchange with prior partners and supports it at a lower
cost (Katz, 1982; Marsden & Campbell, 1984). Firms get better at finding and ex-
ploiting resource complementarities as more dimensions of expertise are uncovered
(McPherson, Smith-Lovin, & Cook, 2001; Uzzi & Spiro, 2005). They design long-
term interfirm strategies with a densely connected group and are able to build trust
with this group (Dahlander & McFarland, 2013; Sorenson & Stuart, 2001). Trust
7

promotes the ability to mobilize resources, so firms in the center are relatively more
incentivized than those in the periphery to engage with the same exchange partners
again (Ahuja, 2000; Coleman, 1988). Organization theory suggests that tradeoff be-
tween exploration and exploitation suggests that the behaviors inherent in operating
in the center or the periphery may reflect diverging motivations for external search
(March, 1991).Firms that are predominantly explorers tend to face a wider range of
outcomes because their search patterns introduce more variance into their behavior
(Gupta, Smith, & Shalley, 2006). Conversely, firms that are exploiters experience a
smaller range of outcomes because they do not jump around their search landscape
as much, reducing the variance for any one type of firm.
The tradeoff between exploration and exploitation suggests that experienc-
ing better performance outcomes may not be about who has the best access to
resources. Instead, it may be about who has the greatest motivation for external
search (March, 1991). The benefits of the center of the network may be a double-
edged sword that actually removes the motivation for external search. This can occur
for social-structural reasons. When firms enter into the center, they gain a modicum
of status by associating with high status, influential firms, rather than earning it via
their own success. This tension creates a middle status conformity problem (Phillips
& Zuckerman, 2001). Deviation from prevalent models high status and influential
firms espouse may carry severe penalties and can result in expulsion from the cen-
ter (McPherson et al., 1992). Engaging in exchange relationships with other actors
that have more status or power may provide exclusive opportunities, but these com-
mitments often become binding. Expectations of reciprocity, or outright obedience,
impact the strategic choices a firm makes. The motivation for external search may
also be removed for cognitive reasons. In the center, firms find success by facilitating
consistent interaction among a connected core of actors (Obstfeld, 2005). Yet, expe-
riencing early positive returns in this manner can produce myopia that discourages
exploration out of this mold (Levinthal & March, 1993). After experiencing success
in a particular manner, firms’ future behavior is tinged by a competency trap that
removes the desire to break out of the firms’ existing search architecture (Denrell &
8

March, 2001; Levitt & March, 1988). Similarly, working with the same group of firms
repeatedly is good for refining existing information and working habits (McPherson
et al., 2001; Obstfeld, 2005). But, it closes off the clustered individuals from new and
distant information (Guimera, Uzzi, Spiro, & Amaral, 2005; Reagans, Zuckerman,
& McEvily, 2004). It encourages an overreliance on existing frameworks of action
rather than the development of new strategies (Uzzi, 1997). In addition, working
groups that are more familiar with each other tend to bring in prior mental models
into new work and are blin ded to new information and sources for ideas from far
afield (Perretti & Negro, 2007; Skilton & Dooley, 2010).
On the other hand, in the periphery a firm is free to explore and adopt its
own preferred strategy and to pursue the opportunities it wishes, which promotes
external search. There are fewer resources available to capture and exploit. Instead,
firms are motivated to explore the landscape for novel ideas and strategies to employ.
In the periphery, benefits arise from networks comprised of disconnected individuals
rather than connected others (Lazer & Friedman, 2007). Firms form sparsely knit
arrangements that are a structurally diverse web (Granovetter, 1973). This web
integrates information and resources from disparate regions of the market (Burt,
2004). External search with new combinations of ideas implies greater variability
that can produce unforeseen breakthroughs (Fleming, 2001). This allows firms in
the periphery to access distant information that is often locally unavailable (Reagans
& Zuckerman, 2001; Van Alstyne & Brynjolfsson, 2005), combine the information in
new ways beyond the additive effect of each resource alone (Burt, 2004; Reagans &
McEvily, 2003), and use it to create strategic opportunities that existing firms have
not been able to capture (Zaheer & McEvily, 1999).
The periphery is not a resource rich area, which limits the potential for long-
term viability. Yet, it is also socially and cognitively freeing. The very foundation of
what makes the center consistent and reliable can remove the motivation for exter-
nal search. On the other hand, the adverse conditions present in the periphery may
increase the motivation for external search. This presents two possible treatment ef-
fects. Under the homogeneous treatment effect, entering firms are uniformly exposed
9

to the increased motivation to search, and the resulting tendency toward exploration
sometimes results in the discovery of great strategies and ideas. It is also possible
to conceive of a heterogeneous treatment effect. The heterogeneous treatment effect
follows from returning to the fact that not all firms that would like to get into the
center can do so. In general, this sorting process reflects firms’ actual endowments
and capabilities, and the less capable firms are selected into the periphery and fail.
However, there may be some more capable firms that end up in the periphery “by
accident.” For the more capable firms that end up in the periphery, the same adverse
conditions here that motivate them to be more exploratory may also stimulate them
to outperform other capable firms in the center. These lead to the same predictions:
the factors active in the periphery influences the variance of the firms located there.
This leads to a different set of predictions than those of Figure 1. It no longer ap-
pears to be the case that the periphery should produce unilaterally worse outcomes.
Instead, the explorative tendencies of the periphery should increase the likelihood of
very bad outcomes, but also allow for the possibility of very good ones. On the other
hand, the exploitative tendencies that make the center more stable should reduce
the likelihood of very bad outcomes, but also stifle the possibility of very good ones.
Thus, the center is a buffer from extreme outcomes, but this buffer cuts both ways.
In the periphery, no buffer exists. Firms are free to make their own way—if they find
success, it uniquely their own, but if they do not, then there is no insurance against
failure. I expect firms that enter in the periphery of the network to end up in the
tails of the performance distribution for all firms. Firms that enter into the center
of the network should end up closer to the center of the performance distribution for
all firms.
Hypothesis 1. The more central (peripheral) in the network a firm’s starting
position is, the less (more) likely it is to experience left-tail performance outcomes.
Hypothesis 2. The more central (peripheral) in the network a firm’s starting
position is, the less (more) likely it is to experience right-tail performance outcomes.
Figure 2 represents this visually. In addition, this setup represents a conservative
10

test of my hypothesis because of positive selection. Firms that are better endowed
should be entering into the center, while firms that are worse endowed should set
up at the periphery, where resources are fewer. Therefore, if firms that enter into
the periphery consistently find right-tail success at a higher rate then firms at the
center, this result is all the more striking.
[insert Figure 2 about here]
Empirical Setting
The co-investment networks of venture capital firms are a useful place to test these
predictions. For venture capital firms, engaging in collaborative investments with
other firms is just as important as interfirm competition. Firms engage in invest-
ments with other venture capital firms as part of syndicate groups. These arrange-
ments help to diversify the risk associated with any one venture, break down infor-
mation asymmetries between firms investing in different rounds of a project, and
build complementary and diverse expertise for evaluating, managing, and mobilizing
resources for startup ventures (Admati & Pfleiderer, 1994; Bygrave, 1987; Lerner,
1994; Sah & Stiglitz, 1984; Wilson, 1968). As this process repeats itself, venture
capitalists develop a network of co-funders over time. Any particular venture capi-
talist’s network can grow to take on a variety of structures. This will depend on the
type of investments undertaken, the number of investments pursued, and the other
venture capitalists a focal firm works with. At the population level, these individual
events aggregate to form the larger venture capital co-investment network.
Research has shown that networks are important for venture capitalists and
the entrepreneurs they fund (Hochberg, Ljungqvist, & Lu, 2007). Networks deter-
mine access and exposure to information and resources (Aldrich & Zimmer, 1986;
Hochberg, Ljungqvist, & Lu, 2007). They contribute to brand image and provide a
support system when times are tough (Stuart, Hoang, & Hybels, 1999). They also
determine the flow of deals a company is exposed to and eventually pursues (Soren-
son & Stuart, 2001). In light of these results, it is evident that the co-investment
11

network influences the strategies venture capital firms are able to pursue.
To better understand the micro mechanisms of this process, I conducted a series
of semi-structured interviews with eighteen venture capitalists. These individuals
worked at firms operating in locations ranging from the Silicon Valley in California to
New Delhi, India.1 I spoke to venture capitalists about the considerations they made
when determining what made others more attractive exchange partners, how they
used their interfirm networks, and also how they would like to position themselves
in the network.
All venture capitalists described the most advantageous network location as the
center. They spoke about the desire to be a part of the densely connected group at
the center and the benefits this would confer. They describe the venture capitalists
located here in glowing terms: as having more status, better visibility and brand
recognition, more resources, easier access to limited partner funds, and more hits
and prior success for their investments. This is consistent with the unilateral core-
periphery dynamic depicted in Figure 1, where, among a group of entrants, those that
position themselves in the center should experience unambiguously better outcomes.
Venture capitalists also spoke about the desire for stability and consistency
above all. One remarked on balancing risk with potential success, “Unicorns are
nice, but we can’t pursue them as a strategy.” Another described the center of the
network as a comfortable place, commenting, “We could really sit back and make
everything we need to off of just our managing fees alone—there’s no real need to
explore elsewhere.” One venture capitalist said fondly of a group of investors he had
worked with before, “You have a group of people you know you can get together and
the project is going to hit a certain outcome.” Overall, the interviews suggested that
venture capitalists value the center as the most resource and information rich location
in the network. They also value the center for its ability to grant consistency and1I gathered an initial sample of six firms through these firms’ connection to Stanford Gradu-
ate School of Business’ Curriculum Development Department. I then used a snowball sample tocontact additional venture capital firms for interview. Building the sample this way introduces thepossibility for survivor bias to tinge the kinds of responses venture capitalists’ give. In interviews,however, venture capitalists spoke freely about their own experiences and biases as well as interfirmsocial interactions more broadly. Importantly, these comments often took the perspective of lesssuccessful and well-known firms. This balance in venture capitalist responses alleviates concernsabout the qualitative results only reflecting a one-sided view, i.e., a portrait of success.
12

ensure long-term survival. All else equal, a venture capitalist would always prefer
to locate in the center instead of trying to “get lucky” in the periphery and face the
risk of failing.
However, my interviews uncovered drawbacks to the center as well. The center
appears to promote a closing off effect where venture capitalists engage with the same
investors on the same projects over and over again. Some of the mechanisms reflect
the social-structural constraints of the center. Venture capitalists also spoke of the
social pressure that exists as a byproduct of investing with other firms. One told the
story of investing together with an influential, high-status firm earlier in his firm’s
history. He said that the visibility was good, but it created expectations: “It got
very hard to say no to the deals they would send across our desk.” He described the
situation where regardless of his firm’s own strategy or preferences, the more powerful
firm impacted his investment behavior and was able to influence the less powerful
firm to follow its wishes. Another venture capitalist explained that interacting in the
center was necessary because of the ability to mobilize resources there, but expressed
reticence at what the costs down the road could be. “There are people you want to
call, and people you have to call,” he said. Other mechanisms parallel the cognitive
constraints outlined in the literature. The same venture capitalist that reflected
fondly on his working group commented that the group “knew what worked”—they
generally took on the same kinds of projects when reconvening again. Another
mentioned that when deciding what other firms would be best in a syndicate for a
particular project, he often based the decision on prior experience. Once two firms
established a particular working relationship, they tended to rely on the tie again.
Importantly, the tie seems to be used for the same kinds of investments when it is
reused.
Venture capitalists spoke of the periphery in terms of its untapped, yet unknown
potential. One said, “We know there’s a huge volume of deals out there, but they
require a lot more sifting through.” At the same time, he explained that a good
deal coming from a relatively unknown area could provide a huge opportunity if his
firm could secure a large equity stake by being one of the first to fund it. “The deals
13

coming from the denser part of the network are better,” he said, “but they’re already
scooped.” He went on to explain that he knew he was guaranteed a higher rate of
success on a given deal of the latter type. But the ceiling on how profitable it could
be for the firm is much lower because the advantageous equity positions are already
taken. In this sense, the very best deals represent strategic opportunities that are yet
to be captured by other firms. Because there is more room for these opportunities
to move around the periphery without getting snapped up, unicorns can be picked
up from here.
My interviews enhanced my understanding about the tradeoffs present in the
center and periphery of the network. In the center, there is a steady stream of deals
available to choose from, and it is easy to mobilize resources. As a venture capital
firm gains experience working with other firms, other firms are more likely to come
to it with deals in the future as well. At the same time, this process creates a cycle
where venture capitalists located in the center end up working on the same people on
the same kinds of projects over and over again. On the other hand, in the periphery,
venture capitalists may not get dependable deals coming across their desk as often,
but they get deals from far afield. And, they have the freedom to pursue the invest-
ments they choose. The center of the network guarantees stability and consistent
returns. The periphery of the network motivates external search that is beneficial
for exploration. While exploration can be risky, it also increases the likelihood of
discovering great, uncaptured ideas. For venture capitalists, I argue that entering
into the center of the co-investment network decreases left-tail outcomes, which I de-
fine as death. But, entering into the center of the co-investment network should also
decrease right-tail outcomes, which I define as successful initial public offerings and
positive acquisitions achieved by a venture capitalist’s investment portfolio. I test
these predictions by measuring these variables as a function of the network location
of other members of first syndicate group a venture capital firm participates in.
14

Research Design and Measurement
I use the venture capital firm-level co-investment network as my strategic research
setting. To test my predictions, I built several sources of data and integrated several
others. I compiled information about funding events from Preqin Venture Deals
Analyst, which populates its database using filings that must be reported when a
venture capital firm invests in a startup. It matches these to the startup companies
on the receiving end of the funds. This catalogue of events contains 14,197 unique
venture capital firms engaging in 65,123 investments. These events occur over an
observation window of 1981 to late 2014. While some venture capitalists stake out
investments as single firms, the majority of investments are undertaken as a part of
a syndicate group. About half of the syndicates are comprised of groups of three of
larger. Figure 3 illustrates the frequency distribution of syndicate size.
[insert Figure 3 about here]
Dependent Variables: Venture Capital Outcomes
My analysis centers on how network entry influences the variance of venture cap-
ital performance outcomes. To investigate the spread of performance, I center on
outcomes that occur at the tails of the performance distribution. In the right tail,
I focus on performance outcomes that venture capitalists agree upon to be highly
desired and also difficult to attain. These outcomes include successful initial pub-
lic offerings and positive acquisitions of startups the firm has invested in. These
outcomes correspond with what the interviews illustrated about what venture capi-
talists aspire to and how they perform and have also been used in prior research as
a measure of venture capital firm success (Hochberg, Ljungqvist, & Lu, 2007). Tak-
ing a company public is a highly desired outcome. One venture capitalist remarked
about the qualities he looks for in entrepreneurs, “What we want is an entrepreneur
that is in it until the end. Their goal is to IPO.” Initial public offerings are also
extremely rare. Of the 34,622 startup firms that receive venture funding in the data,
15

only 86 of these go public. I compile initial public offering data from ThompsonOne.
Having a startup acquired confers less prestige, but positive acquisitions are also a
desired outcome. They provide positive media attention and grant status, brand
recognition, and large inflows of cash to the firm. I integrate acquisition data from
Crunchbase because they compile acquisition events based on media coverage as well
as financial filings. While acquisitions made for a slight loss or no gain do not gain
a lot of media attention, those sold for positive gains do. Reading the tenor of the
media coverage for acquisition events allows us to build a pool of acquisitions that
represent strongly positive events for the companies involved. They are less rare
than initial public offerings, but are also very uncommon. Only 1,217 out of the
34,622 startup firms in the data experience this outcome. Following this, I define
the variable Acquisition or IPO as the yearly count of companies a venture capital
firm has invested in that have been acquired or IPO’d.2
In the left tail, I focus on outcomes that are a result of poor performance and are
agreed upon to be undesired. We characterize the left tail as firm death. A venture
capital firm “dies” when it is unable to attract capital from limited partners to raise
a new fund. Limited partners decide whether or not to allocate capital for a new
fund based upon a venture capitalist’s investment history. Limited partners look for
a portfolio that has a proven track record of success with securing follow-on rounds,
for example, or one that shows high potential for future success. If they are satisfied
with the venture capitalist’s progress, they will raise another round. Another limited
partner may decide to raise a round as well. Venture capital firms compete with each
other to secure the most lucrative deals with the best entrepreneurs; in a more passive
sense they also compete for limited partner funds. If no limited partner is interested
in working with the venture capital firm, it is unable to raise a fund and eventually
dies when its active funds run out and it is unable to invest any more. In accordance
with this, I consider a venture capital firm as no longer active when it does not invest
for over two years since its last funding event and name this variable Defunct.2 More than one venture capitalist can invest in a particular startup, either as a part of a
syndicate group or on separate funding rounds. So, the sum of Acquisitions or IPO across allfirm-year observations is greater than the raw 1,217 count observed among startups.
16

Investment skills are transferrable across organizational housing. So, the indi-
vidual venture capitalists of a defunct firm could decide to cut the losses sustained
and reorganize as a new firm. However, this does not appear to be how venture
capitalists behave. When approaching the fund raising and renewing window with a
portfolio that is inadequate, some venture capitalists engage in what some call “logo
collecting.” This practice involves buying into the late stages of high status deals for
a large amount of capital but without a large share of equity (and therefore without
a large potential for profit). The collectors then “put the logo on their mantle,” as
one venture capitalist put it, and use this apparent portfolio boost to try to attract
quality entrepreneurs and lobby for renewing or raising a limited partner fund. Ven-
ture capital firms in this position also try to gain extensions on their funds, and may
do so by making a case for why a particular company needs more time to develop.
This pattern of reactions to potential failure indicates that it is agreed upon to be
an undesirable outcome. The negative language used to describe the struggles of
firms in this position also indicates that there is a stigma associated with poor per-
formance. These observations illustrate that firm death is an effective measure of a
left-tail outcome for a venture capital firm.
Independent Variables: Co-investment Network and Additional Con-
trols
The investment history of each venture capital firm provides the foundation for
building the co-investment network. Firms can send and receive ties by investing in
portfolio companies with one another. When two firms invest as a part of the same
syndicate, they become tied bidirectionally. The network is comprised of a densely
connected center with a surrounding periphery. I depict this visually in Figure 4,
where each vertex is shaded by the highest k-core to which it belongs. The k-core
of a network is the subgraph for which the degree of each node in the subgraph is
k or more (Seidman, 1983). The coreness of a node k corresponds to the highest k-
core to which it belongs. Vertices with the lowest coreness are colored in the lowest
color frequencies (red and orange) and gradually build up to the highest (indigo
17

and violet) as the coreness becomes high. In 2014, the highest-degree k-core in the
venture capital co-investment network is 46. There are 161 firms in this k-core, which
has a clustering coefficient of .56. The clustering coefficient, calculated as the global
probability that any firm’s ties are also connected to each other, decreases as the
coreness decreases. Figure 5 depicts the number of firms and the clustering coefficient
in each k-core. A firm becomes central in the network by maintaining connections
through making investments with other venture capital firms. I measure a venture
capitalist’s degree centrality as the number of other firms they connect with by
engaging in investments with them. The variable Centrality of entry represents the
sum of the centralities of each of the other venture capitalists that participate in the
first investment a brand new focal firm makes. This variable is an imprint, so it is
set upon entry and remains the same for the focal venture capital firm’s lifetime.
[insert Figure 4 about here]
[insert Figure 5 about here]
I incorporate three additional controls. The first, Syndicate size, measures the
total number of venture capital firms participating in the syndicate round the focal
firm is involved in. This helps to alleviate the possibility that syndicate groups that
are more central are simply comprised of more members. The second, Deal size,
measures the size of the funding round the focal venture capital firm participates in.
The purpose of this variable is to consider the possibility that syndicate groups that
are more central tend to invest in larger funding rounds. If the mechanism of action
that produces my effect were driven primarily by the size of the funding round an
entering firm is exposed to, I should not expect to see any leftover effect for the
centrality variable after deal size is taken into account. The third control accounts
for the possibility that venture capital firms may enter together or that new firms
might attract one another, which could tend to place these firms into the periphery
more often. The variable New syndicate is equal to 1 when the average age in years
of the firms in the syndicate round the focal firm participates in is less than or equal
to 1. That is, the variable indicates when all of the other firms in a focal firm’s
18

syndicate round are less than a year old (age is counted discretely beginning at 1
year). I present descriptive statistics of all variables in Table 1.3 Centrality of entry
is scaled down by a factor of 104 to improve the visual presentation of the results;
the scaling does not affect the substantive content. Deal size is reported in millions,
USD.
[insert Table 1 about here]
Modeling Strategy
To incorporate network characteristics for each of the syndicates, I build a data
structure that models the co-investment network as it evolves. I generate a cross
section of the co-investment network at each time interval in the data and compute
network characteristics for every node at each interval. For each focal venture capital
firm i that participates in an investment at time t′, the other members of its syndicate
are represented by jl, where there are l+1 total members in the syndicate. For each
syndicate investment, I take the network characteristics xjt′ for each of the l other
participants on the investment and match these back to the corresponding focal firm
i for that investment. This builds an index of all the investments a firm participates
in, which includes the corresponding network characteristics for its co-investors (on
that project) at that point in time. Each firm’s network imprint is comprised of the
xjt′ from the members of its initial syndicate group. Since the imprint never changes
for a particular firm, t′ represents the time a firm makes its first investment and
enters the risk set.4
I also observe all subsequent investments each firm makes, and track how well
these portfolio companies perform. Through monitoring a firm’s investment activity,3It is worth nothing that firms that do not die have more observations than those that do not,
and skew the mean of Defunct down. The mean of Defunct is close to 30%, but about 48% ofunique firms go defunct. When predicting this outcome, I model whether a firm ever goes defunct,represented as the function of the the firm’s one-time imprint and matching variables. Thus, thetotal number observations for this model equals the number of unique firms in the dataset, 14,197.
4 As intimated by Figure 3, some firms’ first investments are undertaken alone. I want to ensurethat it is not singleton investors that are driving the centrality effects. To rule out this possibility,I re-run both sets of models including only firms that invest first as a part of a syndicate. Theseresults are presented in Appendix A.
19

it is also evident whether the firm becomes defunct. I use the firm’s investment
trajectory to compile these network and performance outcomes for each firm i in
each year t, so that I have a yearly panel where the unit of analysis is venture capital
firm-years. This provides approximately 37,000 firm-year observations. I model the
dependent variable right-tail and left-tail performance outcomes as a function of the
xjt′ and the controls. For this analysis, I predict the success and failure of each firm
using the combined centrality of the other venture capital firms that participated in
its first investment. This model is estimated
performanceit = µt + βxjt′ + γcontrolsit′ + αi + εit (1)
where µt is an intercept that varies over each year, β is a coefficient, γ is a coefficient
vector, αi is an error term that varies over venture capital firms, and εit is an error
term that varies over venture capital firms over each year.
I supplement this basic model with a Coarsened Exact Matching design. One
matching setup focuses on the initial characteristics of the entering venture capital
firms, and the other on the characteristics of the entering venture capital firm’s initial
investment. Supplementing the baseline model with a matching design accomplishes
two goals. First, Coarsened Exact Matching is a useful tool for estimating causal
treatment effects.5 The use of this identification strategy is to get as clean an effect
of network entry as possible. This setup allows us to eliminate characteristics of
venture capital firms or investments that might make them systematically appear
in one area or another of the network. By doing this, I control in the analysis for
characteristics of first syndicate groups that are correlated with centrality but that
may represent different mechanisms than the ones I advance.
There remains the issue that venture capital firms’ characteristics are observed
as they enter the risk set by making investments. This process occurs simultaneously
to the network imprint rather than before it, so matching on firm characteristics at
this stage does not create true pretreatment groups. I modify the analysis to avoid
this pitfall. The modified setup takes advantage of the fact that while the portfolios5 See Appendix B for an elaboration on the Coarsened Exact Matching Approach and my
identification strategy.
20

of venture capital firms may outperform one another, the return on any independent
investment in the portfolio is random. Similar to stock market returns, a venture
capital firm may invest in five biotech companies and experience the success that one
of them “hits.” But, which of the five goes on to be hit is ex ante subject to chance.
My identification strategy uses this fact, and measures the network imprint as the
centrality of the first syndicate of an investment that “hits.” Here, the firm enters
the risk set when it makes its first investment that goes on to receive a follow-on
round of funding. Here, t ′and the corresponding network variables represent the
other syndicate members’ network positions at the time this eventually successful
investment is made. For approximately 85% of firms, this follow-on investment is not
the first investment they make. This data structure implies that for this matching
setup, 85% of firms are in a true pretreatment group. I use this matching setup to
strengthen the robustness of this identification strategy.
The second goal of matching focuses on accounting for the finite observation win-
dow. To model left-tail outcomes, I use a logistic regression to model the likelihood
of becoming defunct. However, the regression needs to account for right censoring
in the data. I model the hazard of a venture capital firm becoming defunct using
a form of event analysis. My research question investigates the effect of a group of
network variables and a set of controls on the hazard of becoming defunct. It is
less concerned with the particular relationship between a venture capital firm’s age
and this hazard. I want to focus directly on the covariates and do away with this
underlying nuisance function. An obvious choice for this would be the Cox propor-
tional hazards estimator, which would serve this goal while simultaneously avoiding
imposing a functional form. However, I observe a venture capital firm’s death by its
lack of investing rather than its investing activity. Because the data are compiled
based on investment activity, incorporating firm death into a Cox estimator creates
the mechanical issue of inflating the data using artificial data points to mark when
a firm becomes defunct. To avoid this, I use a matching design that creates strata
based on when venture capital firms make their first investment (i.e., enter the risk
set). I alleviate the problem of there being disproportionately more zeros in the De-
21

funct variable for newer firms because these firms are only compared against other
firms that enter at the same time. By building treatment-control cohorts of firms
that exist in parallel in the same portion of the observation window, I do not have
a censoring problem.
The right-tail measure is a discrete outcome. I use count models to analyze the
number of successful acquisitions and IPOs managed. The variance is greater than
the mean for Acquisition or IPO. A goodness of fit test for a Poisson distribution
under the null hypothesis that this variable represents a Poisson process reports a
χ2 statistic of 55203.3 with 43338 degrees of freedom. I reject the null that the data
represent a Poisson process. I turn to the negative binomial class of models, since
they are better equipped to deal with overdispersed data (Hilbe, 2011). I perform
a likelihood-ratio test with the null hypothesis that the dispersion parameter in the
baseline negative binomial model is the same as the Poisson. This test reports a χ2
statistic of approximately 25,000 with one degree of freedom. I reject the null that
the dispersion parameter is the same as the Poisson. One additional consideration
is the heavy skewness in the data. Because these counts are tail events, it is likely
for many firm-year observations to not have any or have very few events occur. It is
impossible for a firm to have negative acquisitions or IPOs occur, while it is possible
to have very many. I provide two additional robustness checks to ensure that our
results are not driven erroneously by the shape of distribution of Acquisition or
IPO. To account for excess zeros in the data, I run a zero-inflated negative binomial
regression to incorporate for the possibility of both structural and sampling zeros in
the data (Lambert, 1992).6 To account for excess skew in the data, I run a quantile
regression estimating the median level of acquisitions and IPOs to avoid for the
possibility that the results are driven by outliers over-influencing the mean (Cade &
Noon, 2003). I use an estimation procedure adapted for use with count data using the
jittering method exposited by Machado and Silva Santos (2005) and implemented by6I also considered an alternative to the zero-inflated negative binomial, a hurdle model that
treats all zeros as structural. The hurdle model produces similar results as the zero-inflated model.I use Vuong’s likelihood-ratio test for non-nested models to compare fit (1989). The null hypothesisis that the models fit the underlying data generating process equally well, while the alternativeis that one model fits the data better. The test produces a z statistic of 25.80 in favor of thezero-inflated negative binomial; I report the zero-inflated model in the results.
22

Miranda (2008). I use 100 jittered samples to build the average-jittering estimator
to calculate the parameters of the model.
All models include year fixed effects and non-matching models cluster standard
errors at the venture capital firm level.
Results
I regress the right-tail and left-tail performance outcomes, Acquisition and IPO and
Defunct, respectively, on the network variable Centrality of entry and a set of con-
trols.
Does Initial Attachment influence Left-Tail Outcomes?
Hypothesis 1 stated that attaching into the center should decrease the likelihood
of experiencing left-tail outcomes, while attaching in the periphery should increase
the likelihood of experiencing left-tail outcomes. The analysis investigates whether
entering into the core or periphery influences a firm’s chances of survival. To ac-
complish this, I regress the outcome variable Defunct on the network attachment
variable Centrality of entry and a set of controls. The results are contained in Table
2.
Column 1 reports the results of a negative binomial regression of Defunct on
Centrality of entry, Syndicate Size, Deal Size, and New syndicate. The coefficient
on Centrality of entry is negative and statistically significant, the coefficient on
Syndicate size is positive and significant, and the coefficients on Deal size and New
syndicate are not significant. This suggests that entering into the center is associated
with a better chance of survival. Conversely, making an initial attachment in the
periphery exposes a firm to a greater risk of death. This result provides support for
Hypothesis 1.
23

Does Initial Attachment Influence Right-Tail Outcomes?
Hypothesis 2 stated that attaching into the center should decrease the likelihood of
experiencing right-tail outcomes, while attaching in the periphery should increase the
likelihood of experiencing right-tail outcomes. The next analysis investigates whether
entering into the core or periphery influences a firm’s chances of runaway success. I
regress the outcome variable Acquisition or IPO on the network attachment variable
Centrality of entry and a set of controls. Table 2 contains this result.
Column 2 reports the results of a negative binomial regression of Acquisition
or IPO on Centrality of entry, Syndicate Size, Deal Size, and New syndicate. The
coefficient on Centrality of entry is negative and statistically significant, the coeffi-
cient on Syndicate size is positive and significant, the coefficient on Deal size is not
significant, and the coefficient on New syndicate is positive and significant. These
results suggest that entering into the center is associated with a lower likelihood of
extreme success. Conversely, making the initial attachment in the periphery provides
a better opportunity for runaway success. This provides support for Hypothesis 2.
Robustness Checks I: Identification
In discussing the research design, I outlined a matching strategy that would help
us to rule out the possibility that venture capitalists with certain types of charac-
teristics would systematically enter into different parts of the network. In doing so,
this would avoid the potential for underlying heterogeneity in initial endowments or
strategies to be the driver of the results. The matching using investment characteris-
tics serves a parallel function by ruling out the possibility that venture capital firms
with different endowments or strategies are systematically tied to first investments
that are located in one part of the network or another. Each of these regressions of
Defunct and Acquisition or IPO on Centrality of entry and the set of controls fol-
low a Coarsened Exact Matching algorithm. The first algorithm focuses on venture
capital firm characteristics. As outlined in the research design, for this group I use
for the network entry variable the first investment a venture capital firm makes that
24

eventually receives follow-on funding in order to build true pretreatment treatment-
control groups in the data. The second algorithm focuses on characteristics of the
investment itself. The results are presented in Table 3.
Column 1 contains a negative binomial regression of Defunct on Centrality of
entry, Syndicate Size, Deal Size, and New syndicate matching on venture capital firm
characteristics. The coefficient on Centrality of entry is negative and statistically
significant, the coefficient on Syndicate size is positive and significant, the coefficient
on Deal size is not significant, and the coefficient on New syndicate is positive and
significant. This result indicates that entering in the center is associated with an
increased likelihood of survival. On the other hand, entering in the periphery is
associated with an heightened chance of dying. Column 2 repeats this regression
matching on investment characteristics. The coefficient on Centrality of entry is
negative and significant, the coefficient on Syndicate size is positive and significant,
the coefficient on Deal size is positive and significant, and the coefficient on New
syndicate is positive and significant. The core result of the two models is that
entering into the center depresses the likelihood of becoming defunct. This bolsters
the support for Hypothesis 1.
Columns 3 and 4 repeat this process for the right-tail outcomes. Column
3 contains a negative binomial regression of Acquisitions or IPO on Centrality of
entry, Syndicate size, Deal size, and New syndicate matching on venture capital firm
characteristics. The coefficient on Centrality of entry is negative and significant, the
coefficient on Syndicate size is positive and significant, the coefficient on Deal size
is positive and significant, and the coefficient on New syndicate is not significant.
This suggests that firms that enter into the center of the network are less likely to
experience runaway success. On the other hand, firms that enter into the periphery
are more likely to experience outcomes in the right tail. Column 4 repeats this
regression, matching on investment characteristics. The coefficient on Centrality of
entry is negative and significant, the coefficient on Syndicate size is positive and
significant, the coefficient on Deal size is positive and significant, and the coefficient
on New syndicate is not significant. Together, the two models illustrate that entering
25

into the center inhibits the chances of runaway success. This result validates the
findings of Hypothesis 2.
Robustness Checks II: The distribution of right-tail performance
outcomes
The negative binomial model accounts for overdispersion in the count of acquisitions
and IPOs. However, there was additional concern that the shape of the distribution
might influence the results. Many firms do not experience acquisitions at all, and
some firms experience many. I employ two additional estimation procedures to ad-
dress this. The zero-inflated negative binomial accounts for the excess zeros present
in the data. The quantile regression estimating the median, rather than the mean
level of acquisitions and IPOs, takes the skewness of the data into account. The
results are presented in Table 4.
Columns 1 and 2 report the results of a zero-inflated negative binomial regression
of Acquisition and IPO on Centrality of entry, Syndicate size, Deal size, and New
syndicate. The negative binomial portion of the model indicates that Centrality of
entry is negative and significant, Syndicate size is not significant, Deal size is not
significant, and New syndicate is positive and significant. The logistic portion of
the model indicates that entering in the center not associated with structural zeros,
increased syndicate size indicates fewer structural zeros, a larger deal size indicates
fewer structural zeros, and a new new syndicate is not associated with structural
zeros. The model suggests that firms may experience acquisitions for both structural
and sampling reasons. But, even when accounting for the data generating process,
firms that enter into the center are less likely to experience right-tail outcomes.
Column 3 contains the results of a quantile regression, adjusted for count data,
estimating the median level of Acquisition and IPO as a function of Centrality of
entry, Syndicate size, Deal size, and New syndicate. The coefficient on Centrality
of entry is negative and significant, the coefficient on Syndicate size is positive and
significant, the coefficient on Deal size is not significant, and the coefficient on New
syndicate is positive and significant. The result indicates that entering in the center
26

is associated with a decreased median likelihood of Acquisitions or IPO. The model
suggests that the previous results are not driven by outliers with extremely high
counts of acquisitions and IPOs. The models in Columns 1 and 2 and Column 3
indicate that even taking into account potential irregularities in the distribution
of right-tail outcomes, the results are not model dependent. These results provide
further support for Hypotheses 1 and 2.
Discussion and Conclusion
My models describe the relationship between the place a new venture capital firm
enters the network and the outcomes it experiences. The first major finding is that
venture capital firms that enter in the center of the network are less likely to become
defunct. On the other hand, firms that enter in the periphery are more likely to shut
down. This result is consistent with the idea that the core of the network provides
a safety blanket. It provides consistent access to resources and quality exchange
partners. This stability allows firms to survive. This idea is summarized in the
arguments leading up to Hypothesis 1.
I go on to explore outcomes in the right tail as well. Venture capital firms that
enter into the center of the network are less likely to experience extreme positive
performance outcomes. Conversely, firms that enter into the periphery of the network
are more likely to achieve performance outcomes in the right tail. This result is
more surprising. It might seem that for firms that are otherwise equal, entering into
relatively more central positions should promote uniformly better outcomes. This
is the naïve illustration in Figure 1. However, organization theory suggests that
there is more to the puzzle than is initially obvious (March, 1991). It belies the
fact that the benefits that make the center more attractive to firms often reflect the
exploitation of safe bets. This means that organizations that “grow up” here take
on a pattern of behavior geared towards capitalizing on already available resources.
This hedging behavior promotes interacting with the same exchange partners, doing
the same kinds of work. This is great for exploitation. Firms build up a specific
27

repertoire of expertise and can execute a specific kind of strategy very well, as one
venture capitalist remarked about having a near certainty with which they could
pursue certain kinds of deals. Because of the pressure for maintaining a consistent
pattern of interaction with other firms, some venture capitalists were influenced into
pursuing deals that did not let them explore their own individual strategies.
Taken together, these factors cut both ways. These examples illustrate that
the center can be a very constraining place as well, with influences stemming from
both cognitive and social-structural mechanisms. While the periphery does have
other problems, notably, the lack of organic resources and notoriety located there, it
is relatively less constraining in important ways. The periphery promotes external,
rather than internal, search. It is home to relatively uncharted idea space, and its
sparse population affords the ability connect these ideas and capitalize on them in
novel ways. One venture capitalist commented about making deals with high status,
well-connected firms, “People will be aggressive when trying to take rewards.” Deals
made in the center required a great deal of cooperative sharing and jostling for
position in order to negotiate high returns. On relatively unknown ideas firms could
source themselves, though, the firms’ successes and failures were all their own. This
applies to both the financial and social dimensions of a successful deal. For already-
exploited deals where a lot of firms are sharing the pie, they must share the financial
windfall the investment brings in smaller slices. On the social side, they also share
the credit, and each of them gains a smaller boost to brand image and recognition.
Often, firms will engage in public or private squabbles over who deserves the credit
for a shared success. One venture capitalist described this as “the particularly nasty
part of the business.” So, the periphery has the potential for a unique snowball effect.
The deals here are not vetted and are on average of lower quality, but come from
far afield, enough so that some may have a wild chance of success. For those that
are executed successfully, firms gain huge returns because the deal is not “scooped”
and the windfall does not have to be shared as widely. Firms also gain huge social
returns in status and brand recognition because it is obvious to others that they are
primarily responsible for the success. They can turn around and leverage both of
28

these types of rewards into attracting new deals from high quality entrepreneurs, and
be the “first one in” on these deals to gain large returns in the next cycle, repeating
the process.
These firms may also be invited to join higher quality deals being brokered by
existing venture capital firms as well. Because of their own independent success, the
status differential in these exchange relationships may be smaller. This could afford
them the protection of not being as easily maneuvered into exploitative investing
as a firm that made its initial investment in a high status group. In this way, it
seems like a firm could eventually thrive by adopting the most effective strategies
promoted in the center and in the periphery. Straddling a bridge between the two
would appear to be a way to capture the benefits of both. This raises an important
question. In this paper, I develop a theory of network entry. I show that network
imprinting has implications for the tendency to explore versus the tendency to exploit
and that this impacts the variance of firm performance. But, how a firm’s initial
ties and formative investments interact with its local network remains an intriguing
puzzle. There is more work to be done on this topic. In particular, it is worth
investigating explicitly how network entry impacts the shape and evolution of the
network itself. Even more intriguing, the tradeoffs associated with occupying each
type of network position imply that experiencing a success or failure in a different
part of the network may have greatly differential effects on a firm’s life. This research
will help us understand the way that these factors, often studied in isolation, interact
to shape the way that a firm forges strategic opportunities and social relationships.
29

Rerefences
Admati, A. R., & Pfleiderer, P. (1994). Robust financial contracting and the role ofventure capitalists. The Journal of Finance, 49 (2), 371-402.
Ahuja, G. (2000). Collaboration networks, structural holes, and innovation: A lon-gitudinal study. Administrative Science Quarterly, 45 (3), 425-455.
Aldrich, H., & Zimmer, C. (1986). Entrepreneurship through social networks. Theart and science of entrepreneurship. Cambridge, MA: Ballinger, , 3-23.
Boje, D. M., & Whetten, D. A. (1981). Effects of organizational strategies andcontextual constraints on centrality and attributions of influence in interorgani-zational networks. Administrative Science Quarterly, 378-395.
Borgatti, S. P., & Foster, P. C. (2003). The network paradigm in organizationalresearch: A review and typology. Journal of management, 29 (6), 991-1013.
Brass, D. J., & Burkhardt, M. E. (1993). Potential power and power use: Aninvestigation of structure and behavior. Academicof Management Journal, 36 (3),441-470.
Burt, R. S. (2004). Structural holes and good ideas. American Journal of Sociology,110 (2), 349-399.
Bygrave, W. D. (1987). Syndicated investments by venture capital firms: A net-working perspective. Journal of business venturing, 2 (2), 139-154.
Cade, B. S., & Noon, B. R. (2003). A gentle introduction to quantile regression forecologists. Frontiers in Ecology and the Environment, 1 (8), 412-420.
Carroll, G. R., & Hannan, M. T. (2000). The demography of corporations and in-dustries. Princeton, NJ: Princeton University Press.
Coleman, J. S. (1988). Social capital in the creation of human capital. AmericanJournal of Sociology, S95-S120.
Dahlander, L., & McFarland, D. A. (2013). Ties that last tie formation and per-sistence in research collaborations over time. Administrative Science Quarterly,58 (1), 69-110.
Denrell, J., & March, J. G. (2001). Adaptation as information restriction: The hotstove effect. Organization Science, 12 (5), 523-538.
Faems, D., Van Looy, B., & Debackere, K. (2005). Interorganizational collabora-tion and innovation: toward a portfolio approach. Journal of product innovationmanagement, 22 (3), 238-250.
Ferriani, S., Cattani, G., & Baden-Fuller, C. (2009). The relational antecedentsof project-entrepreneurship: Network centrality, team composition and projectperformance. Research Policy, 38 (10), 1545-1558.
Fleming, L. (2001). Recombinant uncertainty in technological search. ManagementScience, 47 (1), 117-132.
Gould, R. V. (2002). The Origins of Status Hierarchies: A Formal Theory andEmpirical Test1. American Journal of Sociology, 107 (5), 1143-1178.
Granovetter, M. (1973). The strength of weak ties. American Journal of Sociology,78 (6), 1360-1380.
Greve, A., & Salaff, J. W. (2003). Social networks and entrepreneurship. En-trepreneurship theory and practice, 28 (1), 1-22.
30

Guimera, R., Uzzi, B., Spiro, J., & Amaral, L. A. N. (2005). Team assembly mecha-nisms determine collaboration network structure and team performance. Science,308 (5722), 697-702.
Gupta, A. K., Smith, K. G., & Shalley, C. E. (2006). The interplay between explo-ration and exploitation. Academy of Management Journal, 49 (4), 693-706.
Hamel, G. (1991). Competition for competence and inter-partner learning withininternational strategic alliances. Strategic management journal, 12 (4), 83-103.
Hilbe, J. (2011). Negative binomial regression: Cambridge: Cambridge UniversityPress.
Hite, J. M., & Hesterly, W. S. (2001). The evolution of firm networks: From emer-gence to early growth of the firm. Strategic management journal, 22 (3), 275-286.
Hoang, H., & Antoncic, B. (2003). Network-based research in entrepreneurship: Acritical review. Journal of business venturing, 18 (2), 165-187.
Hochberg, Yael V., Alexander Ljungqvist, & Yang Lu. (2007). Whom you knowmatters: Venture capital networks and investment performance. The Journal ofFinance, 62 (1), 251-301.
Iacus, S. M., King, G., & Porro, G. (2011a). Causal inference without balancechecking: Coarsened exact matching. Political analysis, mpr013.
Iacus, S. M., King, G., & Porro, G. (2011b). Multivariate matching methods that aremonotonic imbalance bounding. Journal of the American Statistical Association,106 (493), 345-361.
Ibarra, H. (1993). Network centrality, power, and innovation involvement: Deter-minants of technical and administrative roles. Academy of Management Journal,36 (3), 471-501.
Ibarra, H., & Andrews, S. B. (1993). Power, social influence, and sense making: Ef-fects of network centrality and proximity on employee perceptions. AdministrativeScience Quarterly, 277-303.
Katz, R. (1982). The effects of group longevity on project communication andperformance. Administrative Science Quarterly, 81-104.
Koka, B. R., & Prescott, J. E. (2008). Designing alliance networks: the influenceof network position, environmental change, and strategy on firm performance.Strategic management journal, 29 (6), 639-661.
Krackhardt, D. (1990). Assessing the political landscape: Structure, cognition, andpower in organizations. Administrative Science Quarterly, 342-369.
Lambert, D. (1992). Zero-inflated Poisson regression, with an application to defectsin manufacturing. Technometrics, 34 (1), 1-14.
Lazer, D., & Friedman, A. (2007). The network structure of exploration and ex-ploitation. Administrative Science Quarterly, 52 (4), 667-694.
Lerner, J. (1994). The syndication of venture capital investments. Financial man-agement, 16-27.
Levinthal, D. A., & March, J. G. (1993). The myopia of learning. Strategic manage-ment journal, 14 (S2), 95-112.
Levitt, B., & March, J. G. (1988). Organizational learning. Annual Review ofSociology, 14 (1), 319-338.
31

Li, S. X., & Rowley, T. J. (2002). Inertia and evaluation mechanisms in interorga-nizational partner selection: Syndicate formation among US investment banks.Academy of Management Journal, 45 (6), 1104-1119.
Liebeskind, J. P., Oliver, A. L., Zucker, L., & Brewer, M. (1996). Social networks,learning, and flexibility: Sourcing scientific knowledge in new biotechnology firms.Organization Science, 7 (4), 428-443.
Machado, J. A. F., & Silva, J. S. (2005). Quantiles for counts. Journal of theAmerican Statistical Association, 100 (472), 1226-1237.
March, J. G. (1991). Exploration and exploitation in organizational learning. Orga-nization Science, 2 (1), 71-87.
Marsden, P. V., & Campbell, K. E. (1984). Measuring tie strength. Social Forces,63 (2), 482-501.
McPherson, J. M., Popielarz, P. A., & Drobnic, S. (1992). Social networks andorganizational dynamics. American Sociological Review, 153-170.
McPherson, J. M., Smith-Lovin, L., & Cook, J. M. (2001). Birds of a feather:Homophily in social networks. Annual Review of Sociology, 415-444.
Miranda, A. (2008). Planned fertility and family background: a quantile regressionfor counts analysis. Journal of Population Economics, 21 (1), 67-81.
Obstfeld, D. (2005). Social networks, the tertius iungens orientation, and involve-ment in innovation. Administrative Science Quarterly, 50 (1), 100-130.
Perretti, F., & Negro, G. (2007). Mixing genres and matching people: a studyin innovation and team composition in Hollywood. Journal of OrganizationalBehavior, 28 (5), 563-586.
Phillips, D. J., & Zuckerman, E. W. (2001). Middle-Status Conformity: TheoreticalRestatement and Empirical Demonstration in Two Markets1. American Journalof Sociology, 107 (2), 379-429.
Podolny, J. M. (1993). A status-based model of market competition. AmericanJournal of Sociology, 829-872.
Podolny, J. M. (2001). Networks as the Pipes and Prisms of the Market. AmericanJournal of Sociology, 107 (1), 33-60.
Podolny, J. M., Stuart, T. E., & Hannan, M. T. (1996). Networks, knowledge,and niches: Competition in the worldwide semiconductor industry, 1984-1991.American Journal of Sociology, 659-689.
Powell, W. W., Koput, K. W., & Smith-Doerr, L. (1996). Interorganizational col-laboration and the locus of innovation: Networks of learning in biotechnology.Administrative Science Quarterly, 116-145.
Reagans, R., & McEvily, B. (2003). Network structure and knowledge transfer: Theeffects of cohesion and range. Administrative Science Quarterly, 48 (2), 240-267.
Reagans, R., Zuckerman, E., & McEvily, B. (2004). How to make the team: Socialnetworks vs. demography as criteria for designing effective teams. AdministrativeScience Quarterly, 49 (1), 101-133.
Reagans, R., & Zuckerman, E. W. (2001). Networks, diversity, and productivity:The social capital of corporate R&D teams. Organization Science, 12 (4), 502-517.
Rossman, G., Esparza, N., & Bonacich, P. (2010). I’d like to thank the academy,
32

team spillovers, and network centrality. American Sociological Review, 75 (1),31-51.
Sah, R. K., & Stiglitz, J. E. (1984). The architecture of economic systems: Hierar-chies and polyarchies. American Economic Review, 76 (4), 716-727.
Seidman, S. B. (1983). Network structure and minimum degree. Social Networks,5, 269-287.
Shimazaki, Hideaki, and Shigeru Shinomoto. (2007). A method for selecting the binsize of a time histogram. Neural Computation 19.(6), 1503-1527.
Simmel, G., (1950). The Sociology of Georg Simmel. (K. H. Wolff, Ed. and Trans.).New York: The Free Press. (Original work published in 1908)
Skilton, P. F., & Dooley, K. J. (2010). The effects of repeat collaboration on creativeabrasion. Academy of Management Review, 35 (1), 118-134.
Sorenson, O., & Stuart, T. E. (2001). Syndication networks and the spatial distri-bution of venture capital investments1. American Journal of Sociology, 106 (6),1546-1588.
Sparrowe, R. T., Liden, R. C., Wayne, S. J., & Kraimer, M. L. (2001). Social net-works and the performance of individuals and groups. Academy of ManagementJournal, 44 (2), 316-325.
Stinchcombe, A. L. (1965). Social structure and organizations. Handbook of organi-zations, 142-193.
Stuart, T. E., Hoang, H., & Hybels, R. C. (1999). Interorganizational endorsementsand the performance of entrepreneurial ventures. Administrative Science Quar-terly, 44 (2), 315-349.
Tsai, W. (2001). Knowledge transfer in intraorganizational networks: Effects ofnetwork position and absorptive capacity on business unit innovation and perfor-mance. Academy of Management Journal, 44 (5), 996-1004.
Tsai, W., & Ghoshal, S. (1998). Social capital and value creation: The role ofintrafirm networks. Academy of Management Journal, 41 (4), 464-476.
Uzzi, B. (1996). The sources and consequences of embeddedness for the economicperformance of organizations: The network effect. American Sociological Review,674-698.
Uzzi, B. (1997). Social structure and competition in interfirm networks: The paradoxof embeddedness. Administrative Science Quarterly, 35-67.
Uzzi, B., & Spiro, J. (2005). Collaboration and Creativity: The Small World Prob-lem. American Journal of Sociology, 111 (2), 447-504.
Van Alstyne, M., & Brynjolfsson, E. (2005). Global village or cyber-balkans? Mod-eling and measuring the integration of electronic communities. Management Sci-ence, 51 (6), 851-868.
Vuong, Q.H. (1989). Likelihood ratio tests for model selection and non-nested hy-potheses. Econometrica, 57, 307-333.
Wilson, R. (1968). The theory of syndicates. Econometrica: Journal of the Econo-metric Society, 119-132.
Zaheer, A., & Bell, G. G. (2005). Benefiting from network position: firm capabilities,structural holes, and performance. Strategic management journal, 26 (9), 809-825.
33

Zaheer, A., & McEvily, B. (1999). Bridging ties: A source of firm heterogeneity incompetitive capabilities. Strategic management journal, 20 (12), 1133.
34

Figures and Tables
Figure 1. Firm Entry and Network Imprinting Under the Matthew Effect
µperformance
freq(performance)
The solid line —– represents firms that enter into the center. The dashed line- - - represents firms that enter into the periphery.
35

Figure 2. Firm Entry and Network Imprinting Under Exploration and Exploitation
µperformance
freq(performance)
The solid line —– represents firms that enter into the center. The dashed line- - - represents firms that enter into the periphery.
36
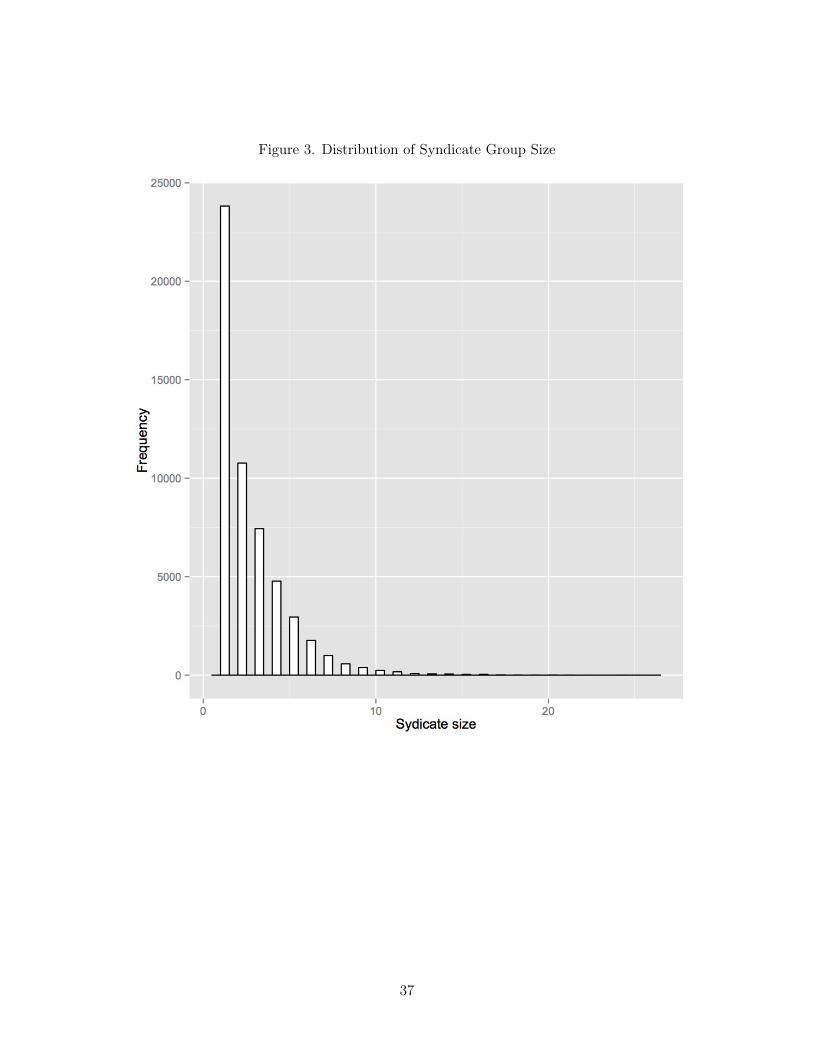
Figure 3. Distribution of Syndicate Group Size
37

Figure 4. Venture Capital Co-investment Network in 2000
Vertices with the lowest coreness are colored in the lowest color frequencies (redand orange) and gradually build up to the highest (indigo and violet) as the
coreness becomes high.
38
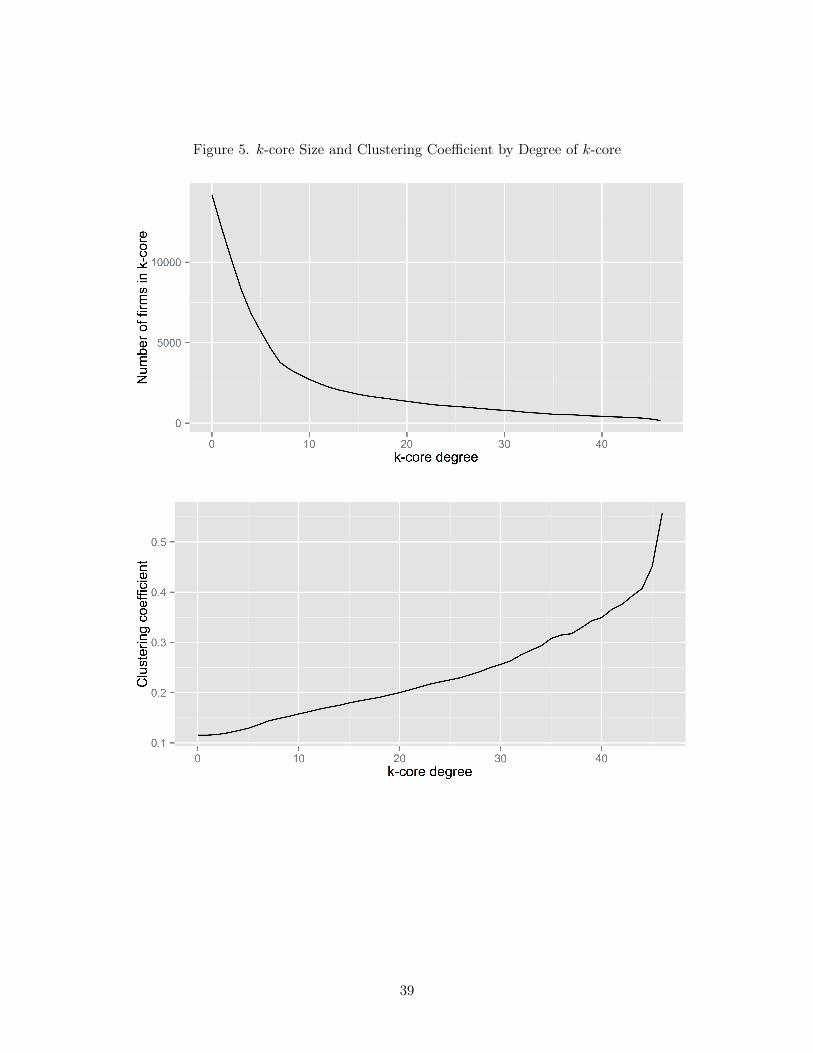
Figure 5. k-core Size and Clustering Coefficient by Degree of k-core
39
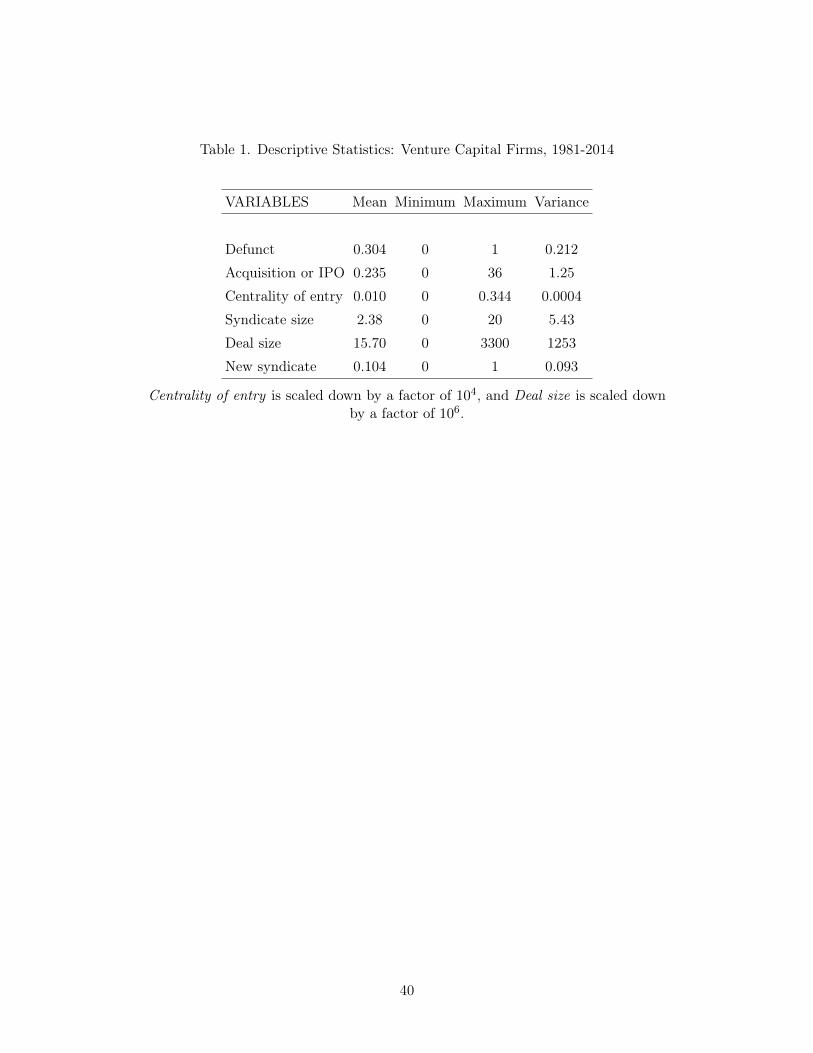
Table 1. Descriptive Statistics: Venture Capital Firms, 1981-2014
VARIABLES Mean Minimum Maximum Variance
Defunct 0.304 0 1 0.212
Acquisition or IPO 0.235 0 36 1.25
Centrality of entry 0.010 0 0.344 0.0004
Syndicate size 2.38 0 20 5.43
Deal size 15.70 0 3300 1253
New syndicate 0.104 0 1 0.093
Centrality of entry is scaled down by a factor of 104, and Deal size is scaled downby a factor of 106.
40

Table 2: Performance of a Venture Capital Firm as a Function of the Centralityof the First Syndicate Group at the Time of Entry: Baseline Models
(1) (2)
VARIABLES Defunct Acquisition or IPO
Centrality of entry -3.242*** -8.360***
(0.844) (2.072)
Syndicate size 0.0403*** 0.0780***
(0.0108) (0.0235)
Deal size 0.0008 0.0011
(0.0005) (0.0015)
New Syndicate -0.0518 0.632***
(0.0677) (0.153)
Constant 279.2*** -512.0***
(9.424) (14.52)
Observations 14,197 43,339
Year fixed effects Yes Yes
Robust standard errors in parentheses
*** p<0.01, ** p<0.05, * p<0.1
41

Tab
le3:
Perform
ance
ofaVenture
Cap
ital
Firm
asaFu
nction
oftheCentrality
oftheFirst
Synd
icateGroup
attheTim
eof
Entry:MatchingMod
els
(1)
(2)
(3)
(4)
VARIA
BLE
SDefun
ctDefun
ctAcquisition
orIP
OAcquisition
orIP
O
Centralityof
entry
-17.62
***
-7.196
***
-15.11
***
-7.762***
(2.601
)(0.911
)(1.356
)(0.981)
Synd
icatesize
0.14
3***
0.14
1***
0.08
31**
*0.0979***
(0.021
3)(0.009
66)
(0.014
5)(0.0105)
Deals
ize
-0.00011
50.00
0892
**0.00
342*
**0.00354***
(0.000
663)
(0.000
417)
(0.001
06)
(0.000670)
New
Synd
icate
0.31
7**
0.27
7***
0.06
810.0473
(0.134
)(0.0654)
(0.110
)(0.0807)
Con
stan
t-0.416
***
-0.097
1***
-601
.2**
*-546.6***
(0.060
7)(0.026
1)(17.39
)(13.35)
Observation
s2,52
613
,583
20,729
38,965
Mod
elde
sign
Venture
capitalistmatching
Investmentmatching
Venture
capitalistmatching
Investmentmatching
Yearfix
edeff
ects
Yes
Yes
Yes
Yes
Stan
dard
errors
inpa
renthe
ses
***p<
0.01
,**p<
0.05
,*p<
0.1
424242

Tab
le4:
Perform
ance
ofaVenture
Cap
ital
Firm
asaFu
nction
oftheCentrality
oftheFirst
Synd
icateGroup
attheTim
eof
Entry:DistributionMod
els
(1)
(2)
(3)
VARIA
BLE
SAcquisition
orIP
OZe
ro-in
flation
mod
elAcquisition
orIP
O
Centralityof
entry
-7.295
**1.104
-1.980
**
(3.472
)(2.746
)(0.950
)
Synd
icatesize
-0.003
16-0.193
***
0.06
97***
(0.022
0)(0.009
15)
(0.005
0)
Deals
ize
-0.000
361
-0.003
48**
*0.00
07
(0.000
614)
(0.000
789)
(0.000
5)
New
Synd
icate
0.38
5***
0.03
370.50
5***
(0.144
)(0.160
)(0.053
7)
Con
stan
t-404
.2**
*0.19
6**
-380
.7***
(22.32
)(0.079
3)(10.26
)
Observation
s36
,883
36,883
43,339
Mod
elde
sign
Zero-in
flatedne
gative
bino
mialZe
ro-in
flatedne
gative
bino
mialQua
ntile
(med
ian)
Yearfix
edeff
ects
Yes
Yes
Yes
Rob
uststan
dard
errors
inpa
renthe
ses
***p<
0.01
,**p<
0.05
,*p<
0.1
434343

Appendix A: Ruling Out Singletons
Following the note from Footnote 3, there was a concern that the results could be
driven by venture capital firms that enter as singletons. To rule out this possibility,
I re-run both models including only firms that invest first as a part of a syndicate.
The results are presented in the table below, and indicate that the pattern of results
are consistent with those presented earlier, whether singleton entrants are included
or not.
Table A1: Performance of a Venture Capital Firm as a Function of the Centralityof the First Syndicate Group at the Time of Entry: Syndicate Entrants Only
(1) (2)
VARIABLES Defunct Acquisition or IPO
Centrality of entry -3.118*** -8.483***
(0.852) (2.068)
Syndicate size 0.0116 0.0955***
(0.0122) (0.0257)
Deal size 0.000824 -0.000542
(0.000570) (0.000498)
New Syndicate -0.136* 0.663***
(0.0702) (0.161)
Constant 287.9*** -530.8***
(10.51) (15.50)
Observations 10,948 33,374
Year fixed effects Yes Yes
Robust standard errors in parentheses
*** p<0.01, ** p<0.05, * p<0.1
44

Appendix B: Coarsened Exact Matching
I employ a Coarsened Exact Matching algorithm, part of the Monotonic Imbalance
Bounding class of matching strategies outlined by Iacus, King, and Porro (2011b) and
later further illustrated by the same (Iacus, King, & Porro, 2011a). The Coarsened
Exact Matching algorithm is designed to take a group of covariates, break each apart
into optimally sized bins so that the difference between covariate values within each
bin are empirically negligible, and then perform an exact match for each data point
on the distance between the vector of these bins. After this process is complete, the
estimation can be carried out on the original uncoarsened data incorporating the
counterfactual matching generated by the coarsened strata.
I chose this matching estimator because it provides an advantage over traditional
approaches such as propensity score matching or nearest neighbor Malahanobis for
several reasons. First, it removes imbalances not just at the mean of the covariates,
but along interactions, quantiles, and other moments. Second, it provides a way
to remove treated and control data points that lie outside of the shared support of
the data that does not rely on the propensity score itself to identify it. This helps
the matching process avoid forcing matches based on extrapolating treated and con-
trol units at extreme values of the data with no common empirical support. Last,
the algorithm ensures that the binning decisions made about the distance between
treatment and control units on one dimension do not affect the balance between
the groups on another dimension. In classical matching methods, when imbalance
on a covariate persists after the matching procedure is completed, researchers must
decide how to redefine the procedure to improve it. But, the change that improves
the balance on one covariate may decrease it for the others. With Coarsened Exact
Matching, the maximum bound of imbalance is determined inherently by the degree
of coarsening. Since changing the coarsening choice for any one covariate cannot
make the maximum bound of imbalance higher for any other covariate, each coars-
ening improvement reduces the maximum imbalance for the total set of covariates.
These factors result in a matching solution that is maximally balanced at the level of
the distribution of each covariate without requiring model dependence. The differ-
45

ences in other covariates that remain between treated and control units occur only
within maximally balanced strata, such that they are empirically indistinguishable.
This also reduces model dependence. Within these strata, we can make a strong
comparison between treatment and control groups. This comparison isolates the
mechanism of interest, the treatment variable, without interference or confounding
from the other covariates.
As outlined in section 4.3, the matching approach focusing on characteristics of
the venture capital firm uses as the network imprint the first investment a venture
capital firm makes that goes on to receive a follow-on round. I match on the location
of the venture capital firm, the modal industry it invests in up to the imprint round,
the modal stage (early or late stage ventures) it invests in up to the imprint round,
and the year that the investment occurs. The second matching approach focuses on
the characteristics of the first investment a focal firm makes. This approach matches
on the size of the syndicate, the size of the deal, the location of the startup company
being invested in, the industry of the startup being invested in, the stage of the
startup, and the year that the investment occurs. Table B1 details the breakdown
of industry, location, and stage for the observed data.
The coarsened exact matching algorithm chooses an optimal bin width for each
stratum. To guide this choice, I use the binning method developed by Shimazaki
and Shinomoto (2007). This binning procedure is unique in that it does not require
any assumptions about the probability density function of the data (e.g., normality,
smoothness), as does Scott’s rule, for example, and instead only that the data follow
a Poisson process. Because the underlying rate that produces the observed data is
unknown, it is not possible to compute the bandwidth arrangement that maximizes
the goodness-of-fit directly from the underlying rate. Instead, the Shimazaki and
Shinomoto method reverse engineers the problem and computes a set of potential
bandwidths, each with a goodness-of-fit to the observed data. It then uses the data
to select from the computed bandwidths the one that maximizes the goodness-of-
fit and has the lowest estimated error. This method is conducive to my covariates
because they are not normally distributed and the method not require us to make
46

any additional distributional assumptions about the underlying rate.
Table B1. Overview of Additional Matching Variables
Industry Frequency Percent
Internet 8,030 18.53
Medical 13,286 30.66
Other 3,556 8.21
Other Tech 10,451 24.11
Software 8,016 18.5
Total 43,339 100
Location Frequency Percent
Asia 4,043 9.33
California 10,619 24.5
Europe 7,636 17.62
Other 4,213 9.72
Non-California US 16,828 38.83
Total 43,339 100
Stage Frequency Percent
Early 28,453 65.65
Late 14,886 34.35
Total 43,339 100
Early stage ventures represent Seed or Series A funding rounds.
47