network level structural evaluation with rolling wheel ... · asphalt institute equation for...
TRANSCRIPT

Network Level Structural Evaluation With Rolling Wheel Deflectometer
Paul W. Wilke, P.E. Applied Research Associates, Inc.

Presentation Outline • Structural Data for Network Level Pavement
Management • Methods of Pavement Structural Evaluation • PennDOT- Case Study-3 Methods of
Evaluation Falling Weight Deflectometer Rolling Wheel Deflectometer Algorithm Based on Pavement Composition & Age
• Recommendations for Network Level Structural Evaluation
9th International Conference on Managing Pavement Assets | May 18-21, 2015 2 6/4/2015

Pavement Management Decision Making
• Goal- identify maintenance & rehab treatments,
priorities & budgets
• Input- pavement surface condition, pavement history, geometric measurements (rut, profile)
• Pavement strength useful- often not available
9th International Conference on Managing Pavement Assets | May 18-21, 2015 3 6/4/2015

Traditional Project Level Structural Evaluation
• Benkelman Beam Testing
• Falling Weight Deflectometer Testing
9th International Conference on Managing Pavement Assets | May 18-21, 2015 4 6/4/2015

Benkelman Beam • Beam deflection under truck load measured by dial
gage • Empirical correlations developed to determine
overlay thickness required Based on deflection & projected traffic loading
Asphalt Institute Manual Series-17 9th International Conference on Managing
Pavement Assets | May 18-21, 2015 5 6/4/2015

Falling Weight Deflectometer (FWD) Testing
• Weight dropped on load plate • Deflection measured at series of sensors • Model developed to determine strength of each
layer (so that predicted deflections = actual)
9th International Conference on Managing Pavement Assets | May 18-21, 2015 6 6/4/2015

Rolling Wheel Deflectometer • FWD concept applied to
tractor trailer • Continuous deflection
measured by laser (under 8,164 kg single axle)
Laser between dual tires Reference beam and forward lasers 9th International Conference on Managing
Pavement Assets | May 18-21, 2015 7 6/4/2015

How Can The RWD Be Used? • Applications Network-level evaluation (PMS) Pre-screener for focusing project-level efforts
(evaluation/design) • Limitations Currently, maximum deflection only Lack of “deflection basin” limits analysis Accuracy is suitable for network-level analysis,
but not detailed engineering analysis
9th International Conference on Managing Pavement Assets | May 18-21, 2015 8 6/4/2015

PennDOT Study - Compared 3 Methods of Structural Evaluation • RWD testing of 463
kilometers
• FWD testing & pavement coring for 16 test segments
• Compared estimates of “structural number” based on RWD, FWD & RMS estimates
9th International Conference on Managing
Pavement Assets | May 18-21, 2015 9 6/4/2015

Structural Capacity
• Commonly expressed in terms of: Structural number Remaining life
• Study used both parameters
9th International Conference on Managing Pavement Assets | May 18-21, 2015 10 6/4/2015

Review of Structural Number & Remaining Life Concepts
• SN used in 1993 AASHTO Pavement Design to quantify pavement strength required to support design traffic
• Select pavement layers to achieve required SN
• SN = a1 D1 + a2 D2 + a3 D3 m3
ai = Layer coefficient of layer i D i = Thickness of layer i mi = Drainage coefficient of layer i
• SN existing pavement used to estimate structural capacity (remaining life, ESALs)
AC Surface AC Base Subbase
9th International Conference on Managing Pavement Assets | May 18-21, 2015 11 6/4/2015
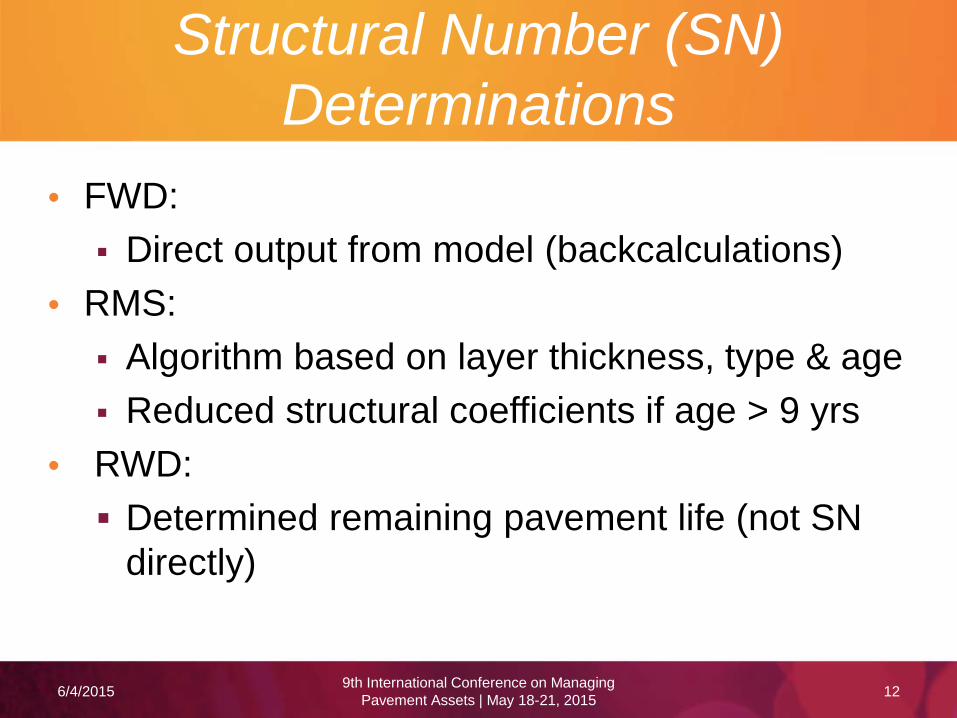
Structural Number (SN) Determinations
• FWD: Direct output from model (backcalculations)
• RMS: Algorithm based on layer thickness, type & age Reduced structural coefficients if age > 9 yrs
• RWD: Determined remaining pavement life (not SN
directly)
9th International Conference on Managing Pavement Assets | May 18-21, 2015 12 6/4/2015

Remaining Life Determinations • FWD:
AASHTO design equation SN eff & subgrade Mr from FWD calcs
• RMS: AASHTO design equation SN eff from algorithm Subgrade Mr= 52 MPa (CBR-5 default) Subgrade Mr from FWD calcs
• RWD: Asphalt Institute equation for Benkelman Beam Determine ESALS corresponding to “zero overlay
thickness” 9th International Conference on Managing
Pavement Assets | May 18-21, 2015 13 6/4/2015

Analysis of PennDOT Study Data
• 2 Separate Evaluations:
• 16 test sites -detailed data cores, FWD, RWD, RMS pavement history & SN
• Broad network- 463 Km RWD & RMS reported SN only Remaining life estimates RWD & RMS compared
9th International Conference on Managing Pavement Assets | May 18-21, 2015 14 6/4/2015

Remaining Life- 3 Methods
9th International Conference on Managing Pavement Assets | May 18-21, 2015 15 6/4/2015

Remaining Life- FWD vs RMS Mr = 52 MPa (7500 psi) assumed
9th International Conference on Managing Pavement Assets | May 18-21, 2015 16 6/4/2015

Evaluation of Remaining Life “Outliers”
• 2 sites RMS << RWD & FWD Bituminous thickness
RMS< cores
• 1 site RMS > FWD RMS bituminous thicker 3”
> core
• 3 outliers removed- RMS better matches FWD & RWD
9th International Conference on Managing Pavement Assets | May 18-21, 2015 17 6/4/2015

Assessment of Global Network (463 km)
• More data points, but less detailed info • No FWD testing • No detailed evaluation of RMS pavement
sections
9th International Conference on Managing Pavement Assets | May 18-21, 2015 18 6/4/2015

Remaining Life Comparisons (RWD vs. RMS)
10,000
100,000
1,000,000
10,000,000
100,000,000
10,000 100,000 1,000,000 10,000,000 100,000,000
RM
S (E
SALs
)
RWD (ESALs)
Remaining Life Comparisons
Bradford sr 3009
Clinton sr 144
9th International Conference on Managing Pavement Assets | May 18-21, 2015 19 6/4/2015

Remaining Life by Business Plan
• Both RWD & RMS clearly show strength increases from BP 4 to 3 to 2 (as expected)
• 70% of data from BP-4; good agreement RWD & RMS
• (log RWD/log RMS= 0.97)
BusinessPlan Group RWD RMS Log RWD/Log RMS
2 225 million 287 million 0.993 63 million 198 million 0.934 14 million 25 million 0.97
Remaining Pavement Life (ESALs)
9th International Conference on Managing Pavement Assets | May 18-21, 2015 20 6/4/2015

PennDOT Study Conclusions
• RMS provides reasonable estimate of SN & remaining life
• RMS & RWD provide comparable estimates of remaining life (log basis reasonable)
• RWD useful in categorizing groups of pavement for network evaluations
• Examples follow
9th International Conference on Managing Pavement Assets | May 18-21, 2015 21 6/4/2015

Network Level Strength Classification
Mile Marker
9th International Conference on Managing Pavement Assets | May 18-21, 2015 22 6/4/2015

Structural Condition Binning By RWD
9th International Conference on Managing Pavement Assets | May 18-21, 2015 23
0.6%
41.6%
15.1%15.1%
27.7%
0%
10%
20%
30%
40%
50%
< 10 10 to 20 20 to 35 35 to 50 > 50
Representative RWD deflection, mils
Perc
ent o
f mile
age
Pavement structural conditions vary widely
Excellent
Very Good
Good
Fair
Poor
6/4/2015

Treatment Matrix Based on RWD & PCI
9th International Conference on Managing Pavement Assets | May 18-21, 2015 24
PCI PCI < 35 35 - 50 > 50 High Traffic Value Rating < 45 45 - 75 > 75 Low Traffic
Good Fair Poor Structural Rating
0
4-in AC Mill and Overlay Reconstruction
2-in AC Mill and Overlay
Defer Improvements
4-in AC Mill and Overlay
Chip seal, Microsurfacing
(maximum 2 times)
Representative RWD Deflection, mils
Defer Maintenance Crack sealing (maximum 1 time)
Excellent
Poor
100
Very Good
Good
Fair
40
65
80 90
6/4/2015

Louisiana DOT Study by LSU
2009 Study led by Mostafa Elseifi (LSU) Developed model to predict SN from RWD data Based on RWD & FWD data from LA DOT test
sites- 16 sites, 2.5 km each

LSU Model Accuracy
Model based on FWD & RWD data from 52 segments
Accuracy deemed acceptable • Coeff of Determination, R2 = 0.77
SN-R
WD
8.00
7.00
6.00
5.00
4.00
3.00
2.00
1.00
0.00
0.00 1.00 2.00 3.00 4.00 5.00 6.00 7.00 8.00 SN-FWD
Relationships between SN based on FWD and SN based on RWD for the
Independent Network Sites
R² = 0.7687

LSU Model Tested with PennDOT RWD Data
LSU used PennDOT data to test model outside of LA conditions Compared SN from model to SN from FWD LA model & LA data- SN prediction error =
27% LA model & PA data- SN prediction error =
19%

RWD Deflection Variability & Pavement Strength

Louisiana Study Conclusions
Scattering & uniformity of RWD data follows road conditions LSU model developed with LA data
appears applicable beyond LA pavements RWD serves as reasonable indicator of
structural integrity (network level) Further validation & evaluation of model is
recommended

Overall Summary
Innovative Rolling Wheel Deflectometer (RWD) provides tool for rapid evaluation of large road networks
Lower cost & less traffic disruption than conventional methods
RWD less accurate than FWD RWD useful in categorizing groups of
pavement for network evaluations PennDOT’s RMS algorithm provides
reasonable estimate of SN (other agencies could adopt)

Questions???
• Contact Info: • Paul Wilke, P.E.- Applied Research Associates • [email protected] 717-975-3550
9th International Conference on Managing Pavement Assets | May 18-21, 2015 31 6/4/2015