network performance: an operator’s competitive differentiator
TRANSCRIPT

July 26, 2015
Network Performance An Operator’s Competitive Differentiator
Christhian Cassino Technical Sales Director

Consumer demand trends

NETWORK PERFORMANCE | July 2015 | Page 3
Greater demand than ever
2.9B mobile broadband subscriptions
1.2B mobile Facebook users
700M WhatsApp users
1.3B Smartphones shipped 2014
8.4B mobile broadband subscriptions
2020
NETWORK PERFORMANCE | July 2015 | Page 4
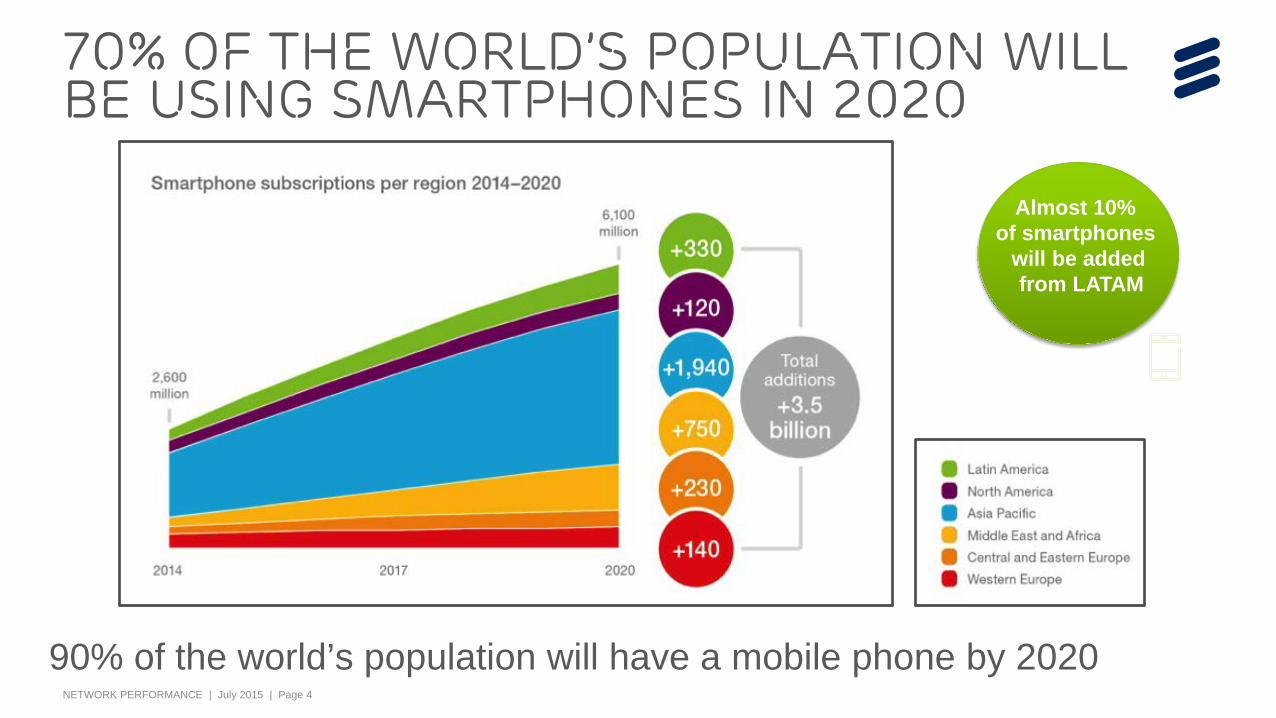
70% of the world’s population will be using smartphones in 2020
90% of the world’s population will have a mobile phone by 2020
Almost 10% of smartphones
will be added from LATAM
NETWORK PERFORMANCE | July 2015 | Page 5
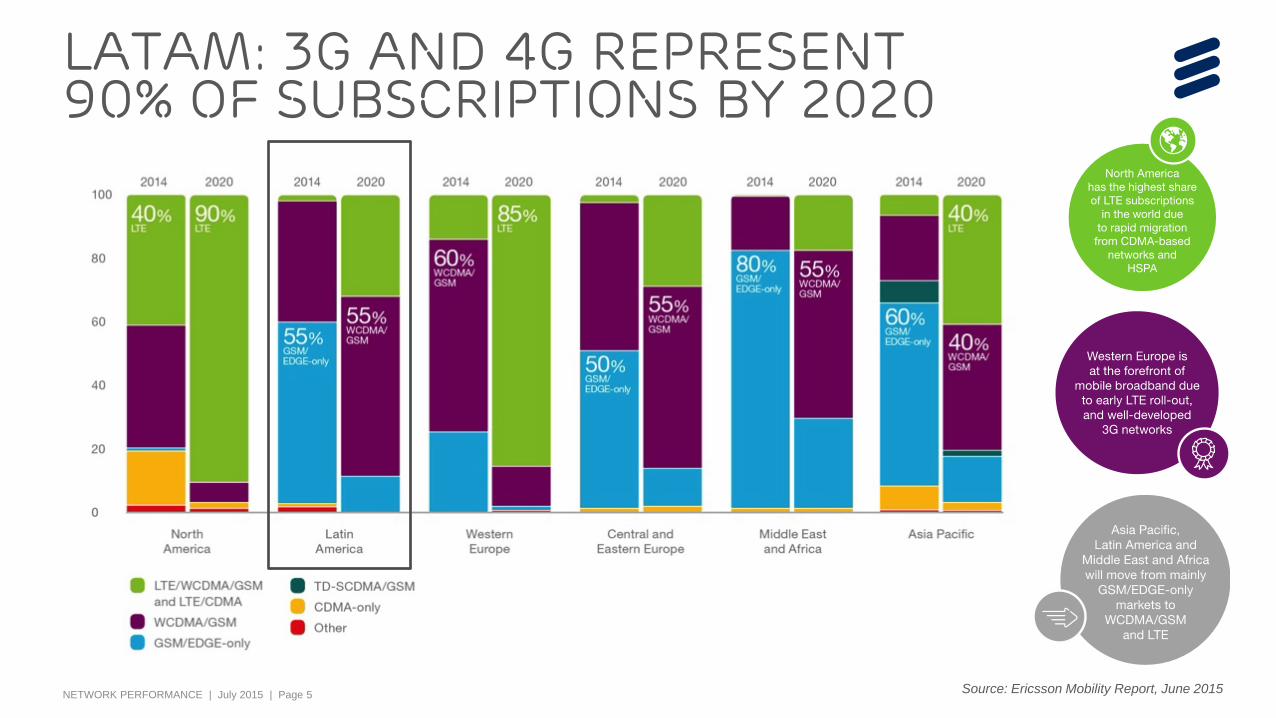
Latam: 3G and 4G represent 90% of subscriptions by 2020
Source: Ericsson Mobility Report, June 2015
NETWORK PERFORMANCE | July 2015 | Page 6
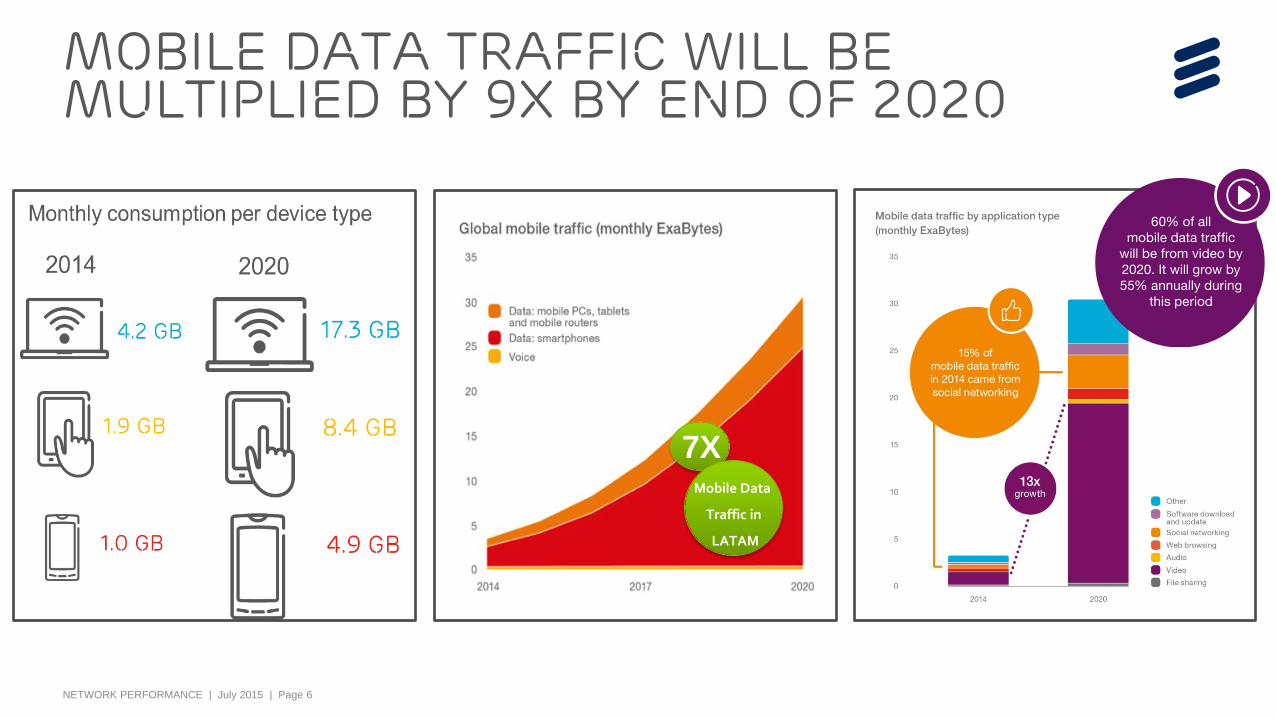
mobile data traffic will be multiplied by 9x by end of 2020
7X Mobile Data
Traffic in
LATAM

Growing demand for Experience
NETWORK PERFORMANCE | July 2015 | Page 8
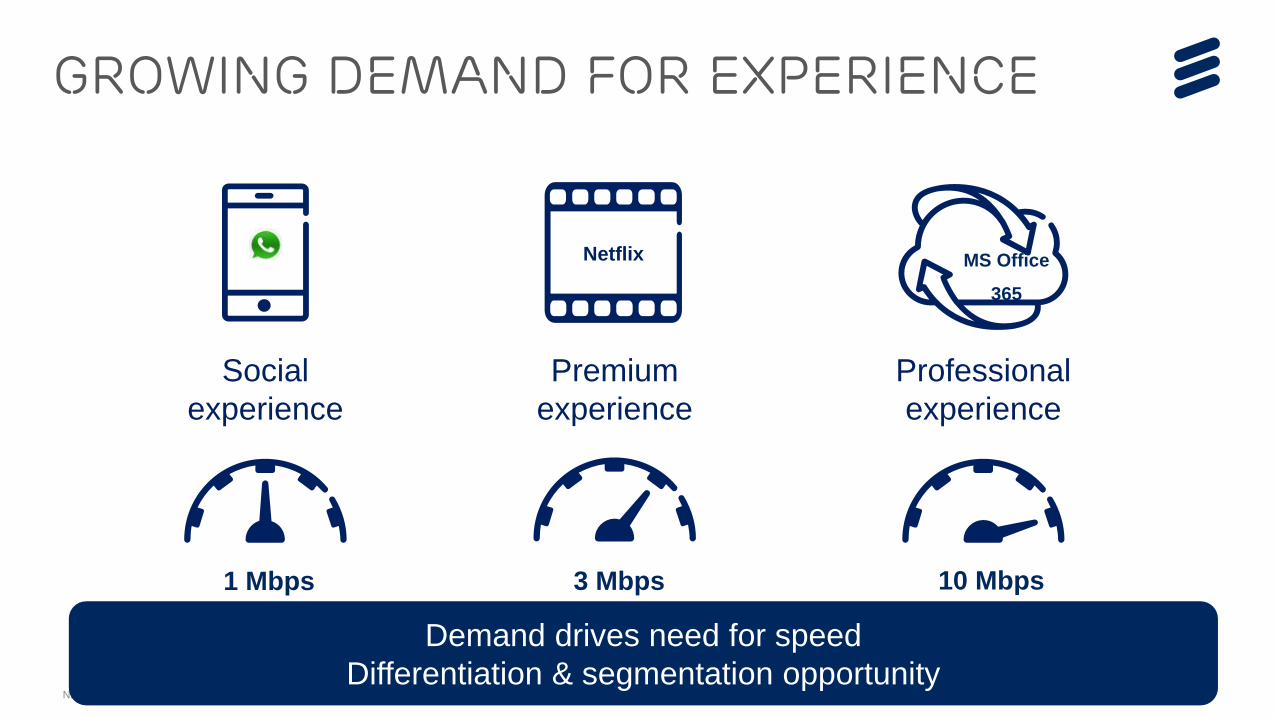
Demand drives need for speed Differentiation & segmentation opportunity
GROWING DEMAND FOR EXPERIENCE
Premium experience
Professional experience
Social experience
1 Mbps 3 Mbps 10 Mbps
Netflix MS Office
365

NETWORK PERFORMANCE | July 2015 | Page 9
Adaptive video streaming (Apple)
Progressive video streaming (Android)
HD Video DRIVES NEED FOR SPEED
0
HD/1080p HD/720p
Std/480
HD/720p 1 Radio Speed
Requiremet [Mbps]
2 3 4 Std/480
Source: IOS8 YouTube measurements by Ericsson Smartphone Lab (2014) Before: IOS7 cellular YouTube speed max 250 kbps

NETWORK PERFORMANCE | July 2015 | Page 10
App Experience Reality
33% 56% STOPPED USING APPS
DUE TO POOR COVERAGE
OF POWER USERS STOPPED USING APPS
DUE TO POOR COVERAGE
MORE TIME SPENT BY SATISFIED USERS ON STREAMING ONLINE
VIDEOS COMPARED TO UNSATISFIED USERS
42%
Source: Ericsson ConsumerLab Embracing data sharing (2015) & Smart Citizens (October 2014)
NETWORK PERFORMANCE | July 2015 | Page 11
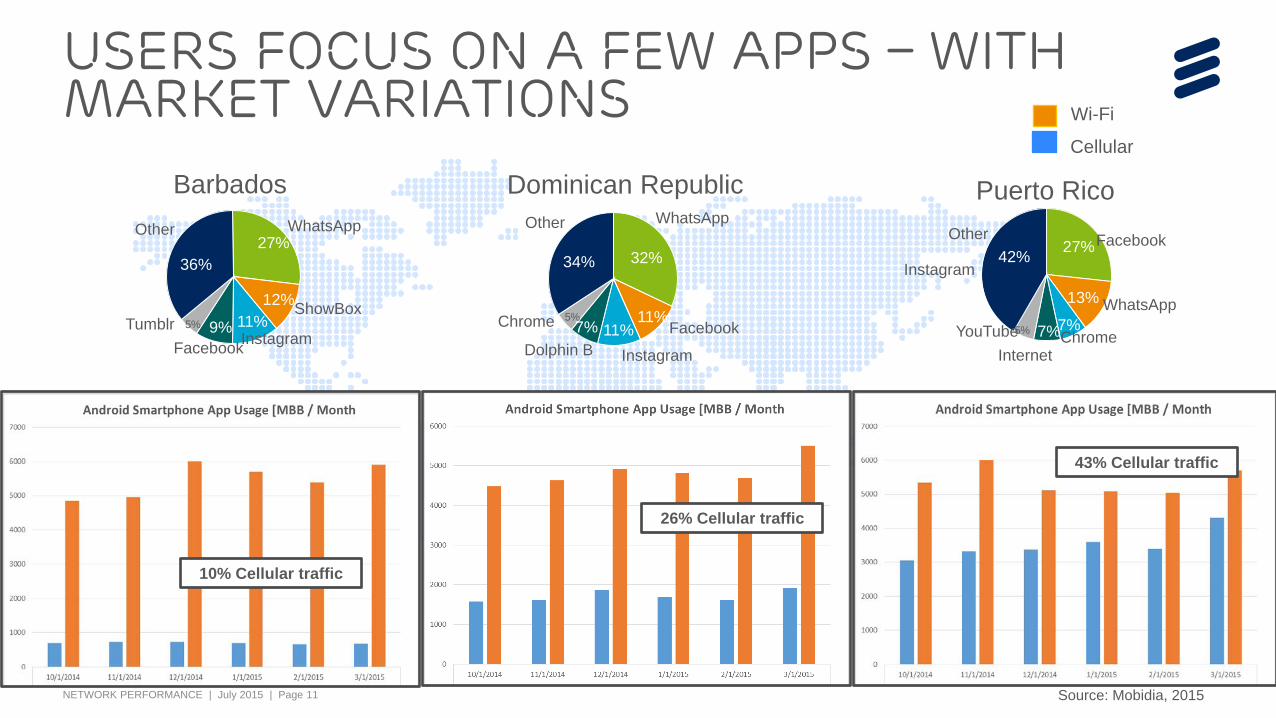
Top 5 apps represent 3/4 of all traffic
Barbados: Other Apps
Netflix 5%
YouTube 3%
Users focus on a few apps – with Market variations
Source: Mobidia, 2015
5%
7%
Other 42% 27%
YouTube
13%
Internet
Puerto Rico
5%
Other
36%
Instagram Tumblr
ShowBox 11%
12%
WhatsApp 27%
Barbados
5%
32%
11% 7% Chrome
34%
11%
Other
Dominican Republic
9% Facebook
Facebook Dolphin B
7% Chrome
Wi-Fi
10% Cellular traffic
Cellular
DR: Other Apps
Netflix 5%
YouTube 4% 26% Cellular traffic
Puerto Rico: Other Apps
Browser 5%
NetFlix 4%
43% Cellular traffic
The Value of Performance

NETWORK PERFORMANCE | July 2015 | Page 13
Value of performance Recognized by financial analysts
NETWORK PERFORMANCE | July 2015 | Page 14
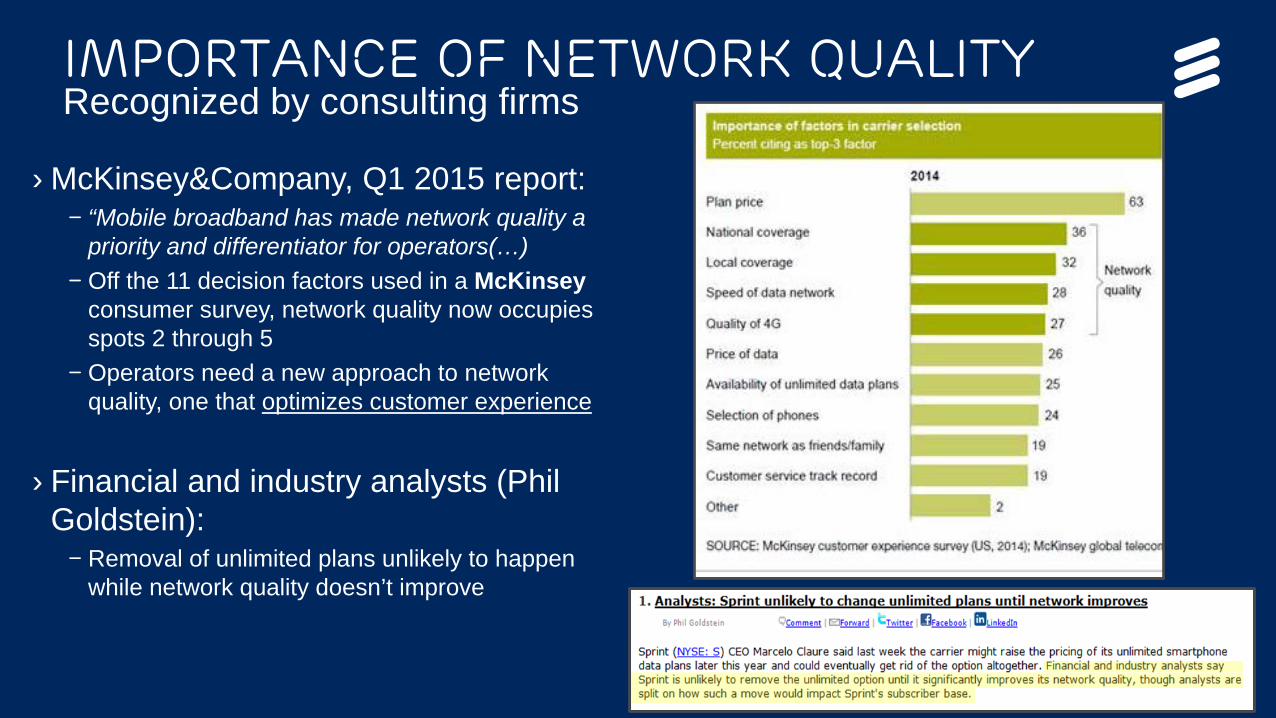
importance of network quality Recognized by consulting firms
› McKinsey&Company, Q1 2015 report: – “Mobile broadband has made network quality a
priority and differentiator for operators(…) – Off the 11 decision factors used in a McKinsey
consumer survey, network quality now occupies spots 2 through 5
– Operators need a new approach to network quality, one that optimizes customer experience
› Financial and industry analysts (Phil Goldstein):
– Removal of unlimited plans unlikely to happen while network quality doesn’t improve

Importance of New Technology in performance

NETWORK PERFORMANCE | July 2015 | Page 16
How does an Operator address $/GB?
Leveraging spectrum & technology to lower cost, optimize spend & differentiate experience

NETWORK PERFORMANCE | July 2015 | Page 17
Traffic management principles › Aim for “Highest G”
– 4G when coverage is good – 3G at cell edge or LTE congestion – 2G ONLY when 3G does not exists
› Avoid inter-layer handovers – All services in all layers – Load sharing primarily in idle mode – Stay at coverage layer even when
radio condition is poor
Key insights › Use 3G as fallback to 4G, speech and data › 2G is not good enough for Smartphones › Inter-layer handovers risk dropped calls &
promotes poor user experience.
Ensuring Smartphones are Always Best Connected
No inter-frequency/RAT handover from
HSPA 850
90% users on 3G by avoiding 2G in idle
mode

NETWORK PERFORMANCE | July 2015 | Page 18
You have a top end iphone 6 this is what you get
› All users will be trapped if connecting using
› AVOID R99 or EDGE
||||||||||||||||||||||||||||||||||||||||||||||||||||||||||||||||||||||||||||||||||||||||||||||||||||
EDGE
64kbps / HS R99
EUL10ms / HS
EUL2ms / HS
LTE from Idle
LTE from DCH
||||||||||||||||||||||||||||||||||||||||||||||||||||||||||||||||||||||||||||||||||||||||||||||||||||
||||||||||||||||||||||||||||||||||||||||||||||||||||||||||||||||||||||||||||||||||||||||||||||||||||
||||||||||||||||||||||||||||||||||||||||||||||||||||||||||||||||||||||||||||||||||||||||||||||||||||
|||||||||||||||||||||||||||||||||||||||||||||||||||||||||||||||||||||||||||||||||||||||||||||||||||| 17 s
|||||||||||||||||||||||||||||||||||||||||||||||||||||||||||||||||||||||||||||||||||||||||||||||||||| 42 s
1.3 s
1.5 s
1.8 s
2.4 s
Download of KEPLER webpage from etsi.org
HSDPA/EUL

NETWORK PERFORMANCE | July 2015 | Page 19
› Proactively remove end-to-end bottlenecks › At minimum deploy HSPA 21 / 5.8 Mbps everywhere › Connect to highest G, apply flow of users recommendations
time to content is critical
Keys to success
Video abandoned Web page
4 seconds 25%
50%
10%
40% 10 seconds
Video abandoned
Web page abandoned

NETWORK PERFORMANCE | July 2015 | Page 20
› 3-5 dB gain proven in field
› 30% reduction in uplink packet loss rates
› Over 50% improvement in average uplink data rates
› Network performance improvement…
– Time on 3G up from 90% to 98% – Downlink speed improved 50% – Triple uplink speed
› … higher customer satisfaction
– NPS up 4 points – Churn indicator improved 2 points
From To Uplink Downlink
% of time on 3G User Speed
From To From To
Net Promoter Score Churn
Value of network performance
NETWORK PERFORMANCE | July 2015 | Page 21
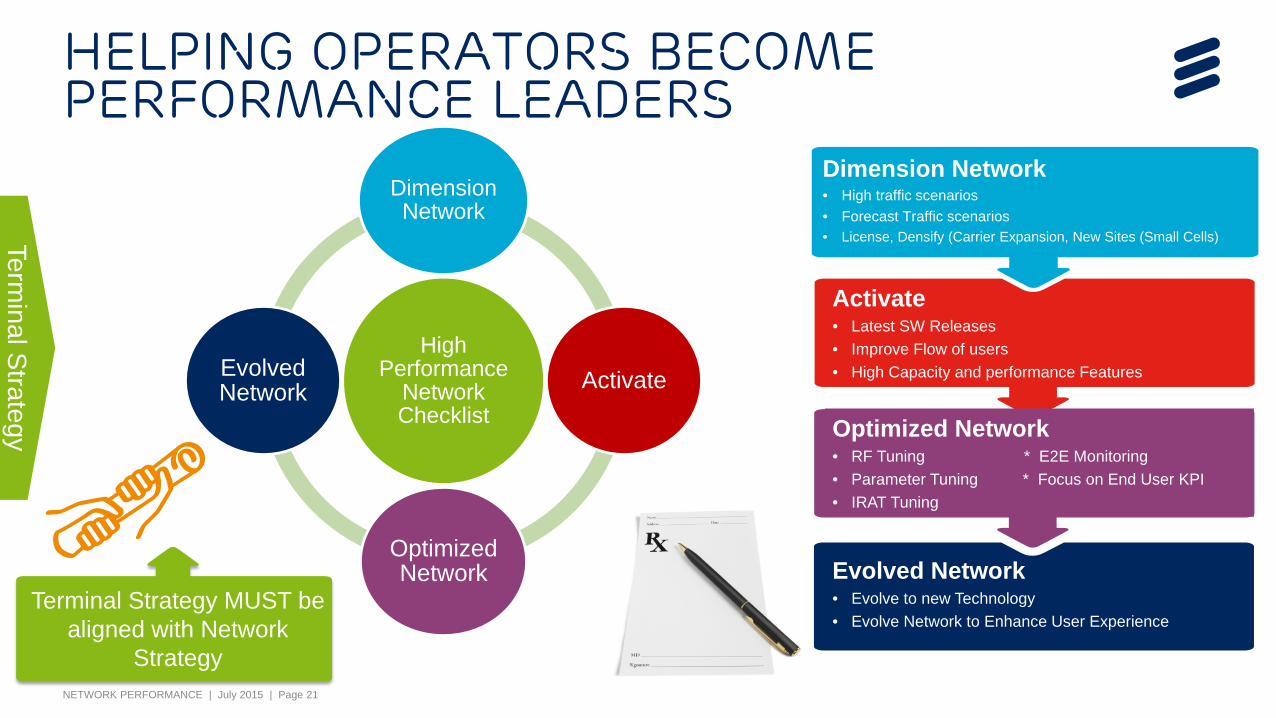
Helping operators become performance Leaders
Activate • Latest SW Releases • Improve Flow of users • High Capacity and performance Features
Evolved Network • Evolve to new Technology • Evolve Network to Enhance User Experience
High Performance
Network Checklist
Dimension Network
Activate
Optimized Network
Evolved Network
Optimized Network • RF Tuning * E2E Monitoring • Parameter Tuning * Focus on End User KPI • IRAT Tuning
Terminal S
trategy
Dimension Network • High traffic scenarios • Forecast Traffic scenarios • License, Densify (Carrier Expansion, New Sites (Small Cells)
Terminal Strategy MUST be
aligned with Network Strategy
NETWORK PERFORMANCE | July 2015 | Page 22
JOIN THE CONVERSATION
Ericsson.com/jm
Facebook.com/EricssonCaribbean
Twitter.com/EricssonCarib
YouTube.com/Ericsson