neural network-based multimode fiber-optic information transmission
TRANSCRIPT
Neural network-based multimode fiber-opticinformation transmission
Ronald K. Marusarz and Mohammad R. Sayeh
A new technique for transmitting information through multimode fiber-optic cables is presented. Thistechnique sends parallel channels through the fiber-optic cable, thereby greatly improving the datatransmission rate compared with that of the current technology, which uses serial data transmissionthrough single-mode fiber. An artificial neural network is employed to decipher the transmitted infor-mation from the received speckle pattern. Several different preprocessing algorithms are developed,tested, and evaluated. These algorithms employ average region intensity, distributed individual pixelintensity, and maximum mean-square-difference optimal group selection methods. The effect of modaldispersion on the data rate is analyzed. An increased data transmission rate by a factor of 37 over thatof single-mode fibers is realized. When implementing our technique, we can increase the channelcapacity of a typical multimode fiber by a factor of 6. © 2001 Optical Society of America
OCIS codes: 060.0060, 060.2330, 060.2350, 060.4230, 200.4260.
1. Introduction
Attempts to enhance the data-carrying capacity offiber-optic cables are well documented in the researchliterature. A system devised by Lukosz1 in 1966used wavelength encoding to transmit the intensityinformation of several pixels simultaneously througha single-mode optical fiber. This system employed awhite-light source and an optical prism to scan me-chanically a black-and-white image. The intensityof each pixel in a line of the image was encoded as aparticular color or wavelength. This allowed an en-tire line of the image to be transmitted in parallelform. However, to transmit the entire two-dimensional image, each separate line of data had tobe sent serially. The system pioneered use of aliquid-crystal display ~LCD! to generate the imagesand a charge-coupled device ~CCD! camera to receivethe images. Lukosz suggests that advances in digi-tal computers will make the LCD and CCD camerasuitable for image decoding and restoration.
A system demonstrating direct three-dimensionalimage transmission through single-mode fibers with
The authors are with the College of Engineering, Southern Illi-nois University, Carbondale, Illinois 62901-6603. R. Marusarz’se-mail address is [email protected].
Received 4 April 2000; revised manuscript received 28 Septem-ber 2000.
0003-6935y01y020219-09$15.00y0© 2001 Optical Society of America
monochromatic light was constructed by Naulleau etal.2 They also present a detailed mathematicalanalysis of coherence imaging, addressing matters ofresolution, image depth, and signal-to-noise ratio.3A spatially incoherent light source was used to illu-minate a three-dimensional object. Through use oflenses, each component point source projects a Fou-rier transform on the entry surface of the fiber.Each point-source element images one spatial-frequency component on the fiber. The systemutilizes a reference beam transmitted by a separatefree-space path to the receiving end of the fiber. Thereference beam is combined with the light coming outof the fiber to produce a hologram of the originalthree-dimensional image. This technique is knownas coherence imaging, with the transmitted imagedata encoded in the degrees of coherence of the light.Although good images are received, the requirementof the free-space transmission of the reference beamlimits the practical application of the system. Naul-leau et al. also discuss the difficulties encounteredwhen one uses a reference beam that is sent througha separate single-mode fiber. In later research theypresent the results of image transmission without theneed for a transmitted reference beam. Naulleauand Dilworth4 employed digital processing of specklepatterns to detect moving objects.
When a multimode optical fiber is employed, thedata-handling capacity is greatly increased. In prin-ciple, all the pixels of a two-dimensional image could betransmitted in parallel simultaneously. However,
10 January 2001 y Vol. 40, No. 2 y APPLIED OPTICS 219

nuAmmmsih
aP
ve
trcmm
2
the received image is distorted because of the variationin path length experienced by the various modes of lightpropagation. A mathematical treatment of this phe-nomenon is provided by Gover et al.5
A method for removing this modal dispersion dis-tortion by utilizing optical phase conjugation wasdemonstrated by Dunning and Lind.6 If the beamtransmitted through the fiber is first conjugated andthen transmitted through an identical fiber, the orig-inal input image will be formed at the output of thesecond fiber.
The phase conjugation was accomplished when thefiber output beam was directed into a crystal of bar-ium titanate ~BaTiO3! in which a degenerative four-wave mixing process had been performed. Thepump beams necessary for the nonlinear optical mix-ing process in the crystal were obtained by a beamsplitter from the krypton-ion laser before the beamwas modulated with the image. Fischer andSternklar7 performed a similar image transmissionexperiment using a BaTiO3 crystal to perform phaseconjugation. They employed a self-pumped four-wave mixing technique. The pump beams were gen-erated from the received beam itself by use of aspherical mirror and the reflective crystal as a reso-nator.
In experiments conducted by Levy and Friesem,8images of the numerals zero through nine were trans-mitted successfully along a multimode optical fiber.An array of 13 dots was used to represent the char-acters in a manner similar to a seven-segment dis-play. Each of the 13 dots of light is first sentseparately through the fiber, and the received spa-tially scattered image is used to construct a holo-graphic plate. The 13 holographic plates are thensuperimposed to make a composite filter for unscram-bling the received numeral images.
When groups of dots representing one of the nu-merals were transmitted simultaneously through thefiber, the received speckle pattern was passedthrough the holographic filter to clearly reconstructthe numeral. An evident advantage of this tech-nique over the phase-conjugation methods is that it isnot necessary to transmit the originating referencelaser beam along with the image. The holographicfilters are constructed at the receiving end from alight source that does not need any specific phaserelationship to the originating light source at thetransmission end of the fiber.
A similar system for direct image transmissionthrough a multimode optical fiber was demonstratedby Son et al.9 Their system generated hologramsfrom each pixel of a 25-pixel array. These holo-grams were combined and used to unscramble thereceived images. A mathematical treatment ofimage-plane holography as a confocal imaging pro-cess is given by Sun and Leith.10
In this paper we present an improved technique fortransmitting images through multimode fiber-opticcables. The major difficulty in transmitting imagesthrough multimode fiber-optic cable is the unscram-bling of the received speckle pattern to retrieve the
20 APPLIED OPTICS y Vol. 40, No. 2 y 10 January 2001
original image information. The technique pre-sented here employs a backpropagation artificial neu-ral network to recover the original image from thereceived speckle pattern. Various coding algo-rithms were developed and tested to condition thereceived pixel intensity information prior to its inputto the neural network.
2. Data Rate Improvement with Multimode OpticalFibers
Use of multimode fibers offers a potential data-rateimprovement over single-mode fibers because of thecapability of sending data in parallel form. ~Thisimprovement would be in addition to the possible useof wavelength encoding to produce additional datapaths.! Because of the orthogonality and complete-
ess properties, each mode of transmission could besed to carry a separate bit of data simultaneously.factor that tends to offset the advantage of multi-ode optical fibers is that they typically have moreodal dispersion than single-mode fibers. Thisodal dispersion causes a transmitted pulse to be
meared in time. The result of this dispersion is anncrease in the time required between pulses andence a reduced data rate.A method for calculating the number of modes thatparticular fiber-optic cable will support is given byowers11:
Nm <V2
2, (1)
where Nm is the number of modes and V is the Vparameter.
The value of V is found from
V <2Pr
l~NA!, (2)
where r is the core radius, l is the laser nominalfree-space wavelength, and NA is the numerical ap-erture of the fiber.
The multimode fiber used in our experiment hadthe following specifications: a core diameter of 98mm, a cladding diameter of 140 mm, a NA of 0.28, andbandwidths of 334 MHzykm at 850 nm and 454MHzykm at 1300 nm.
If we assume a nominal laser wavelength of 1000nm and substitute into approximation ~2!, we obtainV 5 86.21 and Nm 5 3716 modes.
Powers11 compares single-mode fibers to multi-mode fibers in terms of a data-rate and distance prod-uct. A typical single-mode fiber has a value of 3~Gbytesykm!ys. A typical multimode fiber has aalue of only 30 ~Mbytesykm!ys because of dispersionffects.If a technique could be developed to use each of the
ransmission modes to carry a bit of data, the data-ate capability of the multimode fiber could be in-reased by a factor of 3716. Theoretically, use of theultimode fiber could produce a data-rate improve-ent by a factor of 37 over the single-mode fiber.
w
p5alersa
pA
This improvement is due to the parallel transmissionof data. However, the data at the receiving end ofthe fiber must be demultiplexed successfully.
In this paper a neural network is used as a meansof demultiplexing or unscrambling the received data.If each pixel of image data is transmitted through theoptical fiber in analog form, there is an additionaldata-rate improvement by a factor of 8 over a digitalsystem that uses an 8-bit number to represent theintensity level of each pixel.
In what follows, we calculate the data rate giventhe number of modes. The modal dispersion can becalculated as11
Dt 5L~n1 2 n2!
c S1 2p
VD , (3)
here L is the length of the fiber, n1 and n2 are theindices of refraction, and c is the speed of light invacuum.
Then the maximum data rate that the fiber cansupport is given by
DRmax 51
4Dt2 . (4)
From approximations ~1! and ~2! and Eqs. ~3! and ~4!,we can write
DRmax 50.25
FL~n1 2 n2!
c S1 2p
Î2NDG . (5)
As the number of modes Nm is increased, it can beseen that the maximum data rate DRmax decreases toa minimum ~0.25c!y@L~n1 2 n2!#.
However, as the number of modes is increased byuse of a larger-diameter cable, the potential data rateincreases because more channels ~modes! are avail-able for parallel data transmission. This analysissuggests the benefits that can be achieved whenlarger-diameter multimode fiber-optic cables areused to enhance data-handling capability.
3. Data Transmission through Multimode Fiber
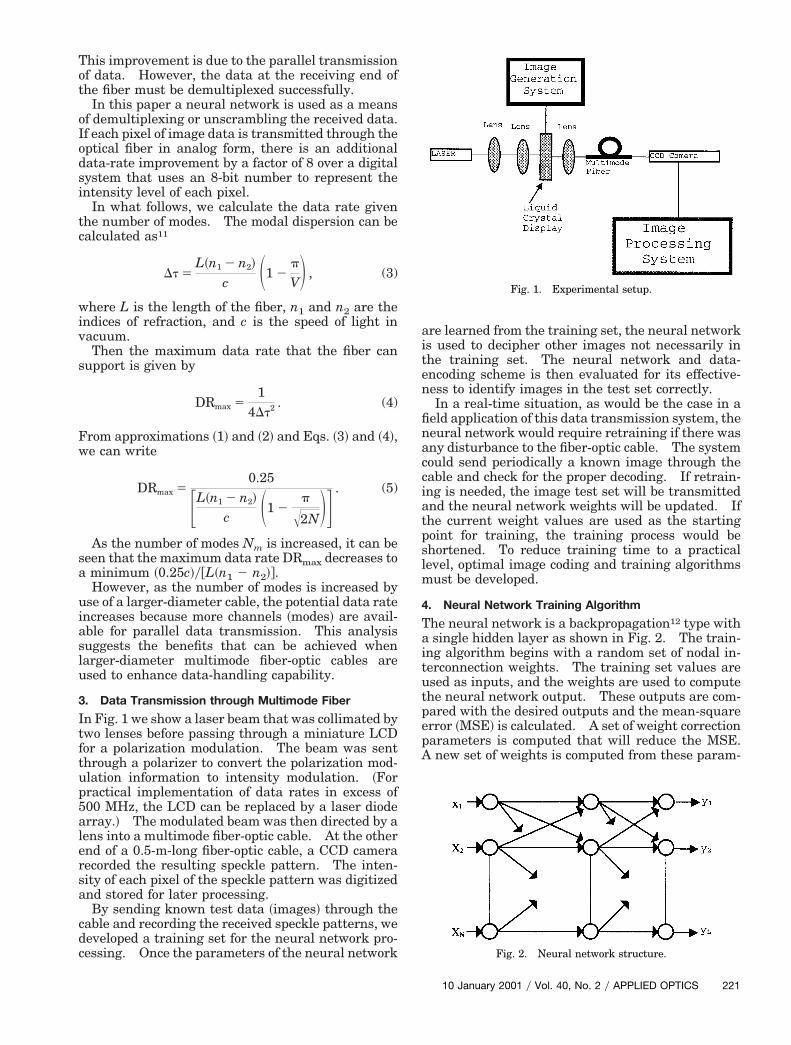
In Fig. 1 we show a laser beam that was collimated bytwo lenses before passing through a miniature LCDfor a polarization modulation. The beam was sentthrough a polarizer to convert the polarization mod-ulation information to intensity modulation. ~For
ractical implementation of data rates in excess of00 MHz, the LCD can be replaced by a laser dioderray.! The modulated beam was then directed by aens into a multimode fiber-optic cable. At the othernd of a 0.5-m-long fiber-optic cable, a CCD cameraecorded the resulting speckle pattern. The inten-ity of each pixel of the speckle pattern was digitizednd stored for later processing.By sending known test data ~images! through the
cable and recording the received speckle patterns, wedeveloped a training set for the neural network pro-cessing. Once the parameters of the neural network
are learned from the training set, the neural networkis used to decipher other images not necessarily inthe training set. The neural network and data-encoding scheme is then evaluated for its effective-ness to identify images in the test set correctly.
In a real-time situation, as would be the case in afield application of this data transmission system, theneural network would require retraining if there wasany disturbance to the fiber-optic cable. The systemcould send periodically a known image through thecable and check for the proper decoding. If retrain-ing is needed, the image test set will be transmittedand the neural network weights will be updated. Ifthe current weight values are used as the startingpoint for training, the training process would beshortened. To reduce training time to a practicallevel, optimal image coding and training algorithmsmust be developed.
4. Neural Network Training Algorithm
The neural network is a backpropagation12 type witha single hidden layer as shown in Fig. 2. The train-ing algorithm begins with a random set of nodal in-terconnection weights. The training set values areused as inputs, and the weights are used to computethe neural network output. These outputs are com-pared with the desired outputs and the mean-squareerror ~MSE! is calculated. A set of weight correction
arameters is computed that will reduce the MSE.new set of weights is computed from these param-
Fig. 1. Experimental setup.
Fig. 2. Neural network structure.
10 January 2001 y Vol. 40, No. 2 y APPLIED OPTICS 221
So
a
ttFEIbqa2f2nb
dppiia
2
eters, and the process is repeated. This iterativetraining process is repeated until the computed out-puts match the desired outputs within a specifiedtolerance or a maximum iteration number is reached.The set of weights arrived at from this training pro-cess is used to implement a neural network for iden-tification of the test set images.
We used Eqs. ~6!–~9! in implementing the neuralnetwork. Equation ~6! is used to compute the inputsto the hidden layer from the network inputs $x%. Wis the weight factor, and f is the sigmoid function,where f ~a! 5 ~1!y@1 1 exp~2a!#:
xj9 5 fS(i51
N
WijxiD , 1 # j # M. (6)
imilarly, Eq. ~7! is used to compute the networkutputs from the hidden layer outputs:
yk 5 fS(j51
M
Wjk9xj9D , 1 # k # L. (7)
As the network is trained with each iteration, therevised weights W~t 1 1! are calculated from Eqs. ~8!nd ~9!:
Wij~t 1 1! 5 Wij~t! 1 hdjxi, (8)
Fig. 3. Four-qua
22 APPLIED OPTICS y Vol. 40, No. 2 y 10 January 2001
where dj 5 xj9~1 2 xj9! ¥k51L dkWjk9 and h is a constant
learning rate, and
Wjk9~t 1 1! 5 Wjk9~t! 1 hxj9yk~1 2 yk!~dk 2 yk!, (9)
where dk is a desired output.
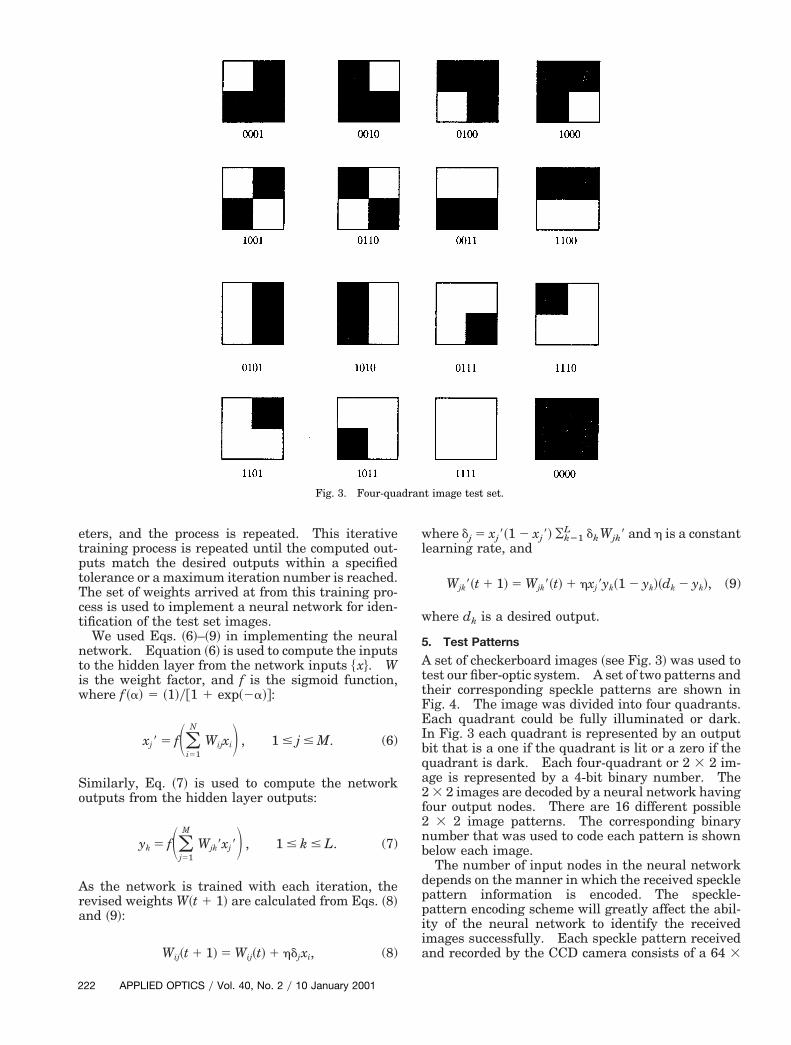
5. Test Patterns
A set of checkerboard images ~see Fig. 3! was used toest our fiber-optic system. A set of two patterns andheir corresponding speckle patterns are shown inig. 4. The image was divided into four quadrants.ach quadrant could be fully illuminated or dark.
n Fig. 3 each quadrant is represented by an outputit that is a one if the quadrant is lit or a zero if theuadrant is dark. Each four-quadrant or 2 3 2 im-ge is represented by a 4-bit binary number. The3 2 images are decoded by a neural network having
our output nodes. There are 16 different possible3 2 image patterns. The corresponding binary
umber that was used to code each pattern is shownelow each image.The number of input nodes in the neural network
epends on the manner in which the received speckleattern information is encoded. The speckle-attern encoding scheme will greatly affect the abil-ty of the neural network to identify the receivedmages successfully. Each speckle pattern receivednd recorded by the CCD camera consists of a 64 3
t image test set.
dran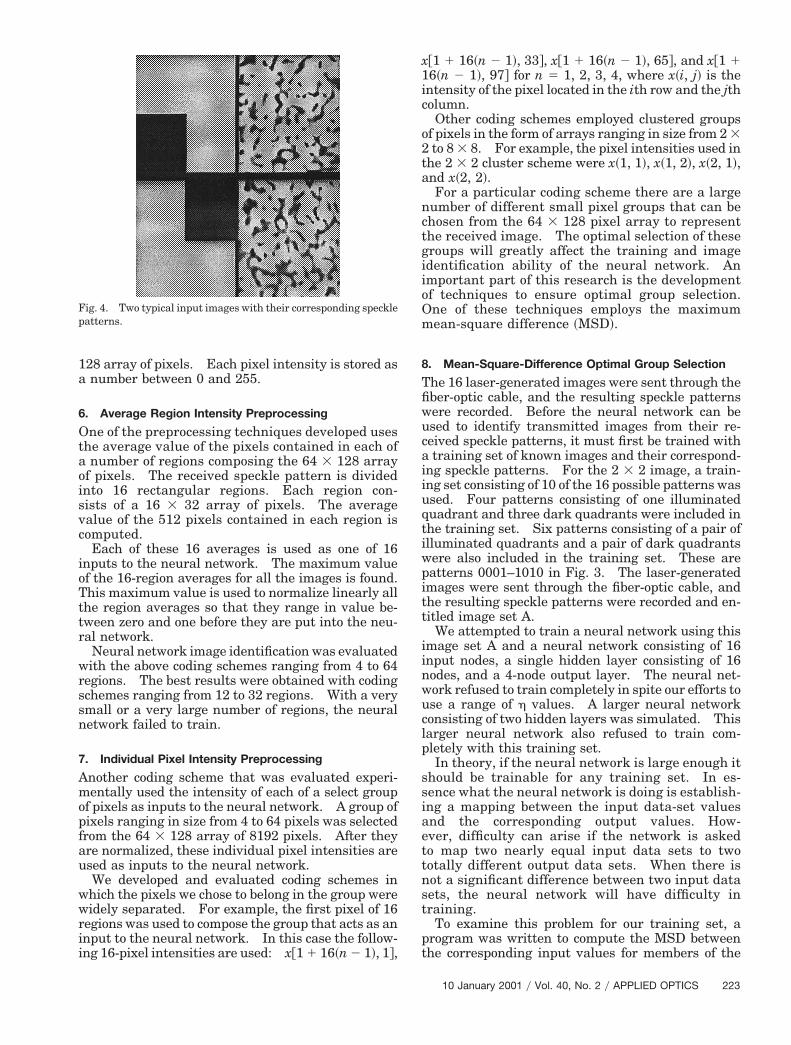
au
wwrii
128 array of pixels. Each pixel intensity is stored asa number between 0 and 255.
6. Average Region Intensity Preprocessing
One of the preprocessing techniques developed usesthe average value of the pixels contained in each ofa number of regions composing the 64 3 128 arrayof pixels. The received speckle pattern is dividedinto 16 rectangular regions. Each region con-sists of a 16 3 32 array of pixels. The averagevalue of the 512 pixels contained in each region iscomputed.
Each of these 16 averages is used as one of 16inputs to the neural network. The maximum valueof the 16-region averages for all the images is found.This maximum value is used to normalize linearly allthe region averages so that they range in value be-tween zero and one before they are put into the neu-ral network.
Neural network image identification was evaluatedwith the above coding schemes ranging from 4 to 64regions. The best results were obtained with codingschemes ranging from 12 to 32 regions. With a verysmall or a very large number of regions, the neuralnetwork failed to train.
7. Individual Pixel Intensity Preprocessing
Another coding scheme that was evaluated experi-mentally used the intensity of each of a select groupof pixels as inputs to the neural network. A group ofpixels ranging in size from 4 to 64 pixels was selectedfrom the 64 3 128 array of 8192 pixels. After theyre normalized, these individual pixel intensities aresed as inputs to the neural network.We developed and evaluated coding schemes inhich the pixels we chose to belong in the group wereidely separated. For example, the first pixel of 16
egions was used to compose the group that acts as annput to the neural network. In this case the follow-ng 16-pixel intensities are used: x@1 1 16~n 2 1!, 1#,
Fig. 4. Two typical input images with their corresponding specklepatterns.
x@1 1 16~n 2 1!, 33#, x@1 1 16~n 2 1!, 65#, and x@1 116~n 2 1!, 97# for n 5 1, 2, 3, 4, where x~i, j! is theintensity of the pixel located in the ith row and the jthcolumn.
Other coding schemes employed clustered groupsof pixels in the form of arrays ranging in size from 2 32 to 8 3 8. For example, the pixel intensities used inthe 2 3 2 cluster scheme were x~1, 1!, x~1, 2!, x~2, 1!,and x~2, 2!.
For a particular coding scheme there are a largenumber of different small pixel groups that can bechosen from the 64 3 128 pixel array to representthe received image. The optimal selection of thesegroups will greatly affect the training and imageidentification ability of the neural network. Animportant part of this research is the developmentof techniques to ensure optimal group selection.One of these techniques employs the maximummean-square difference ~MSD!.
8. Mean-Square-Difference Optimal Group Selection
The 16 laser-generated images were sent through thefiber-optic cable, and the resulting speckle patternswere recorded. Before the neural network can beused to identify transmitted images from their re-ceived speckle patterns, it must first be trained witha training set of known images and their correspond-ing speckle patterns. For the 2 3 2 image, a train-ing set consisting of 10 of the 16 possible patterns wasused. Four patterns consisting of one illuminatedquadrant and three dark quadrants were included inthe training set. Six patterns consisting of a pair ofilluminated quadrants and a pair of dark quadrantswere also included in the training set. These arepatterns 0001–1010 in Fig. 3. The laser-generatedimages were sent through the fiber-optic cable, andthe resulting speckle patterns were recorded and en-titled image set A.
We attempted to train a neural network using thisimage set A and a neural network consisting of 16input nodes, a single hidden layer consisting of 16nodes, and a 4-node output layer. The neural net-work refused to train completely in spite our efforts touse a range of h values. A larger neural networkconsisting of two hidden layers was simulated. Thislarger neural network also refused to train com-pletely with this training set.
In theory, if the neural network is large enough itshould be trainable for any training set. In es-sence what the neural network is doing is establish-ing a mapping between the input data-set valuesand the corresponding output values. How-ever, difficulty can arise if the network is askedto map two nearly equal input data sets to twototally different output data sets. When there isnot a significant difference between two input datasets, the neural network will have difficulty intraining.
To examine this problem for our training set, aprogram was written to compute the MSD betweenthe corresponding input values for members of the
10 January 2001 y Vol. 40, No. 2 y APPLIED OPTICS 223
w
tg
Iiadil
odtnda
platiewtc
wnhofw
i6
Table 1. Neural Network Pattern Recognition by Use of the Average
2
training set. The following is a sample of the MSDcomputation algorithm:
MSDm 5(n51
NS
(j51
NR
(i51
NC
@xm~i, j! 2 xn~i, j!#2
~NS!~NR!~NC!,
here x~i, j! is the intensity of the pixel located in rowi and column j, NS is the number of images in theraining set, NR is the number of rows in the pixelroup, and NC is the number of columns in the pixel
group.Upon reviewing the MSD data, we could see that
some of the image patterns in the training set had avery small MSD between their inputs. Images 1001and 0001 had a small MSD ~less than 3.8 3 10208!.n Fig. 3 it can be seen that these images differ onlyn the lower right quadrant. Similarly, images 1100nd 0100 also had a small MSD and these images alsoiffer only in the lower right quadrant. The lightnformation from the lower right quadrant has a neg-igible affect on the output.
As a verification of this theory regarding the effectf very small MSD, patterns 1001 and 1100 wereeleted from the training set. This new training setrained successfully with a single hidden layer neuraletwork of 16 input nodes. However, with this re-uced data set the neural network ability to identifyll 16 images could not be researched.We concluded that the image was not centered
roperly when it entered the fiber-optic cable. Littleight from the lower right quadrant entered the cable,nd therefore it had little effect on the speckle pat-ern leaving the other end of the cable. The exper-ment was conducted again in the laboratory in whichach of the speckle patterns was compared visuallyith the others to ensure that every quadrant, when
urned off and on, had a noticeable affect on the re-eived speckle patterns.
We repeated our attempts to train a neural net-ork using this image set, called image set B, and aeural network consisting of 16 input nodes, a singleidden layer consisting of 16 nodes, and a 4-nodeutput layer. This time the neural network success-ully trained. The minimum MSD for image set Bas 6.7 3 1024, which was much larger than that of
image set A. The value of our checking the mini-mum MSD prior to training was verified.
9. Effect of Region Size on Average Region IntensityCoding
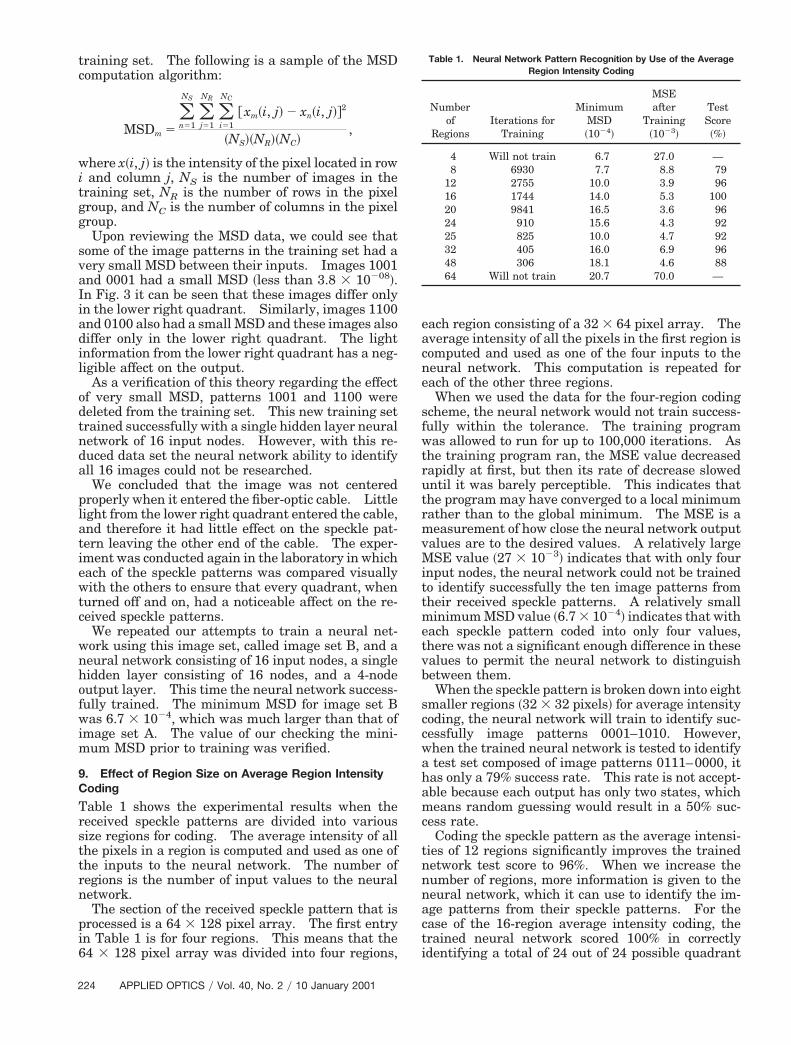
Table 1 shows the experimental results when thereceived speckle patterns are divided into varioussize regions for coding. The average intensity of allthe pixels in a region is computed and used as one ofthe inputs to the neural network. The number ofregions is the number of input values to the neuralnetwork.
The section of the received speckle pattern that isprocessed is a 64 3 128 pixel array. The first entryn Table 1 is for four regions. This means that the4 3 128 pixel array was divided into four regions,
24 APPLIED OPTICS y Vol. 40, No. 2 y 10 January 2001
each region consisting of a 32 3 64 pixel array. Theaverage intensity of all the pixels in the first region iscomputed and used as one of the four inputs to theneural network. This computation is repeated foreach of the other three regions.
When we used the data for the four-region codingscheme, the neural network would not train success-fully within the tolerance. The training programwas allowed to run for up to 100,000 iterations. Asthe training program ran, the MSE value decreasedrapidly at first, but then its rate of decrease sloweduntil it was barely perceptible. This indicates thatthe program may have converged to a local minimumrather than to the global minimum. The MSE is ameasurement of how close the neural network outputvalues are to the desired values. A relatively largeMSE value ~27 3 1023! indicates that with only fourinput nodes, the neural network could not be trainedto identify successfully the ten image patterns fromtheir received speckle patterns. A relatively smallminimum MSD value ~6.7 3 1024! indicates that witheach speckle pattern coded into only four values,there was not a significant enough difference in thesevalues to permit the neural network to distinguishbetween them.
When the speckle pattern is broken down into eightsmaller regions ~32 3 32 pixels! for average intensitycoding, the neural network will train to identify suc-cessfully image patterns 0001–1010. However,when the trained neural network is tested to identifya test set composed of image patterns 0111–0000, ithas only a 79% success rate. This rate is not accept-able because each output has only two states, whichmeans random guessing would result in a 50% suc-cess rate.
Coding the speckle pattern as the average intensi-ties of 12 regions significantly improves the trainednetwork test score to 96%. When we increase thenumber of regions, more information is given to theneural network, which it can use to identify the im-age patterns from their speckle patterns. For thecase of the 16-region average intensity coding, thetrained neural network scored 100% in correctlyidentifying a total of 24 out of 24 possible quadrant
Region Intensity Coding
Numberof
RegionsIterations for
Training
MinimumMSD~1024!
MSEafter
Training~1023!
TestScore~%!
4 Will not train 6.7 27.0 —8 6930 7.7 8.8 79
12 2755 10.0 3.9 9616 1744 14.0 5.3 10020 9841 16.5 3.6 9624 910 15.6 4.3 9225 825 10.0 4.7 9232 405 16.0 6.9 9648 306 18.1 4.6 8864 Will not train 20.7 70.0 —
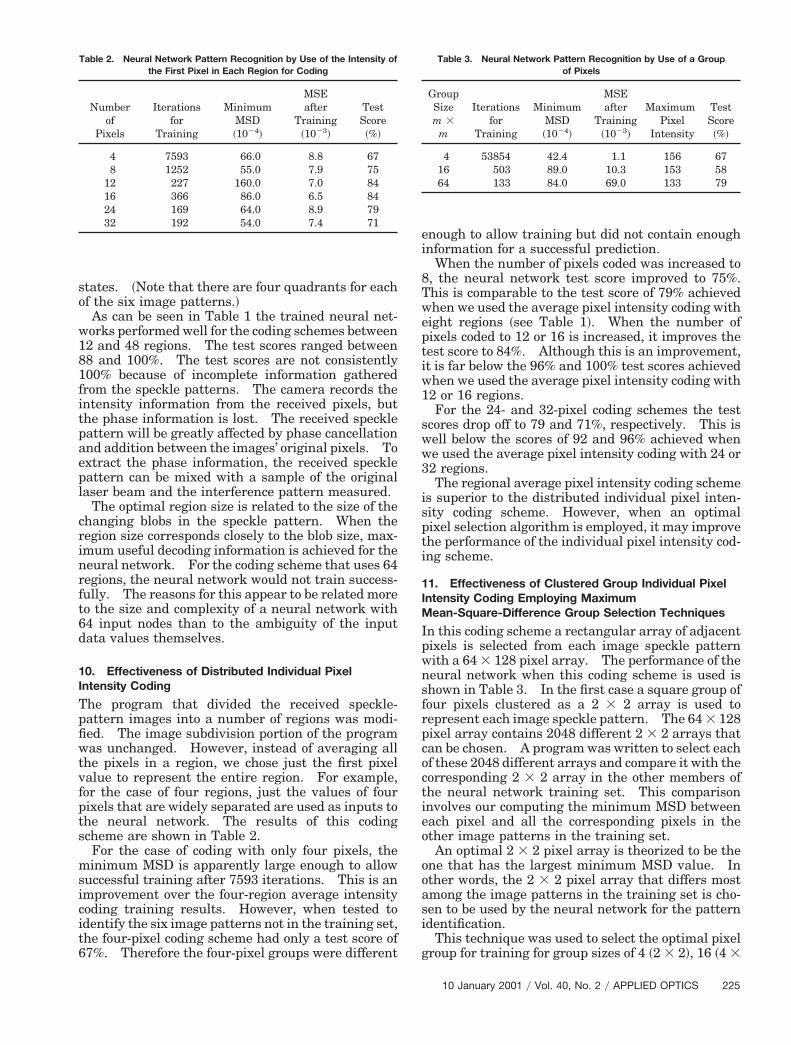
Table 2. Neural Network Pattern Recognition by Use of the Intensity of Table 3. Neural Network Pattern Recognition by Use of a Group
states. ~Note that there are four quadrants for eachof the six image patterns.!
As can be seen in Table 1 the trained neural net-works performed well for the coding schemes between12 and 48 regions. The test scores ranged between88 and 100%. The test scores are not consistently100% because of incomplete information gatheredfrom the speckle patterns. The camera records theintensity information from the received pixels, butthe phase information is lost. The received specklepattern will be greatly affected by phase cancellationand addition between the images’ original pixels. Toextract the phase information, the received specklepattern can be mixed with a sample of the originallaser beam and the interference pattern measured.
The optimal region size is related to the size of thechanging blobs in the speckle pattern. When theregion size corresponds closely to the blob size, max-imum useful decoding information is achieved for theneural network. For the coding scheme that uses 64regions, the neural network would not train success-fully. The reasons for this appear to be related moreto the size and complexity of a neural network with64 input nodes than to the ambiguity of the inputdata values themselves.
10. Effectiveness of Distributed Individual PixelIntensity Coding
The program that divided the received speckle-pattern images into a number of regions was modi-fied. The image subdivision portion of the programwas unchanged. However, instead of averaging allthe pixels in a region, we chose just the first pixelvalue to represent the entire region. For example,for the case of four regions, just the values of fourpixels that are widely separated are used as inputs tothe neural network. The results of this codingscheme are shown in Table 2.
For the case of coding with only four pixels, theminimum MSD is apparently large enough to allowsuccessful training after 7593 iterations. This is animprovement over the four-region average intensitycoding training results. However, when tested toidentify the six image patterns not in the training set,the four-pixel coding scheme had only a test score of67%. Therefore the four-pixel groups were different
the First Pixel in Each Region for Coding
Numberof
Pixels
Iterationsfor
Training
MinimumMSD~1024!
MSEafter
Training~1023!
TestScore~%!
4 7593 66.0 8.8 678 1252 55.0 7.9 75
12 227 160.0 7.0 8416 366 86.0 6.5 8424 169 64.0 8.9 7932 192 54.0 7.4 71
enough to allow training but did not contain enoughinformation for a successful prediction.
When the number of pixels coded was increased to8, the neural network test score improved to 75%.This is comparable to the test score of 79% achievedwhen we used the average pixel intensity coding witheight regions ~see Table 1!. When the number ofpixels coded to 12 or 16 is increased, it improves thetest score to 84%. Although this is an improvement,it is far below the 96% and 100% test scores achievedwhen we used the average pixel intensity coding with12 or 16 regions.
For the 24- and 32-pixel coding schemes the testscores drop off to 79 and 71%, respectively. This iswell below the scores of 92 and 96% achieved whenwe used the average pixel intensity coding with 24 or32 regions.
The regional average pixel intensity coding schemeis superior to the distributed individual pixel inten-sity coding scheme. However, when an optimalpixel selection algorithm is employed, it may improvethe performance of the individual pixel intensity cod-ing scheme.
11. Effectiveness of Clustered Group Individual PixelIntensity Coding Employing MaximumMean-Square-Difference Group Selection Techniques
In this coding scheme a rectangular array of adjacentpixels is selected from each image speckle patternwith a 64 3 128 pixel array. The performance of theneural network when this coding scheme is used isshown in Table 3. In the first case a square group offour pixels clustered as a 2 3 2 array is used torepresent each image speckle pattern. The 64 3 128pixel array contains 2048 different 2 3 2 arrays thatcan be chosen. A program was written to select eachof these 2048 different arrays and compare it with thecorresponding 2 3 2 array in the other members ofthe neural network training set. This comparisoninvolves our computing the minimum MSD betweeneach pixel and all the corresponding pixels in theother image patterns in the training set.
An optimal 2 3 2 pixel array is theorized to be theone that has the largest minimum MSD value. Inother words, the 2 3 2 pixel array that differs mostamong the image patterns in the training set is cho-sen to be used by the neural network for the patternidentification.
This technique was used to select the optimal pixelgroup for training for group sizes of 4 ~2 3 2!, 16 ~4 3
of Pixels
GroupSizem 3
m
Iterationsfor
Training
MinimumMSD~1024!
MSEafter
Training~1023!
MaximumPixel
Intensity
TestScore~%!
4 53854 42.4 1.1 156 6716 503 89.0 10.3 153 5864 133 84.0 69.0 133 79
10 January 2001 y Vol. 40, No. 2 y APPLIED OPTICS 225
n
Actwi
tWtwtf
mpradW
2
4!, and 64 ~8 3 8!. The corresponding test scores forthese group sizes are 67, 58, and 79%, as shown inTable 3. The maximum pixel intensity of all pixelsincluded in the groups is also listed.
Although the maximum MSD group selectionmethod yields trainable groups, these groups are notnecessarily the best for identifying patterns not in thetraining set. The clustered pixel groups selected inthis manner do not perform as well the same sizegroups of distributed pixels.
12. Transmission of the Characters of the Alphabet
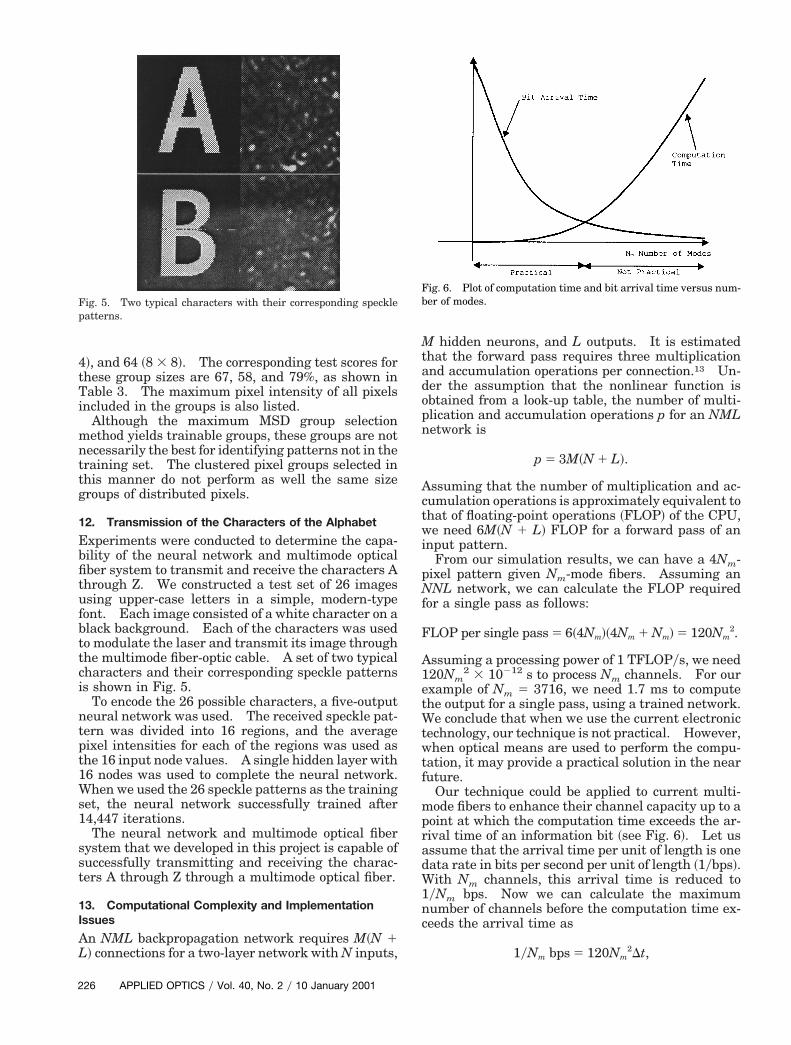
Experiments were conducted to determine the capa-bility of the neural network and multimode opticalfiber system to transmit and receive the characters Athrough Z. We constructed a test set of 26 imagesusing upper-case letters in a simple, modern-typefont. Each image consisted of a white character on ablack background. Each of the characters was usedto modulate the laser and transmit its image throughthe multimode fiber-optic cable. A set of two typicalcharacters and their corresponding speckle patternsis shown in Fig. 5.
To encode the 26 possible characters, a five-outputneural network was used. The received speckle pat-tern was divided into 16 regions, and the averagepixel intensities for each of the regions was used asthe 16 input node values. A single hidden layer with16 nodes was used to complete the neural network.When we used the 26 speckle patterns as the trainingset, the neural network successfully trained after14,447 iterations.
The neural network and multimode optical fibersystem that we developed in this project is capable ofsuccessfully transmitting and receiving the charac-ters A through Z through a multimode optical fiber.
13. Computational Complexity and ImplementationIssues
An NML backpropagation network requires M~N 1L! connections for a two-layer network with N inputs,
Fig. 5. Two typical characters with their corresponding specklepatterns.
26 APPLIED OPTICS y Vol. 40, No. 2 y 10 January 2001
M hidden neurons, and L outputs. It is estimatedthat the forward pass requires three multiplicationand accumulation operations per connection.13 Un-der the assumption that the nonlinear function isobtained from a look-up table, the number of multi-plication and accumulation operations p for an NML
etwork is
p 5 3M~N 1 L!.
ssuming that the number of multiplication and ac-umulation operations is approximately equivalent tohat of floating-point operations ~FLOP! of the CPU,e need 6M~N 1 L! FLOP for a forward pass of an
nput pattern.From our simulation results, we can have a 4Nm-
pixel pattern given Nm-mode fibers. Assuming anNNL network, we can calculate the FLOP requiredfor a single pass as follows:
FLOP per single pass 5 6~4Nm!~4Nm 1 Nm! 5 120Nm2.
Assuming a processing power of 1 TFLOPys, we need120Nm
2 3 10212 s to process Nm channels. For ourexample of Nm 5 3716, we need 1.7 ms to computehe output for a single pass, using a trained network.
e conclude that when we use the current electronicechnology, our technique is not practical. However,hen optical means are used to perform the compu-
ation, it may provide a practical solution in the nearuture.
Our technique could be applied to current multi-ode fibers to enhance their channel capacity up to a
oint at which the computation time exceeds the ar-ival time of an information bit ~see Fig. 6!. Let usssume that the arrival time per unit of length is oneata rate in bits per second per unit of length ~1ybps!.ith Nm channels, this arrival time is reduced to
1yNm bps. Now we can calculate the maximumnumber of channels before the computation time ex-ceeds the arrival time as
1yNm bps 5 120Nm2Dt,
Fig. 6. Plot of computation time and bit arrival time versus num-ber of modes.

p
2. P. Naulleau, M. Brown, C. Chen, and E. Leith, “Direct three-
orNm 5 1y~120 bps Dt!1y3,
where Dt is the time required for a single FLOP. Fora typical multimode fiber with a bps of 30 ~Gbytesykm!ys, and a computational power of 1 TFLOPys, wecan obtain Nm 5 6. This increases the channel ca-
acity by a factor of 6.
14. Conclusions
We have shown that the advantages of our techniqueover earlier multimode fiber-optic cable image trans-mission methods include the following: ~1! There isno need for a reference laser beam to reconstructphase information at the reception site; and ~2! unlikeholographic crystal image descrambling techniques,the neural network can be retrained dynamically torespond to perturbations to the cable in a field set-ting. When compared with single-mode fiber-optictransmission systems, the proposed technique in-creases the data transmission rate by a factor of 37.
We conclude that, when used with the current elec-tronic technology, our technique is not practical.However, for a typical multimode fiber, an implemen-tation of our technique can increase the channel ca-pacity by a factor of 6.
References1. W. Lukosz, “Optical systems with resolving powers exceeding
the classical limit,” J. Opt. Soc. Am. 36, 1463–1472 ~1966!.
dimensional image transmission through single-mode fiberswith monochromatic light,” Opt. Lett. 21, 36–38 ~1996!.
3. P. Naulleau, C. Chen, and E. Leith, “Analysis of direct three-dimensional transmission through optical fibers by the use ofcoherence methods,” Appl. Opt. 35, 3953–3962 ~1996!.
4. P. Naulleau and D. Dilworth, “Motion-resolved imaging ofmoving objects embedded within scattering media by the use oftime-gated speckle analysis,” Appl. Opt. 35, 5251–5257 ~1996!.
5. A. Gover, C. P. Lee, and A. Yariv, “Direct transmission ofpictorial information in multimode optical fibers,” J. Opt. Soc.Am. 66, 306–311 ~1976!.
6. G. J. Dunning and R. C. Lind, “Demonstration of image trans-mission through fibers by optical phase conjugation,” Opt. Lett.7, 558–560 ~1982!.
7. B. Fischer and S. Sternklar, “Image transmission and inter-ferometry with multimode fibers using self-pumped phase con-jugation,” Appl. Phys. Lett. 46, 113–114 ~1985!.
8. U. Levy and A. A. Friesem, “Direct picture transmission in asingle optical fiber with holographic filters,” Opt. Commun. 30,163–165 ~1979!.
9. J.-Y. Son, V. I. Bobrinev, H.-W. Jeon, Y.-H. Cho, and Y.-S. Eom,“Direct image transmission through a multimode optical fiber,”Appl. Opt. 35, 273–277 ~1996!.
10. P. C. Sun and E. N. Leith, “Broad-source image plane holog-raphy as a confocal imaging process,” Appl. Opt. 35, 597–602~1994!.
11. J. P. Powers, An Introduction to Fiber Optic Systems, ~AkenAssociates, Boston, Mass., 1993!.
12. S. Haykin, Neural Networks, a Comprehensive Foundation,2nd ed. ~Prentice-Hall, Englewood Cliffs, N.J., 1999!.
13. J. M. Zurada, Introduction to Artificial Neural Systems ~West,St. Paul, Minn., 1992!.
10 January 2001 y Vol. 40, No. 2 y APPLIED OPTICS 227