neuro lecture laibson 2 aea - harvard...
TRANSCRIPT

David LaibsonJanuary 2010
AEA
This deck contains “hidden slides” that were not presented in course. View in “slideshow” mode to avoid these hidden slides.
NeuroeconomicsLaibson Lecture 2

Outline:
• Neuroeconomics: definition• Multiple Systems Hypothesis

Neuroeconomics: definition.
Definition: Neuroeconomics is the study of the biological microfoundations of economic cognition.
• Biological microfoundations are neurochemical mechanisms and pathways, like brain systems, neurons, genes, and neurotransmitters.
• Economic cognition is cognitive activity that is associated with economic perceptions, beliefs and decisions, including mental representations, emotions, expectations, learning, memory, preferences, decision-making, and behavior.

The “field”
• Less than a decade old• About 200 neuroscientists and economists are active• Roughly a 2:1 mix of neuroscientists and economists• This contrast’s with behavioral economics, where it’s
a one-sided game (mostly economists).• In neuroeconomics, there is a mix of behavioral
economists (Camerer, Fehr, Laibson, Loewenstein, Prelec), classical economists (Dickhaut, McCabe, Rustichini), and some people who are hard to categorize (Bernheim, Rangel).
• You don’t need to believe people are irrational to be a neuroeconomist, though as we’ll see believe it helps.
• Annual conference and a “society.”

Neuroeconomics: methods
• Animal behavioral studies (e.g., addicting rats to cocaine, loss aversion in monkeys; Chen et al 2006)
• Studies of children (e.g. Mischel et al 1975)• Studies of children with autism (e.g. Sally et al 2001).• External physiological measurement (e.g., pupil dilation,
voice tone, facial expression, skin conductance, heart rate)
• Cognitive load (remember this seven digit number and do a task; e.g. Shiv and Fedorhikin 1999)

More methods...
Lesions, localized damage, gene knockout…• e.g., experimental destruction of both amygdalas in an
animal tames the animal, making it sexually inactive and indifferent to danger like snakes or other aggressive members of its own species
• e.g., humans with lesions of the amygdala lose affective (i.e. emotional) meaning
• e.g., knocking out the gene that makes a key protein for amygdala function makes rats relatively fearless
• e.g., hippocampus removal prevents experiences from being encoded in long-term memory

More methods
• Brain stimulation (e.g., electrical stimulation of the amygdala elicits violence and aggressivity; at special loci, electrical brain stimulation is highly reinforcing)
• Single neuron measurement (e.g., track high frequency dopamine release in animal models, Schultz et al, Glimcher)
• Transcranial magnetic stimulation (TMS)
• EEG, PET, fMRI… (taking pictures of the active brain; e.g., McCabe, Houser, Ryan, Smith, and Trouard 2001).

Schultz, Dayan, Montague (1997) Schultz, Dayan, Montague (1997) ScienceScience 275:1593275:1593--15991599
Zero Zero prediction errorprediction error““same as expectedsame as expected””
Negative Negative prediction errorprediction error““worse than expectedworse than expected””
Positive Positive prediction errorprediction error““better than expectedbetter than expected””

Source: Scott Huettel

The fMRI Blood-Oxygenation-Level-Dependent (BOLD) ResponseIncreased neuronal activity results in increased MR (T2*) signal
BASELINE
ACTIVE
Source: Scott Huettel

Basic experimental design
TaskA
TimeTaskB
TaskC
Rest12 sec
Rest12 sec
Rest12 sec
Rest12 sec

Basic econometric methodology
• Divide brain into 10,000 voxels (cubes 3 mm on edge)• Measure blood flow at the voxel level (BOLD signal) • Run “regressions” (general linear model) relating BOLD
signal to covariates:BOLDv,i,t = FEi + controlst + task dummyt
• Indexes for voxel (v), subject (i), and time (t)• Controls: time in scanner, lagged reward event, etc.• event dummy: decision, experience, event, etc.• Analogous method: “contrast”
( ), , , , 'Contrast at voxel = v i t v i ti I
v BOLD BOLD∈
−∑

Unusual features of neuroeconomic experiments
• Extensive pre-scanner piloting (scanner time is $$$)• Only need about 20-40 scanned subjects (not that
expensive after all – about $20,000 for scanner costs)• Claustrophobia and noise issues• Try to implement within-subject designs• Tasks can’t take too long (max about 45 minutes)

Continued…
• Can do almost anything in the scanner – Play games– Play real-time games with other subjects (so-called
hyperscans)– Eat– Experience pain
• Analysis is subject to methodological criticisms (lots of hypothesis tests) – use conservative thresholds, such as 5+ contiguous voxels and α = 0.001 or smaller
• Most economists need neuroscience collaborators to implement neuroimaging experiments

Why should economists study the brain?
1. Because we care about the brain for its own sake? (No.)
2. Because we hope to improve our measurements of utility? (Maybe.)
3. Because the study of the brain will direct and catalyze the development of new models, speeding up the rate of progress in model development. (Yes.)
4. Because neuroscience will provide new empirical methods that will sometimes provide new empirical tests. (Yes.)
5. Because we will eventually be able to use neuroscience measurements to help people better understand and manage themselves. (Yes.)

An example:The Multiple Systems Hypothesis
• Statement of Hypothesis• Variations on a theme• Caveats• Illustrative predictions
– Cognitive load manipulations– Willpower manipulations– Affect vs. analytic manipulations– Cognitive Function– Development– Neuroimaging
• Directions for future research

Statement of Multiple Systems Hypothesis (MSH)
• The brain makes decisions (e.g. constructs value) by integrating signals from multiple systems
• These multiple systems process information in qualitatively different ways and in some cases differentially weight attributes of rewards (e.g., time delay)

An (oversimplified) multiple systems model
System 1 System 2Integration
Behavior
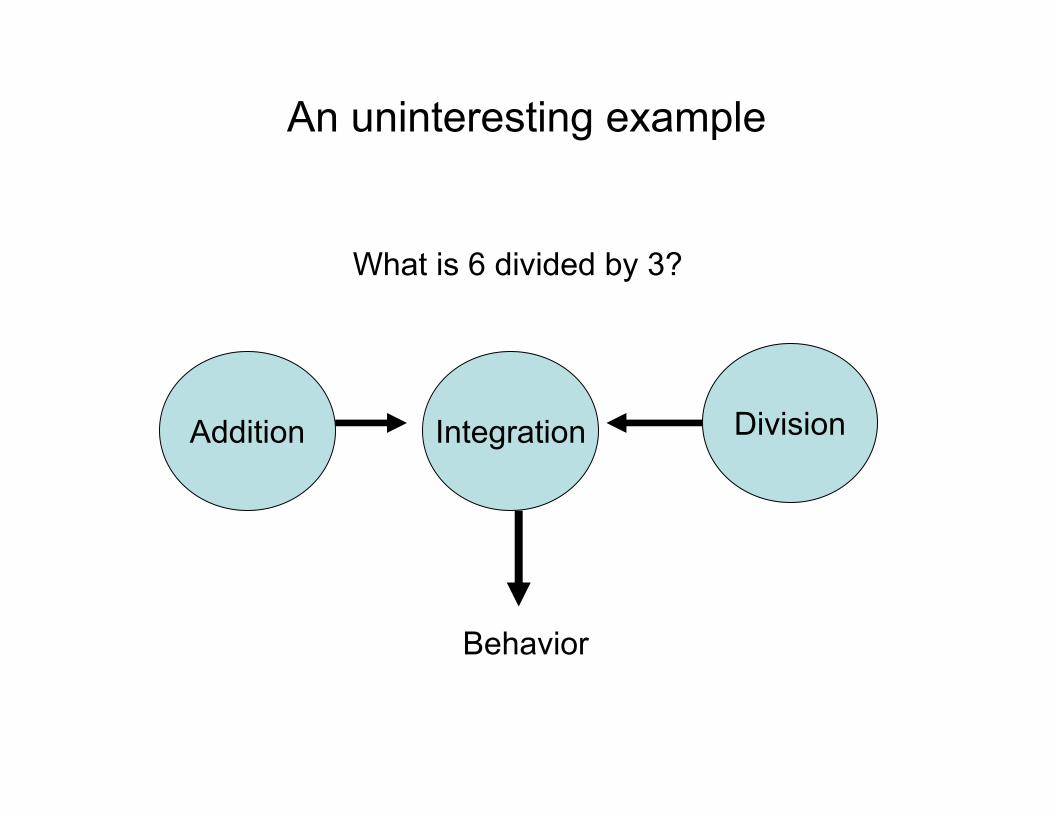
An uninteresting example
Addition DivisionIntegration
Behavior
What is 6 divided by 3?

A more interesting example
Abstract goal:diet
Visceralreward:pleasure
Integration
Behavior
Would you like a piece of chocolate?

A more interesting example
Abstract goal:diet
Visceralreward:pleasure
Integration
Behavior
Would you like a piece of chocolate?

Variations on a theme• Interests vs passions (Smith)• Superego vs Ego vs Id (Freud)• Controlled vs Automatic (Schneider & Shiffrin, 1977; Benhabib & Bisin, 2004)• Cold vs Hot (Metcalfe and Mischel, 1979)• System 2 vs System 1 (Frederick and Kahneman, 2002)• Deliberative vs Impulsive (Frederick, 2002)• Conscious vs Unconscious (Damasio, Bem)• Effortful vs Effortless (Baumeister)• Planner vs Doer (Shefrin and Thaler, 1981)• Patient vs Myopic (Fudenburg and Levine, 2006)• Abstract vs Visceral (Loewenstein & O’Donoghue 2006; Bernheim & Rangel, 2003)
• PFC & parietal cortex vs Mesolimbic dopamine (McClure et al, 2004)

Mesolimbic dopamine reward system
Frontalcortex
Parietalcortex
Affective vs. Analytic Cognition
mPFCmOFCvmPFC

Commonalities between classification schemes
Affective system• fast• unconscious• reflexive• myopic
Analytic system• slow• conscious• reflective• forward-looking• (but still prone to error:
heuristics may be analytic)

Relationship to quasi-hyperbolic model
• Hypothesize that mesolimbic dopamine system is impatient.
• Hypothesize that the fronto-parietal system is patient• Here’s one implementation of this idea:
Ut = ut + β [δut+1 + δ2ut+2 + δ3ut+3 + ...](1/β)Ut = (1/β)ut + δut+1 + δ2ut+2 + δ3ut+3 + ...(1/β)Ut =(1/β−1)ut + [δ0ut + δ1ut+1 + δ2ut+2 + δ3ut+3 + ...]
limbic fronto-parietal cortex

• Hypothesize that the fronto-parietal system is patient• Hypothesize that mesolimbic system is impatient.• Then integrated preferences are quasi-hyperbolic
Relationship to quasi-hyperbolic model
now t+1 t+2 t+3
PFC 1 1 1 1 …
Mesolimbic 1 0 0 0 …
Total 2 1 1 1 …
Total normed 1 1/2 1/2 1/2 …

Caveats
• N ≥ 2• The systems do not have well-defined boundaries
(they are densely interconnected)• Maybe we should not say “system,” but should
instead say “multiple processes”• Some systems may not have a value/utility
representation– Making my diet salient is not the same as assigning
utils/value to a Devil Dog
• If you look downstream enough, you’ll find what looks like an integrated system

Predictions• Cognitive Load Manipulations
– Shiv and Fedorikhin (1999), Hinson, Jameson, and Whitney (2003)
• Willpower manipulations– Baumeister and Vohs (2003)
• Affect vs. analytic manipulations– Rodriguez, Mischel and Shoda (1989)
• Cognitive Function– Benjamin, Brown, and Shapiro (2006), Shamosh and Gray (forth.)
• Developmental Dynamics– Green, Fry, and Myerson (1994), Krietler and Zigler (1990)
• Neuroimaging Studies– Tanaka et al (2004), McClure et al (2004), Hariri et al (2006), McClure et
al (2007), Kabel and Glimcher (2007), Hare, Camerer, and Rangel (2009)
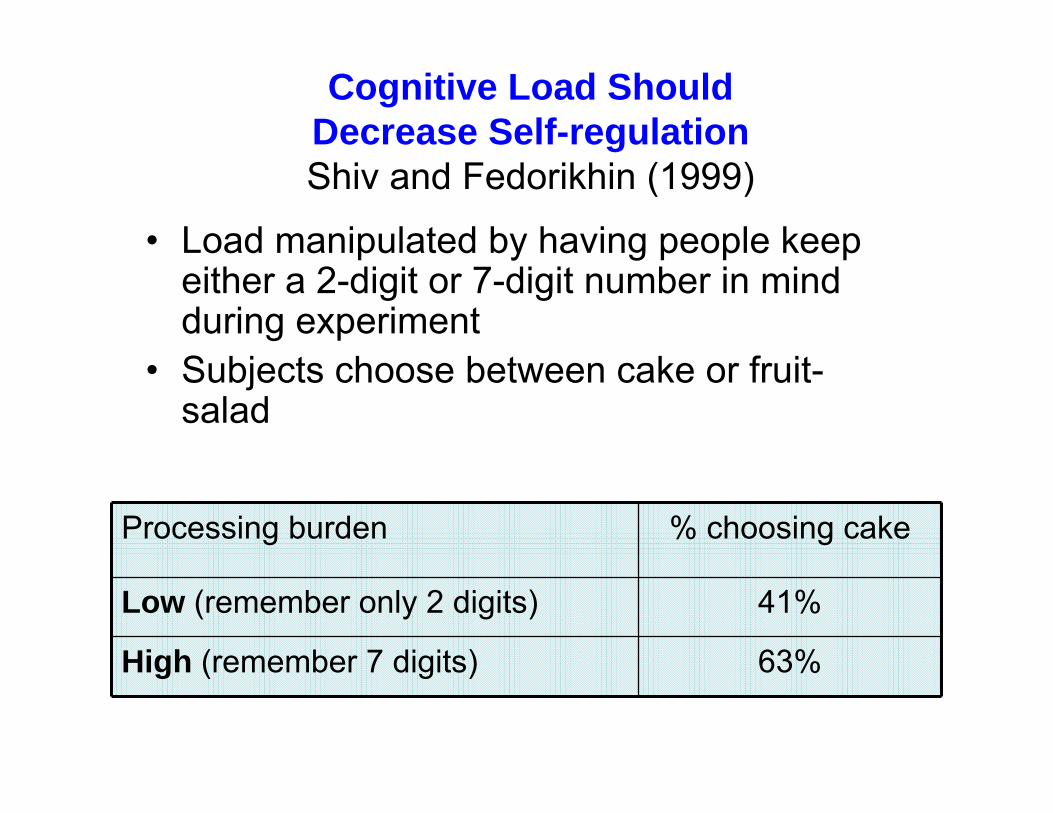
Cognitive Load Should Decrease Self-regulationShiv and Fedorikhin (1999)
• Load manipulated by having people keep either a 2-digit or 7-digit number in mind during experiment
• Subjects choose between cake or fruit-salad
Processing burden % choosing cake
Low (remember only 2 digits) 41%
High (remember 7 digits) 63%
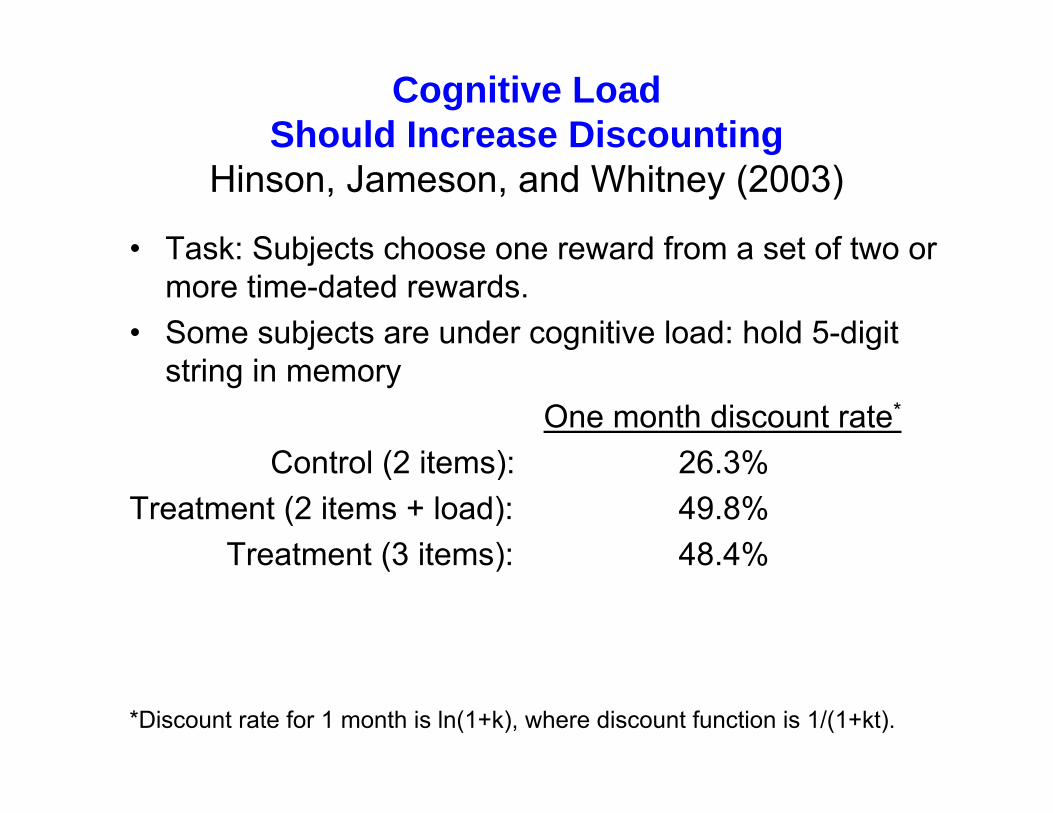
Cognitive Load Should Increase Discounting
Hinson, Jameson, and Whitney (2003)
• Task: Subjects choose one reward from a set of two or more time-dated rewards.
• Some subjects are under cognitive load: hold 5-digit string in memory
One month discount rate*
Control (2 items): 26.3%Treatment (2 items + load): 49.8%
Treatment (3 items): 48.4%
*Discount rate for 1 month is ln(1+k), where discount function is 1/(1+kt).

Willpower should be a domain general and exhaustable resource
Muraven, Tice and Baumeister (1998)
• All subjects watch upsetting video clip– Treatment subjects are asked to control emotions and moods– Control subjects are not asked to regulate emotions
• All subjects then try to squeeze a handgrip as long as possible
• Treatment group gives up sooner on the grip task
• Interpretation: executive control is a scarce resource that is depleted by use
• Many confounds and many variations on this theme
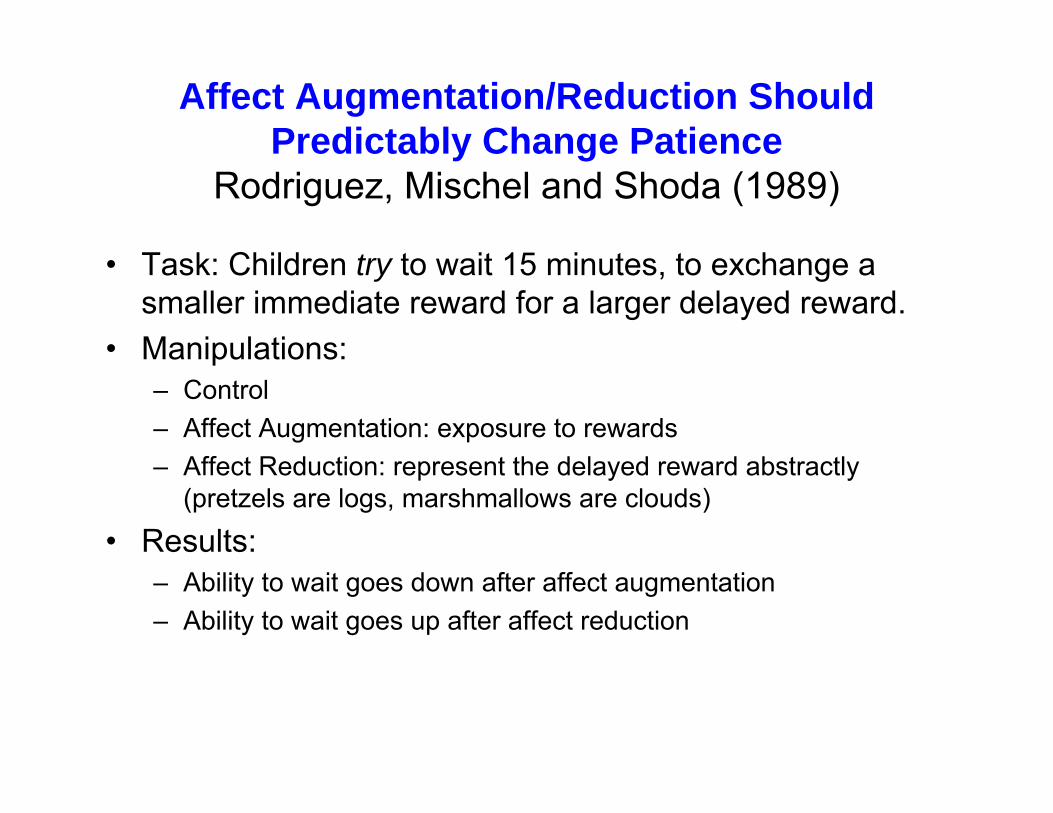
Affect Augmentation/Reduction ShouldPredictably Change Patience
Rodriguez, Mischel and Shoda (1989)
• Task: Children try to wait 15 minutes, to exchange a smaller immediate reward for a larger delayed reward.
• Manipulations:– Control– Affect Augmentation: exposure to rewards– Affect Reduction: represent the delayed reward abstractly
(pretzels are logs, marshmallows are clouds)
• Results: – Ability to wait goes down after affect augmentation– Ability to wait goes up after affect reduction

Delay of Gratification Paradigm

Delay of Gratification Paradigm
QuickTime™ and aYUV420 codec decompressor
are needed to see this picture.

Individuals with greater analytic intelligence should be more patient
Shamosh and Gray (forthcoming)
• Meta-analysis of the relationship between delay discounting and analytic intelligence – e.g. g, IQ, math ability
• In 24 studies, nearly all found a negative relationship• Quantitative synthesis across 26 effect sizes produce a
correlation of -0.23
• See also new work by Burks et al. (2009) which finds this pattern in a sample of truck drivers.
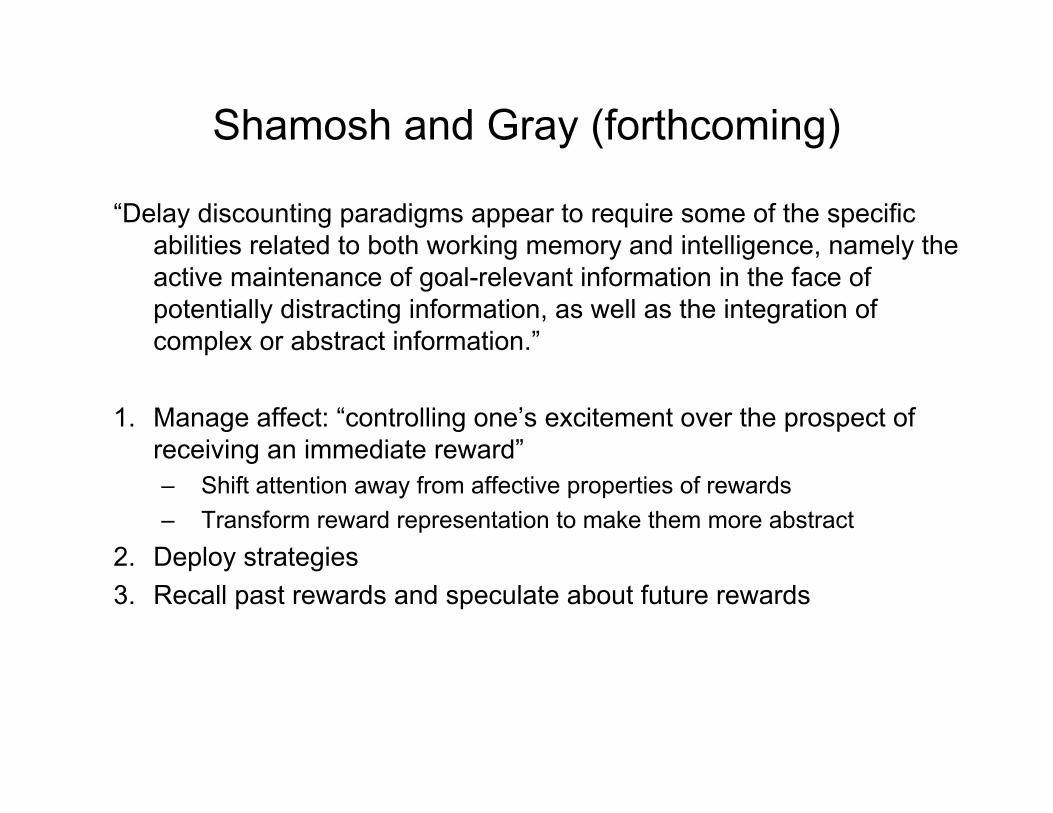
Shamosh and Gray (forthcoming)
“Delay discounting paradigms appear to require some of the specific abilities related to both working memory and intelligence, namely the active maintenance of goal-relevant information in the face of potentially distracting information, as well as the integration of complex or abstract information.”
1. Manage affect: “controlling one’s excitement over the prospect of receiving an immediate reward”– Shift attention away from affective properties of rewards– Transform reward representation to make them more abstract
2. Deploy strategies3. Recall past rewards and speculate about future rewards

Individuals with greater analytic intelligence should be more patient
Benjamin, Brown, and Shapiro (2006)
• Choice task: “500 pesos today vs. 550 pesos in a week”• One standard deviation increase in a subject’s math test
score is associated with a 9.3% increase in the subject’s likelihood of choosing patiently

Patience should track PFC development
• PFC undergoes development more slowly than other brain regions
• Changes in patience track timing of PFC development– Green, Fry, and Myerson (1994)– Krietler and Zigler (1990)– Galvan (2008)
• Cross-species evidence is also supportive – Monkeys have a 50% discount for juice rewards delayed 10
seconds (Livingstone 2009)

Neural activity in frontoparietal regions should be differentiated from neural activity in
mesolimbic dopamine regions
• Not clear.• At least five relevant studies:
– McClure et al (2004) – supportive– McClure et al (2007) – supportive – Kable and Glimcher (2007) – critical– Hariri et al (2007) – supportive– Hare, Camerer, and Rangel (2009) – integration
• And one other study that is related (and supportive):– Tanaka et al (2004): different behavioral task
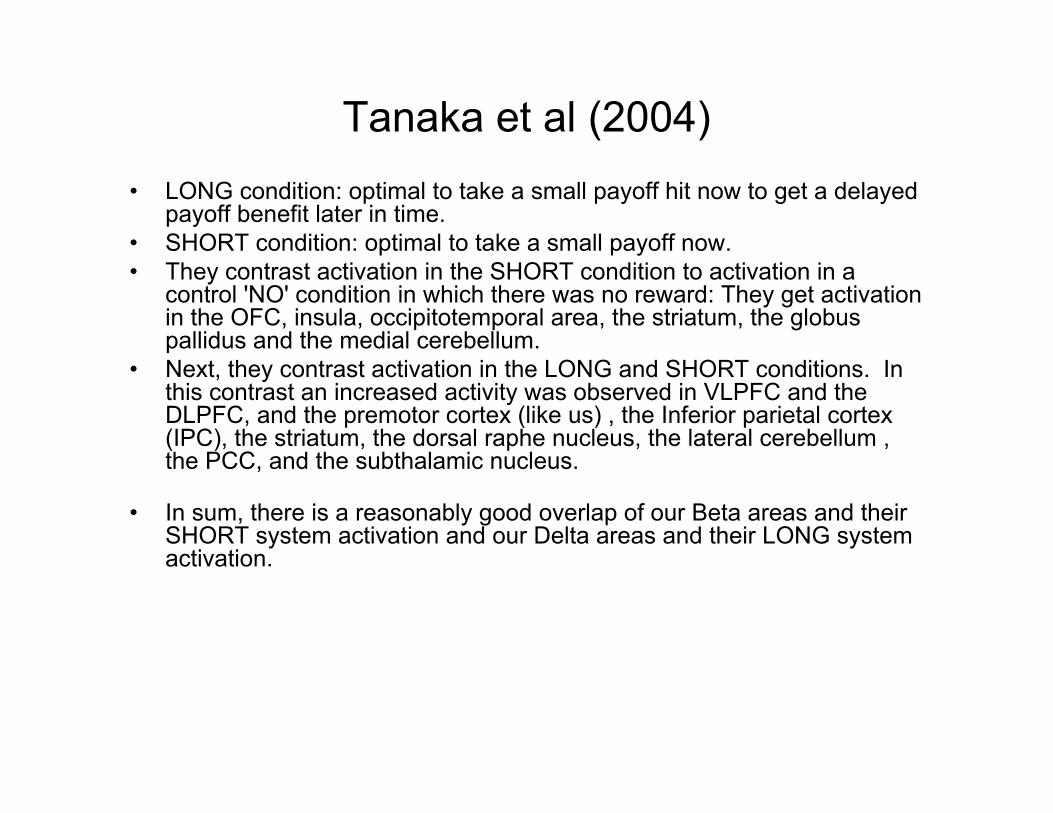
Tanaka et al (2004)• LONG condition: optimal to take a small payoff hit now to get a delayed
payoff benefit later in time.• SHORT condition: optimal to take a small payoff now.• They contrast activation in the SHORT condition to activation in a
control 'NO' condition in which there was no reward: They get activation in the OFC, insula, occipitotemporal area, the striatum, the globus pallidus and the medial cerebellum.
• Next, they contrast activation in the LONG and SHORT conditions. In this contrast an increased activity was observed in VLPFC and the DLPFC, and the premotor cortex (like us) , the Inferior parietal cortex (IPC), the striatum, the dorsal raphe nucleus, the lateral cerebellum , the PCC, and the subthalamic nucleus.
• In sum, there is a reasonably good overlap of our Beta areas and their SHORT system activation and our Delta areas and their LONG system activation.
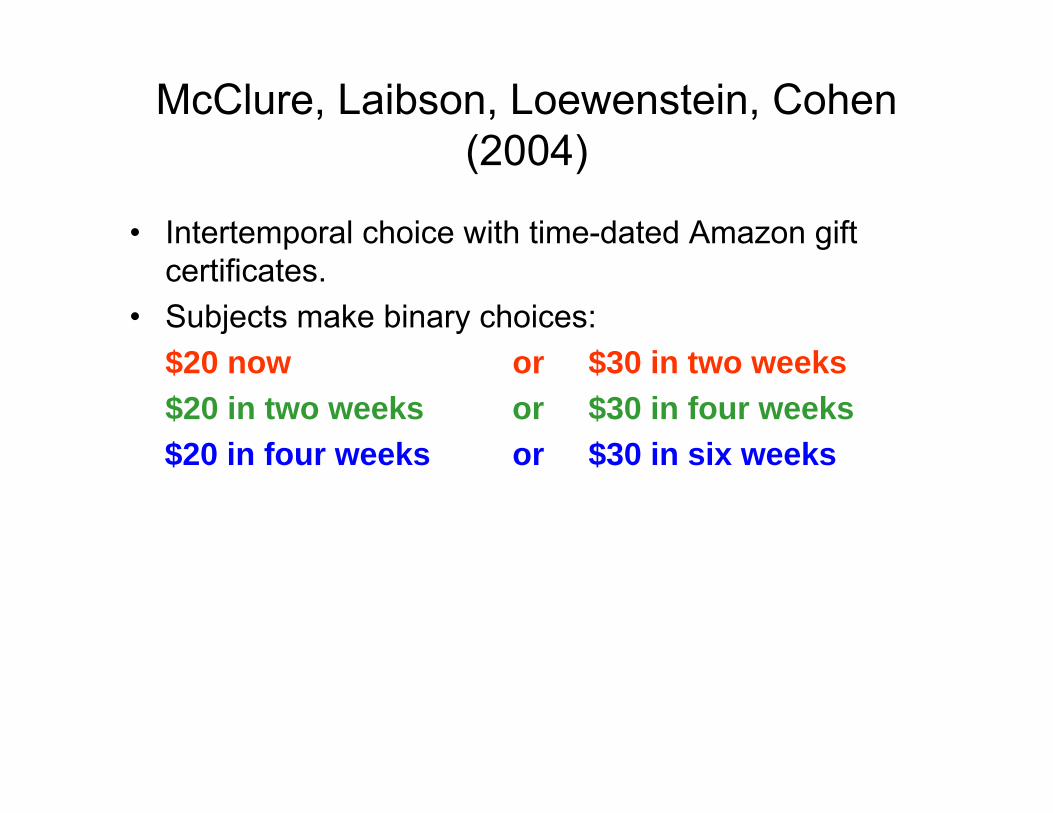
McClure, Laibson, Loewenstein, Cohen (2004)
• Intertemporal choice with time-dated Amazon gift certificates.
• Subjects make binary choices:$20 now or $30 in two weeks$20 in two weeks or $30 in four weeks $20 in four weeks or $30 in six weeks

$20
$20
$20
$30
$30
$30
Fronto-parietal cortex
Fronto-parietal cortex
Fronto-parietal cortexMeso-limbic dopamine

y = 8mmx = -4mm z = -4mm0
7
T1
Delay to earliest reward = TodayDelay to earliest reward = 2 weeksDelay to earliest reward = 1 month
0.2%
VStr MOFC MPFC PCC
β areas respond “only” to immediate rewards
BO
LD
Sig
nal
2 sec
Time

X Y Z Max T n
Medial OFC -8 48 -4 5.034 16
Ventral striatum 6 8 -4 4.369 5
L Posterior hippocampus -26 -38 -8 4.582 7
Medial PFC 0 44 12 6.793 74
Posterior cingulate cortex -8 -28 32 5.354 21
All voxels significant at p < 0.001
β AnalysisSummary of Significant Voxels

x = 44mm
x = 0mm
0 15T1
VCtx
0.4%
2s
PMA RPar
DLPFC VLPFC LOFC
δ Areas respond equally to all rewards
Delay to earliest reward = TodayDelay to earliest reward = 2 weeksDelay to earliest reward = 1 month

X Y Z Max T n
Visual cortex -4 -80 4 14.787 1093
PMA 0 12 56 5.277 15
SMA 4 30 40 4.987 10
R Posterior parietal cortex 40 -60 44 7.364 191
L Posterior parietal cortex -32 -60 52 9.568 73
R DLPFC 44 44 16 7.422 59
R VLPFC 40 20 -8 7.596 39
R Lateral OFC 24 50 -12 5.509 5
δ Analysis: Summary of Significant Voxels
All voxels significant at p < 0.001

0%
25%
50%
75%
100%
1-3% 5-25% 35-50%
P(ch
oose
ear
ly)
Difficult
Easy
0.4%
2s
VCtx RPar
DLPFC VLPFC LOFC
PMA
2.5
3.0
3.5
4.0
4.5
DifficultEasy
Effect of DifficultyR
espo
nse
Tim
e (s
ec)
(R’-R)/R
1-3%35-50%
5-25%
Sec
SecB
OL
D S
igna
lB
OL
D S
igna
l

0.0
-0.05
0.05
ChooseImmediate
Reward
ChooseDelayedReward
DRS
Fronto-parietal cortex
Bra
in A
ctiv
ity
Brain activity in the frontoparietal system and mesolimbic dopamine reward system predict behavior
(Data for choices with an immediate option.)

McClure, Ericson, Laibson, Loewenstein, Cohen(2007)
Subjects water deprived for 3hr prior to experiment
(a subject scheduled for 6:00)

Free (10s max.) 2s Free (1.5s Max)Variable Duration
15s
(i) Decision Period (ii) Choice Made (iii) Pause (iv) Reward Delivery
15s 10s 5s
iv. Juice/Water squirt (1s )
…Time
i ii iii
A
B
Figure 1
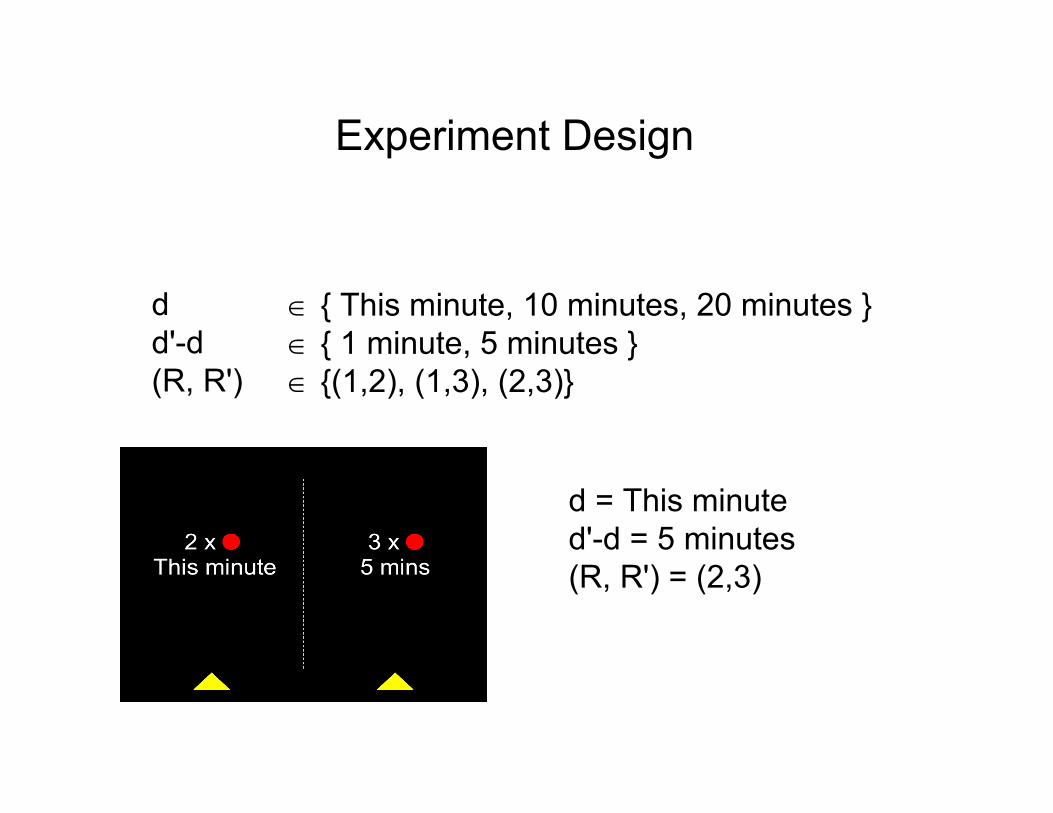
dd'-d (R, R')
∈ { This minute, 10 minutes, 20 minutes }∈ { 1 minute, 5 minutes }∈ {(1,2), (1,3), (2,3)}
Experiment Design
d = This minuted'-d = 5 minutes(R, R') = (2,3)

0
0.2
0.4
0.6
0.8
This Minute 10 Minutes 20 Minutes
P(c
hoos
e ea
rly)
d = delay to early reward
Behavioral evidence

0
0.2
0.4
0.6
0.8
This Minute 10 Minutes 20 Minutes
P(c
hoos
e ea
rly)
0
0.2
0.4
0.6
0.8
This Minute 10 Minutes 20 Minutes
d’-d = 5 mind’-d = 1 min
d = delay to early reward d = delay to early reward
Behavioral evidence
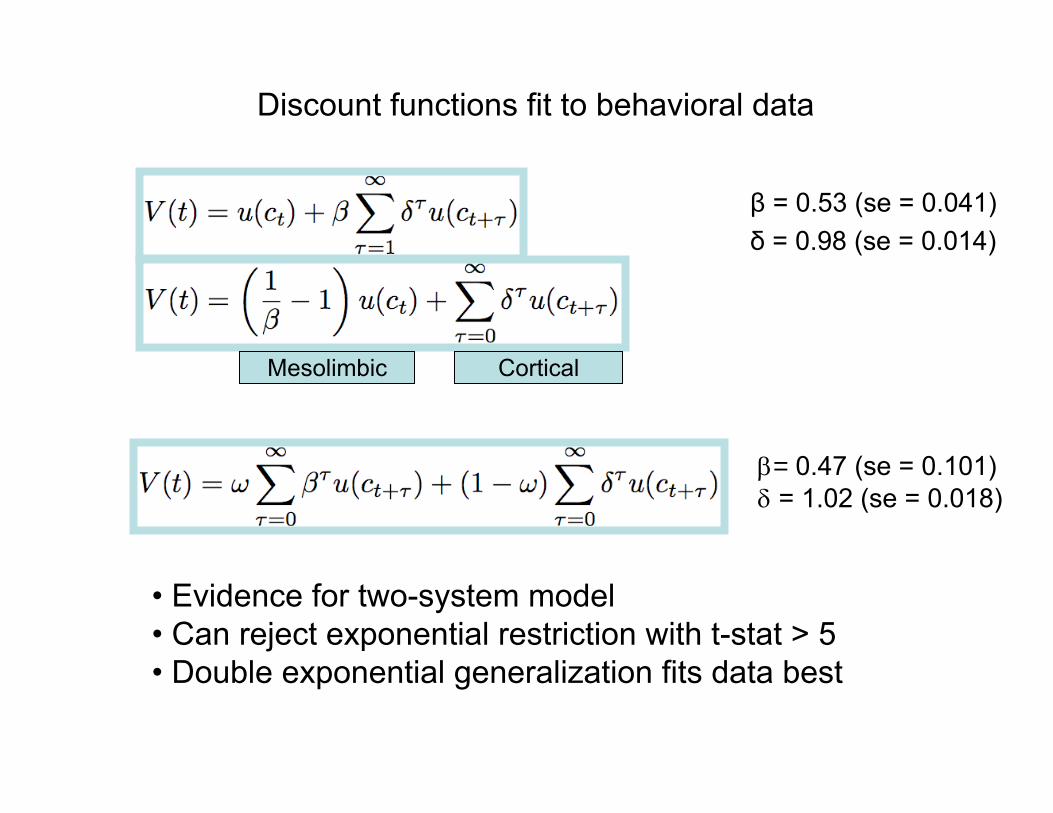
Discount functions fit to behavioral data
Mesolimbic Cortical
β = 0.53 (se = 0.041)δ = 0.98 (se = 0.014)
β= 0.47 (se = 0.101)δ = 1.02 (se = 0.018)
• Evidence for two-system model• Can reject exponential restriction with t-stat > 5• Double exponential generalization fits data best

y = 12mm
VStr
SMAIns
0
11
T2s
0.2%
Juice Water
Juice and Water treated equally (both behavioral and neurally)
Time (2 second increments)

Figure 4
x = -12mm x = -2mm x = -8mm z = -10mm
NAcc
MOFC/SGC
ACCPCu
PCC
NAcc
ACC
SGC
PCu
x = 0mm x = 40mm x = -48mm
PCC SMA/PMA
Vis Ctx
PPar
BA10
Ant Ins
BA9/44 BA46
0
11
T
A
B
β areas: respond only to immediate rewards
δ areas: respond to all rewards
Neuroimaging data estimated with general linear model.

Figure 5
x = 0mm x = -48mm
x = 0mm y = 8mm
Juiceonly
Amazononly
Both
δ areas (p<0.001)
β areas (p<0.001)
Relationship to Amazon experiment:

Figure 5
Primaryonly
Moneyonly
Both
x = 0mm x = -48mm
x = -4mm y = 12mm
δ areas (p<0.01)
β areas (p<0.01)
Relationship to Amazon experiment:
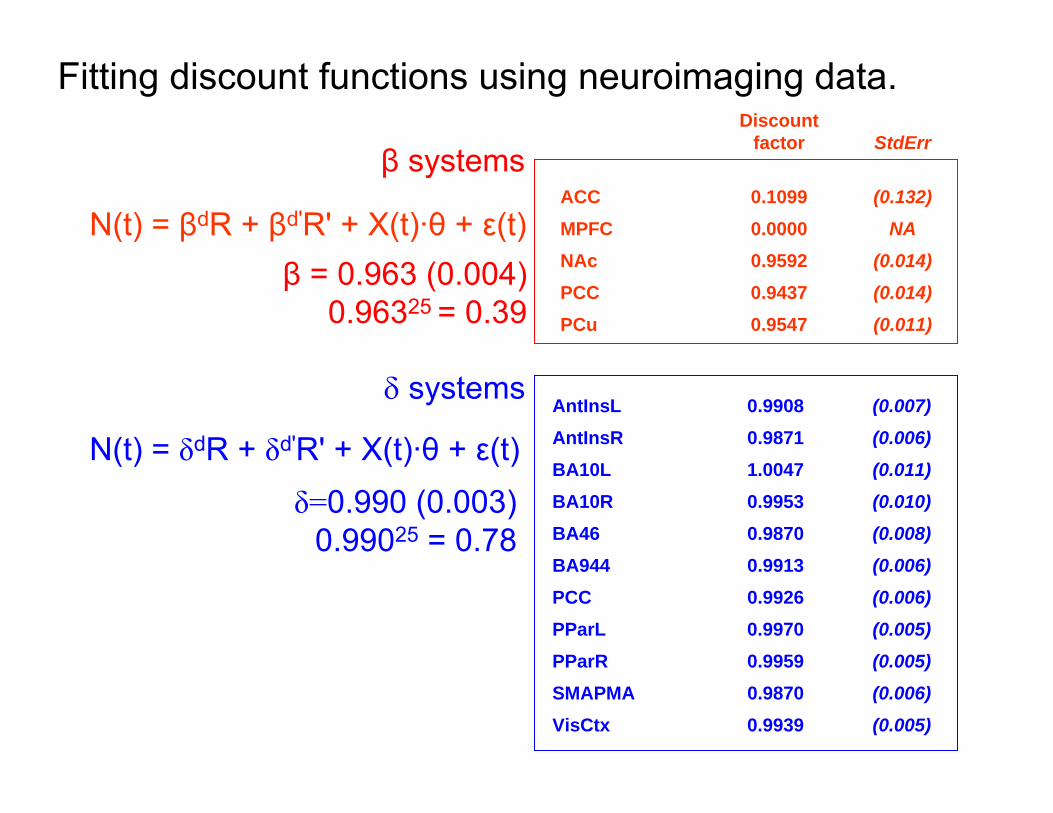
AntInsL 0.9908 (0.007)AntInsR 0.9871 (0.006)BA10L 1.0047 (0.011)BA10R 0.9953 (0.010)BA46 0.9870 (0.008)BA944 0.9913 (0.006)PCC 0.9926 (0.006)PParL 0.9970 (0.005)PParR 0.9959 (0.005)SMAPMA 0.9870 (0.006)VisCtx 0.9939 (0.005)
Fitting discount functions using neuroimaging data. Discount
factor StdErr
ACC 0.1099 (0.132)MPFC 0.0000 NANAc 0.9592 (0.014)PCC 0.9437 (0.014)PCu 0.9547 (0.011)
β = 0.963 (0.004)0.96325 = 0.39
δ=0.990 (0.003)0.99025 = 0.78
N(t) = βdR + βd'R' + X(t)·θ + ε(t)
N(t) = δdR + δd'R' + X(t)·θ + ε(t)
β systems
δ systems

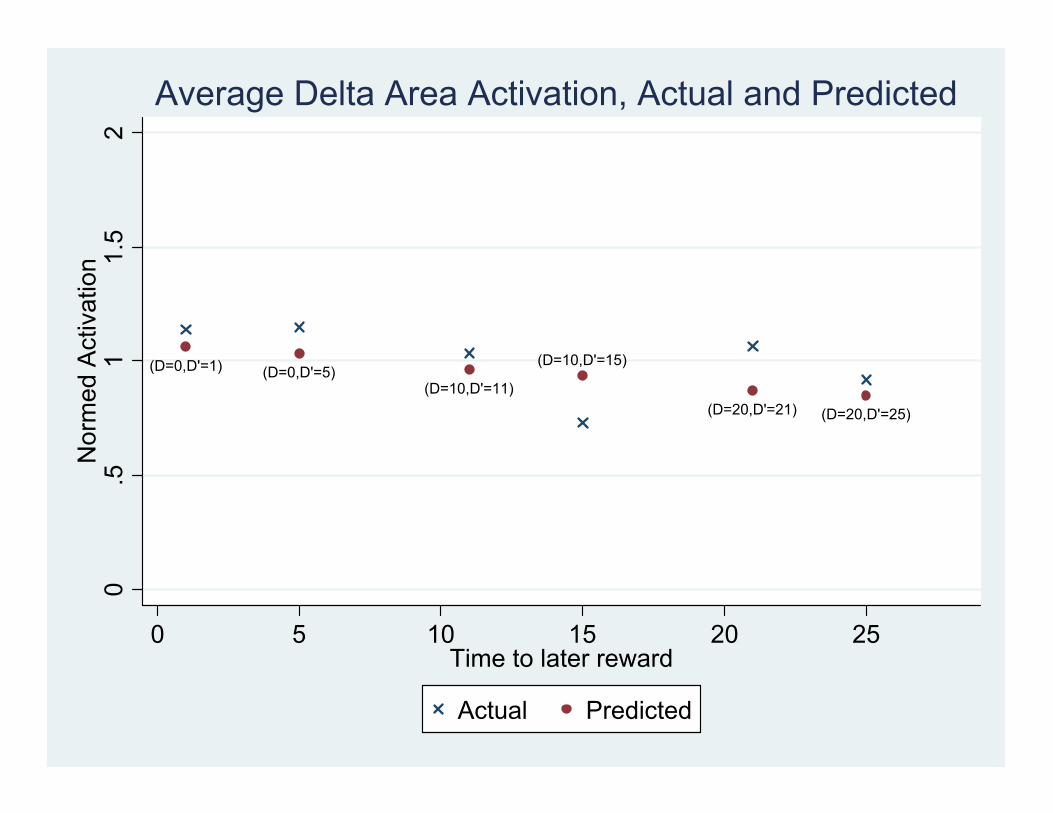
(D=0,D'=1)
(D=0,D'=5)
(D=10,D'=11)(D=10,D'=15)
(D=20,D'=21)(D=20,D'=25)
0.5
11.
52
Nor
med
Act
ivat
ion
0 5 10 15 20 25Time to later reward
Actual Predicted
Average Beta Area Activation, Actual and Predicted
(D=0,D'=1) (D=0,D'=5)(D=10,D'=11)
(D=10,D'=15)
(D=20,D'=21) (D=20,D'=25)
0.5
11.
52
Nor
med
Act
ivat
ion
0 5 10 15 20 25Time to later reward
Actual Predicted
Average Delta Area Activation, Actual and Predicted

What determines immediacy?
Is mesolimbic DRS activation associated with relatively “early” (or earliest) options?
or
Do juice and money have different discount functions?
or
Does thirst invoke more intense discounting?

Our working hypotheses.
• One system associated with midbrain dopamine neurons (mesolimbic DRS) shows high sensitivity to time delay.
• Second system associated with lateral prefrontal and posterior parietal cortex shows less sensitivity to time delay.
• Combined function of these two systems explains decision making across choice domains.
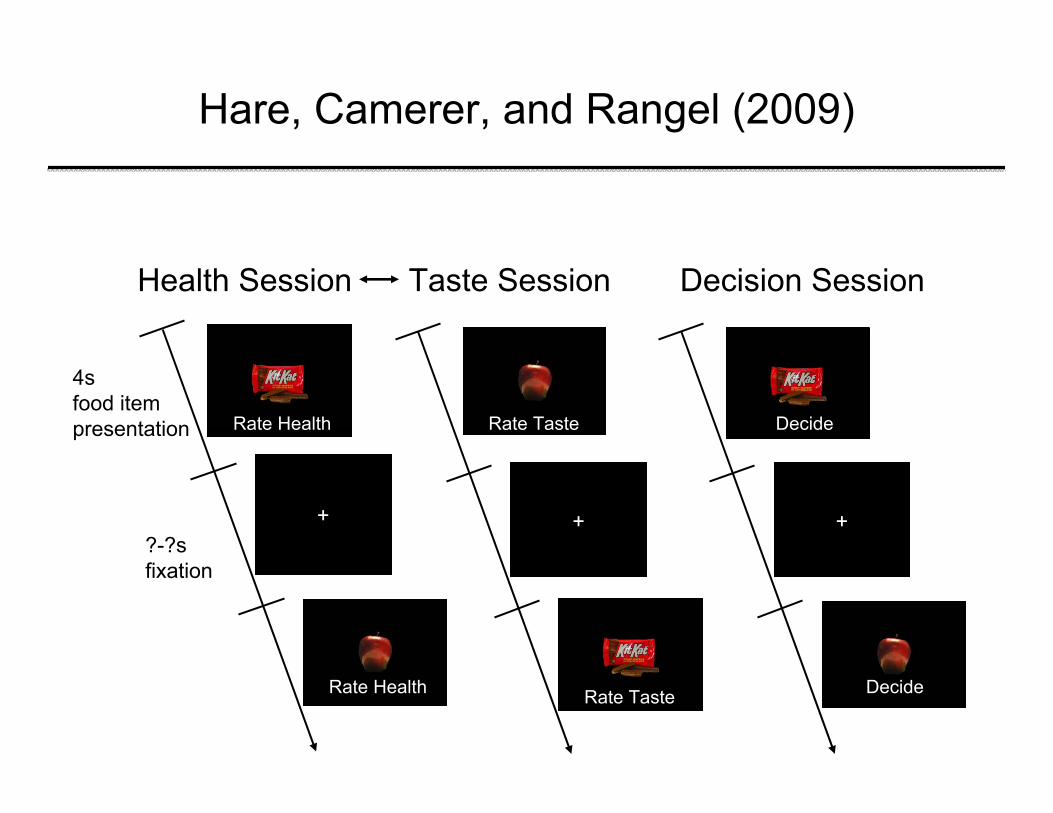
Hare, Camerer, and Rangel (2009)
+
4sfood itempresentation
?-?s fixation
Rate Health
Rate Health
+
Rate Taste
Rate Taste
+
Decide
Decide
Health Session Taste Session Decision Session

Details
• Taste and health ratings made on five point scale:-2,-1,0,1,2
• Decisions also reported on a five point scale: SN,N,0,Y,SY“strong no” to “strong yes”
• Subject choices sometimes reflect self control –rejection of an unhealthy, good tasting food, OR, acceptance of a healthy, bad tasting food

Subjects
• SC (self-control) group = 19 dieting subjects who showed self-control during the decision phase
• NSC (no self-control) group = 18 comparison subjects who did not exhibit self-control during the decision phase

Who is classified as a self-controller: SC?(must meet all criteria below)
1) Use self-control on > %50 of trials in which self-control is required (decline Liked-Unhealthy items or choose Disliked-Healthy ones)
2) Decision = β1HR + β2LR + εβ1> β2
3) R2 for HR > R2 for LR

Examples of individual behavioral fits
Self-controller
Non-self-controller

DislikedHealthy
DislikedUnhealthy
LikedUnhealthy
LikedHealthy
Per
cent
Yes
Result: NSC group chose based on taste

* *
DislikedHealthy
DislikedUnhealthy
LikedUnhealthy
LikedHealthy
Per
cent
Yes
Result: SC group chose based on taste and health

* *
DislikedHealthy
DislikedUnhealthy
LikedUnhealthy
LikedHealthy
Per
cent
Yes
SC group versus NSC group

Question: Is there evidence for a single valuation system?
Neuroimaging Results
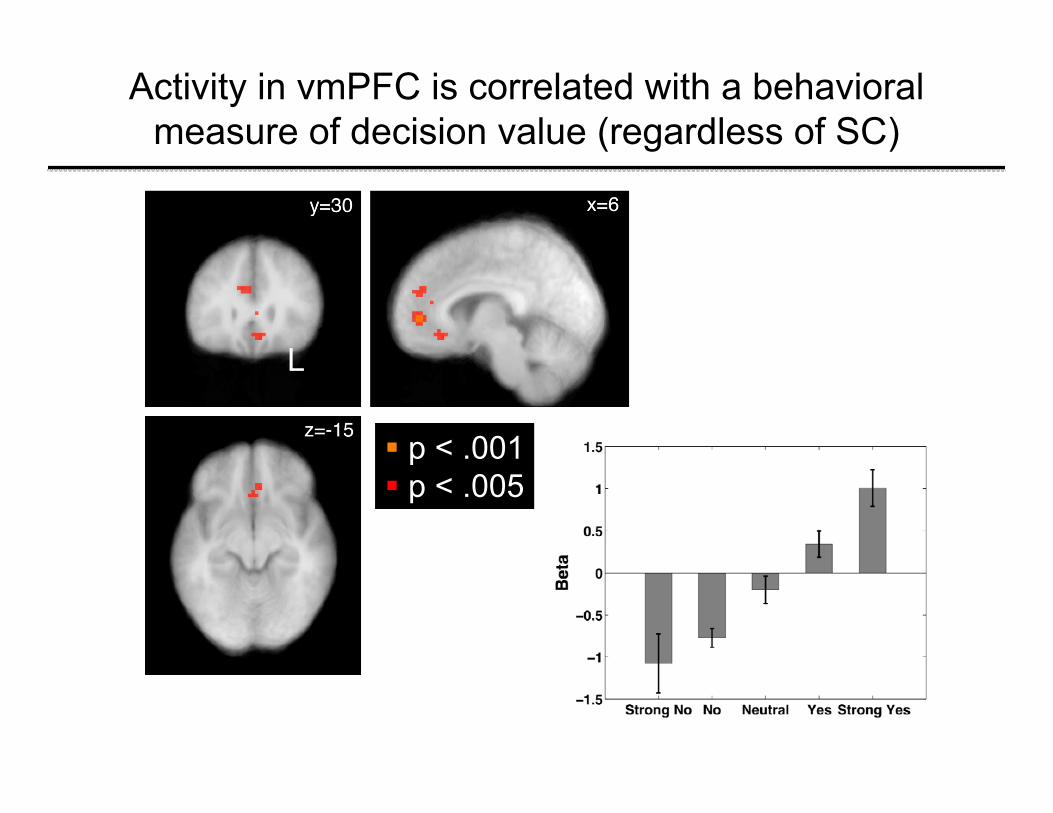
Activity in vmPFC is correlated with a behavioral measure of decision value (regardless of SC)
L
p < .001p < .005

*
*
*
Taste Rating Health Rating
Bet
a
vmPFC BOLD signal reflects both taste and health ratings

BOLD Health Rating Beta
Dec
isio
n H
ealth
Rat
ing
Bet
a
The effect of HR in the vmPFC is correlated with its effect on behavior
Robust regCoef = .847

Neuroimaging Results
Question: Does self-control involve DLPFC modulation of the vmPFC valuation network?

More activity in DLPFC in successful SC trials than in failed SC trials
L
p < .001p < .005

* *
SC group has greater DLPFC than NSCwhen implementing self-control
SC group NSC group

This result establishes that DLPFC activity increases during self-control.
Question: Is there more direct evidence that DLPFC modulates the vmPFC value networks
Neuroimaging results

Functional Connectivity
• Initial psychophysiological interaction (PPI) results revealed no task related connectivity between left DLPFC and vmPFC value computation region

Some evidence for connectivity

An indirect route?
Left DLPFC (IFG9)
Area X
vmPFC

Node 1: Functional Connectivity with adjacent area of left DLPFC (negative
correlation)
L
p < .001p < .005
Left DLPFC (IFG9)
Area X
vmPFC

Justification for selection

SC group NSC group
PP
I Bet
a
Group difference in PPI

Node 2: Functional connectivity with anterior left DLPFC
L
p < .001p < .005
Left DLPFC (IFG9)
Area X
vmPFC

Result: Conjunction of regions showing connectivity and correlation with values
L
p < .001p < .005
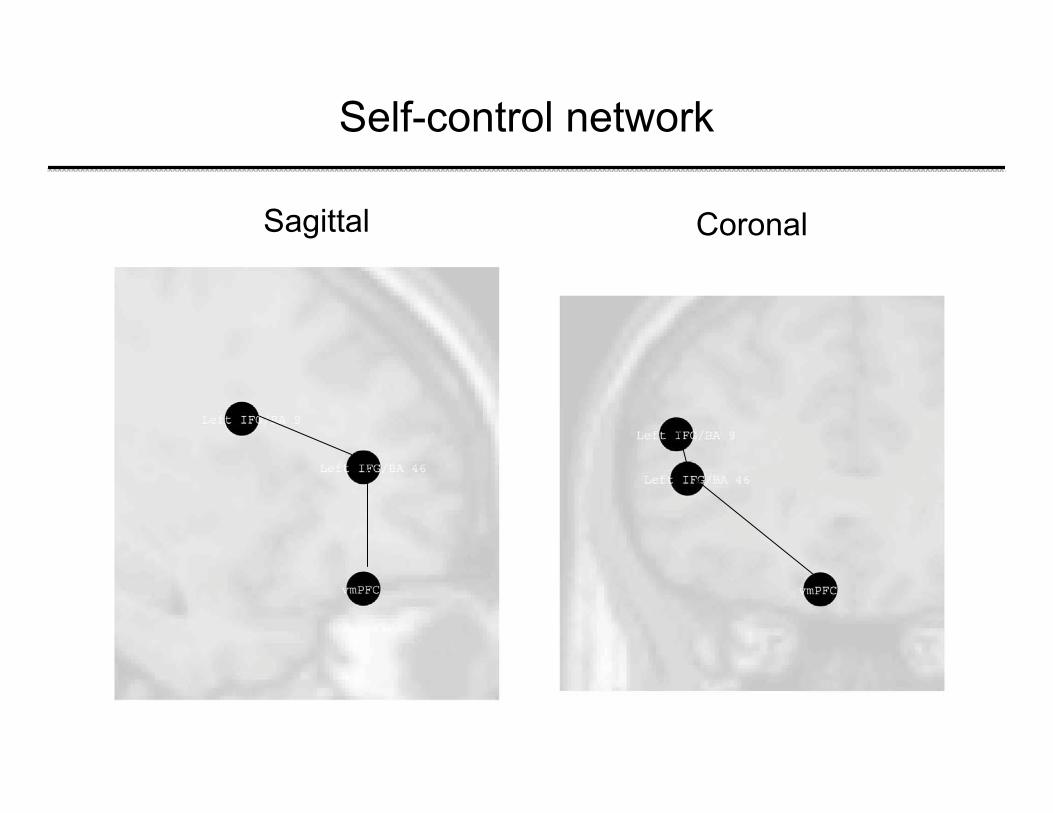
Self-control network
Sagittal Coronal

Dynamic Causal Modeling
• PPI shows that activity in two brain regions is correlated in task dependent manner.
• Does not provide information about causation or directionality
• Dynamic Causal Modeling (DCM) can provide evidence for directionality Friston et al (2003) NeuroImage; Marreiros et al (2008) NeuroImage

Regions modeled
IFG/BA9
vmPFC
IFG/BA46
IFG/BA9
vmPFC
IFG/BA46
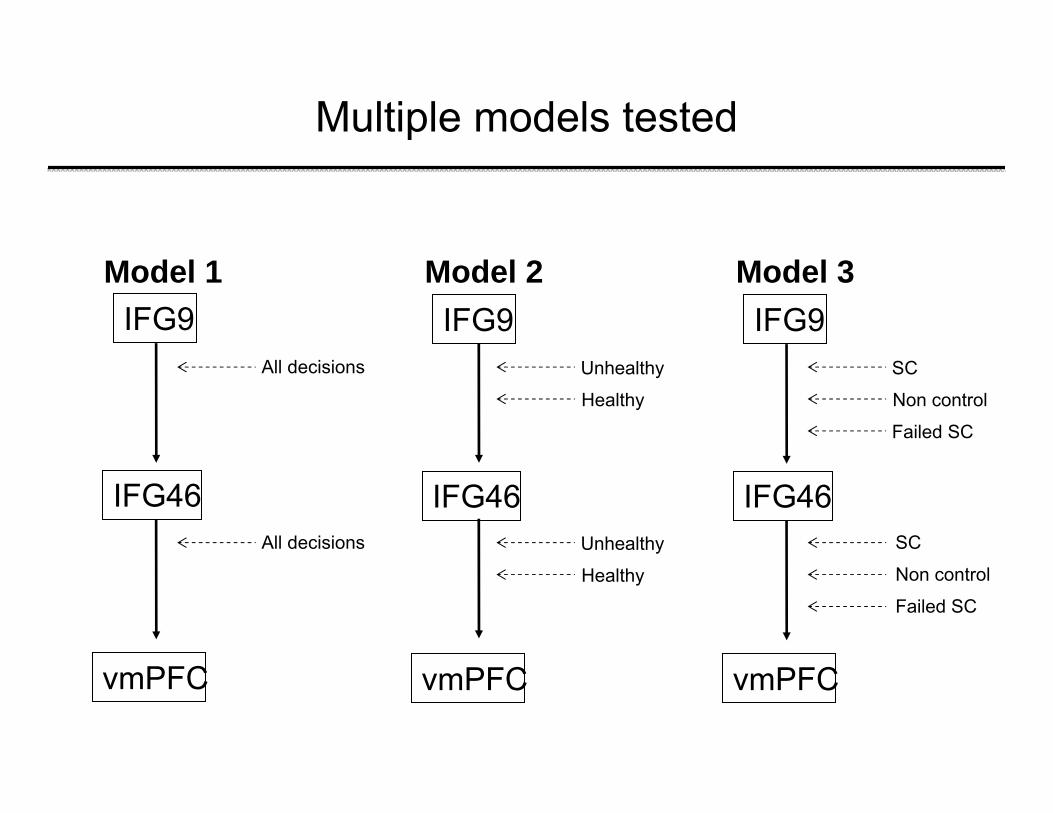
Multiple models tested
All decisions
IFG9
IFG46
vmPFC
All decisions
Unhealthy
Healthy
IFG9
IFG46
vmPFC
Unhealthy
Healthy
SC
Non control
Failed SC
IFG9
IFG46
vmPFC
Model 1 Model 2 Model 3
SC
Failed SC
Non control

Multiple models tested
All decisions
IFG9
IFG46
vmPFC
All decisions
Unhealthy
Healthy
IFG9
IFG46
vmPFC
Unhealthy
Healthy
SC
Non control
Failed SC
IFG9
IFG46
vmPFC
Model 1` Model 2` Model 3`
SC
Failed SC
Non control

Multiple models tested
All decisions
IFG9
IFG46
vmPFC
All decisions
Unhealthy
Healthy
IFG9
IFG46
vmPFC
Unhealthy
Healthy
SC
Non control
Failed SC
IFG9
IFG46
vmPFC
Model 1 Model 2 Model 3
SC
Failed SC
Non control
Group Bayes Factor5.8e+61
Group Bayes Factor6.5e+88
Group Bayes Factor8.8e+86

Best Model
All decisions0.210.99
IFG9
IFG46
vmPFC
All decisions0.090.92
Intrinsic0.500.99
Intrinsic0.100.99
Group Bayes Factor>9e+100 for both comparisons
Ratecoefficient
Bayesianposterior

Summary of DCM results
Additional evidence for the hypothesis that that self-control involves DLPFC modulation of value computations in the vmPFC

What is Self-Control for the brain?
I: Goal directed decisions are guided by a common valuation system II: Self-control involves DLPFC modulation of this valuation network

Evidence for Hypothesis I: Common value system
• Correlation between behavioral measures of value and neural activity in vmPFC across several studies
• vmPFC regions correlated with decision values reflect both taste and health ratings during self-control– Consistent with value computed based on two separate
factors in the same region
Evidence for Hypothesis II: DLPFC modulation of value computation
• DLPFC is more active in the self-control group than the non-self-control group
• PPI & DCM results showing that activity in DLPFC influences activity in vmPFC value computation regions through a two node network

Making sense of previous fMRI literature on the neural basis of intertemporal discounting
• There seems to be a single value system– consistent with findings of Kable & Glimcher
• This value signal is modulated by DLPFC when self-control is required– consistent with McClure and colleagues showing increased
DLPFC when choosing later larger reward

Bottom Line
• There seems to be a single system that computes a common value across multiple factors during goal directed decision-making.
• Self-control is exercised by DLPFC which modulates the input weights these factors have on the value signal computed in vmPFC networks.

Potential implications
• At their core, self-control deficits may be deficits of DLPFC function or connectivity between DLPFC and valuation areas
• This has implications for:- early detection of self-control deficits- co-morbidities between emotion regulation, cognitive control, and self-control failures

Kable and Glimcher (2007)
• Task: subjects make intertemporal monetary choices.
• Fit hyperbolic discount functions to subjects’behavior.
• Identifying assumption: behavioral preferences should match neural activation up to a linear transformation.
• Find brain regions that match the hyperbolic discount function estimated on behavioral data.
• This analysis identifies mPFC, PCC, VStr.• Are these integration regions? (Especially PCC?).

Kable and Glimcher (2007)
Why don’t Kable and Glimcher also identify PFC and Parietal Cortex?
1. These ROIs are not involved in the decision?2. These ROIs are involved in the decision but they
don’t show sensitivity to time delay for this money task? (cf McClure et al 2004)
3. These ROIs are involved in the decision and they doshow sensitivity to time delay but that sensitivity is a small part of total variance (at the subject level), so these regions are not accepted by the filter?

Hariri et al (2007)
• Measure individual differences in VStr responsivity using a task involving positive and negative feedback with monetary reward.
• Measure individual differences in impatience using choices among time-dated rewards.
• VStr responsivity correlates with impatience.• “Increased preference for smaller immediate over
larger delayed rewards reflects both a relatively indiscriminate and hyper-reactive VStr circuitry.”

Future work:1. Are multiple system models a useful way of generating
new hypotheses and models?2. Are these systems localized? If so, where?3. How do the systems communicate?4. How are the inputs integrated?5. When are the systems cooperative and when conflictual?6. When they are in conflict, are they strategic?7. What manipulations enhance or weaken the signals
coming from these systems?8. Can we influence individual systems in the lab? 9. Can we influence individual systems in the field?10.Can we produce useful formalizations of their operation?

The Sweet Taste of Revengede Quervain et alScience (2004)
• Two subjects, A and B, have the opportunity for a social exchange that benefits both parties.
• However, to complete the exchange, A has to move first while B moves second, i.e., A has to trust B, and B can cheat A.
• A is informed about B‘s action and A has an opportunity to punish B.
• A‘s brain is scanned when he is informed about B‘s action (i.e, whether B cheated him or not) and when A deliberates whether, and how much, he wants to punish B.

• Stage 1:– Both A and B receive an endowment of 10 MUs (1 MU =
CHF 0.1).– A decides whether to keep or to transfer his endowment to
B. In case of a transfer B receives 4 times A‘s endowment (40 MUs), in addition to his own endowment of 10 MUs.
• Stage 2: – B has the option to keep all the points he possesses or to
give half of his MUs to A• If A trusts and B is trustworthy both earn 25.• If A trusts and B cheats, A has nothing and B has 50. • Both have 10 if A does not trust and B keeps everything.
• Stage 3: – Both players receive an additional endowment of 20 Mus– A has the opportunity to use this money to punish B or to
keep the money. – Every MU invested into the punishment of B decreases B‘s
payoff by 2 MUs.
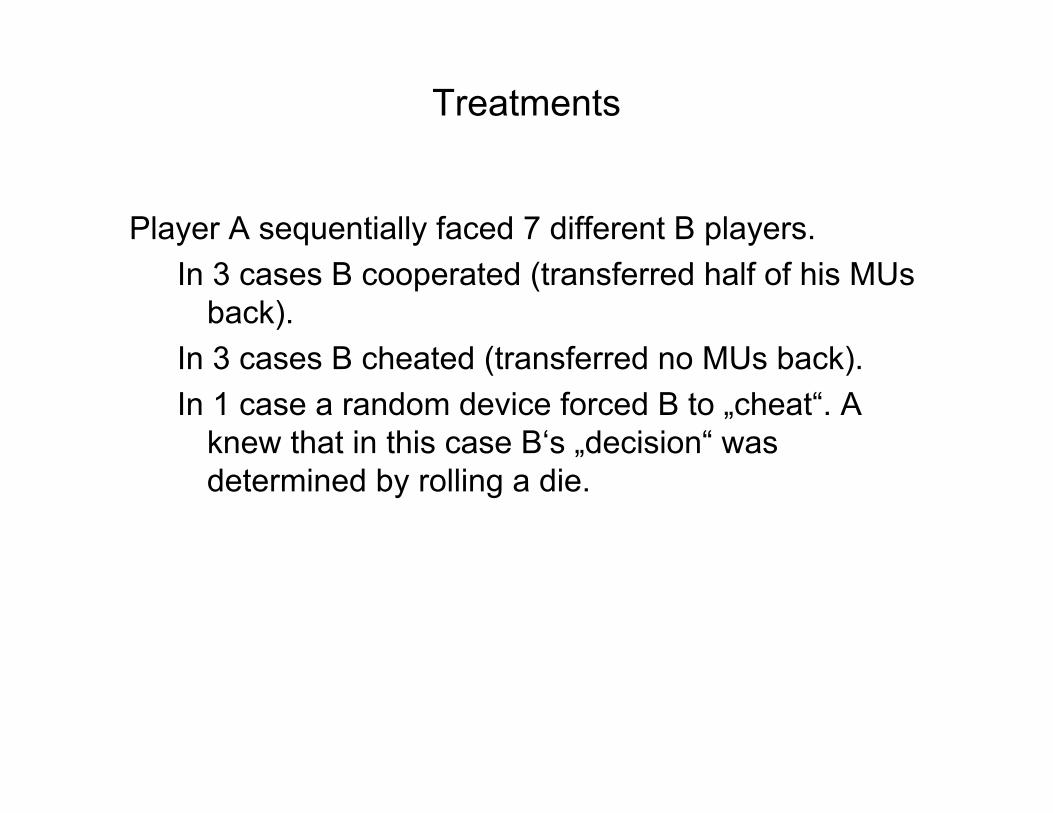
Treatments
Player A sequentially faced 7 different B players. In 3 cases B cooperated (transferred half of his MUs
back).In 3 cases B cheated (transferred no MUs back).In 1 case a random device forced B to „cheat“. A
knew that in this case B‘s „decision“ was determined by rolling a die.

More treatments (when B cheats)
• Treatment where B decides himself and punishment is costly for both A and B (Intentional & Costly, IC). A is hypothesized to experience a desire to punish cheating and he can in fact punish.
• Treatment where B decides himself and punishment is free for A but costly for B (Intentional & Free, IF). A is hypothesized to experience a desire to punish cheating and he can in fact punish– even without a cost.
• Treatment where B decides himself and punishment is only symbolic, i.e., A and B have no costs of punishing (Intentional & Symbolic; IS). A is also hypothesized to experience a desire to punish cheating but he cannot punish.
• Treatment where B‘s decision is randomly imposed on B; punishment is costly for both A and B (Non-intentional & Costly, NC). A is to have no or a much less of a desire to punish B for „non-cooperation“ because B is not responsible for his „action“.

Hypotheses:
• The following contrasts are hypothesized to show activation of reward related (N Accumbens, N caudate) neural circuits:– (IC – IS) because no punishment possible in IS.– (IF – IS) because no punishment possible in IS.– (IC – NC) because no desire to punish in NC.– (IF – NC) because no desire to punish in NC.– (IC + IF) – (IS + NC) because in IS & NC there is either no
possibility or no desire to punish so that there cannot be any satisfaction from punishing.
• The following contrast is hypothesized to show activation of cognition related (PFC, OFC) neural circuits.– (IC – IF) because in IC subjects must weigh the costs and
benefits of punishing while in IF there are no costs. – Related to the Sanfey et al. (2003) hypothesis.

0
5
10
15
20
25
30
35
40
Actual payoff reduction imposed on B
-3
-2
-1
0
1
2
3
Desire to punish
-3
-2
-1
0
1
2
3
Perceived unfairness
intentional & costly ICintentional & free IFintentional & symbolic ISnon-intentional & costly NC
Behavioral and Questionnaire Results

(IC + IF) - (IS + NC)activates the nucleus caudate
0
Z va
lue
1
7
6
5
4
3
2
L R
0
Z va
lue
1
7
6
5
4
3
2
L R

0
Z va
lue
1
7
6
5
4
3
2
L R
0
Z va
lue
1
7
6
5
4
3
2
L R
Differential activation of Nucleus Caudate relative to mean brain activation
(IC + IF) - (IS + NC)
-2
-1.5
-1
-0.5
0
0.5
1
1.5
2
-2
-1.5
-1
-0.5
0
0.5
1
1.5
2S
ize
of e
ffect
at [
6, 2
2, 4
]
intentional & costly IC
intentional & free IF intentional & symbolic IS non-intentional & costly NC

Differential activations across contrastsT ab le 1 . P ET resu lts
C ontras t R egion (BA) C oord inates Z va lue
x y z (IC +IF )-(IS+N C ) C audate nuc leus 6 22 4 5 .11*
T ha lam us 22 -24 10 4 .43*
IF -IS T halam us 22 -22 10 4 .21
C audate nuc leus 6 22 4 3 .55
IC -IS T halam us 22 -22 10 4 .15
C audate nuc leus 6 24 2 3 .70
IF -N C C audate nuc leus 6 22 4 4 .18
IC -N C C audate nuc leus 6 22 4 4 .23
IC -IF Ventrom edia l p re fronta l / 2 54 -4 4 .59
m edia l orb ito fronta l cortex -4 52 -16 3 .35
T he coord ina tes (x , y, z) locate the m ax im a of changes in b lood flow . * ind icate s ign ificant ac tiva tions a t a leve l < 0 .05 correc ted, o therw ise p<0.001 uncorrec ted. B A , B rodm ann area. I, in tentional no-transfer; N , non-in tentiona l no-transfer; C , costly pun ishm ent; F , free pun ishm ent; S , sym bo lic pun ishm ent.

If caudate activity reflects satisfaction from punishment subjects with stronger caudate
activation should punish more0.08
0.06
0.04
0.02
0
-0.02
-0.04
-0.06
0.08
0.06
0.04
0.02
0
-0.02
-0.04
-0.06
Res
pons
e at
[10,
26,
-2] i
n IC
0 2 4 6 8 10 12 14 16 18 200 2 4 6 8 10 12 14 16 18 20
Amount invested for punishing in IC
p < 0.001p < 0.001
Question: Does caudate activation causeQuestion: Does caudate activation causepunishment or does punishment cause punishment or does punishment cause caudate activation?caudate activation?
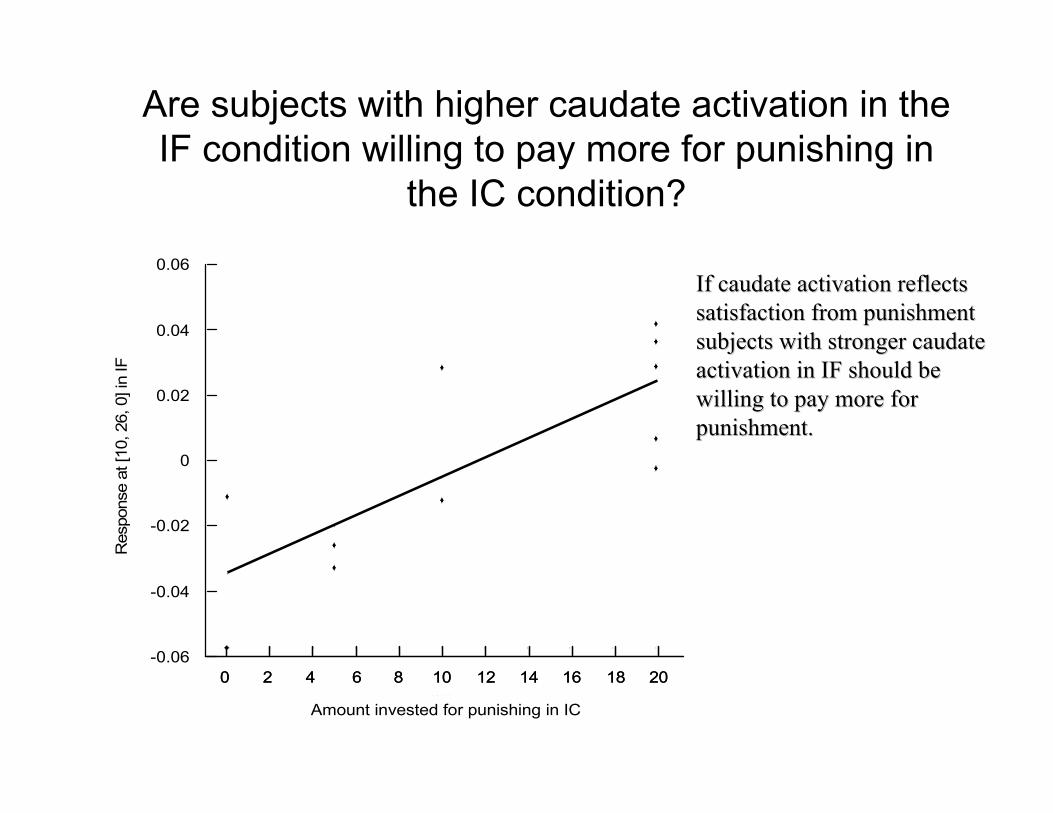
Are subjects with higher caudate activation in the IF condition willing to pay more for punishing in
the IC condition?
Amount invested for punishing in IC
0.06
0.04
0.02
0
-0.02
-0.04
-0.06
Res
pons
e at
[10,
26,
0] i
n IF
0 2 4 6 8 10 12 14 16 18 200 2 4 6 8 10 12 14 16 18 20
If caudate activation reflectsIf caudate activation reflectssatisfaction from punishmentsatisfaction from punishmentsubjects with stronger caudatesubjects with stronger caudateactivation in IF should be activation in IF should be willing to pay more for willing to pay more for punishment. punishment.
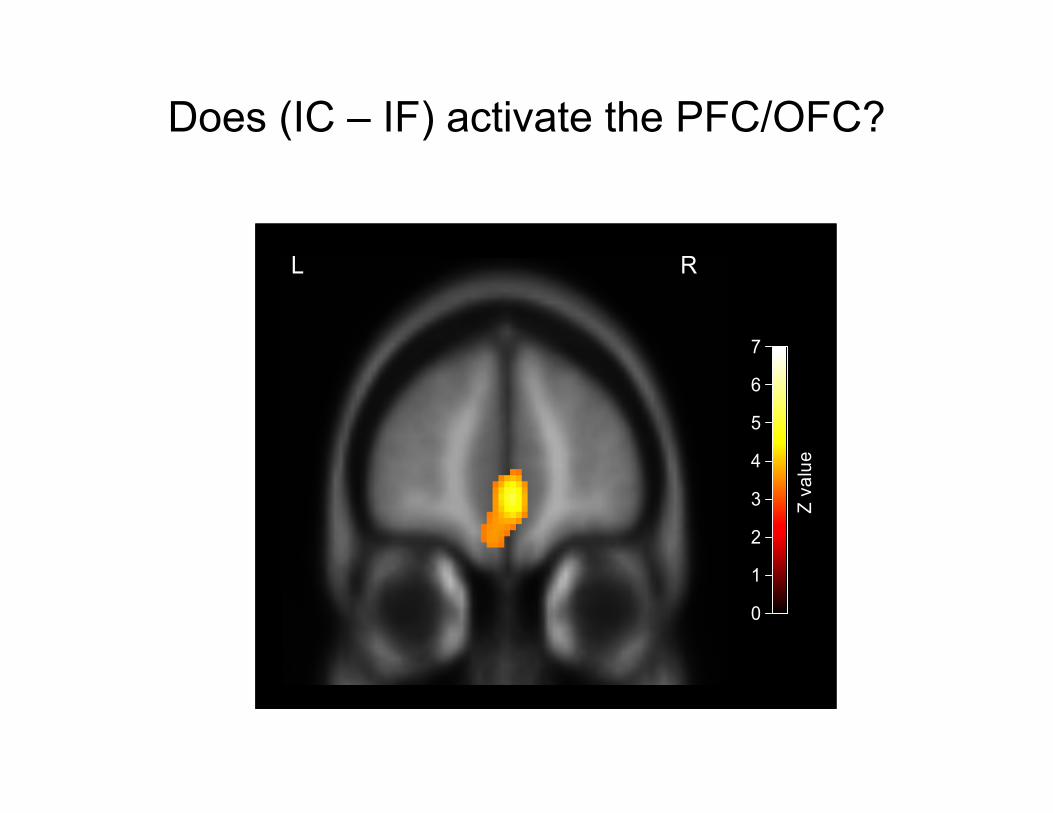
Does (IC – IF) activate the PFC/OFC?
0
Z va
lue
1
7
6
5
4
3
2
L R
0
Z va
lue
1
7
6
5
4
3
2
L R
Summary of revenge study
• Experimental evidence and social preference theories suggest that many people prefer to punish unfair acts.
• This study supports the view that satisfaction is associated with the punishment of unfair acts.
• Correlation between caudate activity and punishment in IC, and between caudate activity in IF and punishment in IC supports this interpretation.