neurofilaments and tau proteins in cerebrospinal fluid and...
TRANSCRIPT

Biomed Pap Med Fac Univ Palacky Olomouc Czech Repub. 2017 Sep; 161(3):286-295.
286
Neurofilaments and tau proteins in cerebrospinal fluid and serum in dementias and neuroinflammation
Lenka Fialovaa*, Ales Bartosb,c*, Jana Svarcovad
Aims. The aim of this study was to evaluate the diagnostic potential of cerebrospinal fluid (CSF) and serum levels of neurocytoskeletal proteins and their ratios for the diagnosis of dementias and to assess the differences in neurocyto-skeletal proteins between neurodegeneration and neuroinflammation. Methods. CSF and serum levels of neurofilament light subunits (NFL) and neurofilament heavy subunits (NFH) as well as CSF levels of total tau (t-tau) and phosphorylated tau (p-tau) proteins were determined using ELISA in 20 Alzheimer’s disease patients (AD group), 13 patients with other dementias (OD group), 17 patients with inflammatory aseptic neuro-infections (IP), and 20 aged-matched cognitively normal elderly persons (NC group). Results. The ratio CSF p-tau/t-tau was significantly higher in the NC group than that in the AD or OD groups (P<0.0005 for each group). The CSF NFH/p-tau and CSF NFL/p-tau ratios were significantly lower in AD patients than OD patients (P≤0.003). Serum and CSF NFL and CSF NFH levels were significantly higher in OD patients than AD patients (P≤0.03). The lowest values of the CSF NFL/NFH ratio were found in the IP group and they significantly differed from those in normal controls (P<0.0001) and any dementia group (IP vs. AD P<0.0001; IP vs. OD P=0.03). Conclusion. CSF tau proteins and their index differentiated between AD or OD patients and cognitively normal sub-jects, while CSF levels of neurofilaments expressed as their index seem to contribute to the discrimination between patients with neuroinflammation and normal controls or AD patients.
Key words: Alzheimer’s disease, dementias, cytoskeletal proteins, neurofilaments, neuroinflammation, tau protein, cerebrospinal fluid, serum
Received: June 26, 2017; Accepted with revision: September 4, 2017; Available online: September 25, 2017https://doi.org/10.5507/bp.2017.038
aInstitute of Medical Biochemistry and Laboratory Diagnostics, First Faculty of Medicine, Charles University and General University Hospital in Prague, Katerinska 32, 121 08 Prague, Czech RepublicbNational Institute of Mental Health, Topolova 748, 250 67 Klecany, Czech RepubliccDepartment of Neurology, Third Faculty of Medicine, Charles University and University Hospital Kralovske Vinohrady, Srobarova 50, 100 34 Prague, Czech RepublicdDepartment of Medical Chemistry and Clinical Biochemistry, Motol University Hospital, Prague, Czech RepublicCorresponding author: Lenka Fialova, e-mail: [email protected]*These authors contributed equally to this paper
INTRODUCTION
Alzheimer’s disease (AD) is characterized by spe cific neuropathological features involving the formation of beta-amyloid plaques and the presence of neurofibrillary tangles (NFT) in the brain1,2. Extracellularly located beta-amyloid plaques contain mainly insoluble peptide beta-amyloid (Abeta), while neurofibrillary tangles located intraneuronally are composed predominantly of cytoskel-etal protein hyperphosphorylated tau2,3. The presence of beta-amyloid plaques and NFT are reflected in the altered levels of beta-amyloid, phosphorylated tau protein (p-tau) and total tau protein (t-tau) in CSF (further referred to as a CSF triplet), and less specific processes like axonal dam-age by altered neurofilament (NF) levels4-6. Determination of these proteins facilitates differentiation of patients with AD from cognitively normal elderly individuals and other dementias7-9.
In addition to the CSF triplet (t-tau, p-tau, Abeta proteins), NFL in CSF is also considered as a marker of neurocytoskeleton impairment in AD. Generally,
neurofilament light subunits (NFL) are considered to be a biomarker of large-caliber myelinated axon injury10. Moreover, detailed analysis showed that NFT contain not only p-tau but also other phosphorylated proteins includ-ing neurofilaments 11. A comparison between nine cohorts with AD patients and eight control cohorts revealed 2.35 times average NFL elevation in AD (ref.9). Correlation of CSF NFL with accelerated cognitive decline, changes in white matter and increased brain atrophy is found in pa-tients with mild cognitive impairment12. Recently, elevated NFL levels were also described in the serum/plasma of AD patients13-15. NFH elevation in CSF seems to be less prominent in AD. Significantly higher CSF NFH levels as well as non-significant elevation of CSF NFH in AD pa-tients have been described16-18. However, higher NF levels in CSF have been found in other dementias, and hence determination of NFL and NFH may be valuable in the differentiation of dementias5,19,20.
In our study we focused on neurocytoskeletal proteins as biomarkers. Measurements of well-established CSF to-tal and phosphorylated tau proteins were extended with
Biomed Pap Med Fac Univ Palacky Olomouc Czech Repub. 2017 Sep; 161(3):286-295.
287
a promising biomarker of NF (ref.9). Our complex evalu-ation included light and heavy subunits of NF not only in CSF, but we also tried to determine serum concentra-tions. Only a limited number of papers have reported on NF levels in the serum of dementia patients. The rela-tionship between individual proteins expressed as ratios might also contribute to differential diagnosis of demen-tias20,21. We assumed simultaneous elevation of selected cytoskeletal proteins released from damaged neurons or involved in NFT and other pathology in neurodegenera-tive dementias. Patients with AD and other dementias were compared not only with age-matched cognitively normal elderly controls but also with patients affected by neuro-infections. Neuroinflammation may result in different consequences compared to neurodegeneration in terms of concentrations or ratios of neuron-specific cytoskeletal proteins.
MATERIALS AND METHODS
ParticipantsWe enrolled 70 individuals at the Department of
Neurology or Memory Clinic of the University Hospital, Charles University, Prague. Participants were divided into four groups: (1) patients with AD (AD group; n=20); (2) patients with other dementias (OD group; n=13); (3) patients with inflammatory aseptic neuro-infections (IP group; n=17); and (4) cognitively normal elderly per-sons (NC group; n=20) (Table 1).
The cognitive function of participants was evaluated using an updated Czech version of the Addenbrooke’s Cognitive Examination-Revised (ACE-R-CZ). The test ACE-R-CZ is a 20-30 min more detailed examina-tion of cognitive functions than the Mini-Mental State Examination (MMSE) (ref.22-28). MMSE scores were de-rived from the ACE-R-CZ. Brain magnetic resonance im-aging (MRI) or computer tomography imaging (when not suitable for MRI) were performed in all dementia patients and in the majority of participants. Intracranial pathology was excluded and hippocampal size was assessed using mediotemporal atrophy scores29,30.
The AD patients met a probable diagnosis of AD according to the NIA-AA (National Institute on Aging-Alzheimer’s Association) criteria by an experienced neurologist31. The patients with other dementias were carefully selected for this study. Most of them had au-topsy confirmation. Four patients had frontotemporal lo-bar degeneration (FTLD) (three were autopsy-confirmed, one had amyotrophic lateral sclerosis as well). All other patients had autopsy-confirmed diagnoses - three with Creutzfeldt-Jacob diseases, one with corticobasal degen-eration and one with Wernicke encephalopathy. The IP group consisted of patients with aseptic neuro-infections, mainly neuroborreliosis or herpetic infections. Normal elderly controls were age-matched with other groups. They were diagnosed as non-inflammatory conditions, mostly with polyneuropathy (n=10); the rest included a variety of diseases (e.g. headache, Bell’s palsy). They had normal MMSE and ACE-R-CZ scores and a normal CSF triplet (t-tau, p-tau, Abeta proteins) based on cut-offs established in our and other previous studies24,28,32,33. These patients underwent a lumbar puncture as part of a routine diag-nostic work-up.
Lumbar CSF and paired blood samples were collected, centrifuged, aliquoted in 1 mL polypropylene tubes and stored on average within 1.5 h of sampling at −80 °C in accordance with established guidelines until analysis34. The specimens were thawed just prior to the measure-ments.
Participants signed an informed consent. The research was approved by the Ethics Committee of the University Hospital Kralovske Vinohrady.
Determination of neurocytoskeletal proteins and albuminAll of the neurocytoskeletal proteins and Abeta pep-
tides were measured by commercially available ELISA kits. The ELISAs were performed according to the manu-facturer’s instructions.
We used NF-Light® Neurofilament ELISA RUO (re-seach use only) kits (UmanDiagnostics, Umeå, Sweden) and Phosphorylated Neurofilament H ELISA kits (pNFH) (BioVendor, Czech Republic) for the determi-nation of light and heavy subunits of neurofilaments in
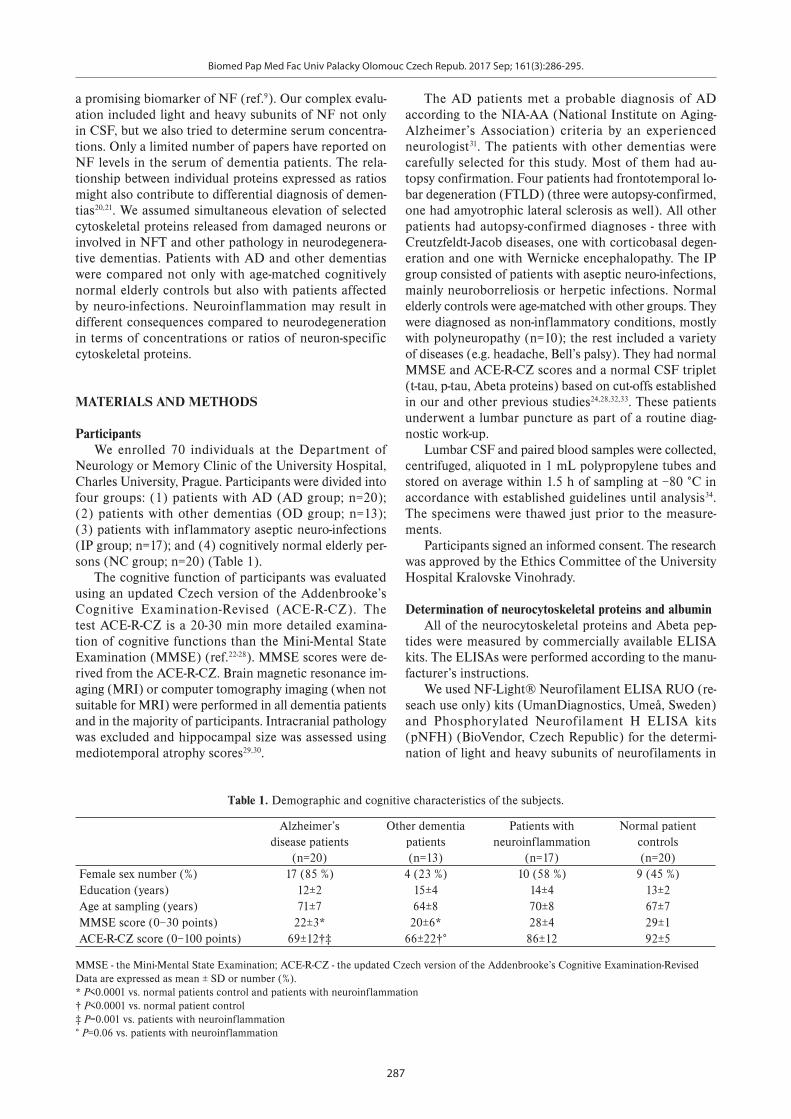
Table 1. Demographic and cognitive characteristics of the subjects.
Alzheimer’s disease patients
(n=20)
Other dementia patients(n=13)
Patients with neuroinflammation
(n=17)
Normal patient controls(n=20)
Female sex number (%) 17 (85 %) 4 (23 %) 10 (58 %) 9 (45 %)Education (years) 12±2 15±4 14±4 13±2Age at sampling (years) 71±7 64±8 70±8 67±7MMSE score (0−30 points) 22±3* 20±6* 28±4 29±1ACE-R-CZ score (0−100 points) 69±12†‡ 66±22†° 86±12 92±5
MMSE - the Mini-Mental State Examination; ACE-R-CZ - the updated Czech version of the Addenbrooke’s Cognitive Examination-Revised Data are expressed as mean ± SD or number (%).* P<0.0001 vs. normal patients control and patients with neuroinflammation† P<0.0001 vs. normal patient control ‡ P=0.001 vs. patients with neuroinflammation° P=0.06 vs. patients with neuroinflammation

Biomed Pap Med Fac Univ Palacky Olomouc Czech Repub. 2017 Sep; 161(3):286-295.
288
CSF and serum. The detection limit was 31 ng/L for the NFL (NF-Light® Neurofilament ELISA kit) and 23.5 pg/mL for NFH (Human Phosphorylated Neurofilament H ELISA kit). For samples below the detection limit, the val-ues equal to limit of detection were used for the purpose of statistical analysis.
Concentrations of total tau protein, phosphorylated tau 181 and beta-amyloid 42 peptide were assayed using ELISA kits (INNOTEST® hTAU Ag, INNOTEST® PHOSPHO-TAU(181P), INNOTEST® β-AMYLOID(1-42)) from Innogenetics (now Fujirebio Europe, Ghent, Belgium). The detection limits declared by manufactures were 34 pg/mL for total tau protein, 13 pg/mL for phos-phorylated tau 181 and 65 pg/mL for beta-amyloid 42 peptide. The analytical sensitivity of the used kits did not enable to measure concentrations of t-tau and p-tau pro-teins in serum.
Albumin was measured using immunonephelometry (IMMAGE, Beckman Coulter, Inc., Fullerton, CA).
Calculations of ratios Albumin quotient (Qalbumin) A quotient between CSF and serum (CSF/serum) albu-min concentrations *10-3 was used for evaluation of the blood-CSF barrier function.
Indices for neurocytoskeletal proteinsWe investigated ratios between: 1) neurofilaments or tau proteins (CSF NFL/NFH, CSF p-tau/t-tau) and different neurofilaments with tau proteins (CSF NFL/t-tau, CSF NFL/p-tau, CSF NFH/t-tau, CSF NFH/p-tau) and 2) a neurocytoskeletal protein in CSF and the corresponding protein in serum (CSF/serum NFL, CSF/serum NFH).
Statistical analysesSince levels of the majority of evaluated variables
were not normally distributed, differences among the four groups were analyzed using the Kruskal-Wallis test. When a significant difference among groups was shown, we performed pairwise comparison by the Mann-Whitney U tests20,35. These statistical analyses were performed us-ing Statistica software, version 12.0 (StatSoft CR s.r.o. Prague, CR).
The diagnostic potential of the cytoskeletal proteins and calculated ratios were evaluated by calculating the areas under the curve (AUC) of the receiver operating characteristic (ROC) and by determination of the sen-sitivities and specificities using optimal cut-offs accord-ing to Youden index. These statistical calculations were performed by MedCalc statistical software (Ostend, Belgium).
The significance level for all tests was P<0.05.
RESULTS
Demographic and cognitive characteristics of the participants are summarized in Table 1. Age did not dif-fer among groups. Females prevailed in the AD group which corresponds with epidemiological findings. The
MMSE score and ACE-R-CZ score were lower in AD and other dementias than in normal controls (P≤0.0001 for each comparison) and inflammatory patients (MMSE: P<0.0001 for each comparison, ACE-R-CZ: AD vs. IP P=0.001; OD vs. IP P=0.06).
Qalbumin was significantly higher in IP patients than in normal controls or the AD group (P<0.005 for each comparison).
Neurocytoskeletal protein levels in CSF and serumThe levels of NFL in CSF differ among the groups
(Fig. 1A). A significant increase of CSF NFL levels was found in the OD group in comparison with the normal controls (P=0 .02). A comparison between dementia groups also showed higher levels in the OD group than in AD patients (P=0.03). NFL levels in the serum were be-low the detection limit of the ELISA assay in 15 persons from all participants. Despite this fact, serum NFL levels were significantly elevated in OD patients compared with the AD group (P=0.005) (Fig. 1B).
The changes in CSF NFH levels were similar to those observed in CSF NFL. The levels in the OD group were significantly elevated in comparison with normal controls and the AD group (P=0.02 for either group) (Fig. 1C). Moreover, CSF NFH levels were also higher in IP pa-tients than in AD patients (P=0.02) and normal controls (P=0.03). NFH levels in the serum did not significantly differ among groups (Fig. 1D). Nineteen values of serum NFH levels from all participants were lower than the de-tection limit of the ELISA kit.
The highest levels of t-tau in CSF were demonstrated in the AD group. A significant difference was observed between the AD group and the control group (P=0.0002) or inflammatory patients (P=0.0005) (Fig. 1E). In addi-tion, the CSF t-tau was significantly elevated in the OD group in comparison with the control group (OD vs. NC P=0.004) or inflammatory patients (OD vs. IP P=0.008).
Like t-tau, the highest CSF p-tau levels were also shown in AD patients (Fig. 1F). The increase of CSF p-tau in the AD group was significant when compared to levels in other groups (AD group vs. OD group P=0.008; AD group vs. NC group P=0.003; AD group vs. IP group P=0.006). The CSF p-tau levels were similar in non-AD groups.
In the OD group, a female patient (71 years old) who had frontotemporal lobar degeneration in combination with amyotrophic lateral sclerosis was included. She had mildly impaired cognitive functions (MMSE score 25 points, ACE-R-CZ score 79 points). Despite the combi-nation of two neurodegenerative processes, an extreme increase in neurocytoskeletal proteins was not observed in this patient. NFL and NFH levels in both serum and cerebrospinal fluid were within the range from the 25th to the 75th percentiles observed for the OD group (CSF NFL 6128 pg/mL, serum NFL 958 pg/mL, CSF NFH 1030 pg/mL serum NFH 37.4 pg/mL). The CSF t-tau (187 pg/mL) and p-tau (17 pg/mL) levels were lower, below 25th percentile. Decreased tau levels influenced the calculated ratios of different neurofilaments with tau proteins, which were higher than the 75th percentile of the OD group.

Biomed Pap Med Fac Univ Palacky Olomouc Czech Repub. 2017 Sep; 161(3):286-295.
289
Fig. 1. Comparisons of levels among patients’ groups (A) in neurofilament light subunits in cerebrospinal f luid; (B) in neurofilament light subunits in serum; (C) in neurofilament heavy subunits in cerebrospinal f luid; (D) in neurofila-ment heavy subunits in serum; (E) in total tau in cerebrospinal f luid; (F) in phosphorylated tau in cerebrospinal f luid. The box plots include the median (horizontal line ─), values from the 25th to the 75th percentiles (boxes); bars (whiskers) above and below the box indicate the range of non-outliers. Non-outliers are indicated by triangles. Outliers and extremes are shown by circles and asterisks (the outlier values are outside the 1.5 box length from the upper and lower value of the box; the extreme values are outside the 3 box length from the upper and lower value of the box).CSF - cerebrospinal fluid; NFH - neurofilament heavy subunits; NFL – neurofilament light subunits; p-tau - phosphorylated tau; t-tau - total tau.
Biomed Pap Med Fac Univ Palacky Olomouc Czech Repub. 2017 Sep; 161(3):286-295.
290
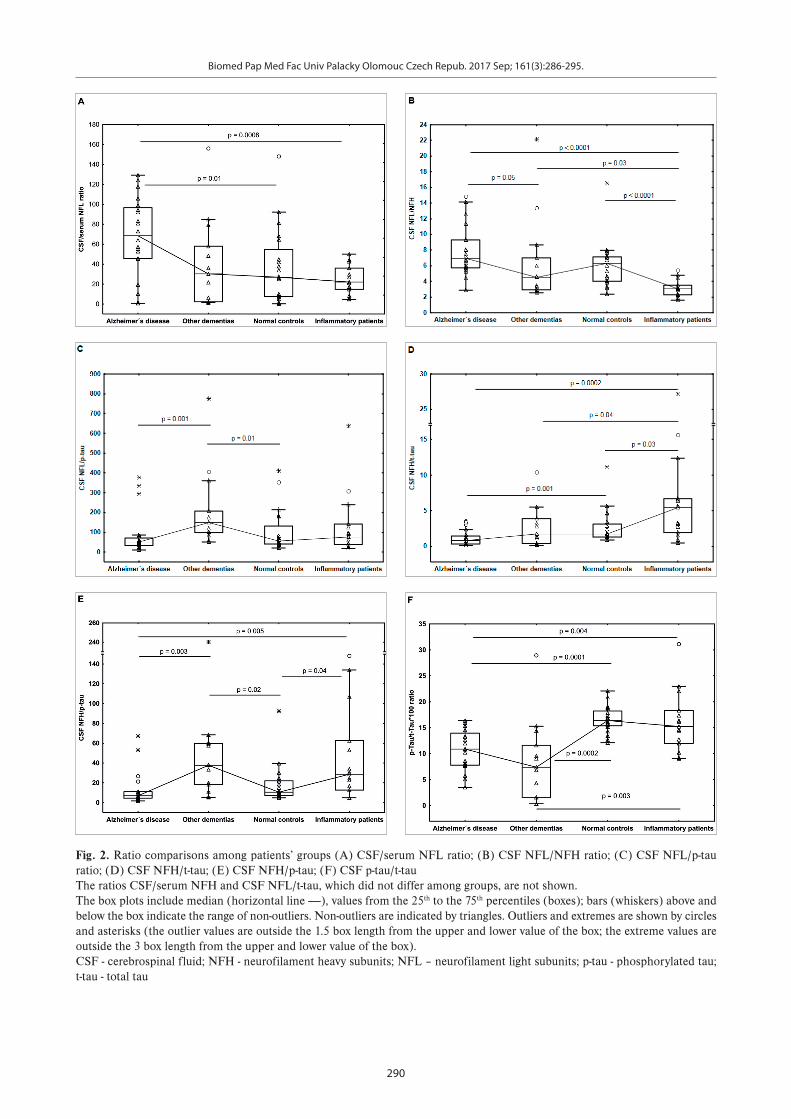
Fig. 2. Ratio comparisons among patients’ groups (A) CSF/serum NFL ratio; (B) CSF NFL/NFH ratio; (C) CSF NFL/p-tau ratio; (D) CSF NFH/t-tau; (E) CSF NFH/p-tau; (F) CSF p-tau/t-tau The ratios CSF/serum NFH and CSF NFL/t-tau, which did not differ among groups, are not shown.The box plots include median (horizontal line ─), values from the 25th to the 75th percentiles (boxes); bars (whiskers) above and below the box indicate the range of non-outliers. Non-outliers are indicated by triangles. Outliers and extremes are shown by circles and asterisks (the outlier values are outside the 1.5 box length from the upper and lower value of the box; the extreme values are outside the 3 box length from the upper and lower value of the box).CSF - cerebrospinal fluid; NFH - neurofilament heavy subunits; NFL – neurofilament light subunits; p-tau - phosphorylated tau; t-tau - total tau
Biomed Pap Med Fac Univ Palacky Olomouc Czech Repub. 2017 Sep; 161(3):286-295.
291
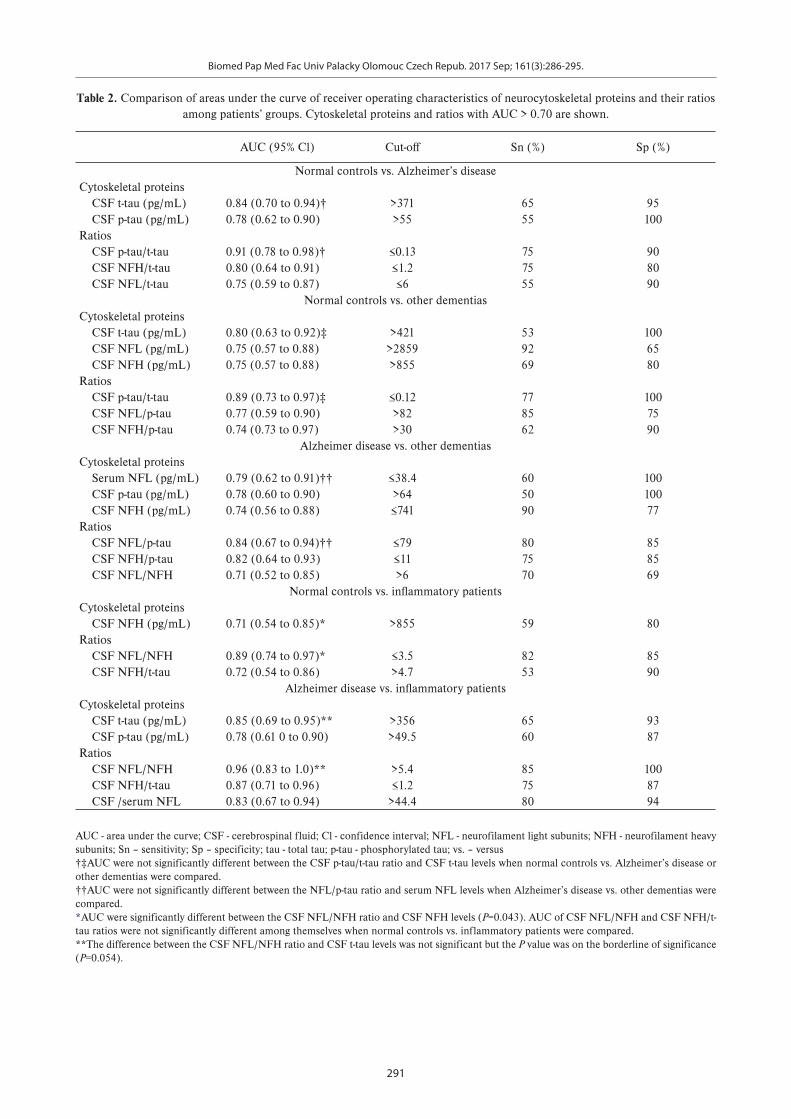
Table 2. Comparison of areas under the curve of receiver operating characteristics of neurocytoskeletal proteins and their ratios among patients’ groups. Cytoskeletal proteins and ratios with AUC > 0.70 are shown.
AUC (95% Cl) Cut-off Sn (%) Sp (%)
Normal controls vs. Alzheimer’s diseaseCytoskeletal proteins CSF t-tau (pg/mL) 0.84 (0.70 to 0.94)† >371 65 95 CSF p-tau (pg/mL) 0.78 (0.62 to 0.90) >55 55 100Ratios CSF p-tau/t-tau 0.91 (0.78 to 0.98)† ≤0.13 75 90 CSF NFH/t-tau 0.80 (0.64 to 0.91) ≤1.2 75 80 CSF NFL/t-tau 0.75 (0.59 to 0.87) ≤6 55 90
Normal controls vs. other dementiasCytoskeletal proteins CSF t-tau (pg/mL) 0.80 (0.63 to 0.92)‡ >421 53 100 CSF NFL (pg/mL) 0.75 (0.57 to 0.88) >2859 92 65 CSF NFH (pg/mL) 0.75 (0.57 to 0.88) >855 69 80Ratios CSF p-tau/t-tau 0.89 (0.73 to 0.97)‡ ≤0.12 77 100 CSF NFL/p-tau 0.77 (0.59 to 0.90) >82 85 75 CSF NFH/p-tau 0.74 (0.73 to 0.97) >30 62 90
Alzheimer disease vs. other dementiasCytoskeletal proteins Serum NFL (pg/mL) 0.79 (0.62 to 0.91)†† ≤38.4 60 100 CSF p-tau (pg/mL) 0.78 (0.60 to 0.90) >64 50 100 CSF NFH (pg/mL) 0.74 (0.56 to 0.88) ≤741 90 77Ratios CSF NFL/p-tau 0.84 (0.67 to 0.94)†† ≤79 80 85 CSF NFH/p-tau 0.82 (0.64 to 0.93) ≤11 75 85 CSF NFL/NFH 0.71 (0.52 to 0.85) >6 70 69
Normal controls vs. infl ammatory patientsCytoskeletal proteins CSF NFH (pg/mL) 0.71 (0.54 to 0.85)* >855 59 80Ratios CSF NFL/NFH 0.89 (0.74 to 0.97)* ≤3.5 82 85 CSF NFH/t-tau 0.72 (0.54 to 0.86) >4.7 53 90
Alzheimer disease vs. infl ammatory patients Cytoskeletal proteins CSF t-tau (pg/mL) 0.85 (0.69 to 0.95)** >356 65 93 CSF p-tau (pg/mL) 0.78 (0.61 0 to 0.90) >49.5 60 87Ratios CSF NFL/NFH 0.96 (0.83 to 1.0)** >5.4 85 100 CSF NFH/t-tau 0.87 (0.71 to 0.96) ≤1.2 75 87 CSF /serum NFL 0.83 (0.67 to 0.94) >44.4 80 94
AUC - area under the curve; CSF - cerebrospinal fluid; Cl - confidence interval; NFL - neurofilament light subunits; NFH - neurofilament heavy subunits; Sn – sensitivity; Sp – specificity; tau - total tau; p-tau - phosphorylated tau; vs. – versus†‡AUC were not significantly different between the CSF p-tau/t-tau ratio and CSF t-tau levels when normal controls vs. Alzheimer’s disease or other dementias were compared.††AUC were not significantly different between the NFL/p-tau ratio and serum NFL levels when Alzheimer’s disease vs. other dementias were compared. *AUC were significantly different between the CSF NFL/NFH ratio and CSF NFH levels (P=0.043). AUC of CSF NFL/NFH and CSF NFH/t-tau ratios were not significantly different among themselves when normal controls vs. inflammatory patients were compared. **The difference between the CSF NFL/NFH ratio and CSF t-tau levels was not significant but the P value was on the borderline of significance (P=0.054).

Biomed Pap Med Fac Univ Palacky Olomouc Czech Repub. 2017 Sep; 161(3):286-295.
292
Ratios of different neurocytoskeletal proteins in CSF and serum
The CSF/serum NFL ratio was significantly higher in the AD group than that in normal controls (P=0.01) or in the IP group (P=0.0008) (Fig. 2A). The non-AD groups did not differ among themselves. The CSF/serum NFH ratio was similar in all groups.
CSF ratios of individual neurocytoskeletal proteinsThe lowest values of the CSF NFL/NFH ratio were
seen in the IP group and they significantly differed from those in normal controls (P<0.0001) and any demen-tia patients (IP vs. AD P<0.0001; IP vs. OD P=0.03). Additionally, the CSF NFL/NFH ratio was significantly lower in the OD group than in the AD group (P=0.05) (Fig. 2B).
The CSF NFL/t-tau ratio CSF did not show any dif-ferences among groups, while the CSF NFL/p-tau ratio was significantly higher in the OD group than that in the AD group (P=0.001) or the NC group (P=0.01) (Fig. 2C).
The ratios of CSF NFH/t-tau or CSF NFH/p-tau dif-fered significantly among groups (Fig. 2D and 2E). Both ratios CSF NFH/t-tau and CSF NFH/p-tau showed the lowest values in the AD group. The CSF NFH/t-tau ra-tio was lower in AD patients than in the control group (P=0.001) or the IP group (P=0.0002). Moreover, the CSF NFH/t-tau ratio was lower in the OD group or normal controls than that in the IP group (OD vs. IP P=0.04; NC vs. IP P=0.03). The CSF NFH/p-tau ratio significantly dif-fered between the AD group and the OD group (P=0.003) or the IP group (P=0.005) and between normal controls and the OD group (P=0.02) or the IP group (P=0.04).
Prominent differences were observed in the ratio CSF p-tau/t-tau (Fig. 2F). The ratio was significantly lower in the AD group and the OD group than that in normal controls (AD group vs. NC group P=0.0001; OD group vs. NC group P=0.0002) and similarly the ratio values were also significantly lower in patients of any dementia group than in the group of patients with inflammatory diseases (AD group vs. IP group P=0.004; OD group vs. IP group P=0.003).
Altogether, 1) the CSF NFL/NFH ratio was the best at differentiating between patients with aseptic neuro-in-fections and the AD group or normal controls; 2) the ra-tio CSF p-tau/t-tau showed the highest difference between normal controls and AD patients or other dementias, and 3) the CSF NFL/p-tau and CSF NFH/p-tau ratios dif-ferentiated between AD patients and patients with other dementias very well.
Evaluation of neurocytoskeletal proteins and their ratios according to the area under the ROC curves
The CSF NFL/NFH ratio showed the highest dis-crimination potency for differentiation between the in-flammatory group and AD or NC groups evaluated by the area under the ROC curves. The optimal results for discrimination between the NC group and the AD or OD groups were observed for the CSF p-tau/t-tau ratio and discrimination between the OD and AD groups were the best using CSF NFL/p-tau, CSF NFH/p-tau and serum
NFL. The AUC for the CSF p-tau/t-tau, CSF NFL/p-tau and CSF NFH/p-tau ratios with the highest values did not significantly differ from those of the individual proteins, while the AUC for the CSF NFL/NFH ratio was signifi-cantly higher than that of the individual proteins with the highest values of AUC (Table 2).
DISCUSSION
In this study we determined neurofilaments NFL and NFH together with CSF tau proteins in patients with AD, other dementias and aseptic inflammatory neuro-infec-tions. This allowed us to evaluate the clinical relevance of various ratios based on the neuron-specific proteins. We demonstrated that CSF NFH levels differed between in-flammatory patients and normal controls or AD patients. Unfortunately, levels of individual NFL and NFH proteins either in CSF or in serum did not seem to differentiate between cognitively normal subjects and patients with Alzheimer’s disease. We observed that the CSF NFL/NFH ratio was significantly elevated in the AD group compared to patients with inflammatory diseases or other dementias and the CSF p-tau/t-tau ratio showed the best values for discrimination between cognitively normal con-trols and AD or other dementias. The findings of the high-est elevation of CSF t-tau and CSF p-tau in AD patients were the expected results9.
Some ratios of neuron-specific proteins might con-tribute to differentiation between patients with dementias and normal controls. The CSF p-tau/t-tau ratio signifi-cantly decreased in both groups of dementias. The most prominent reduction was shown in other dementias but not in AD in which the marked elevation of p-tau caused the lesser decrease of the CSF p-tau/t-tau ratio. It seems that the elevation of CSF t-tau levels considered as a bio-marker of cortical axonal pathology10 mostly contributed to the decrease of the CSF p-tau/t-tau ratio in various types of dementias. Our results are in good agreement with findings of a recent study of Pijnenburg et al.20. The authors identified the decreased CSF p-tau/t-tau ratio as a biomarker for one of the subtypes of frontotemporal dementia (FTD) even with prognostic potential although a similar decrease was not observed in the non-differenti-ated group of FTD in their previous study18. Changes in ratio between CSF p-tau and CSF t-tau were also reported in other neurodegenerative diseases such as Creutzfeldt-Jacob disease and amyotrophic lateral sclerosis36,37.
Alterations in neurofilaments have been observed in multiple neurological diseases including AD (ref.5,38-43). Specific subclasses of neurons varying in the NF content in different regions of the central nervous system have been described44. It is characteristic for AD that neurons containing neurofilament proteins in regions of neocortex as well as medial temporal lobe structures have a greater predisposition to form NFT and degenerate2,45. In the opposite case, neurons lacking neurofilaments are not susceptible to these pathological changes46. We were un-able to confirm observations of some studies reporting increased levels of CSF NFL or CSF NFH in the AD
Biomed Pap Med Fac Univ Palacky Olomouc Czech Repub. 2017 Sep; 161(3):286-295.
293
group5,9. Based on the metaanalysi s9, we expected higher levels of CSF NFL in the AD group. However, not all studies report a significant increase in neurofilament lev-els. In a recent study, levels of NF in CSF as well as in serum were significantly elevated in the Guillain-Barré syndrome or amyotrophic lateral sclerosis, but not in AD (ref.13). Similarly, a study primarily focused on the changes of various markers including neurofilaments over time did not mention the difference in baseline NF levels between the AD group and controls47. In our study we observed the highest CSF and serum NFL levels in the group of other dementias. The median of NFL levels in this group was 2.37 times for CSF and 2.2 times for se-rum higher in comparison with normal control, while the CSF elevation in the AD group was only non-significantly higher, similarly as in the group of patients with inflam-matory diseases. Our observation of increased CSF NFL levels in patients with other dementias is consistent with previous studies5. The highest levels of CSF NFL were found in frontotemporal dementia, vascular dementia and mixed AD in comparison with other types of dementia19.
Serum levels of NFL and NFH did not differentiate normal controls and dementia groups. The use of highly sensitive immunoanalytical methods that allow us to quan-tify very low levels of neurofilaments in serum/plasma can increase their potential as biomarkers for dementias48. The most recent studies using single molecule array (Simoa) technique for NFL determination have shown significant-ly higher serum NFL levels in the AD group even in pro-dromal stadium compared to normal controls. However the overlap between the AD and other diagnostic groups was obvious14,15. Despite this limitation plasma NFL levels may be a useful noninvasive biomarker of neurodegenera-tive processes15.
Considering the different functions of individual NF chains and that variations in NF stoichiometry are as-sumed to be involved in the process of neurodegenera-tion49, we were interested whether the NFL/NFH ratio has any diagnostic potential. The changes in the values of the CSF NFL/NFH ratio may reflect the alteration in the NF stoichiometry in certain neurological diseases. Unfortunately, the ratio of the CSF NLF/NFH ratio did not support the diagnosis in either AD or other demen-tias. However, the neuron damage in neurodegeneration and neuroinflammation in aseptic neuro-infections was reflected in the NF ratio in different ways. The expression of NF levels in the CSF NFL/NFH ratio distinguished between patients with inflammatory diseases and the nor-mal controls or AD with great efficiency.
The ratio of NFL as a biomarker of white matter axo-nal damage and tau were suggested to be useful for dis-tinguishing between early-onset AD and frontotemporal dementia21. Both CSF NFL/p-tau and CSF NFH/p-tau ratios were significantly reduced in AD compared to other dementias. The decrease of the ratio in the AD group reflected both lower levels of neurofilaments and higher levels of p-tau in AD patients than in patients with other dementias.
CONCLUSION
In conclusion, we demonstrated a different impact of axonal impairment in the neurodegeneration and neuro-inflammation in aseptic neuro-infections to the CSF and serum levels of neuronal cytoskeletal proteins. While the tau proteins as well as their index differentiated between AD or OD patients and cognitively normal subjects, CSF levels of neurofilaments expressed as their index might contribute to the discrimination between patients with neuroinflammation and normal controls or AD patients.
Acknowledgement: The study was supported by Research Project Charles University in Prague PROGRES Q25 and Q35, by the project of National Institute of Mental Health NPU I (LO1611) and by Ministry of Health, Czech Republic - conceptual development of research organi-zation RVO VFN 64165, General University Hospital in Prague, Czech Republic.We wish to thank Dr. Benáková for the albumin measure-ment of all of our specimens.Author contributions: LF: study design, data analysis and interpretation, writing of the manuscript; AB: study design, collection and analysis of clinical data, clinical evaluation, general corrections; JS: laboratory analysis, data analysis. Conflict of interest statement: The authors state that there are no conflicts of interest regarding the publication of this article.
REF ERENCES
1. Perrot R, Eyer J. Neuronal intermediate filaments and neurodegen-erative disorders. Brain Res Bull 2009;80: 282-95.
2. Vickers JC, Dickson TC, Adlard PA, Saunders HL, King CE, McCormack G. The cause of neuronal degeneration in Alzheimer’s disease. Prog Neurobiol 2000;60: 139-65.
3. Kolarova M, Garcia-Sierra F, Bartos A, Ricny J, Ripova D. Structure and pathology of tau protein in Alzheimer disease. Int J Alzheimers Dis 2012;2012: 731526.
4. Zetterberg H. Cerebrospinal fluid biomarkers for Alzheimer’s disease: current limitations and recent developments. Curr Opin Psychiatry 2015;28 :402-9.
5. Petzold A, Keir G, Warren J, Fox N, Rossor MN. A systematic review and meta-analysis of CSF neurofilament protein levels as biomarkers in dementia. Neurodegener Dis 2007;4: 185-94.
6. Hort J, Bartos A, Pirttila T, Scheltens P. Use of cerebrospinal fluid biomarkers in diagnosis of dementia across Europe. Eur J Neurol 2010;1 7:90-6.
7. van Harten AC, Kester MI, Visser PJ, Blankenstein MA, Pijnenburg YA, van der Flier WM, Scheltens P. Tau and p-tau as CSF biomarkers in dementia: a meta-analysis. Clin Chem Lab Med 2011;49: 353-66.
8. Llorens F, Kruse N, Schmitz M, Shafiq M, da Cunha JE, Gotzman N, Zafar S, Thune K, de Oliveira JR, Mollenhauer B, Zerr I. Quantification of CSF biomarkers using an electrochemiluminescence-based detec-tion system in the differential diagnosis of AD and sCJD. J Neurol 2015;262:2 305-11.
9. Olsson B, Lautner R, Andreasson U, Ohrfelt A, Portelius E, Bjerke M, Holtta M, Rosen C, Olsson C, Strobel G, Wu E, Dakin K, Petzold M, Blennow K, Zetterberg H. CSF and blood biomarkers for the diag-nosis of Alzheimer’s disease: a systematic review and meta-analysis. Lancet Neurol 2016;15: 673-84.
10. Mattsson N. CSF biomarkers in neurodegenerative diseases. Clin Chem Lab Med 2011;49: 345-52.
11. Rudrabhatla P, Jaffe H, Pant HC. Direct evidence of phosphory-
Biomed Pap Med Fac Univ Palacky Olomouc Czech Repub. 2017 Sep; 161(3):286-295.
294
lated neuronal intermediate filament proteins in neurofibrillary tangles (NFTs): phosphoproteomics of Alzheimer’s NFTs. FASEB J 2011;25:38 96-905.
12. Zetterberg H, Skillback T, Mattsson N, Trojanowski JQ, Portelius E, Shaw LM, Weiner MW, Blennow K, Alzheimer’s Disease Neuroimaging Initiative. Association of Cerebrospinal Fluid Neurofilament Light Concentration With Alzheimer Disease Progression. JAMA Neurol 2016;7 3:60-7.
13. Gaiottino J, Norgren N, Dobson R, Topping J, Nissim A, Malaspina A, Bestwick JP, Monsch AU, Regeniter A, Lindberg RL, Kappos L, Leppert D, Petzold A, Giovannoni G, Kuhle J. Increased neurofilament light chain blood levels in neurodegenerative neurological diseases. PLoS One 2013;8: e75091.
14. Zhou W, Zhang J, Ye F, Xu G, Su H, Su Y, Zhang X, Alzheimer’s Disease Neuroimaging Initiative. Plasma neurofilament light chain levels in Alzheimer’s disease. Neurosci Lett 2017;65 0:60-4.
15. Mattsson N, Andreasson U, Zetterberg H, Blennow K, Alzheimer’s Disease Neuroimaging I. Association of Plasma Neurofilament Light With Neurodegeneration in Patients With Alzheimer Disease. JAMA Neurol 2017;74: 557-66.
16. Brettschneider J, Petzold A, Schottle D, Claus A, Riepe M, Tumani H. The neurofilament heavy chain (NfH) in the cerebrospinal flu-id diagnosis of Alzheimer’s disease. Dement Geriatr Cogn Disord 2006;21 :291-5.
17. de Jong D, Jansen RW, Pijnenburg YA, van Geel WJ, Borm GF, Kremer HP, Verbeek MM. CSF neurofilament proteins in the differential di-agnosis of dementia. J Neurol Neurosurg Psychiatry 2007;78 :936-8.
18. Pijnenburg YA, Janssen JC, Schoonenboom NS, Petzold A, Mulder C, Stigbrand T, Norgren N, Heijst H, Hack CE, Scheltens P, Teunissen CE. CSF neurofilaments in frontotemporal dementia compared with early onset Alzheimer’s disease and controls. Dement Geriatr Cogn Disord 2007;23: 225-30.
19. Skillback T, Farahmand B, Bartlett JW, Rosen C, Mattsson N, Nagga K, Kilander L, Religa D, Wimo A, Winblad B, Rosengren L, Schott JM, Blennow K, Eriksdotter M, Zetterberg H. CSF neurofilament light differs in neurodegenerative diseases and predicts severity and survival. Neurology 2014;83:1 945-53.
20. Pijnenburg YA, Verwey NA, van der Flier WM, Scheltens P, Teunissen CE. Discriminative and prognostic potential of cerebrospinal fluid phosphoTau/tau ratio and neurofilaments for frontotemporal de-mentia subtypes. Alzheimers Dement (Amst) 2015;1: 505-12.
21. Sjogren M, Rosengren L, Minthon L, Davidsson P, Blennow K, Wallin A. Cytoskeleton proteins in CSF distinguish frontotemporal demen-tia from AD. Neurology 2000;54: 1960-4.
22. Mioshi E, Dawson K, Mitchell J, Arnold R, Hodges JR. The Addenbrooke’s Cognitive Examination Revised (ACE-R): a brief cog-nitive test battery for dementia screening. Int J Geriatr Psychiatry 2006;21:1 078-85.
23. Hummelová-Fanfrdlová Z, Rektorová I, Sheardová K, Bartoš A, Línek V, Ressner P, Zapletalová J, Vyhnálek M, Hort J. Czech adaptation of Addenbrooke’s Cognitive Examination. Ceskoslovenska Psychologie 2009;53: 376-89.
24. Bartoš A, Raisová M. The Mini-Mental State Examination (MMSE) – Czech norms and cut-offs for mild dementia and mild cognitive impairment due to Alzheimer disease. Dement and Geriatr Cogn Disord 2016;4 2:50-7.
25. Bartoš A, Raisová M, Kopeček M. Amendment of the Czech Addenbrooke’s cognitive examination (ACE-CZ). Cesk Slov Neurol N 2011;74 :681-4.
26. Bartoš A, Raisová M, Kopeček M. The reasons and the process of amendment of the Czech Addenbrooke´s cognitive examination (ACE-CZ). Cesk Slov Neurol N 2011;74 :e1-e6.
27. Folstein MF, Folstein SE, McHugh PR. “Mini-mental state”. A practical method for grading the cognitive state of patients for the clinician. J Psychiatr Res 1975;12: 189-98.
28. Beránková D, Krulová P, Mračková M, Eliášová I, Košťálová M, Janoušová E, Stehnová I, Bar M, Ressner P, Nilius P, Tomagová M, Rektorová I. Addenbrooke’s Cognitive Examination – Approximate Normal Values for the Czech Population (in Czech). Cesk Slov Neurol N 2015;78/111 :300-5.
29. Scheltens P, Leys D, Barkhof F, Huglo D, Weinstein HC, Vermersch P, Kuiper M, Steinling M, Wolters EC, Valk J. Atrophy of medial tem-poral lobes on MRI in “probable” Alzheimer’s disease and normal ageing: diagnostic value and neuropsychological correlates. J Neurol Neurosurg Psychiatry 1992;55: 967-72.
30. Bartoš A, Zach P, Diblíková F, Tintěra J, Řípová D, Brunovský M. Visual rating of medial temporal lobe atrophy on magnetic resonance im-aging in Alzheimer’s disease. Psychiatrie 2007;11 :49-52.
31. McKhann GM, Knopman DS, Chertkow H, Hyman BT, Jack CR, Jr., Kawas CH, Klunk WE, Koroshetz WJ, Manly JJ, Mayeux R, Mohs RC, Morris JC, Rossor MN, Scheltens P, Carrillo MC, Thies B, Weintraub S, Phelps CH. The diagnosis of dementia due to Alzheimer’s disease: recommendations from the National Institute on Aging-Alzheimer’s Association workgroups on diagnostic guidelines for Alzheimer’s disease. Alzheimers Dement 2011;7 :263-9.
32. Bartoš A, Čechová L, Švarcová J, Říčný J, Řípová D. Cerebrospinal fluid triplet (tau proteins and beta-amyloid) in the diagnosis of Alzheimer-Fischer disease [Likvorový triplet (tau proteiny a beta-amyloid) v diag nostice Alzheimerovy-Fischerovy nemoci]. Cesk Slov Neurol N 2012;75/108: 587-94.
33. Deisenhammer F, Egg R, Giovannoni G, Hemmer B, Petzold A, Sellebjerg F, Teunissen C, Tumani H. EFNS guidelines on disease-specific CSF investigations. Eur J Neurol 2009;16: 760-70.
34. Teunissen CE, Petzold A, Bennett JL, Berven FS, Brundin L, Comabella M, Franciotta D, Frederiksen JL, Fleming JO, Furlan R, Hintzen RQ, Hughes SG, Johnson MH, Krasulova E, Kuhle J, Magnone MC, Rajda C, Rejdak K, Schmidt HK, van Pesch V, Waubant E, Wolf C, Giovannoni G, Hemmer B, Tumani H, Deisenhammer F. A consensus protocol for the standardization of cerebrospinal fluid collection and biobanking. Neurology 2009;73:1 914-22.
35. Bjerke M, Andreasson U, Rolstad S, Nordlund A, Lind K, Zetterberg H, Edman A, Blennow K, Wallin A. Subcortical vascular dementia biomarker pattern in mild cognitive impairment. Dement Geriatr Cogn Disord 2009;28: 348-56.
36. Skillback T, Rosen C, Asztely F, Mattsson N, Blennow K, Zetterberg H. Diagnostic performance of cerebrospinal fluid total tau and phosphorylated tau in Creutzfeldt-Jakob disease: results from the Swedish Mortality Registry. JAMA Neurol 2014;71: 476-83.
37. Grossman M, Elman L, McCluskey L, McMillan CT, Boller A, Powers J, Rascovsky K, Hu W, Shaw L, Irwin DJ, Lee VM, Trojanowski JQ. Phosphorylated tau as a candidate biomarker for amyotrophic lat-eral sclerosis. JAMA Neurol 2014;71 :442-8.
38. Liu Q, Xie F, Alvarado-Diaz A, Smith MA, Moreira PI, Zhu X, Perry G. Neurofilamentopathy in neurodegenerative diseases. Open Neurol J 2011;5 :58-62.
39. Fialova L, Bartos A, Svarcova J, Zimova D, Kotoucova J, Malbohan I. Serum and cerebrospinal fluid light neurofilaments and antibodies against them in clinically isolated syndrome and multiple sclerosis. J Neuroimmunol 2013;262: 113-20.
40. Rejdak K, Kuhle J, Ruegg S, Lindberg RL, Petzold A, Sulejczak D, Papuc E, Rejdak R, Stelmasiak Z, Grieb P. Neurofilament heavy chain and heat shock protein 70 as markers of seizure-related brain injury. Epilepsia 2012;53 :922-7.
41. Dujmovic I. Cerebrospinal fluid and blood biomarkers of neuroax-onal damage in multiple sclerosis. Mult Scler Int 2011;2011: 767083.
42. Kaiserova M, Grambalova Z, Otruba P, Stejskal D, Prikrylova Vranova H, Mares J, Mensikova K, Kanovsky P. Cerebrospinal fluid levels of chromogranin A and phosphorylated neurofilament heavy chain are elevated in amyotrophic lateral sclerosis. Acta Neurol Scand 2017 Feb 10. doi: 10.1111/ane.12735. [Epub ahead of print]
43. Studahl M, Rosengren L, Gunther G, Hagberg L. Difference in patho-genesis between herpes simplex virus type 1 encephalitis and tick-borne encephalitis demonstrated by means of cerebrospinal fluid markers of glial and neuronal destruction. J Neurol 2000;247: 636-42.
44. Vickers JC, Costa M. The neurofilament triplet is present in distinct subpopulations of neurons in the central nervous system of the guinea-pig. Neuroscience 1992;49: 73-100.
45. Vickers JC, Riederer BM, Marugg RA, Buee-Scherrer V, Buee L, Delacourte A, Morrison JH. Alterations in neurofilament protein im-munoreactivity in human hippocampal neurons related to normal aging and Alzheimer’s disease. Neuroscience 1994;6 2:1-13.
46. Vickers JC, Mitew S, Woodhouse A, Fernandez-Martos CM, Kirkcaldie MT, Canty AJ, McCormack GH, King AE. Defining the earliest pathological changes of Alzheimer’s disease. Curr Alzheimer Res 2016;13 :281-7.
47. Kester MI, Scheffer PG, Koel-Simmelink MJ, Twaalfhoven H, Verwey NA, Veerhuis R, Twisk JW, Bouwman FH, Blankenstein MA, Scheltens P, Teunissen C, van der Flier WM. Serial CSF sampling in Alzheimer’s disease: specific versus non-specific markers. Neurobiol Aging 2012;33: 1591-8.
Biomed Pap Med Fac Univ Palacky Olomouc Czech Repub. 2017 Sep; 161(3):286-295.
295
48. Kuhle J, Barro C, Andreasson U, Derfuss T, Lindberg R, Sandelius A, Liman V, Norgren N, Blennow K, Zetterberg H. Comparison of three analytical platforms for quantification of the neurofilament light chain in blood samples: ELISA, electrochemiluminescence immu-noassay and Simoa. Clin Chem Lab Med 2016;54:1 655-61.
49. Szaro BG, Strong MJ. Post-transcriptional control of neurofilaments: New roles in development, regeneration and neurodegenerative disease. Trends Neurosci 2010;33:27-37.