neurophysiological predictor of smr-based bci...
TRANSCRIPT
Neurophysiological Predictor of SMR-Based BCI
Performance
Benjamin Blankertza,b, Claudia Sannellia, Sebastian Halderc, Eva M.Hammerc, Andrea Kublerc,d, Klaus-Robert Mullera, Gabriel Curioe,
Thorsten Dickhaus∗,a
aMachine Learning Laboratory, Berlin Institute of Technology, GermanybIntelligent Data Analysis Group, Fraunhofer FIRST, Berlin, Germany
cInstitute of Medical Psychology and Behavioral Neurobiology, University of Tubingen,Germany
dDepartment of Psychology I - Biological Psychology, Clinical Psychology, andPsychotherapy, University of Wurzburg, Germany
eDept. of Neurology, Campus Benjamin Franklin, Charite University Medicine Berlin,Germany
Abstract
Brain-Computer Interfaces (BCIs) allow a user to control a computer appli-
cation by brain activity as measured, e.g., by electroencephalography (EEG).
After about 30 years of BCI research, the success of control that is achieved by
means of a BCI system still greatly varies between subjects. For about 20%
of potential users the obtained accuracy does not reach the level criterion,
meaning that BCI control is not accurate enough to control an application.
The determination of factors that may serve to predict BCI performance, and
the development of methods to quantify a predictor value from psychological
and/or physiological data serves two purposes: a better understanding of
the ‘BCI-illiteracy phenomenon’, and avoidance of a costly and eventually
∗Corresponding author. Berlin Institute of Technology, Machine Learning Laboratory,Sekr. FR6-9, Franklinstrasse 28/29, 10587 Berlin, Germany. Tel: +49 3031478624, Fax:+49 3031478622. E-mail address: [email protected] (Th. Dickhaus).
Preprint submitted to NeuroImage March 8, 2010
frustrating training procedure for participants who might not obtain BCI
control. Furthermore, such predictors may lead to approaches to antagonize
BCI-illiteracy. Here, we propose a neurophysiological predictor of BCI per-
formance which can be determined from a two minutes recording of a ‘relax
with eyes open’ condition using two Laplacian EEG channels. A correlation
of r = 0.53 between the proposed predictor and BCI feedback performance
was obtained on a large data base with N = 80 BCI-naive participants in
their first session with the Berlin Brain-Computer Interface (BBCI) system
which operates on modulations of sensory motor rhythms (SMRs).
Key words: Brain-Computer Interface (BCI), Sensory Motor Rhythms
(SMRs), Event-Related Desynchronization (ERD), Neurophysiological
Predictor, BCI Illiteracy
Introduction
Amplitude modulations of sensory motor rhythms (SMRs) can be volun-
tarily controlled by most subjects, e.g., by imagining movements. Recently
evidence was provided that also patients diagnosed with amyotrophic lateral
sclerosis (ALS) can accomplish SMR modulations (Kubler et al. (2005)). This
ability can be taken as a basis for Brain-Computer Interfaces (BCIs) which
are devices that translate the intent of a subject, as derived from measuring
brain signals, directly into control commands, e.g., for a computer application
or a neuroprosthesis (Dornhege et al. (2007); Allison et al. (2007); Birbaumer
et al. (2006); Pfurtscheller et al. (2005); Wolpaw et al. (2002); Kubler et al.
(2001)). For alternative applications of BCI technology, see Kohlmorgen
et al. (2007); Muller et al. (2008); Gerson et al. (2006); Tangermann et al.
2
(2009). More specifically, SMR-based BCI operation has its neurophysiologi-
cal grounds in the observation that macroscopic brain activity during resting
wakefulness is comprised of distinct ‘idle’ rhythms located over distinct brain
areas, e.g., the parieto-occipital α-rhythm (8–12Hz), cf. Berger (1933). The
perirolandic sensorimotor cortices show rhythmic macroscopic EEG oscilla-
tions (µ-rhythm) (Jasper and Andrews (1938); Hari and Salmelin (1997)),
with spectral peak energies at about 9–14Hz localized predominantly over
the postcentral somatosensory cortex. Typically phase coupled components
can be found in the beta band (16–25Hz) over the precentral motor cor-
tex. Modulations of the µ-rhythm have been reported for different manipu-
lations, e.g., motor activity, both actual and imagined (Jasper and Penfield
(1949); Pfurtscheller and Aranibar (1979); Schnitzler et al. (1997)), as well
as somatosensory stimulation (Nikouline et al. (2000)). Trial averages of µ-
rhythm power reveal attenuation of SMR, termed event-related desynchro-
nization (ERD, Pfurtscheller and da Silva (1999)), or increase (event-related
synchronization, ERS). Typically, ERD indicates cortical activity, while ERS
is observed as a rebound after ERD or during cortical idling (Pfurtscheller
and da Silva (1999); Pfurtscheller et al. (2006)).
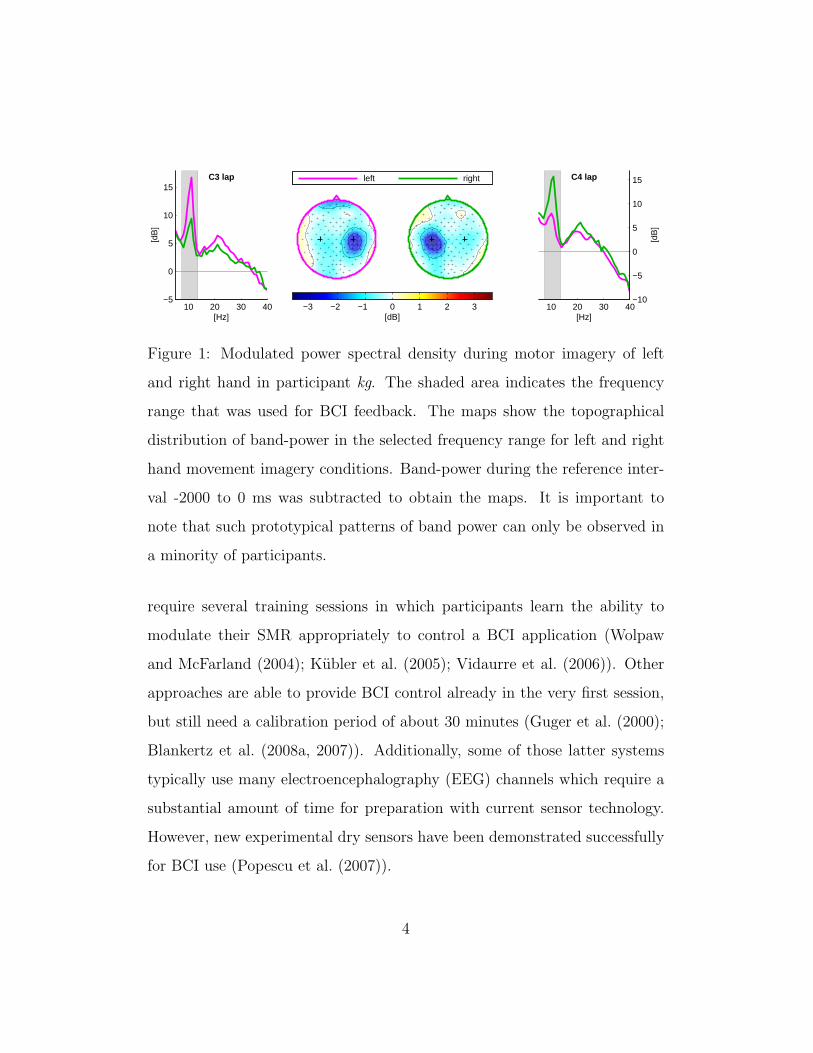
Several EEG-based BCI systems rely on voluntary modulations of SMRs,
e.g., by imagining movements as explained above. Fig. 1 shows the power
spectral density (in particular the amplitude of SMRs) in two channels over
the hand areas of the sensorimotor cortex during left hand and right hand
motor imagery and the corresponding topographies.
However, due to large inter- and intra-subject variability of the frequency
band and spatial patterns of SMR modulation, most SMR-based BCI systems
3
10 20 30 40−5
0
5
10
15
[Hz]
[dB
]
C3 lap
10 20 30 40−10
−5
0
5
10
15
[Hz]
[dB
]
C4 lapleft right
[dB]−3 −2 −1 0 1 2 3
left right
Figure 1: Modulated power spectral density during motor imagery of left
and right hand in participant kg. The shaded area indicates the frequency
range that was used for BCI feedback. The maps show the topographical
distribution of band-power in the selected frequency range for left and right
hand movement imagery conditions. Band-power during the reference inter-
val -2000 to 0 ms was subtracted to obtain the maps. It is important to
note that such prototypical patterns of band power can only be observed in
a minority of participants.
require several training sessions in which participants learn the ability to
modulate their SMR appropriately to control a BCI application (Wolpaw
and McFarland (2004); Kubler et al. (2005); Vidaurre et al. (2006)). Other
approaches are able to provide BCI control already in the very first session,
but still need a calibration period of about 30 minutes (Guger et al. (2000);
Blankertz et al. (2008a, 2007)). Additionally, some of those latter systems
typically use many electroencephalography (EEG) channels which require a
substantial amount of time for preparation with current sensor technology.
However, new experimental dry sensors have been demonstrated successfully
for BCI use (Popescu et al. (2007)).
4
One of the biggest challenges in BCI research is to solve the problem of
BCI illiteracy1, which is that BCI control fails to work for a non-negligible
proportion of participants (estimated 15% to 30%). The development of pre-
dictors of BCI performance may serve to gain a deeper understanding of this
phenomenon. Until the problem of BCI-illiteracy is solved, such predictors
may also serve to avoid the frustrating and costly procedure of trying to
establish BCI control. On the other hand, the study of predictors of BCI
performance may lead to novel approaches, e.g., training procedures or alter-
native experimental designs, which antagonize some causes of illiteracy and
thereby help to provide more people with the possibility of BCI communica-
tion.
Some literature exists on predictors of performance with a BCI system
based on the control of slow cortical potentials (SCPs, Elbert et al. (1980)).
A correlation of the ability for implicit learning with BCI performance was
found in Kotchoubey et al. (2000). Other work demonstrated the correlation
between performance in early neurofeedback sessions with the success to
control a BCI application in later sessions (Neumann and Birbaumer (2003),
Kubler et al. (2004)). In Daum et al. (1993) a correlation between attention
span tests and the ability to learn SCP regulation was found in a study with
14 participants with epilepsy.
Regarding SMR-based BCIs, to our knowledge Burde and Blankertz (2006)
was the only approach to predict feedback performance. In that work a signif-
icant (α = 0.05) correlation of r = 0.59 was found between the psychological
1By the term ‘BCI illiteracy’ we denote the case that a BCI system fails to correctly
detect the mental state of its user.
5
variable ‘locus of control with regard to technology’ (Beier (2004)) and BCI
feedback performance in a group of N = 17 participants.
The aim of the current study was to develop a neurophysiological predic-
tor for a participant’s performance of operating an SMR-based BCI. As we
wanted to draw conclusions that generalize beyond the investigated sample,
we included a large corpus of N = 80 BCI-naive participants. We propose
a resting EEG-based neurophysiological- mathematical procedure with high
predictive quality for later BCI performance. Additionally, our approach is
effective with respect to cap montage and recording time. Finally we provide
interpretable insight into the neurophysiological reasons for good resp. bad
BCI performance and BCI illiteracy.
Material and methods
Experimental Setup
Eighty healthy BCI-novices (41 female, age 29.9±11.5 years; 4 left-handed)
[Requirements: full contractual capability, mother tongue German (since a
series of psychological tests had to be accomplished), no neurological disease,
e.g., epilepsy] took part in this one-session study. All measurements (cali-
bration and feedback runs) of a participant were recorded on the same day
(one ‘session’). Subjects were paid 8 EUR per hour for the participation in
the study.
The participants were sitting in a comfortable chair with arms lying re-
laxed on armrests. Brain activity was recorded from the scalp with multi-
channel EEG amplifiers (BrainAmp DC by Brain Products, Munich, Ger-
many) using 119 Ag/AgCl electrodes (reference at nasion; manufacturer
6
EasyCap, Munich, Germany) in an extended 10-20 system, and sampled
at 1000Hz with a band-pass of 0.05Hz to 200Hz. Additionally, we recorded
electromyogram (EMG) from both forearms and the right leg as well as hori-
zontal and vertical electrooculogram (EOG). The EMG/EOG channels were
exclusively used to control for physical limb/eye movements that could cor-
relate with the task and could be reflected directly (artifacts) or indirectly
(afferent signals from muscles and joint receptors) in the EEG channels.
The session started with an EEG artifact recording during which the
participant performed tasks such as particular eye movements, blinking, or
maximum voluntary contraction of the hand. Then, ten periods of 15s were
recorded with the alternating tasks to ‘relax with eyes open’ and to ‘relax
with eyes closed’.
After this baseline recording and at the very end of the experimental ses-
sion, one run with the task ‘observation of movements’ was recorded. Video
clips of 10s duration showed either left hand, right hand or feet movement
from a first person’s perspective, which were presented in random order, 20
of each type. Results of the observation task will be presented elsewhere.
During ‘calibration’ every eight seconds one of three different visual cues
(arrows pointing left, right, or down) indicated to the participant which
type of motor task to perform: left hand, right hand, and right foot or feet
movement (according to the preference of the participant), see Fig. 2. A
15s break followed after every 20 trials. In one run, 25 trials of each motor
condition were recorded. First, we recorded one run of performed movements
(results will be presented elsewhere) and subsequently three runs of imagined
movement resulting in 100 trials altogether.
7

Between the calibration runs of imagined movement, participants were
confronted with a computerized version of the d2-test (Brickenkamp and
Zillmer (1998)), which was part of an extended psychological test battery
(results will be presented elsewhere).
2 sec 2 sec4 sec
baseline motor imagery rest
Figure 2: Course of a calibration trial. 2s fixation cross, 4s motor imagery
cued by arrows (left, right, or down), 2s blank screen.
After the calibration, participants performed three runs each of 100 trials
with BCI ‘feedback’ (for some participants only one or two runs were recorded
due to fatigue (N = 3) or lack of time (N = 7)). The first 20 trials were used
for adapting the bias of the classifier (see section ‘BBCI Feedback’). Each
trial of feedback started with a period of 2s with a black fixation cross in
the center of a gray screen. Then an arrow appeared behind the cross to
indicate the target direction of that trial (left or right for motor imagery
classes left hand and right hand and downward for class foot) and 1s later
the cross turned purple and started moving according to the classifier output,
as described in section ‘BBCI Feedback’. If the foot classes was selected, the
cursor moved on a corner shaped trajectory: For left hand vs. foot, e.g., the
cursor moved from the center to the left of the screen for detected left hand
motor imagery, and the cursor moved from the center downwards for detected
8
foot imagery. After 4s of cursor movement the cross froze at the final position
and turned black again. Two seconds later the cross was reset to the center
position and the next trial began. Hits or misses were counted according to
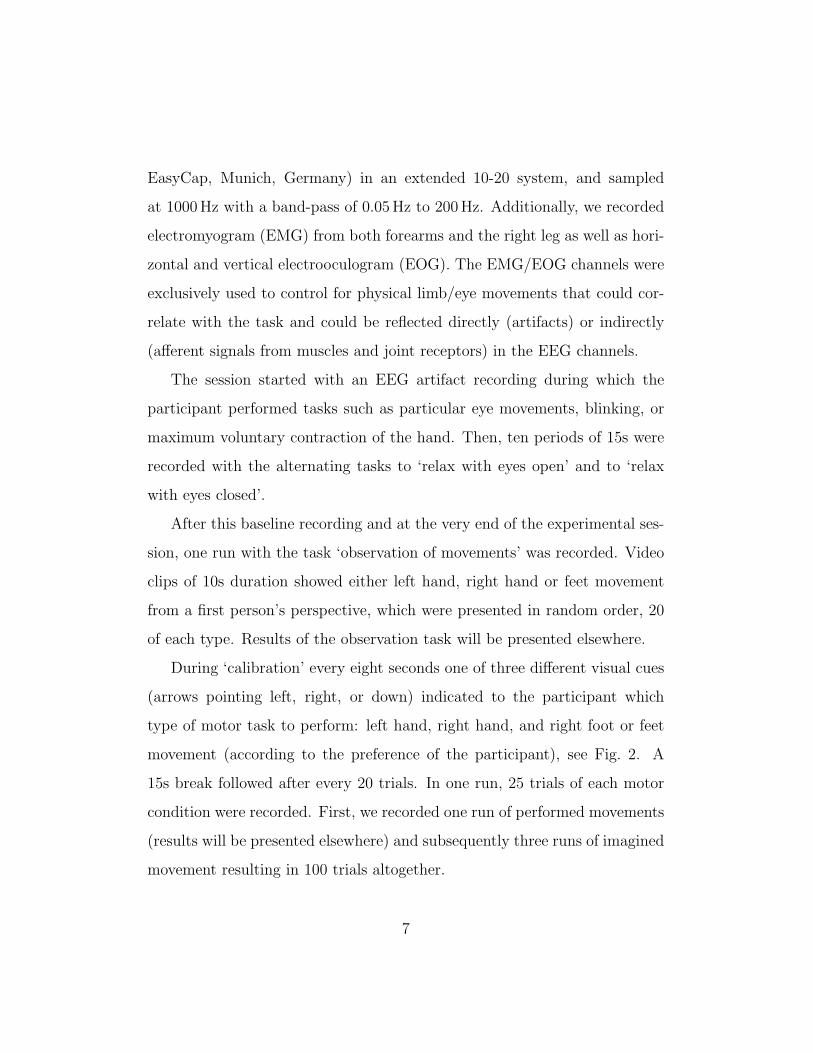
this final position, but the score was only indicated during a break of 15s
after every block of 20 trials (see Fig. 3 for timing during feedback runs).
of targetindication indication
of result
2 sec 2 sec4 sec1 sec
fixation feedback
Figure 3: Course of a feedback trial. 2s fixation cross (black), 1s indication of
target direction cued by arrows, 4s feedback (cross turns magenta and moves
according to BBCI classifier), 2s indication of result (cross turns black and
freezes at its final position).
BBCI Feedback
The EEG signals of the calibration measurement were band-pass filtered
in a subject-specific frequency band and temporally filtered in a subject-
specific time interval. The start of that interval varied between 480 ms and
2720 ms (median 930 ms) after cue onset and its end varied between 1700 ms
and 4990 ms (median 3810 ms). The median length of the interval was
2730 ms (range 1000 ms to 3890 ms). Details on the heuristics underlying the
selection of frequency band and time interval can be found in Blankertz et al.
(2008b). Note that also subject-optimized spatial filters were determined by
9
common spatial pattern (CSP) analysis (Blankertz et al. (2008b)). From
these signals the log-variance was calculated in each trial of the calibration
data. This procedure resulted in a feature vector with dimensionality equal to
the number of (heuristically) selected CSP filters (Blankertz et al. (2008b)).
To our experience, those features can be classified well by linear methods
like linear discriminant analysis (LDA). Other paradigms and feature repre-
sentations may however require non-linear modeling (see, e.g., Muller et al.
(2001); Muller et al. (2003)).
For online operation, features were calculated every 40ms with a sliding
window of 750ms (applying CSP filters, band-pass filtering, calculating log-
variance and applying the LDA classifier, see Blankertz et al. (2008b)). The
output of the classifier was translated into cursor movement in a rate control
manner: At the beginning of each trial, the cursor started in the center
of the screen and every 40ms a fraction of the classifier output was added
to the current cursor position (see also section ‘Experimental Setup’). CSP
filters calculated from the initial calibration measurement were not adapted
during online operation. The bias of the linear classifier was adapted on the
basis of the data of the first 20 trials of each feedback run (see Krauledat
et al. (2008)). (By bias we denote the term b in the separating hyperplane
formulation y = wx + b which can be used to adjust the output of a binary
classifier toward one class or the other). These 20 trials were not included in
the calculation of the feedback performance.
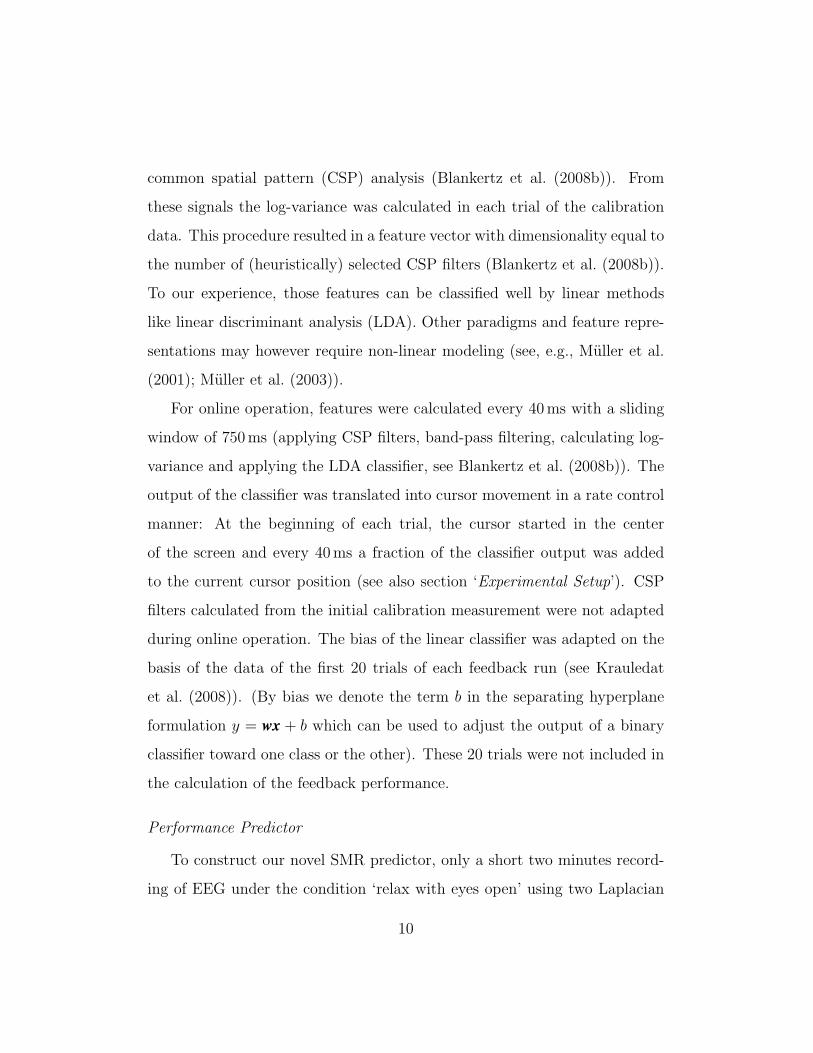
Performance Predictor
To construct our novel SMR predictor, only a short two minutes record-
ing of EEG under the condition ‘relax with eyes open’ using two Laplacian
10
channels (C3 and C4, calculated from nine original monopolar channels) was
required. For this purpose we used the concatenated segments of the same
condition during the baseline recording (see section ‘Experimental Setup’).
10 20 30
C3 lap
9.0
10 20 30
C4 lap
8.3
g1
g
PSD
0
5
10
[dB]
[Hz]
Figure 4: Illustration of the calculation of the performance predictor. The
plots depict the power spectral densities (PSDs) of a relax measurement (eyes
open) of one participant for two Laplace-filtered channels over sensorimotor
cortex (solid blue line), the estimated noise floor g1(f ; λ,k) (dashed purple
line) and the fitted values g(f ; λ, µ, σ,k) (dotted red line). In each channel
the maximum elevation of the peaks over the noise floor was determined
(vertical black lines). The value of the SMR predictor is the average of these
two values, in this example (9.0 + 8.3)/2 = 8.65.
From these data we calculated the power spectral density (PSD) in the
Laplace-filtered channels C3, C4 and determined for each of those channels
the maximum difference between the PSD curve and a fit of the 1/f noise
spectrum as explained below (cf. Fig. 4). These two values were estimates
of the strength of the SMR over the hand areas. The SMR-predictor was
11
calculated as the average of those two values. It quantified the potential
for desynchronization of the SMRs at rest as an indicator of SMR strength
during feedback.
We modeled each PSD curve as a function g of the frequency f with two
additive components of the form
g(f ; λ, µ, σ,k) = g1(f ; λ,k) + g2(f ; µ, σ,k) with
g1(f ; λ,k) = k1 +k2
fλand
g2(f ; µ, σ,k) = k3ϕ(f ; µ1, σ1) + k4ϕ(f ; µ2, σ2),
where k = (k1, k2, k3, k4) ∈ R4, λ ∈ R and ϕ(·; m, s) denotes the probability
density function (pdf) of a normal distribution with mean m and standard
deviation s. Function g1 is a model for the noise spectrum.The parameters
λ and k2 determine its shape and k1 its power level. Function g2 models the
additional peaks in the PSD around α and β frequency ranges. Thereby, µ1
resp. µ2 are the corresponding location parameters, σ1 resp. σ2 the scale
parameters and k3 resp. k4 determine the amplitudes of the two peaks.
As objective function for the optimization of the nine parameters (λ, µ =
(µ1, µ2), σ = (σ1, σ2), and k) we chose the L2-norm of the difference vector
PSD(f)−g(f ; λ, µ, σ,k), where f is the vector of all available frequency values
for the PSD; in our case f = (2Hz, 3Hz, . . . , 35Hz), see Fig. 4.
Since we decomposed the PSD into the noise component g1 and the two
peak components g2, the contribution of one channel to our proposed in-
dicator was simply maxf∈f g2(f ; µ, σ,k) ≈ maxf∈f{PSD(f) − noise(f)}. It
is worth noting that this PSD model with additive components g1 and g2
provides distinctly higher predictive accuracy than a simpler model which
12
does not explicitly take into account the noise floor of the PSD. For example,
averaging the peak PSD values in channels C3 and C4 without subtracting
the corresponding estimated noise floor values led in our sample to a dete-
rioration of the correlation coefficient with BCI feedback performance from
0.53 to 0.33.
Determining Foci of SMRs
We used two methods for determining which channels were best suited
for the SMR predictor, one based on the relax condition, the other based on
the separability of the motor imagery conditions. Using the data of the relax
condition of each participant, we did the same optimization as explained in
section ‘Performance Predictor’ for the SMR predictor to quantify separately
the strength of the SMR rhythm in each Laplacian channel. The obtained
values were averaged across all 80 participants.
Using the data of the motor imagery conditions, we determined the clas-
sification error for each participant when using logarithmic band power in a
single Laplacian channel as a feature. Here, a classifier was trained on the
data of the calibration measurement and evaluated on the feedback measure-
ment data. The resulting values were averaged across participants who had
the same combination of motor imagery classes in the feedback (left-right
(LR) for N = 30, left-foot (LF) for N = 34, and foot-right (FR) for N = 16
participants).
13
Results
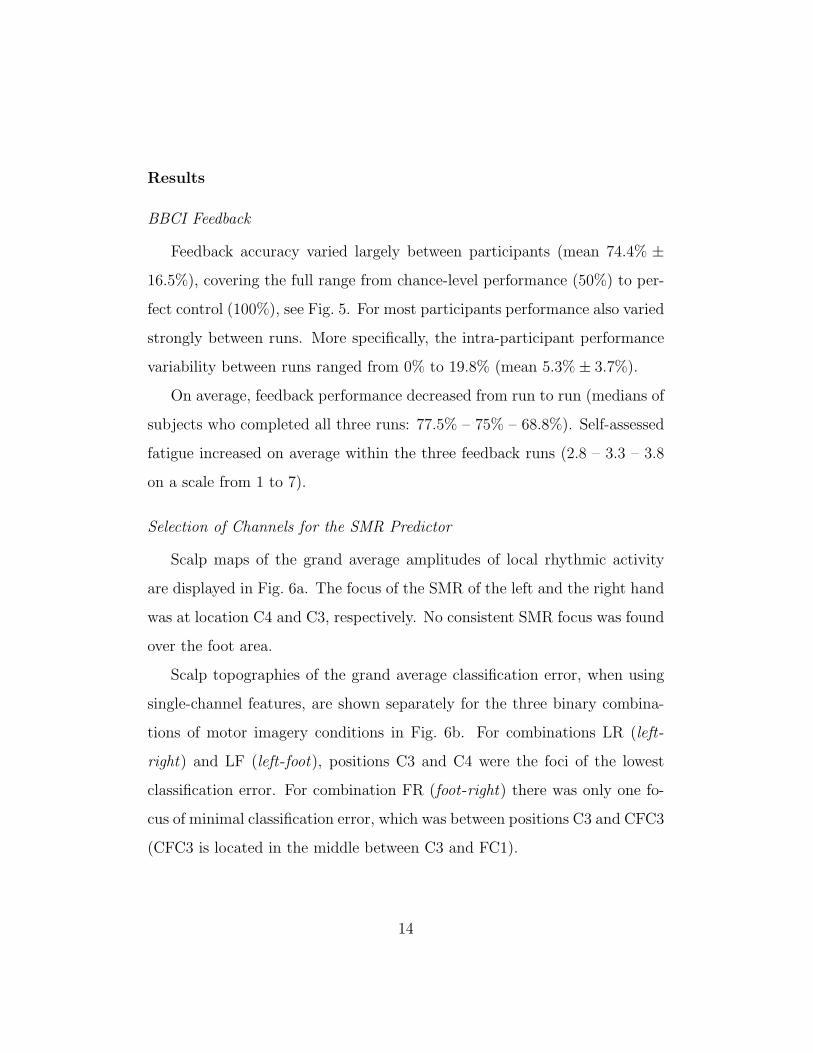
BBCI Feedback
Feedback accuracy varied largely between participants (mean 74.4% ±
16.5%), covering the full range from chance-level performance (50%) to per-
fect control (100%), see Fig. 5. For most participants performance also varied
strongly between runs. More specifically, the intra-participant performance
variability between runs ranged from 0% to 19.8% (mean 5.3%± 3.7%).
On average, feedback performance decreased from run to run (medians of
subjects who completed all three runs: 77.5% – 75% – 68.8%). Self-assessed
fatigue increased on average within the three feedback runs (2.8 – 3.3 – 3.8
on a scale from 1 to 7).
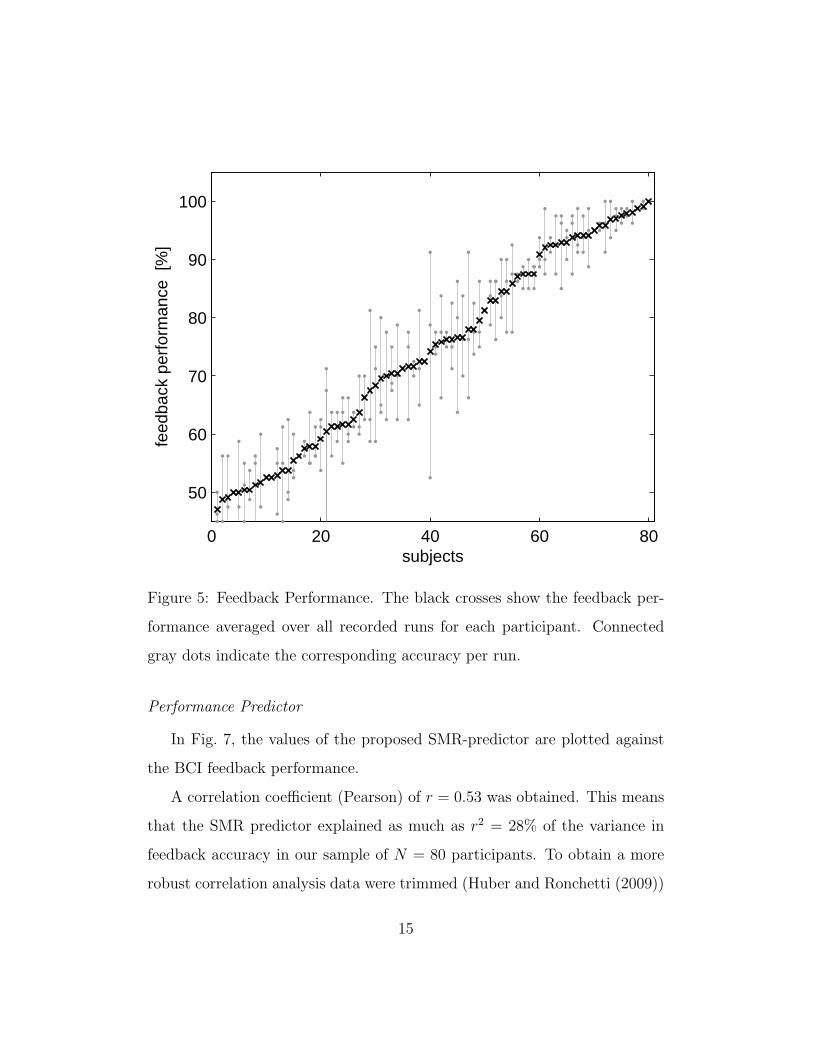
Selection of Channels for the SMR Predictor
Scalp maps of the grand average amplitudes of local rhythmic activity
are displayed in Fig. 6a. The focus of the SMR of the left and the right hand
was at location C4 and C3, respectively. No consistent SMR focus was found
over the foot area.
Scalp topographies of the grand average classification error, when using
single-channel features, are shown separately for the three binary combina-
tions of motor imagery conditions in Fig. 6b. For combinations LR (left-
right) and LF (left-foot), positions C3 and C4 were the foci of the lowest
classification error. For combination FR (foot-right) there was only one fo-
cus of minimal classification error, which was between positions C3 and CFC3
(CFC3 is located in the middle between C3 and FC1).
14
0 20 40 60 80
50
60
70
80
90
100
subjects
feed
back
per
form
ance
[%
]
Figure 5: Feedback Performance. The black crosses show the feedback per-
formance averaged over all recorded runs for each participant. Connected
gray dots indicate the corresponding accuracy per run.
Performance Predictor
In Fig. 7, the values of the proposed SMR-predictor are plotted against
the BCI feedback performance.
A correlation coefficient (Pearson) of r = 0.53 was obtained. This means
that the SMR predictor explained as much as r2 = 28% of the variance in
feedback accuracy in our sample of N = 80 participants. To obtain a more
robust correlation analysis data were trimmed (Huber and Ronchetti (2009))
15
[dB
]
3.5
4
4.5
5
5.5
6
6.5
(a) Idle Rhythm
LR (N= 30)
36
38
40
42
44
46
48
50LF (N= 34)
36
38
40
42
44
46
48
50FR (N= 16)
36
38
40
42
44
46
48
50
(b) Topographies of error-rates in single-channel classification for
class combinations LR, LF, and FR
Figure 6: (a) Topography of the SMR idle rhythm. For each Laplacian chan-
nel the amplitude of the idle rhythm during a relax condition was calculated
as in the proposed SMR predictor (see section ‘Performance Predictor’).The
resulting values were averaged across all 80 participants and displayed as
scalp topography. Larger crosses mark the channels C3 and C4. (b) Average
classification error utilizing only one Laplacian channel per motor imagery
class. For each binary combination of motor imagery classes left-right (LR),
left-foot (LF), and foot-right (FR), the classification error in single Lapla-
cian channels was determined, averaged across participants for whom the
respective class combination was chosen for feedback and displayed as scalp
topographies. Larger crosses mark the channels C3 and C4.
by removing points of the sample that have the 10% largest Malahanobis
distances to the data center (consisting of the arithmetic means of the SMR
predictor and the BCI feedback performance values). Applying this technique
results in removal of the data points which are shaded in Fig. 7 and in an
increase of correlation to r = 0.61.
16
2 4 6 8 10 12 14 16 18
50
60
70
80
90
100
jh
ji
jj jl
jn
jo
jp
js
jv
jx jy
jz
ka
kckd
kekf
kl
km
kn
ko
kq
kr
ks
kt
ku
kv
kw
kx
ky
kz
lb
ld le
taa
tac
tad
tae
taf
tah
tai
taj
tak
tal
tam
tantao
taptaq
tar
tas
tat
tbb
tbc
tbd
tbe
tbftbg
tbh
tbi
tbj
tbktbl
tbm
tbn
tbotbp
tbq
tbr
tbs
tbt
tbu
jk
kg
kk
kp
la
lc
tabtba
SMR predictor
BC
I fee
dbac
k ac
cura
cy [%
]
Figure 7: Correlation of SMR-predictor with BCI performance. Each dot
corresponds to one participant. The value of the proposed SMR-predictor
(abscissa) is plotted against the average BCI feedback performance (ordi-
nate). The solid line is the result of a linear regression analysis of the BCI
performance onto the SMR-predictor (r = 0.53, Pearson correlation). The
slope parameter of this regression line was estimated as β = 2.38. This has
the interpretation that the expected increase in BCI feedback accuracy in
case that the predictor value increases by one unit equals 2.38%. Removing
outliers by trimming with a level of 10% (shaded points) increases the Pear-
son correlation coefficient to r = 0.61 (corresponding regression line dashed,
β = 3.39).
Discussion
BBCI Feedback
Feedback results of 77.5% on average were remarkably high for first-time
BCI users in their first run. Notably, even better results have been obtained17
in earlier studies Blankertz et al. (2007, 2008a). This can be understood
from the fact that the demands were high on the participants in this study.
Because we used 128 EEG/EMG/EOG channels, the preparation of the cap
often took more than one hour. Then there was a sequence of several off-line
measurements such that the actual feedback only started after several hours.
The complete session took 5.5 to 6.5 hours. This may have had negative
influence on the performance compared to the earlier studies which ere per-
formed under more convenient conditions. Self-assessed fatigue increased and
feedback performance decreased on average from run to run. This suggests
that effects of fatigue were more prominent than potential improvement of
performance by practice.
Selection of Channels for the SMR Predictor
Raw EEG scalp potentials are known to have a poor spatial resolution due
to volume conduction. This implies the need for spatial filtering if the signal
of interest is weak, like SMRs, compared to other potentials of the brain. If
no prior data is available to optimize subject-specific spatial filters, Laplacian
filters are a good first choice, see Blankertz et al. (2008b). Consequently, our
aim was to operate with two or three Laplacian channels only to minimize
the effort that is needed to predict BCI performance.
We conclude from our results that single Laplacian channels C3 and C4
are a reasonable choice for the SMR predictor. Those locations showed the
strongest SMR amplitude in the relax condition and provided most informa-
tion for the discrimination of the motor imagery conditions, see Fig. 6.
18
Peri-Imagery ERS
Several studies found an ERS during motor imagery (‘peri-imagery ERS’).
This ERS was typically located either ipsilateral during hand motor imagery,
or bilaterally over both hand areas during foot motor imagery (Pfurtscheller
et al. (2006)). One interpretation of the peri-imagery ERS is that it is a sur-
round ERS reflecting an active inhibition of non-involved areas. Pfurtscheller
and colleagues observed the peri-imagery ERS in motor imagery trials with-
out feedback as in our offline calibration and the band power increased rel-
ative to a pre-stimulus interval. The peri-imagery ERS phenomenon might
deteriorate the performance of our proposed SMR predictor provided that
(1)during motor imagery band-power increases substantially over the level
of a (longer lasting) relax condition, and (2) the phenomenon can also be
observed during feedback operation. In this situation (weak SMR peak in
the relax condition, but successfully control BCI feedback by an ERS) our
SMR predictor would underestimate the BCI performance
In our data base of 80 participants, we found 51 cases of peri-imagery ERS
(over pre-stimulus level) in at least one of the three motor imagery classes
(mostly foot) during calibration, which is in line with Pfurtscheller et al.
(2006). But, remarkably, only four of those still produced a substantial ERS
during feedback operation. In three of these cases, the SMR predictor indeed
underestimated the BCI performance; in the forth, the raise of the SMR peak
above the relax level was of negligible magnitude, such that it did not matter
for the SMR predictor. Another four participants were moderately successful
in producing an ERS during feedback (mean BCI feedback accuracy 73%).
Seventeen participants had an ERS relative to pre-stimulus level, which did
19
not exceed the SMR level of the relax condition. Notably, 19 participants
who had a peri-imagery ERS during calibration had none during feedback
runs. For the seven remaining participants, the binary class combination
that was chosen for feedback did not include the class for which an ERS was
observed during calibration. Thus, it cannot be judged how many of those
would have produced a similar peri-imagery ERS during feedback. However,
since the selection of classes was based on classification performance during
calibration, it can be concluded that the ERS effect was less reliable than
the ERD.
To conclude, with respect to the proposed SMR predictor, we could not
find evidence in our data that peri-imagery ERS caused a substantial source
prediction error. However, the role of peri-imagery ERS during calibration
has to be studied in more detail, in particular, why the phenomenon rarely
carries over to the feedback condition.
Implications for the Illiteracy Problem and Limitations
The finding of our study suggests that the strength of the SMR idling
rhythm in the EEG is an essential property for successful performance with
an SMR-based BCI. This might be seen as a drawback of this type of BCI
system. As one alternative, features derived from slow movement related
potentials could be used, which are known to vary independently from SMR
modulations, cf. Dornhege et al. (2004). On the other hand, the relationship
that was found in this study may pave a way to approach the BCI illiteracy
problem: further studies will evaluate a specifically tailored neurofeedback
training to enhance the SMR idle rhythm and, hopefully, feedback perfor-
mance in subsequent BCI applications.
20
While present results were restricted to data recorded within the same
session, the intra-subject variability of SMR-predictor values as well as the
relation of the predictor to performance in future BCI sessions need to be
investigated in further studies. Likewise, the value of the SMR predictor in
BCI approaches that require more individual learning by means of neurofeed-
back remains to be elucidated [Kubler et al. (2005); Neuper et al. (2003)].
Despite our SMR predictor being to date the strongest described in the neu-
rofeedback/BCI literature, it has to be kept in mind that two-third of the
variance is caused by other factors.
Cases of Prediction Failure
Our performance predictor essentially estimated the amplitude of the
SMR to assess the potential for BCI performance assuming that motor im-
agery leads to an attenuation of the SMR (Pfurtscheller and da Silva (1999)).
There were, however, several cases in which the SMR predictor failed. (1) Some
participants had a detectable SMR but no class-specific attenuation of that
rhythm. One possible reason for this phenomenon could be that these par-
ticipants used a wrong strategy, e.g., only visually imagining the movements
instead of kinesthetically (Neuper et al. (2005)). Participant ji, e.g., reported
to have used abstract thoughts (“I rather thought left and down.”) during
feedback instead of motor imagery as in the calibration measurement. For
this participant the actual feedback performance was at chance level, while
the SMR predictor indicated fair performance. But the phenomenon of miss-
ing ERD was also observed in participants whose self-assessments provided no
evidence for non-compliance with instructions. Here, an alternative approach
suggested in Nikulin et al. (2008) could be useful: In this study, individuals
21
were guided to perform quasi-movements, which are volitional movements
that are minimized under instructions of the experimenter to an extent that
they become undetectable by peripheral physiological measures. Although
they are similar to imagined movements, the attitude of the performers is dif-
ferent. Classification rates (for left vs. right hand) were significantly better
for quasi-movements than for imagined movements in a study with seventeen
volunteers. Consequently, participants in who the BBCI fails to detect task
related ERD could be instructed to perform quasi movements. Whether this
approach would be applicable in paralysed patients who are a target popula-
tion for BCI remains an empirical question. (2) In some participants motor
imagery lead to an enhancement of the SMR (event-related synchronization,
ERS) compared to the measurement under the relax condition. In some of
those cases the SMR predictor underestimated the performance, but these
were few, see section ‘Peri-Imagery ERS’. (3) Some participants had a pro-
nounced SMR which they managed to attenuate by motor imagery, but they
were not able to sustain this attenuation long enough (i.e., until the end of
the feedback trial), e.g., participants lc and ky. Those participants would
have performed well if the feedback had been adapted to shorter trial dura-
tions. (4) The feedback runs started about 2.5 hours after the beginning of
the experiment. This may have lead to problems in vigilance and may have
degraded the feedback performance.
Possible Improvements of the SMR Predictor
Our observations indicated that the SMR predictor can be distorted by
contributions from the occipital visual idling rhythm, which has a peak in
the alpha frequency range and is typically much stronger than the SMR
22
idling rhythm. Although the Laplacian filter over sensorimotor areas should
cancel out contributions from the occipital site, this seemed not to be com-
pletely true in practice. To address the contribution of occipital alpha, we
did the same analysis as above with segments acquired under the condition
‘relax with eyes closed’- a condition know to substantially increase power in
the alpha band over occipito-parietal areas. The results were substantially
worse; namely, the correlation coefficient dropped from r = 0.53 to r = 0.27.
But even with eyes open, the visual alpha rhythm does not disappear com-
pletely, and therefore it might deteriorate the predictive value of the SMR
predictor. There are two approaches to counteract this potential problem.
(1) The experimental paradigm can be changed such that there is a task
which requires some visual processing during the ‘relax’ condition to sup-
press the visual alpha rhythm, e.g., watching a small abstract animation on
the screen. (2) Spatial filters that are specifically designed for the positions
C3 and C4 might be better in eliminating contributions from occipital sites
than the Laplacians filters.
Conclusion
While some publications focus on reporting results for successful partic-
ipants only, a percentage of 15-30% cases of BCI illiteracy are common in
every BCI laboratory. So far, very little was known about possible reasons
of such failures in BCI control. In the present study we found a reliable
predictor of BCI performance: Two minutes of resting state EEG with eyes
open measured at two Laplacian channels over left and right hand motor ar-
eas (positions C3 and C4) were sufficient to predict BCI performance during
later feedback runs within the same BCI session.
23

Our results contribute to speed up studies that focus on SMR-based BCI
based on a machine learning approach, because potentially non-successful
subjects can be identified at the very beginning of a session. Further, our
findings point at a versatile direction to counteract BCI illiteracy: In sub-
jects who present with no SMR peak that could be modulated, operant
conditioning procedures similar to [Birbaumer et al. (1999); Kubler et al.
(2005); McFarland et al. (1998)] could be applied in a pre-training session
to specifically enhance the power of the SMR idling rhythm. Future studies
will therefore contrast and unite psychological shaping strategies with online
machine learning approaches where the SMR is enhanced by individually
optimized classification procedures.
Acknowledgements
This work was supported in part by grants of the Deutsche Forschungs-
gemeinschaft (DFG), MU 987/3-1 and KU 1453-1, Bundesministerium fur
Bildung und Forschung (BMBF), FKZ 01IB001A/B and 01GQ0850 and by
the FP7-ICT Programme of the European Community, under the PASCAL2
Network of Excellence, ICT-216886. This publication only reflects the au-
thors’ views. Funding agencies are not liable for any use that may be made
of the information contained herein.
References
Allison, B., Wolpaw, E., Wolpaw, J., 2007. Brain-computer interface systems:
progress and prospects. Expert Rev Med Devices 4 (4), 463–474.
24
Beier, G., 2004. Kontrolluberzeugungen im Umgang mit Technik : ein
Personlichkeitsmerkmal mit Relevanz fur die Gestaltung technischer Sys-
teme. dissertation.de.
Berger, H., 1933. Uber das Elektroenkephalogramm des Menschen. Arch Psy-
chiatr Nervenkr 99 (6), 555–574.
Birbaumer, N., Ghanayim, N., Hinterberger, T., Iversen, I., Kotchoubey, B.,
Kubler, A., Perelmouter, J., Taub, E., Flor, H., 1999. A spelling device for
the paralysed. Nature 398, 297–298.
Birbaumer, N., Weber, C., Neuper, C., Buch, E., Haapen, K., Cohen, L.,
2006. Physiological regulation of thinking: brain-computer interface (BCI)
research. Prog Brain Res 159, 369–391.
Blankertz, B., Dornhege, G., Krauledat, M., Muller, K.-R., Curio, G., 2007.
The non-invasive Berlin Brain-Computer Interface: Fast acquisition of ef-
fective performance in untrained subjects. Neuroimage 37 (2), 539–550.
URL http://dx.doi.org/10.1016/j.neuroimage.2007.01.051
Blankertz, B., Losch, F., Krauledat, M., Dornhege, G., Curio, G., Muller,
K.-R., 2008a. The Berlin Brain-Computer Interface: Accurate performance
from first-session in BCI-naive subjects. IEEE Trans Biomed Eng 55 (10),
2452–2462.
URL http://dx.doi.org/10.1109/TBME.2008.923152
Blankertz, B., Tomioka, R., Lemm, S., Kawanabe, M., Muller, K.-R., Jan.
2008b. Optimizing spatial filters for robust EEG single-trial analysis. IEEE
25
Signal Process Mag 25 (1), 41–56.
URL http://dx.doi.org/10.1109/MSP.2008.4408441
Brickenkamp, R., Zillmer, E., 1998. D2 Test of Attention. Hogrefe & Huber,
Gottingen, Germany.
Burde, W., Blankertz, B., 2006. Is the locus of control of reinforcement a
predictor of brain-computer interface performance? In: Proceedings of
the 3rd International Brain-Computer Interface Workshop and Training
Course 2006. Verlag der Technischen Universitat Graz, pp. 76–77.
Daum, I., Rockstroh, B., Birbaumer, N., Elbert, T., W., A. C., Lutzen-
berger, 1993. Behavioural treatment of slow cortical potentials in in-
tractable epilepsy: neuropsychological predictors of outcome. J Neurol
Neurosurg Psychiatry, 94–97.
Dornhege, G., Blankertz, B., Curio, G., Muller, K.-R., Jun. 2004. Boosting
bit rates in non-invasive EEG single-trial classifications by feature combi-
nation and multi-class paradigms. IEEE Trans Biomed Eng 51 (6), 993–
1002.
URL http://dx.doi.org/10.1109/TBME.2004.827088
Dornhege, G., del R. Millan, J., Hinterberger, T., McFarland, D., Muller,
K.-R. (Eds.), 2007. Toward Brain-Computer Interfacing. MIT Press, Cam-
bridge, MA.
Elbert, T., Rockstroh, B., Lutzenberger, W., Birbaumer, N., 1980. Biofeed-
back of slow cortical potentials. I. Electroencephalogr Clin Neurophysiol
48, 293–301.
26
Gerson, A., Parra, L., Sajda, P., 2006. Cortically coupled computer vision for
rapid image search. IEEE Trans Neural Syst Rehabil Eng 14 (2), 174–179.
Guger, C., Ramoser, H., Pfurtscheller, G., 2000. Real-time EEG analysis with
subject-specific spatial patterns for a Brain Computer Interface (BCI).
IEEE Trans Neural Syst Rehabil Eng 8 (4), 447–456.
Hari, R., Salmelin, R., 1997. Human cortical oscillations: a neuromagnetic
view through the skull. Trends Neurosci 20, 44–9.
Huber, P. J., Ronchetti, E. M., 2009. Robust statistics. 2nd ed. Hoboken,
NJ: John Wiley & Sons. 354 p.
Jasper, H., Andrews, H., 1938. Normal differentiation of occipital and pre-
central regions in man. Arch Neurol Psychiatry 39, 96–115.
Jasper, H., Penfield, W., 1949. Electrocorticograms in man: Effects of volun-
tary movement upon the electrical activity of the precentral gyrus. Arch
Psychiatr Nervenkr 183, 163–174.
Kohlmorgen, J., Dornhege, G., Braun, M., Blankertz, B., Muller, K.-R.,
Curio, G., Hagemann, K., Bruns, A., Schrauf, M., Kincses, W., 2007.
Improving human performance in a real operating environment through
real-time mental workload detection. In: Dornhege, G., del R. Millan,
J., Hinterberger, T., McFarland, D., Muller, K.-R. (Eds.), Toward Brain-
Computer Interfacing. MIT press, Cambridge, MA, pp. 409–422.
Kotchoubey, B., Haist, S., Daum, I., Schugens, M., Birbaumer, N., 2000.
Learning and self-regulation of slow cortical potentials in older adults.
Exp Aging Res 26 (1), 15–36.
27
Krauledat, M., Tangermann, M., Blankertz, B., Muller, K.-R., Aug 2008.
Towards zero training for brain-computer interfacing. PLoS ONE 3 (8),
e2967.
Kubler, A., Kotchoubey, B., Kaiser, J., Wolpaw, J., Birbaumer, N., 2001.
Brain-computer communication: Unlocking the locked in. Psychol Bull
127 (3), 358–375.
Kubler, A., Neumann, N., Wilhelm, B., Hinterberger, T., Birbaumer, N.,
2004. Predictability of brain-computer communication. Int J Psychophysiol
18 (2-3), 121–129.
Kubler, A., Nijboer, F., Mellinger, J., Vaughan, T. M., Pawelzik, H., Schalk,
G., McFarland, D. J., Birbaumer, N., Wolpaw, J. R., 2005. Patients with
ALS can use sensorimotor rhythms to operate a brain-computer interface.
Neurology 64 (10), 1775–1777.
McFarland, D. J., McCane, L. M., Wolpaw, J. R., 1998. EEG-based com-
munication and control: Short-term role of feedback. IEEE Trans Rehabil
Eng 6 (1), 7–11.
Muller, K.-R., Anderson, C. W., Birch, G. E., 2003. Linear and non-linear
methods for brain-computer interfaces. IEEE Trans Neural Syst Rehabil
Eng 11 (2), 165–169.
Muller, K.-R., Mika, S., Ratsch, G., Tsuda, K., Scholkopf, B., May 2001. An
introduction to kernel-based learning algorithms. IEEE Neural Networks
12 (2), 181–201.
28
Muller, K.-R., Tangermann, M., Dornhege, G., Krauledat, M., Curio, G.,
Blankertz, B., 2008. Machine learning for real-time single-trial EEG-
analysis: From brain-computer interfacing to mental state monitoring. J
Neurosci Methods 167 (1), 82–90.
URL http://dx.doi.org/10.1016/j.jneumeth.2007.09.022
Neumann, N., Birbaumer, N., 2003. Predictors of successful self control dur-
ing brain-computer communication. J Neurol Neurosurg Psychiatry 74 (8),
1117–1121.
Neuper, C., Muller, G., Kubler, A., Birbaumer, N., Pfurtscheller, G., 2003.
Clinical application of an eeg-based brain-computer interface: A case study
in a patient with severe motor impairment. Clin Neurophysiol 114 (3), 399–
409.
Neuper, C., Scherer, R., Reiner, M., Pfurtscheller, G., 2005. Imagery of
motor actions: Differential effects of kinesthetic and visual-motor mode
of imagery in single-trial EEG. Brain Res Cogn Brain Res 25 (3), 668–677.
Nikouline, V., Linkenkaer-Hansen, K., H., W., Kesaniemi, M., Antonova, E.,
Ilmoniemi, R., Huttunen, J., 2000. Dynamics of mu-rhythm suppression
caused by median nerve stimulation: a magnetoencephalographic study in
human subjects. Neurosci Lett 294 (3), 163–166.
Nikulin, V. V., Hohlefeld, F. U., Jacobs, A. M., Curio, G., 2008. Quasi-
movements: A novel motor-cognitive phenomenon. Neuropsychologia
46 (2), 727–742.
URL http://dx.doi.org/10.1016/j.neuropsychologia.2007.10.008
29
Pfurtscheller, G., Aranibar, A., 1979. Evaluation of event-related desyn-
chronization preceding and following voluntary self-paced movement. Elec-
troencephalogr Clin Neurophysiol 46 (2), 138–46.
Pfurtscheller, G., Brunner, C., Schlogl, A., da Silva, F. L., 2006. Mu rhythm
(de)synchronization and EEG single-trial classification of different motor
imagery tasks. Neuroimage 31 (1), 153–159.
Pfurtscheller, G., da Silva, F. H. L., Nov 1999. Event-related EEG/MEG
synchronization and desynchronization: basic principles. Clin Neurophys-
iol 110 (11), 1842–1857.
Pfurtscheller, G., Neuper, C., Birbaumer, N., 2005. Human Brain-Computer
Interface. In: Riehle, A., Vaadia, E. (Eds.), Motor Cortex in Voluntary
Movements. CRC Press, New York, Ch. 14, pp. 367–401.
Popescu, F., Fazli, S., Badower, Y., Blankertz, B., Muller, K.-R., 2007. Single
trial classification of motor imagination using 6 dry EEG electrodes. PLoS
ONE 2 (7).
URL http://dx.doi.org/10.1371/journal.pone.0000637
Schnitzler, A., Salenius, S., Salmelin, R., Jousmaki, V., Hari, R., 1997. In-
volvement of primary motor cortex in motor imagery: a neuromagnetic
study. Neuroimage 6 (3), 201–208.
Tangermann, M., Krauledat, M., Grzeska, K., Sagebaum, M., Blankertz, B.,
Vidaurre, C., Muller, K.-R., 2009. Playing pinball with non-invasive BCI.
In: Advances in Neural Information Processing Systems 21. MIT Press,
Cambridge, MA, pp. 1641–1648.
30

Vidaurre, C., Schlogl, A., Cabeza, R., Scherer, R., Pfurtscheller, G., 2006. A
fully on-line adaptive BCI. IEEE Trans Biomed Eng 53 (6), 1214–1219.
Wolpaw, J. R., Birbaumer, N., McFarland, D. J., Pfurtscheller, G., Vaughan,
T. M., 2002. Brain-computer interfaces for communication and control.
Clin Neurophysiol 113 (6), 767–791.
Wolpaw, J. R., McFarland, D. J., 2004. Control of a two-dimensional move-
ment signal by a noninvasive brain-computer interface in humans. Proc
Natl Acad Sci U S A 101 (51), 17849–17854.
31