neutral line model of substorms: past results and present...
TRANSCRIPT

JOURNAL OF GEOPHYSICAL RESEARCH, VOL. 101, NO. A6, PAGES 12,975-13,010, JUNE 1, 1996
Neutral line model of substorms: Past results and present view
D. N. Baker, • T. I. Pulkkinen, 2 V. Angelopoulos, 3 W. Baumjohann, 4 and R. L. McPherron •
Abstract. The near-Earth neutral line (NENL) model of magnetospheric substorms is reviewed. The observed phenomenology of substorms is discussed including the role of coupling with the solar wind and interplanetary magnetic field, the growth phase sequence, the expansion phase (and onset), and the recovery phase. New observations and modeling results are put into the context of the prior model framework. Significant issues and concerns about the shortcomings of the NENL model are addressed. Such issues as ionosphere-tail coupling, large-scale mapping, onset trigger- ing, and observational timing are discussed. It is concluded that the NENL model is evolving and being improved so as to include new observations and theoretical insights. More work is clearly required in order to incorporate fully the complete set of ionospheric, near-tail, midtail, and deep- tail features of substorms. Nonetheless, the NENL model still seems to provide the best avail- able framework for ordering the complex, global manifestations of substorms.
1. Introduction
Geomagnetic activity is the generic term used to define variations in the Earth's magnetic field caused by sources ex- ternal to the Earth. Many different types of activity have been identified including the daily variation, the storm time variation, bay disturbances (substorms), sudden impulses and commencements, DPY or cusp currents, NBZ (northward in- terplanetary field)currents, and a wide variety of magnetic pulsations. These variations are caused by fluctuations in dif- ferent current systems within the ionosphere and magneto- sphere. The fluctuations are controlled by changes in the so- lar wind, interplanetary magnetic field, and/or the geometri- cal relation of the sun and Earth [Russell and McPherron, 1973a]. In this review we will be mainly concerned with magnetospheric substorms, the physical process responsible for bay disturbances.
Very early studies of solar-terrestrial physics established that geomagnetic activity is correlated with the sunspot cy- cle (l 1-year period), the position of the Earth in its orbit around the Sun (6-month period), and the solar rotation pe- riod (27 days) [Chapman and Bartels, 1962]. The reasons for these correlations was not confirmed until the solar wind was
discovered at the beginning of the space age, and it was demonstrated that geomagnetic activity is caused by the in- teraction of the terrestrial magnetic field with the solar wind [Snyder et al., 1963]. Two physical explanations for the cor- relation were suggested in 1961. The first explanation was
1Laboratory for Atmospheric and Space Physics, University of Colo- rado, Boulder.
2Finnish Meteorological Institute, Helsinki. 3Space Sciences Laboratory, University of California, Berkeley. 4Max-Planck-Institut fiir Extraterretrial Physik, Garching, Germany. 5Institute of Geophysics and Planetary Physics, University of Califor-
nia, Los Angeles.
Copyright 1996 by the American Geophysical Union.
Paper number 95JA03753. 0148-0227/96/95JA-03753509.00
that a viscous interaction between the Earth's field and the
solar wind allows closed field lines of the magnetosphere to be dragged antisunward creating an internal convection sys- tem [Axford and Hines, 1961 ]. The second explanation was that magnetic reconnection at the subsolar point allows the interplanetary magnetic field (IMF) to connect to the Earth's field. Flow of the solar wind around the Earth drags newly opened field lines antisunward, also creating an internal convection system [Dungey, 1961]. Both processes appear to be involved in the generation of geomagnetic activity with the reconnection process being much more important for substorms than the viscous interaction [Cowley, 1982].
As the solar wind impinges on the magnetosphere, chang- ing its velocity or density and, especially, when the IMF changes magnitude or direction, the magnetosphere under- goes substantial alterations. The size of the magnetosphere is modified, strong ionospheric currents may be established, and significant configurational changes can be seen throughout the magnetotail. The substorm initial phase is a slow process in which energy is stored in the tail by in- creasing the magnetic flux content of the magnetotail lobes. This phase is typically associated with southward IMF, thus suggesting magnetic reconnection at the front side of the magnetosphere. This leads to the addition of magnetic flux to the lobes of the magnetotail. The next step in the sub- storm cycle is the rapid release of this stored energy. Evi- dence indicates that a large fraction of the plasma populating the plasma sheet region is ejected tailward as a "plasmoid" which propagates tailward at speeds of the order of hundreds of kilometers per second. The appearance of fast tailward di- rected plasma flow is often observed beyond 20-25 RE geo- centric distance. This phase is often associated with a promi- nent thinning of the plasma sheet beyond about 18 R E dis- tance, while nearer the Earth the field becomes more dipolar. The last phase of the tail activity is termed the substorm re- covery phase. The onset of the recovery phase is identified by the recovery of negative bays in the ground-based auroral zone magnetograms and, often, by high-latitude bay devel- opment. At about the same time in the tail the plasma sheet suddenly reappears as a result of its rapid thickening. Such recovery events are normally associated with the appearance
12,975

12,976 BAKER ET AL.' THE NEAR-EARTH NEUTRAL LINE MODEL
THE SUBSTORM ENERGY DISSIPATION SEQUENCE
•OLAR WIND ENERGY INPU• SOUTHWARD IMF
CONVECTIVE
STORAGE • DI•IPATION EXPLOSIV• • DISSIPATION
"DRIVEN PROCESS (GLOBAL)
ENERGETIC PARTICLE
ACCELERATION
PLASMA SleET HEATING
JOULE HEA•G
PARTICLE PRECIPITATION
RInG CURRENT INJECTION
PLASMOID , AURO1/AL FORMATION : LUMINOSrrY
"UNLOADING PROCESS"
-!
RADIATION
RETURN TO SOLAR WIND
l MAGNETOTAlL IONOSPHERE
Figure 1. The flow of energy from the solar wind into, and through, the magnetosphere-ionosphere system.
of fast earthward plasma transport. Figure 1 describes the en- ergy flow within the magnetosphere-ionosphere system dur- ing the substorm process.
The substorm neutral line model represents an attempt to place this broad range of observations into a consistent framework. It was originally conceived independently in theoretical investigations of large-scale magnetotail in- stabilities and through interpretation of magnetotail obser- vations. Both observational and theoretical approaches base substorm activity on the phenomenon of magnetic merging which allows magnetic field lines to be severed and subse- quently reconnected. Thus magnetic reconnection involves large scale mass, magnetic flux, and energy transport which would otherwise be impossible. Magnetic reconnection in this context refers to processes at a near-Earth reconnection site, which was originally assumed to be a magnetic neutral line. This gave rise to the name near-Earth neutral line (NENL) model.
Early theoretical work and continuing numerical simula- tions have been highly successful in the explanation of ob- servational phenomena such as tailward flow with southward B z and velocity dispersion when the separatrix layer linked to a reconnection site crosses the satellite location. Also,
the model explains quite naturally plasma sheet thinning and
expansion tailward and earthward of the reconnection site, respectively, and the presence of plasmoids in the distant tail. All of these observations can be related to substorm on-
set by a variety of timing arguments. Furthermore, the reduc- tion of the open magnetic flux as evidenced by low-altitude spacecraft and ground-based optical auroral observations is often taken as strong support for the NENL model.
Despite its many successes such as its ability to explain and combine phenomena observed at widely separated loca- tions in space, the NENL model has been subject to substan- tial criticism. Examples include the lack of detailed and re- peated observational evidence for neutral lines and questions about field-aligned current generation. These criticisms have been addressed by improved theory and simulations using three-dimensional tail models. Such three-dimensional mod-
els seem to produce a neutral line as a response to enhanced flux loading into the tail, and also show that shears in the earthward flows generated by magnetic reconnection cause the formation of region 1-type field-aligned currents.
Further refinements of the model include the substorm-
related bursty bulk flows which are explained on the basis of localized magnetic reconnection. Moreover, the energy flow pattern required both globally and locally in the inner tail to power substorm evolution has recently been addressed. The

BAKER ET AL.: THE NEAR-EARTH NEUTRAL LINE MODEL 12,977
earthward transport of magnetic flux required to explain the dipolarization of the magnetic field in the near-tail, and large-scale auroral features such as the westward traveling surge, identified as the ionospheric footprint of the western section of the substorm current wedge, have now been in- cluded in the NENL model.
Recent criticism of the NENL model is based primarily on observations in the inner tail, for example, near geosyn- chronous orbit, and on the ground. Traditionally, the NF3• model has covered primarily the midtail and far-tail regions of the magnetosphere and established large-scale connec- tions between these regions and the polar cap and auroral ionosphere. Recent observational evidence, however, indi- cates that a variety of previously unappreciated phenomena occur in the inner tail region. In this region, substorm onset brings about the rapid dipolarization of the magnetic field, including strong magnetic fluctuations with timescales com- parable to local ion gyrofrequencies. At the same time, ground-based optical observations indicate that the first au- roral brightening occurs near the equatorward boundary of the auroral oval. Furthermore, spacecraft observations demon- strate the existence of strong spiky electric fields at the trapping boundary in the inner magnetosphere. These obser- vations, together with the commonly observed substorm in- jection of energetic particles in the inner magnetosphere, have led to other substorm models, which suggest that the process that initiates the substorm dynamical evolution is apparently located in the inner tail, inside of ~10 R E from the Earth. This view is further supported by magnetic map- ping of various auroral and ionospheric features into the pre- onset magnetotail, which again suggests near-tail activity occurring simultaneously with the auroral brightening.
In this paper we review the observational and theoretical basis for the NENL model of substorms. We recount new ob-
servations and modeling results which tend to support this model. We also examine the issues and problems that pres- ent difficulties in the NENL model. We conclude with a sec-
tion that looks to future refinements of the NENL approach.
2. Global Substorm Processes: The Original NENL Model
2.1 Solar Wind and IMF Control
The first demonstration of IMF control of substorms was
by Fairfield and Cahill [1966], who established that auroral zone bay disturbances occurred during intervals of southward IMF. Several years, later Aubry and McPherron [1971 ] dem- onstrated that substorms followed a definite sequence of growth, expansion, and recovery. A southward turning of the IMF (i.e., antiparallel to the Earth's field) is followed by an interval during which the tail field systematically increases until the onset of the expansion phase, and then decreases during the expansion phase. Their results showed that the best AE correlation (a measure of the strength of bay activity) was with the rate at which southward magnetic flux arrived at the subsolar bow shock, that is, with VB s (B s = -B z if B z <0, =0 if B z >0). Furthermore, the best prediction of AEwas ac- complished by regressing the current and two preceding hourly values of VB s against the current hourly AE.
Subsequently, Russell and McPherron [1973a] used the hypothesis of magnetic reconnection to explain the semian-
nual variation of geomagnetic activity. They noted that each year the Earth's dipole reaches maximal tilt (35 ø ) relative to the normal to the ecliptic plane at the equinoxes. At these times the interplanetary magnetic field is more likely to have a large projection on the Earth's dipole axis allowing magnetic reconnection to generate stronger magnetic activ- ity.
IMF control of the ring current (Dst index) was quantita- tively demonstrated by Burton et al. [1975]. Their relation was based on the work of Dessler and Parker [1959], who
showed that the magnetic perturbation (AB)produced by a symmetric ring current at the Earth's center is directly pro- portional to the total energy (Ur)of particles drifting in the radiation belts: AB =2/3 Ur/UB. In this relation, UB is the total magnetic energy of the Earth's field. Since the Dst in- dex is a good approximation to AB, the time rate of change of Dst is proportional to the rate at which the energy of ring current particles changes. Ring current energy is increased by particle injection and decreased by particle loss due to charge exchange with neutral particles.
Later, Perreault and Akasofu [1978] used a somewhat similar approach to study the development of magnetic storms. However, since Dst is proportional to energy they argued that the ring current injection function Q(t) must also have energy units. Since it was evident that the IMF plays an essential role, they chose the magnitude of the solar wind Poynting vector as one factor in the injection function, so that Q(t) o• E x H o• VB 2. To account for the strong depen- dence of geomagnetic activity on the orientation of the IMF, they tried a number of different angular gating functions g(O) as a second factor in the injection function. Because they be- lieved magnetic activity was directly driven and that no en- ergy is stored in the magnetosphere, they selected a gating function that had finite value for all IMF clock angles. This allows a finite correlation between activity indices and the IMF even when the IMF has a northward component.
Two-and-one-half-minute averages were utilized by Clauer et al. [1981, 1983] to investigate the relation of the AU, AL, and Asym indices to the solar wind electric field at high time resolution. The authors showed that the AL filter is 3 hours
long and has the form of a negative bay peaking at about 1 hour [see Baker et al., 1981]. Bargatze et al. [1985] investigated the possibility that the prediction filter for the AL index changes in a systematic way with the level of ac- tivity. They found that at all levels of activity there is a peak in the impulse response at about 20 min. In addition, at moderate levels of activity there is a second peak at about 1 hour. They interpreted these two peaks in the impulse re- sponse as evidence that two distinct processes contribute to the AL index. Since it is the rectified solar wind electric field
that is correlated with AL, they assumed that magnetic re- connection underlies both. Thus they attributed the first peak to dayside reconnection and the second to nightside recon- nection.
High time resolution data were also used by McPherron et al. [1986a] and Fay et al. [1986] to obtain linear prediction filters for the relations between the solar wind electric field
and dynamic pressure and the Dst index. The pressure filter was a delta function at approximately zero delay when the solar wind input was first propagated to the magnetopause. The Dst filter was identical to that obtained by lyemori et al. [1979] although with higher time resolution. The authors also obtained a filter for the injection function defined as

12,978 BAKER ET AL.: THE NEAR-EARTH NEUTRAL LINE MODEL
Q(t) = [dDst/dt + Dst/'r When •: was taken to be 8 hours the filter was a Gaussian pulse centered at 20-min delay. This peak appears at the same time delay as the first peak in the AL filter and presumably indicates that ring current injection occurs in response to the same process that drives the initial response of the AL index, that is, dayside reconnection.
2.2. Growth phase Sequence
The clearest manifestation of the substorm occurs when the field is southward for about 1 hour. Under such condi-
tions, three phases of the substorm can be identified: the growth phase, the expansion phase, and the recovery phase. The growth phase is an interval during which energy is ex- tracted from the solar wind and stored in the magnetotail and ring current, while it is simultaneously dissipated in the ionosphere [Baker et al., 1984a]. During the growth phase the magnetosphere undergoes a sequence of changes in configu- ration that eventually lead to a global instability and the explosive release of energy during the expansion phase.
Finite ionospheric resistance dissipates energy associated with the region 1 and 2 currents as they close through the ionosphere. Also, the self-inductance of the field-aligned cur- rents, in conjunction with the resistance, retards the rate at which the currents develop. As a consequence, the iono- spheric currents cannot develop as rapidly as needed to force nightside magnetic flux to return to the dayside at the rate required by dayside reconnection [Coroniti and Kennel, 1972a]. To compensate, the reconnection region moves earthward eroding the dayside magnetopause [Aubry et al., 1970; Holzer and Slavin, 1978]. Magnetopause pressure bal- ance is maintained by a reduction of magnetospheric mag- netic field caused by the magnetic perturbations of the re- gion 1 and 2 current system [Coroniti and Kennel, 1972b].
On the dayside of the Earth, erosion causes the cross sec- tion of the magnetosphere to decrease, while further from the Earth the addition of magnetic flux to the lobes causes it to increase [Maezawa, 1975; Baker et al., 1984b]. These changes produce increased flaring of the magnetopause [Fairfield, 1985]. The increased angle of attack of the solar wind on the flared magnetopause enables the solar wind to exert greater pressure than before. This enhanced pressure is balanced by increased magnetic field pressure within the tail lobes. Lobe magnetic pressure is transmitted to the plasma sheet causing it to thin. At the same time, plasma and mag- netic flux transported through the plasma sheet to the day- side is associated with thinning as well.
In addition to producing the above effects, magnetic re- connection opens the magnetosphere. Field lines from the polar caps pass through the magnetopause into the solar wind. Tailward of the neutral points these field lines pass through the portion of the magnetopause where the currents flow in the dusk-to-dawn direction. Within the boundary there is a sunward directed force on the plasma, and by re- action, the solar wind applies a tangential force to the boundary. This drag pulls the Earth's tail and its contents an- tisunward. To maintain equilibrium, the Earth must pull harder on the tail. This is accomplished by the tail current moving closer to the Earth so that the gradients in the fring- ing field of the tail lobes can interact more strongly with the Earth's dipole moment [Unti and Atkinson, 1968' Siscoe, 1966].
Another consequence of magnetic field lines passing through the magnetopause is the application of the solar wind motional electric field to the magnetic field lines of the tail lobes and to the polar caps. It is this electric field that drives the cross polar cap portion of the region 1 iono- spheric current closure. It also causes the field lines of the tail lobes to slowly drift toward the plasma sheet. Close to the Earth this drift begins soon after dayside reconnection begins. However, at the distant X line (100-200 R E down tail) it may take 30-40 min before it begins. Recent obser- vations of reconnection in the tail during substorms by ionospheric radar [Blanchard et al., 1995] show that recon- nection of open field lines does not begin until shortly after the expansion phase onset. Thus it appears that recon- nection does not commence at the distant X line during the substorm growth phase and so magnetic flux accumulates in the tail lobes.
During the growth phase, an increasing amount of closed magnetic flux is removed from the dayside which then ap- pears in the lobes as open flux. These changes are apparent in the ionosphere as an increase in the size of the polar cap [Akasofu, 1968; Baker et al., 1994a]. The auroral oval moves equatorward [Feldstein and Starkov, 1967] and the auroras be- come more intense. Multiple auroral arcs are observed in the auroral oval all drifting equatorward across the oval [Akasofu, 1964]. The strength of the DP-2 current increases with time (the AU and AL indices increase), with more and more current closing outward from the Harang discontinuity along field lines. This current continues westward in the equatorial plane closing along field lines in the afternoon sector. The magnetic effects of this current are observed as a partial ring current and are measured by an increase in the asymmetry (Asym) index.
As the growth phase progresses, the near-Earth current sheet becomes thinner and more intense causing much of the magnetic flux normally crossing this region to close at greater radial distances [e.g., Baker and Pulkkinen, 1991]. The field becomes very weak and tail-like in the equatorial plane [Kokubun and McPherron, 1981 ]. Energetic particles normally drifting though this region with 90 deg pitch an- gles move closer to the Earth causing a decrease in particle fluxes. Particles of small pitch angles are less affected so that pitch angle distributions become highly elongated or "cigar-shaped" [Baker et al., 1978].
Baker and McPherron [1990] examined the extreme thin- ning of the cross-tail current sheet that occurs remarkably close to the Earth during the late growth phase. They argued that magnetic reconnection on closed field lines in the more distant tail could help drive this extreme thinning. McPher- ron et al. [ 1987], Sergeev et al. [ 1990a], and Sanny et al. [1994] presented observations demonstrating such extreme current sheet thinning and used empirical modeling methods to assess this behavior. Pulkkinen [1991] used modifications of the Tsyganenko models to study magnetic field and cur- rent configurations near substorm onset. This work was later extended to provide a time-dependent modeling of the night- side currents and field configurations throughout the entire growth phase sequence [Pulkkinen et al., 1991a, 1992]. In Figure 2, for example, is shown the integrated cross-tail cur- rent, K, and the magnetic field configuration in a particular magnetic meridian for the CDAW-9 analysis period [Pulkkinenet al., 1991a]. The upper panels show the values

BAKER ET AL.: THE NEAR-EARTH NEUTRAL LINE MODEL 12,979
K[•-] a) 50 300
200 /•tal .... / ".......•Ring
100 [ ....... ']'2:.-......-..-..2............•'5 Lon•146' TS,,Kp•5-- i i
mA ø K[•-]
300
200
100
b) 5
0
-5
5
Z[RE] o
-5
5 Z[RE]
-5
i i i 0 10 20 30 0 5 10 15 20
Radial distance [ RE ] Radial distance [ RE ]
Figure 2. (left) Current intensities integrated over the current sheet thickness (in mA/m) in the ISEE 1 meridian (a) in the basic T89 model, and (b) in the modified model with maximal parameter values. Total current (solid line), ring current (dotted line), and tail current (dashed line) are shown for both cases. The added current sheet is shown by dashed-dotted line. (right)Field line projections to the ISEE 1 meridian (146 ø) computer using (c) basic T89 model and (d) the modified model. The region of chaotic electron motion for 1 keV electrons is shown hatched [from Pulkkinen et al., 1991a].
of K (Figure 2) and the field lines (Figure 2) for the unmod- ified Tsyganenko [1989] model. The lower panels (Figure 2b and 2d) show the corresponding results for the modified, time-dependent model which is constrained by multisatellite observations in the midnight sector. Tremendous field stretching and cross-tail current enhancement leads to a very thin current sheet structure.
2.3. Magnetotail Storage and Release
Essentially all of the energy to drive substorms comes from solar wind input; this input is greatly enhanced when the IMF tums southward. However, as discussed above, there
may also be significant solar wind coupling even under mildly northward IMF conditions [Perreault and Akasofu, 1978; Baker et al., 1986]. A notable point [e.g., Baker et al., 1984a] is that the directly driven aspects of substorms are manifested in the ionosphere as a substantial dissipation as- sociated with the global convection process. As this global convective dissipation occurs, the magnetotail is also loaded with energy thus making "storage", or the substorm growth phase, an integral part of the driven aspects of substorms.
The changes in the distribution of magnetic flux occurring during the sub storm growth phase cannot continue indefi- nitely. Eventually, no flux would cross the nightside equato- rial plane and the plasma sheet would thin to the scale of an ion gyroradius. Alternatively, magnetic flux would be com- pletely eroded from the dayside. Before either of these hap- pens a global instability develops that allows closed field lines to return to the dayside. In the NENL model this insta- bility is the onset of reconnection [e.g., Schindler, 1974]. At first this reconnection is on closed field lines, but quite soon it moves into the open field lines of the lobe, thus ad- justing the balance of open and closed field lines.
The onset of reconnection is attributed to growth phase thinning of the plasma and current sheet, and reduction in
the vertical magnetic field through the current sheet. When some portion of the current sheet reaches an appropriate threshold, reconnection begins spontaneously at the center of the sheet. At the instant of formation the X line is of limited azimuthal extent and connected to an O line at each
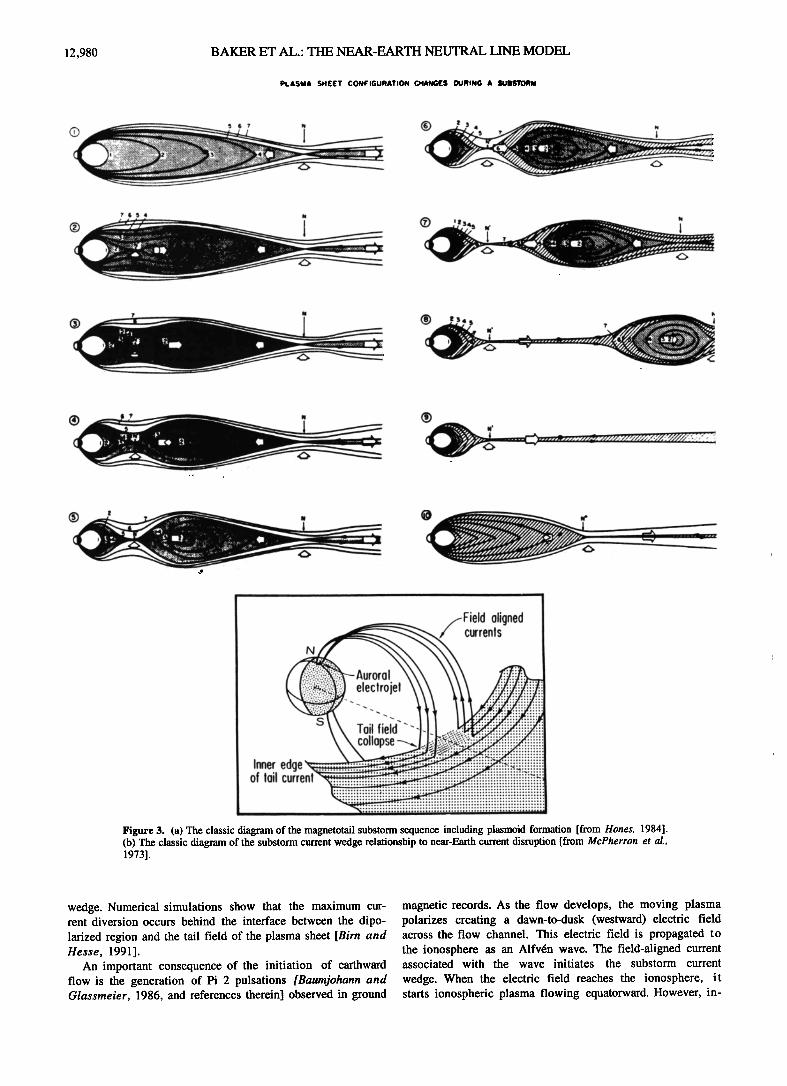
end. As reconnection proceeds, closed magnetic field lines in the plasma sheet are reconnected forming loops around the O line and shorter closed field lines moving earthward from the X line [Fairfield, 1984]. Within the plasma sheet, plasma flows vertically into the X line and then horizontally out of the X line. On the tailward side it fills the loops of field sur- rounding the O line causing it to move tailward away from the X line stretching the remaining closed field lines of the plasma sheet that still surround the plasmoid. Figure 3a is the classic diagram showing this substorm sequence in the magnetotail [Hones, 1984].
The substorm current wedge is a predicted consequence of a localized X line [McPherron et al., 1973]. When the X line forms, the net current across the tail in the meridian of the X
line is decreased [Birn and Hesse, 1991]. The original current may be diverted in several different ways: earthward of the X line enhancing the inner edge of the tail current [Baker and McPherron, 1990], tailward of the X line along the center of the plasmoid, and to the ionosphere along field lines con- necting to the ends of the X line. This is the beginning of the substorm. current wedge as shown in Figure 3b. Plasma flowing earthward from the X line will occupy a narrow channel with strong velocity shears at the edge of the chan- nel. The sense of these shears is such that tail current will
be diverted into the growing substorm current wedge. When the flow reaches the strong field in the inner magnetosphere, it is slowed and the embedded field is compressed. The flow then splits and begins to move around the Earth. The vortic- ity associated with the splitting of the flow toward dawn and dusk diverts additional tail current into the substorm current
12,980 BAKER ET AL.: THE NEAR-EARTH NEUTRAL LINE MODEL
PLASMA SHEET CONFIGURATION CHANGES DURING A SUBSTORM
(• 1•$45 W
/-Field aligned
s\• Tail fie•'d"- \ •. collapse ---.,,
I nne.redge "•
Figure 3. (a) The classic diagram of the magnetotail substorm sequence including plasmoid formation [from Hones, 1984]. (b) The classic diagram of the substorm current wedge relationship to near-Earth current disruption [from McPherron et al., 1973].
wedge. Numerical simulations show that the maximum cur- rent diversion occurs behind the interface between the dipo- larized region and the tail field of the plasma sheet [Birn and Hesse, 1991].
An important consequence of the initiation of earthward flow is the generation of Pi 2 pulsations [Baumjohann and Glassmeier, 1986, and references therein] observed in ground
magnetic records. As the flow develops, the moving plasma polarizes creating a dawn-to-dusk (westward)electric field across the flow channel. This electric field is propagated to the ionosphere as an Alfv6n wave. The field-aligned current associated with the wave initiates the substorm current
wedge. When the electric field reaches the ionosphere, it starts ionospheric plasma flowing equatorward. However, in-

BAKER ET AL.: THE NEAR-EARTH NEUTRAL LINE MODEL 12,981
ertia retards the flow, and the electric field is mostly re- flected. The initial wave reverberates between the plasma sheet and ionosphere a number of times eventually establish- ing the dc current necessary to drive the equatorward flow against ionospheric resistance.
Particle precipitation is expected in the turbulent region of stagnation and flow diversion behind the interface be- tween dipolar and tail-like fields. This precipitation creates the unstructured aurora of the auroral bulge [Nakamura et al., 1992]. The interface projects as the poleward edge of the auroral bulge [see Rostoker, 1991]. Subsequent earthward flow adds additional magnetic flux to the region of dipolar field and the interface moves tailward. Its projection into the ionosphere moves poleward expanding the region of bright luminosity. Within the auroral bulge ionospheric conductiv- ity is much enhanced relative to the surrounding ionosphere. A westward electric field produced by the high-velocity earthward flow projects into this region and drives Pedersen currents westward and Hall currents poleward. Because of the strong conductivity gradients at the latitudinal edges of the auroral bulge, the Hall current cannot close in the iono- sphere and the bulge polarizes becoming a Cowling channel [Coroniti and Kennel, 1972a; Baumjohann et al., 1981]. At the western end of the channel there is a strong upward field- aligned current returning diverted tail current to the equatorial plane. Above a threshold current density the magnetosphere is unable to supply sufficient electrons to carry the required current, and an instability develops creating a field-aligned potential drop [Knight, 1973]. This potential accelerates electrons downward causing the auroral surge, and accelerates oxygen atoms upward injecting them into the magnetosphere [Daglis et al., 1991]. A similar effect can occur in the out- ward sheet of field-aligned current at the poleward edge of the auroral bulge. At locations where the outward current density is sufficiently high, potential drops can develop and surge- like forms will result.
At distances beyond the interface between dipolar and tail- like field lines (but earthward of the X line), the plasma flows associated with the near-Earth X line project into the ionosphere as equatorward flows. Above and below the X line plasma flows toward the neutral sheet also projecting as equatorward motion. Most auroral arcs probably map within this active region. The details of the arc formation are likely dictated by low-altitude processes such that individual arcs do not necessarily have a corresponding structure in the magne- totail. In the ionosphere the distinguishing characteristic of this phase of the substorm is the absence of flow across the separatrix between open and closed field lines; that is, there is not reconnection of open field lines. Ionospheric plasma in the polar cap will be flowing antisunward, but the bound- ary of open and closed field lines moves equatorward at the same rate as the plasma convects on either side of the boundary. Above and below the X line the plasma sheet thins as closed field lines are progressively cut, and their plasma is accelerated both earthward and tailward [Nishida et al., 1981].
As reconnection proceeds within the plasma sheet, fewer and fewer closed field lines separate the X line from the separatrix defining the plasma sheet boundary. In the iono- sphere the auroral bulge expands poleward as well as east- west. If the plasma density near the plasma sheet outer edge is low, precipitation can be quite weak, and thus it is not necessary that the visible bulge reaches the boundary. The
plasmoid continues to grow as its central axis moves radi- ally away from the Earth. In the ionosphere the plasmoJd and the X line that defines its inner edge are not visible. However, field lines that map just earthward of the X line and just tailward of the last reconnected field lines (well be- yond the O line) must contain plasma of quite different prop- erties. Within 5-15 min, reconnection reaches the boundary of the plasma sheet, and the last closed field lines begin to be severed [Coroniti, 1985; Baker and McPherron, 1990]. Plasma in the ionosphere begins to flow across the polar cap boundary. At this time the near-Earth X line connects to the distant X line and the plasmoid begins to be enfolded by recently reconnected lobe field lines. The plasmoid is then free to move tailward. As it departs, it creates a thin plasma sheet extending some distance tailward of the original X line. At the center of this sheet southward magnetic flux is transported tailward. At the edges of the sheet tailward flow from the X line becomes field-aligned.
If the IMF remains southward, the above situation could
remain stable provided that closed flux flows out of the dipo- lar region to the dayside as fast as it is added. This may ex- plain the observations of convection bays in which strong electrojet activity continues without evidence of substorm expansion [Pytte et al., 1978; Sergeev et al., this issue]. It is more likely, however, that the flow channel earthward of the X line will be clogged by reconnected flux on the night side. This situation is the inverse of dayside erosion, that is, the nightside magnetosphere grows more dipolar by accretion of closed field lines. If the IMF turns northward, dayside recon- nection stops and the internal convection transporting flux to the dayside slows down. Again, it might be expected that the X line will move tailward to make room for additional
closed flux. In either case, as the X line moves away from the Earth the plasma flow reverses locally as the X line passes and earthward of the X line the plasma sheet expands. This is the beginning of the recovery phase.
There is no reason to expect that reconnection will al- ways continue sufficiently long at a given X and O line pair to reach the plasma sheet boundary. If it stops, a small plasmoid will be produced in the plasma sheet. Closed field lines that wrap around this structure may provide sufficient tension to overcome the radial pressure gradients in the plasma sheet and will pull it earthward. In this case, south- ward flux will appear to be transported earthward everywhere tailward of the O line. Such events may explain pseu- dobreakups. In the framework of the NENL model, these are defined as bursts of reconnection that do not sever the last
closed field lines and hence do not produce a detached plas- moid. If subsequently a new X and O line pair forms earth- ward of the first, and the X line succeeds in reconnecting through the plasma sheet a disconnected plasmoid with com- plex internal structure will be produced and travel down the tail. These entities would be expected to evolve with adja- cent O lines attracting each other and eventually coalescing into a single O line [Richardson et al., 1987]. Conceivably several X and O line pairs could exist simultaneously, al- though how their flows would interact and affect each other if they were all active is not clear. Once disconnection takes place any events occurring within the plasmoid would be in- visible in the ionosphere. earthward of the disconnection the earthward flow and northward flux make it unlikely that addi- tional X and O lines would form.
As shown in Figure 1, a key ingredient of any viable sub-

12,982 BAKER ET AL.: THE NEAR-EARTH NEUTRAL LINE MODEL
storm model is the explosive dissipation that occurs in the expansion phase. Initially at least, the dissipation is more localized on the nightside of the Earth than is the storage, or loading, phase. The dominant ionospheric energy dissipa- tion is in the form of Joule heating and particle precipita- tion. In the magnetotail, effects include plasma sheet heat- ing, ring current injection, energetic particle acceleration, and plasmoid formation and release. In addition to plasmoids that carry magnetotail energy back to the solar wind [Hones et al., 1984a], a significant portion of the stored energy may also be so far tailward that it is not geoeffective (and there- fore this far-tail energy is returned to the solar wind as well). Hesse [1995] has argued that lobe energy beyond the near- tail reconnection site does not contribute substantially to near-Earth substorm effects.
2.4. Recovery Phase
Within the NENL framework, the recovery phase begins when the plasmoid starts to retreat tailward [e.g., Hones et al., 1984a]. In the midtail region (15-30 RE), the rapid plasma sheet expansion [Sauvaud et al., 1984] and earthward plasma flow [Hones, 1992] have been interpreted to be sig- natures of the recovery phase. Statistically, such plasma sheet expansions are found over a large range of z values, indicating that the thickness change is quite large. On aver- age, the plasma sheet recovery was found to occur about 45 min after the substorm onset as timed from the AE index.
These plasma sheet expansions were also found to correlate with energetic particle flux enhancements at geostationary orbit. Such enhancements were found in all local time sec-
tors other than local noon, and they were interpreted to be caused by relatively small magnetic field reconfiguration events associated with the midtail plasma sheet expansions [Baker et al., 1994b]. The tailward motion is further sup- ported by the observations of plasmoids or traveling com- pression regions in the distant tail [Slavin et al., 1993] as will be discussed in section 3.6.
In the near-Earth tail, the recovery phase appears as the decay of the substorm current wedge and the subsequent slow recovery of the magnetic field toward the quiet time configu ration after the neutral line has started its tailward motion.
The rebuilding of the near-tail current system has been found to last for more than 2 hours. Perhaps surprisingly, both the start time of the field recovery and its duration seem to be controlled by internal magnetospheric processes rather than variations in the IMF direction [Pulkkinen et al., 1994]. How- ever, the final state strongly depends, of course, on the ex- ternal driving conditions.
Using ground-based data, several other definitions for the substorm recovery phase can be found: It is often defined as the time when the substorm electrojet starts to decay (maximum in the AE index) or as the time when the auroras
reach their most poleward extent [see Pellinen et al., 1992]. Both usually appear before the tailward retreat of the neutral line [Baker et al., 1994b], whereas these two definitions roughly coincide.
The auroral behavior during the recovery phase shows in- teresting features whose significance to the NENL scenario has not yet been fully clarified. During this period, the
auroral activity moves from the (pre-midnight) midnight sec- tor to the morning sector, where diffuse pulsating patches, pulsating auroras, or omega bands [e.g., Davidson, 1990; Opgenoorth et al., 1983] are often observed. In the AE index, a two-step behavior can be identified: A decrease in the ac- tivity is caused by the substorm current wedge and auroral bulge decay. The subsequent slower decrease is due to the morning sector oval activation, which maintains the activity at an elevated level.
The precipitation patterns in the morning sector are con- siderably different from those found in the evening sector during growth or expansion phases. In the morning sector, the Hall conductivity is high, whereas the Pedersen conduc- tivity remains at a relatively low level. This results in con- ductivity ratio of-4 broadly throughout the morning sector, which is about twice the typical values (other than in arcs) found in the e•,ening sector expansion phase auroral iono- sphere [Opgenoorth et al., 1994]. This suggests that the pre- cipitation during the recovery phase into the morning sector is more energetic than that into the evening sector during earlier substorm phases (see Plate 1).
The ionospheric recovery phase signatures need not al- ways be temporally separated from the expansion phase fea- tures: Often, expansion phase auroral forms are still visible in the evening sector simultaneously with recovery phase characteristics already appearing in the morning sector [Pulkkinen et al., 1991c]. On the other hand, recovery phase signatures may be observable at higher latitudes and in the morning sector, while at lower latitudes and in the evening sector signatures of a new growth phase are already visible [Pellinen et al., 1992].
During many recovery phases, a new discrete precipitation region is formed poleward of the preexisting auroral oval. As shown in Plate 2, this "double oval" is separated from the main oval by a few-degree-wide gap almost void of precipita- tion [Elphinstone et al., 1995b]. Magnetic field modeling re- sults indicate that the equatorward (preexisting) oval, to- gether with the hard precipitation and omega bands, maps to the inner magnetotail close to geostationary orbit [Pulkkinen et al., 199!c]. The precipitation gap is associated with the midtail region (-20-40 RE) but also the poleward oval maps mostly within lunar distance [Pulkkinen et al., 1995b]. From the magnetic field pattern suggested by the NENL model, it is not clear what causes the region of weak luminosity between the two bright bands. It could be envi- sioned that the more poleward band maps to subsequently larger distances as the neutral line retreats, but this remains an open question.
Figure 4 shows a comparison of the different timescales associated with recovery phase observations in various mag- netospheric regions. The midtail recovery occurs relatively rapidly, over a period of few tens of minutes [Baker et al., 1994b], whereas the ionospheric and near-tail observations show a slow and gradual decay toward the quiet time state rPulkkinen et al., 1994b]. Both the similar recovery times- cales and magnetic mapping studies suggest that the morn- ing sector activation is connected with the near-Earth mag- netic field recovery (see Figure 4). It could be envisioned that the increasing current system drives high-energy parti- cles into the loss cone giving rise to the auroral patterns in the morning sector. However, it is not clear either what the precipitation process is or what in the tail causes the sig- nificant dawn-dusk asymmetry observed in the auroral oval.

BAKER ET AL.' THE NEAR-EARTH NEUTRAL LINE MODEL 12,983
Evening Sector
1986-04-01 1842 UT
60 Height-integrated conductivity • Hall
• I •- Pealersen • 40 ''
o
68 70 72
Latitude of field line at 1t30 kin
5 Ratio between Hall and Pedersen
Evening Sector
1986-04-01 1904 UT
Morning Sector
• Height-integrated conductivity
.
68 70 72
Latitude of field line at 100 km
5 Ratio between Hall and Pealersen
4
3
2
1
0 68 70 72
Latitude of field line at 100 km
1986-04-03 0147 UT
Height-integrated conductivity
68 70 72
Latitude of field line at 100 km
Ratio between Hall and Pedersen
68 70 72 68 70
Latitude of field line at 100 km Latitude of field line at I00 km
Plate 1. Viking images illustrating the (top) auroral situations during three EISCAT latitude scans through an evening sector arc (ESA), a westward traveling surge (WTS), and intense morning sector precipitation (IMSP). These are compared with the (middle) latitude distributions of height-integrated Hall and Pedersen conductivities, and (bottom) their ratios as derived from EISCAT measurements [from Opgenoorth et al., 1994].
3. Recent Observations and Concerns With the NENL Model
3.1. Linking Tail and Low-Altitude Substorm Effects
Within the last decade or so there have been many im- provements in space-based and ground-based observations of magnetospheric processes. This has included global auroral images, imaging riometers, arrays of all-sky cameras, and
ground radar systems. These tools have been combined with the latest data distribution and data analysis tools to permit major strides in the study of substorms. Individual research- ers using the latest in graphic visualization tools as well as group participants in Coordinated Data Analysis Workshops [e.g., McGuire et al., 1993] have been able to perform exten- sive multispacecraft studies [Lopez et al., 1993; Pulkkinen et al., 1991a].
Several authors over the past several years have come to the conclusion that substorms initiate in the inner magneto- sphere (6-8 RE). They seem to accept the notion of a highly

ooo
800
600
400
200
o 15:oo
•... ?•.•¾-- •..• -:: •,•.i :•'* 0 ' ß ! •'•;•;•E •': *•' --'5-.', ' !•??•• •' ',. •'...• -.• ..... ,..• .
•E 80 80 .
•' • . • ..,
"2 0 3 2 . _ __ e ......... '.3 • 1822'-'1•2 :UT 0759-08• UT
I --- I ................... I I ' ' ' I AE April
I I I I ....
20:00 01:00 06:00 11:00 UT
ß . :;•.. • , ..
. •:,. >•:: ,, .. :...• .
,,
22' :-2334 UT 1213'•1•6 UT 1417-1458 UT
Plate 2. Illustration of the double auroral oval seen in Viking images during a series of substorms on April 9-10, 1986 [after Elphinstone et al., 1995a].
stressed, tail-like configuration near the Earth [Kaufinann, 1987; Baker and McPherron, 1990; Baker and Pulkkinen,
1991] developing during the growth phase as a prelude to substorm initiation. Several studies have used AMFFEJCCE
data to argue that the thin, intense current sheet at the inner edge of the plasma sheet rapidly and violently "disrupts" at substorm onset [Takahashi et al., 1987; Lui et al., 1988, 1990; Lopez and Lui, 1990; Lopez et al., 1990; Ohtani et al., 1992a]. As also summarized by Lui [1991], the current dis- ruption model of substorms postulates that a plasma insta- bility [Lui et al., 1990] of the cross-tail current grows and spreads radially outward from the near-tail region [Lui et al., 1992; Lopez et al., 1992], and that the growth of this insta- bility powers the near-Earth field reconfiguration. The NENL model takes an opposite view, proposing that these pro-
cesses are powered from an outside source (a neutral line lo- cated tailward of the near-Earth current sheet disruption re- gion).
Jacquey et al. [1991] and Ohtani et al. [1992b] used ISEE 1 and 2 data at somewhat larger geocentric distances to support the idea of current disruption and outward radial propagation of such a disruption. The partial breakdown and tailward propagation of the disruption region can account for meas- urements both at geostationary orbit (GEOS) and in the near- tail (ISEE) according to Jacquey et al. [ 1993]. Indeed, the magnetic signatures seen by ISEE in many cases seem very supportive of such simple disruption and propagation scenar- ios; other more complex substorm events are not as con- vincirig, however [see Jacquey and Sauvaud, 1993].
A rather comprehensive study of a large substorm event

BAKER ET AL.' THE NEAR-EARTH NEUTRAL LINE MODEL 12,985
o
-200
•= -400 -600
10 -•
10 -z
10
0
-10
29 MARCH 1979
............................ ....................
:::::::::::::::::::::::::::::::::::::::::::::::::::::::::::::: ISEE-2
• Plasma she,_.,et recovery
ß
SEE-2
1.30 2.00 2.30 3.00 3.30 4.00 4.30 UT
i-....i .... i .... i .... i .... i .... i .... i .... i .... i .... i .... i ß ß ß ...i
80
7O
$0 ...............
50 4O
-;50 -15 0 15 ;50 45 60 75 90 105 120 1;55 150
Time [minutes from onset]
Figure 4. Timing of the substorm recovery at several locations.
was presented by Baker et al. [1993]. They used numerous high-altitude satellites as well as global auroral images and ground-based data to study the substorm growth and early ex- pansion phase. The magnetic modeling methods of Pulkki- nen et al. [1991a,b] were also employed. Figure 5 summarizes
•s$ LATE GROWTH PHASE
SgI•IRS•EONRTM FL .... EAR ..... , . •sEo uGrlceONo• F AC)
OFINTENSE ] II I I I II I I I I I I'• CROSS-TAIL I II I I I II I I I I I I "INITIAL CURRENT III I I I II I I I I I I NEUTRAL
EXPANSION PHASE
FLOW SHEAR
• INITIAL NEUT•L
• • LINE (X-LINE) Figure 5. A schematic of the near-Earth plasma sheet and cross-tail currents during the (top) late growth phase and (bottom) early expansion phase of a large substorm (adapted from Baker et al. [1993]).
the principal findings of the Baker et al. [1993] study. The substorm was simultaneously imaged in the southern auroral oval by DE 1 and the northern auroral oval by Viking. The set of spacecraft near local midnight in the radial range 5-9 RE made it possible to study the strong cross-tail current de- velopment during the substorm growth phase (see also Fig- ure 2 describing the same event) and the current disruption and current wedge development during the expansion phase. The time-evolving magnetic field model permitted mapping of observed auroral features out into the magnetospheric equatorial plane. There was both a dominant-eastward and a weaker westward progression of activity following the ex- pansion phase. A clear latitudinal separation (_> 10 ø) of the initial region of auroral brightening and the region of in- tense westward electrojet current was identified. The com- bined ground, near-tail, and imaging data provided the op- portunity to investigate tail current development, field line mapping, and substorm onset mechanisms. Evidence was found for strong current enhancement within the near-tail plasma sheet during the late growth phase [Baker and McPherron, 1990] and strong current disruption and field- aligned current formation from deeper in the tail at substorm onset. Baker et al. [1993] invoked a model of magnetic neu- tral line formation in the late growth phase which causes plasma sheet current diversion before the substorm onset. The expansion phase onset was concluded to occur when re- connection of lobelike magnetic field lines began, roughly concurrent with the cross-tail current disruption in the inner plasma sheet region.
The near-Earth neutral line model has been remarkably successful in organizing observation in the near-Earth and distant tail. In fact, the outstanding success of the model was the prediction of the structure of plasmoids and flux ropes as they were subsequently observed in the distant tail [Hones et al., 1984a; Baker et al., 1987]. The model has also provided an observational basis motivating an extensive body of work in numerical simulation of space plasmas. Although these simulations do not in detail model the microscopic processes responsible for magnetic reconnection or nonadiabatic particle motion, they reproduce remarkably well the observations summarized by the NENL model.
At low altitudes the NENL model is less successful in or-
ganizing the host of phenomena observed in satellite auroral images (R. D. Elphinstone et al., What is a global auroral substorm, submitted to Reviews of Geophysics, 1995), or the details of development of the auroral electrojets [Rostoker, 1979]. However, on a macroscopic scale the NENL model does predict many aspects of substorm development. For ex- ample, the recent simulation results of Raeder et al. [1995] and Fedderet al. [1995] that on a large scale are consistent with the predictions of the NENL model, include the sub- stom current wedge, the auroral bulge, the poleward expan- sion of the aurora, the westward traveling surge, and a double oval structure.
A major problem in substorm studies is the mapping of auroral breakup to the equatorial plane. Many researchers at- tempt to project the X line to the breakup arc. This appears to be quite difficult. The distinguishing signature of the NENL, namely, tailward flow threaded by southward magnetic field, is seldom seen inside of-20 RE [Baumjohann et al., 1990; Angelopoulos et al., 1993], suggesting that the X line typically forms beyond this distance. However, auroral lumi- nosity just before auroral breakup is difficult to map beyond

12,986 BAKER ET AL.: THE NEAR-EARTH NEUTRAL LINE MODEL
10-15 RE, even with very stretched field configurations [Pulkkinen et al., 1991a]. Instead, the breakup arc appears to map to the thin current sheet just beyond synchronous orbit, a location which is almost certainly near the inner edge of the tail current, and well earthward of the probable location of the X line. However, reconnection at the NENL would not cause significant field-aligned flows; rather, the most nota- ble signatures are the tailward and earthward flows within the neutral sheet. Thus it is only when this flow travels earth- ward driving FAC that a ground onset is seen. In this sense, the onset arc mapping earthward of the NENL is a quite natu- ral result of the reconnection process.
The above discussion relates also to another NENL prob- lem in the view of some researchers, namely that the field line on which the breakup occurs is almost certainly closed. Viking auroral images show a wide auroral oval with breakup beginning in the equatorward region of luminosity [Elphinstone et al., 1995b; Baker et al., 1993]. Also, meridian scanning photometers on the ground often show substantial luminosity more than 5 ø poleward of the breakup arc [Samson et al., 1992]. Typically, it takes 5-10 min for the auroral disturbance to propagate poleward from the region of onset to the high-latitude region whose poleward border is taken to be the polar cap boundary. The problem arises be- cause in some previous versions of the NENL model auroral expansion onset was associated with the release of the plas- moid by severance of the last closed field line. Clearly, this association of plasmoid release with auroral onset cannot be correct if reconnection of open field lines does not begin un- til the auroral expansion reaches the polar cap boundary [Baker and McPherron, 1990].
The realization that the arc that brightens first during a substorm should map near the inner edge of the plasma sheet [Samson et al., 1993; Elphinstone et al., 1991; Galperin and Feldstein, 1991; Mauk and Meng, 1991; Roux et al., 1991 ] suggests that most often the substorm expansion is a phe- nomenon that is associated with closed plasma sheet field lines that are located near the transitional region between dipole-like and tail-like field lines. The breakup arc is also associated with the Harang discontinuity [Koskinen and Pulkkinen, 1995] and the outward field-aligned current in this region. It is probably no coincidence that the outward cur- rent of the substorm current wedge has the same sense and occurs in the same region as this current. However, the level of details in the description of near-tail and low-altitude phe- nomena within the NENL model is not sufficient to explain this fact.
Recently, Kan [1993] has discussed a magnetosphere- ionosphere coupling (MIC)model of substorms. In this view, the substorm expansion onset occurs as a consequence of the ionospheric response to enhanced magnetospheric convection. It is asserted in the MIC model and other near-
Earth models that no new X line is needed at expansion on- set. Instead, the explosive dissipation of the substorm onset results from an "unloading instability" or disruption within the current wedge region near local midnight. This school of thought asserts that the energy stored on closed field lines of the plasma sheet can power all, or most, of the substorm expansion phase.
Hesse and Birn [1993] reached a quite robust and different conclusion concerning the source of substorm power. They found that the current disruption and magnetic field dipolari-
zation that occur in the inner portion of the plasma sheet typically require substantial energy inflow into the disrup- tion region from outside. Hesse and Birn [1993] therefore ar- gue that a large-scale magnetotail instability is required to provide the energy which flows into the near-tail, closed field line region.
Multiple auroral arcs are a problem for the NENL model as is true for most models. Such arcs are often observed drifting equatorward during the substorm growth phase, and the con- ventional view is that it is the most equatorward arc that is activated at onset. If this arc projects well earthward of the X line, then the remaining arcs are presumably between the re- gion of activation and the X line. This is the region of strong earthward flow out of the X line. It is difficult to un- derstand how such a flow could exist through the region of the magnetospheric projection of the arcs and not cause any disruption in the ionosphere.
The NENL picture is made much more complicated by con-
sideration of finite By effects. Typically, the plasma sheet contains a finite By component transverse to the tail axis. In its presence reconnection produces a flux rope rather than a simple plasmoid [Hughes and Sibeck, 1987; Slavin et al.,
1995]. If the sign of By is positive the flux rope will be connected to the northern hemisphere at the dawn end and the southern hemisphere at the dusk end. Projected into a meridian plane the flux rope will have a form similar to that of a plasmoid except that there will be field lines at the ends connected to the ionosphere. If reconnection proceeds at the same rate everywhere along the flux rope the structure will grow in a uniform manner with ionospheric connectivity only at its ends. More likely, however, the reconnection rate is fastest near the center of the flux rope and closed flux is added more rapidly there than at the ends. Also, the length of the flux rope probably increases with time carrying re- connection to other meridians in the tail. The evolving structure will be very complex with different layers of flux being added at different locations. Each layer will be con- nected to different polar regions at its two ends, and there will be multiple field lines connecting each layer to the ionospheres. In this more realistic geometry, the "neutral line" becomes a finite size "neutral region" within which the reconnection-associated energy dissipation occurs.
3.2. High-Speed Plasma Sheet Flows
The realization that during the course of magnetospheric substorms the outermost parts of the plasma sheet are often populated by counterstreaming beams [De Coster and Frank, 1979; Forbes et al., 1981] led to the definition of the plasma sheet boundary layer as an important region of magnetotail dynamics. Recent studies of the relative importance of the PSBL and CPS by Baumjohann et al. [1989, 1990] have re- vealed that high-speed flows occur with low but statistically significant occurrence probability in all plasma sheet re- gions, and that when the flow velocity is high the occur- rence rate of fast flows at the plasma sheet center is compa- rable to that in the boundary layer.
Fast neutral sheet flows are qualitatively different from the boundary layer flows: They are predominantly due to the drift of a single-ion population [Nakamura et al., 1991 ], rather than the imbalance of counterstreaming beams, as is typi- cally the case at the plasma sheet boundary [De Coster and Frank, 1979; Eastman et al., 1984]. Baumjohann et al. [1990]

BAKER ET AL.' THE NEAR-EARTH NEUTRAL LINE MODEL 12,987
showed that in the outer central plasma sheet and the plasma sheet boundary layer, the high-speed flows are nearly field- aligned. In the neighborhood of the neutral sheet about 70% of all high-speed flows have a dominant component perpen- dicular to the ambient magnetic field. Thus in the inner cen- tral plasma sheet most of the high-speed plasma transport occurs across field lines rather than along them.
Fast flows near the neutral sheet were shown to have an
average 10-min duration and a substructure of the order of 1 min [Angelopoulos et al., 1992]. The 10-min timescale struc- tures were termed bursty bulk flows (BBFs) and the 1-min structures were called flow bursts. Flow bursts correlate posi- tively with magnetic field dipolarizations and ion tempera- ture increases. The importance of the fast flows for magneto- tail transport of energy and magnetic flux was demonstrated by Angelopoulos et al. [1994a]. BBFs are responsible for 60- 100% of the measured earthward mass energy and magnetic flux transport past the satellite in the high-beta plasma sheet, even if they are observed only 10-15% of the time in the midnight plasma sheet. As significant earthward energy and flux transport is expected during substorms, BBFs are good candidates to attempt to correlate with geomagnetic ac- tivity. Indeed, a positive correlation between fast neutral sheet flows and AE was observed by Baumjohann et al. [1989]. BBF occurrence rates and AE were correlated by An- gelopoulos et al. [1994b]. A one-to-one correlation between BBFs and substorm phase is not apparent [Angelopoulos et al., 1992] and represents an area of active research today.
The newest results from the IRM and ISEE satellites show
that most of the plasma transport along the length of the tail is achieved by means of high-speed flow bursts. The left-hand panel of Figure 6 shows the occurrence rates of high-speed flows (bulk flows in excess of 400 km/s) in two different layers of the plasma sheet for different ranges of AE again using the IRM tail survey data. If one averages over all levels of disturbance, the following picture emerges: From all 4.5-s ion flow samples taken in the plasma sheet boundary layer, about 5% exhibit velocities in excess of 400 km/s. This rate drops to 1% in the outer central plasma sheet (not shown here) but rises again to an average of about 3% of the samples obtained in the inner central plasma sheet,
that is, the neighborhood of the neutral sheet. Thus there is a 3:1:5 chance to detect ion flows with velocities greater than 400 km/s when going from the neutral sheet to the boundary layer. However, if one considers the behavior of the fast flow occurrence rate during substorm activity, it var- ies by less than a factor of 2 in the plasma sheet boundary layer [Baumjohann et al., 1990]. It is only near the neutral sheet that the fast flow occurrence rate strongly increases with increasing AE, reaching the same or even slightly higher levels than in the plasma sheet boundary layer during strongly disturbed conditions. Thus the high-speed plasma flow in the plasma sheet boundary layer is less affected by substorm activity than that near the neutral sheet, similar to the behavior of the ion temperature.
From all high-speed ion flows with the velocity in excess of 400 km/s observed by the IRM satellite during the two 4- month periods it spent in the magnetotail at distances be- tween 9 and 19 R E, the overwhelming majority was directed earthward. Less than 100 samples had a distinct tailward component. The same holds for the ISEE observation in the same distance range [Angelopoulos et al., 1993]. However, i n the ISEE data set, about 20% of the samples taken between 19 and 22 R E had a distinct tailward component. These ob- servations indicate that a near-Earth neutral line is typically located outside of-20 R E , however, on rare occasions it may come as close to the Earth as 13 R E [McPherron and Manka, 1985; Paschmann et al., 1985; Lin et al., 1991].
The right-hand panel of Figure 5 shows that high-speed flows are rather bursty. The majority of all flows stay unin- terruptedly at high-speed levels for no more than 10 s. About 35% of all flow bursts were observed during only one 4.5 s measurement interval. Typically, several of these high- speed flow bursts are grouped into an event lasting for some minutes. Of course, with data from just one satellite one is unable to decide whether the burstiness results from temporal or spatial variations, that is, whether the ions in the whole plasma sheet move at such high velocities for short periods of time or whether the short durations are caused by rapid traversals of thin layers of plasma streaming at high ve- locities and intermittent regions of slower plasma motion.
Figure 7 shows a superposed epoch analysis of the behav-
8. 40. w I * ' ! *
30.
20.
10.
O. , t , I , O. O. 300. 600. 900. O. 10. 20. 30. 40. 50. 60.
AE Index, nT Iligh-Speed Flow Duration, See Figure 6. (left) Occurrence rate (in percent) of high-speed ion bulk flow samples in the inner central plasma sheet (solid line) and in the plasma sheet boundary layer (dashed line) as a function of the AE index. (right) Occurrence rate of high- speed ion bulk flow samples in the plasma sheet as a function of continuous duration of the flow event [from Baumjohann et al., 1990].

12,988 BAKER ET AL.' THE NEAR-EARTH NEUTRAL LINE MODEL
250. o.3
200. .
5o. 0.25
o.o ,oo.
•0. • 0.10 -30. -20. -10. o. 10. 20. 30. -30. -20. -10. o. 10. 20. •0.
•inutes Around Plow Burst •inutes Around Plow Burst
•igure •. R•sults o• a sup•os•d •poch •alysis applied on plasma and magnetic •ld data •ound more than 100 bursty bulk flow (BBF) •v•nts obs•d by IRM in th• inner c•ntr• plasma sh•t du6ng 1985. Th• plasma and magnetic fi•ld data w•m tim•-c•nt•md •ound th• flow burst c•nt•r (t = 0) and averaged in 3-min bins •or -30 bins •or -30 • t •30 min.
ior of plasma and magnetic field around the center of more than 100 BBF events observed by the IRM satellite in 1985. The typical BBF event lasts about 10-15 min and is accom- panied by a strong dipolarization. Moreover, the plasma temperature also increases strongly during a BBF event. Al- together, a BBF event looks much the same as a substorm intensification, and it is quite reasonable to assume that it is caused by the same mechanism, namely a burst of reconnec- tion somewhere tailward of 20 R E, which heats the plasma and accelerates it earthward.
3.3. Thin Current Sheet Instability
The tail region responsible for the global reconfiguration during substorms has been extensively debated for the past decade. The results from AMPTE/CCE showed that processes in the near-Earth tail are closely correlated in time with the ground signatures of substorm onset [e.g., Lopez et al., 1990]. Empirical magnetic field models also suggested that the auroral brightenings map to the near-Earth tail [Pulkkinen et al., 1992, 1995b]. However, magnetic field and plasma observations have suggested that in most cases the neutral line is formed in the region beyond-20 RE, some- what tailward of the active inner tail region [Hones et al., 1984a]. Figure 8 summarizes schematically our present view of tail observations.
The changes in the near-Earth magnetic field configura- tion have been extensively studied using empirical magnetic field models. These studies utilized the Tsyganenko [1989] magnetic field models, which were modified to give a best fit to satellite magnetic field measurements [Pulkkinen et al., 1992]. The most important result from these modeling stud- ies was that during each of the growth phases modeled, a thin and intense current sheet was formed in the relatively near-Earth region. The inner edge of the thin current sheet was located between 6.5 and 9 R E (see Figure 9, for exam- ple). The minimum current sheet thickness was in many cases only a fraction of an RE, being comparable to the thermal ion Larmor radius in the corresponding lobe region (see also the review by Sergeev et al., [this issue]). Further- more, small regions of very small B z values were found to form in the near-Earth tail [Pulkkinen et al., 1992]. The pa-
rameter values obtained are in concert with direct satellite
observations [Sergeev, 1992; Sanny et al., 1994]. Recent studies of substorms have included estimates of
current sheet thicknesses at the inner edge of the plasma sheet and suggestions of an "explosive" growth phase [Ohtani et al., 1992a]. Also, recent studies by Mitchell et al. [1990] have attempted to identify the current carriers in the near-Earth plasma sheet during all parts of the growth phase. There has also been observational support for the idea [Buchner and Zelenyi, 1987] that "chaotization" of thermal electron motion may trigger near-Earth tearing mode onset [e.g., Pulkkinen et al., 1992]. Daglis et al. [1991, 1992] have
GROWTH
INNER EDGE EARTHWARD
?•___ ------ PLASMA •- _ • • • • • • PS THINNING ,•,/SHEET SW M'PAUSE
DAYS,DE I RECONNECTON | IMF
TAIL CURRENT SHEET
LATE GROWTH
NENL ON RECONNECTION CLOSED FIELD • FLOW DURING
RECONNECTION
CURRENT DIVERSION WffHIN CURRENT SHEET
ONSET AND
EXPANSION -;. NENL ON OPEN' FIELD LINES
NEG. H-BAY Pi2 .•• PULSATIONS •
BRIGHTENI DIPOLARIZATION • AURORAL .'
FAST TAILWARD FLOWS
TURBULENCE FLOW SHEAR INJECTIONS REGIONS
Figure 8. Schematic summary of obse•ations in the tail during the growth, onset, and expansion phases of substorms.

BAKER ET AL.' THE NEAR-EARTH NEUTRAL LINE MODEL 12,989
Substorm onset on May 3, 1986, 0111 UT
Equatorial plane projection: Tail satellite data:
substorm current wedge
Magnetic field model: Inner edge of the
thin current sheet 40 (B min -- 2.1 nT, h min -- 0.2 Re)
-10
Earth/l ToSun
o111
10 2o Y
Dusk
Figure 9. Thin current sheet structure observed on May 3, 1986 [from Pulkkinen et al. 1995b].
examined the role of ionospheric ions in triggering ion tear- ing mode onset during substorms.
Several numerical modeling studies have recently empha- sized the importance of thin current sheets in the substorm process. Both MHD simulations [Voge et al., 1994] and two- dimensional kinetic simulations [Pritchett and Coroniti, 1994] have shown that changes in the boundary conditions (or changes in the convection electric field) can result in the formation of a very thin current sheet in the transition re- gion, where the tail-like field merges with the dipolar near- Earth field. These results are in concert with the empirical model results of the location, magnetic field, and current sheet thickness values. Furthermore, Birn et al. [ 1994] showed that thin current sheets can be formed even if the
plasma is relatively isotropic, contrary to what is often as- sumed.
Recent observations from midtail spacecraft have further illuminated the thin current sheet issue. Figure 10 shows the average behavior of the AE index, separately for those on- sets where IRM was located between 10 and 16 R E and those substorms during which the satellite was situated further out, at radial distances of 16 to 19 R E [Baumjohann et al., 1992]. The AE traces look quite similar for both sets of events, thus there seem to be no systematic differences or biases between the two radial distance ranges.
To show relative changes in the thickness of the central plasma sheet, it is easiest to determine the number of meas- urements where IRM was located in the central plasma sheet relative to the total number of (central plasma sheet, plasma sheet boundary layer, and lobe) samples and then look for temporal changes in the central plasma sheet occurrence rate
relative to substorm onset. Whenever the central plasma sheet thins, chances increase that the spacecraft will be in the plasma sheet boundary layer or lobe; thus the occurrence rate is an indirect measure of the central plasma sheet thick- ness.
The right-hand panel in Figure 10 shows the results of the superposed epoch analysis, again separately for the two dis- tance ranges, that is, those onsets where IRM was located between 10 and 16 RE and those substorms during which the satellite was situated further out, at 16-19 R E . The difference in the absolute numbers is readily explained by a larger ab- solute thickness of the central plasma sheet closer in. Throughout the whole region between 10 and 19 R E the thinning starts 30'45 min before substorm onset and per- sists throughout the growth phase. After substorm onset, the central plasma sheet expands. Note that the timescale of the averaging is not sufficient to judge whether the minimum thickness was obtained prior to, or after, the substorm on- set. Furthermore, Figure 12 combines two physically very different processes: The thinning during the growth phase is slow and linear, and thus the probability curve shown can be associated with the actual current sheet thickness. However
(on this timescale), the plasma sheet recovery is a step-like process. Thus the part of the curve after substorm onset is not a measure of actual current sheet thickness but rather a
measu.re of the probability that the plasma sheet recovery has occurred. These probabilities are in agreement with an- other statistical study by Baker et al. [1994b].
These results are consistent with the following scenario: During the growth phase, magnetic flux is added to the tail lobes, increasing the lobe pressure and stretching the tail

12,990 BAKER ET AL.: THE NEAR-EARTH NEUTRAL LINE MODEL
,500.
450.
400.
350.
• •00.
250.
P.,00. -45.
' I ' I *
o. 45. 90.
Minutes around Substorm Onset
1.0
--•
0.4 •
0.2 t -4.5.
: ß .
i -
ß •
I I I
o. 45. 90.
Minutes around Substorm Onset
Figure 10. (left) Superposed AE traces with respect to 19 substorm onsets during which IRM was located at 10<R<16 R E (solid line) and 20 onsets when the satellite was situated further out (16<R<19 R E, dashed line), constructed by averaging the 19 and 20 AE traces in 11.25-min bins. (right) Relative fraction of central plasma sheet samples with respect to the 10 or 20 substorm onsets, constructed by dividing the number of IRM measurements taken in the central plasma sheet by the total number of tail measurements in a particular 11.25-min bin. The dashed vertical lines mark substorm onset and the start of the recovery phase [from Baumjohann et al., 1992].
magnetic field. To keep the vertical pressure profile constant and to adapt to the changing magnetic field configuration, the plasma sheet must shrink in its vertical extent. Inde- pendently, the transition region near the inner edge of the plasma sheet develops a thin current sheet structure and low- B region, which is embedded in a thicker plasma sheet, and is formed as a response to the changing external conditions.
Theoretically, a key question for the substorm onset proc- ess determination has been the plasma and magnetic field conditions that would allow reconnection to proceed in the relatively near-Earth region, especially through the growth of the ion tearing mode. Various analyses have given results both in favor [Kuznetsova and Zelenyi, 1991] and against [Pellat et al., 1991] the growth of the ion tearing instability. To resolve this issue, more advanced theories and models treating all three dimensions and both particle species are needed, and better observations from the reconnection region are also required.
We propose that reconnection (presumably due to the growth of a tearing instability) initiates during the late growth phase in a region close to or tailward of about 20 R E , in the region of enhanced current density and thinned plasma sheet. In its initial state, reconnection would proceed slowly within the closed field line region. However, this would lead to a feedback effect, which would further enhance
the thinning of the plasma sheet at its inner edge, and would finally drive the inner tail to an unstable state [Baker and McPherron, 1990]. The instability that leads to the current sheet disruption at the inner edge of the plasma sheet is not yet clear; various kinetic and MHD instabilities have been suggested [e.g., Roux et al., 1991' Lui, this issue]. This view of the near-tail instability being driven by a more distant neutral line is further supported by observations during steady convection periods' In such events, a thin current sheet has been observed to form and remain stable in the
near-Earth tail for several hours, but in these cases the mid-
tail field is expanded, B z is large, and there are no signs of a neutral line [Sergeev et al., this issue].
It would only be at the stage when the inner tail is driven unstable that the onset signatures would be visible from ground: The plasma jetting from the neutral line toward the Earth causes a shear between the plasma flow regions, feed- ing field-aligned currents into and out of the ionosphere [Hesse and Birn, 1992]. These currents form the substorm current wedge and form a part of the auroral bulge in the ionosphere.
3.4. Substorm Triggering and Steady Convection
Soon after the southward turning of the IMF the growth phase of magnetospheric substorms begins: magnetic flux is stored in the magnetotail and the near-Earth plasma sheet thins while its current intensity increases. Soon after that a magnetospheric substorm develops [Russell and McPherron, 1973b], but the cause of that substorm is sometimes not an
internal, spontaneous instability but a solar-wind-driven one. Kokubun et al. [1977] noted that when the interplane- tary conditions are right (southward IMF) then the probabil- ity of an interplanetary discontinuity causing the onset of a substorm is very high (90%), whereas when there is no sig- nature of an enhanced ground activity resembling the growth phase, the probability of an interplanetary discontinuity triggering a substorm is very low (8%). Thus the precondi- tioning of the tail current sheet due to a previous southward turning of the IMF seems to be a necessary condition for substorm triggering. Caan et al. [1977] analyzed 18 events during which the IMF switched from northward, as it had been for 2 hours or more, to southward. A positive correla- tion between the amount of flux transported by the solar wind until substorm onset and the amplitude of the negative bay at onset was revealed. In addition, a class of events that
were triggered by positive changes in the (negative) IMF B z was revealed. In fact, 60% of the events studied were consis-
tent with a partial northward recovery of the IMF B z, indicat- ing that a substantial number of substorms are apparently triggered by IMF changes.

BAKER ET AL.: THE NEAR-EARTH NEUTRAL LINE MODEL 12,991
That a significant proportion of substorms are triggered by the IMF partial positive excursions can also be inferred by the superposed epoch analysis of 20 events by Caan et al. [1975]. The solar wind magnetic field behavior that cor- relates with the onset in that study is a partial positive ex- cursion of the B z component (see their Figure 1). More re- cently, McPherron et al. [1986b] revisited the question of substorm triggering from IMF changes and solar wind dis- continuities and concluded that 44% of the substorms studied
were associated with an excursion of the IMF northward, but
29% of the events occurred during periods of steady negative B a. That there exists a class of substorms that are associated with steady southward B a without any evidence of a solar wind trigger was pointed out also by Caan et al. [1977].
Drnitrieva and Sergeev [1983] also studied the issue of substorm triggering. They also found that 11 out of the 30 events that went into their analysis were not associated with a variation of the IMF B a to within the uncertainty of the timing. In addition, they showed that a further decrease of the B z component to more southward values does not cause a substorm, but rather causes an increase in the DP2 current
system. A similar magnitude positive excursion, however, is enough to trigger a substorm. The preferential response of the magnetotail to northward B z partial excursions after a pe- riod of southward B a indicates an important property of the system that needs to be addressed theoretically. In addition, Drnitrieva and Sergeev [1983] showed that for the 11 cases of steady southward IMF with no evidence of triggering, the du- ration of loading (i.e., the duration of the growth phase) is inversely proportional to the magnitude of the solar wind electric field. The duration of the growth phase times the so- lar wind electric field was constant. They interpreted their re- sults as evidence that the current sheet thickness ought to reach a critical value before it becomes spontaneously unsta- ble.
Prolonged periods of southward IMF lead to a state of the magnetosphere that has been termed a convection bay [Pytte et al., 1978] or a steady magnetospheric convection interval [Sergeev, 1977]. Such events may start with conventional substorms, but if the IMF is stable and prolonged (4-6 hours), then the magnetosphere can reach a state whereby the classical substorm signatures (Pi 2 pulsations, midlati- tude bays) are absent. A review of the state of the magneto- sphere under such conditions can be found in the work of Sergeev et al. [this issue]. Here we emphasize some pertinent recent results concerning convection bays and their associa- tion with substorms: (1) During convection bays the near- Earth tail (7-12 R E) resembles the substorm growth phase; the current sheet is thin and B z is small [Pulkkinen et al., 1992]. (2) The midtail plasma sheet (12-20 RE) is thick, and the equatorial B a is quite large relative to the average value [Sergeev et al., this issue]. The midtail plasma sheet resem- bles the recovery phase plasma sheet. (3) Transient activa- tions similar to the ones observed at substorm times are also
observed in the thick plasma sheet [Sergeev et al., 1990b]. These resemble the bursty flow events studied by Angelopou- los et al. [1994b] and by V. A. Sergeev et al. (Detection of localized plasma bubbles in the midtail plasma sheet, sub- mitted to Journal of Geophysical Research, 1995, hereinafter referred to as submitted manuscript). Occasionally, such flow bursts may protrude close enough to Earth to produce a clear injection signature in the geosynchronous region [Sergeev et
al., 1991]. According to Sergeev et al. [this issue] convection bays differ from classical substorms in that the source of the fast, earthward moving plasma is further tailward than during classical substorms. Although such fast flows contribute significantly to the flux and energy transport, they do not affect the magnetotail topology very much. The auroral sig- nature of a convection bay during which DE 1 images were available [Yahnin et al., 1994] is the one of a double auroral oval. Discrete arcs are the ones responsible for the luminos- ity at high latitudes [Yahnin et al., 1994] presumably map- ping to the tail activations tailward of the thick plasma sheet, whereas diffuse precipitation is mostly observed in the equatorial portion of the oval, presumably mapping to the near-Earth plasma sheet [Sergeev et al., 1991]. The above analyses reveal magnetotail activity during convection bays similar to that which occurs during substorms taking place at large distances from Earth and mapping to electrojet activa- tions at high latitudes. The fact that the activity is far from Earth is responsible for the lack of classical substorm signa- tures (Pi 2 values and midlatitude bays).
More recently, Lyons [this issue] argued that there are no clear cases of substorms that occur during intervals of steady southward IMF. According to this work, if an extended defi- nition of trigger is introduced in which not only B z partial northward recoveries but also IByl decreases are included, then there are no substorms that are not triggered. Although the work of Caan et al. [1977], McPherron et al. [1986b], and Dmitrieva and Sergeev [1983] addressed this issue and all these studies showed that indeed there are examples of sub- storms that do not have obvious triggers in the solar wind, a large statistical study that includes the addition of IByl reduc- tion as a possible trigger has not been performed yet. We look forward to such a study in the future.
The NENL model for substorms postulates that an insta- bility resulting from the increase of the cross-tail current causes interconnection of the magnetic field lines in the plasma sheet and eventually at the lobes. The onset of that interconnection is not necessarily due to an internal insta- bility, but it may be due to external factors. One puzzling aspect of the partial northward IMF triggering substorms is that such an IMF perturbation ought to cause a decrease in the solar wind electric field that operates across the tail, and a resulting decrease in the amount of flux transfer in the nightside magnetosphere. This results in reducing the rate of plasma sheet thinning, not increasing it. Given that thin plasma sheets ought to be more unstable to plasma instabili- ties, we conclude that it is counterintuitive that the partial northward IMF excursion should acts as a substorm trigger. Is it possible that it is the inductive response to the IMF changes that results in substorm onset? The physics of sub- storm triggering due to such IMF changes is very important not only because it is a very frequent phenomenon, but also because it may lead to better understanding of the instability that causes plasma sheet reconnection, and an enhancement of our ability to predict substorm activity.
3.5. Multiple Onsets, Localized Flow, and Pseudobreakups
A common feature of substorms observed on the ground is multiple onsets. If these occur before the main breakup, they are called pseudobreakups [Koskinen et al., 1993; Nakamura et

12,992 BAKER ET AL.: THE NEAR-EARTH NEUTRAL LINE MODEL
al., 1994b]. After onset they are referred to as intensifica- tions. There is evidence that each intensification occurs at
subsequently higher latitudes, and somewhat further west than preceding onsets [Wiens and Rostoker, 1975]. How to associate such discrete events with a single X line is unclear and a definite issue for the NENL model.
Pseudobreakups are similar to the substorm expansion phase in that they include activation of an auroral arc, en- hancement of the westward electrojet, and onset of Pi 2 UI_F pulsations [see McPherron, 1991, and references therein]. Yet these signatures, which occur during many substorm growth phases, are relatively weak and seem to be rather lo- calized. Pseudobreakups have received considerable renewed attention recently due, for example, to high time resolution auroral images [e.g., Shepherd and Murphree, 1991; Mur- phree et al., 1991]. Multispacecraft data and ground-based measurements have been combined very effectively to study the pseudobreakup process [Koskinen et al., 1993]. This work suggests that the optical and magnetic signatures may, in- deed, be very localized, but a wide part of the auroral oval may still be weakly activated.
Koskinen et al. [1993] and Nakamura et al. [1994b] showed that pseudobreakups have almost all of the features of a sub- storm onset, but the disturbance seems to "quench" rather than proceed to full expansion development. In the event studied by Koskinen et al. [1993] pseudobreakup subsided quickly and the actual substorm expansion phase onset did not occur for another 20 min. Nakamura et al. [1994b] used
all-sky camera and near-tail spacecraft data to delineate the tight localization of pseudobreakup features both in the ionosphere and in the near-tail.
Early evidence of localization of magnetotail phenomena was presented by investigators of energetic particle signa- tures at the IMP 6, 7, and 8 satellites [Sarris et al., 1976; Krimigis and Sarris, 1979]. Sergeev etal. [1986] also pro- vided evidence of localized (a few R E) extent of magnetotail activations. Hones and Schindler [1979] attributed the poor correlation between fast magnetotail flows and substorms to the longitudinal localization of the magnetotail phenomena. Lin et al. [1991 ] used two satellite measurements and inferred that the scale size of flux ropes earthward of the presumed location of the plasmoid was of the order of a few R E, sug- gesting that the magnetotail activations within the re- connection region have a small scale size. More recently, Angelopoulos et al. [1996] used magnetic flux and energy transport arguments to infer that the scale size of a BBF event which correlated well with a substorm intensification
was of the order of 1-2 R E. Ohtani et al. [1992c] studied a limited duration fast flow event and also inferred a maximum
scale size of 6 R E. Sergeev et al. (submitted manuscript, 1995) argued based on ISEE 1 and 2 measurements that the scale size of the plasma bubbles is of the order of 1-3 RE. The above studies suggest that both during expansion phase onset and during the recovery phase of substorms, the mid- tail (IXI- 15 to 30 RE) magnetotail acceleration phenomena are localized. Within the simple picture of the NENL model, it is difficult to explain either the highly localized nature of the activations (if the NENL is assumed to have a macro- scopic scale size) or the breakups and quenchings of small- scale activations (if reconnection at a large NENL is assumed to proceed explosively). Thus more details need to be added to the NENL model before these phenomena can be accounted for.
Angelopoulos et al. [1994b] analyzed several low AEBBFs and showed that they were not registered by the AE index be- cause of the longitudinal localization of the electrojet cur- rents. One of the low AE events was studied further by Ser- geev et al. [1995a]. They showed that the plasma sheet be- havior during the event was consistent with a magnetotail reconnection geometry which started a few minutes prior to the onset of Pi 2 pulsations and geosynchronous injection and produced BBFs on its earthward side. These observations suggest that the low AE bursty bulk flows are associated with electrojet activity that may not be seen in the global indices because of its limited spatial extent in the ionosphere.
Fast near-neutral sheet flows during active times have also been studied by Paschmann et al. [ 1985], Lin et al. [ 1991 ], Sergeev et al. [1992], Ohtani et al. [1992c], Lopez et al. [1994], and Angelopoulos et al. [1996]. These studies com- plement the earlier work of many researchers [Frank et al., 1976, Hones and Schindler, 1979; Huang et al., 1987; Paschmann et al., 1985; Coroniti et al., 1978, 1980]. Sergeev et al. [1992] showed the importance of nightside earthward flux transport and its association with geomagnetic activity. Lopez et al. [1994] studied a bursty bulk flow event and showed that it occurred at substorm onset at the meridian of
the AMPTE/IRM satellite. However, Lopez et al. argued that some auroral activity was present in another time sector prior to the BBF event despite the lack of fast flows at IRM prior to the BBF event onset. Thus it is possible that fast flows are not always related with auroral arc formation at the meridian of the fast flows. Angelopoulos et al. [1996] also studied a high-latitude substorm intensification which oc- curred at the meridian of AMFFE/IRM in good temporal as- sociation with a BBF event onset. The authors argued that the good temporal association between ground and space was a result of the fortuitous presence of AMPTE/IRM at the me- ridian of the substorm intensification. The auroral activity spread over more than 5 hours of local time within 10 min, yet the energy and magnetic flux transport estimates in the magnetotail suggest that the BBF event was localized to within 1-2 R E . It is possible that the auroral arc formation and electrojet enhancement do not map to the location of the fast flows themselves but rather to the location of the decel-
eration of those flows near Earth.
Additional information as to the evolution of the magne- totail acceleration during substorms comes from a multi- spacecraft study by Angelopoulos et al. (Tailward progres- sion of maagnetotail acceleration centers: Relationship to substorm current edge, submitted to Journal of Geophysical Research, 1995). The authors observed that the "tailward re- treat of a neutral line" during the active period studied was in reality a gradual progression of multiple, time dependent and localized acceleration regions. They provided evidence that occasionally there is more than one particle acceleration source in the plasma sheet and therefore there is not a single X line associated with a substorm but many localized accel- eration sites. Sergeev et al. [1992] also argued that impulsive dissipation events observed in energetic particle, electric field and plasma data in the magnetotail have exhibited, dur- ing fortuitous conjunctions with the ground, a good one-to- one correlation with ionospheric activity intensifications. A good correlation between energetic particle intensifications and ground activity has also been observed in an event stud- ied by Jacquey et al. [1994]. Ionospheric intensifications are composed of a progressive poleward re-appearance of local-

BAKER ET AL.: THE NEAR-EARTH NEUTRAL LINE MODEL 12,993
ized, short-lived (a few minutes) activations [Bosinger and Yahnin, 1987] that are reminiscent of the progressive reap- pearance of the acceleration centers discussed in the An- gelopoulos et al. [1996] paper. It is likely that the iono- spheric manifestation of the short-lived, localized, tailward retreating magnetotail activations of Angelopoulos et al. [1996] are the progressively poleward moving short-lived auroral activations of Bosinger and Yahnin [1987]. Sergeev et al. [1995a] also provide further evidence for this process.
In addition, Angelopoulos et al. [1995] showed that IMP 8 located at X--35 R E observed a large B z increase interpreted as current wedge formation, at least several minutes after the tailward progression of the acceleration centers past the Geo- tail satellite, located at X--70 R E. The result provides further evidence that the location of magnetotail acceleration and the tailward boundary of the current wedge are far from each other at late expansion/early recovery phase of substorms (at least 30 R E apart in this case. These results are in agreement with the conceptual evolution of the near-Earth neutral line model that suggests that the energy that powers the sub- storms may be due to magnetotail reconnection but that aurorae and electrojet currents may map very close to Earth, much closer than the location of the X line.
Recently, Pontius and Wolf [1990] and Chen and Wolf [1993] argued that if the plasma sheet is loaded with plasma in the distant tail in an inhomogeneous fashion, flux tubes of low pressure will tend to move earthward, and protrude with high speed into the surrounding high thermal pressure plasma sheet. The observational signature of these bubbles would be fast flow and short duration, as well as low thermal
pressure relative to the surrounding medium. Sergeev et al. [1995a] argued that a subset of the bursty bulk flow events, the ones that are seen in a thick plasma sheet, predomi- nantly at the recovery phase of substorms, exhibits such thermal pressure decrease and thus adheres to the "bubble" paradigm. Thus high-speed flows are not always evidence for nearby reconnection but may be due to reconnection much further downtail from the satellite. These features add a sub-
stantial amount of complexity to the traditional view of laminar plasma flow in the tail. More theoretical work on the interaction of many small-scale activations and their in- tegrated effects on the flow pattern are required before their meaning to the NENL picture can be fully estimated.
3.6. Plasmoids and Flux Ropes in the Distant Tail
The Geotail satellite has verified the presence and rele- vance of plasmoids for substorm dynamics. It has also pro- vided new insight into the structure, dynamics, composition, and evolution of plasmoids. Meanwhile recent new analyses from the ISEE 3 satellite and the Galileo Earth flyby have complemented the Geotail results.
Plasmoid composition may give significant clues as to the plasmoid history and connectivity. Lui et al. [1994] re- ported observations of the abundance ratios of He++/H + and O+/H + in plasmoids. The relative abundance of ionospheric to solar wind sources is variable not only from one plasmoid to another but also in different regions within the same plasmoid. The authors concluded that both ionospheric and solar wind plasma sources remain operational and dynami- cally influence the compositional content of plasmoids. This result is in agreement with the idea of Hughes and Sibeck
[1987] that the connection of plasmoids to the ionosphere and the solar wind may change along the plasmoid's history. The composition of the distant tail is influenced during sub- storms not only via plasmoids transporting near-Earth plasma but also via more complex magnetic topologies with only moderate north-south bipolar B z signatures threading tailward convecting plasma. Christon et al. [1994] reported that during a very active period (Kp=7-) molecular ions (O2 +, NO +, N2 +) had a measurable abundance ratio to O + of 1-2%. These ions emanated from the ionosphere prior to the major substorm onset but during an interval when the auroral elec- trojet was active. The authors argued that the molecular ions loaded the plasma sheet at a distance of 80-100 R E and were subsequently heated and convected to the satellite location at X=-145 R E.
The ionosphere is an active modifier of plasmoid compo- sition not only because of the connection of plasmoids to the ionosphere or because of the ionospheric loading of the plasma sheet plasma prior to plasmoid formation. Cold ions from the mantle get accelerated and heated at the plas- moid/mantle interface. Mukai et al. [1994] reported on H + and O + cold ion beams observed at X=-42 RE. These beams were ExB-drifting toward the plasma sheet with the same velocity and had the same field-aligned speed, just as expected from the ion spectrometer model of mantle plasma. Although ob- servations of cold ionospheric outflow at X=-23 RE had been made with the ISEE 2 satellite [Orsini et al., 1990], the Mukai et al. [1994] observations pointed out the dyngtmic and localized nature of the ionospheric loading. The electric field associated with the equatorward convection of the cold beams was 1.5 mV/m and therefore could not extend across the en-
tire tail: The process had to be localized in Y. In addition, Hirahara et al. [1994] pointed out that the cold ions were ac- celerated and heated after the passage of a plasmoid during the course of the substorm. However, the O + beam was al- ready traveling at a speed of 100-200 km/s when observed at the mantle; this speed is greater than the typical outflow ve- locities from the dayside cusp/cleft region and places limita- tions on the possible circulation mechanisms of ionospheric plasma.
Nishida et al. [1994a] reported on observations of fast tailward flow at X=-70 RE, which were consistent with the passage of a plasmoid. They showed that the slowly flowing plasma sheet ahead of the plasmoid was accelerated to high speeds upon the plasmoid arrival. Contrary to the high-speed beams observed at the plasma sheet boundary, the authors clarified that their observations were consistent with convec-
tive motions of the plasma sheet. Machida et al. [1994] also investigated the interaction of the plasmoid with the sur- rounding mantle plasma and found that the cold mantle ions are pushed away from the neutral sheet plane before the plasmoid arrival, whereas they convect toward the neutral plane after the passage of the plasmoid. This was also true in the Mukai et al. [1994] case.
A statistical survey of plasmoid signatures defined as bi-
polar signatures in both B z and By with peak to peak ampli- tude of > 3 nT [Moldwin and Hughes, 1992] revealed a sig- nificant number of earthward moving plasmoids. The earth- ward moving plasmoids are preferentially located close to Earth and have average speed (based on electron measure- ments) equal to 218 km/s, which is half the average speed of tailward moving plasmoids (498 km/s). Also, Nishida et al. [1986] had noted that slow flow (V<300 km/s) plasmoids

12,994 BAKER ET AL.' THE NEAR-EARTH NEUTRAL LINE MODEL
SUPERPOSED EPOCH
800 I I I I I I I I I I I _ PLASMOID --
¾EL " t "
4OO
-- I o I
_B 8
4 I I
o I co Bz I I- 4-- I -- -- I
•' 2• _ ..• o
•'-2
-• I ß 1 Log Flux I ,1• ? _ 6.6 R e I --
GROWTH I 5'-- 1 i
SUBSTORMI >$0 key 0 I I
AL I --
-200 - I -
-400 - I -
-600
I I I I I -120 -80 -40 0 40 80 120
TIME (Minute.)
Figure 11. A superposed epoch analysis for ISEE 3 plasma and field data (top three panels) and for electron data (at L = 6.6) and AL index data (bottom panels). Zero epoch corresponds to plasmoid arrival at ISEE 3 at -220 R E in the tail [from Baker et al., 1987].
may be due to simultaneous operation of the near-Earth and distant tail neutral lines prior to the onset of explosive, lobe field line reconnection. More recently, Kawano et al. [1995] presented a bipolar magnetic field signature observed under geomagnetically quiet conditions (Kp=0) and also in- terpreted that in terms of two plasma sources: A near-Earth and a distant-tail source. Their quasi-stagnant plasmoid was also moving with a speed less than 300 krn/s. The modeling results of Khurana et al. [1995a] help one approach these observations from a different angle: Is it possible that the quasi-stagnant plasmoids are low total current structures that are inconsequential for substorm dynamics?
As shown in Figure 11, the ISEE 3 observations have shown a remarkable correlation between substorms and dis-
tant tail phenomena such as tail expansions at growth phase, plasmoid release, and passage of traveling compres- sion regions [Hones et al., 1984a; Baker et al., 1984c, 1987; Slavin et al., 1985; Moldwin and Hughes, 1993]. Many of these results have been corroborated from the results of the
distant tail part of the Geotail mission. The examination of the plasma ion data for plasmoids and other tail phenomena has been an important element that was missing from previ- ous studies. These data have brought new insight but also pose interesting problems.
The plasmoid association with substorms has been ap- proached in a statistical manner and on a case-by-case basis. Moldwin and Hughes [1992, 1993] identified 366 plasmoids in the ISEE 3 database and found that more than 84% of the
events occurred between 4 and 60 min after substorm onset.
Large, isolated substorms had a good one-to-one correlation with plasmoids. Prolonged periods of activity that may have multiple intensifications did not appear in one-to-one corre- spondence with plasmoids. A fraction of all plasmoids (16%) did not have a correlation with substorms in either the AE
index or in geosynchronous spacecraft energetic particle in- jections. The authors discounted the possibility that plas- moids are not related to substorms by noting that the quiet time plasmoids occurred within prolonged periods of geo- magnetic quiescence when (1) it is more likely for the AE stations to be outside the nominal position of the contracted auroral oval; and (2) the inner edge of the plasma sheet and the possible plasmoid related injections are much further away from 6.6 R E . The location of the near-Earth and the distant tail reconnection sites was inferred from the times of
the earthward and tailward encounters of the plasmoids rela- tive to onset and the plasmoid speed as measured by the electron detector on ISEE 3. The average tailward flow veloc- ity was 439 km/s. The resulting earthward and tailward neu- tral lines at the time of onset were variable and were placed anywhere from 10 to 140 RE.
Slavin et al. [1993] also noted an excellent agreement be- tween isolated or paired TCRs and small substorms. The TCR delay times relative to onset based on many indicators (AKR, AL index, Pi 2 pulsations, geosynchronous injec- tions) were all found to be in good positive correlation with the distance of TCR observation. The speed inferred from the plot of delay times versus distance varied from 580 to 1200 km/s depending on the substorm indicator used. The lowest speed, 580 km/s was determined from the AL index as a sub- storm indicator, and the highest was determined by using AKR as an indicator. Slavin et al. [1992] also pointed out that the correlation between substorm onset and TCR or
plasmoid observation was not simply a statistical result but is evident during periods of recurrent substorms during which the magnetotail is monitored continuously. No plas- moids/TCRs were observed during a low geomagnetic activ- ity period surrounding the recurrent substorm period. The time delays between plasmoid observation and onset were consistent with plasmoid formation due to a near-Earth neu- tral line at the time of onset with an inferred plasmoid speed of 400 km/s.
Recent Geotail observations have confirmed the statistical
results from the ISEE 3 mission [e.g., Baker et al., 1987]. Nagai et al. [1994] used geosynchronous injection data for substorm identification and Pi 2 data for onset timing and classified the magnetic signatures observed at Geotail. Of the 89 events in their study, 53 had a clear bipolar signature in B z. A timing analysis on those events produced a good cor- relation between delay times and observation distance with a slope of-775 krn/s. The inferred location of the near-Earth neutral line was at X=-30 RE and the center of the newly cre- ated plasmoid at X=-60 R E. Estimates of the near-Earth re-

BAKER ET AL.' THE NEAR-EARTH NEUTRAL LINE MODEL 12,995
GEOTAIIdMGF/LEP
g 1o
14 0
-10
• 10 0
-10
• 6 • o
<1 o
:>' o 3
[.,, 1 o
x
GEOTAII-./LEP/I•,A-i ION OCT. 8. 1993
(a) 12:03:59- 12:04:11 UT (b) 12:05:2,2- 12:05:34 UT (c) 12:05:34- 12.'O5:46 tYi'
i)awnwatd Dawnward Dawn ward
Duskward Duskw•ud Du6kward
o
L(:X• (I •)
Figure 12. Geotail observations of thermal ions inside a plasmoid (adapted from Figures 2 and 4 of Machida et al. [ 1995]). Top panels show the magnetic field and plasma moments during the passage of a plasmoid. The measured ion flow velocity is -700 km/s. Bottom panel shows three ion distribution functions during selected times: (a) At the separatrix layer a cold, dense ion beam traveling at --300 km/s appears simultaneously with a hot ion beam traveling at 2100 km/s. (b) The ion distribution has a character similar to the previous one. (c) Ion distribution inside the plasmoid: The hot ion beam and the portion of the cold ions that crossed the plasmoid boundary are assimilating to become one component moving tailward at an average ve- locity of-700 km/s.

12,996 BAKER ET AL.' THE NEAR-EARTH NEUTRAL LI• MODEL
connection line location based on the assumption that the plasmoid speed is comparable to the local Alfv6n speed (V-300-1000 km/s) and using AKR observations for sub- storm Onset timing also gave a distance of X=-35 RE for the near-Earth position.
O X . nT
By
BZ
I I
-,o : ,-:
201- ' ' O ! , ß 1 • 'IT ! •, I ß 1230 I3C)O 1330 UT
GE:OTAIL OPT -HP
PIlOTON V•:LOClTY DISTRIBUTION SOLAR ECLIPTIC CC)4]K)INATES
Vz c-zz s3/cuS
All the above observations are consistent with a near-
Earth location of the plasmoid earthward edge. However, is it not possible to determine very aCCurately (to bett6r than several minutes) when the tailward plasma acceleration started in the plasma sheet. In addition, the above calcula- tions either depend on inference of the local plasmoid speed based on electron measurements, or energetic particle meas- urements, or predict a plasmoid speed that is consistent with such measurements. Observations from the distant tail por- tions of the Galileo and Geotail satellites have provided di- rect measurements of the plasmoid ion flow velocity and have resulted in interesting but• controversial results.
Nishida et al. [1995a] identified based on magnetic field measurements several types .of neutral sheet crossings. One of the types was the type "B" crossing, that is, those with a bipolar B z signature. One such signature was examined on the basis of electric field and magnetic field data. The authors showed that the crossing was consistent with a tail- ward moving plasmoid with a speed of-430 km/s and was centered at X=-60 R E at the time of the correlated AKR en- hancement as shown in Figure 12. A large plasmoid speed, consistent with the plasmoid speeds inferred from the ISEE 3 instrumentation was also found in the plasmoids studied by Machida et al. [1994] (-700 km/s) and Nishida et al. [1995a] (300 -1000 krn/s).
Frank et al. [1994] presented magnetic field and plasma observations of a plasmoid observed by Geotail at X=-125 R E (see Figure 13). Ion distributions from that plasmoid were presented by Frank and Paterson [1994]. The authors argued that the ion distribution within the plasmoid is composed of a hot (T i > 107 K), tailward streaming (Vx=--500 km/s) and low-density (N i -0.06 cm -3) ion population and a colder, slower (Vx=-200 krn/s) and denser (N i -0.1 cm -3) compo- nent. The number density of the cold ions was similar to the mantle ion beams that surrounded the plasmoid. The elec- trons can be approximated with a hot isotropic Maxwelhan distribution of a tailward flow similar to the ion flow and a
density equal to the sum of the densities of the two ion populations. Thus quasi-neutrality was observed, but the net speed of the ions was only -250 km/s, that is, lower than the speed of the electrons. The imbalance between electron and ion speeds was indicative of a significant earthward cur- rent of-5-10 nA/m 2. The authors argued that these results were consistent with both the electron flow measurements
from the ISEE 3 satellite and the inferred flow velocities
from the energetic particle instruments on the ISEE 3 satel- lite. However, the ISEE 3 measurements which were typically 500 -1000 krn/s are not representative of the bulk flow of the plasmoid because of the presence of the cold ion com- ponent. The low (_< 200 krn/s) plasmoid speed is not a prop- erty of only the plasmoid whose ion distribution functions
iC; 25
1306-1314 UT 31 MARCH Igg3
Figure 13. Geotail observations of thermal ions inside a plasmoid (adapted from Figures 1 and 2 of Frank et al. [1995] and Figure 4 of Frank and Paterson [1994]). Top panels show plasma moments and magnetic field measurements during the passage of a i•lasmoid. The ver- tical lines delineate the earthward and tailward sides of the plasmoid. The measured ion flow velocity during this plasmoid is -250 km/s. The ions distribution function (bottom panel) shows a cold and a hot compo- nent. The hot component is fiowin•g tailward with a flow velocity of 200 km/s and has a density of 0.1 cm 'ø. The cold component is necessary to satisfy qUasi-neutrality. The total ion distribution is flowing slowly be- cause of the presence of the dense cold component.

BAKER ET AL.' THE NEAR-EARTH NEUTRAL LINE MODEL 12,997
were presented by Frank and Paterson [1994], but of all four plasmoids seen between 0500 UT on March 30, 1993, and 1306 UT on March 31, 1993.
Khurana et al. [1995b] also presented observations of flux ropes seen by the Galileo satellite. There, too, a slow flow (Vx --150 krn/s) flux rope was associated with the onset of a substorm. It was modeled with a structure that contained
about a quarter of the total plasma sheet magnetic flux per unit Y distance. The authors argued that the near-Earth neutral line for that substorm was formed at a distance of X=-50 R E.
The issue of the plasmoid ion flow velocity is quite im- portant. It lies at the heart of the basic problem that faces the near-Earth neutral line model: A low plasmoid speed re- sults in a plasmoid ejection far from Earth and a location for the near-Earth neutral line that is far from where the sub-
storm dissipation region is expected to map. It is important to assess whether the plasmoids analyzed by Frank et al. [1994], Frank and Paterson [1994], and Khurana et al. [1995b] are typical of the Geotail database of plasmoids or whether they represent unusual events, possibly due to the geomagnetic conditions prior to their observation.
Recently, with the use of two satellites (IMP 8 and Geo- tail) in the tail, Angelopoulos et al. [1995] addressed the is- sue of the tailward retreat of plasmoids and acceleration re- gion in the course of substorms. Angelopoulos et al. [1995] analyzed the release of a plasmoid during a small isolated substorm. They showed that the plasmoid formed within closed field lines and gradually evolved to encompass much of the flux of the plasma sheet. These observations also agree with the observations of Machida et al. [1994] and ear- lier observations by Kettmann et al. [ 1990] that reconnection evolved from closed field lines and gradually proceeds to the last closed field line. In the Angelopoulos et al. [1995] event the plasmoid core moved tailward of X--70 R E and the earth- ward ion beams were seen at IMP 8 at X--35 R E prior to the poleward expansion of the activity at an auroral station. The authors presented evidence that the active electrojet mapped to the near-Earth environment (around X=-10 RE). They ar- gued on the basis of the time delay that the acceleration re- gion (interpreted as the X line) and the equatorial projection of the active electrojet were very far apart from each other (one was tailward of X=-35 R E and the other was as close in as X=-10 RE). These multi-point observations from the tail further elucidate the progression of the X line and its rela- tionship to the near-Earth activity during the course of a substorm. They support the earlier idea [Baker and McPher- ron, 1990] and the numerical simulation results of Birn and Hesse [1991] that the location of the X line and the location of the current diversion into the ionosphere are at two differ- ent places and can be far apart from each other at substorm recovery.
3.7. MHD Simulations
Global and large-scale fluid simulations of magneto- spheric dynamics and of the solar wind-magnetosphere inter- action consistently show that the response of the magneto- tail to external energy input (southward IMF)is the forma- tion and tailward ejection of an isolated plasma structure, a plasmoid [e.g., Walker et al., 1993; Raeder, 1994]. This has been true for a wide variety of simulation codes and external parameters used in the simulation runs.
Enhanced energy input is seen in the MHD simulations as
an increase in the near-Earth cross-tail current, in agreement with direct observations. The details of the numerical models
affect the stability of the tail, but eventually in all simula- tions the tail is driven to an unstable state, and global re- configuration of the magnetic field pattern follows. For ex- ample, in the simulation by Walker et al. [1993], even during a period that would be characterized as the late growth phase, a quasi-stable neutral line forms in the near-Earth tail (Figure 14). During this period, slow reconnection begins on closed field lines, but this does not cause a large-scale field recon- figuration. When reconnection proceeds to open field lines, a plasmoid is severed and begins to move away from the Earth. Formation of a neutral line during the late growth phase has been earlier suggested by Baker and McPherron [1990], based on observational results obtained in the near- Earth magnetotail.
The large-scale fluid models considering only a portion of the solar wind-magnetosphere-ionosphere system have basi- cally produced similar results (see, e.g., the review by Birn et al. [this issue]. In these models, the dynamical evolution is initiated either by imposing a finite resistivity within the plasma sheet or by enhancing convection through changes in the boundary conditions [Birn and Hesse, 1991; Janhunen et al., 1995]. The finite resistivity triggers magnetic recon- nection, and an unstable configuration develops. It is nota- ble that in most simulations the energy dissipation is real- ized through magnetic reconnection.
z 20 Its
, T = 38 min Reconnection on
z 20 Rs
T = 47 min Reconnection on
•1 open field lines
z 20 Rs
T = 57 min
Tailward motion
Figure 14. Development of magnetic field structures in a three- dimensional simulation showing reconnection and plasmoid formation [from Walker et al., 1993].

12,998 BAKER ET AL.: THE NEAR-EARTH NEUTRAL LINE MODEL
Since we still lack global imaging of the entire magneto- sphere or the possibility to monitor each key region with a dense network of instruments, global fluid simulations, to- gether with comparison with observations, provide the best way to study the large-scale response of the magnetosphere to the variations in the external conditions. The global MHD simulations have consistently verified the NENL scheme for magnetospheric substorms, producing effects of the growth phase, a plasmoid during the expansion phase, and a recovery phase characterized by the tailward motion of the plasmoid [e.g., Raeder, 1994]. However, there are still some aspects in the present-day models which may affect the dynamic sequence that the system undergoes under solar Wind driving.
A key issue in substorm research during the past few years has been the location of the substorm Onset region in the very innermost part of the magnetotail, that is, in the vicin- ity of the geostationary orbit. This region is particularly dif- ficult to represent with the global MHD models for two ob- vious reasons: First, the field and plasma gradients in that region are large, and thus a small grid size is required. This requires both enhanced computer resources and the develop- ment of variable-size grids. Second, the near-Earth plasma sheet is largely populated by particles originating from the dense ionosphere. Because most of the MHD models do not have an ionospheric source, the ring current region is under- populated, and the magnetic field and plasma sheet descrip- tions do not give an accurate representation of the real mag- netosphere. Accurate current and plasma distributions can be particularly important in determining the time scales of the growth phase and in determining the location where the in- stability growth occurs. Furthermore, the details of the cur- rent sheet disruption observed near the geostationary orbit also require an accurate representation of the local current systems [Pulkkinen et al., 1995a].
The formation of thin current sheets and their effects on
the substorm evolution has also been under lively discussion recently [e.g., Pritchett and Coroniti, 1994; Sergeev et al., this issue]. Some of the MHD models show quite consider- able thinning of the near-Earth current sheet prior to the on- set of reconnection, but this has not been the case for all
simulations [e.g., Pulkkinen et al., 1995a]. Further in- vestigations are needed to find the controlling parameters for the thin current sheet formation, to ensure that the simula-
tions represent reality the best possible way.
sion for the magnetospheric processes represented by AL. For example, results of such analysis by Vassiliadis et al. [1990] showed a correlation dimension of-3.5.
State-space reconstruction using autonomous methods for AE and AL tend to show low-dimensional behavior with a
correlation dimension _<4. This result would imply that the coupled solar wind-magnetosphere system settles onto a low- dimensional attractor. This means that just three or four ordi- nary first-order differential equations could describe the es- sence of magnetospheric dynamics. Hence a complex plasma system with an essentially infinite number of degrees of freedom may manifest just a few of these degrees of freedom. This suggested a high degree of possible coherence in the system and the fractional dimension suggested a fractal struc- ture and an underlying "strange" attractor.
More recent examinations of magnetospheric dynamics have made clear that one must consider the solar wind and
the magnetosphere as a complete system. This is because the magnetosphere, and the auroral activity represented by AE, depends for virtually all of the dissipated energy on the ex- ternal driving by the solar wind. Hence one must consider the magnetosphere as a nonautonomous rather than au- tonomous system. Input-output methods are therefore neces- sary as was pointed out by Prichard and Price [1992]. Cer- tainly, it is possible to construct data bases which associate solar wind inputs with magnetospheric outputs [e.g., Bar- gatze et al., 1985; Price et al., 1994]. Vassiliadis et al., [1995] have found evidence from nonautonomous analyses that non- linearity of optimal activity predictors may be equivalent to nonlinearity of the solar wind-magnetospheric coupling. This issue remains to be fully resolved and is the subject of very active research [see Klimas et al., this issue].
Building on the apparent evolution of linear prediction filter elements with increasing geomagnetic activity [see Bargatze et al., 1985], Baker et al. [1990] developed a simple mechanical analogue model of substorm dynamics. As shown in Figure 15, the model considers a mass on a spring. The mass increases at a fixed loading rate th L until a critical dis- tention D=D c is reached. At this critical point, a portion of the mass is released from the spring at a rate (rh u) that is governed by the velocity of the mass D at the critical dis- placement point. The set of equations for /5 and /3, as closed by the conditions on rh, lead to a nonlinear system of equations. As the th L increases, the system goes from weak periodic unloading to highly chaotic, nonlinear behav-
3.8. Low-Dimensional Nonlinear Dynamics
The NENL model is one of the few models which consid-
ers the complete, global substorm framework. However, the very general aspects of solar wind-magnetosphere coupling, have been examined by several authors using the tools of nonlinear dynamics [e.g., Vassiliadis et al., 1990; Roberts et al., 1991]. In this "state-space reconstruction" technique, the AL index is treated as a general time series that reflects the basic dynamics of the magnetosphere-ionosphere system. A state vector is constructed from the extensive AL time series.
The generation of state vectors creates a new m-dimensional space out of the AL time series. Within this m-dimensional space, one can examine the intrinsic correlation characteris- tics of the dynamical system. The correlation dimension v for higher and higher m-space embedding dimensions be- comes a good estimate of the dynamical "attractor" dimen-
Dripping Faucet Analogue Model
(a)
Figure 15. (a) A mechanical analogue of the dripping faucet. (b) Anal- ogy of plasmoid formation to a leaky faucet [from Baker et al., 1994b].

BAKER ET AL.: THE NEAR-EARTH NEUTRAL LINE MODEL 12,999
ior. Thus the loading and unloading of the mass leads to complex interferences as the loading rate increases.
The mass-on-spring model of Baker et al. [1990] took cognizance of an analogy between substorm unloading proc- esses and a dripping faucet [Hones, 1979], as shown in Fig- ure 15. In the magnetotail, the plasma sheet distends and stretches during the growth phase. At substorm onset (in the NENL model), a part of the plasma sheet pinches off to form the substorm plasmoid. The plasmoid moves down the tail and out of the system at high speed while the residual plasma sheet snaps back toward the Earth. The upper part of Figure 15 shows that the dripping faucet behaves in a very analogous way to the unloading magnetotail during sub- storms.
The mechanical analogue model of Baker et al. [ 1990] was able to model several aspects of substorms; the growth, ex- pansion, and recovery cycle was accounted for. Also, as the loading rate went up, the analogue system exhibited nonlin- ear evolution, period-doubling and bifurcation, and eventu- ally full-fledged chaotic dynamics. For a rather simple sys- tem, this is a quite successful representation. However, the mechanical analogy is somewhat limited and so Klimas et al. [1992] developed a plasma physical analogue model called the Faraday loop model. This is a dynamic global convec- tion model with three degrees of freedom: (1) the average
cross-tail electric field in the central current sheet, Ey; (2) the rate of change of Ey due to external loading and/or inter- nal dynamics in the tail near the NENL position; and (3) the time-varying magnetic flux content of the tail lobes. By prescribing a critical lobe flux content, the Faraday loop model is similar to the drippy faucet model. Flux loads into the tail at a rate determined by the external (solar wind) elec- tric field E o. When the critical flux level is reached, the tail unloads by forming a plasmoid, thereby dumping much of the free energy in the tail. This is very consistent with the substorm cycle depicted in Figure 15.
An advantage of the Faraday loop model over the me- chanical analogue model is that it is possible to drive the Faraday loop using realistic solar wind electric field varia- tions [Klimas et al., 1992, 1994]. By using observed VBs values from the Bargatze et al. [1985] data set, it was possi- ble to compare the analogue model response to that of the real magnetosphere. Moreover, in the Faraday loop model, one can also examine aspects of loading and unloading in ways that are not controllable in the real magnetosphere. The very simple global analogue models, including as they do the essence of the NENL model, are able to represent sub- storm dynamics to a remarkable degree [Klimas et al., this is- sue].
3.9. Energy Budgets
A problem with powering the substorm by a near-Earth current disruption is the source of the energy for the sub- storm expansion phase. An analysis of the near-Earth plasma sheet carried out by Hesse and Birn [1993] demon- strated that there is not sufficient energy in. the closed field line region of the inner plasma sheet to power a substorm expansion. Thus it is essential to tap the reservoir of energy stored in the tail lobes [Baker et al., 1995a]. A similar argu- ment can be applied to flux balance. The buildup of the lobe field is generally attributed to opening of field lines on the dayside and their transport to the tail lobes. It is difficult to
understand how the return of the lobe field to presubstorm values can occur during an expansion phase as is observed statistically [Caan et al., 1978], and yet none of the open flux is reconnected.
As shown by Hesse and Birn [1993], an energy balance equation needs to be satisfied in the substorm current disrup- tion region V. In general, one can integrate the energy equa- tion over the volume V to show that
+ +P_l_ + dV ¾ v 2#0 2
+ ds n' ExB + v + 2p_l_ + v_l - •o3 P0 2
+ vx +•v, v ,•+q} • 0. (1)
This is the most general formulation assuming anisotropic, hot flowing plasmas. The equation shows that the time de- rivative of the volume integral of the magnetic, kinetic, and internal energies of the plasma is equal to the surface inte- gral of the energy fluxes. These are, respectively, the Poynting flux, the kinetic energy flux, the enthalpy flux, and the heat flux.
This very general relation is often greatly simplified. For example, Hesse and Birn [1993] note that if one can define a suitable volume which is "closed" and across whose surface
the energy fluxes are negligible, then the first integral in (1) should be zero. For a fixed volume V this relation can be re-
written for some initial time to and some final time t I as
+0vg 2//0 2
2//0 2 -•- V. (2)
Hesse and Birn [1993] go on to show that for observed mag- netic field and plasma flow conditions, this balance cannot be obtained in the inner plasma sheet region. They therefore conclude that energy must flow into the "disruption" region from a strong energy source outside the near-tail.
If the closed field lines of the plasma sheet are not ade- quate to power the substorm, then one must look to the open field lines of the tail lobes connection to the polar cap. Baker et al. [1995a] have applied the energy budget formal- ism above to a specific event. Four specific times were iden- tified: The beginning of the growth phase, the expansion onset, the beginning of the recovery phase, and the end of the recovery phase. A good magnetic field model for the first and last time steps was the unmodified Tsyganenko [1989] model. The model at substorm onset was the maximally modified growth phase model with a thin and intense current sheet in the near-Earth tail, and at the beginning of the re- covery phase the field was strongly dipolarized and the plasma sheet was expanded [Pulkkinen et al., 1992, 1994].
For each of the time steps, the magnetic energy given by the first term of (1) was evaluated for both the open field

13,000 BAKER ET AL.: THE NEAR-EARTH NEUTRAL LINE MODEL
line and plasma sheet regions separately. In addition, for the plasma sheet region the kinetic energy given by the follow- ing three terms in (1) was evaluated using (constant) obser- vational values for the velocity and pressure (which was as- sumed isotropic). The region of the tail included in this vol- ume integral was chosen to be from X=-4 to X=-20 R E, -15 < Y < 15 RE, and Z from the current sheet center to the magne- topause defined by the field models. As the magnetic field model does not specify the open-closed field line boundary, the plasma sheet region was defined by mapping the pole- ward boundary of the oval to the tail. Evaluation of the above integrals revealed that the lobe region is the only re- gion to increase its energy content during the growth phase. The plasma sheet magnetic energy decreases due to the thin- ning of the current sheet and consequent decrease of B in the plasma sheet. The plasma energy decreases because the plasma is cooled and the density is reduced.
During the expansion phase, the lobe energy is dramati- cally decreased. During this period, the plasma sheet mag- netic and plasma energy increase: B increased due to the field dipolarization and the plasma was heated and the flow veloc- ity increased. During the recovery phase, the system returned to the original Tsyganenko model. Lobe magnetic field in- creased, leading to an increase in the lobe energy, and in the plasma sheet the magnetic field was reduced.
Overall, the work of D.N. Baker et al. (A quantitative as- sessment of energy storage and release in the Earth's magne-
totail, submitted to Journal of Geophysical Research, 1995, hereinafter referred to as Baker et al., submitted manuscript, 1995a) and Hesse and Birn [1993] strongly suggests that the inner plasma sheet region cannot supply very much of the energy to power substorms. Therefore, an alternative power supply is clearly required. As shown by Baker et al. (submitted manuscript, 1995a), a more than adequate supply of energy can be obtained by tapping the lobes of the mag- netotail through near-Earth magnetic reconnection. More events need to be evaluated in this comprehensive way using the fall suite of ISTP spacecraft.
3.10. Plasma Heating Processes
During disturbed times, the plasma sheet changes dramati- cally. Baumjohann et al. [1991] did a superposed epoch study of the behavior of the plasma sheet around substorm onset in order to study these changes. The upper left panel in Fig- ure 16 shows the average behavior of the AE index during 39 substorm onsets, where the IRM satellite was located be-
tween 10 and 19 R E. The AE trace looks typical for a moder- ate-to-major substorm. On average, the 45 rain following the onsets can be characterized as expansion phase with AE reaching peak values around 500 nT. During the last 45 min, AE decreases again, and this interval can thus be character- ized as the first part of the recovery phase.
Baumjohann et al. [1991] constructed average traces of the
•00.
450.
400.
"• 350.
• 300ß
• 250.
2oo.
150. -45.
Minutes around Substorm Onset
70. , • , , 65.
80.
55. -
50.
45.
40.
35. , I . . -45. O. 45. 90.
Minutes around Substorm Onset
0.30
'• 0.25
0 '• 0.20
e 0.15 ß
o
ß I ' I ' , ,
:
: :
.
0.10 . : : : : :
0.05 . ; . ; . -45. O. 45. 90.
Minutes around Substorm Onset
•.0 ... ß ! , . ß
ß
ß
?.0
6.6 : . : : : : : : .
6.0 , -45. O. 45. O0.
Minutes around Substorm Onset
Figure 16. Superposed AE index trace, constructed by averaging 39 AE index traces in 9-min bins with respect to 39 sub- storm onsets (upper left). The other three panels give the average ion temperature (upper right), the specific entropy, k Ti/Ni 2/3 (lower left), and the average ion-to-electron temperature ration (lower right) in the central plasma sheet during the same 39 substorms. The dashed vertical lines mark substorm onset and the start of the recovery phase [ Baumjohann et al., 1991].

BAKER ET AL.: THE NEAR-EARTH NEUTRAL LINE MODEL 13,001
development of relevant magnetic field and plasma parame- ters by binning measurements taken between 45 min before and 90 min after each of the 39 substorm onsets with respect to the particular onset into 9-min-wide bins and then averag- ing over all the samples in a particular bin. Their result is consistent with those achieved in earlier statistical studies
which binned the data with respect to the AE index [Lennartsson and Shelley, 1986; Huang and Frank, 1986; Baumjohann et al., 1989]: During a substorm the magnetic field gets more dipolar, the ion temperature increases mark- edly, and the plasma density in the central plasma sheet is somewhat depleted.
IRM data [Baurnjohann et al., 1991] as well as ISEE data [Huang et al., 1992] show that the heating of the central plasma sheet during the expansion phase to about twice its presubstorm temperature is accompanied by a density de- crease of about 25%. This clearly indicates that the substorm heating cannot occur in an adiabatic fashion, where tempera- ture and density changes must be positively correlated ac- cording to the polytropic equation for adiabatic space plas- mas P = atN 5/3, where at is the specific entropy of the plasma.
The lower left panel of Figure 16 [from Baumjohann et al., 1991] shows the superposed epoch trace of the average spe- cific entropy at = k T i /N i 2/3. The specific entropy trace shows a rapid change during the expansion phase. Actually, the specific entropy increases even more strongly than the ion temperature during the expansion phase and, as a result, presubstorm and postsubstorm plasma are at totally different specific entropy levels. Thus the substorm heating process must clearly be a nonadiabatic process, most likely current sheet heating or heating by reconnection.
It is not only the ion temperature that increases strongly with geomagnetic activity, the electron temperature varies the same way, too. The two temperatures show a very high degree of correlation, with Ti/T e -- 7 [Baumjohann et al., 1989]. The linear relation between T i and T e holds for tem- perature variations over nearly two decades, that is, both in a hot and cold plasma sheet and is totally independent of the disturbance level.
In fact, one can see from the lower right panel of Figure 16 that the temperature ratio in the central plasma sheet stays between 6.5 < Ti/T e < 7.5 during the course of a sub- storm. There are temporal variations of this ratio, but they are not related to the substorm phases in any systematic way, thereby corroborating the conclusion of Christon et al. [1988] that the plasma as well as energetic ion and electron populations respond collectively as a single unified particle population during plasma sheet temperature transitions.
Hence any substorm theory has to include a mechanism that heats the plasma in a nonadiabatic way, increasing its entropy and treating ions and electrons as a single fluid. MHD simulations of magnetotail reconnection [Hesse and Birn, •992] tell us that nonadiabatic heating and increase of plasma entropy are a natural consequence of the ion tearing mode. These dramatic changes in the central plasma sheet are hence consistent with the neat-Earth neutral line model.
However, the parallel heating of ions has not been ex- plained yet, either in the framework of the near-Earth neutral line model or by any other theory. Since such a behavior can, by definition, not be seen in the single fluid MHD simulations as presently performed, this is not necessarily an argument against the validity of the near-Earth neutral
model. One has to await hybrid, or at least two-fluid, simula- tions to see whether the ion tearing mode actually heats ions and electrons in parallel.
4. Future Directions
4.1. Aurora and Near Tail
Is it possible to explain recent observations of aurora and magnetic field in terms of the NENL model? We believe the answer is yes, but not without modification of the model. Such modifications should not be considered a failure of the
model but the necessary consequences of increased under- standing brought about by new observations. It should be remembered that a substorm is a collection of physical pro- cesses organized in time and space. Additional processes can be added to this collection without changing the basic nature of the model. In our opinion the fundamental question raised by recent observations is whether the current disruption mechanism triggers reconnection after a short delay, or whether current disruption is a near-Earth manifestation of a somewhat more distant X line.
The most crucial factor in the determination of an inner
tail substorm onset is relative timing in the observations of the occurrence of different phenomena [McPherron, 1978]. While ground-based observations can often be timed to within tens of seconds, space-based observations often have temporal uncertainties of the order of a few minutes. These are due to the fluctuation levels present in the data at most times and problems with one-point measurements to locate the relative position of the activated region. In addition to these limitations, magnetic maps based on average magnetic field models tend to be exceedingly inaccurate during times of high geomagnetic activity, or just prior to substorm on- set, when thin current sheets change the magnetic field ge- ometry to be much more tail-like. More meaningful magnetic mapping requires specially tailored field models, which have been developed in some cases [Pulkkinen et al., 1991a, 1992]. In these cases, auroral features are mapped signifi- cantly farther downtail than expected from average models. Therefore an exact cause-effect relation between processes in the ionosphere, the inner tail, and the midtail and outer tail is, at best, difficult to establish and suffers from a high de- gree of uncertainty.
This uncertainty, however, does not take away from the fact that these processes indeed occur. Since these features are an important and repeatable part of substorm dynamics, a complete model of substorm evolution needs to include a sat- isfactory explanation of near-tail events. Possible causal connections to other phenomena and to substorm processes like magnetic reconnection must be established. One such connection can be made on the basis of global arguments, which show that magnetic reconnection is required to tap the lobe energy and magnetic flux reservoir as an energy source for the majority of the substorm energy dissipation (Baker et al., submitted manuscript, 1995a), and a flux source required to dipolarize large sections of the inner plasma sheet. This fact does not, however, preclude the possibility that the auroral brightening maps away from the actual reconnection site, for example, somewhere closer to the Earth instead. This scenario is suggested by the large spatial distance be- tween the reconnection site, placed at or outward of-20 R E

13,002 BAKER ET AL.: THE NEAR-EARTH NEUTRAL LINE MODEL
downtail from the Earth, and the inner magnetosphere. If a near-Earth sequence of events should occur first, magnetic re- connection (and thus a large-scale tail instability) must then be triggered by the original onset process through some complicated interaction, Thus one important goal of future research should be to establish this connection and its direc-
tion.
4.2. Midtail Region
Using IMP 6 and 8 plasma data, Nakamura et al. [1994a] found that high-speed flow events with velocities in excess of 300 km/s near tile midtail neutral sheet were essentially restricted to tailward distances of XGS M < -24 R E. Setting the threshold a bit higher, at 400 km/s nearly all high-speed flows were observed even further tailward (XGS M <-30 R E, cf. their Figure 4).
Since the IMP plasma data had a temporal resolution of only 0.5 to 2 rrfin, short bursts of high-speed flow, which may have occurred further inward, would have gone unnoticed in the. data set used by Nakamura et al. [1994a]. Indeed, Baumjohann et al. [1990], using IRM plasma data with its much higher resolution of about 5 s, found that high-speed ion flows with velocities often near the local Alfv6n speed can be observed near the neutral sheet at radial distances of
less than 20 R E , but that these flows are very short-lived, often lasting less than 10 s (see also section 3.2). Hence, taking into ,,,.account both studies, there seem to be two choices. Either relatively steady flows get bursty inside of 25-30 R E or "the flows are already bursty around-30 < XGSM<-35 RE,'yet have such high speeds there that even 0.5 or 2-min averages still yield velocities in excess of 400 km/s.
That there is indeed braking of bursty high-speed ion flow to much lower velocities, at least further inward, has already been observed. Figure 17 shows the occurrence rate of high- speed ion bulk flows detected by the IRM plasma instrument
. w
0. -19. -17. -15. -13.
XG$ M, Earth Radii
-11.
Figure 17. Occurrence of high-speed ion bulk flows in excess of 400 km/s near the midnight sector neutral sheet versus tailward distance from Earth [after Baurnjohann et al., 1990].
near the neutral sheet at tailward distances between 11 and
19 R E . It is quite apparent that the probability to observe even short-lived high-speed flows drops sharply inside of about 15 RE.
It seems important to answer the question of what hap- pens further outward, because if the flow is bursty from the beginning, this would put considerable constraints on the source mechanism creating these flows. If, on the other hand, a coherent steady flow is converted into a more inco- herent bursty flow somewhere around tailward dislances of 25-30 R E, it may tell us something about how the kibetic energy of the fast flowing plasma is converted ihto thermal energy. It may also explain the clearly observablfi herating of electrons and ions during the substorm expansion phase (see section 3.10). Finally, the observed braking of the bur- sty high-speed flows around 15 RE has still not been ex- plained theoretically, at least within the framework of the near-Earth neutral line model.
The Geotail spacecraft has now entered a phase of its mis- sion where it is in a 10 x 30 R E geocentric orbit. It has very comprehensive plasma measurement capabilities and should be well suited for examining plasma flow and associated field characteristics in the critical region beyond ~20 R E . These data will be crucial in addressing the issue of where and when the X line forms in relation to substorm expansion phase onset.
4.3. Distant Tail
Time-dependent, localized acceleration and plasmoids. If indeed reconnection operates in a time dependent and local- ized manner how do the multiple and often simultaneously operating acceleration centers produce large-scale plasmoids? Is it possible that during moderate substorms the tail be- haves in a more organized manner than during large sub- storms? Nishida et al. [1988], Fairfield et al. [1989], and Moldwin and Hughes [1993] all commented on the fact that during large substorms there are not always plasmoids or multiple plasmoids observed for each substorm intensifica- tion. They also emphasized that isolated substorms exhibit a good one-to-one correlation with one or more plasmoids. Similarly, Slavin et al. [1993] pointed out that large sub- storms produce multiple TCRs, whereas moderate substorms produce one or two TCRs with a time delay relative to onset consistent with a near-Earth generation of a plasmoid.
Is it possible that large substorms are associated with a direct energy dissipation in the ionosphere without a loading phase? The results of Nishida et al. [1994b] suggest that it is indeed possible for the distant magnetotail to be in a state where no plasmoids are seen but instead neutral sheet fluctua- tions of short time scale (and therefore short spatial scale occur). This third state of the magnetotail at active times has no analog in the near-Earth plasma sheet where even during prolonged active times the flow is bimodal [Sergeev and Lennartsson, 1988]. Critical in our understanding of the magnetotail behavior during such times is an understanding of the interplanetary conditions that drive the magnetotail. This is possible for the distant tail portion of the Geotail mission because IMP 8 data were available for a large por- tion of that period, unlike during the ISEE 3 excursions of the distant tail. The correlations between IMP 8 solar wind
input and the Geotail measurements of the distant tail behav- ior may cast light on our understanding of how energy gets dissipated from the solar wind to the ionosphere.

BAKER ET AL.: THE NEAR-EARTH NEUTRAL LINE MODEL 13,003
Problem of plasmoid speed. One of the most puzzling problems that has surfaced during the distant tail portion of the Geotail mission has been the estimates of the plasmoid speed. This lies at the heart of the verification of the near- Earth neutral line model for substorms because the timing analyses done in the past using the ISEE 3 satellite data all depended on an estimate of the plasmoid velocity. These es- timates gave results consistent with a near-Earth location of the NENL. Although the plasmoid speed quoted by Machida et al. [1994] and Nishida et al. [1994b] is in agreement with plasmoid speed estimates from the energetic particle instru- ment on ISEE 3 [Richardson et al., 1987] and from the elec- tron flow measurements [Moldwin and Hughes, 1992, 1993], the measurements of plasmoid speeds by Frank et al. [1994], Frank and Paterson [1995] and Khurana et al. [1995b] are much lower (at least a factor of 2). As a result the near-Earth neutral line location estimate would be much further away from Earth than originally postulated. This poses a serious problem to the NENL model for substorms that has to be ad- dressed by means of statistical studies on a large set of plasmoids just as was done with the ISEE 3 data sets by Moldwin and Hughes [1993].
Slow shocks. The recent Geotail plasma measurements have provided important new information concerning slow shocks in the distant tail. In particular, Saito et al. [1995] used quite rigid selection criteria and found several events that satisfied the Rankine-Hygoniot relations across the shock and in addition had an electron heat flux upstream. Further analysis of the plasma, magnetic field, energetic par- ticle and wave behavior around these entities shows great promise to provide insight on the microphysics of magnetic reconnection in the distant tail. The realization that slow
shocks are not seen close to Earth suggests that either near- Earth reconnection does not proceed in a manner similar to distant tail reconnection or that the conditions in the near-
Earth environment inhibit formation of slow shocks [Cattell et al., 1992]. Understanding the reason for this near-Earth tail behavior will be an important contribution to the near- Earth neutral line model.
4.4. Coupling Studies
Generalizing linear prediction filters with nonlinear dy- namical methods, nonlinear filters have been based on a
method of representing records of past geomagnetic and so- lar wind activity as points in a phase space [Vassiliadis et al., 1995]. The state-input space representation, where nearby points correspond to similar geomagnetic and solar wind conditions, is useful in studies of the solar wind-
magnetosphere coupling such as classification, superposed epoch analysis, and prediction. In the state-input space, the magnetospheric state vector evolves in time subject to solar wind driving conditions and to internal magnetospheric dy- namics. By fitting linear filters locally to the magneto- spheric dynamics in the state-input space, one obtains non- linear moving-average filters and state-input models.
Nonlinear moving-average filters assume that the auroral geomagnetic activity depends solely on solar wind parame- ters. They generalize the linear moving-average filters and give improved correlations and reduced single-step prediction errors for synthetic and real AL data [Vassiliadis et al., 1995]. State-input-space models correlate the present geomagnetic output with both earlier outputs and inputs. These models ac-
count for feedback processes related to loading-unloading which cannot be expressed in terms of moving-average fil- ters. The nonlinearity of solar wind coupling is suggested by the variability of the number of filter coefficients necessary for different levels of activity and types of AL response. The nonlinearity is even more evident in the superior perfor- mance of nonlinear state-input models (obtained from a small number of similar data) to linear state-input models (obtained from an average over a large number of data of various activity levels). This type of work must be related to detailed magnetotail processes.
Baurnjohann et al. [1995] did a superposed epoch to study possible differences in the behavior of the near-Earth tail around substorm onsets that occurred during the expansion phase of magnetic storms and those that were not accompa- nied by a magnetic storm (Dst>-25nT). Comparing these re- sults with the signatures to be expected from the near-Earth neutral line model [e.g., McPherron et al., 1973; McPherron, 1991; Hones, 1984], only the substorms occurring during the storm main phase seemed to show the expected features. For this type of substorm, a clear dipolarization of the tail magnetic field and decrease in the strength of the lobe field was seen, both of which were expected to be associated with the formation of a near-Earth neutral line tailward of the sat-
ellite during substorm onset and subsequent reconnection of closed plasma sheet field lines and open magnetic flux tubes intermediately stored in the tail lobes. During the typical nonstorm substorm, a more dipolar field also develops, but the dipolarization is weaker and maximizes only near the end of the expansion phase, after the AE index has reached its maximum value. Moreover, during this type of substorm, the lobe field strength stays nearly constant. This work raises fundamental questions about the differences between proc- esses during relatively quiet and relatively disturbed condi- tions. Certainly more research is needed in this area.
Results presented by Baker et al. (Re-examination of driven and unloading aspects of magnetospheric substorms, submitted to Journal of Geophysical Research, 1995, herein- after referred to as Baker et al., submitted manuscript, 1995b) utilized the Faraday loop nonlinear dynamical model of substorms. Computational simulations were shown using realistic solar wind input time series. Baker et al. demon- strated that realistic replications of the AL index result from the model simulations if unloading is included in the model. On the other hand, if unloading is not permitted, that is, if only a driven response is included, then the resulting AL (electrojet current)simulation is unrealistic in both its am- plitude and its temporal evolution. Quite importantly, the bimodal shape of the linear response filters (as found by Bargatze et al. [1985]) could not be reproduced unless un- loading was included.
The modeling results presented by Baker et al. (submitted manuscript, 1995b) also shed new light on several aspects of geomagnetic activity: (1) the nature of the isolated sub- storm response was characterized for the full dynamical path through growth, expansion, and recovery; (2) the role of chaotic and nonchaotic behavior was clarified for realistic
solar wind input conditions; and (3) the intrinsically bi- modal response of the magnetosphere was demonstrated for moderate activity conditions both for the real system and for the analogue system. This tends to suggest again (as seen in earlier work)that the simple analogue models including tail reconnection are able to capture much of the essence of ac-

13,004 BAKER ET AL.: THE NEAR-EARTH NEUTRAL LINE MODEL
.........
x
x

BAKER ET AL.: THE NEAR-EARTH NEUTRAL LINE MODEL 13,005
tual magnetospheric behavior. As shown by Baker et al. (submitted manuscript, 1995b) and Klimas et al. [this issue], the Faraday loop model clearly requires an internal unloading process in order to reproduce the data. It therefore is con- cluded that both driven and loading-unloading processes are key to describing fully the general substorm dynamical se- quence.
4.5. Modeling and Theory
The ISTP program with its multiplicity of observations from various key regions emphasizes the role of large-scale models in order to interpret the complex, combined data sets. The global magnetic field configuration is highly vari- able, thus comparisons of data sets from different regions re- quires time-dependent information about the magnetic field evolution as shown in Plate 3 [Pulkkinen et al., 1995b]. Thus empirical formulas representing the various states of the magnetosphere are urgently needed.
In addition to the magnetic field configuration, the plasma motions are controlled by the large-scale electric field pattern. Simple models for the near-Earth electric field [e.g., Volland, 1973] and statistical results for the inner magnetosphere and near-Earth tail [Angelopoulos et al., 1992] exist, but the models for the electric field pattern are much less detailed than the corresponding models for the magnetic field.
For the model studies, it is important to recognize the need of the various-scale models. Mesoscale models are re-
quired for studying the detailed processes taking place in the current sheet at the instability onset, whereas the global MHD simulations can give us clues about the large-scale re- sponse of the magnetosphere to the solar wind driving. Fur- thermore, fully kinetic (small-scale) numerical and analytical studies are required for the instability mode analysis.
The larger databases and improved computer facilities have reached a level where the symmetry requirements tradi- tionally assumed in the models may no longer be necessary. The dawn-dusk asymmetry both in the magnetic field and plasma parameters, the asymmetric ring current closing through the ionosphere, and nonzero tilt angles are all ef- fects whose contribution to the substorm evolution have not
been investigated in detail. In particular, the large-scale field-aligned current patterns, the region 1 and region 2 cur- rents, are not represented in most present-day models.
5. Summary
In this paper we have reviewed the near-Earth neutral line model of substorms. We have attempted to provide an his- torical framework for the model, and we have tried to show the observational and theoretical underpinnings of this framework. In our opinion, the NENL approach is still the only one which constitutes a complete model of the global cycle of growth, expansion, and recovery of substorms. In particular, it treats the large-scale interaction of the magne- tosphere with the solar wind, and it also addresses the cou- pling of the magnetosphere to the polar and auroral iono- sphere. Any model that would attempt to supplant the NENL model must address all of these global aspects of substorm dynamics at least as well as the NENL model.
We have tried in this review to discuss the weaknesses of
the NENL model as well as its strengths. New observations force one to improve and refine continuously the model's de-
tails: This is the essence of science and seems to us in no
way a fatal shortcoming of the basic model. Many of the most recent observational results seem to fit rather naturally into the NENL framework. Also, numerical simulations and analogue models seem to support the general elements of the NENL approach. Throughout this review we have tried to show fruitful directions for continuing research. We are hopeful that powerful new theoretical modeling methods and a new generation of multipoint observations in the next few years will help us to improve the NENL model even more. In particular, it is hoped that the inner magnetotail can be modeled successfully, and it is also hoped that observations on all appropriate scales can reveal clearly the processes that drive auroral arcs and lead to the substorm onset.
Acknowledgments. Work at CU/LASP was supported by grant num- ber NAG5-2664 from NASA. The authors thank the two referees for
outstanding assistance in improving this paper. The Editor thanks V. A. Sergeev and G. Rostoker for their assistance
in evaluating this paper.
References
Akasofu, S. -I., The development of the auroral substorm, Planet. Space Sci., 12, 273-282, 1964.
Akasofu, S.-I., Polar and Magnetospheric Substorms, D. Reidel, Nor- well, Mass., 1968.
Akasofu, S. oI., Assessing the magnetic reconnection paradigm, Eos Trans. AGU, 75, 248-, 1994.
Angelopoulos, V., W. Baumjohann, C. F. Kennel, F. V. Coroniti, M. G. Kivelson, R. Pellat, R. J. Walker, H. Liihr, and G. Paschmann, Bursty bulk flows in the inner central plasma sheet, J. Geophys. Res., 97, 4027-4039, 1992.
Angelopoulos, V., C. F. Kennel, F. V. Coroniti, W. C. Feldman, J. T. Gosling, M. G. Kivelson, R. J. Walker, and C. T. Russell, Observa- tions of a quasi-static plasma sheet boundary, Geophys. Res. Lett., 20, 2813-2816, 1993.
Angelopoulos, V., C. F. Kennel, F. V. Coroniti, R. Pellat, M. G. Kivelson, R. J. Walker, C. T. Russell, W. Baumjohann, W. C. Feldman, and J. T. Gosling, Statistical characteristics of bursty bulk flow events, J. Geo- phys. Res., 99, 21,257-21,280, 1994a.
Angelopoulos, V., V. A. Sergeev, D. N. Baker, D. G. Mitchell, G. D. Reeves, C. T. Russell, and H. J. Singer, Multi-point study of bursty bulk flow events during a sequence of small substorms, in Proceed- ings of the Second International Conference on Substorms, pp. 643- 650, AGU, Washington, D.C., 1994b.
Angelopoulos, V., et al., Growth and evolution of a plasmoid associated with a small isolated substorm: IMP 8 and GEOTAIL measurements in the magnetotail, Geophys. Res. Lett., 2, 3011-3014, 1995b.
Angelopoulos, V., F. V. Coroniti, C. F. Kennel, M. G. Kivelson, R. J. Walker, C. T. Russell, R. L. McPherron, W. Baumjohann, E. Sanchez, C.-I. Meng, W. Baumjohann, G. D. Reeves, R. D. Belian, N. Sato, E. Friis-Christensen, P. R. Sutcliffe, K. Yumoto, and T. Har- ris, Multi-point analysis ofbursty bulk flow events, I, April 11, 1985, J. Geophys. Res., in press, 1996.
Aubry, M.P., and R. L. McPherron, Magnetotail changes in relation to the solar wind magnetic field and magnetospheric substorms, J. Geo- phys. Res., 76, 4381-4401, 1971.
Aubry, M.P., C. T. Russell, and M. G. Kivelson, Inward motion of the magnetopause before a substorm, J. Geophys. Res., 75, 7018-7031, 1970.
Axford, W. I., and C. O. Hines, A unifying theory of high-latitude geo- physical phenomena and geomagnetic storms, Can. J. Phys., 39, 1433-1464, 1961.
Baker, D. N., and R. L. McPherron, Extreme energetic particle de- creases near geostationary orbit: A manifestation of current diversion within the inner plasma sheet, J. Geophys. Res., 95, 6591-6599, 1990.

13,006 BAKER ET AL.: THE NEAR-EARTH NEUTRAL LINE MODEL
Baker, D. N., and T. I. Pulkkinen, The earthward edge of the plasma sheet in magnetospheric substorms, in Magnetospheric Substorms, Geophys. Monogr. Ser., vol. 64, edited by J. R. Kan et al., pp. 147, AGU, Washington, D.C., 1991.
Baker, D. N., P. R. Higbie, E. W. Hones Jr., and R. D. Belian, High- resolution energetic particle measurements at 6.6 R E , 3, Low-energy electron anisotropies and short-term substorm predictions, J. Geo- phys. Res., 83, 4863-4868, 1978.
Baker, D. N., E. W. Hones Jr., J. B. Payne, and W. C. Feldman, A high time resolution study of interplanetary parameter correlations with AE, Geophys. Res. Lett., 8, 179-182, 1981.
Baker, D. N., S. -I. Akasofu, W. Baumjohann, J. W. Bieber, D. H. Fair- field, E. W. Hones Jr., B. Mauk, R. L. McPherron, and T. E. Moore, Substorms in the magnetosphere, NASA Ref Publ., 1120, 1984a.
Baker, D. N., S. J. Bame, R. D. Belian, W. C. Feldman, J. T. Gosling, P.
currents in MHD simulations of magnetotail reconnection, J. Geo- phys. Res., 96, 1611-1618, 1991.
Bim, J., K. Schindler, and M. Hesse, Magnetotail dynamics: MHD simu- lations of driven and spontaneous dynamic changes, in Substorms 2, pp. 135-142, Geophys. Inst., Univ. of Alaska, Fairbanks, 1994.
Blanchard, G. T., L. R. Lyons, O. de la Beaujardiere, M. J. Mendillo, and R. A. Doe, Measurements of the reconnection rate in the geomag- netic tail, paper presented at Int. Assoc. Geomagn. and Aeron., Boul- der, Colo., July 1-14, 1995.
Bosinger, T., and A. G. Yahnin, PilB type magnetic pulsations as a high time resolution monitor of substorm development, Ann. Geophys., 5, 231-238, 1987.
Buchner, J., and L. M. Zelenyi, Chaotization of the electron motion as the cause of an internal magnetotail instability and substorm onset, J. Geophys. Res., 92, 13,456-13,466, 1987.
R. Higbie, E. W. Hones Jr., D. J. McComas, and R. D. Zwickl, Cor- Burton, R. K., R. L. McPherron, and C. T. Russell, An empirical relation- related dynamical changes in the near-Earth and distant magnetotail ship between interplanetary conditions and Dst, J. Geophys. Res., 80, regions: ISEE 3, J. Geophys. Res., 89, 3855-3864, 1984b. 4204-4214, 1975.
Baker, D. N., et al., Direct observations of passages of the distant neutral Caan, M. N., R. L. McPherron, and C. T. Russell, Substorm and inter- line (80-140 RE) following substorm onsets: ISEE 3, Geophys. Res. planetary magnetic field effect on the geomagnetic tail lobes, J. Lett., 11, 1042-1045, 1984c. Geophys. Res., 80, 191-194, 1975.
Baker, D. N., L. F. Bargatze, and R. D. Zwickl, Magnetospheric re- Caan, M. N., R. L. McPherron, and C. T. Russell, Characteristics of the sponse to the IMF: Substorms, J. Geomagn. Geoelectr., 38, 1047- association between the interplanetary magnetic field and substorms, 1073, 1986. J. Geophys. Res., 82, 4837-4842, 1977.
Baker, D. N., R. C. Anderson, R. D. Zwickl, and J. A. Slavin, Average Caan, M. N., R. L. McPherron, and C. T. Russell, The statistical magnetic plasma and magnetic field variations in the distant magnetotail asso- ciated with near-Earth substorm effects, J. Geophys. Res., 92, 71-82, 1987.
Baker, D. N., A. J. Klimas, R. L. McPherron, and J. Buchner, The evolu- tion from weak to strong geomagnetic activity: An interpretation in terms of deterministic chaos, Geophys. Res. Lett., 17, 41-44, 1990.
Baker, D. N., et al., CDAW-9 analysis of magnetospheric events on May 3, 1986: Event C, J. Geophys. Res., 98, 3815-3834, 1993.
Baker, D. N., T. I. Pulkkinen, E. W. Hones Jr., R. D. Belian, R. L. McPherron, and V. Angelopoulos, Signatures of the substorm recov- ery phase at high-altitude spacecraft, J. Geophys. Res., 99, 10,967- 10,980, 1994a.
Baker, D. N., T. I. Pulkkinen, R. L. McPherron, and C. R. Clauer, Multi- spacecraft study of substorm growth and expansion features using a time-evolving field model, in Geophys. Monogr. Ser., vol. 84, edited by H. Waite Jr., pp. 101-110, AGU, Washington, D.C., 1994b.
Bargatze, L. F., D. N. Baker, R. L., McPherron, and E. W. Hones, Jr., Magnetospheric impulse response for many levels of geomagnetic activity, J. Geophys. Res., 90, 6387-6394, 1985.
Baumjohann, W., and K.-H. Glassmeier, The transient response mecha- nism and Pi 2 pulsations at substorm onset- Review and outlook, Planet. Space Sci., 32, 1361-1370, 1986.
Baumjohann, W., R. Pellinen, H. J. Opgenoorth, and E. Nielsen, Joint two-dimensional observations of ground magnetic and ionospheric electric fields associated with auroral zone currents: Current systems associated with local auroral breakups, Planet. Space Sci., 29, 431- 447, 1981.
Baumjohann, W., G. Paschmann, and C. A. Cattell, Average plasma properties in the central plasma sheet, J. Geophys. Res., 94, 6597- 6606, 1989.
Baumjohann, W., G. Paschmann, and H. Liihr, Characteristics of high- speed ion flows in the plasma sheet, J. Geophys. Res., 95, 3801-3809, 1990.
Baumjohann, W., G. Paschmann, T. Nagai, and H. Ltihr, Superposed ep- och analysis of the substorm plasma sheet, J. Geophys. Res., 96, 11,605-11,608, 1991.
Baumjohann, W., G. Paschmann, and T. Nagai, Thinning and expansion of the substorm plasma sheet, J. Geophys. Res., 97, 17,173-17,175, 1992.
Baumjohann, W., Y. Kamide, and R. Makamura, Storms, substorms, and the near-Earth tail, J. Geomagn. Geoelectr., in press, 1995.
Bim, J., MHD simulations of plamoid formation and magnetotail current disruption, J. Geophys. Res., this issue.
Bim, J., and M. Hesse, The substorm current wedge and field-aligned
signature of magnetospheric substorms, Planet. Space Sci., 26, 269- 279, 1978.
Cattell, C. A., C. W. Carlson, W. Baumjohann, and H. Ltihr, The MHD structure of the plasma sheet boundary layer, Geophys. Res. Lett., 19, 2083-2096, 1992.
Chapman, S., and J. Bartels, Geomagnetism, vol. 2, 506 pp., Clarendon, Oxford, 1962.
Chen, C. X., and R. A. Wolf, Interpretation of high-speed flows in the plasma sheet, J. Geophys. Res., 98, 21,409-21,420, 1993.
Christon, S. P., D. G. Mitchell, D.J. Williams, L. A. Frank, C. Y. Huang, and T. E. Eastman, Energy spectra of plasma sheet ions and electrons from-50 eV/e to ~1 MeV during plasma temperature transitions, J. Geophys. Res., 93, 2562-2572, 1988.
Christon, S. P., et al., Energetic atomic and molecular ions of ionospheric origin observed in distant magnetotail flow-reversal events, Geophys. Res. Lett., 21, 3023-3026, 1994.
Clauer, C. R., R. L. McPherron, C. Searls, and M. G. Kivelson, Solar
wind control of auroral zone geomagnetic activity, Geophys. Res. Lett., 8, 915-918, 1981.
Clauer, C. R., R. L. McPherron, and C. Searls, Solar wind control of the
low-latitude asymmetric magnetic disturbance field, J. Geophys. Res., 88, 2123-2130, 1983.
Coroniti, F. V., Explosive tail reconnection: The growth and expansion phases of magnetospheric substorms, J. Geophys. Res., 90, 7427- 7447, 1985.
Coroniti, F. V., and C. F. Kennel, Polarization of the auroral electrojet, J. Geophys. Res., 77, 2835-2850, 1972a.
Coroniti, F. V., and C. F. Kennel, Changes in magnetospheric configura- tion during the substorm growth phase, J. Geophys. Res., 77, 3361- 3370, 1972b.
Coroniti, F. V., and C. F. Kennel, Can the ionosphere regulate magneto- spheric convection, J. Geophys. Res., 78, 2837-2851, 1973.
Coroniti, F. V., L. A. Frank, D. J. Williams, R. P. Lepping, F. L. Scarf, and K. L. Ackerson, Plasma flow pulsations in the Earth's magnetic tail, J. Geophys. Res., 83, 2162-2168, 1978.
Coroniti, F. V., L. A. Frank, D. J. Williams, R. P. Lepping, F. L. Scarf, S. M. Krimigis, and G. Gloeckler, Variability of plasma sheet dynamics, J. Geophys. Res., 85, 2957-2977, 1980.
Cowley, S. W. H., The causes of convection in the Earth's magneto- sphere: A review of developments during the IMS, Rev. Geophys., 20, 531-565, 1982.
Daglis, I. A., E. T. Sarris, and G. Kremser, Ionospheric contribution to the cross-tail current enhancement during the substorm growth phase, J. Atmos. Terr. Phys., 53, 1091-1098, 1991.

BAKER ET AL.: THE NEAR-EARTH NEUTRAL LINE MODEL 13,007
Daglis, I. A., E. T. Sarris, G. Kremser, and B. Wilken, On the solar wind-magnetosphere-ionosphere coupling: AMPTFdCCE particle data and the AE indices, Eur. Space Agency Spec. Publ., SP-346, p. 193, 1992.
Davidson, G. T., Pitch-angle diffusion and the origin of temporal and spatial structures in morningside aurorae, Space Sci. Rev., 53, 45, 1990.
De Coster, R. J., and L. A. Frank, Observations pertaining to the dynam- ics of the plasma sheet, J. Geophys. Res., 84, 5099-5121, 1979.
Dessler, A. J., and E. N. Parker, Hydromagnetic theory of magnetic storms, J. Geophys. Res., 64, 2239-2259, 1959.
Dmitrieva, N. P., and V. A. Sergeev, The spontaneous and induced onset of the explosive phase of a magnetospheric substorm and the duration of its preliminary phase, Geomagn. Aero., Engl. Transl., 23, 380-383, 1983.
Dungey, J. W., Interplanetary magnetic field and the auroral zones, Phys. Res. Lett., 6, 47-48, 1961.
Eastman, T. E., L. A. Frank, W. K. Pederson, and W. Lennartsson, The
plasma sheet boundary layer, J. Geophys. Res., 89, 1553-1572, 1984. Eastman, T. E., L. A. Frank, and C. Y. Huang, The boundary layers as
the primary transport regions of the Earth's magnetotail, J. Geophys. Res., 90, 9541-9560, 1985.
Elphinstone, R. D., D. Heam, J. S. Murphree, and L. L. Cogger, Mapping using the Tsyganenko long magnetospheric model and its relationship to Viking auroral images, J. Geophys. Res., 96, 1467-1480, 1991.
Elphinstone, R. D., et al., Observations in the vicinity of substorm onset: Implications for the substorm process, J. Geophys. Res., 100, 7937- 7969, 1995a.
Elphinstone, R. D., et al., The double oval UV auroral distribution. 1. Im- plications for the mapping of auroral arcs, J. GeøPhys., Res., 100, 12,075-12,092, 1995b.
Erickson, G. M., and R. A. Wolf, Is steady convection possible in the Earth's magnetotail?, Geophys. Res. Lett., 7, 897-900, 1980.
Erickson, G. M., R. W. SPiro, and R. A. Wolf, The physics of the Harang discontinuity, J. Geophys. Res., 96, 1633-1645, 1991.
Fairfield, D. H., Average magnetic field configuration of the outer mag- netosphere, J. Geophys. Res., 73, 7329-7338, 1968.
Fairfield, D. H., Magnetotail energy storage and the variability of the magnetotail current sheet, in Magnetic Reconnection in Space and Laboratory, Geophys. Monogr. Ser., vol. 30, edited by E. W. Hones Jr., pp. !68-177, AGU, Washington, D.C., 1984.
Fairfield, D. H., Solar wind control of magnetosPheric pressure (CDAW-6), J. Geophys. Res., 90, 1201-1204, 1985.
Fairfield, D. H., and L. J. Cahill Jr., Transition region magnetic field and polar magnetic disturbances, J. Geophys. Res., 71, 155-169, 1966.
Fairfield, D. H., et al., Substorms, plasmoids, flux ropes, and magnetotail flux loss on March 25, 1983: CDAW-8, J. Geophys. Res., 94, 15,135- 15,152, 1989.
Fay, R. A., C. R. Garrity, R. L., McPherron, and L. F. Bargatze, Predic- tion filters for the Dst index and the polar cap potential, in Solar Wind-Magnetosphere Coupling, edited by Y. Kamide and J. A. Slavin, pp. 111-117, Terra Sci., Tokyo, 1986.
Fedder, J. A:, S. P. Slinker, J. G. Lyon, and R. D. Elphinstone, Global numerical simulation of the growth phase and expansion onset of a substorm observed by Viking, J. Geophys. Res., 100, 19,083-19,093, 1995.
Feldstein, Y. I., and G. V. Starkov, Dynamics of auroral belt and polar geomagnetic disturbances, Planet. Space Sci., 15, 209-229, 1967.
Forbes, T. G., E. W. Hones Jr., S. J. Bame, J. R. Asbridge, G. Pasch- mann, N. Sckopke, and C. T. Russell, Evidence for the tailward re- treat of a magnetic neutral line in the magnetotail during substorm re- covery, Geophys. Res. Lett., 8, 261-264, 1981.
Frank, L. A., and W. R. Paterson, Survey of electron and ion bulk flows in [he distant magnetotail with the Geotail spacecraft, Geophys. Res. Lett., 21, 2963-2966, 1994.
Frank, L. A., K. L. Ackerson, and R. P. Lepping, On hot tenuous plas- mas, fireballs and boundary layers in the Earth's magnetotail, J. Geo- phys. Res., 81, 5859-5881, 1976.
Frank, L. A., W. R. Paterson, K. L. Ackerson, S. Kokubun, T.
Yamamoto, D. H. Fairfield, and R. P. Lepping, Observations of plas- mas associated with the magnetic signature of a plasmoid in the dis- tant magnetotail, Geophys. Res. Lett., 21, 2967-2970, 1994.
Galperin, Y. I., and Y. I. Feldstein, Auroral luminosity and its relation- ship to magnetospheric plasma domains, in Auroral Physics, (edited by C.-I. Meng, M. J. Rycroft, and L. A. Frank), pp. 207-222, Cam- bridge Univ. Press, New York, 1991.
Hesse, M., and J. Birn, Three-dimensional MHD modeling of magneto- tail dynamics for different polytropic indices, J. Geophys. Res., 97, 3965-3976, 1992.
Hesse, M., and J. Bim, On the energy budget in the current disruption region, Geophys. Res. Lett., 20, 1451-1454, 1993.
Hesse, M., The magnetotail's role in magnetospheric dynamics: Engine or exhaust pipe?, U.S. Natl. Rep. Int. Union Geod. Geophys. 1991- 1994, Rev. Geophys., 33, pp. 675-683, 1995.
Hirahara, M., M. Nakamura, T. Terasawa, T. Mukai, Y. Saito, T. Yamamoto, A. Nishida, S. Machida, and S. Kokubun, Acceleration
and heating of cold ion beams in the plasma sheet boundary layer ob- served with Geotail, Geophys. Res. Lett., 21, 3003-3006, 1994.
Holzer, R. E., and J. A. Slavin, Magnetic flux transfer associated with expansions and contractions of the dayside magnetosphere, J. Geo- phys. Res., 83, 3831-3839, 1978.
Hones, E. W., Jr., Transient phenomena in the magnetotail and their re- lation to substorms, Space Sci. Rev., 23, 393-410, 1979.
Hones, E. W., Jr., Plasma sheet behavior during substorms, in Magnetic Reconnection in Space and Laboratory Plasmas, Geophys. Monogr. Ser., vol. 30, edited'by E. W. Hones Jr., pp. 178-184, AGU, Wash- ington, D.C., 1984.
Hones, E. W., Jr., and K. Schindler, Magnetotail plasma flow during sub- storms: A survey with IMP 6 and IMP 8, J. Geophys. Res., 84, 7155- 7169, 1979.
Hones, E. W., Poleward leaping auroras, the substorm expansive and re- covery phases and the recovery of the plasma sheet, in Substorms 1, Eur. Space Agency Spec. Publ., ESA SP-335, 477, 1992.
Hones, E. W., Jr., D. N. Baker, S. J. Bame, W. C. Feldman, J. T. Gosling, D. J. McComas, R. D. Zwickl, J. A. Slavin, E.J. Smith, and B. T. Tsu-
rutani, Structure of the magnetotail at 220 R E and its response to geomagnetic activity, Geophys. Res. Lett., 22, 5, 1984a.
Hones, E. W., Jr., T. Pytte, and H. I. West Jr., Associations of geomag- netic activity with plasma sheet thinning and expansion: A statistical study, J. Geophys. Res., 89, 5471-5478, 1984b.
Hones, E. W., Jr., T. A. Fritz, J. Birn, J. Cooney, and S. J. Bame, Detailed observations of the plasma sheet during a substorm on April 24, 1979, J. Geophys. Res., 91, 6845-6859, 1986.
Huang, C. Y., and L. A. Frank, A statistical study of the central plasma sheet: Implications for substorm models, Geophys. Res. Lett., 13, 652- 655, 1986.
Huang, C. Y., L. A. Frank, and T. E. Eastman, Plasma flows near the neutral sheet of the magnetotail, in Magnetotail Physics, ( edited by A. T. Y. Lui), pp. 127-135, Johns Hopkins Univ. Press, Baltimore, Md., 1987.
Huang, C. Y., L. A. Frank, G. Rostoker, J. Fennel, and D. G. Mitchell, Nonadiabatic heating of the central plasma sheet at substorm onset, J. Geophys. Res., 97, 1481-1495, 1992.
Hughes, W. J., and D. G. Sibeck, On the 3-dimensional structure of plasmoids, Geophys. Res. Lett., 14, 636-639, 1987.
Iyemori, T., H. Maeda, and T. Kamei, Impulse response of geomagnetic indices to interplanetary magnetic field, J. Geomagn. Geoelectr., 31, 1-9, 1979.
Jacquey, C., and J. A. Sauvand, Correlated dynamics of the tail and the ionosphere related with energy transfer between the solar wind and the magnetosphere, Adv. Space Res., 13, 437, 1993.
Jacquey, C., J. A. Sauvaud, and J. Dandouras, Location and propagation of the magnetotail current disruption during substorm expansion: Analysis and simulation of an ISEE multi-onset event, Geophys. Res. Lett., 18, 389-392, 1991.
Jacquey, C., J. A. Sauvaud, J. Dandouras, and A. Korth, Tailward propagating cross-tail current disruption and dynamics of near-Earth
13,008 BAKER ET AL.: THE NEAR-EARTH NEUTRAL LINE MODEL
tail: A multi-point measurement analysis, Geophys. Res., Lett., 20, 938-986, 1993.
Jacquey, C., D. J. Williams, R. W. McEntire, A. T. Y. Lui, V. An- gelopoulos, S. P. Christon, S. Kokubun, T. Yamamoto, G. D. Reeves, and R. D. Belian, Tailward energetic ion streams observed at -100 R E by Geotail-EPIC associated with geomagnetic activity intensifi- cation, Geophys. Res. Lett., 21,3015-3018, 1994.
Janhunen, P., T. I. Pulkkinen, and K. Kauristie, Auroral fading in iono- sphere-magnetosphere coupling model: Implication for possible mechanisms, Geophys. Res. Lett., 22, 2049-2052, 1995.
Kan, J. R., A global magnetosphere-ionosphere coupling model of sub- storms, J. Geophys. Res., 98, 17,263-17,276, 1993.
Kaufmann, R.L., Substorm currents: Growth phase and onset, J. Geo- phys. Res., 92, 7471-7486, 1987.
Kawano, H., A. Nishida, M. Fujitubo, T. Mukai, S. Kokubun, T. Yamamoto, M. Hirahara, Y. Saito, S. Machida, and K. Yumoto,
Quasi-stagnant plasmoids observed with Geotail on October 15, 1993, in IUGG XXI General Assembly, 1995.
Kettman, G., T. A. Fritz, and D. W. Hones Jr., CDAW7 revisited: Fur- ther evidence for the creation of a near-Earth neutral line, J. Geo-
phys. Res., 95, 12,045-12,056, 1990. Khurana, K. K., M. G. Kivelson, and L. A. Frank, The relationship of
magnetic flux ropes to substorms, Adv. Space Res., in press, 1995a. Khurana, K. K., M. G. Kivelson, L. A. Frank, and W. R. Paterson, Ob-
servations of magnetic flux ropes and associated currents in Earth's magnetotail with the Galileo spacecraft, Geophys. Res. Lett., 22, 2087-2090, 1995b.
Klimas, A. J., D. N. Baker, D. A. Roberts, and D. H. Fairfield, A nonlin-
ear dynamical analogue model of geomagentic activity, J. Geophys. Res., 97, 12,253-12,266, 1992.
Klimas, A. J., D. N. Baker, D. Vassiliadis, and D. A. Roberts, Substorm recurrence during steady and variable solar wind driving: Evidence for a normal mode in the unloading dynamics of the magnetosphere, J. Geophys. Res., 99, 14,855-14,862, 1994.
Klimas, A. J., D. Vassiliadis, D. N. Baker, and D. A. Roberts, Organized dynamics of the magnetosphere, J. Geophys. Res., this issue.
Knight, S., Parallel electric fields, Planet. Space Sci., 21,741-750, 1973. Kokubun, S., and R. L. McPherron, Substorm signatures at synchronous
altitude, J. Geophys. Res., 86, 11,265-11,277, 1981. Kokubun, S., R. L. McPherron, and C. T. Russell, Triggering of sub-
storms by solar wind discontinuities, J. Geophys. Res., 82, 74-86, 1977.
Koskinen, H. E. J., and T. I. Pulkkinen, Midnight velocity shear zone and the concept of Harang discontinuity, J. Geophys. Res., 100, 9539- 9547, 1995.
Koskinen, H. E. J., R. E. Lopez, R. J. Pellinen, T. I. Pulkkinen, D. N. Baker, and T. Bosinger, Pseudobreakup and substorm growth phase in the ionosphere and magnetosphere, J. Geophys. Res., 98, 5801- 5813, 1993.
Krimigis, S. M., and E. T. Sarris, Energetic particle bursts in the Earth's magnetotail, in Dynamics of the Magnetosphere, edited by S. Aka- sofu, pp. 599-630, D. Reidel, Norwell, Mass., 1979.
Kuznetsova, M. M., and L. M. Zelenyi, Magnetic reconnection in colli- sionless field reversals: The universality of the ion tearing mode, Geophys. Res. Lett., 18, 1825-1828, 1991.
Lennartsson, W., and E.G. Shelley, Survey of 0.1 to 16-keV/e plasma sheet ion composition, J. Geophys. Res., 91,3061-3076, 1986.
Lin, N., R. L. McPherron, M. G. Kivelson, and R. J. Walker, Multipoint reconnection in the near-Earth magnetotail: CDAW-6 observations of energetic particles and magnetic field, J. Geophys. Res., 96, 19,427-19,439, 1991.
Lopez, R. E., and A. T. Y. Lui, A multi-satellite case study of the expan- sion of a substorm current wedge in the near-Earth magnetotail, J. Geophys. Res., 95, 8009-8017, 1990.
Lopez, R. E., R. W. McEntire, T. A. Potemra, D. N. Baker, and R. D. Belian, A possible case of radially anti-Sunward propagating sub- storm onset in the near-Earth magnetotail, Planet. Space Sci., 38, 771-784, 1990.
Lopez, R. E., H. E. Spence, and C. -I. Meng, Substorm aurorae and their
connection to the inner magnetosphere, J. Geomagn. Geoelectr., 44, 1251-1260, 1992.
Lopez, R. E., H. E. J. Koskinen, T. I. Pulkkinen, T. Bosinger, R. W. McEntire, and T. A. Potemra, Simultaneous observation of the pole- ward expansion of substorm electrojet activity and the tailward ex- pansion of current sheet disruption in the near-Earth magnetotail, J. Geophys. Res., 98, 9285-9295, 1993.
Lopez, R. E., C. C. Goodrich, G. D. Reeves, R. D. Belian, and A. Tak- takishvili, Midtail plasma flows and the relationship to near-Earth substorm activity: A case study, J. Geophys. Res., 99, 23,561-23,569, 1994.
Lui, A. T. Y., A synthesis of magnetospheric substorm models, J. Geo- phys. Res., 96, 1849-1856, 1991.
Lui, A. T. Y, R. E. Lopez, S. M. Krimigis, R. W. McEntire, L. J. Zanetti, and T. A. Potemra, A case study of magnetotail current sheet disrup- tion and diversion, Geophys. Res. Lett., 15, 721-724, 1988.
Lui, A. T. Y., A Mankofsky, C.-L. Chang, K. Papadopolous, and C. S. Wu, A current disruption mechanism in the neutral sheet: A possible trigger for substorm expansions, Geophys. Res. Lett., 17, 745-748, 1990.
Lui, A. T. Y., R. E. Lopez, B. J. Anderson, K. Takahashi, L. J. Zanetti, R. W. McEntire, T. Potemra, D. Klumpar, E. M. Greene, and R. Strangeway, Current disruptions in the near-Earth neutral sheet •e- gion, J. Geophys. Res., 97, 1461-1480, 1992.
Lui, A. T. Y., D. J. Williams, S. P. Christon, R. W. McEntire, V. An-
gelopoulos, C. Jacquey, T. Yamamoto, and S. Kokubun, A prelimi- nary assessment of energetic ion species in flux ropes/plasmoids in the distant tail, Geophys. Res. Lett., 21, 3019-3022, 1994.
Lui, A. T. Y., Current disruption in the Earth's magnetosphere: Observa- tions and models, J. Geophys. Res., this issue.
Lyons, L. R., Substorms: Fundamental observational features, distinction from other disturbances, and external triggering, J. Geophys. Res., this issue.
Machida, S., T. Mukai, Y. Saito, T. Obara, T. Yamamoto, A. Nishida, M. Hirahara, T. Terasawa, and S. Kokubun, Geotail low energy particle and magnetic field observations of a plasmoid at XGSM=-142 R E, Geophys. Res. Lett., 21, 2995-2998, 1994.
Maezawa, K., Magnetotail boundary motion associated with geomag- netic substorms, J. Geophys. Res., 80, 3543-3548, 1975.
Mauk, B. H., and C.-I. Meng, The aurora and middle magnetospheric processes, in Auroral Physics, (edited by C.-I. Meng, M. J. Rycroft, and L. A. Frank), pp. 223-239, Cambridge Univ. Press, New York, 1991.
McGuire, R. E., R. H. Manka, and D. N. Baker, The CDAW program, Eos Trans. AGU, 74, 270, 1993.
McPherron, R. L., The use of ground magnetograms to time the onset of magnetospheric substorms, J. Geomagn. Geoelectr., 30, 149-163, 1978.
McPherron, R. L., Physical Processes Producing Magnetospheric Sub- storms and Magnetic Storms, in Geomagnetism, Vol. 4, edited by J. Jacobs, pp. 593-739, Academic Press, London, 1991.
McPherron, R. L., The growth phase of magnetospheric substorms, in Substorms 2, AGU, p. 213-220, 1994.
McPherron, R. L., and R. H. Manka, Dynamics of the 1054 UT, March 22, 1979 substorm event: CDAW-6, J. Geophys. Res., 90, 1175-1190, 1985.
McPherron, R. L., C. T. Russell, and M. Aubry, Satellite studies of mag- netospheric substorms on August 15, 1978, 9, Phenomenological model for substorms, J. Geophys. Res., 78, 3131-3149, 1973.
McPherron, R. L., D. N. Baker, and L. F. Bargatze, Linear filters as a method of real time prediction of geomagnetic activity, in Solar Wind-Magnetosphere Coupling, edited by Y. Kamide and J.A. Slavin, pp. 85-92, Terra Sci., Tokyo, 1986a.
McPherron, R. L., T. Terasawa, and A. Nishida, Solar wind triggering of substorm onset, J. Geomagn. Geoelectr., 38, 1089-1108, 1986b.
McPherron, R. L., A. Nishida, and C. T. Russell, Is near-earth current
sheet thinning the cause of auroral substorm expansion onset? (extended abstract), in Quantitative Modeling of Magnetosphere-

BAKER ET AL.: THE NEAR-EARTH NEUTRAL LINE MODEL 13,009
Ionosphere Coupling Processes, edited by Y. Kamide and R.A. Wolf, pp. 252-257, Kyoto Sangyo Univ., Kyoto, Jpn., 1987.
Mitchell, D. G., D. J. Williams, C. Y. Huang, L. A. Frank, and C. T. Rus- sell, Current carders in the near-Earth cross tail current sheet during substorm growth pahse, Geophyhs. Res. Lett., 15, 583-586, 1990.
Moldwin, M. B., and W. J. Hughes, Plasmoids as flux ropes, J. Geophys. Res., 96, 14,051-14,064, 1991.
Moldwin, M. B., and W. J. Hughes, On the formation and evolution of plasmoids: A survey of ISEE 3 geotail data, J. Geophys. Res., 97, 19,259-19,281, 1992.
Moldwin, M. B., and W. J. Hughes, Geomagnetic substorm association of plasmoids, J. Geophys. Res., 98, 81-88, 1993.
Mukai, T., M. Hirahara, S. Machida, Y. Saito, T. Terasawa, and A. Nishida, Geotail observation of cold ion streams in the distant mag- netotail lobes in the course of a substorm, Geophys. Res. Lett., 21, 1023-1026, 1994.
Murphree, J. S., R. D. Elphinstone, L. L. Cogger, and D. Hearn, Viking optical substorm signatures, in Magnetospheric Substorms, Geophys. Monogr. Ser., vol. 64, edited by J. R. Kan et al., pp. 241-255, A GU, Washington, D.C., 1991.
Nagai, T., K. Takahashi, H. Kawano, T. Yamamoto, S. Kokubun, and A. Nishida, Initial Geotail survey of magnetic substorm signatures in the magnetotail, Geophys. Res. Lett., 21, 2991-2994, 1994.
Nakamura, M., G. Paschmann, W. Baumjohann, and N. Sckopke, Ion distributions and flows near the neutral sheet, J. Geophys. Res., 96, 5631-5649, 1991,
Nakamura, M., G. Paschmann, W. Baumjohann, and N. Sckopke, Ion distributions and flows in and near the plasma sheet boundary layer, J. Geophys. Res., 97, 1449-1460, 1992.
Nakamura, R., D. N. Baker, D. H. Fairfield, D. G. Mitchell, R. L. McPherron, and E. W. Hones Jr., Plasma flow and magnetic field characteristics near the midtail neutral sheet, J. Geophys. Res., 99, 23,591-23,601, 1994a.
Nakamura, R., D. N. Baker, R. D. Belian, and E. A. Bering III, Particle and field signatures during the pseudobreakup and major expansion onset of substorms, J. Geophys. Res., 99, 207-222, 1994b.
Nishida, A., H. Hayakawa, and E. W. Hones Jr., Observed signatures of reconnection in the magnetotail, J. Geophys. Res., 86, 1442-1436, 1981.
Nishida, A., et al., Quasi-stagnant plasmoid in the middle tail: A new pre- expansion phenomenon, J. Geophys. Res., 91, 4245-4255, 1986.
Nishida, A., S. J. Bame, D. N. Baker, G. Gloeckler, M. Scholer, E. J. Smith, T. Terasawa, and B. Tsurutani, Assessment of the boundary layer model of the magnetospheric substorm, J. Geophys. Res., 93, 5579, 1988.
Nishida, A., T. Mukai, Y. Saito, T. Yamamoato, H. Hayakawa, K. Maezawa, S. Machida, T. Terasawa, S. Kokubun, and T. Nagai, Transition from slow flow to fast tailward flow in the distant plasma sheet, Geophys. Res. Lett., 21, 2939-2942, 1994a.
Nishida, A., T. Yamamoto, K. Tsuruda, H. Hayakawa, A. Matsuoka, S. Kokubun, M. Nakamura, and H. Kawano, Classification of the tail- ward drifting magnetic structures in the distant tail, Geophys. Res. Lett., 21, 2947-2950, 1994b.
Nishida, A., T. Mukai, T. Yamamoto, Y. Saito, and S. Kokubun, Geotail observations of the reconnection process in the distant tail in geomagnetically active times, Geophys. Res. Lett., 22, 2453-2456, 1995a.
Nishida, A., T. Mukai, T. Yamamoto, Y. Saito, S. Kokubun, Magnetotail convection in geomagnetically active times, 1, Distance to the neutral lines, J. Geomagn. Geoelectr., in press, 1995b.
Ohtani, S., S. Kokubun, and C. T. Russell, Radial expansion of the tail current disruption during substorms: A new approach to the substorm onset region, J. Geophys. Res., 97, 3129-3136, 1992a.
Ohtani, S., K. Takahashi, L. J. Zanetti, T. A. Potemra, R. W. McEntire, and T. Iijima, Initial signatures of magnetic field and energetic parti- cle fluxes at tail reconfiguration: Explosive growth phase, J. Geo- phys. Res., 97, 19,311-19,324, 1992b.
Ohtani, S., R. C. Elphic, C. T. Russel, and S. Kokubun, ISEE-1 and -2 ob- servations of an isolated diamagnetic event: An Earthward-moving
plasma bulge or a tail-aligned flux rope?, Geophys. Res. Lett., 19, 1743-1746, 1992c.
Opgenoorth, H.J., J. Oksman, K. U. Kaila, E. Nielsen, and W. Baumjo- hann, Characteristics of eastward drifting omega bands in the morn- ing sector of the auroral ova!, J. Geophys. Res., 88, 9171-9185, 1983.
Opgenoorth, H. J., M. A. L. Persson, T. I. Pulkkinen, and R. J. Pellinen, The recovery phase of magnetospheric substorms and its association with morning sector aurora, J. Geophys. Res., 99, 4115-4129, 1994.
Orsini, S., M. Candidi, M. Stokholm, and H. Balsiger, Injection of iono- spheric ions into the plasma sheet, J. Geophys. Res., 95, 7915-7928, 1990.
Paschmann, G., N. Sckopke, and E. W. Hones Jr., Magnetotail plasma observations during the 1054 UT substorm on March 22, 1979 (CDAW-6), J. Geophys. Res., 90, 1217-1229, 1985.
Pellat, R., F. V. Coroniti, and P. L. Pritchett, Does ion tearing exist?, Geophys. Res. Lett, 18, 143-146, 1991.
Pellinen, R. J., H. J. Opgenoorth, and T. I. Pulkkinen, Substorm recovery phase: Relationship to next activation, in Substorm 1, Eur. Space Agency Spec. Publ., ESA SP-335, 469-475, 1992.
Pellinen, R. J., T. I. Pulkkinen, and K. Kauristie, have we learned enough about auroral substorms morphology during the past 30 years?, in Substorms 2, pp. 43-48, Geophys. Inst., Univ. of Alaska, Fairbanks, 1994.
Perreault, P., and S. -I. Akasofu, A study of geomagnetic storms, Geo- phys. J. R. Astron. Soc., 54, 547-573, 1978.
Pontius, D, H., Jr., and R. A. Wolf, Transient flux tubes in the terrestrial magnetosphere, Geophys. Res. Lett., 17, 49-52, 1990.
Price, C. P., D. Prichard, and J. E. Bischoff, Nonlinear input-output analysis of the auroral electrojet index, J. Geophys. Res., 99, 13,227- 13,238, 1994.
prichard, D., and C. P. Price, Spurious dimension estimates from time serise of geomagnetic data, Geophys. Res. Lett., 19, 1623-1626, 1992.
Pritchett, P. L., and F. V. Coroniti, Convection and the formation of thin current sheets in the near-Earth plasma sheet, Geophys. Res. Lett., 21, 1587-1590, 1994.
Pulkkinen, T. I., D. N. Baker, D. H. Fairfield, R. J. Pellinen, J. S. Mur- phree, R. D. Elphinstone, R. L. McPherron, J. F. Fennell, and R. E. Lopez, Modeling of the growth phase of a substorm using the Tsy- agenko model and multi-spacecraft observations during the CDAW-9 event C, Geophys. Rev. Lett., 18, 1963-1966, 1991a.
Pulkkinen, T. I., H. E. J. Koskinen, and R. J. Pellinen, Mapping of auroral arcs during substorm growth phase, J. Geophys. Res., 96, 21,087- 21,094, 1991b.
Pulkkinen, T. I., R. J. Pellinen, H. E. Koskinen, H. J. Opgenoorth, J. S. Murphree, V. Petroy, A. Zaitzev, and E. Friis-Christensen, Auroral signatures of substorm recovery phase: A case study, Magneto- spheric Substorms, Geophys. Monogr. Ser., vol. 64, edited by J. R. Kan et al., pp. 333-342, AGU, Washington, D.C., 1991c.
Pulkkinen, T.I., D. N. Baker, R. J. Pellinen, J. Buchner, H. E. J. Koski- nen, R. E. Lopez, R. L. Dyson, and L. A. Frank, Particle scattering and current sheet stability in the geomagnetic tail during the substorm growth phase, J. Geophys. Res., 97, 19,283-19,297, 1992.
Pulkkinen, T. I., D. N. Baker, P. K. Toivanen, R. J. Pellinen, R. H. W. Friedel, and A. Korth, Magnetic field modeling during the substorm recovery phase, J. Geophys. Res., 99, 10,955-10,966, 1994.
Pulkkinen, T. I., D. N. Baker, R. J. Walker, J. Raeder, and M. Ashour- Abdalla, Comparison of empirical magnetic field models and global MHD simulations: The near-tail currents, Geophys. Res. Lett., 22, 675-678, 1995a.
Pulkkinen, T. I., D. N. Baker, P. K. Toivanen, J. S. Murphree, and L. A. Frank, Mapping of the auroral oval and individual arcs during sub- storms, J. Geophys. Res., 100, 21,987-21,994, 1995b.
Pytte, T., R. L. McPherron, E. W. Hones Jr., and H. I. West Jr., Multiple- satellite studies of magnetospheric substorms. III, Distinction between polar substorms and convection-driven negative bays, J. Geophys. Res., 83, 663-679, 1978.
Raeder, J., Global MHD simulations of the dynamics of the magneto- sphere: Weak and strong solar wind forcing, in Substorms 2, p. 561, Geophys. Inst., Univ. of Alaska, Fairbanks, 1994.

13,010 BAKER ET AL.' THE NEAR-EARTH NEUTRAL LINE MODEL
Raeder, J., R. J. Walker, and M. Ashour-Abdalla, The structure of the distant geomagnetic tail during long periods of northward IMF, Geo- phys. Res. Lett., 22,349-352, 1995.
Richardson, I. G., S. W. H. Cowley, E. W. Hones Jr., and S. J. Bame, Plasmoid-associated energetic ion bursts in the deep geomagnetic tail: Properties of plasmoids and the post-plasmoid plasma sheet, J. Geo- phys. Res., 92, 9,997-10,013, 1987.
Roberts, D. A., D. N. Baker, A. J. Klimas and I• F. Bargatze, Indications of low dimensionality in magnetospheric dynamics, Geophys. Res. Lett., 18, 151-154, 1991,
Rostoker, G., The auroral electrojets, Dynamics of the Magnetosphere, pp. 201-211, D. Reidel, Norwell, Mass., 1979.
Rostoker, G., Overview of observations and models of auroral sub- storms, in Auroral Physics, edited by C.-I. Meng, M. J. Rycroft, and I• A. Frank, p. 257, Cambridge Univ. Press, New York, 1991.
Roux, A., S. Pertaut, A. Morane, P. Robert, A. Korth, G. Kremser, A. Pederson, R. Pellinen, and Z. Y. Pu, Role of the near Earth plas- masheet at substorms, /n Magnetospheric Substorms, Geophys. Monogr. Ser., vol. 64, edited by J. R. Kan, et al., pp. 201-214, AGU, Washington, D.C., 1991.
Russell, C. T. and R. L. McPherron, Semiannual variation of geomag- netic activity, J. Geophys. Res., 78, 92-108, 1973a.
Russe•, C. T., and P• L. McPherron, The magnetotail and substorms, Space Sci. Rev., 15, 111-122, 1973b.
Saito, Y., T. Mukai, T. Terasawa, A. Nishida, S. Machida, M. Hirahara, K. Maezawa, S. Kolmbun, and T. Yamamoto, Slow mode shocks in the magp. etotail, J. Geophys. Res., 100, 23,567-23,581, 1995.
Samson, J. C., D. D. Wallis, T. J. Hughes, F. Creutzl•erg, J. M. Ruoho- niemi, and R. A. Greenwald, Substorm intensifications and field line resonances in the nightside magnetosphere, J. Geophys. Res., 97, 8495-8518, 1992.
Samson, J. C., L. R. Lyons, P. T. Newell, F. Creutzl•erg, and B. Xu, Pro- ton aurora and substorm intensifications, Geophys. Res. Lett., 19, 2167-2170, 1992.
Sanny, J., R. L. McPherron, C. T. Russell, D. N. Baker, T.I. Pulkkinen, and A. Nishida, Growth-phase thinning of the near-Earth current sheet during the CDAW-6 substorm, J. Geophys. Res., 99, 5805- 5816, 1994.
San-is, E. T., S. M. Kfimigis, T. Iijima, C. O. Bostrom, and T. P. Arm- strong, Location of the source of magnetospheric energetic particle bursts by multi-spacecraft observations, Geophys. Res. Lett., 3, 437- 440, 1976.
Sauvaud, J. A., A. Saint-Marc, J. Dandouras, H. Reme, A. Korth, G. Kremser, and G. K. Parks, A multisatellite study of the plasma sheet dynamics at substorm onset, Geophys. Res. Lett., 11,500-503, 1984.
Schindler, K., A theory of the substorm mechanism, d. Geophys. Res., 79, 2803-2810, 1974.
Sergeev, V. A., On the state of the magnetosphere during prolonged pe- riod of southward oriented IMF, Phys. Solar Terr., 5, 39, 1977.
Sergeev, V. A., Tail-aurora direct relationship, /n Substorm• 1, Eur. Space Agency Spec. PubI., ESA SP-335,277-289, 1992.
Sergeev, V. A., and W. Lennartsson, Plasma sheet at X--20 R E during steady magnetospheric convection, Planet. Space Sci., 36, 355, 1988.
Sergeev, V. A., R. J. Pellinen, T. Bosinger, W. Baumjohann, P. Stauning, and A. T. Y. Lui, Spatial and temporal characteristics of impulsive structure of magnetospheric substorm, Journal of Geophysics, 60, 186-198, 1986.
Sergeev, V. A., P. Tanskanen, K. Mursula, A. Korth, and R. C. Elphi½, Current sheet thickness in the near-Earth plasma sheet during sub- storm growth phase, d. Geophys. Res., 95, 3819-3828, 1990a.
Sergeev, V. A., W. Lennartsson, R. L. Pellinen, and M. K. Vallinkosld, Average patrems of precipitation and plasma flow in the plasma sheet'flux tubes during steady magnetospheric convection, Planet. Space Sci., 38, 355, 1990b.
Sergeev, V. A., B. Aparicio, S. Perraut, M. V. Malkov, and R. Pellinen, Structure of the inner plasma sheet at midnight during steady magne- tospheric convection, Planet. Space Sci., 39, 1083-1096, 199.1.
Sergeev, V. A., R. C. Elphic, F. S. Mozer, A. Saint-Marc, and J. Sau- vaud, A two-satellite study of nightside flux transfer events in the plasma sheet, Planet. Space Sci., 40, 1551-1572, 1992.
Sergeev, V. A., V. Angelopoulos, D. G. Mitchell, and C. T. Russell, In situ observations of magnetotail reconnection prior to the onset of a small substorm, J. Geophys. Res., 100, 19,121-19,133, 1995a.
Sergeev, V. A., R. J. Pellinen, and T. I. Pulkkinen, Steady magneto- spheric convection: A review of recent results, Space Sci. Rev., in press, 1995b.
Sergeev, V. A., T. I. Pulkkinen, and R. J. Pellinen, Coupled-mode model for magnetospheric dynamics, J. Geophys. Res., this issue.
Shepherd, G. G., and J. S. Murphree, Diagnosis of auroral dynamics us- ing global auroral imaging with emphasis on localized and transient features, in Auroral Physics, p. 298, edited by C.-I. Meng et al., Cam- bridge Univ. Press, New York, 1991.
Siscoe, G. L., A unified treatment of magnetospheric dynamics with ap- plications to magnetic storms, Planet. Space Sci., 14, 947-967, 1966.
Slavin, J. A., E. J. Smith, D. G. Sibeck, D. N. Baker, R. D. Zwickl, and
S.-I. Akasofu, An ISEE 3 study of average and substorm conditions in the distant magnetotail, J. Geophys. Res.; 90, 10,875-10,895, 1985.
Slavin, J. A., et al., ISEE 3 plasmoid and TCR observations during an extended interval of substorm activity, Geophys. Res. Lett., 19, 825- 828, 1992.
Slavin, J. A., M. F. Smith, E. L. Mazur, D. N. Baker, T. Iyemori, and E. W. Greenstadt, ISEE 3 observations of traveling compression regions in the Earth's magnetotail, J. Geophys. Res., 98, 15,425, 1993.
Slavin, J. A., C. J. Owen, M. M. Kuznetsova, and M. Hesse, ISEE 3 ob-
servations of plasmoids with flux rope topologies, Geophys. Res. Lett., 22, 2061-2064, 1995.
Snyder, C. W., M. Neugeauer, and U. R. Rao, The solar wind velocity and its correlation with cosmic-ray variations and with solar and geomagnetic activity, J. Geophys. Res., 68, 6361-6370, 1963.
Takahashi, K., L. J. Zanetti, R. E. Lopez, R. W. McEntire, T. A. Po- temra, and K. Yumoto, Disruption of the magnetotail current sheet observed by AMPTE/CCE, Geophys. Res. Lett., 14, 1019-1022, 1987.
Tsyganenko, N. A., A magnetospheric magnetic field model with a warped tail current sheet, Planet. Space Sci., 37, 5-20, 1989.
Unti, T., and G. Atkinson, Magnetotail current sheet, J. Geophys. Res., 73, 7319, 1968.
Vassiliadis, D. V., A. S. Sharma, T. E. Eastman, and D. Papadopoulos, Low-dimensional chaos in magnetospheric activity from AE time se- ries, Geophys. Res. Lett, 17, 1841-1844, 1990.
Vassiliadis, D. V., A. J. Klimas, D. N. Baker, and D. A. Roberts, A de-
scription of solar wind-magnetosphere coupling based on nonlinear filters, J. Geophys. Res., 100, 3495-3512, 1995.
Voge, A., A. Otto, and K. Schindler, Nonlinear current sheet formation in ideal plasmas, J. Geophys. Res., 99, 21,241-21,248, 1994.
Volland, H., Semiempirical model of large-scale magnetospheric elec- tric field, J. Geophys. Res., 78, 171-180, 1973.
Walker, R. J., T. Ogino, J. Raeder, and M. Ashour-Abdalla, A global magnetohydrodynamic simulation of the magnetosphere when the interplanetary magnetic field is southward: The onset of magnetotail reconnection, J. Geophys. Res., 98, 17,235-17,250, 1993.
Wiens, R. G., and Rostoker, G., Characteristics of the development of the westward electrojet during the expansive phase of magneto- spheric substorms, J. Geophys. Res., 80, 2109-2128, 1975.
Yahnin, A., et al., Features of steady magnetospheric convection, J. Geophys. Res., 99, 4039-4052, 1994.
V. Angelopoulos, Space Sciences Laboratory, University of Cali- fornia, Berkeley, CA 94720.
D. N. Baker, Laboratory for Atmospheric and Space Physics, Uni- versity of Colorado at Boulder, Boulder, CO 80309-0392.
W. Baumjohann, Max Planck Institut fiir Extraterrestrische Physik, 8046 Garching Bei Miinchen, Germany.
R. L. McPherron, Institute of Geophysics and Planetary Physics, University of California at Los Angeles, Los Angeles, CA90095-1567.
T. I. Pulkkinen, Finnish Meteorological Institute, SF-00101 Helsinki, Finland.
(Received August 25, 1995 ß revised November 30, 1995 ß accepted December 5, 1995 .)