neutralization of acid mine drainage using stabilized flue...
TRANSCRIPT

Neutralization of Acid Mine Drainage Using Stabilized Flue Gas Desulfurization Material W. Wolfe1, C.-M. Cheng1, R. Baker1, T. Butalia1, J. Massey-Norton2 1The Ohio State University, 2American Electric Power

Stingy Run Fly Ash Impoundment

Reclamation of Fly Ash Impoundment

Highwalls and Pits in Stingy Run Impoundment

Sources of AMD into Stingy Run
Weir # 4
Location
Weir #1Weir #2
Weir #3Weir #4
North PondSouth Pond
pH
0
2
4
6
8
10
AMD Weir #1 AMD Weir #2
AMD Weir #3
AMD Weir #4
South Pond
North Pond
OGS- UGMs GA-031, GA-011

Reclaiming using Fixated FGD Material Utilizing large volume of fixated flue gas
desulfurization materials FGD by-product (calcium sulfite) stabilized with fly ash and
lime
Goals Encapsulate acid mine drainage (AMD) producing materials Neutralize AMD Re-contour highwalls
Approaches Year I: field investigation; laboratory test; bench-scale study;
numerical analysis of design approaches; background water monitoring
Year II and III: permitting, water quality monitoring, construction of the demonstration project

Full-scale Demonstration
1000 ft
2000 ft
3000 ft 4000 ft
Approximate Highwall Location
Start Point
1000 ft Approximate Measurement of Distance
Drainage-way for AMD Discharge during Excavation
Scale:
N Proposed Road Entrance from Plant
MW-96155
MW-96159 Proposed Pomeroy Monitoring Well Sites
Proposed Deep Monitoring Well Site

Establishing Background Groundwater Quality

Groundwater Quality Monitoring
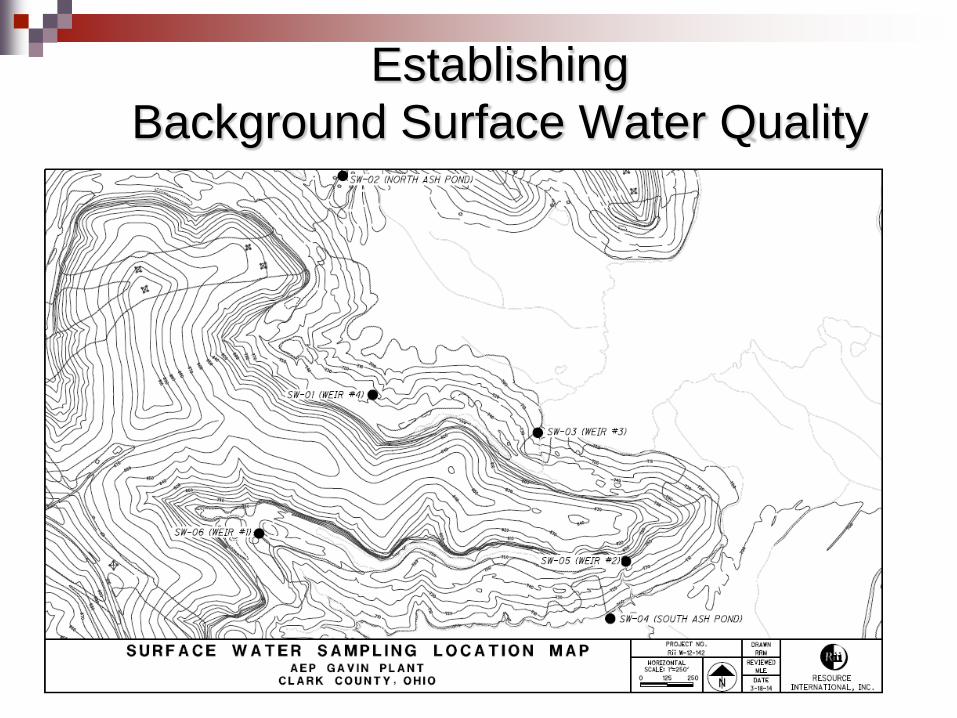
Establishing Background Surface Water Quality
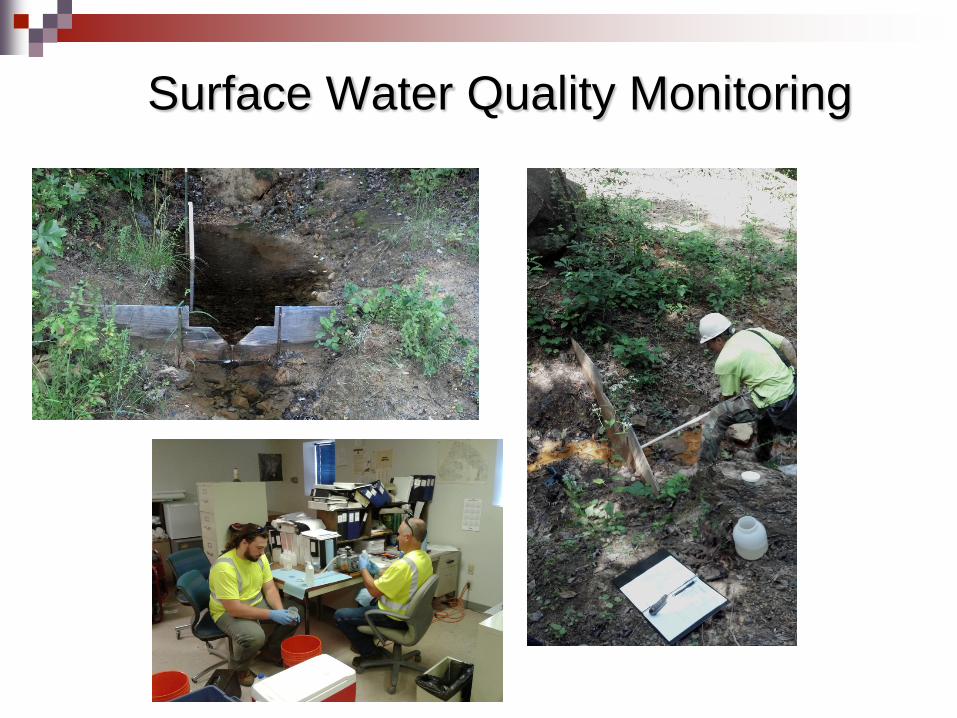
Surface Water Quality Monitoring
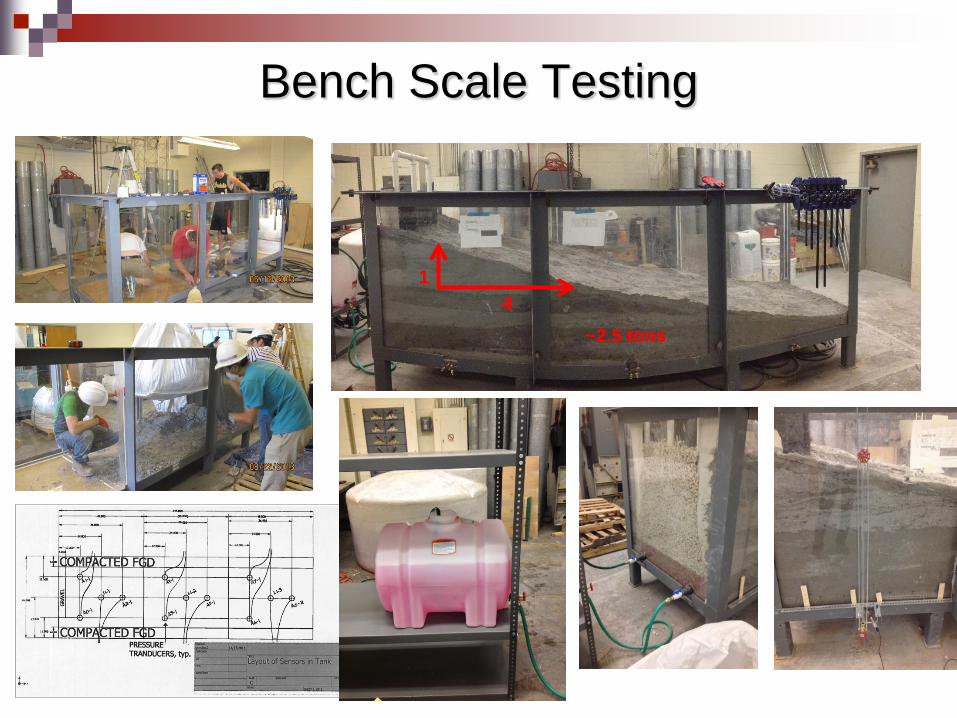
Bench Scale Testing
1 4
~2.5 tons

Bench Scale Testing
Assessment of FGD saturation with tap and AMD waters in the absence and presence of geo-composite intrusion Optimizing geo-composite placement design to maximize contact
between AMD and stabilized FGD material Monitoring change of water quality as tap/AMD water percolates
through the FGD mass under different hydraulic heads AMD was transported to the lab the day before each batch of test and
continuously purged with nitrogen gas to prevent oxidation and carbonation

Bench Scale Testing

Accumulative testing time, minutes
0 200 400 600 800 1000 1200 1400 1600 1800
pH
2
4
6
8
10
12
Hyd
raul
ic H
ead,
ft
0.4
0.6
0.8
1.0
1.2
1.4
1.6
1.8
2.0
2.2
LL1LL2LL3OutletHydraulic HeadAMD pH
Change of AMD pH after Contacting Fixated FGD Material

L/S Ratio
0.0 0.2 0.4 0.6 0.8 1.0 1.2 1.4
pH
2
4
6
8
10
12
LL1LL2LL3Outlet
Change of AMD pH after Contacting Fixated FGD Material at Different L/S ratio
AMD pH=3.14

Mineral Composition of Gavin Fixated FGD Material
Hannebachite (CaSO3 0.5 H2O) Portlandite (Ca(OH)3 )
Hematite (Fe2O3 ) Magnetite (Fe3O4 ) Quartz (SiO2 )
Mullite (3Al2O3 2SiO2 ) Maghemite (Fe2O3) Ettringite (Ca6Al2(SO4)3(OH)12·26H2O)

Chemical Reactions between AMD and Fixated FGD Material
Fixated FGD (g)/ AMD (L)
Neutralization of AMD
OHCaHOHCa 22
2 22)( +→+ ++
Portlandite
OHSOCaAl
12HO·26H(OH))(SOAlC 2123426
22
423 38362 +++
→+−++
+
Ettringite
OHFeHOFe 23
32 626 +→+ ++
Iron oxides
OHFeFeHOFe 223
43 828 ++→+ +++
Formation of potential secondary minerals
Iron hydroxides, Chrysotile (Mg3Si2O5), diaspore (AlHO2), bixbyite (Mn2O3), barite (BaSO4)
Carbonates

Neutralization Capacity Estimated by Geochemical Modeling
Gallon AMD/Pound Fixated FGD
0 20 40 60
pH
2
4
6
8
10
12
14
AMD 3.18
3.7% Lime4.7% Limegeochemical model

Laboratory Column Testing
Two columns with different L/S flow rates Column I: ~1.0 L/S per day Column II: ~2.0 L/S per day
Monitoring change of AMD water quality with extended L/S ratio Column I: ~74 (9 gallons
AMD/lb fixated FGD) Column II: ~147 (17 gallons
AMD/lb fixated FGD)
Simulating AMD neutralization process under similar percolation process as reclamation

Date/Time
6/24/14 7/1/14 7/8/14 7/15/14 7/22/14 7/29/14 8/5/14 8/12/14 8/19/14 8/26/14 9/2/14
pH
7.0
7.5
8.0
8.5
9.0
9.5
10.0
Column IColumn II
delay depletion of portlandite/enttringite
Change of AMD pH after Contacting Fixated FGD Material in Flow Through Column Test

L/S Ratio
0 20 40 60 80 100 120 140 160 180
pH
6
7
8
9
10
pH a
t inl
et
2.0
2.5
3.0
3.5
4.0
4.5
5.0
Gallon of AMD/pound of Fixated FGD
0 3 6 9 12 15 18
Column IColumn IIColumn I inletColumn II inlet
Change of AMD pH after Contacting Fixated FGD Material in Flow Through Column Test
as a Function of L/S Ratio

L/S Ratio
0 20 40 60
Sul
fate
, mg/
L
1000
2000
3000
4000
5000
6000
Column IColumn IIColumn I inletColumn II inlet
Change of Sulfate in AMD
Independent of flow rate
due to change of AMD chemical property

Constituent
K B Mo Sr Sulfate Ca Ba V pH
Nor
mal
ized
Con
cent
ratio
n (C
i/CA
MD)
0.1
1
10
100
1000
Column IIColumn I
Bench Scale Outlet
Constituents with Elevated Levels

Constituent
Cr Cd Si Co Zn Ni Al Mn Fe
Nor
mal
ized
Con
cent
ratio
n (C
i i/CA
MD)
0.00001
0.0001
0.001
0.01
0.1
1
10
Column IIColumn I
Bench Scale Outlet
Elements with Decreased Concentration

Constituent
Na Cl Hg Sb Tl Se As Cu Be Pb
Nor
mal
ized
Con
cent
ratio
n (C
i i/CA
MD)
0.01
0.1
1
10
100
1000
Column IIColumn I
Bench Scale Outlet
Elements Showing First Flush Phenomenon
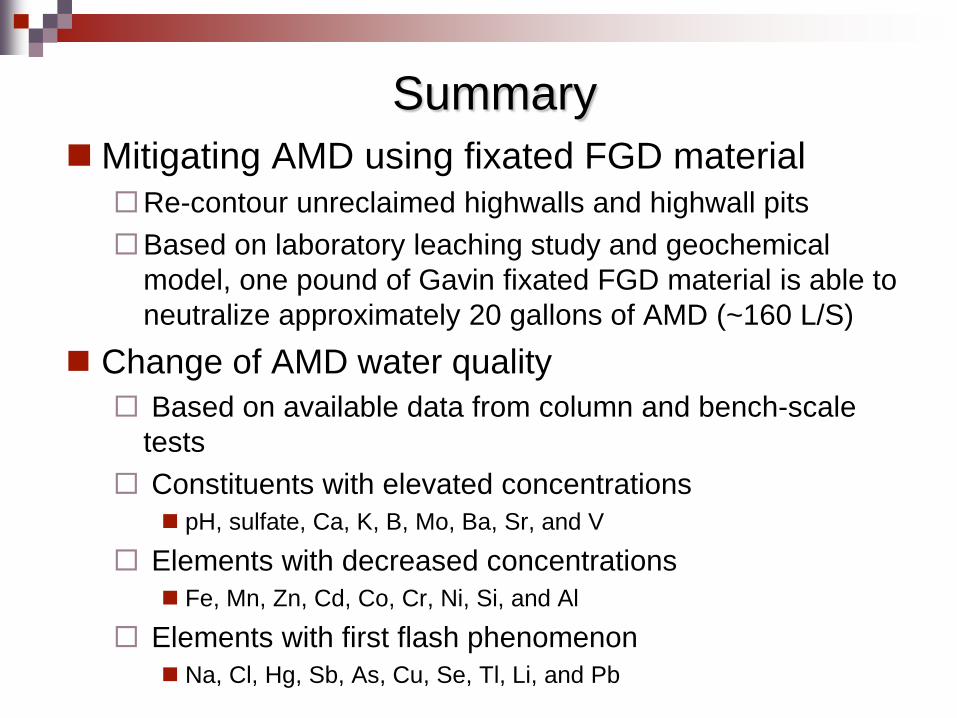
Summary Mitigating AMD using fixated FGD material Re-contour unreclaimed highwalls and highwall pits Based on laboratory leaching study and geochemical
model, one pound of Gavin fixated FGD material is able to neutralize approximately 20 gallons of AMD (~160 L/S)
Change of AMD water quality Based on available data from column and bench-scale
tests Constituents with elevated concentrations
pH, sulfate, Ca, K, B, Mo, Ba, Sr, and V
Elements with decreased concentrations Fe, Mn, Zn, Cd, Co, Cr, Ni, Si, and Al
Elements with first flash phenomenon Na, Cl, Hg, Sb, As, Cu, Se, Tl, Li, and Pb

Future Works Laboratory column test Examining the environmental response beyond
the neutralization capacity of the fixated FGD material
Geochemical kinetic model Bench-scale reclamation module Optimizing placement of geocomposite drainage layer
and fixated FGD material in the reclamation design Establishing AMD flow model Finalizing reclamation design

Future Works Full-scale demonstration Continuing on water quality monitoring Carrying out statistical and hydrogeochemical analyses of
background water quality data Permit application Project site preparation/construction Backfilling of fixated FGD material Post reclamation water monitoring

L/S Ratio
0.0 0.5 1.0 1.5 2.0 10.0 20.0 30.0 40.0 50.0 60.0 70.0
Ars
enic
, mg/
L
0.008
0.010
0.012
0.014
0.016
0.018
0.020
0.022
Column 1Column 2Inlets (under detection limt)Bench Scale LL1Bench Scale LL2Bench Scale LL3Bench Scale Outlet
First Flush of Arsenic

L/S Ratio
0.0 0.5 1.0 1.5 10.0 20.0 30.0 40.0 50.0 60.0 70.0
Mer
cury
, ng/
L
0
10
20
30
40
50
Column 1Column 2L/S ratio_Full vs Hg L/S ratio Half vs Hg Bench Scale LL1Bench Scale LL2 Bench Scale LL3 Bench Scale Outlet
First Flush of Mercury