nevada bureau of air quality planning ambient air quality ...ambient air quality monitoring...
TRANSCRIPT
NEVADA DIVISION OF STATE OF NEVADA
E NVI RONMENTALDepartment of Conservation & Natural Resources
PROTEC1 ION Kay Scherer. Interim Director
David Emme, Administrator
Nevada Bureau of Air Quality PlanningAmbient Air Quality Monitoring Guidelines
The Ambient Air Quality Monitoring Guidelines are prepared by the Bureau of Air Quality Planning(BAQP) to define what constitutes acceptable criteria pollutant and meteorological monitoringpractices for facilities required to conduct (pre- and post-construction) ambient air quality monitoring.These Guidelines are provided in the interest of obtaining valid, consistent, usable data from ambientmonitoring operations within the Division of Environmental Protection’s jurisdiction, which excludesClark and Washoe Counties except for regulation of certain power plants. Fossil fuel-fired steamgenerating plants are under the Division’s jurisdiction statewide. Deviations from or alternatives tothe Guidelines procedures or requirements shall be submitted to the Bureau of Air Quality Planningprior to their use for review and approval.
Revised November 2016
Contents
1. References and Quality Assurance Project Plans (QAPP) 3
2. Highlights 5
3. Meteorological Monitoring 7
3.1 Wind Speed 7
3.1.1 Calibration and accuracy tolerance for horizontal and vertical wind speed 8
3.2 Wind Direction 8
3.3 Vertical Temperature Gradient 9
3.4 Solar Radiation 9
3.5 Wind Gust 10
3.6 Sampling Frequency 10
3.7 Standard Deviation of Horizontal Wind Direction 10
3.8 Reporting Meteorological Data 11
4. Pollutant Monitoring 12
4.1 Reporting Pollutant Data 12
4.2 Gaseous Monitoring Sampling Frequency and Data Recovery 12
4.3 Particulate Samplers and Monitors 12
4.3.1 PM2.5 Monitoring 12
4.3.2 PM10 Monitoring 13
4.3.3 High-Volume PM10 Samplers 13
5. Quality Control and Quality Assurance 15
5.1 High-Volume PM10 Sampling 15
5.2 Continuous Particulate Monitoring 17
5.3 Gaseous Monitoring 17
5.3.1 Ozone Monitoring 18
5.3.2 Nitrogen Dioxide Monitoring 18
5.3.3 Gaseous Monitoring Audits 18
5.3.4 Gaseous Monitoring Quality Control Checks 19
6. Certification 20
Revised November2016 Page 2
1. References and Quality Assurance Project Plans (QAPP)
To ensure data of sufficiently high quality, all sampling and continuous monitoring for Prevention ofSignificant Deterioration (PSD) permitting (pre- or post-construction) shall be conducted inaccordance with these guidelines and U.S. Environmental Protection Agency (EPA) regulations and,generally, EPA guidance. Exceptions include the quality control check tolerances designed for usewith trace gas monitors (see subsection 5.3, Gaseous Monitoring) and inconsistent EPA pollutant andmeteorological monitoring guidance.
As the Bureau of Air Quality Planning (BAQP) does not submit source monitoring data into thenational database for comparison with the National Ambient Air Quality Standards, source monitoringQuality Assurance Project Plan (QAPP) submittals are required only for monitoring under federaljurisdiction—that is, PSD pre-construction monitoring and post-construction monitoring for asignificant PSD permitting action such as a major modification. Non-PSD monitoring and State-required post-construction monitoring for PSD sources do not require a QAPP submittal. However, abrief protocol submittal of the project siting including topographic and other relief maps as well aspictures in the four cardinal directions, meteorological tower height, meteorological sensors andpollutant measurement methods (analyzers/samplers and methodology, e.g., Section 2.11 for high-volume PM10 sampling), quality control checks and frequency, auditing schedule, and data validationconsiderations is advisable. Submit QAPPs and protocols in both hard copy and electronic versions.Sampling and continuous monitoring for non-PSD permitting use, or as the result of a State permitcondition to monitor, shall be conducted according to these guidelines and EPA regulations and,generally, EPA guidance for State and Local Air Monitoring Stations (SLAMS) with exceptionsincluding quality control check tolerances designed for use with trace gas monitors (see subsection5.3, Gaseous Monitoring) and inconsistent EPA pollutant and meteorological monitoring guidance, oraccording to EPA regulations and, generally, guidance for Prevention of Significant Deterioration(PSD) monitoring, with exceptions including quality control check tolerances designed for use withtrace gas monitors (see subsection 5.3, Gaseous Monitoring) and inconsistent EPA pollutant andmeteorological monitoring guidance. Thus, after one year of preconstruction PSD monitoring, thefacility conducting State-required post-construction monitoring as a PSD permit condition mayconduct SLAMS, rather than PSD, monitoring. However, only PSD monitoring will support PSDapplications for new construction and major modifications. Modeling applications may requiremeteorological data collected in accordance with the Meteorological Monitoring Guidance forRegulatory Modeling Applications (formerly, the On-Site Meteorological Program Guidance forRegulatory Modeling Applications) and the Quality Assurance Handbook for Air PollutionMeasurement Systems, Volume IV, Meteorological Measurements, Version 2.0 (Final) (2008),including recommended system accuracies and resolutions and recommended responsecharacteristics for meteorological sensors.
Several EPA documents follow which contain information to be adhered to in the operation of suchmonitoring networks. These documents and their titles may be revised at times.
• Code of Federal Regulations, Title 40, Chapter I, Subchapter C, Part 58, Ambient AirQuality Surveillance. This reference is available for purchase from the Superintendent ofDocuments, Attn: New Orders, P.O. Box 371954, Pittsburgh, PA 15250-7954, telephone(202) 512-1800. It may also be available at Internet address http://www.ecfr.qov/cqibin/text-idx?Sl D=ca67d97a0ed8a8d8ff35 I fd 11 320efca&node=t40.6. 58&rqn=d iv5.
Revised November 2016 Page 3
• Ambient Monitoring Guidelines for Prevention of Significant Deterioration (PSD)(1987), EPA-450/4-87-007, US EPA Office of Air Quality Planning and Standards(OAQPS), Research Triangle Park (RTP), NC 27711. A copy of this document is availablefor purchase from the National Technical Information Service (NTIS), stock number PB 90-168030, telephone (800) 553-6847. It may also be available at Internet addresshttp://www.epa .qov/reg ion7/air/nsr/nsrmemos/monq uide. pdf.
• 2012 PSD ambient monitoring guidance Q &A update “Technical Note —PSDMonitoring Quality Assurance Issues,” Office of Air Quality Planning and Standards,Research Triangle Park, NC 27711. This document may be available at Internet addresshttp ://www.epa.qov/ttn/amtic/files/policy/PSDAppAQATechN0te14dec12. pdf.
• Meteorological Monitoring Guidance for Regulatory Modeling Applications (2000),EPA-454/R-99-005, may be available at Internet addresshttp://www.epa.gov/scramool/quidance/quide/mmqrma.pdf. A copy of this document isalso available for purchase from the National Technical Information Service (NTIS), stocknumber PB 2001103606, telephone (800) 553-6847. This document is an updated versionof the On-Site Meteorological Program Guidance for Regulatory Modeling Applications(1987, revised 02/93).
• Quality Assurance Handbook for Air Pollution Measurement Systems, Volume I, aField Guide to Environmental Quality Assurance (1994), EPA-600/R-94/038a, US EPAOffice of Research and Development (ORD), Washington, DC 20460. This document maybe available at Internet address http://www.epa.qov/ftn/amtic/files/ambientlpapc/r94-038a.pdf.
• Quality Assurance Handbook for Air Pollution Measurement Systems, Volume II,AmbientAir Specific Methods (Interim Edition) (1994), EPA-600/R-94/038b, ORD,Washington, DC 20460. The section of Volume II of greatest interest to many operators isSection 2.11, the “Reference Method for the Determination of Particulate Matter as PM10 inthe Atmosphere (High-Volume PM10 Sampler Method).” An electronic copy of the January1990 version of this document is available from the BAQP Technical Services Branch uponrequest. This document may also be available at Internet addresshttp ://www.epa.gov/ttnamti 1 /files/ambienUgagc/m2 11. pdf.A 1997 incorrect version of this document is known as the “Quality Assurance Guidance Document 2.11,Monitoring PM,0 in Ambient Air Using a High-Volume Sampler Method.” This 1997 PM10 guidance documentwas intended to implement the 1997 99thpercentlle actual (rather than standard) concentration-based PM10standard, which was vacated by the courts. Consequently, Section 5.1.2 of this document, Calculation ofPM10 Concentrations, is not applicable, as it calculates PM10 concentrations in micrograms per actual, ratherthan standard, cubic meter. An early version of this 1997 document contained other calculation errors sincecorrected. This 1997 guidance document was removed from the EPA AMTIC online references in late 2014and replaced with the 1990 version of Section 2.11 guidance.
Quality Assurance Handbook for Air Pollution Measurement Systems, Volume II: Part1, Ambient Air Quality Monitoring Program Quality System Development (1998), EPA454/R-98/004, OAQPS, Research Triangle Park, NC 27711. This document is available forpurchase from the NTIS, stock number PB 99-1 29876, telephone (800) 553-6847. It mayalso be available at Internet addresshifp ://nepis.epa .qov/Exe/ZyN ET.exe/2000QNC4 .TXT?ZyAction D=ZyDocument&Client= EP
Revised November 2016 Page 4
A&I ndex= I 995+Thru+ 1 999&Docs=&Query=&Time=&Endlime=&SearchMethod=I &TocRestrict=n&Toc=&TocEntrv=&QFieId=&QFieldYear=&QFieldMonth=&QFieldDay&l ntQFieldOp=0&ExtQFieldOp=O&XmlQuerv=&FiIe=D%3A%5Czvflles%5Clndex%2OData%5C95thru99%5CTxt%5C0000001 7%5C20000NC4.txt&User=ANONYMOUS&Password=anonymous&SortMethod=h%7C-&MaximumDocuments=1 &FuzzyDegree=O&lmageQuality=r75g8/r75g8/xl 50y1 50g161i425&Display=p%7C1&DefSeekPage=x&Search Back=ZyAction L&Back=ZyActionS&BackDesc=Resu lts%20page&Maximum Pages= 1 &ZyEntry= 1 &SeekPage=x&ZyPU RL
• Quality Assurance Guidance Document 2.12, Monitoring PM2.5 in Ambient Air UsingDesignated Reference or Class I Equivalent Methods (Nov. 1998). This document maybe available at Internet addresshttp://www.epa.gov/ttn/amtic/files/ambienUpm25/ga/m2 1 2covd pdf.
• A more recent version of the December 2008 EPA Quality Assurance Handbook for AirPollution Measurement Systems, Volume II, Ambient Air Quality Monitoring Programwas published in May 2013; an address at which this document may be found ishttp://www.epa.gov/ttn/amtic/files/ambientlpm25/ga/QA-Handbook-Vol-I I. pdf. This 2013version of Volume II of the Quality Assurance Handbook does not include the Section 2.77 PM10 samplingguidance document associated with early versions of the Handbook.In July 2014 EPA made changes to Appendix D, Measurement Quality Objectives and ValidationTemplates (AMTIC Version) of the 2013 Quality Assurance Handbook, Volume II relating togaseous monitoring zero drift and other changes. The 2014 version of Appendix D may beavailable at Internet addresshttpJ/www.epa. gov/ffnamti 1 /files/ambienUpm25/ga/appd validation template amtic. pdf.
• Quality Assurance Handbook for Air Pollution Measurement Systems, Volume IV,Meteorological Measurements, Version ZO (Final) (2008). This document may beavailable at Internet addresshttp://www.epa .gov/ttn/amtic/files/ambientlmetNolume%20IV Meteorological Measurements.pdf.
2. Highlights
The NDEP-BAQP monitoring requirements specifically include the following:
1) To be usable, all required meteorological data collected shall be recovered at a minimum rateof 90% of the total data possible on an annual basis for each variable being measured.Additionally, wind speed, wind direction, temperature difference, and solar radiation forAERMOD shall have a joint recovery of at least 90% on an annual basis. For regulatorymodeling applications, the 90% recovery rate, including joint recovery, should be met on aquarterly basis and must be met on an annual basis.
2) All ambient monitoring data for pollutants (including data from continuous analyzers andmanual samplers) shall be recovered at a minimum rate of 80% of the total data possible percontinuous analyzer or manual sampler per calendar quarter for PSD monitoring, or at aminimum rate of 75% of the total data possible per continuous analyzer or manual sampler percalendar quarter for non-PSD (SLAMS) monitoring.
Revised November 2016 Page 5
3) The EPA Quality Assurance Handbook for Air Pollution Measurement Systems, Vol. IV:Meteorological Measurements, Version 2.0 (Final) (2008) says in Table 10-I, DAS ScreeningTechniques (with regard to the number of instantaneous readings in the averaging period),“Most data should be valid 75% of the time.” The Meteorological Monitoring Guidance forRegulatory Modeling Applications (2000), Section 6.1, Averaging and Sampling Strategiessays, ‘if the hourly average is to be based on shorter period averages, then it is recommendedthat 15-minute intervals be used. At least two valid 15-minute periods are required to representthe hourly period.”
4) For gaseous pollutant monitoring data, at least 45 minutes of valid observations are required torepresent an hourly average. In general, running averages of more than one hour shallrequire valid observations for at least 75 percent of the hours in the averaging period. Allinvalid data observations shall be excluded from the average.
5) The EPA specification for the high-volume particulate sampling run time is 24 hours ± one hour(1440 minutes ± 60 minutes), from midnight to midnight, local standard time.
6) The EPA specification for the PM10 high-volume particulate sampling flow rate is 1.02 to 1.24actual cubic meters per minute, or 36 to 44 actual cubic feet per minute (flow not correctedto standard conditions).
7) Because the 1997 99th...percentile actual concentration-based PM10 standard was vacated bythe courts (D.C. Circuit, May 14, 1999) without an appeal by the EPA, and because only theoriginal PM10 standard is in effect, the PM10 concentration calculations section of the 1997“Quality Assurance Guidance Document 2.11, Monitoring PM10 in Ambient Air Using a High-Volume Sampler Method” does not apply. Section 5.1.2 of the Quality Assurance GuidanceDocument 2.11 calculates the volume of air sampled in actual conditions (while incorrectlyidentifying the conditions as standard conditions). For calculating PM10 concentrations, thevolume of air sampled must be calculated in standard conditions according to the EPAQuality Assurance Handbook’s Section 2.11, the “Reference Method for the Determinationof Particulate Maffer as PM10 in the Atmosphere (High-Volume PM10 Sampler Method)” (seethe link to the 1990 Section 2.11 guidance in the References and Quality Assurance ProjectPlans (QAPP) section of these Guidelines).
8) For gaseous analyzers, the results of zero, span and precision checks shall be reportedquarterly. Hourly shelter temperature or instrument rack temperature shall be reported forgaseous analyzers. When an analyzer is operated outside the temperature range for which theanalyzer is designated by the EPA as a Federal Reference or Equivalent Method, it may benecessary to invalidate the data as described in the Quality Control and Quality Assurancesection of these guidelines.
9) Wind measurements should be taken at heights within the rise of the plume. For tall stacks,this may require use of a (maximum) 100-meter meteorological tower or use of meteorologicalremote sensing such as acoustic sounding, or SODAR, in conjunction with a meteorologicaltower at least 10 meters high. Meteorological upper-air monitoring (e.g., SODAR) shall beconducted in accordance with the guidance provided in Chapter 9, Upper-Air Monitoring, of theEPA’s Meteorological Monitoring Guidance for Regulatory Modeling Applications (February2000). Another applicable EPA reference is Section 8, Ground-Based Remote SensingDevices, of the Quality Assurance Handbook for Air Pollution Measurement Systems, VolumeIV, Meteorological Measurements, Version 2.0 (Final) (2008).
10) Coordinates in Universal Transverse Mercator projection (UTM - NAD 1983, where UTM zone11 North includes the entire state of Nevada) and elevation shall be provided for eachmeteorological and pollutant monitoring site.
Revised November 2016 Page 6
With the exception of preconstruction PSD monitoring and up to the first year of PSD post-construction monitoring, all required ambient air quality and meteorological monitoring data shall besubmitted to the Bureau on a calendar quarter basis within 60 days after the end of the applicablequarter. The initial PSD monitoring may be submitted on a monitoring quarter basis instead of acalendar quarter basis, within 60 days after the end of the monitoring quarter. Monitoring quarterlyreports and audit reports, if not included in the quarterly reports, shall be submitted in hardcopy andelectronic format. Should any of the requirements for a monitoring program not be maintained at therequisite levels, part or all of the data recovered may be deemed incomplete and may not be usableto support the environmental evaluation, ambient concentration assessment, or meteorologicalassumptions necessary for new or modified air quality permits, and, if applicable, the facility may besubject to noncompliance penalties for violations of its air quality permit conditions.
3. Meteorological Monitoring
Site-specific meteorological data can be used for input to dispersion models used for analyzing thepotential impacts from the air pollution sources at a facility. For non-PSD meteorological monitoring,representative National Weather Service (NWS) data may be used instead of site-specific data forinput to dispersion models. Dispersion modeling may be used to determine impacts from proposedfacilities, proposed modifications to facilities, and for compliance determinations in the event of anexceedance. Meteorological data may also be used to aid the Bureau in determining the source of apollutant that has caused an exceedance of the standards and to aid a facility in correcting a problem.When deciding whether to use site-specific versus NWS data, the representativeness of suchmeteorological data with respect to the modeled emission sources should be carefully weighed.Especially in complex terrains, the distance between the meteorological station and the emissionsources, as well as property boundaries, may not be of primary importance compared to topography.“[A]cquisition of adequately representative site specific data does not preclude collection of data froma location off property. Conversely, collection of meteorological data on a source’s property does notof itself guarantee adequate representativeness” (40 CFR 51, AppendixW, Section 8.3.3.1).
The valid hourly averages of meteorological parameters are to be reported to the Bureau; if 15-minuteaverages are collected, they may be reported in addition to the 1-hour averages. The one-houraverages should be computed by the data logger due to the complexity of computing hourly averagewind directions from sub-hourly intervals. For most meteorological considerations, including siting,obstructions and sensor placement, refer to the Meteorological Monitoring Guidance for RegulatotyModeling Applications (February 2000) and the Quality Assurance Handbook for Air PollutionMeasurement Systems, Volume IV: Meteorological Measurements, Version 2.0 (Final) (2008). AsAppendix W to 40 CFR 51 is of prime importance in modeling source impacts, and as Appendix Wrelies on the EPA Meteorological Monitoring Guidance for Regulatory Modeling Applications(MMGRMA, 2000) through numerous citations, the Bureau requires the MMGRMA’s 6-monthmeteorological audit schedule for modeling, rather than the 2008 Quality Assurance Handbook’sannual meteorological audit schedule for non-PSD monitoring (Section 0, Table 0-6) and for modeling(Section 0, Table 0-10).
31 Wind SpeedWind speed is generally measured with a cup or propeller anemometer for ease of auditing, as sonicinstruments require collocated auditing of wind measurements. In addition, NDEP recommends themeasurement of the standard deviation of the vertical wind speed (a), at least at one height and, if
Revised November 2016 Page 7
possible, within the plume layer.
3.1.1 Calibration and accuracy tolerance for horizontal and vertical wind speed
The March 2008 EPA Quality Assurance Handbook for Air Pollution Measurement Systems, VolumeIV: Meteorological Measurements, Version 2.0 (Final), Section 0, Table 0-8 PSD Calibration andAccuracy criteria specifies a tolerance of ±0.2 mIs for horizontal and vertical wind speed calibrationsand audits. As pointed out also by the author of this section, once directly contacted by the Bureau,this is a typographical error. The correct tolerance should be ±(O.2 mis + 5% of observed windspeed) for both vertical and horizontal wind speed. The same tolerance must be applied tomeasurements of horizontal and vertical wind speed for modeling applications (Table 0-10 of thesame section, which also erroneously lists ±0.2 m/s as the tolerance for calibrations and audits). Thecorrect formula of the tolerance, which is dependent on the magnitude of the measurement itself, ismore consistent with other applications in the same document (e.g., SLAMS/SPM — Table 0-6, NCore— Table 0-4) and previous EPA guidance documents (e.g., EPA Meteorological Monitoring Guidancefor Regulatory Modeling Applications (2000) and the 1987 PSD guidance).The same incorrect tolerance of ±0.2 m/s also appears in Appendix C of Volume IV, the CriticalCriteria Table—Meteorological Measurement Methods.
3.2 Wind DirectionIn accordance with the Quality Assurance Handbook, Vol. IV, Meteorological Measurements, Version2.0 (Final) (2008), NDEP strongly recommends the use of the unit vector calculation to estimatemean wind direction. This approach has been deemed more reliable than the original single-passprocedure developed by Mitsuta, which is described in the Meteorological Monitoring Guidance forRegulatory Modeling Applications (2000) (MMGRMA). The Quality Assurance Handbook, Vol. IV(2008) analyzes a meteorological data set with one 360-degree wind direction rotation injected in themiddle of the profile and concludes that “the scalar calculation produced erroneous results for thedata set while the unit vector calculation produced a reasonable average[....]”. If the unit vectorcalculation is used, the MMGRMA recommends a sampling rate of one to five seconds.
Bureau investigation into the algorithms used to calculate unit vector wind direction averagesindicates the algorithms provided in both of the above EPA reference documents fail to yield validwind direction averages for all four quadrants of the circle. The problem in the Quality AssuranceHandbook, Vol. IV (2008) is in the use of ArcTan rather than ArcTan2, while in the MMGRMA, theproblem is in the algorithm’s flows. Investigation into the algorithms in two commonly used types ofdata loggers indicates the data loggers are programmed correctly, even though the data loggermanual may be in error as to the use of ArcTan versus ArcTan2.
If the single-pass procedure developed by Mitsuta is used to compute the scalar mean wind direction(not recommended by NDEP), the MMGRMA and the Quality Assurance Handbook, Vol IV,Meteorological Measurements (2008) recommend a sampling rate of at least once per second toensure that consecutive values do not differ by more than 180 degrees.
NDEP recommends the measurement of the standard deviation of the horizontal wind direction,sigma theta (Ce), at least at one height and, if possible, within the plume layer.
Revised November 2016 Page 8
3.3 Vertical Temperature GradientAppendix W1 to 40 CFR Part 51, the Guideline on Air Quality Models, Section 4.2.2 b states, “For awide range of regulatory applications in all types of terrain, the recommended model is AERMOD.”AERMOD modeling with AERMET processing will generally involve temperature measurements atheights of 2 meters and 10 meters. Due to the 0.1° C system accuracy tolerance for the temperaturedifference (Delta-I), the use of temperature sensors matched by the manufacturer for Delta-Tmeasurements is referenced in Appendix W as follows: “Temperature difference (tfl) measurementsshould be obtained using matched thermometers or a reliable thermocouple system to achieveadequate accuracy.” Appendix W adds that the guidance provided in the EPA’s MeteorologicalMonitoring Guidance for Regulatory Modeling Applications (February 2000) should be followed. Thisdocument and other EPA guidance also call for these temperature sensors to be aspirated (a fanmotor continuously draws ambient air across the temperature sensor).
The Meteorological Monitoring Guidance for Regulatory Modeling Applications states in Section 6.3.2,Vertical Temperature Gradient:
Recommended heights for temperature gradient measurements in the surface layer are2m and lOm. For use in estimating plume rise in stable conditions, the verticaltemperature gradient should be determined using measurements across the plume riselayer; a minimum height separation of 50 m is recommended for this application.
The same guidance states in Section 3.3.3, Temperature Difference, for tall tower measurements:
A tower measurement of temperature difference can be used as a representation of thetemperature profile. The measurement should be taken between two elevated levels onthe tower (e.g. 50 and 100 meters).... A separation of 50 m between the two sensors ispreferred.
Therefore, it is recommended that the temperature difference derived from elevated levels of talltowers maximize the height of the lower temperature within these constraints (i.e., I OOm-50m or 60m-lOm, rather than lOOm-2m or60m-2m).
3.4 Solar RadiationBoth the EPA Meteorological Monitoring Guidance for Regulatory Modeling Applications (February2000) and the EPA Quality Assurance Handbook for Air Pollution Measurement Systems, Volume IV:Meteorological Measurements, Version 2.0 (Final) (2008) specify a spectral response of 285-2800 nmfor solar radiation measurements. Yet both guidance documents appear to allow the use ofphotovoltaic pyranometers, which have a spectral response of only 400-1158 nm. The 2008 guidancefeatures a picture of a photovoltaic pyranometer in Figure 6.4, saying it is “. . . a popular thermopileradiometer with a silicon photovoltaic detector mounted in a fully cosine-corrected head. The currentoutput is directly proportional to solar radiation.” The 2000 guidance says, “If the solar radiation dataare to be used in procedures for estimating stability (Section 6.4) then second class (photovoltaic)pyranometers are acceptable.” However, the specified regulatory dispersion model when the 2000
1All references to 40 CFR Part 51 and its Appendix W across this document refer to the November 9, 2005 version. EPArecently released a proposal for the revision of its guidelines, changes in the BAQP guidance (this document) may occurafter the final version of the EPA guidelines is released.
Revised November 2016 Page 9
guidance was promulgated (ISC) used Pasquill-Gifford stability categories for estimating boundarylayer stability, while the current dispersion model AERMOD uses the Monin-Obukhov similaritytheory. This may affect the suitability of photovoltaic pyranometers (spectral range 400-1158 nmversus 285-2800 nm for full spectral response pyranometers) for AERMOD dispersion modeling. TheEPA replaced the ISC dispersion model with AERMOD in November 2006.
3.5 Wind GustFacilities required to conduct both meteorological monitoring and particulate monitoring may find itdesirable to record the highest gust wind speed or other EPA-specified short-term average windspeed each hour. This information may be useful in documenting Exceptional Events for high winds(dust storms).
3.6 Sampling FrequencyIf the unit vector method is used to calculate mean wind direction, the recommended samplingfrequency is between one and five seconds. The Meteorological Monitoring Guidance for RegulatoryModeling Applications (2000) (MMGRMA) and the Quality Assurance Handbook, Vol IV,Meteorological Measurements, Version 2.0 (Final) (2008) state that if single-pass (i.e., the Mitsutamethod) processing is used to compute the mean scalar wind direction, the output from the wind-direction sensor (wind vane) should be sampled at least once per second to ensure that consecutivevalues do not differ by more than 180 degrees. Therefore, the Bureau reserves the right to reject winddirection measurements obtained using the Mitsuta method with a sampling interval greater than onesecond. The data sampling frequency shall be reported in the quarterly monitoring report.
3.7 Standard Deviation of Horizontal Wind DirectionThe AERMOD dispersion model uses the standard deviation of the horizontal wind direction, or sigmatheta, commonly already being collected. The preferred method for calculating sigma theta (a0), thestandard deviation of the horizontal wind direction, is the Yamartino method described in Section 6 ofthe Meteorological Monitoring Guidance for Regulatory Modeling Applications.
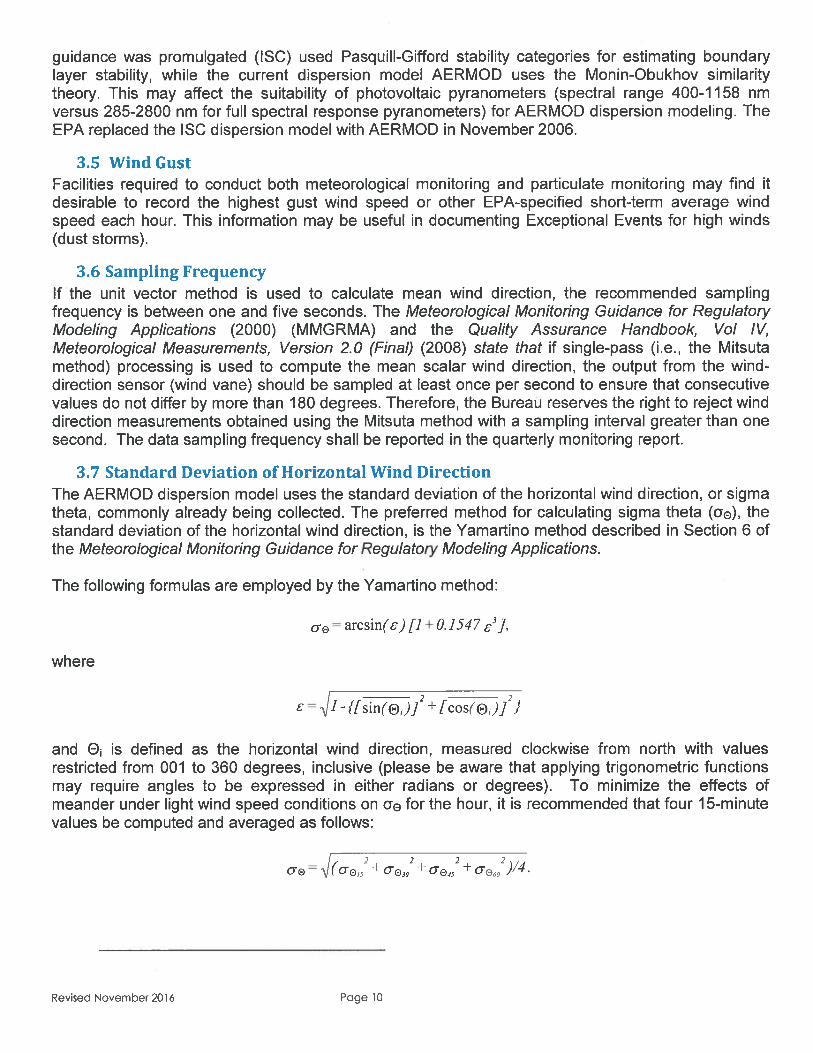
The following formulas are employed by the Yamartino method:
= arcsin() [1+0.15478],
where
8 1- ([sin(0,)]2 + [cos(e)f}
and 0, is defined as the horizontal wind direction, measured clockwise from north with valuesrestricted from 001 to 360 degrees, inclusive (please be aware that applying trigonometric functionsmay require angles to be expressed in either radians or degrees). To minimize the effects ofmeander under light wind speed conditions on a0 for the hour, it is recommended that four 15-minutevalues be computed and averaged as follows:
/ 2 2 2 2go = (g + + e, + )/4.
Revised November 2016 Page 10
3.8 Reporting Meteorological DataTo conform to common modeling requirements, hourly meteorological data shall be reported for theperiod ending at the hour (i.e., the data between midnight and one o’clock shall be reported for hour“one”). The hourly average values for use in AERMOD shall be reported for each parameter asfollows:
Year, Month, Day, Hour Ending, Wind Speed (mis), Wind Direction (degrees clockwisefrom true north), Upper Level Temperature (K or C) for Delta-T, Lower LevelTemperature (K or C) for Delta-T, Delta-T (C), Solar Radiation (W1m2).
Reporting additional parameters which may affect the modeling outcome (see table below) isoptional.
The upper and lower tower levels (in meters) used for Delta-T shall be identified. For talltowers, only one elevated Delta-T need be reported in addition to the lOm - 2m Delta-T. This shouldbe the highest suitable (preferably 50m separation) Delta-T (e.g., for a lOOm tower, lOOm - 50m,rather than 50m - lOm, where lOOm - lOm and 50m - lOm with Delta-T accuracy could be used asbackups for lOOm - 50m Delta-T).
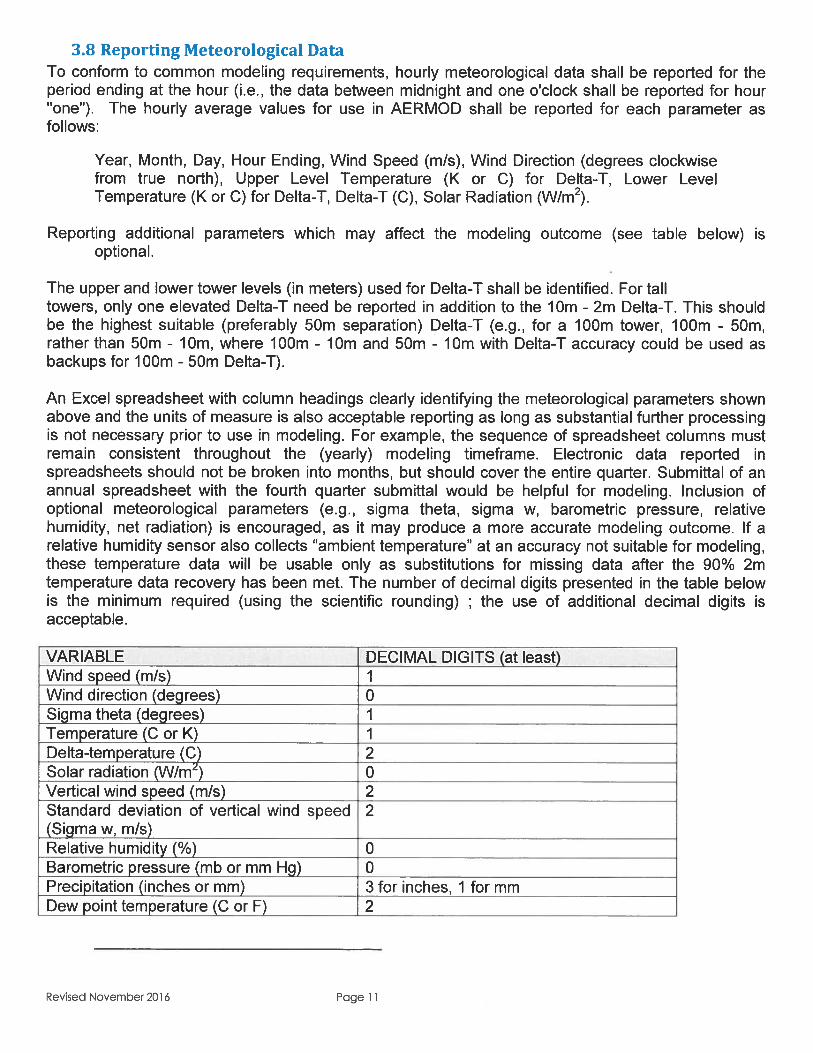
An Excel spreadsheet with column headings clearly identifying the meteorological parameters shownabove and the units of measure is also acceptable reporting as long as substantial further processingis not necessary prior to use in modeling. For example, the sequence of spreadsheet columns mustremain consistent throughout the (yearly) modeling timeframe. Electronic data reported inspreadsheets should not be broken into months, but should cover the entire quarter. Submittal of anannual spreadsheet with the fourth quarter submittal would be helpful for modeling. Inclusion ofoptional meteorological parameters (e.g., sigma theta, sigma w, barometric pressure, relativehumidity, net radiation) is encouraged, as it may produce a more accurate modeling outcome. If arelative humidity sensor also collects “ambient temperature” at an accuracy not suitable for modeling,these temperature data will be usable only as substitutions for missing data after the 90% 2mtemperature data recovery has been met. The number of decimal digits presented in the table belowis the minimum required (using the scientific rounding) ; the use of additional decimal digits isacceptable.
VARIABLE DECIMAL DIGITS (at least)Wind speed (mis) IWind direction (degrees) 0Sigma theta (degrees) ITemperature (C or K) 1Delta-temperature (C) 2Solar radiation (W/m2) 0Vertical wind speed (mIs) 2Standard deviation of vertical wind speed 2(Sigma w, mis)Relative humidity (%) 0Barometric pressure (mb or mm Hg) 0Precipitation (inches or mm) 3 for inches, 1 for mmDew point temperature (C or F) 2
Revised November 2016 Page 11
For questions about other meteorological variables, please contact the Bureau’s Technical ServicesBranch.
In addition to hardcopy data submittals, meteorological data shall be recorded to an electronicmedium approved by the Bureau (Windows-compatible format), such as CD’s, DVD’s and USBmemory devices, and, if not already shown (e.g., on a spreadsheet), be accompanied by a “Read Me”text file explaining the order of meteorological data entries and definitions of units for data entries. Inthe electronic files, a missing or invalid meteorological datum value shall be identified consistentlywith the same alphanumeric code across all parameters, for example, as “-9999” or “NA” or “NAN” or“invalid,” but not as a combination of different qualifiers, such as “tower” “calib” and “audit” whenused for modeling. However, such combinations of qualifiers are acceptable in quarterly reports asopposed to modeling datasets.
For SODAR monitoring, the data reporting format varies with the size definition of the levels, or bins,and the heights monitored.
The data recovery for each meteorological parameter, and for the joint recovery of wind speed, winddirection, temperature difference (Delta-I) and solar radiation, shall be identified in the hardcopyquarterly report.
4. Pollutant Monitoring
4.1 Reporting Pollutant DataA designated Federal Reference Method or Federal Equivalent Method may be used to collect airpollutant concentration data (http :Ilwww.epa .gov/ttn/amtic/files/ambientlcriteria/reference-equ ivalentmethods-list.pdf). Pollutant data shall be reported in a format suitable for comparison with the Stateambient air quality standards. This includes reporting running averages, as applicable.
4.2 Gaseous Monitoring Sampling Frequency and Data RecoveryFor gaseous analyzers, the recommended data sampling frequency of at least 360 samples peraveraging period is met by electronically sampling the instrument output at least once every 10seconds for hourly averages or at least once every 2.5 seconds for 15-minute averages. Morefrequent sampling may be necessary when sampling gaseous analyzers simultaneously withmeteorological instrumentation, where sampling should be once per second. The data samplingfrequency shall be reported in the quarterly report. For gaseous monitoring, data recovery shall bebased on the total number of hours in the reporting period, rather than the number of hours possibleless time used for quality control, upset conditions, etc., and the data recovery shall be reported in thequarterly reports.
4.3 Particulate Samplers and Monitors
4.3.1 PM2.5 Monitoring
Guidance for PM2.5 monitoring includes the EPA Quality Assurance Guidance Document 2.12,Monitoring PM2.5 in Ambient Air Using Designated Reference or Class I Equivalent Methods,November 1998 (http ://www.epa.qov/ttn/amtic/files/ambient/pm25/ga/m2 1 2covd . pdf). This referenceand other PM2.5 monitoring references are listed in the May 2013 EPA Quality Assurance Handbook
Revised November2016 Page 12
for Air Pollution Measurement Systems, Volume Il, Ambient Air Quality Monitoring Program, AppendixD Information/Action column. Other Appendix D references include 40 CFR 58, Appendices A and E;40 CFR 50, Appendices L and N; and various equipment manufacturers’ manuals’ standard operatingprocedures.
4.3.2 PM10 Monitoring
The EPA Quality Assurance Handbook, Volume II, Appendix D (July 2014) Continuous PM10 STPConditions Validation Template says the number of continuous Federal Equivalent Method PM10monitors have “measurement or sampling attributes that cannot be identified in this validationtemplate. Monitoring organizations should review specific instrument operating manuals[.
. .1. Ingeneral, 40 CFR Part 58 App A and 40 CFR Part 50 App J requirements apply to Continuous PM10.Since a guidance document was never developed for continuous PM10, many of the requirementsreflect a combination of manual and continuous PM2.5 requirements and are therefore consideredrecommendations.” The Appendix D PM10 Low Volume STP Filter-Based Local Conditions ValidationTemplate says, “...it is suggested that the validation criteria for this method follow the methodrequirements for the PM2.5 which is Appendix L.”
Since use of high-volume PM10 samplers, the original reference method for PM10 monitoring, hasbeen widespread in Nevada, this method and the Bureau’s requirements for its use are discussed ingreater detail below and on following pages. If this method is selected, the Bureau requirescompliance with Section 2.11 guidance in the EPA Quality Assurance Handbook for Air PollutionMeasurement Systems, Volume II (see References and Quality Assurance Project Plans (QAPP)section of these Guidelines).
4.3.3 High-Volume PM10 Samplers
The data reported for high-volume particulate samplers shall include:
• sampler identification• run date• filter serial number• elapsed run time (minutes)• actual flow rate (m3/min)• standard flow rate (m3/min)• netweight(g)• particulate concentration (pg/rn3).
For co-located particulate samplers, the particulate data for both samplers shall be reported in orderto provide a precision check of the samplers. Sampling shall conform to the EPA national every-sixth-day PM10 sampling schedule. The 2015 electronic link to the EPA particulate sampling scheduleis hffp://www.epa.gov/ttnarntil/files/ambienUpm25/calendar_2015.pdf. Any deviations from thesescheduled run days require justification and wriffen approval from the Bureau.
The most common type of sampler is the high-volume PM10 sampler; therefore, this guidance isdirected toward high-volume PM10 samplers. PM10 may be measured by drawing a known volume ofambient air at a specified flow rate through a size-selective inlet and through a quartz fiber filter.Particles in the PM10 size range are collected on the filter during a 24-hour sampling period frommidnight to midnight, local standard time. After a period of equilibration for temperature and humidity,filters are weighed prior to and after collection of the sample to determine the net mass of the
Revised November2016 Page 13
collected sample. The concentration of PM10 in the ambient air is computed as the total mass of thecollected particles divided by the volume of air sampled in standard conditions. The originalreference method for PM10 sampling is given in 40 CFR Part 50, Appendix J and implemented in theQuality Assurance Handbook for Air Pollution Measurement Systems, Volume II, Section 2.11.Comparisons with the PM10 standards are done according to 40 CFR Part 50, Appendix K.
For high-volume PM10 sampling, co-located PM10 samplers are required on one or more sites in eachfacility’s PM10 monitoring network, depending on the size of the network, in order that the precision ofthe samples from the network may be determined relative to EPA and Bureau requirements. The colocated samplers must be of the same type with the same inlet type and use the same method of flowcontrol. The two samplers must be located within four meters of each other, but at least two metersapart to preclude any air flow interference. The vertical placement of the samplers must be such thatthe inlets are no lower than two meters and no higher than fifteen meters above ground elevation. Ifthe sampler is to be located on a roof or near any structures, there must be a minimum clearance oftwo meters from surrounding walls or obstacles. Adjacent buildings or obstacles should be avoidedso that the distance between an obstacle and the sampler is at least twice the height that the obstacleprotrudes above the sampler. Also, there must be a minimum of a 270-degree arc of unrestrictedairflow around each sampler. The predominant wind direction for the season of greatest pollutantconcentration potential from the facility must be included in the 270-degree arc. Calibration, samplingand analysis must be the same for both co-located samplers and any other samplers in the samplingnetwork to which the co-located samplers apply. One of the two co-located samplers must bedesignated as the primary or official sampler and the second designated as the secondary orduplicate sampler. The official sampler shall be used to report the air quality for the monitoring siteand the duplicate sampler shall be used to determine the precision of the measurement. In the eventof a failure of the official sampler, the duplicate sampler may be used to report the air quality for themonitoring site.
The measured concentrations from both co-located samplers shall be reported, as well as thepercentage difference in concentrations between the two samplers for concentrations above 80pg/rn3. For the purpose of this precision check of co-located high-volume samplers, negativeconcentrations shall be reported without changing the negative concentration to zero. With properPM10 sampling and analysis, co-located samplers should generally be capable of precision of notmore than seven percent difference for concentrations above 80 pg/m3 and not more than five pg/rn3difference for concentrations below 80 pg/rn3 (40 CFR 50, Appendix J, Section 4.1).
The accuracy of high-volume PM10 samplers is assessed by auditing the actual flow rate of eachsampler with an orifice transfer standard. First the sampler flow rate is compared to the audit flowrate; then the corrected sampler flow rate without an orifice transfer standard is compared to thedesign flow rate.
The monitoring site location shall be representative of the point of maximum PM10 concentration fromthe proposed and existing facilities at the limit of public access. This shall be determined based onthe combined effect of existing facilities and the proposed new facility or modification. The maximumconcentration at the point of public access may be determined through the use of an EPA-approvedmodel. In the case where a model may not be applicable, the initial monitoring site location,supported by detailed maps, may be proposed by the applicant, and shall be based on atmosphericdrainage and prevailing wind direction in the area where the facility is to be located. Samplerlocations shall also satisfy the requirement to sample ambient air. Ambient air is defined in 40 CFR
Revised November2016 Page 14
Part 50.1 (e) as “that portion of the atmosphere, external to buildings, to which the general public hasaccess,” and in the Nevada Administrative Code (NAC) 445B.018 as “that portion of the atmospherewhich is external to buildings, structures, facilities, or installations to which the general public hasaccess.” Each monitoring site location shall be approved by Bureau staff.
4.3.3.1 Calculations for High-Volume PM10 Sampling
High-volume PM10 sampling calculations, methodology and units of measurement shall conform toSection 2.11 of the “Quality Assurance Handbook for Air Pollution Measurement Systems, Volume II,Ambient Air Specific Methods (Interim Edition)” (see the References and Quality Assurance ProjectPlans (QAPP) section of these Guidelines). The method utilizes sampler and orifice calibrationrelationships based on linear regressions involving the actual flow rate in the independent variableand the adjusted flow rate indicator reading in the dependent variable. Since the multiplier andexponent from a power-fit orifice certification (y = axb) are not usable in the specified PM10calculations, power-fit orifice certifications are not acceptable.
5. Quality Control and Quality Assurance
The Quality Assurance Handbook for Air Pollution Measurement Systems, Volume II: Part 1 (8/98)notes in Section 3 of Appendix 15, “The performance audit is used to validate and document theaccuracy of the data generated by a measurement system.” An instrument or sensor output may beadjusted only after the audit determines its accuracy in the calibration/configuration in which it wascollecting data over a period of time before the audit. Audit results must be compared with instrumentor sensor outputs, as recorded by the data acquisition system, that are derived from the samecalibration used to calculate the data values (e.g., using high volume sampler on-site flow calibrationsfor concentration calculations but lookup tables for flow audits is not acceptable).
When some meteorological sensors (e.g., pyranometers) are replaced, the sensor-specific multipliers(/offsets, if applicable) used in the data acquisition system programming may need to be updatedunless the sensor has been factory-calibrated with variable electrical resistance to yield a consistentmultiplier(/offset). The applicability of resistors used with a sensor must also be examined whensensors are replaced.
The results of particulate, gaseous and meteorological performance audits called for in theReferences and Quality Assurance Project Plans (QAPP) section of these Guidelines shall bereported to the Bureau with the monitoring report for the quarter in which the audits were conducted.For meteorological monitoring, a performance audit for each parameter is required twice yearly ateach site, every other quarter. Startup and shutdown meteorological audits may also be appropriate.A performance audit for each ambient air quality (pollutant) automated analyzer and manual sampleris required to be conducted quarterly for PSD monitoring and for non-PSD monitoring with not morethan one automated analyzer or manual sampler for a pollutant. The minimum audit schedule fornon-PSD monitoring with more than one automated analyzer or manual sampler for a pollutant is thesame as for SLAMS monitoring, as presented in 40 CFR Part 58, Appendix A, Section 3.
5.1 High-Volume PM10 SamplingHigh-volume PM10 sampling calculations, methodology and units of measurement shall conform toSection 2.11 of the Quality Assurance Handbook for Air Pollution Measurement Systems, Volume II,Ambient Air Specific Methods (Interim Edition) (see References and Quality Assurance Project Plans
Revised November 2016 Page 15
(QAPP) section of these Guidelines). Copies shall be submitted each calendar quarter of the mostrecent orifice transfer standard certifications for both calibration and audit orifices, with the slope,intercept and correlation coefficient for each orifice transfer standard calculated according to Section2.11.2 of the Section 2.11 guidance document. Copies shall also be submitted each calendar quarterof the audit sheets and sampler calibration sheets applicable to the report quarter, calculatedaccording to Sections 2.11.7 and 2.11.2 of the Section 2.11 guidance document, showing thefollowing:
• ambient temperature• uncorrected station atmospheric pressure• orifice pressure drop• sampler pressure or sampler pressure indicator reading• sampler calibration slope, intercept and correlation coefficient.
Sample calibration sheets are shown in the Section 2.11 guidance document, Figure 2.3 and Figure2.5, respectively, for mass-flow-controlled (MFC) and volumetric-flow-controlled (VFC) high-volumesamplers. Some versions of Section 2.11 guidance documents (e.g., the 1987 version and seconddraft September 1997 version) may contain an error on the MFC Sampler Calibration Data Sheet,Figure 2.3. There the formula for the subsequent calculation of the sampler flow rate with a flowrecorder using a square root scale, such as a Dickson recorder with square root chart paper (theconcentric circles become more widely spaced away from the center of the circular chart), may be inerror. This formula should have “mean I” moved outside (to the left of) the left square root bracket, sothat the square root applies only to (lay + 3O)/Pav and not to “mean I.” The correct formula is then:
Ave. Qa = {mean I [(Tav ÷ 30)/Pay]1”2 - b}{1/m}.
This error was corrected on the Internet copy of the September 1997 version, which was removed inlate 2014 and replaced with the January 1990 version of Section 2.11.Sample audit sheets in the 1990 Section 2.11 guidance are found in Figure 7.1 and Figure 7.3 forMFC and VFC samplers, respectively. In the EPA 1997 Section 2.11 guidance document, anothererror occurs in the calculation of PM10 concentrations, as explained in Item 7 of the Highlights sectionof these Guidelines. Therefore the 1997 Section 2.11 guidance should be replaced with the 1990Section 2.11 guidance, as indicated in the References and Quality Assurance Project Plans (QAPP)section of these Guidelines.
The filters shall be handled with care to minimize breakage and loss of sample. Unexposed andexposed filters shall be equilibrated in an environment with controlled temperature and humidity for atleast 24 hours before weighing. The mean temperature shall be between 15°C and 30°C, with avariability of not more than ±3°C. The mean relative humidity shall be between 20 and 45 percent,with a variability of not more than ±5 percent. If filters must be weighed outside the conditioningchamber, begin the weighing within 30 seconds of removal of the filters. Filters shall be weighed onan analytical balance with a minimum resolution of 0.1 mg and a precision of 0.5 mg that is calibratedat least annually. Before a batch of filters is weighed, the balance shall be zeroed according to themanufacturer’s recommendations. The balance shall be checked at least daily during weighs foragreement within ±0.5 mg by weighing two working mass reference standards with weights betweenIg and 5 g. The balance shall be zero-checked at least every 10 weighs for agreement within ±0.5mg of true zero. Each day of weighing, at least five exposed and unexposed filters per balance shall
Revised November 2016 Page 16
be reweighed. Reweighed unexposed filters should be within ±2.8 mg of original values. If reweighedexposed filters differ by more than 5.0 mg from original values, the laboratory supervisor shouldinvestigate why. Each calendar quarter, a copy shall be submitted of the most recent balancecalibration certification and the balance minimum resolution. Each calendar quarter, copies shall alsobe submitted of the records for each day of filter weighing, showing the equilibration temperature andrelative humidity, results of zero checks and weight checks with working mass reference standards,and results of exposed and unexposed filter re-weighs.
5.2 Continuous Particulate MonitoringPlease refer to the comments under subsections 4.3.1, PM2.5 Monitoring and 4.3.2, PMIOMonitoring. Of particular interest are the guidance elements of the EPA Quality Assurance Handbook,Volume II, Appendix D (July 2014 or later) as well as the monitoring instrument manufacturer’smanual. For continuous PM10 monitors (as opposed to manual PM10 methods), there is no co-locationrequirement.
5.3 Gaseous MonitoringAs applicable, for the quality control (station reference) and audit calibrators and gas cylinders,submit copies each calendar quarter of the most recent certifications of the ozone generatorcalibrations, photometer calibrations, mass flow-controller calibrations, and gaseous standardconcentrations with cylinder expiration dates.
Quality control for gaseous pollutant analyzers requires zero, span (traditionally, ±80% of full scale, orlower concentrations for lower measurement ranges), and precision checks (“one-point QC checks”)at least every two weeks. The results of these checks shall be included in the quarterly report in theform of the known (calibrator or cylinder) input concentration and the analyzer response data loggerconcentration for the zero, span and precision points. The accuracy tolerance for validating the datacollected since the last satisfactory quality control or audit check is a difference, or drift from true,which varies with EPA guidance updates and may be pollutant specific. As Federal ReferenceMethod and Federal Equivalent Method standard analyzers are sufficient for source monitoring,quality control check tolerances designed for trace gas monitors will not be used for standardanalyzer data validation purposes or other comparisons, and the Bureau may then default to earlier(e.g., 2008) EPA guidance tolerances suitable for standard analyzers. When such a quality controlcheck is suspect, it may be supplemented with a multipoint calibration.
A recommended zero air circuit consists of the following scrubbers in the following order: first, adesiccant, such as silica gel; then, a carbon monoxide scrubber (if applicable), such as hopcalite;then an oxidant, such as Purafil (potassium permanganate); and last, a suitable grade of activatedcarbon. The desiccant should be first in the sequence so that dry air is delivered to the remainingscrubbers. The oxidant must precede the activated carbon, since it oxidizes nitric oxide to nitrogendioxide, which is captured by the activated carbon.
The shelter temperature or instrument rack temperature shall be monitored and reported quarterly ashourly averages, with the analyzer model and EPA-designated temperature range for that analyzer tobe operated as a Federal Reference or Equivalent Method. Data collected outside the temperaturerange specified in the analyzer’s EPA certification as a reference or equivalent method shall beevaluated in conjunction with other relevant information, such as the results of zero, span andprecision checks conducted at similar panel temperature, and validated accordingly.
Revised November 2016 Page 17
5.3.1 Ozone Monitoring
Since instrument ozone outputs are elevation-dependent, test concentrations that rely on an ozonegenerator calibration, rather than a photometer concentration adjusted with pressure and temperaturesensors, shall be derived from an ozone generator calibration done at the monitoring site elevation ormathematically corrected for the monitoring site elevation. Ozone generation shall be done at thesame flow rate used to calibrate the ozone generator.
5.3.2 Nitrogen Dioxide Monitoring
The following guidance is for traditional nitrogen dioxide (NO2) analyzers measuring NO2 indirectlyand utilizing gas phase titration (GPT) with ozone to generate test NO2 concentrations. This guidanceis not for EPA-designated Reference or Equivalent Methods utilizing new technology to measure NO2concentrations directly.
For traditional nitrogen dioxide (NO2) monitoring, required quality control checks and qualityassurance audits shall use gas phase titration (GPT) or a permeation tube and record the NO2channel data logger responses. Quality control checks of the nitric oxide (NO) and oxides of nitrogen(NOr) channels alone are insufficient. Audit NO2 concentrations using GPT shall be calculated fromthe drop in the true NO concentration with GPT. For the purpose of calculating NO2 auditconcentrations with GPT, the NO channel responses shall be adjusted to true NO concentrations byapplying the NO channel audit linear regression slope and intercept to the NO channel readingsbefore and after GPT. The subtraction difference between the adjusted NO concentrations before andafter GPT is the true NO2 audit concentration.
As discussed in the 40 CFR 58, Appendix A regulations, NO2 audit gas must contain at least 0.08ppm NO (excess NO) to assure the reaction of NO with 03 to produce audit NO2 concentrations goesto completion. Due to inevitable minor channel imbalance, however, NO2 audit concentrations maylead to evaluation errors in chemiluminescence analyzers at the lower concentration audit pointsunless the high GPT audit point NO concentration is reduced for each of the lower GPT audit points(to at least 0.08 ppm above each audit NO2 concentration). For example, if the high audit point is runfirst and generates 370 ppb NO2 in 450 ppb NO (with 80 ppb excess NO), the NO concentration fora 100 ppb NO2 audit point could be 180 ppb (with 80 ppb excess NO) instead of the original (highaudit point) 450 ppb NON. Thus reducing the NO2 audit NO concentrations for the lower NO2 auditpoints will reduce the magnitude of errors introduced by channel imbalance.
The NO2 converter efficiency in percent is 100 times the slope of the linear regression, where theindependent variable (x-value) is the drop in NO (adjusted to true concentration as described above)with gas phase titration, and the dependent variable (y-value) is the independent variable (x-value)less the drop in N0 (adjusted to true concentration with the NO slope and intercept) with gas phasetitration.
5.3.3 Gaseous Monitoring Audits
As the EPA gaseous monitoring guidance (i.e., the Quality Assurance Handbook for Air PollutionMeasurement Systems, Vol. II, Appendix D audit tolerances) is geared toward urban pollution levels,toward average concentrations (as opposed to peak concentrations), which are meaningless in ruralor remote locations, and toward the use of trace gas analyzers, which are not required, the Bureaudoes not use the EPA guidance accuracy tolerances of 15% per audit point for higher concentrationsor in the case of very low audit concentrations, per point accuracy of 15% or a specified trace gas
Revised November 2016 Page 18
range concentration, whichever is higher. Instead, the Bureau relies on a linear regression analysis ofthe audit points as follows.
For this agency, gaseous multipoint audit results shall be evaluated by a linear regression analysisbetween the audit concentrations (x-axis independent variable) and the analyzer response datalogger concentrations (y-axis dependent variable). This approach provides a fairly robust way toevaluate the gas analyzer’s performance because it uses an ensemble analysis of the audit points(i.e., a check on the intercept and slope, rather than single-point checks), while ensuring a stronglinearity in the sensor response with the check on the correlation coefficient. These audit linearregression tolerances (obtained using the standard least squares method) are:
Slope: 0.90 slope 1.10 = satisfactoryIntercept: -10 ppb intercept ÷10 ppb = satisfactoryCorrelation Coefficient: corr. 0.9950 (to 1.0000) = satisfactory
NO2, SO2 and CO
Slope: 0.85 slope 1.15 = satisfactoryIntercept: -10 ppb (-1.0 ppm CO) intercept +10 ppb (+1.0 ppm CC) = satisfactoryCorrelation Coefficient: corr. 0.9950 (to 1.0000) = satisfactory.
These linear regression slope tolerances borrow from the 2008 EPA Quality Assurance Handbook forAir Pollution Measurement Systems, Vol. II, App. D, Operational Criteria, Federal Audits (NPAP)tolerances, which use a mean absolute percent difference tolerance for the audit points of 10% forozone and 15% for NO2, SO2 and CO. The linear regression intercept tolerances borrow from the2008 EPA Quality Assurance Handbook for Air Pollution Measurement Systems, Vol. II, App. D,Critical Criteria, zero drift tolerances of 2% of full scale (10 ppb and 1.0 ppm for standard analyzers)for 03 and CC, respectively, and tighten the 2008 zero drift tolerance of 3% of full scale for NO2 andSO2 to 2% of full scale (10 ppb). The Correlation Coefficient tolerance is taken from the EPA QualityAssurance Handbook for Air Pollution Measurement Systems, Vol. II: Part 1, Ambient Air QualityMonitoring Program Quality System Development (Aug., 1998), Appendix 15, Table A.11, LinearRegression Criteria.
Because a linear regression analysis is being used, the Bureau also recommends use of theregulatory optional fourth audit point: “An additional 4th level is encouraged for those PSDorganizations that would like to confirm the monitor’s linearity at the higher end of the operationalrange” (Part 58, Appendix B). Also recommended is the selection of required audit points at the highend of each audit level concentration range to make the audit points more suitable for standard gasanalyzers as opposed to trace gas or lower range analyzers.
5.3.4 Gaseous Monitoring Quality Control Checks
The EPA Quality Assurance Handbook for Air Pollution Measurement Systems, Vol. II, Appendix D,Measurement Quality Objectives and Validation Templates (May2013) criteria pollutant monitoringguidance radically changed the acceptable gaseous criteria pollutant zero drift tolerances for checks
Revised November2016 Page 19
every 14 days (biweekly checks) from the EPA 2008 Appendix D tolerances. For NO2 and SO2, thezero drift data validation tolerance was changed from 15 ppb to 1.5 ppb, for 03 from 10 ppb to 1.5ppb, and for CO from 1 ppm to 0.03 ppm. The 0.03 ppm tolerance was later identified by EPA as atypographical error that should have been 0.3 ppm. These are all trace gas analyzer tolerances,where trace gas analyzers are not required and standard analyzers are in widespread, if notexclusive, use in Nevada source monitoring.
The EPA subsequently acknowledged these 2013 zero drift tolerances for 14-day intervals weretaken in error from the 12- and 24-hour zero drift tolerances for analyzer designation by EPA as aFederal Reference or Equivalent Method. Therefore, in July 2014 EPA revised the gaseous criteriapollutant biweekly zero check tolerances, based on its statistical analysis, from 1 .5 ppb for 03, NO2and SO2 to 5.0 ppb and the CO zero check tolerance from 0.03 ppm (a typographical error for 0.3ppm) to 0.6 ppm. The Bureau finds the EPA statistical analysis on which these changes were madedoes not support these small increases in zero drift tolerances for biweekly quality control checks,which must be suitable for standard analyzers. Therefore the Bureau adopts, with consideration of theEPA 2008 Appendix D zero drift tolerances, the following zero drift tolerances: for 03, the EPA 2008tolerance of 10 ppb; for CO, the EPA 2008 tolerance of 1.0 ppm; for NO2 and SO2, the EPA 2008tolerance of 15 ppb is reduced to JO ppb.
The Bureau also does not adopt the EPA Quality Assurance Handbook for Air Pollution MeasurementSystems, Vol. II, Appendix D, Measurement Quality Objectives and Validation Templates (2013/2014)criteria pollutant monitoring guidance tolerance for biweekly ozone precision (“one point QC check”)and span checks. With concurrence from the EPA Region 9 Quality Assurance Office in 2009 for useof a 10% precision and span check tolerance to achieve the 7% ozone data quality objectives, basedon available monitoring data at that time, the Bureau uses a 10% tolerance for ozone precision andspan checks, rather than a 7% tolerance. As the regulatory precision check concentration range hasbeen lowered, the absolute magnitude of this 10% tolerance has decreased. This 10% precision andspan drift tolerance can also be compared to the 2014 EPA Appendix D per audit point tolerance of15% for annual performance evaluations.
The Bureau supports the 2014 EPA Appendix D precision and span check tolerances of 15% and10%, respectively, for NO2 and 10% for SO2 and CO.
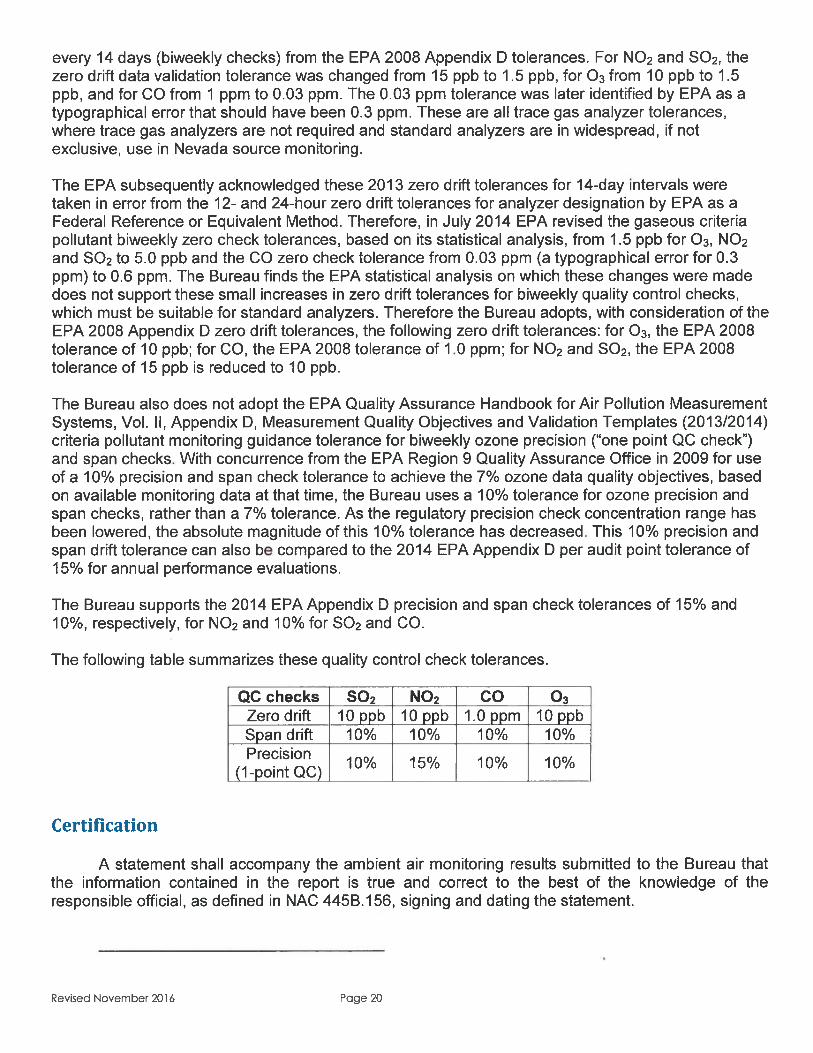
The following table summarizes these quality control check tolerances.
QC checks SO2 NO2 CO 03Zero drift loppb loppb 1.0 ppm loppbSpan drift 10% 10% 10% 10%Prefision
10% 15% 10% 10%(1-point QC)
Certification
A statement shall accompany the ambient air monitoring results submitted to the Bureau thatthe information contained in the report is true and correct to the best of the knowledge of theresponsible official, as defined in NAC 445B.156, signing and dating the statement.
Revised November 2016 Page 20