nevada department of wildlife · nevada department of wildlife ... (fps) for each district within...
TRANSCRIPT
NNeevvaaddaa DDeeppaarrttmmeenntt ooff WWiillddlliiffee
22001122
UUppllaanndd aanndd MMiiggrraattoorryy GGaammee BBiirrdd,, RRaabbbbiitt aanndd FFuurrbbeeaarriinngg MMaammmmaallss
HHaarrvveesstt DDaattaa aanndd PPooppuullaattiioonn SSttaattuuss RReeppoorrttss
CCoommppiilleedd bbyy::
SShhaawwnn PP.. EEssppiinnoossaa,, UUppllaanndd GGaammee SSttaaffff BBiioollooggiisstt RRuusssseellll WWoooollsstteennhhuullmmee,, WWaatteerrffoowwll aanndd FFuurrbbeeaarreerr SSttaaffff BBiioollooggiisstt
RReeggiioonnaall SSuuppeerrvviissiinngg GGaammee BBiioollooggiissttss
MMiicchhaaeell DDoobbeell -- KKeenn GGrraayy -- SStteevveenn KKiimmbbllee

i
State of Nevada Brian Sandoval, Governor
Department of Wildlife Kenneth E. Mayer, Director
Game Division Larry Gilbertson, Chief
BOARD OF WILDLIFE COMMISSIONERS
Jack Robb, Chairman ................................................................................. Reno Jeremy Drew, Vice Chairman .................................................................. Minden Michael McBeath ............................................................................... Las Vegas David McNinch .......................................................................................... Reno Peter Mori .......................................................................................... Tuscarora Scott Raine ............................................................................................ Eureka Grant Wallace ........................................................................................... Dyer Bill Young ......................................................................................... Las Vegas
Persons are free to use material in this report for educational or informational purposes. However, since most reports are part of continuing studies, persons intending to use this material in scientific publications should obtain prior permission from the Department of Wildlife. In all cases, tentative conclusions should be identified as such in quotation, and due credit would be appreciated. The Nevada Department of Wildlife receives funds from Federal Aid in Fish and Wildlife Restoration Acts. Federal and State law state that there shall be no difference in the treatment of individuals because of race, color, creed, religion, national origin, sex or disability. Anyone receiving alleged discriminatory treatment in any Department program, activity or facility should report it to either: Director U.S. Fish and Wildlife Service Nevada Department of Wildlife Department of the Interior 1100 Valley Road 18th & C Streets Reno, Nevada 89512 Washington D.C. 20240

ii
DIRECTOR’S MESSAGE Kenneth E. Mayer, Director
Nevada Department of Wildlife
Dear Fellow Sportsmen: The Nevada Department of Wildlife has been publishing the Upland Game, Waterfowl and Furbearer Status and Trend report since the 1950s. This year will represent at least the 52nd publication of this document. Some changes were made to streamline the document somewhat this year by condensing reports to regional summaries rather than county by county reports. More graphs have also been added over the last couple of years to facilitate easy reading and quick reference. As I write this, many of the early upland game seasons have already begun and we have been receiving fair to good reports from forest grouse hunters. We have been very pleased with the opportunities that ruffed grouse are offering Nevada sportsmen in northeastern Nevada. We have worked hard this year to translocate ruffed grouse to other areas of the state for the future establishment of the species. For those of you that have not taken part in ruffed grouse hunting in Nevada yet, we certainly encourage you to do so. In attempting to sum up how things are shaping up for our most popular game bird, the chukar partridge, our Upland Game Staff Specialist found this quote from our 1959 Small Game Season Recommendation submitted by the Game Division of the Nevada Fish and Game Commission: “Drought during the past year has shown immediate effects on chukar partridge reproduction. Although there has been a good carry-over of birds from last year, chukar reproduction is very light and practically nil in many areas. Other species are suffering from lower production than the previous year”. This excerpt certainly applies to 2012. Chukar density surveys conducted in mid-August indicated that numbers are down approximately 24% from 2011, but ironically remain 24% greater than the long-term average. Overall, expect decent numbers of birds (depending on conditions at the time you’re able to hunt) which may be difficult to approach, especially as the season progresses. I pray for adequate moisture during the remainder of 2012 into 2013. As you know, the Greater Sage-grouse remains a candidate species for listing under the Endangered Species Act. It was found “warranted for listing, but precluded by higher priority species” by the U.S. Fish and Wildlife Service in 2010. The Bureau of Land Management and US Forest Service, which manage approximately 58% of the bird’s habitat, is in the process of developing two separate Environmental Impact Statements that would allow them to efficiently amend Resource Management Plans (RMPs) and Forest Plans (FPs) for each District within the range of the species. These RMPs and FPs would theoretically include stipulations to conserve and improve the species habitat. This along with ongoing efforts by individual states and private landowners (potentially through the NRCS Sage-grouse Initiative) may negate the need for listing; however, much remains to be accomplished and there is a very tight timeline that agencies are under in order for these efforts to be considered by the U.S. Fish and Wildlife Service for their 2015 status review. On a brighter note, waterfowl hunters should experience a lot of ducks and geese migrating through Nevada this year. Continental breeding duck numbers this past spring were estimated to be an impressive 48.6 million birds, which is the highest breeding population estimate since
iii
the survey began in 1955. The estimate is 43% above long-term averages and 7% higher than last year’s estimate. Despite the dry year we are experiencing, water reserves from last year’s abundant moisture has us in a good condition in many of Nevada’s marshes and management areas. Many are at 80 to 90% capacity going into the hunting season. There should be plenty of migrating birds, and with water to draw them in, we can only hope for some good duck weather to turn this into a great season. For those trappers out there, the 2012-13 season should be a great year. Prey species continue to be plentiful in many areas following a couple of years of good moisture. Furbearing species have responded favorably and production continues to be good. This is particularly evident with bobcat, which saw production that was over the 10-year average for the third straight year. Prices on most species increased last year with coyote prices increasing by 40% and bobcat prices increasing by 7%. With both production and prices up, it should prove to be a good trapping season. I would encourage those of you with youngsters to get out during the youth hunts. They are excellent opportunities to get the younger generation involved with our beloved sport and away from the television or video games. They are also opportunities for you to scout your favorite spots. I also urge all you veteran hunters out there to participate in the Department’s Mentor Program. Identify a candidate that you feel would enjoy the program and sign them up as an apprentice hunter. An “apprentice” license is valid for one year for persons 18 years of age and older, does not require a Hunter Education Certificate and is free. We hope that this ultimately helps recruit new hunters. On behalf of the Nevada Department of Wildlife, thank you for supporting wildlife management and conservation through the purchase of your hunting license and Upland Game and/or Waterfowl Stamp. Fees obtained from licenses, permits and stamps allow us to provide match for federal grant funding and conduct the type of work you see in this document, as well as “on the ground” projects to benefit wildlife populations. We face many challenges in the future, but remain optimistic that those challenges can be met head on and addressed to improve wildlife populations and habitat for future generations. Sincerely,

1
TABLE OF CONTENTS BOARD OF WILDLIFE COMMISSIONERS ................................................................................................................ i DIRECTOR’S MESSAGE .........................................................................................................................................ii TABLE OF CONTENTS .......................................................................................................................................... 1 2012‐13 HUNTING SEASONS & BAG LIMIT REGULATIONS ................................................................................... 2
UPLAND GAME .......................................................................................................................................................... 2 WILD TURKEY ............................................................................................................................................................ 7 FALCONRY SEASON .................................................................................................................................................. 13 FURBEARING ANIMALS ............................................................................................................................................ 14 BOBCAT PELT SEALING DATES ................................................................................................................................. 15 MIGRATORY UPLAND GAME BIRDS ......................................................................................................................... 16
STATEWIDE SUMMARIES FOR UPLAND GAME SPECIES ...................................................................................... 17 GREATER SAGE‐GROUSE ......................................................................................................................................... 17 FOREST GROUSE ...................................................................................................................................................... 20 CHUKAR PARTRIDGE ................................................................................................................................................ 22 CALIFORNIA QUAIL .................................................................................................................................................. 23 GAMBEL’S QUAIL ..................................................................................................................................................... 24 RABBIT ..................................................................................................................................................................... 26
STATEWIDE SUMMARY OF MIGRATORY GAME BIRDS ....................................................................................... 28 WATERFOWL ........................................................................................................................................................... 28 DUCKS AND MERGANSERS ...................................................................................................................................... 29 GEESE ...................................................................................................................................................................... 30 TUNDRA SWAN ........................................................................................................................................................ 31 MOURNING AND WHITE‐WINGED DOVE ................................................................................................................ 33 BAND‐TAILED PIGEON ............................................................................................................................................. 37 AMERICAN CROW .................................................................................................................................................... 37
STATEWIDE SUMMARY FOR FURBEARER ANIMALS ............................................................................................ 39 REGIONAL GAME DIVISION STAFF ..................................................................................................................... 42 REGIONAL SPECIES SUMMARIES ........................................................................................................................ 43
GREATER SAGE‐GROUSE ......................................................................................................................................... 43 FOREST GROUSE ............................................................................................................................................... 48
SNOWCOCK ............................................................................................................................................................. 52 CHUKAR AND HUNGARIAN PARTRIDGE .................................................................................................................. 53 CALIFORNIA QUAIL .................................................................................................................................................. 56 GAMBEL’S QUAIL ..................................................................................................................................................... 58 PHEASANT ............................................................................................................................................................... 59 WILD TURKEY .......................................................................................................................................................... 60 RABBIT ..................................................................................................................................................................... 64
APPENDIX I ..................................................................................................................................................... A‐1 APPENDIX 2 .................................................................................................................................................... Q‐1

2
2012-13 HUNTING SEASONS & BAG LIMIT REGULATIONS
COMMISSION REGULATION 12-06
UPLAND GAME (Units referenced are Game Management Units)
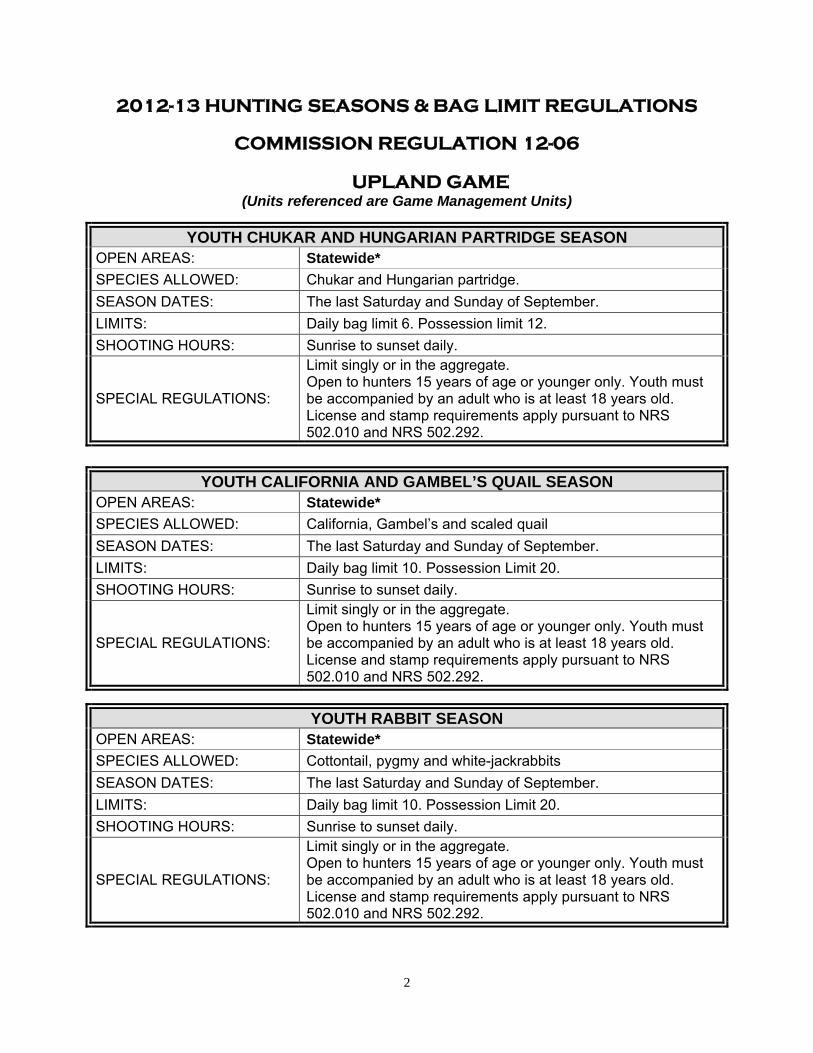
YOUTH CHUKAR AND HUNGARIAN PARTRIDGE SEASON OPEN AREAS: Statewide*
SPECIES ALLOWED: Chukar and Hungarian partridge. SEASON DATES: The last Saturday and Sunday of September. LIMITS: Daily bag limit 6. Possession limit 12. SHOOTING HOURS: Sunrise to sunset daily.
SPECIAL REGULATIONS:
Limit singly or in the aggregate. Open to hunters 15 years of age or younger only. Youth must be accompanied by an adult who is at least 18 years old. License and stamp requirements apply pursuant to NRS 502.010 and NRS 502.292.
YOUTH CALIFORNIA AND GAMBEL’S QUAIL SEASON OPEN AREAS: Statewide*
SPECIES ALLOWED: California, Gambel’s and scaled quail SEASON DATES: The last Saturday and Sunday of September. LIMITS: Daily bag limit 10. Possession Limit 20. SHOOTING HOURS: Sunrise to sunset daily.
SPECIAL REGULATIONS:
Limit singly or in the aggregate. Open to hunters 15 years of age or younger only. Youth must be accompanied by an adult who is at least 18 years old. License and stamp requirements apply pursuant to NRS 502.010 and NRS 502.292.
YOUTH RABBIT SEASON OPEN AREAS: Statewide*
SPECIES ALLOWED: Cottontail, pygmy and white-jackrabbits SEASON DATES: The last Saturday and Sunday of September. LIMITS: Daily bag limit 10. Possession Limit 20. SHOOTING HOURS: Sunrise to sunset daily.
SPECIAL REGULATIONS:
Limit singly or in the aggregate. Open to hunters 15 years of age or younger only. Youth must be accompanied by an adult who is at least 18 years old. License and stamp requirements apply pursuant to NRS 502.010 and NRS 502.292.

3
SAGE-GROUSE
OPEN AREAS:
Elko County, except Units 079, 091 and 106 Eureka County, except Unit 068 Lander County, except Units 151, 153, 156, 183 and 184 Nye County, except Units 132, 133, 181, 251, 252, 261 and
262 Washoe County, except Units 021, 022, 033, 194 and 196 White Pine County, except Unit 114, 115 and 132
SEASON DATES: September 25 – October 9 LIMITS: Daily bag limit 2. Possession limit 4. SHOOTING HOURS: Sunrise to sunset daily. SPECIAL REGULATIONS: Closed to nonresidents.
SAGE-GROUSE
OPEN AREAS: Humboldt County, except Units 031, 032, 033, 035, 042, 044, 046 and 151
SEASON DATES: September 25 – October 4 LIMITS: Daily bag limit 2. Possession limit 4. SHOOTING HOURS: Sunrise to sunset daily. SPECIAL REGULATIONS: Closed to nonresidents.
SAGE-GROUSE
OPEN AREAS: Churchill County, except Units 041, 181, 182 and 183 Lander County, except Units 068, 151, 152, 153, 154, 155, 156, 161, 172, 173
SEASON DATES: First Saturday and Sunday in October LIMITS: Daily bag limit 2. Possession limit 4. SHOOTING HOURS: Sunrise to sunset daily. SPECIAL REGULATIONS: Closed to nonresidents.
4
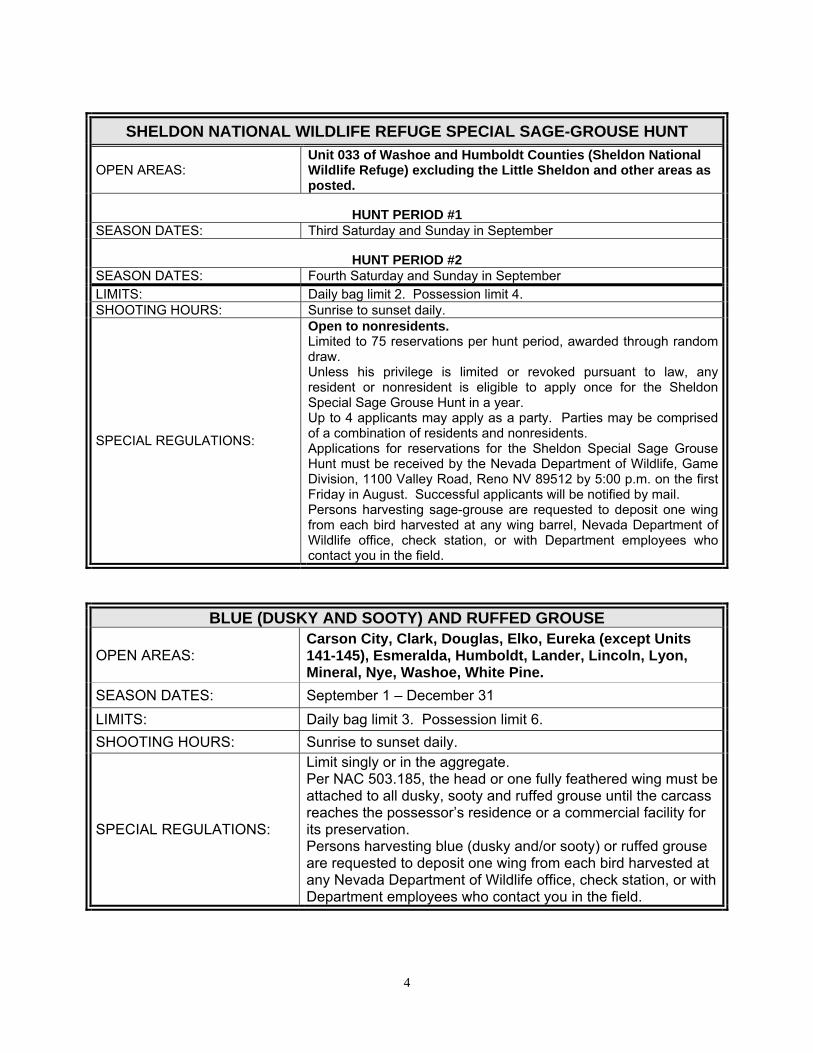
SHELDON NATIONAL WILDLIFE REFUGE SPECIAL SAGE-GROUSE HUNT
OPEN AREAS: Unit 033 of Washoe and Humboldt Counties (Sheldon National Wildlife Refuge) excluding the Little Sheldon and other areas as posted.
HUNT PERIOD #1 SEASON DATES: Third Saturday and Sunday in September
HUNT PERIOD #2 SEASON DATES: Fourth Saturday and Sunday in September LIMITS: Daily bag limit 2. Possession limit 4. SHOOTING HOURS: Sunrise to sunset daily.
SPECIAL REGULATIONS:
Open to nonresidents. Limited to 75 reservations per hunt period, awarded through random draw. Unless his privilege is limited or revoked pursuant to law, any resident or nonresident is eligible to apply once for the Sheldon Special Sage Grouse Hunt in a year. Up to 4 applicants may apply as a party. Parties may be comprised of a combination of residents and nonresidents. Applications for reservations for the Sheldon Special Sage Grouse Hunt must be received by the Nevada Department of Wildlife, Game Division, 1100 Valley Road, Reno NV 89512 by 5:00 p.m. on the first Friday in August. Successful applicants will be notified by mail. Persons harvesting sage-grouse are requested to deposit one wing from each bird harvested at any wing barrel, Nevada Department of Wildlife office, check station, or with Department employees who contact you in the field.
BLUE (DUSKY AND SOOTY) AND RUFFED GROUSE
OPEN AREAS: Carson City, Clark, Douglas, Elko, Eureka (except Units 141-145), Esmeralda, Humboldt, Lander, Lincoln, Lyon, Mineral, Nye, Washoe, White Pine.
SEASON DATES: September 1 – December 31 LIMITS: Daily bag limit 3. Possession limit 6. SHOOTING HOURS: Sunrise to sunset daily.
SPECIAL REGULATIONS:
Limit singly or in the aggregate. Per NAC 503.185, the head or one fully feathered wing must be attached to all dusky, sooty and ruffed grouse until the carcass reaches the possessor’s residence or a commercial facility for its preservation. Persons harvesting blue (dusky and/or sooty) or ruffed grouse are requested to deposit one wing from each bird harvested at any Nevada Department of Wildlife office, check station, or with Department employees who contact you in the field.
5
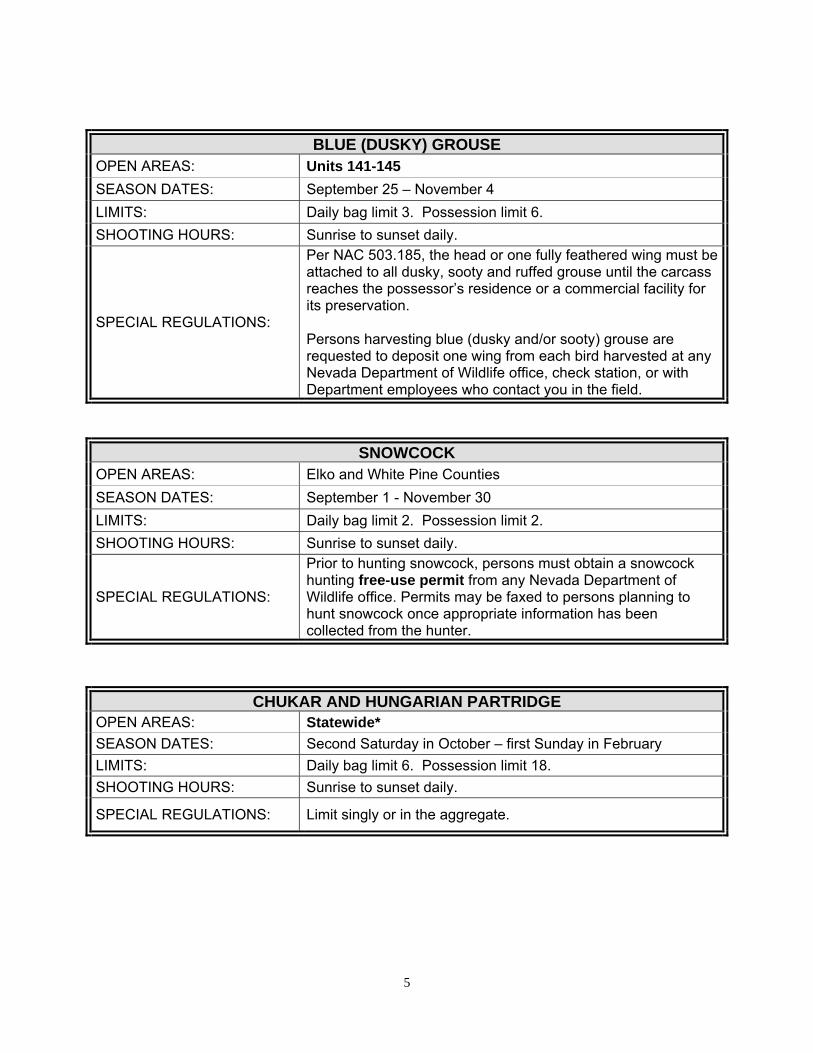
BLUE (DUSKY) GROUSE OPEN AREAS: Units 141-145
SEASON DATES: September 25 – November 4 LIMITS: Daily bag limit 3. Possession limit 6. SHOOTING HOURS: Sunrise to sunset daily.
SPECIAL REGULATIONS:
Per NAC 503.185, the head or one fully feathered wing must be attached to all dusky, sooty and ruffed grouse until the carcass reaches the possessor’s residence or a commercial facility for its preservation. Persons harvesting blue (dusky and/or sooty) grouse are requested to deposit one wing from each bird harvested at any Nevada Department of Wildlife office, check station, or with Department employees who contact you in the field.
SNOWCOCK OPEN AREAS: Elko and White Pine Counties SEASON DATES: September 1 - November 30 LIMITS: Daily bag limit 2. Possession limit 2. SHOOTING HOURS: Sunrise to sunset daily.
SPECIAL REGULATIONS:
Prior to hunting snowcock, persons must obtain a snowcock hunting free-use permit from any Nevada Department of Wildlife office. Permits may be faxed to persons planning to hunt snowcock once appropriate information has been collected from the hunter.
CHUKAR AND HUNGARIAN PARTRIDGE OPEN AREAS: Statewide*
SEASON DATES: Second Saturday in October – first Sunday in February LIMITS: Daily bag limit 6. Possession limit 18. SHOOTING HOURS: Sunrise to sunset daily.
SPECIAL REGULATIONS: Limit singly or in the aggregate.
6
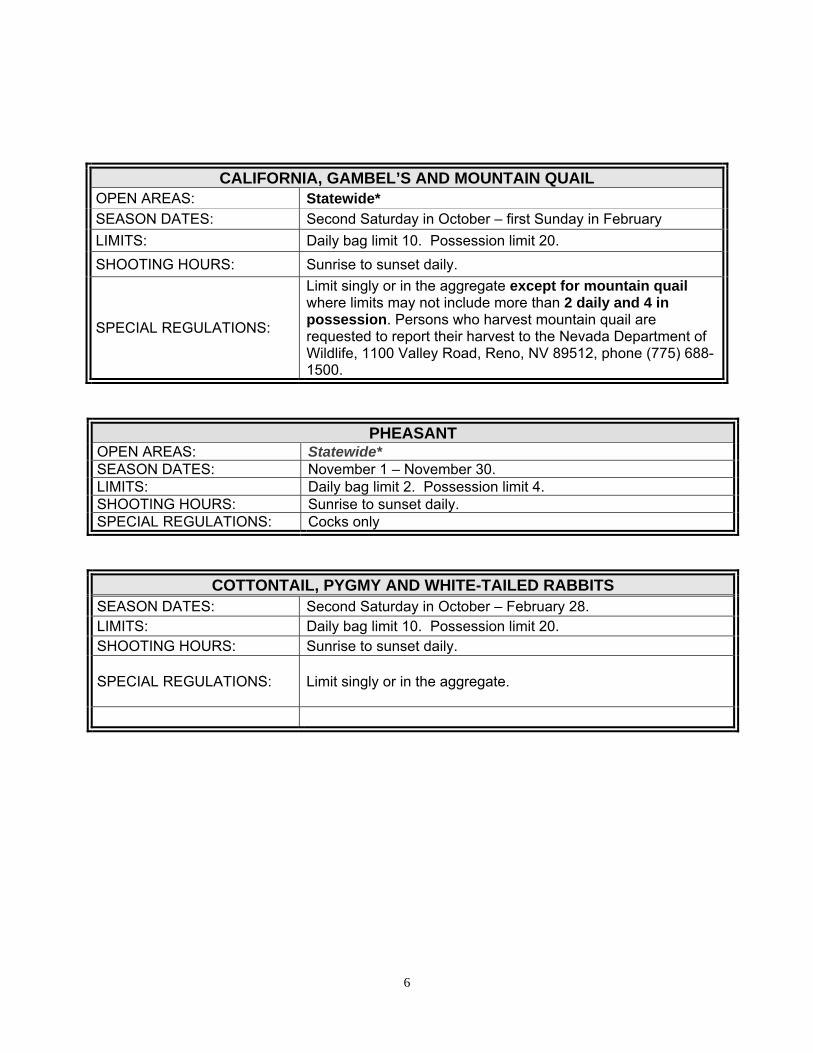
CALIFORNIA, GAMBEL’S AND MOUNTAIN QUAIL OPEN AREAS: Statewide*
SEASON DATES: Second Saturday in October – first Sunday in February LIMITS: Daily bag limit 10. Possession limit 20. SHOOTING HOURS: Sunrise to sunset daily.
SPECIAL REGULATIONS:
Limit singly or in the aggregate except for mountain quail where limits may not include more than 2 daily and 4 in possession. Persons who harvest mountain quail are requested to report their harvest to the Nevada Department of Wildlife, 1100 Valley Road, Reno, NV 89512, phone (775) 688-1500.
PHEASANT OPEN AREAS: Statewide* SEASON DATES: November 1 – November 30. LIMITS: Daily bag limit 2. Possession limit 4. SHOOTING HOURS: Sunrise to sunset daily. SPECIAL REGULATIONS: Cocks only
COTTONTAIL, PYGMY AND WHITE-TAILED RABBITS SEASON DATES: Second Saturday in October – February 28. LIMITS: Daily bag limit 10. Possession limit 20. SHOOTING HOURS: Sunrise to sunset daily.
SPECIAL REGULATIONS: Limit singly or in the aggregate.

7
WILD TURKEY
JUNIOR WILD TURKEY 2013-2014 GENERAL SPRING HUNTS – 0138
PHYSICAL CHARACTERISTICS: Bearded Wild Turkey LIMIT: 1 by tag only. SHOOTING HOURS: One half hour before sunrise to 4:00 p.m. daily
SPECIAL REGULATIONS:
Youth must be 12 prior to the opening of the hunt season indicated and not attain their 18th birthday until after the last day of the hunt season indicated, pursuant to NAC 502.063. Applications for these tags or bonus points will only be accepted during the draw application periods. Remaining tags will not be issued. Closed to nonresidents.
OPEN AREAS: Season Dates Quota
Unit 151 & 152 of Lander County* Last Saturday in March through Last Sunday in April 1 Mason Valley Wildlife Management Area
Last Saturday in March through Last Sunday in April 2
* Applicants are advised that a significant portion of the turkey population occurs on private lands and permission should be obtained from a landowner before applying for this hunt.
2013 - 2014 APPLICATION PROCEDURES FOR RESIDENT AND NONRESIDENT HUNTS:
Unless his privilege is limited or revoked pursuant to law, an eligible person may apply once for a type of hunt for Wild Turkey during a draw period. Only one person may apply on an application. Except for those Wild Turkey hunts requiring the landowner to sign the application, Wild Turkey applications must be submitted online through the Internet at www.huntnevada.com. Hand delivered applications will not be accepted. Applications will be accepted until 11:00:00 p.m. on the third Tuesday in February. Applications for bonus points only will be accepted until 11:00:00 p.m. on the fourth Tuesday in February. The release date will be the first Friday in March. Except as specified for the Junior Wild Turkey Hunts and Landowner Hunts, any remaining tags will be available on a first come, first serve basis through the Internet at www.ndow.org over the counter during business hours, M – F, 8 a.m. to 5 p.m. at Wildlife Administrative Services, 185 N. Maine St., Fallon, Nevada 89407. Remaining tags will be sold until 7 weekdays prior to the close of the season. Only one Wild Turkey tag can be awarded to an individual within a calendar year.

8
WILD TURKEY 2013 & 2014 SPRING – LIMITED ENTRY – HUNTS 0131 & 0132 PHYSICAL CHARACTERISTICS: Bearded Wild Turkey
LIMIT: 1 by tag only
SHOOTING HOURS: One half hour before sunrise to 4:00 p.m. daily
UNIT 091 of ELKO COUNTY
Seasons Tag Quota
Resident Hunt 0131
Nonresident Hunt 0132
Hunt Periods: Last Saturday in March – first Sunday in May 5 -
UNIT 101 of ELKO COUNTY*
Seasons Tag Quota
Resident Hunt 0131
Nonresident Hunt 0132
Hunt Periods: Last Saturday in March – first Sunday in May 5 -
UNITS 102 & 065 of ELKO COUNTY*
Seasons Tag Quota
Resident Hunt 0131
Nonresident Hunt 0132
Hunt Periods: Last Saturday in March – first Sunday in May 12 1
UNITS 151 and 152 of LANDER COUNTY*
Seasons Tag Quota
Resident Hunt 0131
Nonresident Hunt 0132
Hunt Periods: Last Saturday in March – first Sunday in May 3 -
UNIT 192 of DOUGLAS COUNTY*
Seasons Tag Quota
Resident Hunt 0131
Nonresident Hunt 0132
Hunt Periods: Last Saturday in March – first Sunday in May 2 -
*Applicants are advised that a significant portion of the turkey population occurs on private lands and permission should be obtained from a landowner before applying for this hunt. Wild Turkey Continued on Next Page

9
WILD TURKEY 2013 & 2014 SPRING – LIMITED ENTRY – HUNTS 0131 & 0132
PHYSICAL CHARACTERISTICS: Bearded Wild Turkey
LIMIT: 1 by tag only
SHOOTING HOURS: One half hour before sunrise to 4:00 p.m. daily
MASON VALLEY WILDLIFE MANAGEMENT AREA ONLY OF UNIT 203
Seasons Tag Quota
Resident Hunt 0131
Nonresident Hunt 0132
Hunt Periods:
Last Saturday in March – first Sunday in April 5 - Second Saturday in April – third Sunday in April 5 - Last Saturday in April – first Sunday in May 5 -
MOAPA VALLEY PORTION OF UNITS 243, 244, 268, 271, & 272 IN CLARK COUNTY*
Seasons Tag Quota
Resident Hunt 0131
Nonresident Hunt 0132
Hunt Periods:
Last Saturday in March – first Sunday in April 3 1 Second Saturday in April – third Sunday in April 4 - Last Saturday in April – first Sunday in May 4 -
PERSHING COUNTY*
Seasons Tag Quota
Resident Hunt 0131
Nonresident Hunt 0132
Hunt Periods:
Last Saturday in March – second Sunday in April 5 - Third Saturday in April – first Sunday in May 5 -
UNIT 115 OF WHITE PINE COUNTY**
Seasons Tag Quota
Resident Hunt 0131
Nonresident Hunt 0132
Hunt Periods: Last Saturday in March – first Sunday in May 18 2
*Applicants are advised that a significant portion of the turkey population occurs on private lands and permission should be obtained from a landowner before applying for this hunt. **Applicants are advised that a significant portion of the turkey population occurs on Great Basin National Park lands. Hunting is not permitted within park boundaries.
Wild Turkey Continued on Next Page
10
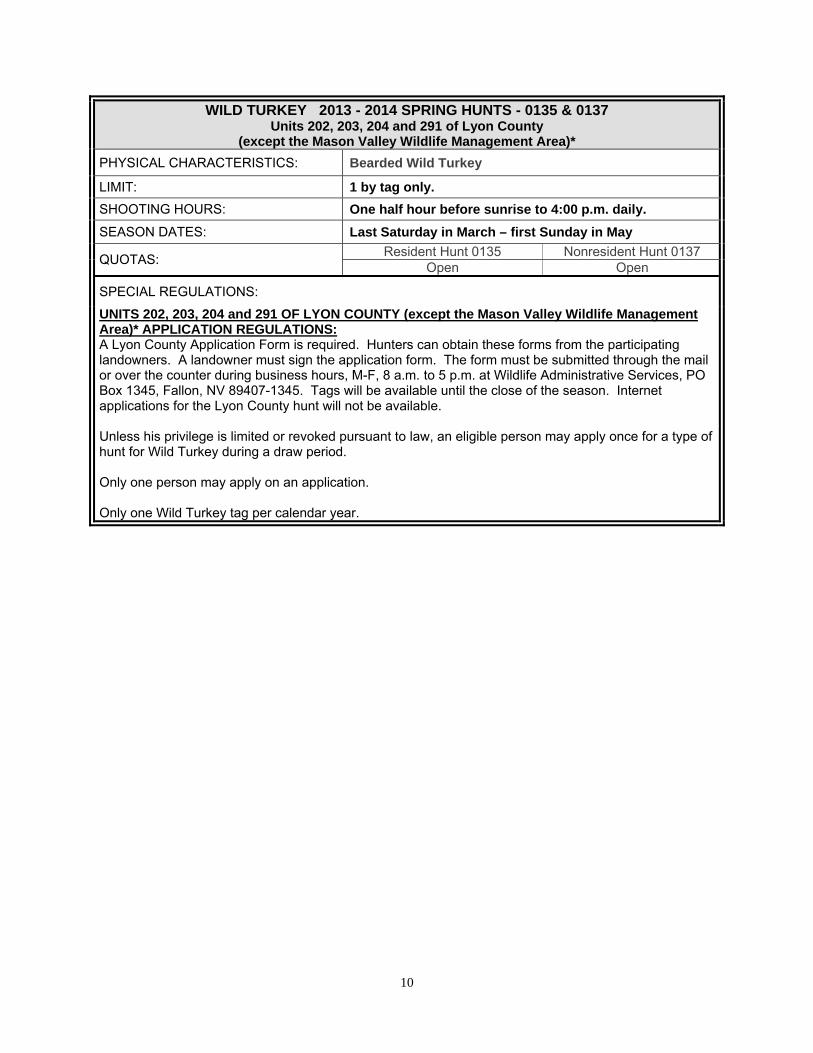
WILD TURKEY 2013 - 2014 SPRING HUNTS - 0135 & 0137 Units 202, 203, 204 and 291 of Lyon County
(except the Mason Valley Wildlife Management Area)*
PHYSICAL CHARACTERISTICS: Bearded Wild Turkey
LIMIT: 1 by tag only.
SHOOTING HOURS: One half hour before sunrise to 4:00 p.m. daily.
SEASON DATES: Last Saturday in March – first Sunday in May
QUOTAS: Resident Hunt 0135 Nonresident Hunt 0137 Open Open
SPECIAL REGULATIONS:
UNITS 202, 203, 204 and 291 OF LYON COUNTY (except the Mason Valley Wildlife Management Area)* APPLICATION REGULATIONS: A Lyon County Application Form is required. Hunters can obtain these forms from the participating landowners. A landowner must sign the application form. The form must be submitted through the mail or over the counter during business hours, M-F, 8 a.m. to 5 p.m. at Wildlife Administrative Services, PO Box 1345, Fallon, NV 89407-1345. Tags will be available until the close of the season. Internet applications for the Lyon County hunt will not be available. Unless his privilege is limited or revoked pursuant to law, an eligible person may apply once for a type of hunt for Wild Turkey during a draw period. Only one person may apply on an application. Only one Wild Turkey tag per calendar year.
11
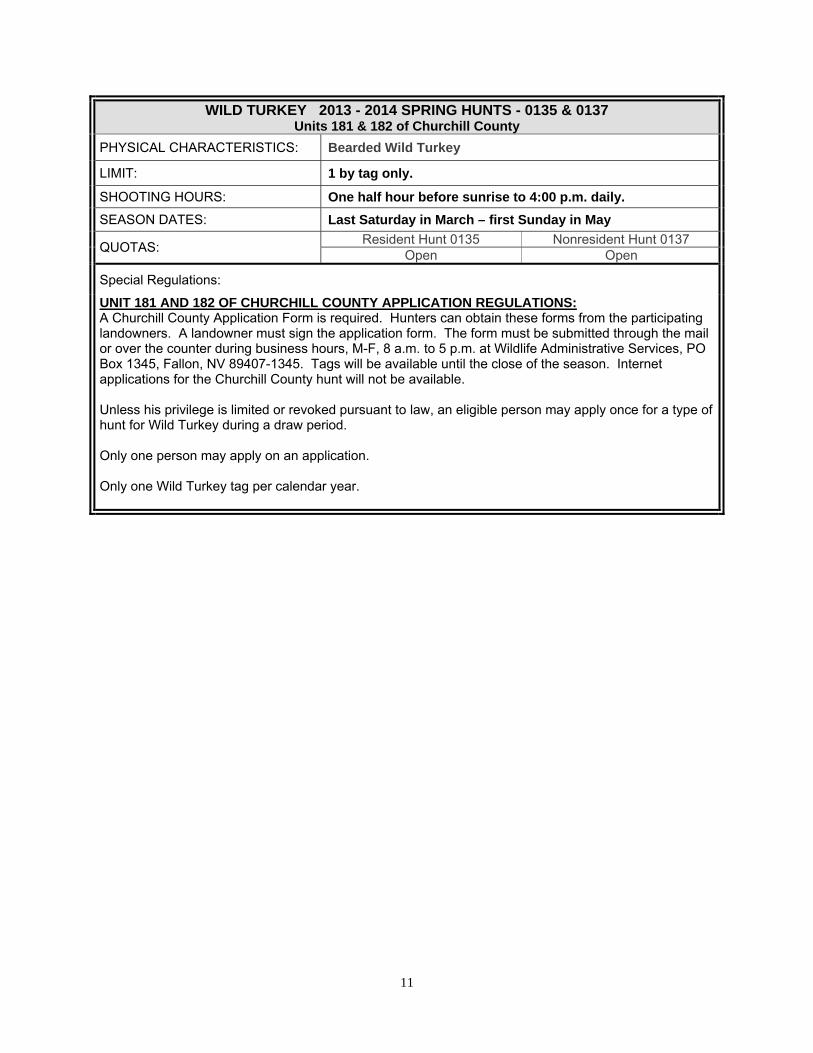
WILD TURKEY 2013 - 2014 SPRING HUNTS - 0135 & 0137 Units 181 & 182 of Churchill County
PHYSICAL CHARACTERISTICS: Bearded Wild Turkey
LIMIT: 1 by tag only.
SHOOTING HOURS: One half hour before sunrise to 4:00 p.m. daily.
SEASON DATES: Last Saturday in March – first Sunday in May
QUOTAS: Resident Hunt 0135 Nonresident Hunt 0137 Open Open
Special Regulations:
UNIT 181 AND 182 OF CHURCHILL COUNTY APPLICATION REGULATIONS: A Churchill County Application Form is required. Hunters can obtain these forms from the participating landowners. A landowner must sign the application form. The form must be submitted through the mail or over the counter during business hours, M-F, 8 a.m. to 5 p.m. at Wildlife Administrative Services, PO Box 1345, Fallon, NV 89407-1345. Tags will be available until the close of the season. Internet applications for the Churchill County hunt will not be available. Unless his privilege is limited or revoked pursuant to law, an eligible person may apply once for a type of hunt for Wild Turkey during a draw period. Only one person may apply on an application. Only one Wild Turkey tag per calendar year.
12
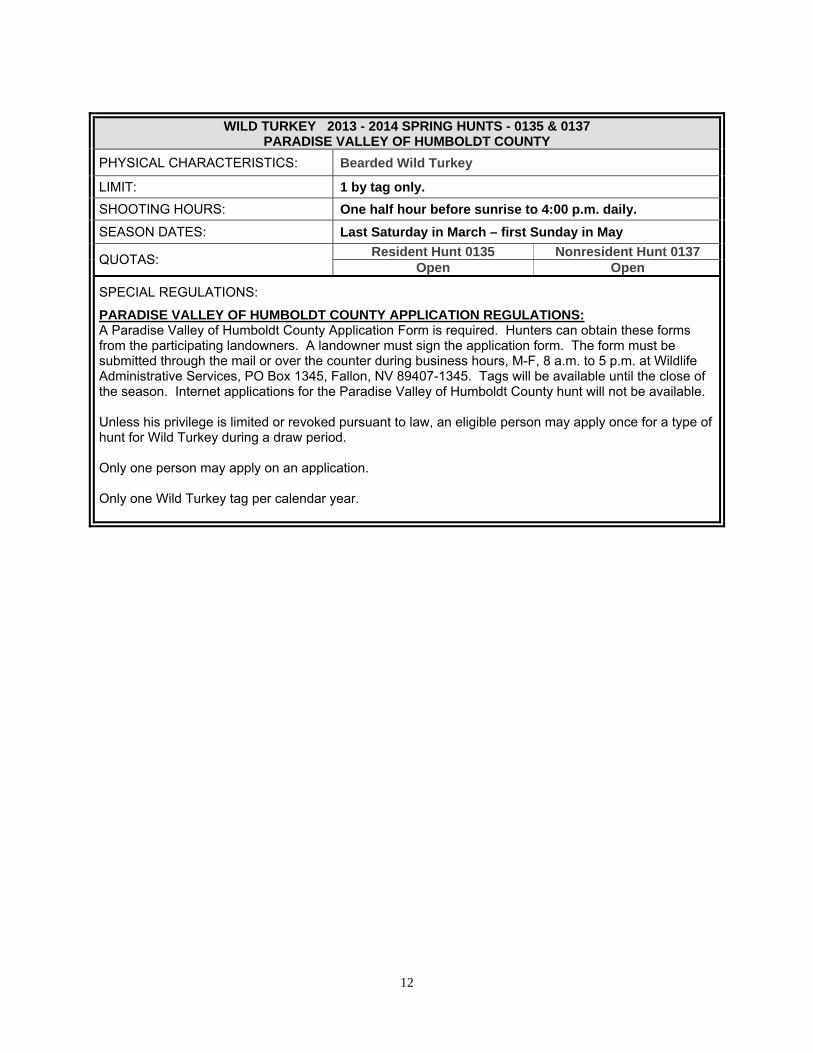
WILD TURKEY 2013 - 2014 SPRING HUNTS - 0135 & 0137
PARADISE VALLEY OF HUMBOLDT COUNTY PHYSICAL CHARACTERISTICS: Bearded Wild Turkey
LIMIT: 1 by tag only.
SHOOTING HOURS: One half hour before sunrise to 4:00 p.m. daily.
SEASON DATES: Last Saturday in March – first Sunday in May
QUOTAS: Resident Hunt 0135 Nonresident Hunt 0137 Open Open
SPECIAL REGULATIONS:
PARADISE VALLEY OF HUMBOLDT COUNTY APPLICATION REGULATIONS: A Paradise Valley of Humboldt County Application Form is required. Hunters can obtain these forms from the participating landowners. A landowner must sign the application form. The form must be submitted through the mail or over the counter during business hours, M-F, 8 a.m. to 5 p.m. at Wildlife Administrative Services, PO Box 1345, Fallon, NV 89407-1345. Tags will be available until the close of the season. Internet applications for the Paradise Valley of Humboldt County hunt will not be available. Unless his privilege is limited or revoked pursuant to law, an eligible person may apply once for a type of hunt for Wild Turkey during a draw period. Only one person may apply on an application. Only one Wild Turkey tag per calendar year.
13
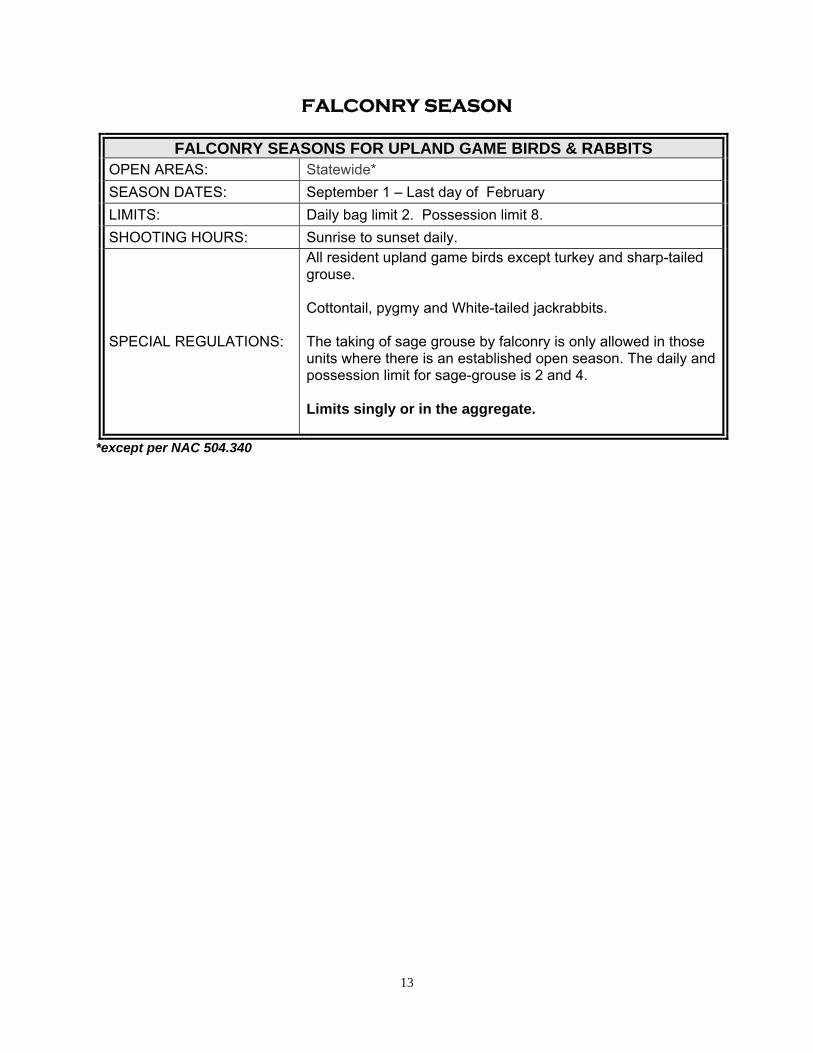
FALCONRY SEASON
FALCONRY SEASONS FOR UPLAND GAME BIRDS & RABBITS OPEN AREAS: Statewide* SEASON DATES: September 1 – Last day of February LIMITS: Daily bag limit 2. Possession limit 8. SHOOTING HOURS: Sunrise to sunset daily.
SPECIAL REGULATIONS:
All resident upland game birds except turkey and sharp-tailed grouse. Cottontail, pygmy and White-tailed jackrabbits. The taking of sage grouse by falconry is only allowed in those units where there is an established open season. The daily and possession limit for sage-grouse is 2 and 4. Limits singly or in the aggregate.
*except per NAC 504.340
14
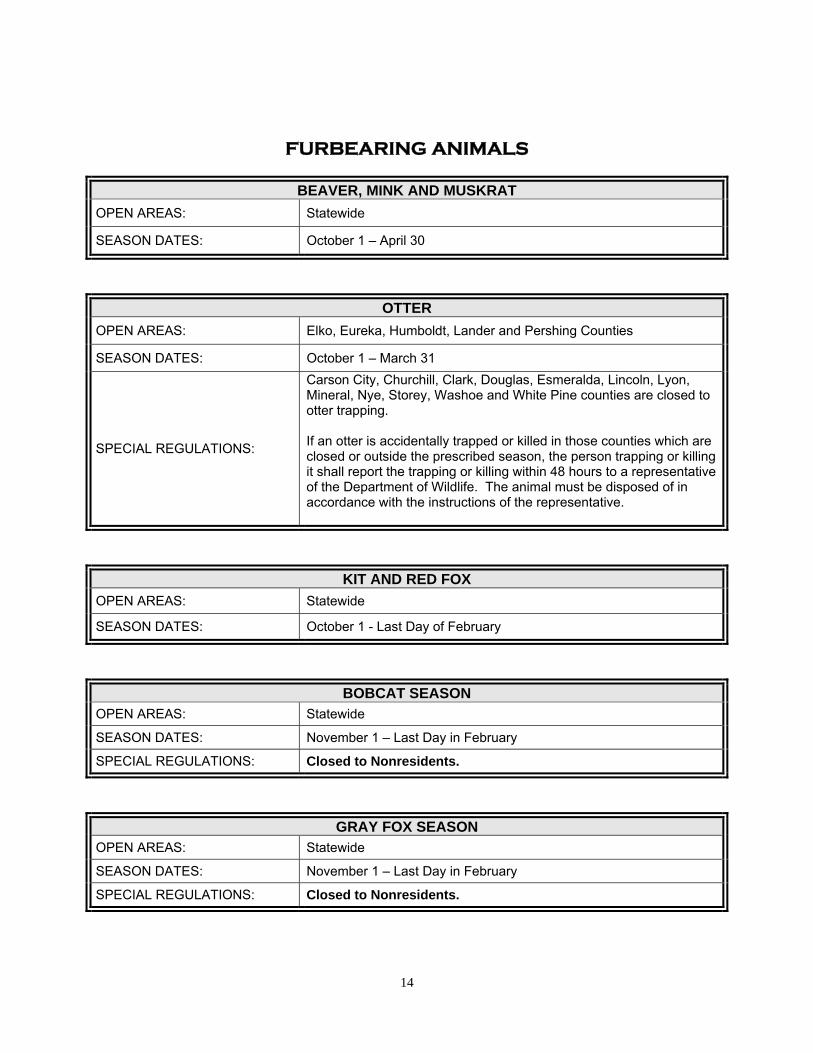
FURBEARING ANIMALS
BEAVER, MINK AND MUSKRAT
OPEN AREAS: Statewide
SEASON DATES: October 1 – April 30
OTTER
OPEN AREAS: Elko, Eureka, Humboldt, Lander and Pershing Counties
SEASON DATES: October 1 – March 31
SPECIAL REGULATIONS:
Carson City, Churchill, Clark, Douglas, Esmeralda, Lincoln, Lyon, Mineral, Nye, Storey, Washoe and White Pine counties are closed to otter trapping. If an otter is accidentally trapped or killed in those counties which are closed or outside the prescribed season, the person trapping or killing it shall report the trapping or killing within 48 hours to a representative of the Department of Wildlife. The animal must be disposed of in accordance with the instructions of the representative.
KIT AND RED FOX
OPEN AREAS: Statewide
SEASON DATES: October 1 - Last Day of February
BOBCAT SEASON OPEN AREAS: Statewide
SEASON DATES: November 1 – Last Day in February
SPECIAL REGULATIONS: Closed to Nonresidents.
GRAY FOX SEASON OPEN AREAS: Statewide
SEASON DATES: November 1 – Last Day in February
SPECIAL REGULATIONS: Closed to Nonresidents.
15
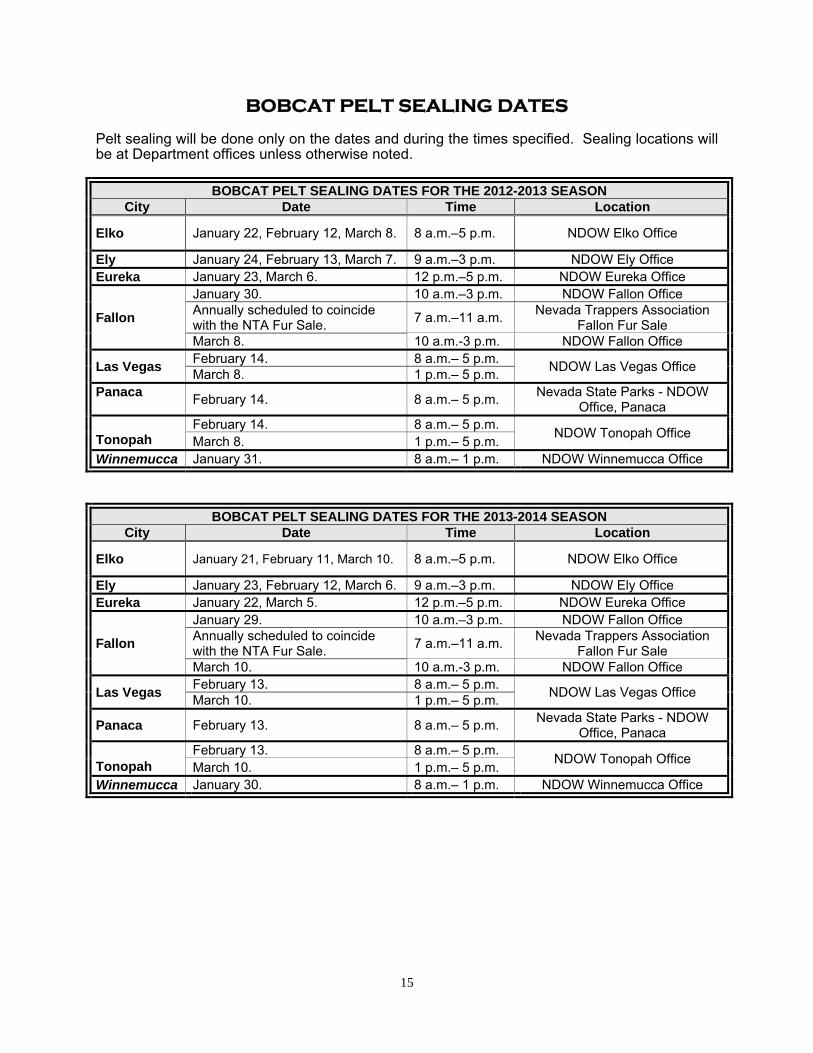
BOBCAT PELT SEALING DATES Pelt sealing will be done only on the dates and during the times specified. Sealing locations will be at Department offices unless otherwise noted.
BOBCAT PELT SEALING DATES FOR THE 2012-2013 SEASON City Date Time Location
Elko January 22, February 12, March 8. 8 a.m.–5 p.m. NDOW Elko Office
Ely January 24, February 13, March 7. 9 a.m.–3 p.m. NDOW Ely Office Eureka January 23, March 6. 12 p.m.–5 p.m. NDOW Eureka Office
Fallon
January 30. 10 a.m.–3 p.m. NDOW Fallon Office Annually scheduled to coincide with the NTA Fur Sale. 7 a.m.–11 a.m. Nevada Trappers Association
Fallon Fur Sale March 8. 10 a.m.-3 p.m. NDOW Fallon Office
Las Vegas February 14. 8 a.m.– 5 p.m. NDOW Las Vegas Office March 8. 1 p.m.– 5 p.m.
Panaca February 14. 8 a.m.– 5 p.m. Nevada State Parks - NDOW Office, Panaca
Tonopah
February 14. 8 a.m.– 5 p.m. NDOW Tonopah Office March 8. 1 p.m.– 5 p.m. Winnemucca January 31. 8 a.m.– 1 p.m. NDOW Winnemucca Office
BOBCAT PELT SEALING DATES FOR THE 2013-2014 SEASON City Date Time Location
Elko January 21, February 11, March 10. 8 a.m.–5 p.m. NDOW Elko Office
Ely January 23, February 12, March 6. 9 a.m.–3 p.m. NDOW Ely Office Eureka January 22, March 5. 12 p.m.–5 p.m. NDOW Eureka Office
Fallon
January 29. 10 a.m.–3 p.m. NDOW Fallon Office Annually scheduled to coincide with the NTA Fur Sale. 7 a.m.–11 a.m. Nevada Trappers Association
Fallon Fur Sale March 10. 10 a.m.-3 p.m. NDOW Fallon Office
Las Vegas February 13. 8 a.m.– 5 p.m. NDOW Las Vegas Office March 10. 1 p.m.– 5 p.m.
Panaca February 13. 8 a.m.– 5 p.m. Nevada State Parks - NDOW Office, Panaca
Tonopah
February 13. 8 a.m.– 5 p.m. NDOW Tonopah Office March 10. 1 p.m.– 5 p.m. Winnemucca January 30. 8 a.m.– 1 p.m. NDOW Winnemucca Office
16
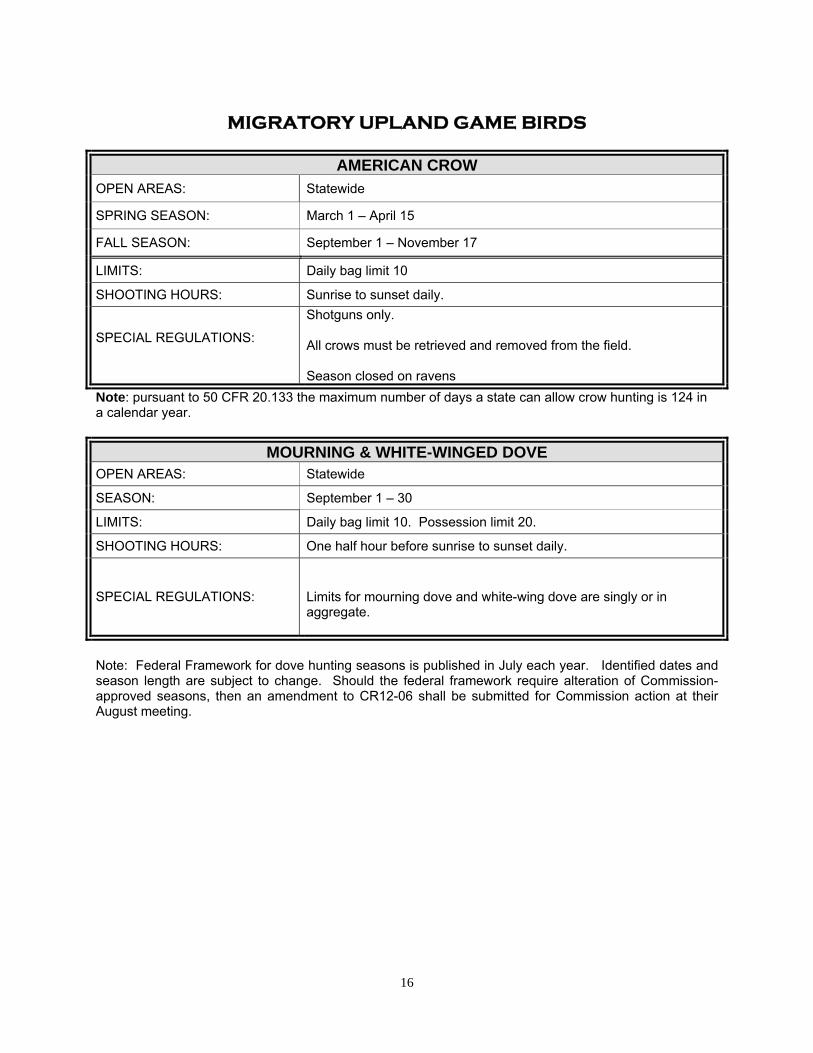
MIGRATORY UPLAND GAME BIRDS
AMERICAN CROW
OPEN AREAS: Statewide
SPRING SEASON: March 1 – April 15
FALL SEASON: September 1 – November 17
LIMITS: Daily bag limit 10
SHOOTING HOURS: Sunrise to sunset daily.
SPECIAL REGULATIONS:
Shotguns only. All crows must be retrieved and removed from the field. Season closed on ravens
Note: pursuant to 50 CFR 20.133 the maximum number of days a state can allow crow hunting is 124 in a calendar year.
MOURNING & WHITE-WINGED DOVE OPEN AREAS: Statewide
SEASON: September 1 – 30
LIMITS: Daily bag limit 10. Possession limit 20.
SHOOTING HOURS: One half hour before sunrise to sunset daily.
SPECIAL REGULATIONS:
Limits for mourning dove and white-wing dove are singly or in aggregate.
Note: Federal Framework for dove hunting seasons is published in July each year. Identified dates and season length are subject to change. Should the federal framework require alteration of Commission-approved seasons, then an amendment to CR12-06 shall be submitted for Commission action at their August meeting.
17
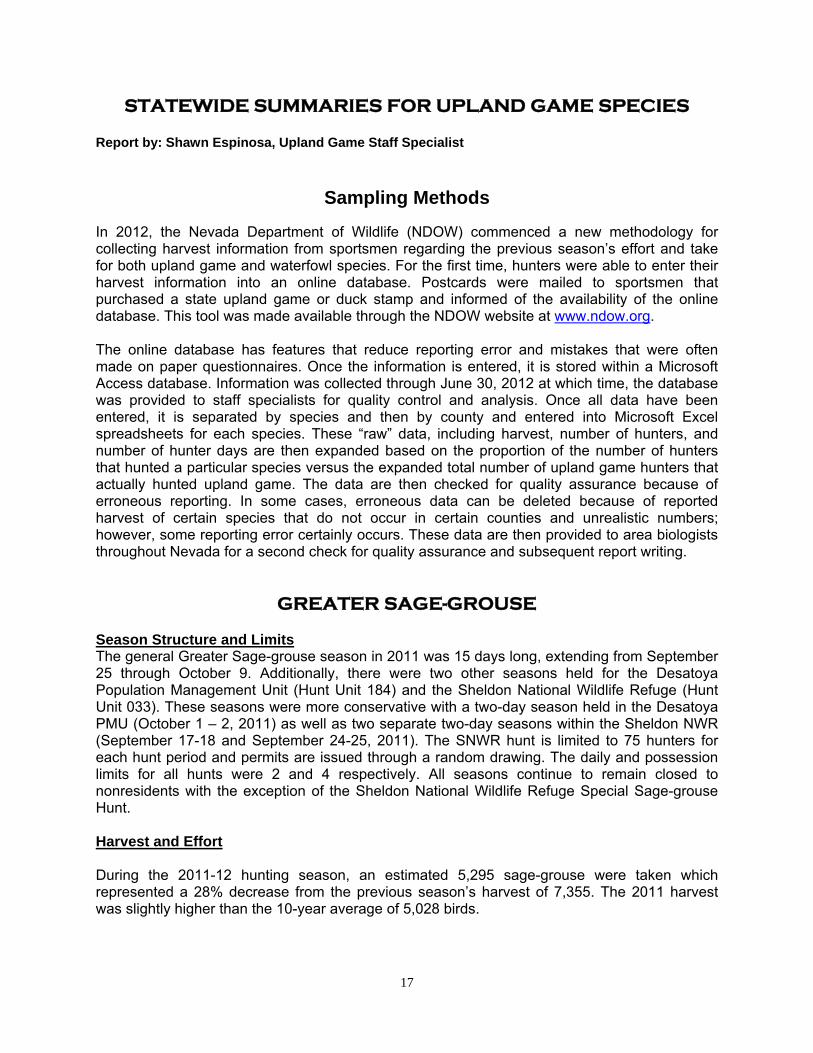
STATEWIDE SUMMARIES FOR UPLAND GAME SPECIES Report by: Shawn Espinosa, Upland Game Staff Specialist
Sampling Methods In 2012, the Nevada Department of Wildlife (NDOW) commenced a new methodology for collecting harvest information from sportsmen regarding the previous season’s effort and take for both upland game and waterfowl species. For the first time, hunters were able to enter their harvest information into an online database. Postcards were mailed to sportsmen that purchased a state upland game or duck stamp and informed of the availability of the online database. This tool was made available through the NDOW website at www.ndow.org. The online database has features that reduce reporting error and mistakes that were often made on paper questionnaires. Once the information is entered, it is stored within a Microsoft Access database. Information was collected through June 30, 2012 at which time, the database was provided to staff specialists for quality control and analysis. Once all data have been entered, it is separated by species and then by county and entered into Microsoft Excel spreadsheets for each species. These “raw” data, including harvest, number of hunters, and number of hunter days are then expanded based on the proportion of the number of hunters that hunted a particular species versus the expanded total number of upland game hunters that actually hunted upland game. The data are then checked for quality assurance because of erroneous reporting. In some cases, erroneous data can be deleted because of reported harvest of certain species that do not occur in certain counties and unrealistic numbers; however, some reporting error certainly occurs. These data are then provided to area biologists throughout Nevada for a second check for quality assurance and subsequent report writing.
GREATER SAGE-GROUSE
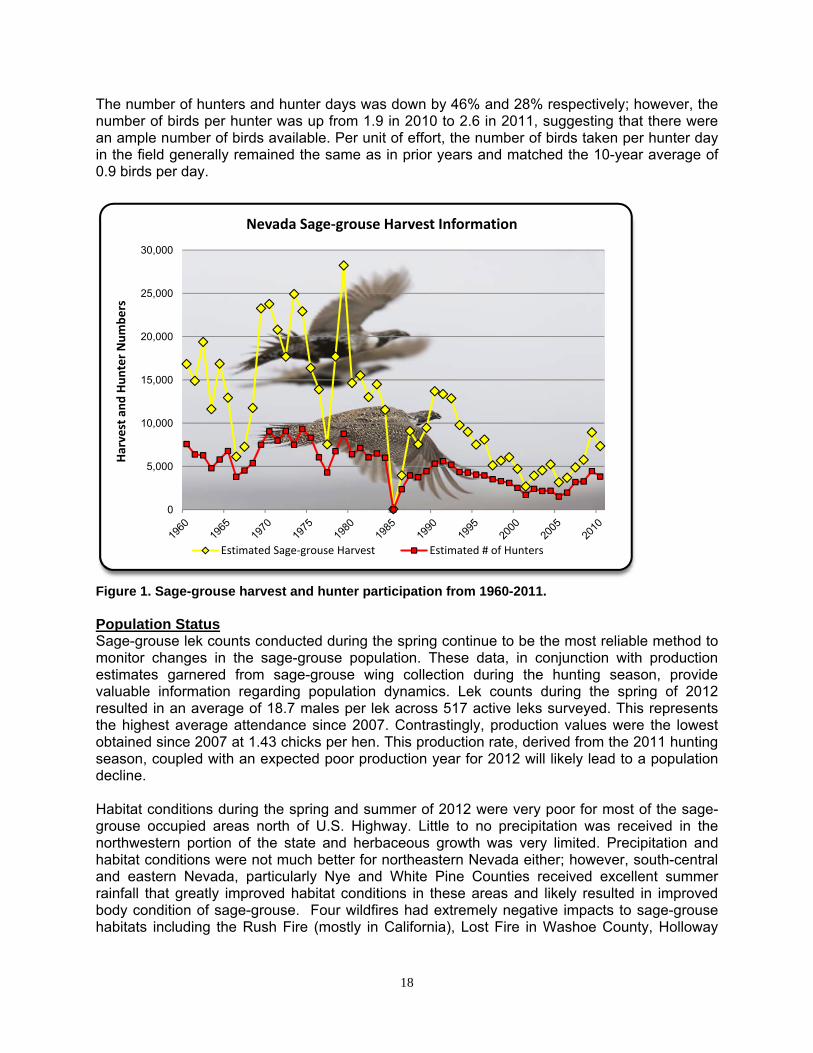
Season Structure and Limits The general Greater Sage-grouse season in 2011 was 15 days long, extending from September 25 through October 9. Additionally, there were two other seasons held for the Desatoya Population Management Unit (Hunt Unit 184) and the Sheldon National Wildlife Refuge (Hunt Unit 033). These seasons were more conservative with a two-day season held in the Desatoya PMU (October 1 – 2, 2011) as well as two separate two-day seasons within the Sheldon NWR (September 17-18 and September 24-25, 2011). The SNWR hunt is limited to 75 hunters for each hunt period and permits are issued through a random drawing. The daily and possession limits for all hunts were 2 and 4 respectively. All seasons continue to remain closed to nonresidents with the exception of the Sheldon National Wildlife Refuge Special Sage-grouse Hunt. Harvest and Effort During the 2011-12 hunting season, an estimated 5,295 sage-grouse were taken which represented a 28% decrease from the previous season’s harvest of 7,355. The 2011 harvest was slightly higher than the 10-year average of 5,028 birds.
18
The number of hunters and hunter days was down by 46% and 28% respectively; however, the number of birds per hunter was up from 1.9 in 2010 to 2.6 in 2011, suggesting that there were an ample number of birds available. Per unit of effort, the number of birds taken per hunter day in the field generally remained the same as in prior years and matched the 10-year average of 0.9 birds per day.
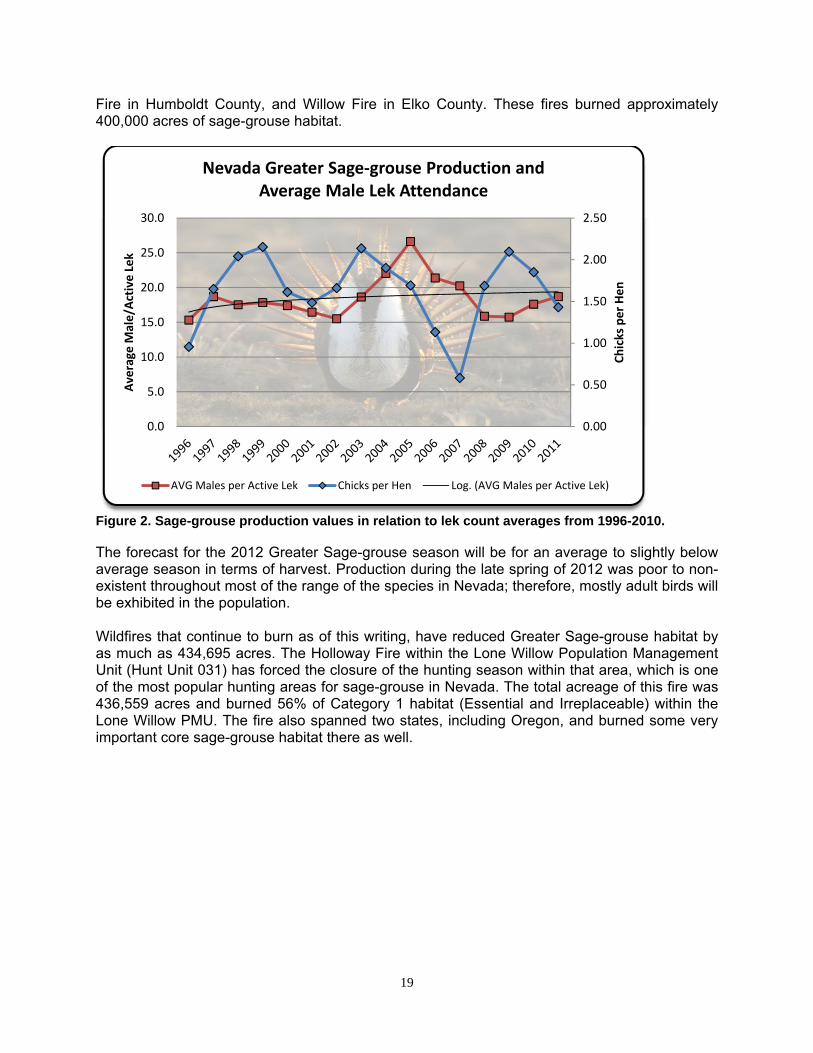
Figure 1. Sage-grouse harvest and hunter participation from 1960-2011. Population Status Sage-grouse lek counts conducted during the spring continue to be the most reliable method to monitor changes in the sage-grouse population. These data, in conjunction with production estimates garnered from sage-grouse wing collection during the hunting season, provide valuable information regarding population dynamics. Lek counts during the spring of 2012 resulted in an average of 18.7 males per lek across 517 active leks surveyed. This represents the highest average attendance since 2007. Contrastingly, production values were the lowest obtained since 2007 at 1.43 chicks per hen. This production rate, derived from the 2011 hunting season, coupled with an expected poor production year for 2012 will likely lead to a population decline. Habitat conditions during the spring and summer of 2012 were very poor for most of the sage-grouse occupied areas north of U.S. Highway. Little to no precipitation was received in the northwestern portion of the state and herbaceous growth was very limited. Precipitation and habitat conditions were not much better for northeastern Nevada either; however, south-central and eastern Nevada, particularly Nye and White Pine Counties received excellent summer rainfall that greatly improved habitat conditions in these areas and likely resulted in improved body condition of sage-grouse. Four wildfires had extremely negative impacts to sage-grouse habitats including the Rush Fire (mostly in California), Lost Fire in Washoe County, Holloway
0
5,000
10,000
15,000
20,000
25,000
30,000
Harvest and Hunter Numbers
Nevada Sage‐grouse Harvest Information
Estimated Sage‐grouse Harvest Estimated # of Hunters
19
Fire in Humboldt County, and Willow Fire in Elko County. These fires burned approximately 400,000 acres of sage-grouse habitat.
Figure 2. Sage-grouse production values in relation to lek count averages from 1996-2010. The forecast for the 2012 Greater Sage-grouse season will be for an average to slightly below average season in terms of harvest. Production during the late spring of 2012 was poor to non-existent throughout most of the range of the species in Nevada; therefore, mostly adult birds will be exhibited in the population. Wildfires that continue to burn as of this writing, have reduced Greater Sage-grouse habitat by as much as 434,695 acres. The Holloway Fire within the Lone Willow Population Management Unit (Hunt Unit 031) has forced the closure of the hunting season within that area, which is one of the most popular hunting areas for sage-grouse in Nevada. The total acreage of this fire was 436,559 acres and burned 56% of Category 1 habitat (Essential and Irreplaceable) within the Lone Willow PMU. The fire also spanned two states, including Oregon, and burned some very important core sage-grouse habitat there as well.
0.00
0.50
1.00
1.50
2.00
2.50
0.0
5.0
10.0
15.0
20.0
25.0
30.0
Chicks per Hen
Average
Male/A
ctive Lek
Nevada Greater Sage‐grouse Production and Average Male Lek Attendance
AVG Males per Active Lek Chicks per Hen Log. (AVG Males per Active Lek)
20
FOREST GROUSE (Blue and Ruffed Grouse)
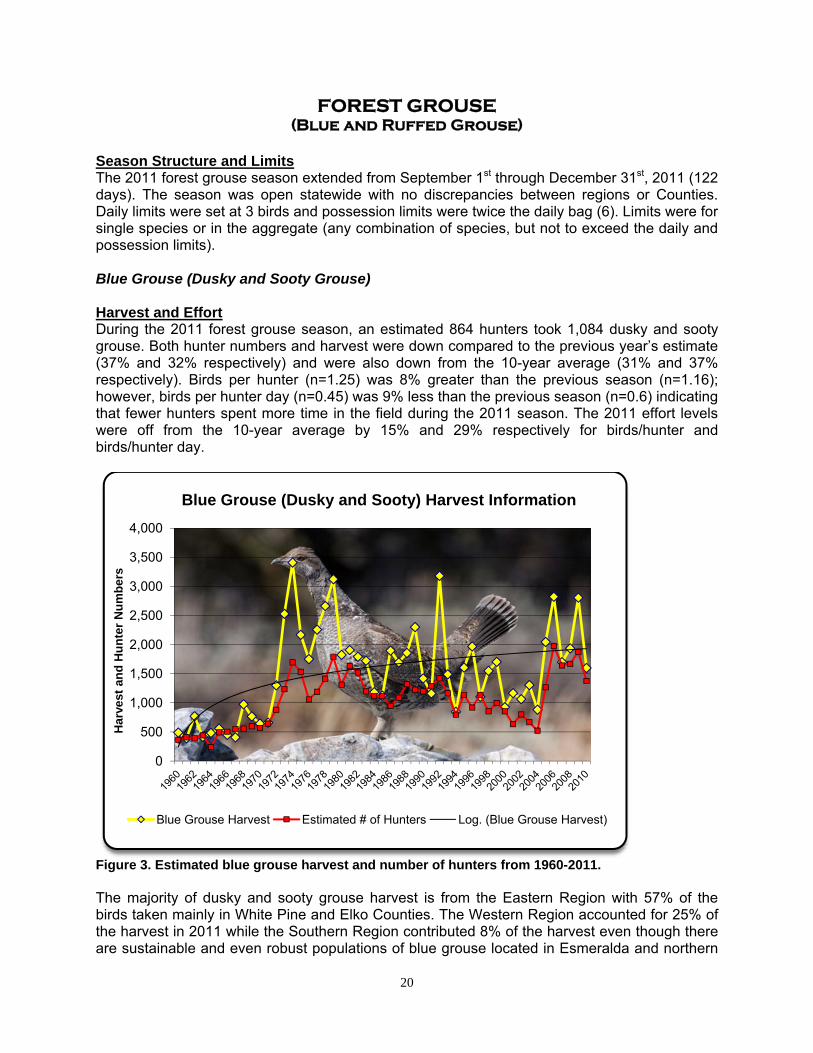
Season Structure and Limits The 2011 forest grouse season extended from September 1st through December 31st, 2011 (122 days). The season was open statewide with no discrepancies between regions or Counties. Daily limits were set at 3 birds and possession limits were twice the daily bag (6). Limits were for single species or in the aggregate (any combination of species, but not to exceed the daily and possession limits). Blue Grouse (Dusky and Sooty Grouse) Harvest and Effort During the 2011 forest grouse season, an estimated 864 hunters took 1,084 dusky and sooty grouse. Both hunter numbers and harvest were down compared to the previous year’s estimate (37% and 32% respectively) and were also down from the 10-year average (31% and 37% respectively). Birds per hunter (n=1.25) was 8% greater than the previous season (n=1.16); however, birds per hunter day (n=0.45) was 9% less than the previous season (n=0.6) indicating that fewer hunters spent more time in the field during the 2011 season. The 2011 effort levels were off from the 10-year average by 15% and 29% respectively for birds/hunter and birds/hunter day.
Figure 3. Estimated blue grouse harvest and number of hunters from 1960-2011. The majority of dusky and sooty grouse harvest is from the Eastern Region with 57% of the birds taken mainly in White Pine and Elko Counties. The Western Region accounted for 25% of the harvest in 2011 while the Southern Region contributed 8% of the harvest even though there are sustainable and even robust populations of blue grouse located in Esmeralda and northern
0
500
1,000
1,500
2,000
2,500
3,000
3,500
4,000
Har
vest
an
d H
un
ter
Nu
mb
ers
Blue Grouse (Dusky and Sooty) Harvest Information
Blue Grouse Harvest Estimated # of Hunters Log. (Blue Grouse Harvest)
21
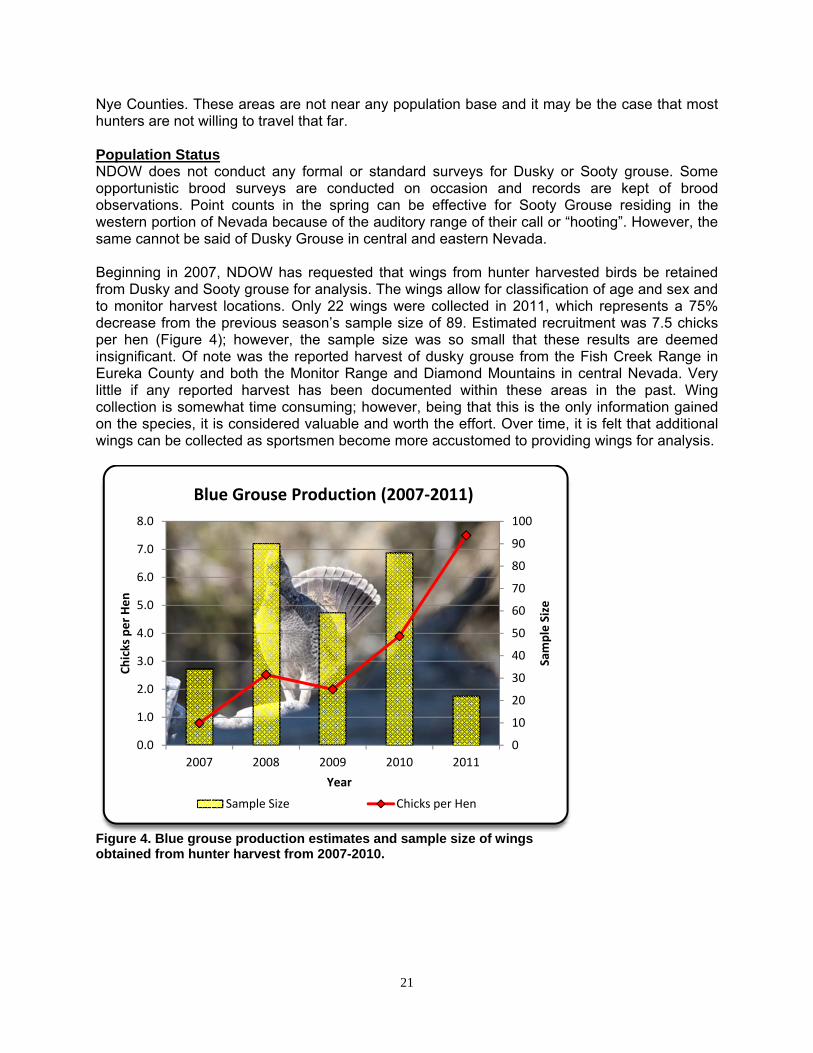
Nye Counties. These areas are not near any population base and it may be the case that most hunters are not willing to travel that far. Population Status NDOW does not conduct any formal or standard surveys for Dusky or Sooty grouse. Some opportunistic brood surveys are conducted on occasion and records are kept of brood observations. Point counts in the spring can be effective for Sooty Grouse residing in the western portion of Nevada because of the auditory range of their call or “hooting”. However, the same cannot be said of Dusky Grouse in central and eastern Nevada. Beginning in 2007, NDOW has requested that wings from hunter harvested birds be retained from Dusky and Sooty grouse for analysis. The wings allow for classification of age and sex and to monitor harvest locations. Only 22 wings were collected in 2011, which represents a 75% decrease from the previous season’s sample size of 89. Estimated recruitment was 7.5 chicks per hen (Figure 4); however, the sample size was so small that these results are deemed insignificant. Of note was the reported harvest of dusky grouse from the Fish Creek Range in Eureka County and both the Monitor Range and Diamond Mountains in central Nevada. Very little if any reported harvest has been documented within these areas in the past. Wing collection is somewhat time consuming; however, being that this is the only information gained on the species, it is considered valuable and worth the effort. Over time, it is felt that additional wings can be collected as sportsmen become more accustomed to providing wings for analysis.
Figure 4. Blue grouse production estimates and sample size of wings obtained from hunter harvest from 2007-2010.
0
10
20
30
40
50
60
70
80
90
100
0.0
1.0
2.0
3.0
4.0
5.0
6.0
7.0
8.0
2007 2008 2009 2010 2011
Sample Size
Chicks per Hen
Year
Blue Grouse Production (2007‐2011)
Sample Size Chicks per Hen
22
Ruffed Grouse Harvest and Effort The estimated ruffed grouse harvest and number of hunters were equal at 196 during the 2011 season. This represented an 11% increase in harvest from the previous season’s harvest of 177 birds even though hunter numbers were down 20% from the previous year. The majority of ruffed grouse were harvested in the Eastern Region within Elko County (85%) with the remaining 15% of harvest coming from Humboldt County in the Western Region. Population Status Population size and distribution within Elko County appears to be growing within the Independence, Bull Run and Merritt Mountain areas. Additionally, populations in the Santa Rosa Range in Humboldt County and the Ruby Mountains in Elko County appear to be stable. Fledgling populations established from recent releases in the northern Toiyabe Range and the northern portion of the Tuscarora Range also appear to be successful as indicated from radio-marked individuals. Additional release augmentations to both of these populations should allow for more robust populations and provide opportunities for expansion. Recent trapping efforts during the summer of 2012 in northern Elko County suggest that ruffed grouse production in this area is good. Brood size appears fairly large with several broods of greater than 5 chicks observed. Even though conditions were very dry throughout much of Nevada, this portion of the state appears to have received climate and precipitation patterns conducive to improved nest success and chick survival.
CHUKAR PARTRIDGE
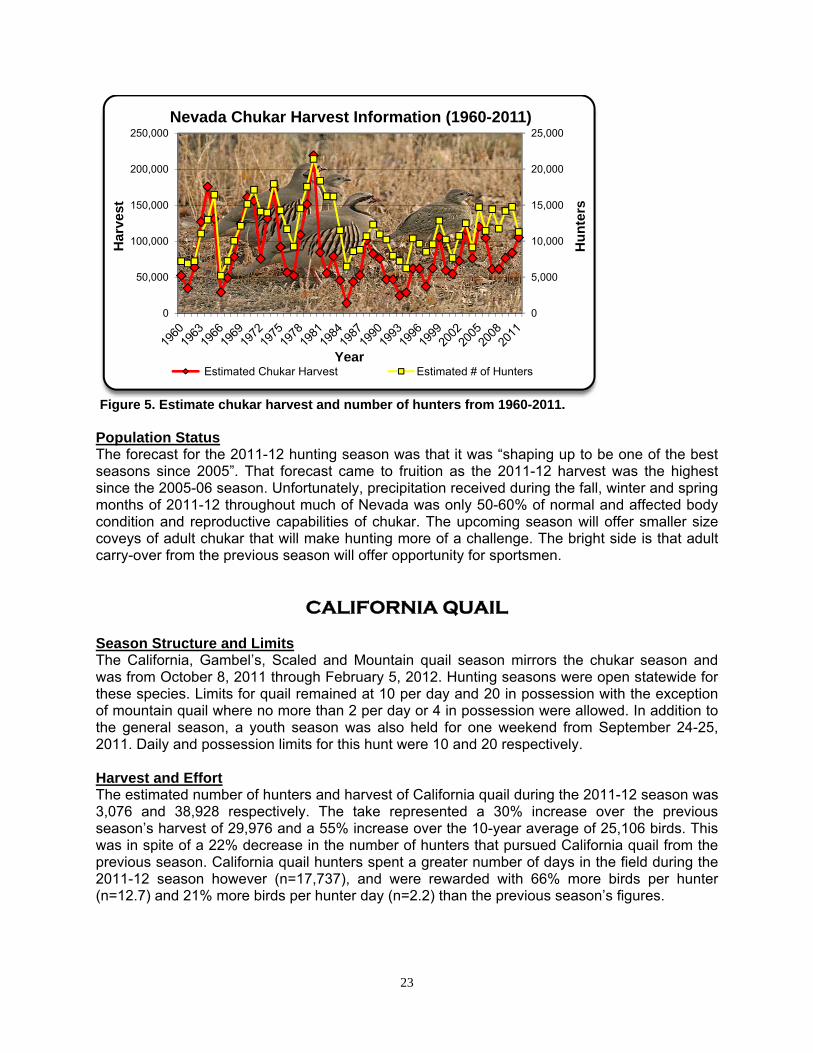
Season Structure and Limits The 2011-12 chukar season was open statewide from October 8, 2011 through February 5, 2012 with a total season length of 121 days. Daily and possession limits for chukar remained the same as the previous season at 6 and 18 respectively. Limits applied as a single species or in the aggregate with Gray (Hungarian) Partridge. In addition to the general season, a youth season was also held for one weekend from September 24-25, 2011. Daily and possession limits for the youth hunt were 6 and 12 respectively. Harvest and Effort During the 2011-12 hunting season, an estimated 11,273 chukar hunters harvested 105,047 birds. This represented a 26% increase over the previous season’s harvest (n=83,660) and a 27% increase over the 10-year average harvest of 82,569. This is in spite of a 24% decrease in the overall number of chukar hunters from the previous season and is 7% shy of the 10-year average number of hunters. The number of birds per hunter was up almost 65% from the previous season at 9.3 and almost 35% greater than the 10-year average of 6.9 birds per hunter. Birds per hunter day was estimated at 1.73, which was almost 19% better than the previous season’s reward per unit of effort of 1.46.
23
Figure 5. Estimate chukar harvest and number of hunters from 1960-2011. Population Status The forecast for the 2011-12 hunting season was that it was “shaping up to be one of the best seasons since 2005”. That forecast came to fruition as the 2011-12 harvest was the highest since the 2005-06 season. Unfortunately, precipitation received during the fall, winter and spring months of 2011-12 throughout much of Nevada was only 50-60% of normal and affected body condition and reproductive capabilities of chukar. The upcoming season will offer smaller size coveys of adult chukar that will make hunting more of a challenge. The bright side is that adult carry-over from the previous season will offer opportunity for sportsmen.
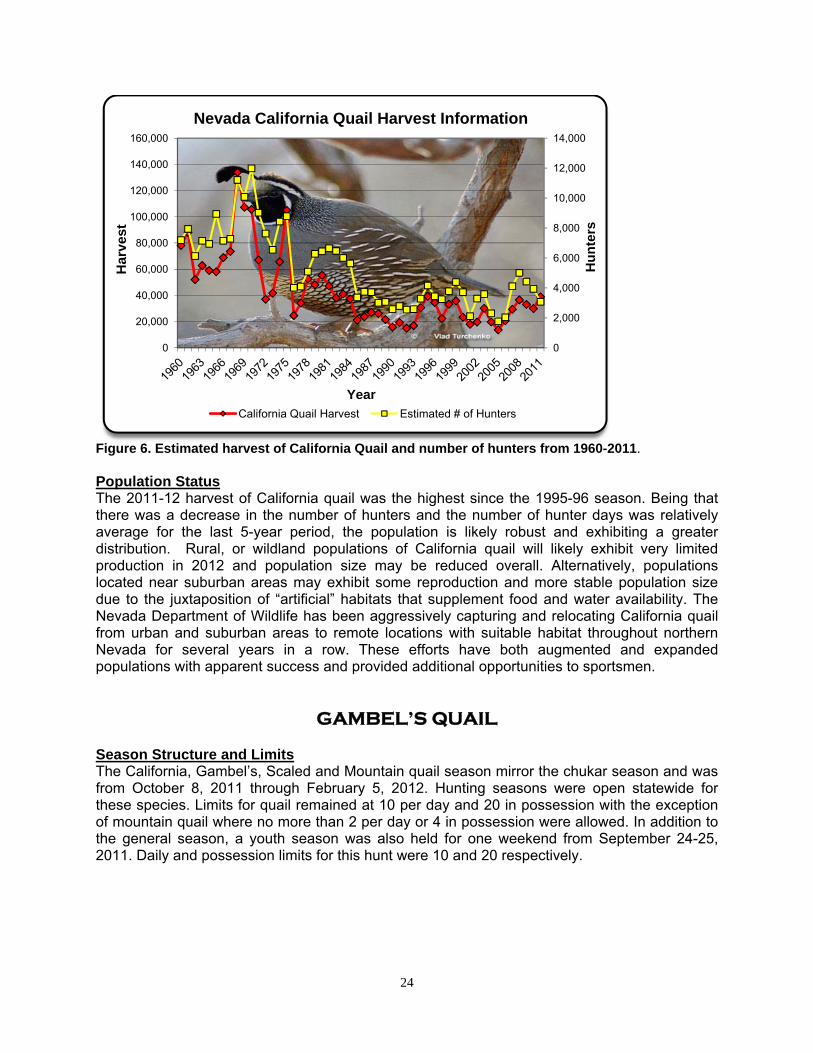
CALIFORNIA QUAIL Season Structure and Limits The California, Gambel’s, Scaled and Mountain quail season mirrors the chukar season and was from October 8, 2011 through February 5, 2012. Hunting seasons were open statewide for these species. Limits for quail remained at 10 per day and 20 in possession with the exception of mountain quail where no more than 2 per day or 4 in possession were allowed. In addition to the general season, a youth season was also held for one weekend from September 24-25, 2011. Daily and possession limits for this hunt were 10 and 20 respectively. Harvest and Effort The estimated number of hunters and harvest of California quail during the 2011-12 season was 3,076 and 38,928 respectively. The take represented a 30% increase over the previous season’s harvest of 29,976 and a 55% increase over the 10-year average of 25,106 birds. This was in spite of a 22% decrease in the number of hunters that pursued California quail from the previous season. California quail hunters spent a greater number of days in the field during the 2011-12 season however (n=17,737), and were rewarded with 66% more birds per hunter (n=12.7) and 21% more birds per hunter day (n=2.2) than the previous season’s figures.
0
5,000
10,000
15,000
20,000
25,000
0
50,000
100,000
150,000
200,000
250,000
Hu
nte
rs
Har
vest
Year
Nevada Chukar Harvest Information (1960-2011)
Estimated Chukar Harvest Estimated # of Hunters
24
Figure 6. Estimated harvest of California Quail and number of hunters from 1960-2011. Population Status The 2011-12 harvest of California quail was the highest since the 1995-96 season. Being that there was a decrease in the number of hunters and the number of hunter days was relatively average for the last 5-year period, the population is likely robust and exhibiting a greater distribution. Rural, or wildland populations of California quail will likely exhibit very limited production in 2012 and population size may be reduced overall. Alternatively, populations located near suburban areas may exhibit some reproduction and more stable population size due to the juxtaposition of “artificial” habitats that supplement food and water availability. The Nevada Department of Wildlife has been aggressively capturing and relocating California quail from urban and suburban areas to remote locations with suitable habitat throughout northern Nevada for several years in a row. These efforts have both augmented and expanded populations with apparent success and provided additional opportunities to sportsmen.
GAMBEL’S QUAIL Season Structure and Limits The California, Gambel’s, Scaled and Mountain quail season mirror the chukar season and was from October 8, 2011 through February 5, 2012. Hunting seasons were open statewide for these species. Limits for quail remained at 10 per day and 20 in possession with the exception of mountain quail where no more than 2 per day or 4 in possession were allowed. In addition to the general season, a youth season was also held for one weekend from September 24-25, 2011. Daily and possession limits for this hunt were 10 and 20 respectively.
0
2,000
4,000
6,000
8,000
10,000
12,000
14,000
0
20,000
40,000
60,000
80,000
100,000
120,000
140,000
160,000
Hu
nte
rs
Har
vest
Year
Nevada California Quail Harvest Information
California Quail Harvest Estimated # of Hunters

25
Harvest and Effort During the 2011-12 season, an estimated 1,959 hunters took 25,471 Gambel’s quail. Harvest was up 35% from the previous year; however, hunter numbers were down approximately 27% from the previous year. As with some other upland game species, the fewer hunters spent more days in the field in 2011-12 and were rewarded with increased birds per hunter (n=13.0) and birds per hunter day (n=2.2) compared to the previous year and 10-year average numbers. Last season’s harvest was approximately 51% greater than the 10-year average of 16,929 and represented the most birds harvested since the 1998-99 season. All Gambel’s quail harvest occurs within the Southern Region. Unfortunately, as is evident with California quail, the long-term hunter participation trends are declining (Figure 7).
Figure 7. Gambel’s quail harvest and hunter participation from 1976-2011. Population Status The winter of 2011-12 and subsequent spring did not provide adequate precipitation to induce favorable nesting and brood rearing conditions for Gambel’s quail. Production, in turn, was mostly poor with only a few localized areas where at least some production was noted. However, there are a few areas with relatively high densities of Gambel’s quail that are carry-over birds from 2010-2011. Densities of birds will be quite varied across the Southern Region, but the traditional areas where quail have been found should be holding moderate densities of birds. Above average precipitation during July and August of 2012 should result in favorable habitat conditions during the fall of 2012. Limited brood surveys conducted in 2012 resulted in an average of 3.8 chicks per adult compared to 7.6 chicks per adult recorded in 2011. These surveys indicate a downward trend for Gambel’s quail across the Southern Region. Poor winter precipitation followed by nearly zero precipitation during May and June likely resulted in poor nesting and brood-rearing conditions. Although dry conditions existed during the early summer, mid and late-summer moisture should provide increased forage in the form of green grasses, forbs, and insects.
0
1,000
2,000
3,000
4,000
5,000
6,000
7,000
8,000
0
20,000
40,000
60,000
80,000
100,000
120,000
140,000
Hu
nte
rs
Har
vest
Nevada Gambel's Quail Harvest Information
Gambel's Quail Harvest Estimated # of Hunters Log. (Gambel's Quail Harvest)
26
The long term average harvest of Gambel’s quail (1976-2010) is 27,725 birds. Last season’s harvest of 25,471 was just 8% less than the long-term average and represents the highest harvest since 1998. An estimated 1,959 hunters pursued Gambel’s quail in 2012 which was the fewest since 2005. It appears that Gambel’s quail populations may have reached a short-term peak and the population will decline until favorable precipitation and subsequent habitat conditions conducive to pre-laying, nesting and brood rearing are realized.
RABBIT
Season Structure and Limits The 2011-12 season for rabbit extended from October 8, 2011 through Febtruary 28, 2012. Legal rabbit species included under this season include cottontail, pygmy, and white-tailed jackrabbit. A youth rabbit season was also held for one weekend (September 24-25, 2011) prior to the normal season opener. Limits for these species remained and 10 per day and 20 in possession and could consist of a single species, or an aggregate of species not exceeding those limits. Black-tailed jackrabbits are not considered a protected species. Harvest and Effort The estimated harvest of cottontail rabbit (most commonly hunted species) was 11,149, which was down almost 6% from the previous season’s harvest of 11,805 and down by 30% from the 10-year average of 15,897. The number of rabbit hunters (n=1,920) was down almost 26% from the previous year (n=2,587) and 13% below the 10-year average. The number of rabbits per hunter (n=7.8) was up 27% from the previous season; however, the number of rabbits per hunter day (n=1.6) was down 16.4%. White-tailed jackrabbits are considered a lightly hunted species and are probably the subject of much misidentification by sportsmen, often not differentiated with black-tailed jackrabbits during much of the year and then being incorrectly labeled as “snowshoe rabbits” in the winter. During the 2011-12 hunting season, an estimated 320 white-tailed jackrabbits were harvested by 84 hunters. This represented a 34% decrease from the previous season’s harvest of 482. The majority of harvest occurred in Elko County, which very likely harbors the largest population of white-tailed jackrabbits in Nevada. Pygmy rabbits are also considered a lightly hunted species and are very secretive, often being most active during the very early morning and late evening hours. The estimated harvest of pygmy rabbits was 86, which was substantially down from last season’s harvest of 522. An estimated 61 hunters pursued the species during the 2011-12 season. The decrease in the actual number of hunters that hunted the species may have been due to the increased effort to provide photos and descriptions of Nevada’s upland game species through the online questionnaire process. In the past, it is suspected that sportsmen routinely mistook young of the year cottontails for pygmy rabbit and incorrectly recorded their harvest.
27
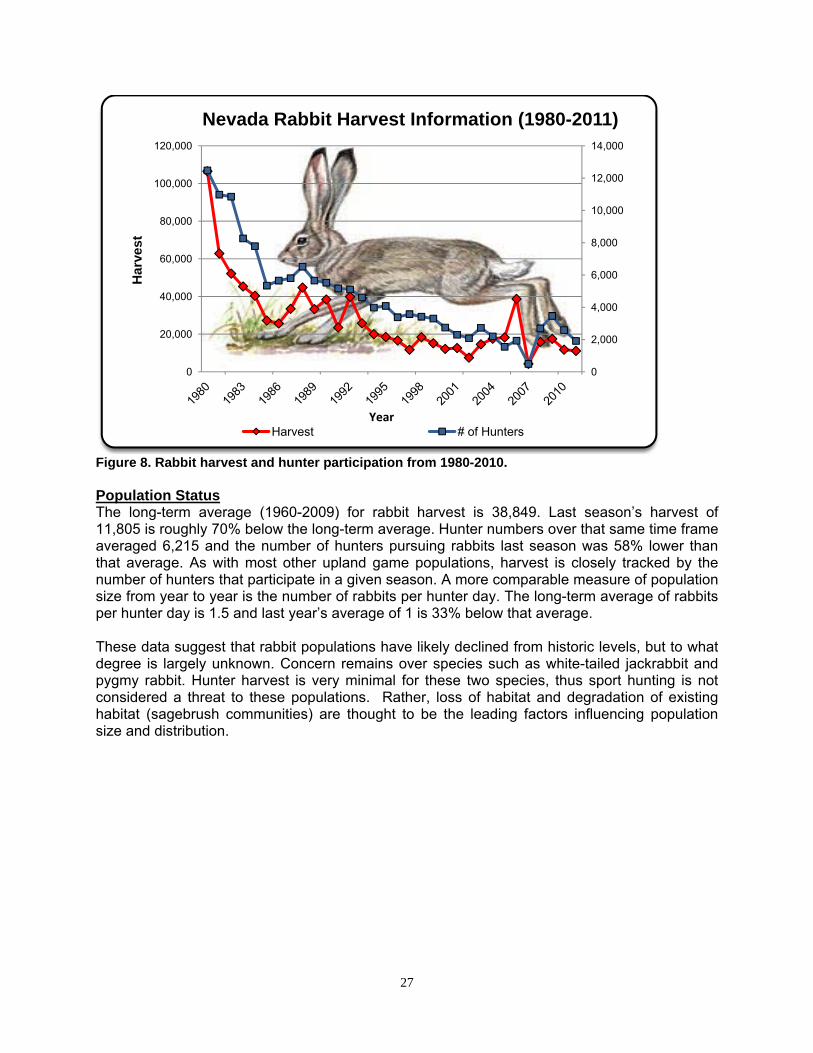
Figure 8. Rabbit harvest and hunter participation from 1980-2010. Population Status The long-term average (1960-2009) for rabbit harvest is 38,849. Last season’s harvest of 11,805 is roughly 70% below the long-term average. Hunter numbers over that same time frame averaged 6,215 and the number of hunters pursuing rabbits last season was 58% lower than that average. As with most other upland game populations, harvest is closely tracked by the number of hunters that participate in a given season. A more comparable measure of population size from year to year is the number of rabbits per hunter day. The long-term average of rabbits per hunter day is 1.5 and last year’s average of 1 is 33% below that average. These data suggest that rabbit populations have likely declined from historic levels, but to what degree is largely unknown. Concern remains over species such as white-tailed jackrabbit and pygmy rabbit. Hunter harvest is very minimal for these two species, thus sport hunting is not considered a threat to these populations. Rather, loss of habitat and degradation of existing habitat (sagebrush communities) are thought to be the leading factors influencing population size and distribution.
0
2,000
4,000
6,000
8,000
10,000
12,000
14,000
0
20,000
40,000
60,000
80,000
100,000
120,000H
arve
st
Year
Nevada Rabbit Harvest Information (1980-2011)
Harvest # of Hunters
28
STATEWIDE SUMMARY OF MIGRATORY GAME BIRDS
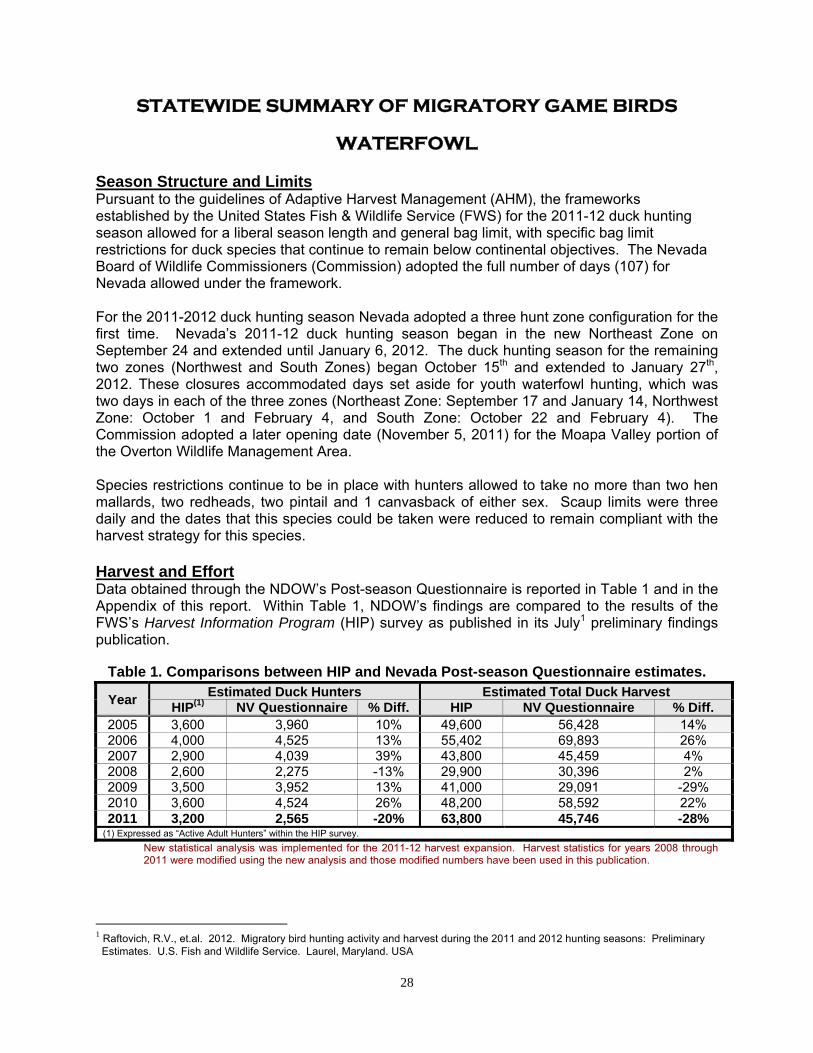
WATERFOWL Season Structure and Limits Pursuant to the guidelines of Adaptive Harvest Management (AHM), the frameworks established by the United States Fish & Wildlife Service (FWS) for the 2011-12 duck hunting season allowed for a liberal season length and general bag limit, with specific bag limit restrictions for duck species that continue to remain below continental objectives. The Nevada Board of Wildlife Commissioners (Commission) adopted the full number of days (107) for Nevada allowed under the framework. For the 2011-2012 duck hunting season Nevada adopted a three hunt zone configuration for the first time. Nevada’s 2011-12 duck hunting season began in the new Northeast Zone on September 24 and extended until January 6, 2012. The duck hunting season for the remaining two zones (Northwest and South Zones) began October 15th and extended to January 27th, 2012. These closures accommodated days set aside for youth waterfowl hunting, which was two days in each of the three zones (Northeast Zone: September 17 and January 14, Northwest Zone: October 1 and February 4, and South Zone: October 22 and February 4). The Commission adopted a later opening date (November 5, 2011) for the Moapa Valley portion of the Overton Wildlife Management Area. Species restrictions continue to be in place with hunters allowed to take no more than two hen mallards, two redheads, two pintail and 1 canvasback of either sex. Scaup limits were three daily and the dates that this species could be taken were reduced to remain compliant with the harvest strategy for this species. Harvest and Effort Data obtained through the NDOW’s Post-season Questionnaire is reported in Table 1 and in the Appendix of this report. Within Table 1, NDOW’s findings are compared to the results of the FWS’s Harvest Information Program (HIP) survey as published in its July1 preliminary findings publication.
Table 1. Comparisons between HIP and Nevada Post-season Questionnaire estimates.
New statistical analysis was implemented for the 2011-12 harvest expansion. Harvest statistics for years 2008 through 2011 were modified using the new analysis and those modified numbers have been used in this publication.
1 Raftovich, R.V., et.al. 2012. Migratory bird hunting activity and harvest during the 2011 and 2012 hunting seasons: Preliminary
Estimates. U.S. Fish and Wildlife Service. Laurel, Maryland. USA
Year Estimated Duck Hunters Estimated Total Duck Harvest
HIP(1) NV Questionnaire % Diff. HIP NV Questionnaire % Diff. 2005 3,600 3,960 10% 49,600 56,428 14% 2006 4,000 4,525 13% 55,402 69,893 26% 2007 2,900 4,039 39% 43,800 45,459 4% 2008 2,600 2,275 -13% 29,900 30,396 2% 2009 3,500 3,952 13% 41,000 29,091 -29% 2010 3,600 4,524 26% 48,200 58,592 22% 2011 3,200 2,565 -20% 63,800 45,746 -28%
(1) Expressed as “Active Adult Hunters” within the HIP survey.

29
0
2,000
4,000
6,000
8,000
10,000
12,000
14,000
16,000
18,000
20,000
0
20,000
40,000
60,000
80,000
100,000
120,000
140,000
160,000
180,000
200,000
1952
1954
1956
1958
1960
1962
1964
1966
1968
1970
1972
1974
1976
1978
1980
1982
1984
1986
1988
1990
1992
1994
1996
1998
2000
2002
2004
2006
2008
2010
Hu
nters
Du
ck H
arve
st
Figure 1. Nevada Duck Hunting Statistics 1952-2011Source: Nevada Post-season Questionnaire
Harvest Hunters
DUCKS AND MERGANSERS The general limit was seven ducks per day with the species restrictions previously described. Table 2 describes harvest and effort statistics compiled through Nevada’s post-season questionnaire.
Table 2. Statewide duck & merganser harvest - from post-season questionnaire. STATEWIDE TOTALS: Percent Change
2011 2010 10-Yr Avg. Prev. yr. vs. Avg. No. of Ducks & Mergs. 45,746 58,592 44,567 -21.9% 2.6% No. of Hunters* 3,750 6,525 4,501 -42.5% -16.7% No. of Days 20,204 31,566 24,044 -36.0% -16.0% Birds / Hunter 12.2 8.98 9.78 35.9% 24.7% Birds/Hunter Day 2.3 1.86 1.83 23.7% 23.8% Individual Hunters* 2,565 4,524 -- -43.3% -- * see explanation below
In the table above, the “number of hunters” (second row) represents the sum of all hunters hunting in all counties. The totals at the bottom of the columns for 2010 & 2011 represents the estimated total of all individual hunters, based upon the reported sales of electronic duck stamp privileges and a proportion of all paper duck stamps sold. Figure 1 below describes the trends for duck harvest and hunter numbers in Nevada based upon NDOW’s post-season questionnaire data. The decline in harvest numbers during the mid-1980’s correlates with declines in continental breeding habitat. Similar habitat trends affected Nevada, though the state did have some years with good precipitation in the late 1980’s. However, without the migration from northerly breeding grounds, hunters had lots of water to set up a blind, but not much to shoot at. Since 1990, Nevada has seen a few peaks in harvest and hunter participation. Peaks are principally attributed to short term precipitation-driven habitat reprieves but again Nevada’s habitat is not linked to continental duck numbers.
30
GEESE For the 2011-2012 goose hunting season Nevada adopted a three hunt zone configuration for the first time. The 2011-12 goose hunting season the Northeast zone for both dark and white geese (snow and Ross’ geese) began on September 24, 2011 and extended until January 6, 2012. The dark and white goose seasons for both the Northwest and South zones began on October 15, 2011 and extended to January 27, 2012. These closures accommodated days set aside for youth waterfowl hunting, which was two days in each of the three zones (Northeast Zone: September 17 and January 14, Northwest Zone: October 1 and February 4, and South Zone: October 22 and February 4). The Commission adopted a later opening date (November 5, 2011) for the Moapa Valley portion of the Overton Wildlife Management Area. Limits for the Canada and white-fronted geese were three daily, species singly or in the aggregate and Limits for white geese were ten daily.
Table 3. Statewide dark and white goose harvest - from Post-season Questionnaire. STATEWIDE TOTALS: Percent Change
2011 2010 10 Yr. Avg. Prev. Yr. vs. Avg. Dark Geese Harvest 2,641 5,936 5,058 -55.5% -47.8% No. of Hunters 1,124 2,353 1,853 -52.3% -39.4% Light Geese Harvest 359 1,275 644 -71.8% -44.2% No. of Hunters 254 841 857 -69.8% -70.4% TOTAL GEESE: 3,000 7,211 5,702 -58.4% -47.4%
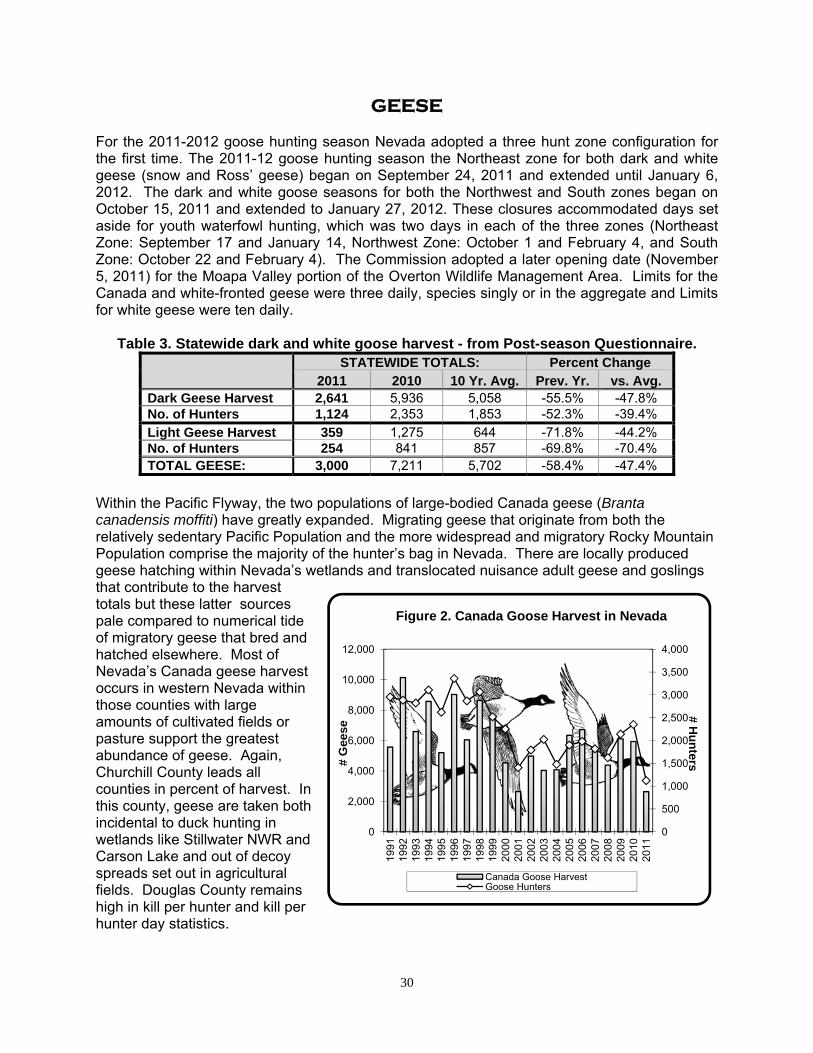
Within the Pacific Flyway, the two populations of large-bodied Canada geese (Branta canadensis moffiti) have greatly expanded. Migrating geese that originate from both the relatively sedentary Pacific Population and the more widespread and migratory Rocky Mountain Population comprise the majority of the hunter’s bag in Nevada. There are locally produced geese hatching within Nevada’s wetlands and translocated nuisance adult geese and goslings that contribute to the harvest totals but these latter sources pale compared to numerical tide of migratory geese that bred and hatched elsewhere. Most of Nevada’s Canada geese harvest occurs in western Nevada within those counties with large amounts of cultivated fields or pasture support the greatest abundance of geese. Again, Churchill County leads all counties in percent of harvest. In this county, geese are taken both incidental to duck hunting in wetlands like Stillwater NWR and Carson Lake and out of decoy spreads set out in agricultural fields. Douglas County remains high in kill per hunter and kill per hunter day statistics.
0
500
1,000
1,500
2,000
2,500
3,000
3,500
4,000
0
2,000
4,000
6,000
8,000
10,000
12,000
1991
1992
1993
1994
1995
1996
1997
1998
1999
2000
2001
2002
2003
2004
2005
2006
2007
2008
2009
2010
2011
# Hu
nters#
Gee
se
Figure 2. Canada Goose Harvest in Nevada
Canada Goose HarvestGoose Hunters

31
TUNDRA SWAN The Nevada tundra swan season commenced on October 15, 2011 and concluded on January 8, 2012. Permits were available during an initial draw period, which had an application deadline of September 16, 2011. Only 171 applications for the 650 permits (26%) were posted for the initial draw. Remaining permits were available online, over the counter or through the mail after October 3rd through the last Friday of the hunting season. An additional 356 permits were sold after the initial draw bringing the total permit sales to 527. This total included 98 second permits, thus there were 429 individual permitees last year. Total sales for the 2010-11 season were slightly higher (8.6%) than the previous year. Continuing a flyway commitment to detect trumpeter swan harvest, NDOW required all successful hunters to have their swan and permit validated within five days of the harvest date. Agency personnel inspected swans at specific NDOW offices where they could examine the birds’ bills and feather coloration. This scrutiny is necessary to detect occurrence of trumpeter swans. In this manner, incidental take can be documented and its impact to the latter species can be assessed. Table 4. Past ten years of Nevada swan harvest.
Year Tags / Permits Percent Reported Expanded
Purchased Participating Harvest Hunter Days
2002 273 69% 40 886 2003 298 74% 71 802 2004 330 67% 77 892 2005 370 73% 92 934 2006 605 73% 147 2,014 2007 650 77% 200 1,996 2008 535 75% 124 1,597 2009 472 60% 56 1,424 2010 469 75% 118 1,831 2011 527 76% 145 2,061
’01-’09 Avg. 453 72% 107 1,444
For the 2011-12 season, juvenile swans made up 24% of the total swan harvest (n=35), a figure that is below the long-term average of 36%. Seventy-six percent of permitees hunted last year, matching long-term average. Hunters reported taking 75% of swans at Stillwater NWR, lower than the LTA of 61%. Four trumpeter swans were taken in the 2011-12 season, a number that is double the total Trumpeter swan take since 1995. The increase in Trumpeter swan harvest is likely a result of a long-term increase in the continental population and expansion of that species. Nonresidents accounted for 2% of all individual swan permitees last year. Thirty-eight percent of those were California residents. Population Status Each year the U.S. Fish and Wildlife Service (FWS) conducts a continental assessment of the status of waterfowl2. The FWS follows established survey protocols to evaluate bird abundance and habitat conditions within traditional survey areas in the central and northwest portions of North America, known as the Prairie Pothole Region and the Canadian Parkland Region, and in
2 U. S. Fish and Wildlife Service. 2012. Waterfowl population status, 2012. U.S Dept. of the Interior, Washington, D.C. USA. 79pp.

32
Northwest Canada and Alaska. Service statisticians then incorporate these data into annual or multi-year population models. Biologists estimated this spring’s breeding duck population (BPOP) within the traditional survey area at 45.6 million birds (Figure 3). This total represents an increase (11%) compared to the 2010 estimate and is a 35% increase over the long term average. Nevada Breeding pair population estimates for 2011were 11,718 birds. This number is down significantly from last year’s estimate of 68,900 birds. It is likely that the 2011 count is down because of cold weather well into spring that may have delayed breeding.
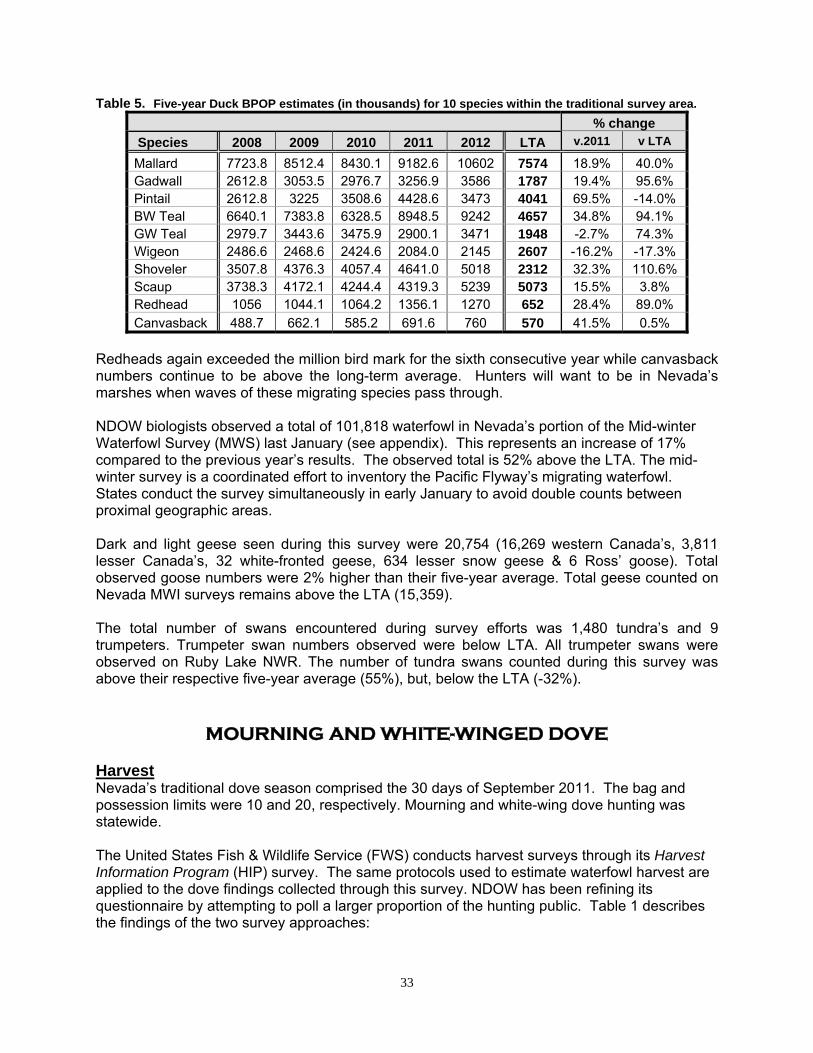
For the traditional survey area, most species showed good increases in estimated numbers compared to the previous year, and, most are still above the long term average (Table 5). Most impressive to managers was the continued increase in pintails, a species which is heavily dependent upon prairie potholes.
20.0
25.0
30.0
35.0
40.0
45.0
50.0
1955
1957
1959
1961
1963
1965
1967
1969
1971
1973
1975
1977
1979
1981
1983
1985
1987
1989
1991
1993
1995
1997
1999
2001
2003
2005
2007
2009
2011
Mill
ion
s
Figure 3. Total breeding duck estimates for the traditional survey area.
33
Table 5. Five-year Duck BPOP estimates (in thousands) for 10 species within the traditional survey area. % change
Species 2008 2009 2010 2011 2012 LTA v.2011 v LTA
Mallard 7723.8 8512.4 8430.1 9182.6 10602 7574 18.9% 40.0% Gadwall 2612.8 3053.5 2976.7 3256.9 3586 1787 19.4% 95.6% Pintail 2612.8 3225 3508.6 4428.6 3473 4041 69.5% -14.0% BW Teal 6640.1 7383.8 6328.5 8948.5 9242 4657 34.8% 94.1% GW Teal 2979.7 3443.6 3475.9 2900.1 3471 1948 -2.7% 74.3% Wigeon 2486.6 2468.6 2424.6 2084.0 2145 2607 -16.2% -17.3% Shoveler 3507.8 4376.3 4057.4 4641.0 5018 2312 32.3% 110.6% Scaup 3738.3 4172.1 4244.4 4319.3 5239 5073 15.5% 3.8% Redhead 1056 1044.1 1064.2 1356.1 1270 652 28.4% 89.0% Canvasback 488.7 662.1 585.2 691.6 760 570 41.5% 0.5%
Redheads again exceeded the million bird mark for the sixth consecutive year while canvasback numbers continue to be above the long-term average. Hunters will want to be in Nevada’s marshes when waves of these migrating species pass through. NDOW biologists observed a total of 101,818 waterfowl in Nevada’s portion of the Mid-winter Waterfowl Survey (MWS) last January (see appendix). This represents an increase of 17% compared to the previous year’s results. The observed total is 52% above the LTA. The mid-winter survey is a coordinated effort to inventory the Pacific Flyway’s migrating waterfowl. States conduct the survey simultaneously in early January to avoid double counts between proximal geographic areas. Dark and light geese seen during this survey were 20,754 (16,269 western Canada’s, 3,811 lesser Canada’s, 32 white-fronted geese, 634 lesser snow geese & 6 Ross’ goose). Total observed goose numbers were 2% higher than their five-year average. Total geese counted on Nevada MWI surveys remains above the LTA (15,359). The total number of swans encountered during survey efforts was 1,480 tundra’s and 9 trumpeters. Trumpeter swan numbers observed were below LTA. All trumpeter swans were observed on Ruby Lake NWR. The number of tundra swans counted during this survey was above their respective five-year average (55%), but, below the LTA (-32%).
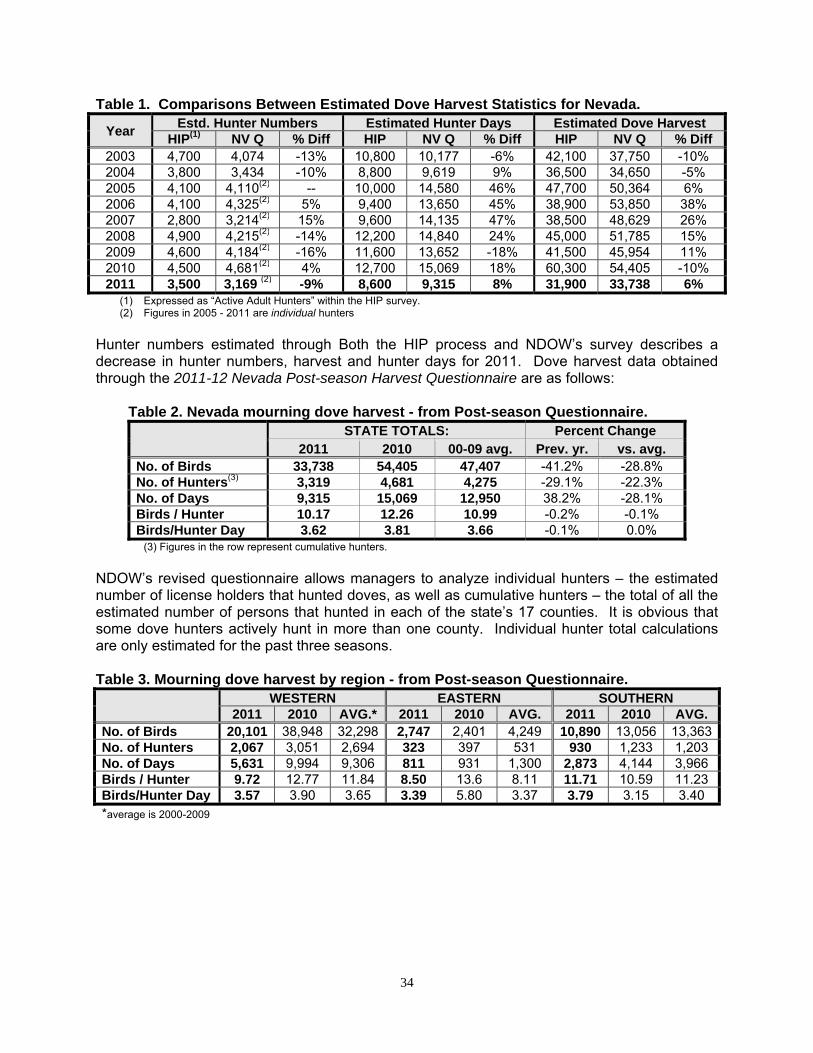
MOURNING AND WHITE-WINGED DOVE Harvest Nevada’s traditional dove season comprised the 30 days of September 2011. The bag and possession limits were 10 and 20, respectively. Mourning and white-wing dove hunting was statewide. The United States Fish & Wildlife Service (FWS) conducts harvest surveys through its Harvest Information Program (HIP) survey. The same protocols used to estimate waterfowl harvest are applied to the dove findings collected through this survey. NDOW has been refining its questionnaire by attempting to poll a larger proportion of the hunting public. Table 1 describes the findings of the two survey approaches:
34
Table 1. Comparisons Between Estimated Dove Harvest Statistics for Nevada.
Year Estd. Hunter Numbers Estimated Hunter Days Estimated Dove Harvest
HIP(1) NV Q % Diff HIP NV Q % Diff HIP NV Q % Diff 2003 4,700 4,074 -13% 10,800 10,177 -6% 42,100 37,750 -10% 2004 3,800 3,434 -10% 8,800 9,619 9% 36,500 34,650 -5% 2005 4,100 4,110(2) -- 10,000 14,580 46% 47,700 50,364 6% 2006 4,100 4,325(2) 5% 9,400 13,650 45% 38,900 53,850 38% 2007 2,800 3,214(2) 15% 9,600 14,135 47% 38,500 48,629 26% 2008 4,900 4,215(2) -14% 12,200 14,840 24% 45,000 51,785 15% 2009 4,600 4,184(2) -16% 11,600 13,652 -18% 41,500 45,954 11% 2010 4,500 4,681(2) 4% 12,700 15,069 18% 60,300 54,405 -10% 2011 3,500 3,169 (2) -9% 8,600 9,315 8% 31,900 33,738 6%
(1) Expressed as “Active Adult Hunters” within the HIP survey. (2) Figures in 2005 - 2011 are individual hunters
Hunter numbers estimated through Both the HIP process and NDOW’s survey describes a decrease in hunter numbers, harvest and hunter days for 2011. Dove harvest data obtained through the 2011-12 Nevada Post-season Harvest Questionnaire are as follows: Table 2. Nevada mourning dove harvest - from Post-season Questionnaire.
STATE TOTALS: Percent Change
2011 2010 00-09 avg. Prev. yr. vs. avg. No. of Birds 33,738 54,405 47,407 -41.2% -28.8% No. of Hunters(3) 3,319 4,681 4,275 -29.1% -22.3% No. of Days 9,315 15,069 12,950 38.2% -28.1% Birds / Hunter 10.17 12.26 10.99 -0.2% -0.1% Birds/Hunter Day 3.62 3.81 3.66 -0.1% 0.0%
(3) Figures in the row represent cumulative hunters. NDOW’s revised questionnaire allows managers to analyze individual hunters – the estimated number of license holders that hunted doves, as well as cumulative hunters – the total of all the estimated number of persons that hunted in each of the state’s 17 counties. It is obvious that some dove hunters actively hunt in more than one county. Individual hunter total calculations are only estimated for the past three seasons.
Table 3. Mourning dove harvest by region - from Post-season Questionnaire. WESTERN EASTERN SOUTHERN
2011 2010 AVG.* 2011 2010 AVG. 2011 2010 AVG. No. of Birds 20,101 38,948 32,298 2,747 2,401 4,249 10,890 13,056 13,363No. of Hunters 2,067 3,051 2,694 323 397 531 930 1,233 1,203 No. of Days 5,631 9,994 9,306 811 931 1,300 2,873 4,144 3,966 Birds / Hunter 9.72 12.77 11.84 8.50 13.6 8.11 11.71 10.59 11.23 Birds/Hunter Day 3.57 3.90 3.65 3.39 5.80 3.37 3.79 3.15 3.40 *average is 2000-2009
35
White-winged Dove – This year 873 individual questionnaire respondents indicated that they hunted migratory game birds other than waterfowl during the 2010-11 hunting season. Of these, 34 indicated that they hunted white-winged dove in the state during the 2011 hunting season. This data was sufficient to perform an extrapolation of harvest. Those harvest figures are depicted on page Q-6. NDOW cannot do any comparisons between years because the white-winged dove data has been very sporadic. Suffice it to say that this species is not abundant in Nevada and will continue to be somewhat of a novelty among southern Nevada hunters. Eurasian Collared Dove – NDOW began asking questionnaire recipients to indicate whether or not they shot Eurasian Collared Doves (ECD) in 2007-08. The ECD is a bird that is expanding its distribution and abundance throughout the nation and in Nevada. Seven hundred thirty individual questionnaire respondents indicated ECD harvest in all of Nevada’s 17 counties. Those numbers are up from 309 hunters harvesting in all counties in 2010. The data supports an estimated statewide harvest of 5,769 in 2011, compared to 2,404 ECD in 2010 and 3,938 in 2009. The species is unprotected and the questionnaire did not ask which month the birds were shot in. However, it is suspected that most were taken incidental to mourning dove hunting. Managers continue to attempt to gain an understanding of the bird’s ecological role.
0
2,000
4,000
6,000
8,000
10,000
12,000
14,000
0
20,000
40,000
60,000
80,000
100,000
120,000
140,000
160,000
180,000
1960
1962
1964
1966
1968
1970
1972
1974
1976
1978
1980
1982
1984
1986
1988
1990
1992
1994
1996
1998
2000
2002
2004
2006
2008
2010
Hu
nte
rs
Har
vest
Figure 1. Nevada dove harvest & hunter data.
Dove Harvest Dove Hunters
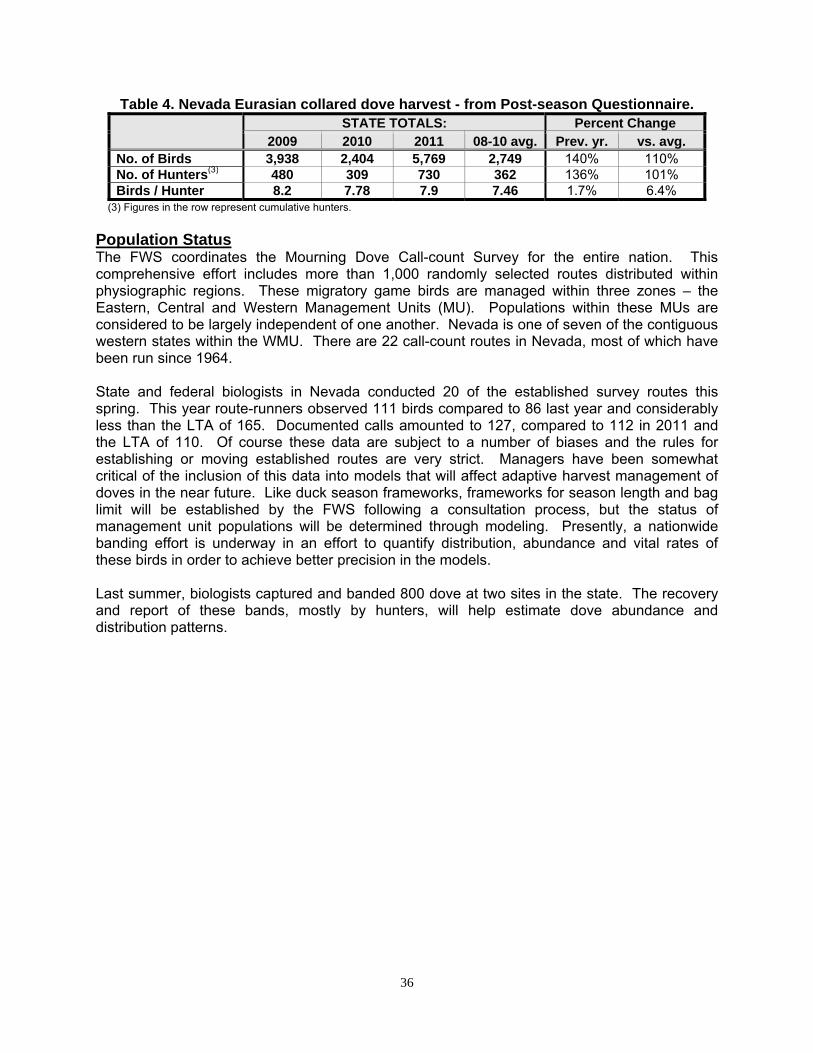
36
Table 4. Nevada Eurasian collared dove harvest - from Post-season Questionnaire.
STATE TOTALS: Percent Change
2009 2010 2011 08-10 avg. Prev. yr. vs. avg. No. of Birds 3,938 2,404 5,769 2,749 140% 110% No. of Hunters(3) 480 309 730 362 136% 101% Birds / Hunter 8.2 7.78 7.9 7.46 1.7% 6.4%
(3) Figures in the row represent cumulative hunters. Population Status The FWS coordinates the Mourning Dove Call-count Survey for the entire nation. This comprehensive effort includes more than 1,000 randomly selected routes distributed within physiographic regions. These migratory game birds are managed within three zones – the Eastern, Central and Western Management Units (MU). Populations within these MUs are considered to be largely independent of one another. Nevada is one of seven of the contiguous western states within the WMU. There are 22 call-count routes in Nevada, most of which have been run since 1964. State and federal biologists in Nevada conducted 20 of the established survey routes this spring. This year route-runners observed 111 birds compared to 86 last year and considerably less than the LTA of 165. Documented calls amounted to 127, compared to 112 in 2011 and the LTA of 110. Of course these data are subject to a number of biases and the rules for establishing or moving established routes are very strict. Managers have been somewhat critical of the inclusion of this data into models that will affect adaptive harvest management of doves in the near future. Like duck season frameworks, frameworks for season length and bag limit will be established by the FWS following a consultation process, but the status of management unit populations will be determined through modeling. Presently, a nationwide banding effort is underway in an effort to quantify distribution, abundance and vital rates of these birds in order to achieve better precision in the models. Last summer, biologists captured and banded 800 dove at two sites in the state. The recovery and report of these bands, mostly by hunters, will help estimate dove abundance and distribution patterns.
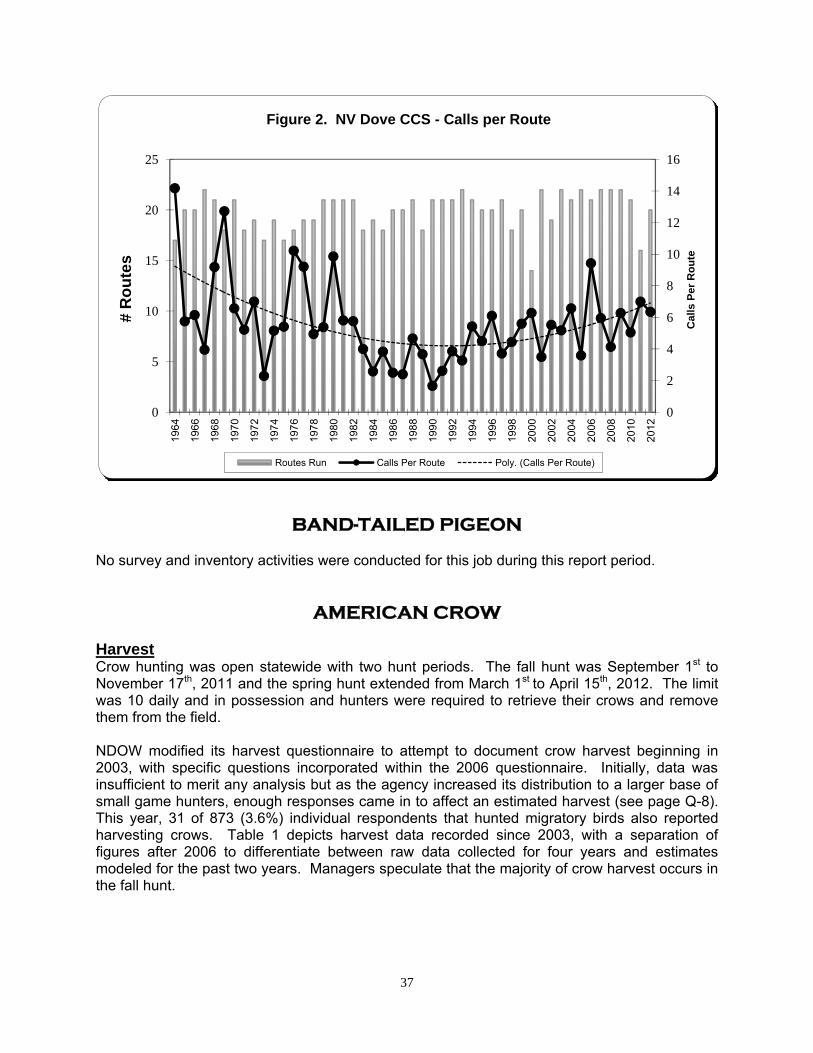
37
BAND-TAILED PIGEON No survey and inventory activities were conducted for this job during this report period.
AMERICAN CROW Harvest Crow hunting was open statewide with two hunt periods. The fall hunt was September 1st to November 17th, 2011 and the spring hunt extended from March 1st to April 15th, 2012. The limit was 10 daily and in possession and hunters were required to retrieve their crows and remove them from the field. NDOW modified its harvest questionnaire to attempt to document crow harvest beginning in 2003, with specific questions incorporated within the 2006 questionnaire. Initially, data was insufficient to merit any analysis but as the agency increased its distribution to a larger base of small game hunters, enough responses came in to affect an estimated harvest (see page Q-8). This year, 31 of 873 (3.6%) individual respondents that hunted migratory birds also reported harvesting crows. Table 1 depicts harvest data recorded since 2003, with a separation of figures after 2006 to differentiate between raw data collected for four years and estimates modeled for the past two years. Managers speculate that the majority of crow harvest occurs in the fall hunt.
0
2
4
6
8
10
12
14
16
0
5
10
15
20
2519
64
1966
1968
1970
1972
1974
1976
1978
1980
1982
1984
1986
1988
1990
1992
1994
1996
1998
2000
2002
2004
2006
2008
2010
2012
Cal
ls P
er R
ou
te
# R
ou
tes
Figure 2. NV Dove CCS - Calls per Route
Routes Run Calls Per Route Poly. (Calls Per Route)

38
Table 1. – Reported American crow harvest in Nevada. CC CH DO HU LY MN PE ST WA EL EU LA WP CL ES LN NY
2003 4 5 5 -- -- -- -- -- -- 2 17 -- -- 1 -- 1 --
2004 -- 6 2 36 124 -- 4 -- -- -- 32 13 -- 42 -- -- 18
2005 3 1 -- 4 49 41 2 -- 1 54 1 51 5 -- -- 2 10
2006 -- 0 -- 9 3 3 15 -- 1 16 -- 11 -- -- 6 16 1
2007 -- 262 363 68 233 2 77 -- 198 72 -- -- -- 363 0 98 30
2008 -- 93 -- 42 291 19 -- 32 16 19 -- 109 32 80 -- 67 --
2009 -- 136 50 311 91 5 50 -- 10 69 17 31 7 165 -- -- 53
2010 -- 21 -- 82 36 23 -- -- 75 40 -- 55 47 49 1 15 8
2011 -- 9 9 88 4 -- 4 -- -- 494 13 -- 62 119 -- -- --
Since the sample size is still relatively small, some variation in data can be quite significant between years. The 2011-12 harvest estimates are based upon data provided by information provided by a total of 31questionnaire respondents. Last year, there were 75 respondents that indicated they hunted crows. Only a greater distribution of questionnaires among theoretical small game hunters, in other words a higher sampling rate, will achieve more statistically reliable estimates. Population Status Crows are not classified as migratory game birds under federal rule thus the FWS does not regulate the take of American Crows. Accordingly, there are no coordinated efforts within the flyways to determine their population status. NDOW does not conduct any population analysis other than an analysis of harvest data. The species is ubiquitous and since it is lightly hunted within a broad statewide distribution, managers feel that the harvest data is not indicative of crow population trends. The extent of the effects of West Nile Virus is not known, although it is recognized that corvids are particularly susceptible to the disease.
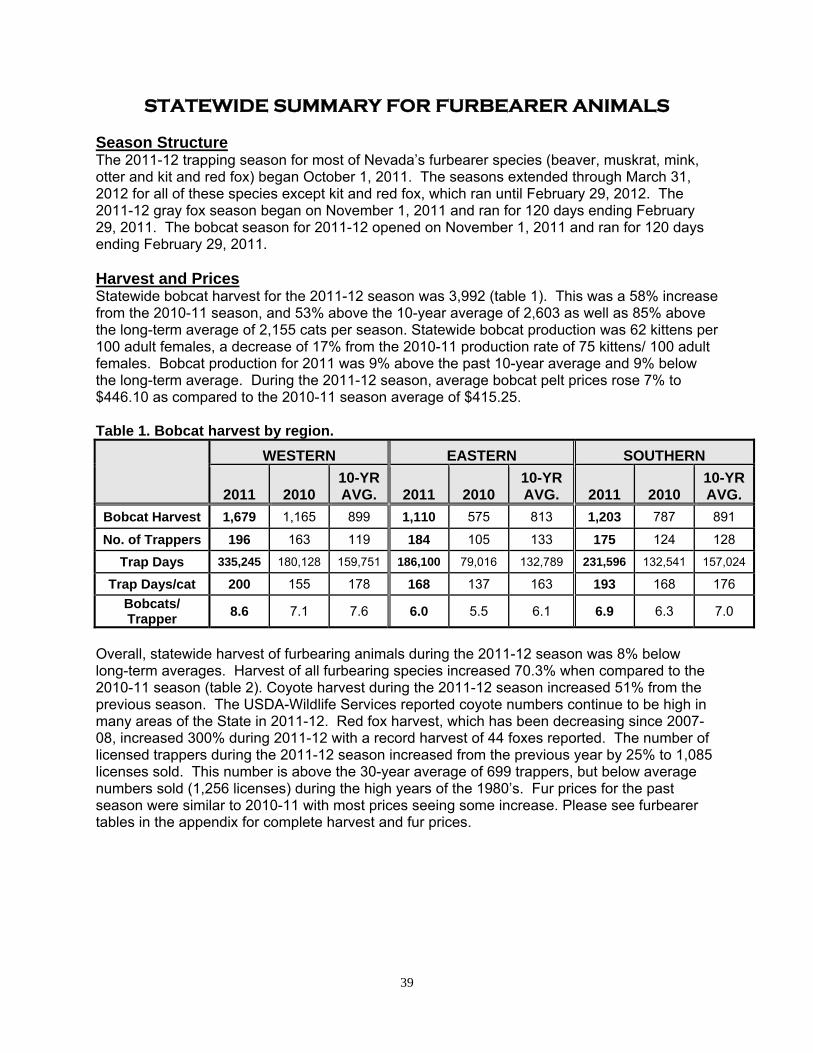
39
STATEWIDE SUMMARY FOR FURBEARER ANIMALS Season Structure The 2011-12 trapping season for most of Nevada’s furbearer species (beaver, muskrat, mink, otter and kit and red fox) began October 1, 2011. The seasons extended through March 31, 2012 for all of these species except kit and red fox, which ran until February 29, 2012. The 2011-12 gray fox season began on November 1, 2011 and ran for 120 days ending February 29, 2011. The bobcat season for 2011-12 opened on November 1, 2011 and ran for 120 days ending February 29, 2011. Harvest and Prices Statewide bobcat harvest for the 2011-12 season was 3,992 (table 1). This was a 58% increase from the 2010-11 season, and 53% above the 10-year average of 2,603 as well as 85% above the long-term average of 2,155 cats per season. Statewide bobcat production was 62 kittens per 100 adult females, a decrease of 17% from the 2010-11 production rate of 75 kittens/ 100 adult females. Bobcat production for 2011 was 9% above the past 10-year average and 9% below the long-term average. During the 2011-12 season, average bobcat pelt prices rose 7% to $446.10 as compared to the 2010-11 season average of $415.25. Table 1. Bobcat harvest by region. WESTERN EASTERN SOUTHERN
2011 2010 10-YR AVG. 2011 2010
10-YR AVG. 2011 2010
10-YR AVG.
Bobcat Harvest 1,679 1,165 899 1,110 575 813 1,203 787 891
No. of Trappers 196 163 119 184 105 133 175 124 128
Trap Days 335,245 180,128 159,751 186,100 79,016 132,789 231,596 132,541 157,024
Trap Days/cat 200 155 178 168 137 163 193 168 176 Bobcats/ Trapper
8.6 7.1 7.6 6.0 5.5 6.1 6.9 6.3 7.0
Overall, statewide harvest of furbearing animals during the 2011-12 season was 8% below long-term averages. Harvest of all furbearing species increased 70.3% when compared to the 2010-11 season (table 2). Coyote harvest during the 2011-12 season increased 51% from the previous season. The USDA-Wildlife Services reported coyote numbers continue to be high in many areas of the State in 2011-12. Red fox harvest, which has been decreasing since 2007-08, increased 300% during 2011-12 with a record harvest of 44 foxes reported. The number of licensed trappers during the 2011-12 season increased from the previous year by 25% to 1,085 licenses sold. This number is above the 30-year average of 699 trappers, but below average numbers sold (1,256 licenses) during the high years of the 1980’s. Fur prices for the past season were similar to 2010-11 with most prices seeing some increase. Please see furbearer tables in the appendix for complete harvest and fur prices.

40
Table 2. Selected Furbearer Harvest Synopsis by Region. Population estimates for some of the furbearer species harvested in Nevada were generated by utilizing USGS GAP analysis data. GAP data uses maps that delineate topographical, biological and geological features to identify various habitats. GAP data for each species is paired with habitat suitability models that specify known habitat requirements. This process provided the Department with maps indicating available statewide habitat for each of the species. The GAP data was then used in conjunction with biological density and home range data for each species to generate population estimates. Density and home range data were derived from research data either in Nevada, or in the absence of Nevada research, from nearby states (Utah and California) with similar habitat types. Those estimates and estimated harvest rates based on expanded trapper harvest data appear in Table 3.
Species: 20011-12 2010-11 10 yr
Average Percent Change
Prev. Year 10 Year Avg.
Statewide Coyote 3,236 2,147 2,337 51% 39%
Gray Fox 1,760 715 1,062 146% 66% Kit Fox 963 619 497 56% 94% Beaver 879 515 603 71% 46% Muskrat 4,047 2,140 1,810 89% 124%
Mink 116 125 68 -7.2% 71% Eastern Region
Coyote 764 682 773 12% -1% Gray Fox 111 96 97 16% 14% Kit Fox 54 12 25 350% 116% Beaver 538 279 210 93% 156% Muskrat 335 168 71 99% 372%
Mink 72 64 23 13% 213% Western Region
Coyote 1,310 966 981 36% 34% Gray Fox 603 173 210 249% 187% Kit Fox 446 312 254 43% 76% Beaver 308 232 375 33% -18% Muskrat 3,709 1,972 1,725 88% 115%
Mink 44 61 45 -28% -2% Southern Region
Coyote 781 499 544 57% 44% Gray Fox 1,027 446 754 130% 36% Kit Fox 418 295 213 42% 96% Beaver 4 4 15 0% 73% Muskrat 0 0 13 0% 100%
Mink 0 0 0 0% 0%

41
Table 3. Estimated Population and Rate of Harvest. Median Population 2011-12 Rate of
Species Estimate Harvest HarvestBeaver 71,000 879 1.24%Bobcat 27,000 3,992 14.79%Gray Fox 88,500 1,760 1.99%Kit Fox 83,000 963 1.16%
Furbearer harvest data are obtained each year by summarizing and expanding postseason questionnaire information obtained from licensed trappers. The Department sends trappers a logbook at the beginning of each season to facilitate their documentation of trapping effort. These data have been comparable for decades. Additionally, the Department obtains bobcat harvest data and trapper effort through a mandatory check-in process. Trappers are required to retain and remit a portion of the lower jaw preserving one or more canine teeth. Biologists can later extract the canines and determine the age classification of the animal, adult or juvenile, based upon tooth characteristics. Various data from harvest and age characteristics of harvested bobcats are used to assess population status and trends.
42
REGIONAL GAME DIVISION STAFF
Western Region Mike Dobel, Supervising Biologist
Biologists: Chris Hampson, Reno
Rodney Johnson, Lovelock Carl Lackey, Gardnerville
Kyle Neill, Fallon Ed Partee, Winnemucca Jason Salisbury, Fallon
Eastern Region
Ken Gray, Supervising Biologist
Biologists: Curt Baughman, Ely Matt Jeffress, Elko Kari Huebner, Elko
Mike Podborny, Eureka Jeremy Lutz, Battle Mountain
Caleb McAdoo, Elko Kody Menghini, Elko Scott Roberts, Elko
Southern Region
Steve Kimble, Supervising Biologist
Biologists: Pat Cummings, Las Vegas
Angelique Curtis, Las Vegas Tom Donham, Tonopah
Mike Scott, Panaca


43
REGIONAL SPECIES SUMMARIES
GREATER SAGE-GROUSE
WESTERN REGION Harvest Sage-grouse harvest data for the Western Region showed a decline in both the number of birds harvested and the number of hunters participating in last year’s hunt. Despite the decrease in harvest from last season, the numbers are still above the 10-year average. Conversely, the number of hunters dropped 21% from the 10-year average. Table 1 describes the combined hunting season results of the open counties within the Western Region.
Table 1. WESTERN REGION SAGE GROUSE HARVEST Post-season Questionnaire Data
REGIONAL TOTALS Percent Change 2010 2011 10-Yr Avg. Prev. yr. vs. Avg.
No. of Birds 3,071 2,680 2,285 -13% 17% No. of Hunters 1,704 937 1,185 -45% -21% No. of Days 3,336 2,740 2,434 -18% 13% Birds / Hunter 1.80 2.86 2.0 59% 45% Birds/Hunter Day 0.9 1.0 1.0 6% 2%
Population Status and Productivity Potential Department biologists continue to monitor sage-grouse population trends throughout the region. Sage-grouse production is measured by juvenile per hen ratios and is acquired from hunter harvested wings. Production values for the region show a slight decline from the previous year. This is an indication that there may be fewer birds available for harvest during the fall of 2012.
Fall Prediction Early brood counts in Humboldt County indicate that some areas have had fair production while brood surveys in other counties further to the south indicate very poor production values. Current range conditions throughout the region are extremely dry with an unusual lack of free water. During the summer of 2012, one of the region’s most densely population sage-grouse areas, the Lone Willow Population Management Unit, was affected by a wild land fire which burned approximately 56% of the higher quality sage grouse habitat within the unit.
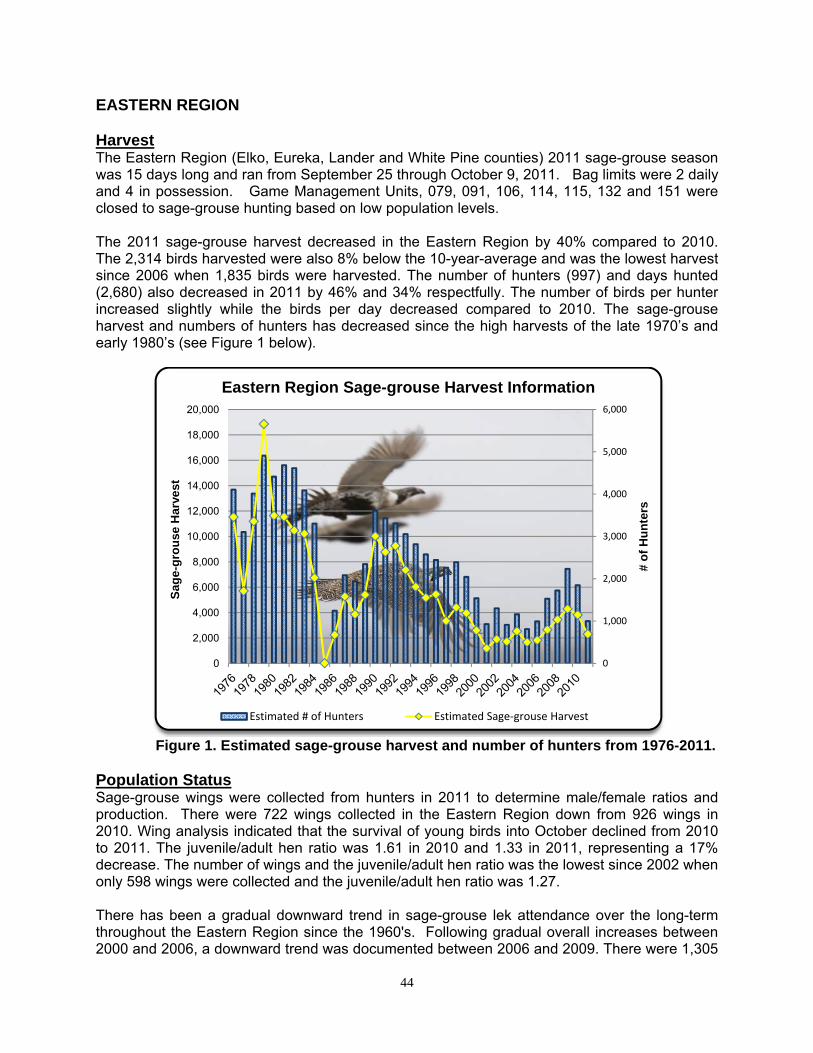
44
EASTERN REGION Harvest The Eastern Region (Elko, Eureka, Lander and White Pine counties) 2011 sage-grouse season was 15 days long and ran from September 25 through October 9, 2011. Bag limits were 2 daily and 4 in possession. Game Management Units, 079, 091, 106, 114, 115, 132 and 151 were closed to sage-grouse hunting based on low population levels. The 2011 sage-grouse harvest decreased in the Eastern Region by 40% compared to 2010. The 2,314 birds harvested were also 8% below the 10-year-average and was the lowest harvest since 2006 when 1,835 birds were harvested. The number of hunters (997) and days hunted (2,680) also decreased in 2011 by 46% and 34% respectfully. The number of birds per hunter increased slightly while the birds per day decreased compared to 2010. The sage-grouse harvest and numbers of hunters has decreased since the high harvests of the late 1970’s and early 1980’s (see Figure 1 below).
Figure 1. Estimated sage-grouse harvest and number of hunters from 1976-2011.
Population Status Sage-grouse wings were collected from hunters in 2011 to determine male/female ratios and production. There were 722 wings collected in the Eastern Region down from 926 wings in 2010. Wing analysis indicated that the survival of young birds into October declined from 2010 to 2011. The juvenile/adult hen ratio was 1.61 in 2010 and 1.33 in 2011, representing a 17% decrease. The number of wings and the juvenile/adult hen ratio was the lowest since 2002 when only 598 wings were collected and the juvenile/adult hen ratio was 1.27. There has been a gradual downward trend in sage-grouse lek attendance over the long-term throughout the Eastern Region since the 1960's. Following gradual overall increases between 2000 and 2006, a downward trend was documented between 2006 and 2009. There were 1,305
0
1,000
2,000
3,000
4,000
5,000
6,000
0
2,000
4,000
6,000
8,000
10,000
12,000
14,000
16,000
18,000
20,000
# o
f H
un
ters
Sag
e-g
rou
se H
arve
st
Eastern Region Sage-grouse Harvest Information
Estimated # of Hunters Estimated Sage‐grouse Harvest
45
male sage-grouse counted on 42 trend leks throughout the Eastern Region in 2012, a 9% increase compared to 2011. The number of males on trend leks has increased for 4 consecutive years. There were 601 leks of the 1,202 known leks in the Eastern Region surveyed in 2012 with 5,786 male sage-grouse in attendance. Eastern Region biologists spent 153 man days conducting lek surveys throughout the region in 2012. Fall Prediction The productivity potential is considered fair for the Eastern Region in 2012. January, 2012 was one of the hottest and driest on record throughout the region and the dry spell continued through July. The precipitation data for the current water year October 1st to August 29, 2012 from the National Weather Service stations in Elko and Eureka were only 39% and 38% of normal respectfully. White Pine County was 105% of normal with the majority of their precipitation coming in the form of rain in July and August. The drought of 2012 resulted in poor herbaceous cover with few forbs and insects for brooding sage-grouse in the Eastern Region. Successful nesting hens had fair to poor conditions to raise their broods. The juvenile per hen ratio from wing data and harvest of sage-grouse both decreased slightly in the Eastern Region in 2011. The decreased harvest may be a reflection of fewer hunters and not directly a result of the number of birds available. The increase in trend lek counts in 2012 indicates a stable to slight increase in the base population of sage-grouse in the short-term. The low production potential should provide for a low to moderate number of young birds this fall. Bird availability in the Eastern Region is predicted to be fair where habitat is intact but poor in areas of Elko County where large wildfires, including several this summer, have destroyed sage-grouse habitat. Any measurable precipitation occurring immediately prior to and during the hunting season tends to reduce hunting success. Dry conditions often concentrate birds making them more available to the hunter. Hunting is expected to be fair in most of the region for 2012. SOUTHERN REGION Harvest Three of the four counties making up the Nevada Department of Wildlife’s (NDOW’s) Southern Region support sage-grouse. Although sage-grouse occur in both Esmeralda and Lincoln counties, these populations are not considered large enough to support an open season at this time. Currently, Nye County is the only county within the Southern Region which maintains an open sage-grouse season. In Nye County, the sage grouse season ran from September 25th to October 9th, totaling 15 days. Daily bag and possession limits remained unchanged at two daily and four in possession.
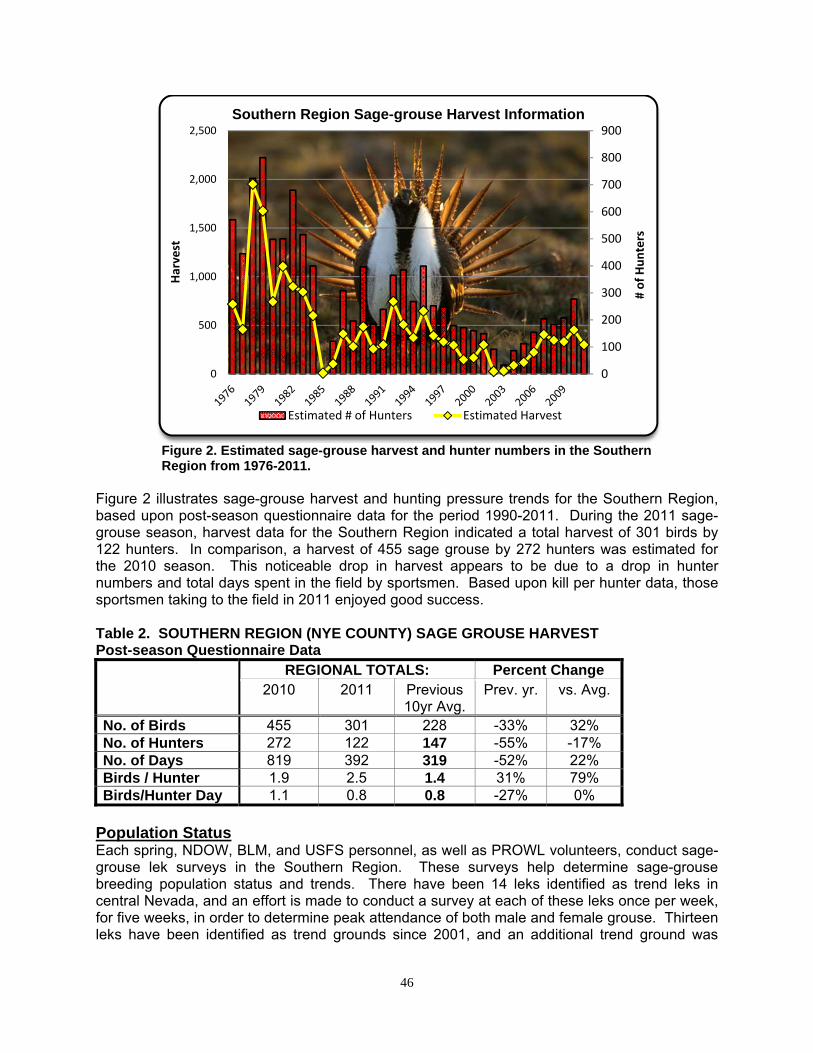
46
Figure 2. Estimated sage-grouse harvest and hunter numbers in the Southern Region from 1976-2011.
Figure 2 illustrates sage-grouse harvest and hunting pressure trends for the Southern Region, based upon post-season questionnaire data for the period 1990-2011. During the 2011 sage-grouse season, harvest data for the Southern Region indicated a total harvest of 301 birds by 122 hunters. In comparison, a harvest of 455 sage grouse by 272 hunters was estimated for the 2010 season. This noticeable drop in harvest appears to be due to a drop in hunter numbers and total days spent in the field by sportsmen. Based upon kill per hunter data, those sportsmen taking to the field in 2011 enjoyed good success. Table 2. SOUTHERN REGION (NYE COUNTY) SAGE GROUSE HARVEST Post-season Questionnaire Data REGIONAL TOTALS: Percent Change
2010 2011 Previous 10yr Avg.
Prev. yr. vs. Avg.
No. of Birds 455 301 228 -33% 32% No. of Hunters 272 122 147 -55% -17% No. of Days 819 392 319 -52% 22% Birds / Hunter 1.9 2.5 1.4 31% 79% Birds/Hunter Day 1.1 0.8 0.8 -27% 0%
Population Status Each spring, NDOW, BLM, and USFS personnel, as well as PROWL volunteers, conduct sage-grouse lek surveys in the Southern Region. These surveys help determine sage-grouse breeding population status and trends. There have been 14 leks identified as trend leks in central Nevada, and an effort is made to conduct a survey at each of these leks once per week, for five weeks, in order to determine peak attendance of both male and female grouse. Thirteen leks have been identified as trend grounds since 2001, and an additional trend ground was
0
100
200
300
400
500
600
700
800
900
0
500
1,000
1,500
2,000
2,500
# of Hunters
Harvest
Southern Region Sage-grouse Harvest Information
Estimated # of Hunters Estimated Harvest

47
added in 2006 (Sullivan Pond, Eureka Co.). Surveyors attempt to make independent counts on the 14 trend grounds once per week for five weeks, but weather, ground conditions, and time constraints do not always allow for five visits. Of the 14 trend grounds, seven showed increases in cock attendance in 2012 from 2011, and seven showed decreases. 2012 trend lek survey data indicate that overall male attendance was up one percent from 2011. Sage-grouse wings collected from hunter harvested birds each fall provide important information to NDOW biologists. These wings are used to determine male/female harvest ratios, nesting success, and young of the year recruitment rates. During the 2011 Southern Region sage- grouse season, a record total of 205 wings was collected. Data obtained from assessing these wings indicate that the juvenile per adult hen ratio during the fall of 2011 was approximately 1.98 juveniles/adult hen. This level of recruitment is above the long-term average, and is considered high enough to have resulted in a stable to increasing sage grouse population for 2011. The reliability of wing data is partially dependent upon sample size, and although an increasing number of wings are being collected in central Nevada, sample sizes from some areas are still comparatively small. Wing data for central Nevada are summarized in Table 3. Table 3. SOUTHERN REGION SAGE GROUSE WING DATA
Year Total Sample
Adults Juveniles Young/ Ad Hen Males Females Males Females
2000 33 5 10 7 11 1.8 2001 76 10 16 21 28 3.1 2002 63 10 25 9 19 1.1 2003 75 6 20 26 23 2.5 2004 62 14 24 10 14 1.0 2005 90 8 23 36 23 2.6 2006 155 28 40 31 56 2.2 2007 127 30 58 17 22 0.7 2008 103 11 38 22 32 1.4 2009 188 14 68 53 53 1.6 2010 166 25 50 38 53 1.8 2011 205 38 56 52 59 2.0 Average 112 17 36 27 33 1.8
Productivity Potential and Fall Prediction Central Nevada experienced a very mild winter, which resulted in good adult carryover of sage- grouse. Unfortunately, the lack of winter and spring moisture and the resultant effect to habitat conditions impacted production of many upland game species, including sage-grouse. While sage-grouse experienced somewhat better production in some areas than many other species of upland game, due to their preference for higher elevation habitats in many cases, it was likely still below levels needed to maintain stable population levels. A return to favorable precipitation patterns during the summer period has provided some relief to wildlife and their habitats, at least in the short-term, in central Nevada. Many forage species have responded to the increased moisture, and sage-grouse should be able to take advantage of this “flush”, and improve their overall body condition moving into the fall/winter period. Due to decreased production, numbers of young birds available for harvest are expected to be lower than those seen in 2011. However, good adult carryover should result in reasonable densities of birds in traditionally productive areas. Depending upon late summer moisture
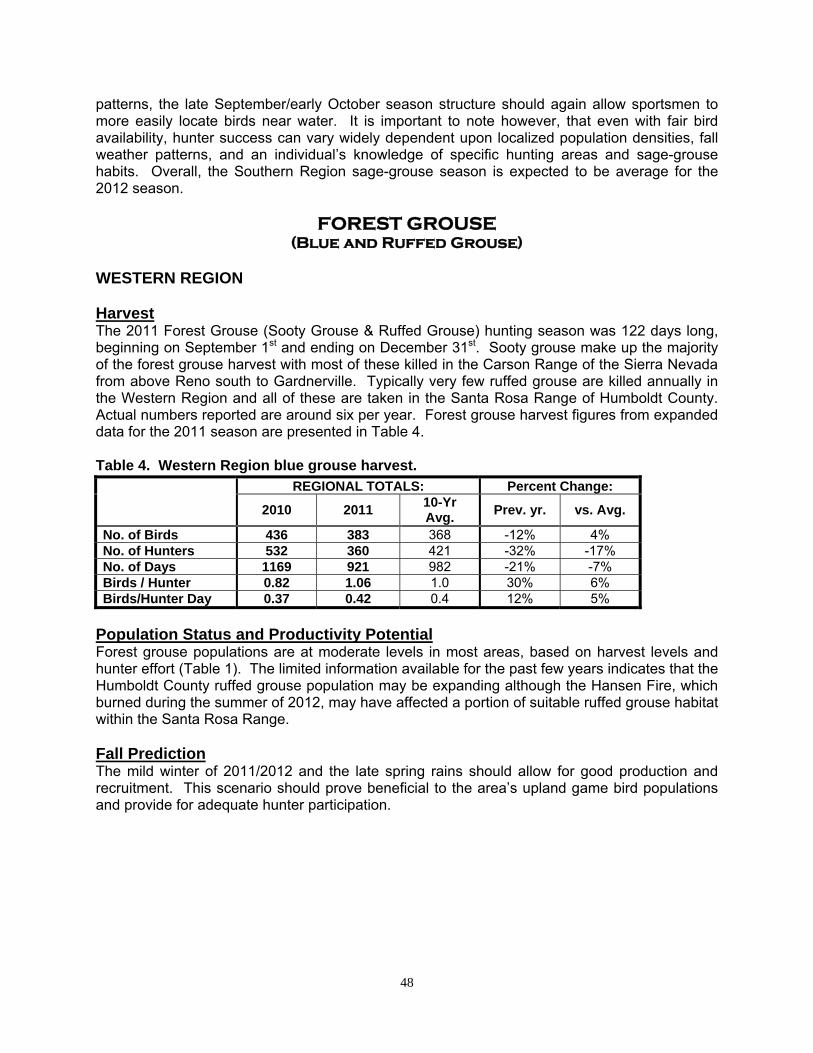
48
patterns, the late September/early October season structure should again allow sportsmen to more easily locate birds near water. It is important to note however, that even with fair bird availability, hunter success can vary widely dependent upon localized population densities, fall weather patterns, and an individual’s knowledge of specific hunting areas and sage-grouse habits. Overall, the Southern Region sage-grouse season is expected to be average for the 2012 season.
FOREST GROUSE (Blue and Ruffed Grouse)
WESTERN REGION Harvest The 2011 Forest Grouse (Sooty Grouse & Ruffed Grouse) hunting season was 122 days long, beginning on September 1st and ending on December 31st. Sooty grouse make up the majority of the forest grouse harvest with most of these killed in the Carson Range of the Sierra Nevada from above Reno south to Gardnerville. Typically very few ruffed grouse are killed annually in the Western Region and all of these are taken in the Santa Rosa Range of Humboldt County. Actual numbers reported are around six per year. Forest grouse harvest figures from expanded data for the 2011 season are presented in Table 4.
Table 4. Western Region blue grouse harvest.
Population Status and Productivity Potential Forest grouse populations are at moderate levels in most areas, based on harvest levels and hunter effort (Table 1). The limited information available for the past few years indicates that the Humboldt County ruffed grouse population may be expanding although the Hansen Fire, which burned during the summer of 2012, may have affected a portion of suitable ruffed grouse habitat within the Santa Rosa Range. Fall Prediction The mild winter of 2011/2012 and the late spring rains should allow for good production and recruitment. This scenario should prove beneficial to the area’s upland game bird populations and provide for adequate hunter participation.
REGIONAL TOTALS: Percent Change:
2010 2011 10-Yr Avg.
Prev. yr. vs. Avg.
No. of Birds 436 383 368 -12% 4% No. of Hunters 532 360 421 -32% -17% No. of Days 1169 921 982 -21% -7% Birds / Hunter 0.82 1.06 1.0 30% 6% Birds/Hunter Day 0.37 0.42 0.4 12% 5%
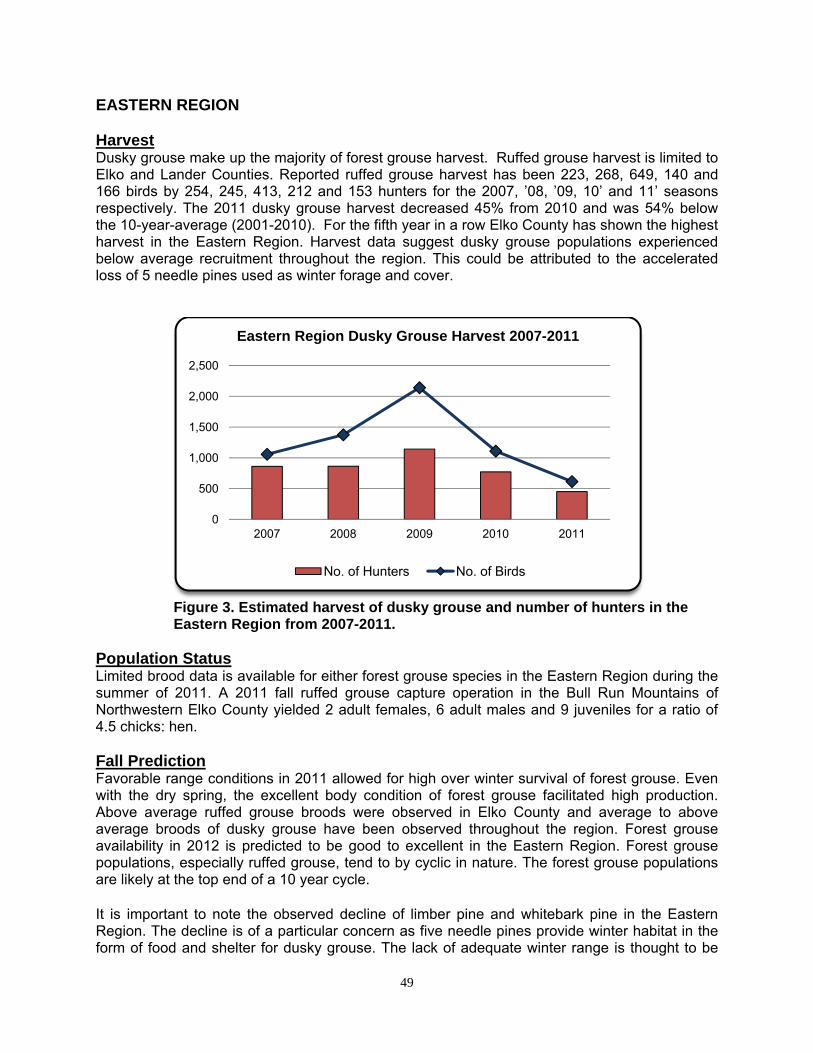
49
EASTERN REGION Harvest Dusky grouse make up the majority of forest grouse harvest. Ruffed grouse harvest is limited to Elko and Lander Counties. Reported ruffed grouse harvest has been 223, 268, 649, 140 and 166 birds by 254, 245, 413, 212 and 153 hunters for the 2007, ’08, ’09, 10’ and 11’ seasons respectively. The 2011 dusky grouse harvest decreased 45% from 2010 and was 54% below the 10-year-average (2001-2010). For the fifth year in a row Elko County has shown the highest harvest in the Eastern Region. Harvest data suggest dusky grouse populations experienced below average recruitment throughout the region. This could be attributed to the accelerated loss of 5 needle pines used as winter forage and cover.
Figure 3. Estimated harvest of dusky grouse and number of hunters in the Eastern Region from 2007-2011. Population Status Limited brood data is available for either forest grouse species in the Eastern Region during the summer of 2011. A 2011 fall ruffed grouse capture operation in the Bull Run Mountains of Northwestern Elko County yielded 2 adult females, 6 adult males and 9 juveniles for a ratio of 4.5 chicks: hen. Fall Prediction Favorable range conditions in 2011 allowed for high over winter survival of forest grouse. Even with the dry spring, the excellent body condition of forest grouse facilitated high production. Above average ruffed grouse broods were observed in Elko County and average to above average broods of dusky grouse have been observed throughout the region. Forest grouse availability in 2012 is predicted to be good to excellent in the Eastern Region. Forest grouse populations, especially ruffed grouse, tend to by cyclic in nature. The forest grouse populations are likely at the top end of a 10 year cycle. It is important to note the observed decline of limber pine and whitebark pine in the Eastern Region. The decline is of a particular concern as five needle pines provide winter habitat in the form of food and shelter for dusky grouse. The lack of adequate winter range is thought to be
0
500
1,000
1,500
2,000
2,500
2007 2008 2009 2010 2011
Eastern Region Dusky Grouse Harvest 2007-2011
No. of Hunters No. of Birds
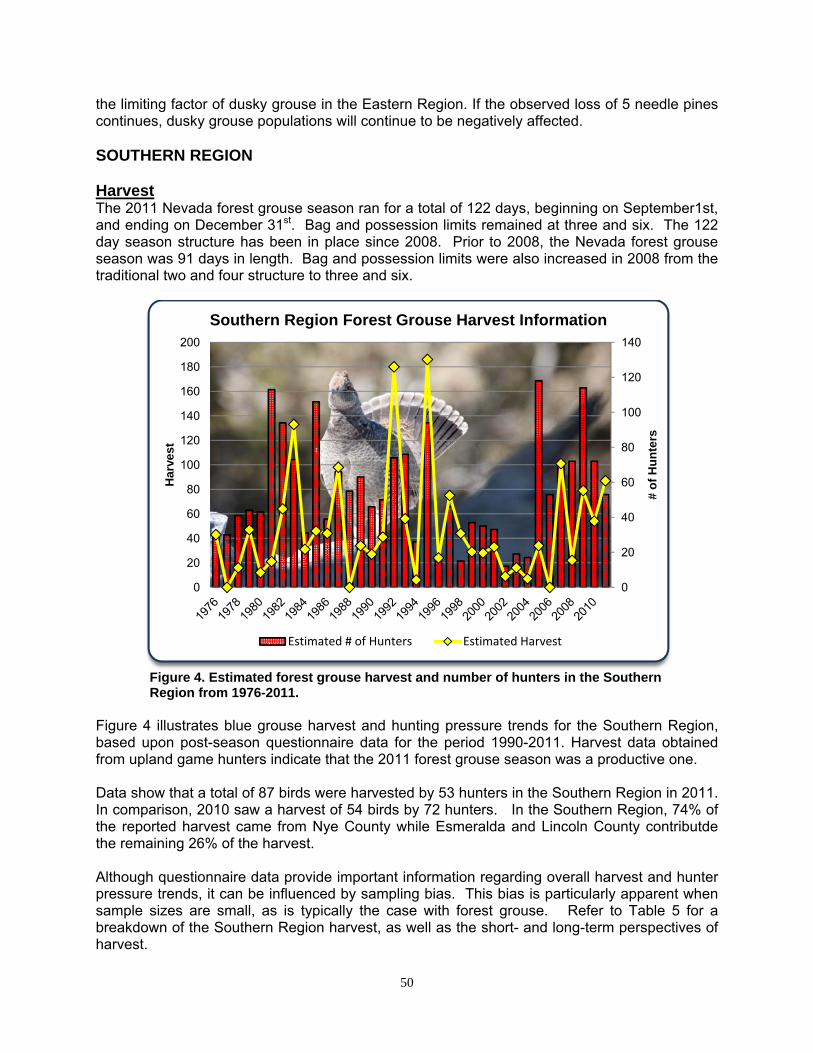
50
the limiting factor of dusky grouse in the Eastern Region. If the observed loss of 5 needle pines continues, dusky grouse populations will continue to be negatively affected. SOUTHERN REGION Harvest The 2011 Nevada forest grouse season ran for a total of 122 days, beginning on September1st, and ending on December 31st. Bag and possession limits remained at three and six. The 122 day season structure has been in place since 2008. Prior to 2008, the Nevada forest grouse season was 91 days in length. Bag and possession limits were also increased in 2008 from the traditional two and four structure to three and six.
Figure 4. Estimated forest grouse harvest and number of hunters in the Southern Region from 1976-2011.
Figure 4 illustrates blue grouse harvest and hunting pressure trends for the Southern Region, based upon post-season questionnaire data for the period 1990-2011. Harvest data obtained from upland game hunters indicate that the 2011 forest grouse season was a productive one. Data show that a total of 87 birds were harvested by 53 hunters in the Southern Region in 2011. In comparison, 2010 saw a harvest of 54 birds by 72 hunters. In the Southern Region, 74% of the reported harvest came from Nye County while Esmeralda and Lincoln County contributde the remaining 26% of the harvest. Although questionnaire data provide important information regarding overall harvest and hunter pressure trends, it can be influenced by sampling bias. This bias is particularly apparent when sample sizes are small, as is typically the case with forest grouse. Refer to Table 5 for a breakdown of the Southern Region harvest, as well as the short- and long-term perspectives of harvest.
0
20
40
60
80
100
120
140
0
20
40
60
80
100
120
140
160
180
200
# o
f H
un
ters
Har
vest
Southern Region Forest Grouse Harvest Information
Estimated # of Hunters Estimated Harvest
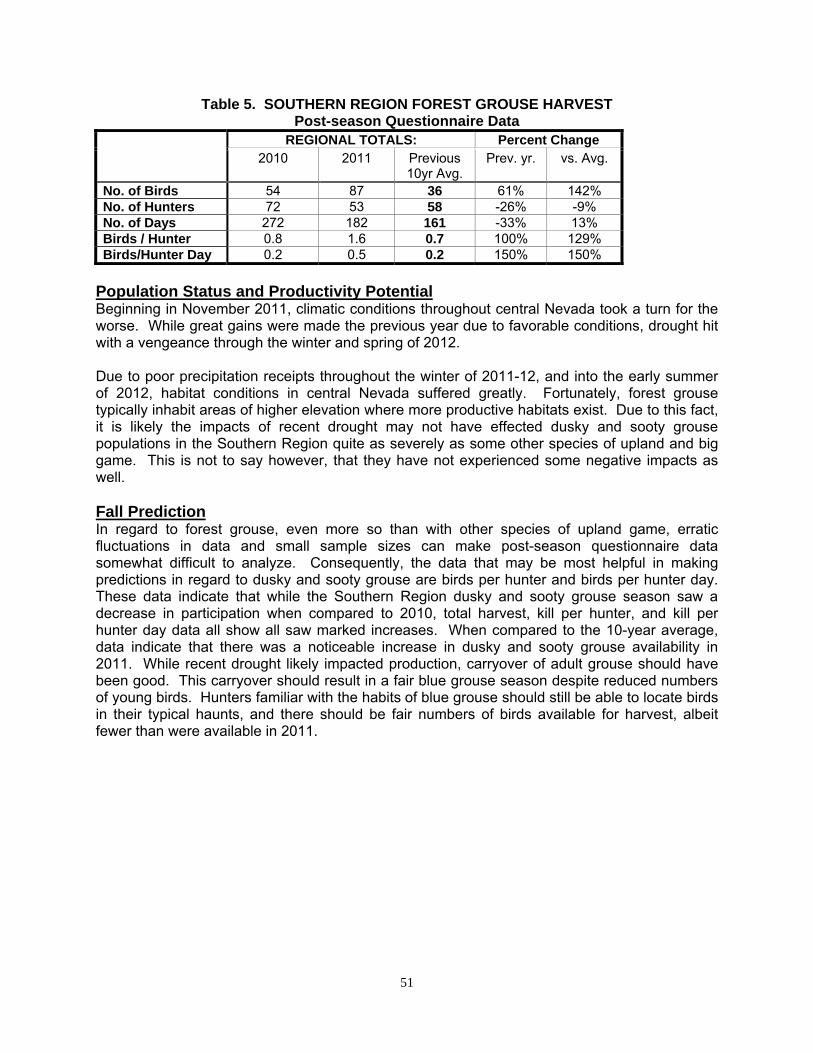
51
Table 5. SOUTHERN REGION FOREST GROUSE HARVEST Post-season Questionnaire Data
REGIONAL TOTALS: Percent Change 2010 2011 Previous
10yr Avg. Prev. yr. vs. Avg.
No. of Birds 54 87 36 61% 142% No. of Hunters 72 53 58 -26% -9% No. of Days 272 182 161 -33% 13% Birds / Hunter 0.8 1.6 0.7 100% 129% Birds/Hunter Day 0.2 0.5 0.2 150% 150%
Population Status and Productivity Potential Beginning in November 2011, climatic conditions throughout central Nevada took a turn for the worse. While great gains were made the previous year due to favorable conditions, drought hit with a vengeance through the winter and spring of 2012. Due to poor precipitation receipts throughout the winter of 2011-12, and into the early summer of 2012, habitat conditions in central Nevada suffered greatly. Fortunately, forest grouse typically inhabit areas of higher elevation where more productive habitats exist. Due to this fact, it is likely the impacts of recent drought may not have effected dusky and sooty grouse populations in the Southern Region quite as severely as some other species of upland and big game. This is not to say however, that they have not experienced some negative impacts as well. Fall Prediction In regard to forest grouse, even more so than with other species of upland game, erratic fluctuations in data and small sample sizes can make post-season questionnaire data somewhat difficult to analyze. Consequently, the data that may be most helpful in making predictions in regard to dusky and sooty grouse are birds per hunter and birds per hunter day. These data indicate that while the Southern Region dusky and sooty grouse season saw a decrease in participation when compared to 2010, total harvest, kill per hunter, and kill per hunter day data all show all saw marked increases. When compared to the 10-year average, data indicate that there was a noticeable increase in dusky and sooty grouse availability in 2011. While recent drought likely impacted production, carryover of adult grouse should have been good. This carryover should result in a fair blue grouse season despite reduced numbers of young birds. Hunters familiar with the habits of blue grouse should still be able to locate birds in their typical haunts, and there should be fair numbers of birds available for harvest, albeit fewer than were available in 2011.
52
SNOWCOCK EASTERN REGION Harvest For the 2011 Snowcock hunting season, only 34 questionnaires were received from 91 known permits issued (37%), despite many attempts to reach hunters via phone. Of those 34 received, nine indicated that they did not hunt. The 25 hunters who reported spending time in the field, only one bird was reported as being harvested, with no wounding loss reported. Hunters reported seeing 135 snowcocks during 65 days of hunting. Past reported snowcock harvest has ranged between 2 and 23 birds annually and has averaged approximately eight birds/year since 1980. Further changes in the permitting and reporting requirements should be considered to improve data collection and analysis. Population Status The habits and remote habitat preference of these birds make standard population surveys extremely difficult. Random sightings and observations noted during other wildlife management activities are recorded. Snowcock density and distribution surveys were previously conducted in conjunction with helicopter mountain goat/bighorn sheep surveys. Beginning in 2005, bighorn sheep surveys and Rocky Mountain goat surveys were rescheduled to late winter to better assess lamb and kid recruitment. Unfortunately, because snowcock data were collected incidental to helicopter sheep and goat surveys, summer aerial surveys are no longer being conducted for snowcock. Productivity Potential Mild climatic conditions existed during the majority of the winter and spring months. During the 2011 breeding and nesting periods, below average snow pack was present and spring moisture was also well below normal creating good nesting and hatching conditions. However, due to the below average snowpack, summer range conditions, even in the upper elevations of the Ruby and East Humboldt Ranges, were extremely dry. Sheep fescue and Alpine Fescue (some of the primary spring forage) cured very quickly. Additionally, many of the meadows and riparian areas historically used by the birds did not have water early in the year. Of the successful nesters, brood survival should be moderate. The current snowcock population appears to be at low levels based on limited observations from hunters, low harvest, and numbers of birds observed during incidental helicopter surveys. More intensive survey work would be needed to adequately assess snowcock population condition and trend. Fall Prediction Climatic conditions, habitat preference, the snowcocks wary nature, and the current low-moderate population level are expected to keep harvest levels low. Birds observed per hunter day were approximately 2.0 in 2011 as compared to 2.8 in 2010. Bird availability for the 2011 season is expected to be fair and harvest is expected to remain well below 10 percent.
53
CHUKAR AND HUNGARIAN PARTRIDGE
WESTERN REGION Harvest Chukar hunters within the Western Region enjoyed an outstanding hunting season in 2011. The 81,380 birds harvested represented the second highest harvest level since 1981. In fact, the 2011 Western Region chukar harvest was the fourth highest harvest level recorded over the past 35 years. Chukar hunters also expended considerable effort chasing chukar in 2011. Hunters averaged a very impressive 10.1 birds/hunter which represented the 2nd highest average since 1976. Population Status and Productivity Potential Severe drought conditions during the summer of 2012 appeared to have negatively impacted chukar chick survival. Water availability continued to worsen as the summer progressed. Occasional thundershowers provided some short-term relief during August; however, the thundershowers were localized and many areas within the Region did not receive moisture. Chukar recruitment within the Western Region is expected to be only poor to fair due to the extremely dry conditions. Chukar populations within the Region are expected to experience stable to slightly decreasing trends due to lower recruitment values. Fall Prediction Chukar hunting is still expected to be good in 2012; however, less young birds will be available in the population for hunters to harvest. The adult birds will be much more wary and could be difficult to approach later in the hunting season. Hunters are expected to have to work harder for birds in 2012. Total harvest levels are expected to decline. EASTERN REGION Harvest The 2011 chukar and Hungarian partridge season was 121 days in length running from October 8, 2011 through February 5, 2012. Limits were 6 daily and 18 in possession, singly or in aggregate. In addition youth hunters (15 years of age or younger) were allowed to hunt for 2 days during a special youth season (September 24-25, 2011). Table 6. EASTERN REGION CHUKAR HARVEST Post-season Questionnaire Data REGIONAL TOTALS: Percent Change
2010 2011 Avg. Prev. yr. vs. Avg.
No. of Birds 14,103 18,116 19,694 29% -8% No. of Hunters 3,105 2,100 2,965 -32% -29% No. of Days 12,629 11,424 12,268 -10% -7% Birds / Hunter 4.5 8.63 6.5 90% 32% Birds/Hunter Day 1.1 1.59 1.5 42% -1%
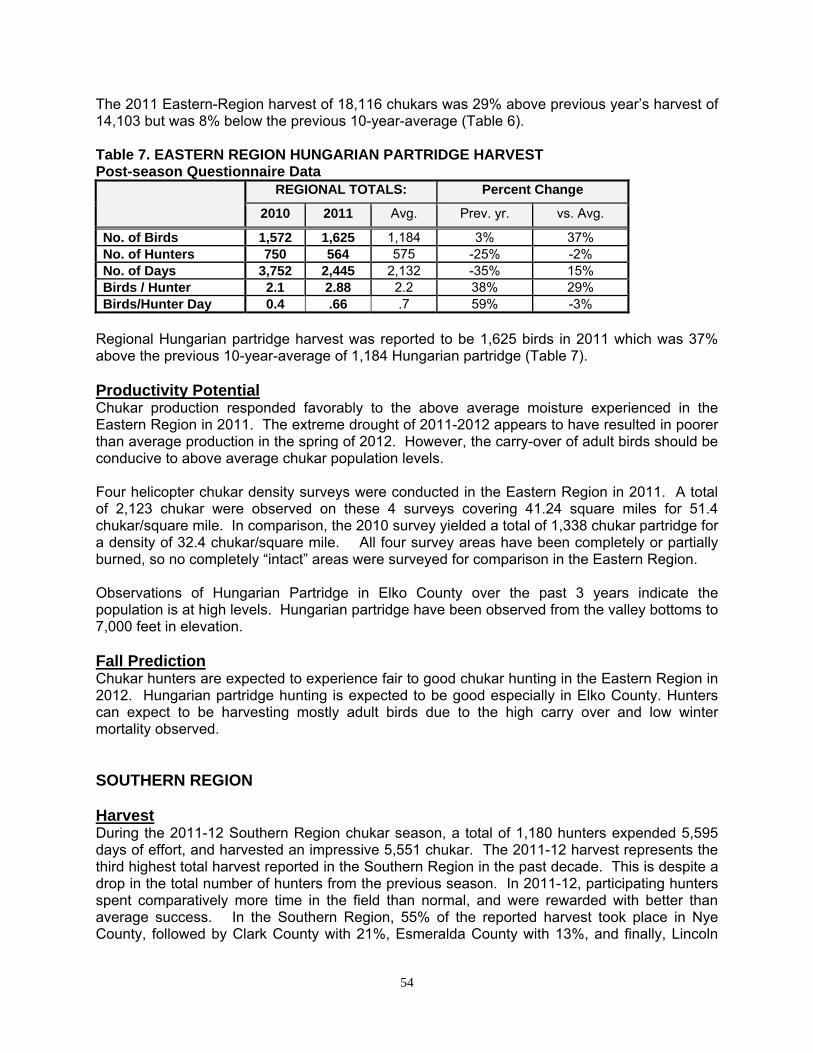
54
The 2011 Eastern-Region harvest of 18,116 chukars was 29% above previous year’s harvest of 14,103 but was 8% below the previous 10-year-average (Table 6). Table 7. EASTERN REGION HUNGARIAN PARTRIDGE HARVEST Post-season Questionnaire Data REGIONAL TOTALS: Percent Change
2010 2011 Avg. Prev. yr. vs. Avg.
No. of Birds 1,572 1,625 1,184 3% 37% No. of Hunters 750 564 575 -25% -2% No. of Days 3,752 2,445 2,132 -35% 15% Birds / Hunter 2.1 2.88 2.2 38% 29% Birds/Hunter Day 0.4 .66 .7 59% -3%
Regional Hungarian partridge harvest was reported to be 1,625 birds in 2011 which was 37% above the previous 10-year-average of 1,184 Hungarian partridge (Table 7). Productivity Potential Chukar production responded favorably to the above average moisture experienced in the Eastern Region in 2011. The extreme drought of 2011-2012 appears to have resulted in poorer than average production in the spring of 2012. However, the carry-over of adult birds should be conducive to above average chukar population levels. Four helicopter chukar density surveys were conducted in the Eastern Region in 2011. A total of 2,123 chukar were observed on these 4 surveys covering 41.24 square miles for 51.4 chukar/square mile. In comparison, the 2010 survey yielded a total of 1,338 chukar partridge for a density of 32.4 chukar/square mile. All four survey areas have been completely or partially burned, so no completely “intact” areas were surveyed for comparison in the Eastern Region. Observations of Hungarian Partridge in Elko County over the past 3 years indicate the population is at high levels. Hungarian partridge have been observed from the valley bottoms to 7,000 feet in elevation. Fall Prediction Chukar hunters are expected to experience fair to good chukar hunting in the Eastern Region in 2012. Hungarian partridge hunting is expected to be good especially in Elko County. Hunters can expect to be harvesting mostly adult birds due to the high carry over and low winter mortality observed. SOUTHERN REGION Harvest During the 2011-12 Southern Region chukar season, a total of 1,180 hunters expended 5,595 days of effort, and harvested an impressive 5,551 chukar. The 2011-12 harvest represents the third highest total harvest reported in the Southern Region in the past decade. This is despite a drop in the total number of hunters from the previous season. In 2011-12, participating hunters spent comparatively more time in the field than normal, and were rewarded with better than average success. In the Southern Region, 55% of the reported harvest took place in Nye County, followed by Clark County with 21%, Esmeralda County with 13%, and finally, Lincoln
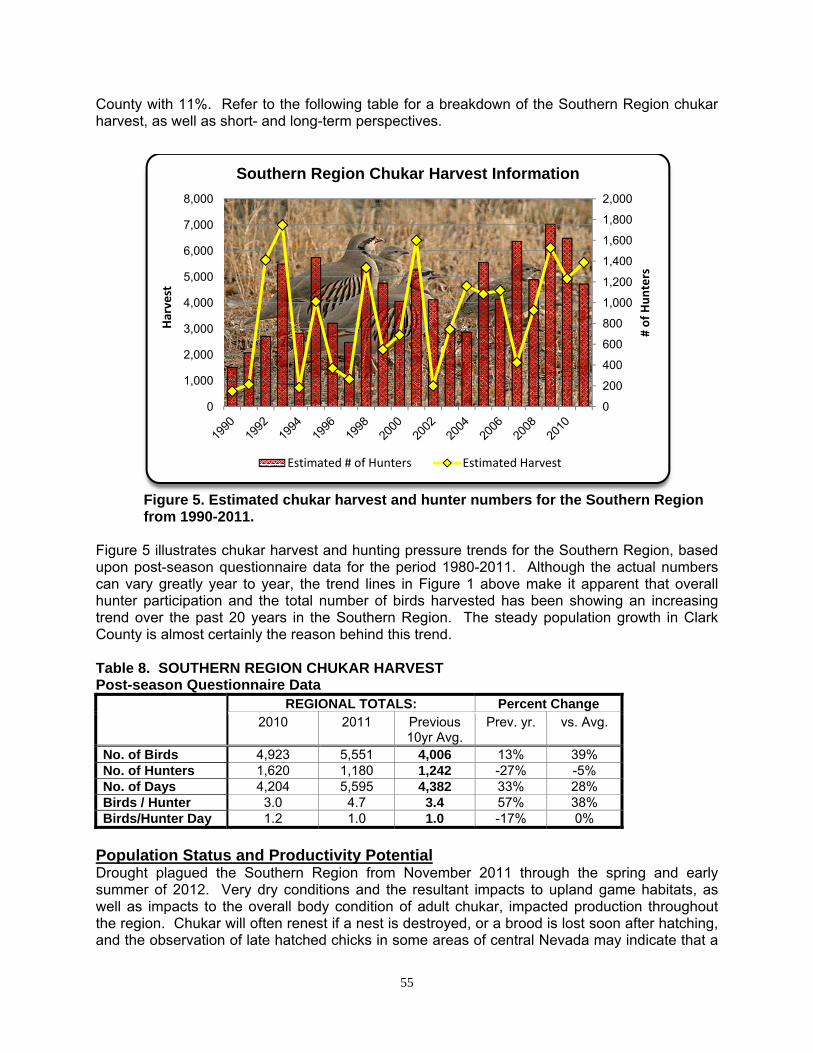
55
County with 11%. Refer to the following table for a breakdown of the Southern Region chukar harvest, as well as short- and long-term perspectives.
Figure 5. Estimated chukar harvest and hunter numbers for the Southern Region from 1990-2011.
Figure 5 illustrates chukar harvest and hunting pressure trends for the Southern Region, based upon post-season questionnaire data for the period 1980-2011. Although the actual numbers can vary greatly year to year, the trend lines in Figure 1 above make it apparent that overall hunter participation and the total number of birds harvested has been showing an increasing trend over the past 20 years in the Southern Region. The steady population growth in Clark County is almost certainly the reason behind this trend. Table 8. SOUTHERN REGION CHUKAR HARVEST Post-season Questionnaire Data REGIONAL TOTALS: Percent Change
2010 2011 Previous 10yr Avg.
Prev. yr. vs. Avg.
No. of Birds 4,923 5,551 4,006 13% 39% No. of Hunters 1,620 1,180 1,242 -27% -5% No. of Days 4,204 5,595 4,382 33% 28% Birds / Hunter 3.0 4.7 3.4 57% 38% Birds/Hunter Day 1.2 1.0 1.0 -17% 0%
Population Status and Productivity Potential Drought plagued the Southern Region from November 2011 through the spring and early summer of 2012. Very dry conditions and the resultant impacts to upland game habitats, as well as impacts to the overall body condition of adult chukar, impacted production throughout the region. Chukar will often renest if a nest is destroyed, or a brood is lost soon after hatching, and the observation of late hatched chicks in some areas of central Nevada may indicate that a
0
200
400
600
800
1,000
1,200
1,400
1,600
1,800
2,000
0
1,000
2,000
3,000
4,000
5,000
6,000
7,000
8,000
# of Hunters
Harvest
Southern Region Chukar Harvest Information
Estimated # of Hunters Estimated Harvest
56
period of inclement weather experienced during late May and early June in this area caused increased chick mortality also. As a result, chick numbers were noticeably lower in 2012 than during the previous year. Fortunately, beginning in July, very favorable precipitation patterns returned to the Southern Region. While these conditions came too late to benefit this year’s production, the base of adult chukar that carried over from 2011 should enter the fall/winter period in good condition.
Fall Prediction In the Southern Region, reduced production will likely result in a noticeably more challenging chukar season than that experienced in 2011. Although a reduced number of young birds will be available for harvest during the upcoming season, the mild winter, in conjunction with improved conditions over the summer, should have allowed reasonable numbers of adult birds to have carried over into the fall. In addition to relative abundance of chukar, fall precipitation patterns can also affect overall hunter success in any given year as well. Overall, the Southern Region chukar season is only anticipated to be fair in 2012-13, although some localized areas of comparatively good bird availability may be present, and a in the event of a dry fall, birds could be concentrated in areas where they are more easily located near water.
CALIFORNIA QUAIL WESTERN REGION Harvest California quail harvest data indicates that the 2012 harvest was well above both short-term and long-term levels. Harvest data also indicates that fewer hunters spent more time in the field and were rewarded with a strong increase in birds harvested per hunter.
Table 9. Western Region California Quail harvest.
REGIONAL TOTALS: Percent Change
2010 2011 10-Yr Avg. Prev. yr. vs. Avg. No. of Birds 27,298 37,911 24,375 38.9% 55.5% No. of Hunters 3,402 2,970 3,075 -12.7% -3.4% No. of Days 14,235 17,152 12,008 20.5% 42.8% Birds / Hunter 8.0 12.76 8.1 59.1% 57.3% Birds/Hunter Day 1.9 2.21 2.1 15.3% 6.8%
Population Status California quail are found throughout the region and are typically associated with upland riparian areas or urban interfaces. Populations of California quail, like most other upland species, are greatly influenced by precipitation levels and the timing of weather events over the course of the year. Over the last five years, quail population levels in the western region have been above average. Relatively mild winters coupled with warm late winter and spring precipitation events have allowed bird numbers to increase and remain high.
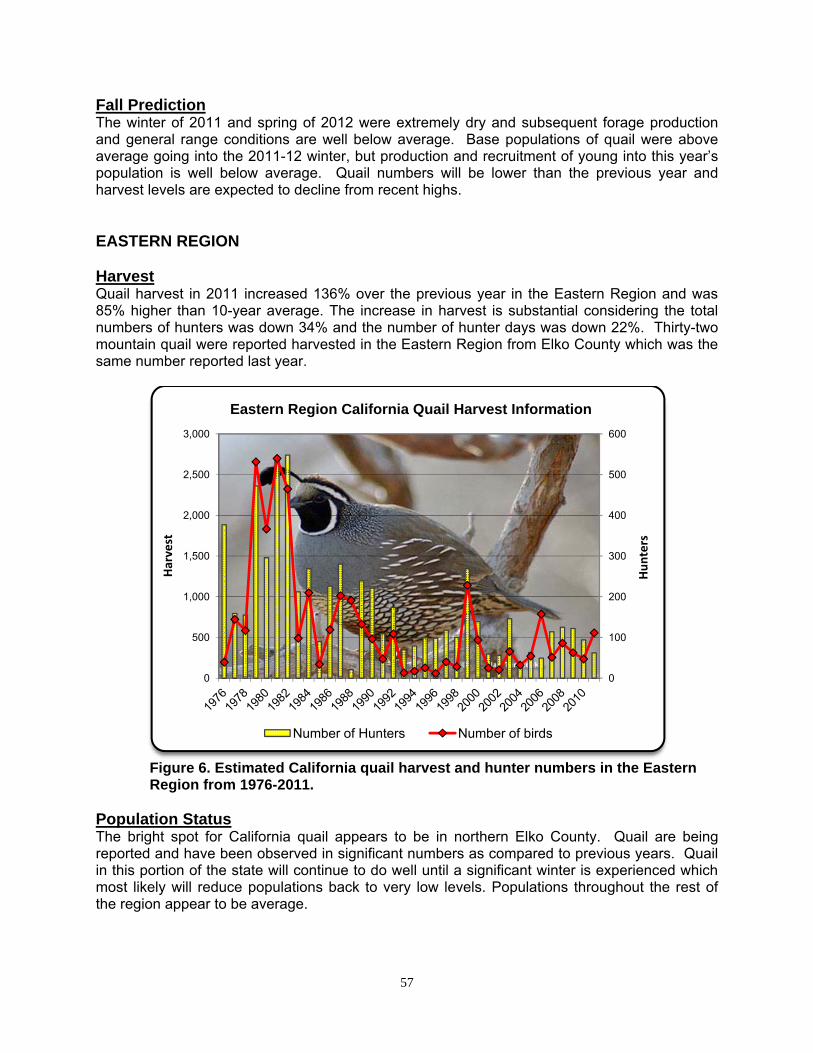
57
Fall Prediction The winter of 2011 and spring of 2012 were extremely dry and subsequent forage production and general range conditions are well below average. Base populations of quail were above average going into the 2011-12 winter, but production and recruitment of young into this year’s population is well below average. Quail numbers will be lower than the previous year and harvest levels are expected to decline from recent highs. EASTERN REGION Harvest Quail harvest in 2011 increased 136% over the previous year in the Eastern Region and was 85% higher than 10-year average. The increase in harvest is substantial considering the total numbers of hunters was down 34% and the number of hunter days was down 22%. Thirty-two mountain quail were reported harvested in the Eastern Region from Elko County which was the same number reported last year.
Figure 6. Estimated California quail harvest and hunter numbers in the Eastern
Region from 1976-2011. Population Status The bright spot for California quail appears to be in northern Elko County. Quail are being reported and have been observed in significant numbers as compared to previous years. Quail in this portion of the state will continue to do well until a significant winter is experienced which most likely will reduce populations back to very low levels. Populations throughout the rest of the region appear to be average.
0
100
200
300
400
500
600
0
500
1,000
1,500
2,000
2,500
3,000
Hunters
Harvest
Eastern Region California Quail Harvest Information
Number of Hunters Number of birds
58
In January 2012, 83 California quail were released at the Cowboy’s Rest Trust. The ranch is located on the west side of Ruby Mountains in Unit 103. In addition to providing a release area for urban trapped quail, the hope is that an established population will provide viewing opportunities for children that visit the ranch as well as establish a viable population on nearby public land. No report is available about the success of this release. Fall Prediction Eastern Region quail populations are low compared to most of the State. Small relatively isolated quail populations in the region will provide limited hunting opportunities during the 2012 season. Quail are normally harvested in the Eastern Region by hunters pursuing other species such as rabbits and chukar. Due to mild winter conditions last year and increased concentrations around water sources this fall, quail harvest is expected to be higher than last year in the Eastern Region.
GAMBEL’S QUAIL
SOUTHERN REGION Harvest The 2011-2012 quail season began October 8th, 2011 and extended through February 5th, 2012 (121 days). Limits were ten daily and 20 in possession. Based on hunter questionnaire data for the Southern Region, 1,959 hunters harvested 25,471 quail during the 2011-2012 season. This total represents a 35% increase in harvest from the 2010-2011quail season. Table 10. SOUTHERN REGION GAMBEL’S QUAIL HARVEST Post-season Questionnaire Data
REGIONAL TOTALS: Percent Change
2010-11 2011-12 01-10 AVG. PRE. YR.
10 YR. AVG.
No. of Birds 18,863 25,471 16,929 35.0% 50.5% No. of Hunters 2,672 1,959 2,393 -26.7% -18.1% No. of Days 10,625 11,778 9,913 10.9% 18.8% Birds / Hunter 7.06 13.00 7.9 84.2% 64.9% Birds/Hunter Day 1.78 2.16 1.9 21.8% 15.8%
Quail harvest, number of hunter days, birds per hunter, and birds per hunter day all increased compared to the 2010-2011 season as well as the previous ten-year average, while the number of hunters decreased compared to both the 2010-11 season and the previous ten-year average. Population Status Below average precipitation during the winter of 2011-12 resulted in poor habitat conditions during the spring of 2012. Below average precipitation during April, May, and June likely resulted in unfavorable nesting and brood-rearing conditions. Hot, dry conditions during the spring of 2012 have likely taken a toll on young birds, but a few areas still appear to be carrying relatively high densities of quail. Densities of birds will be quite varied across the southern region, but the traditional areas where quail have been found should be holding moderate
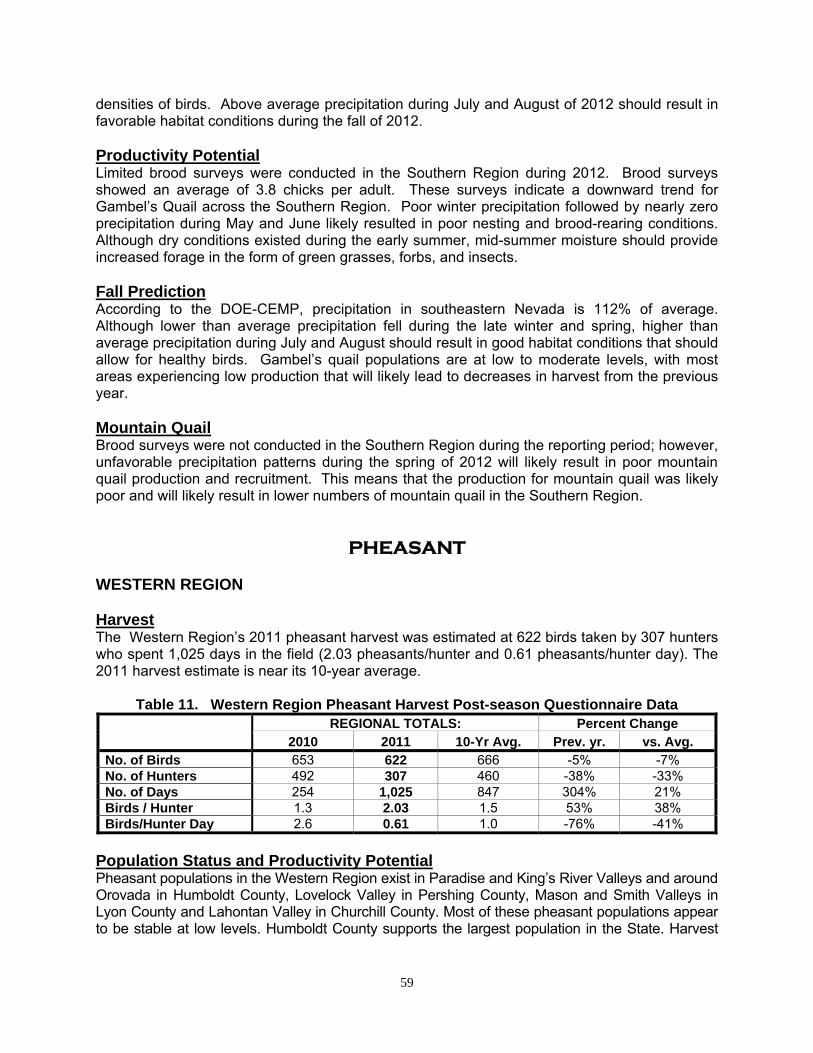
59
densities of birds. Above average precipitation during July and August of 2012 should result in favorable habitat conditions during the fall of 2012.
Productivity Potential Limited brood surveys were conducted in the Southern Region during 2012. Brood surveys showed an average of 3.8 chicks per adult. These surveys indicate a downward trend for Gambel’s Quail across the Southern Region. Poor winter precipitation followed by nearly zero precipitation during May and June likely resulted in poor nesting and brood-rearing conditions. Although dry conditions existed during the early summer, mid-summer moisture should provide increased forage in the form of green grasses, forbs, and insects. Fall Prediction According to the DOE-CEMP, precipitation in southeastern Nevada is 112% of average. Although lower than average precipitation fell during the late winter and spring, higher than average precipitation during July and August should result in good habitat conditions that should allow for healthy birds. Gambel’s quail populations are at low to moderate levels, with most areas experiencing low production that will likely lead to decreases in harvest from the previous year. Mountain Quail Brood surveys were not conducted in the Southern Region during the reporting period; however, unfavorable precipitation patterns during the spring of 2012 will likely result in poor mountain quail production and recruitment. This means that the production for mountain quail was likely poor and will likely result in lower numbers of mountain quail in the Southern Region.
PHEASANT WESTERN REGION Harvest The Western Region’s 2011 pheasant harvest was estimated at 622 birds taken by 307 hunters who spent 1,025 days in the field (2.03 pheasants/hunter and 0.61 pheasants/hunter day). The 2011 harvest estimate is near its 10-year average.
Table 11. Western Region Pheasant Harvest Post-season Questionnaire Data
REGIONAL TOTALS: Percent Change
2010 2011 10-Yr Avg. Prev. yr. vs. Avg. No. of Birds 653 622 666 -5% -7% No. of Hunters 492 307 460 -38% -33% No. of Days 254 1,025 847 304% 21% Birds / Hunter 1.3 2.03 1.5 53% 38% Birds/Hunter Day 2.6 0.61 1.0 -76% -41%
Population Status and Productivity Potential Pheasant populations in the Western Region exist in Paradise and King’s River Valleys and around Orovada in Humboldt County, Lovelock Valley in Pershing County, Mason and Smith Valleys in Lyon County and Lahontan Valley in Churchill County. Most of these pheasant populations appear to be stable at low levels. Humboldt County supports the largest population in the State. Harvest
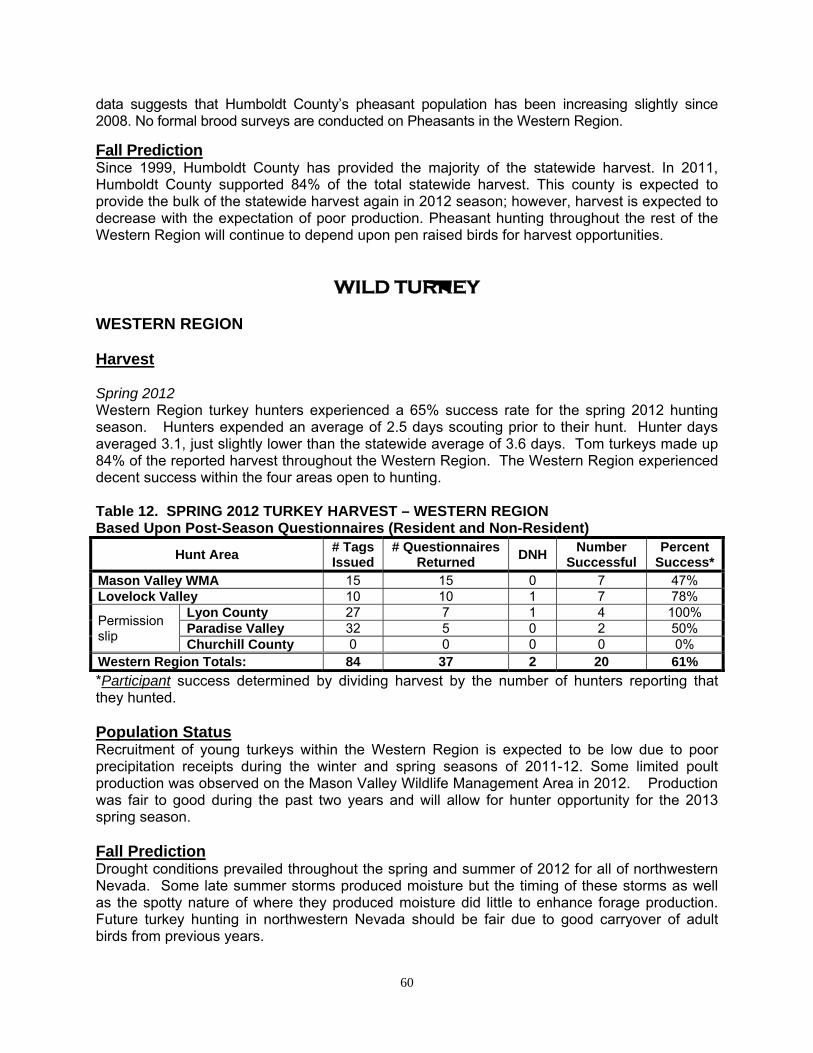
60
data suggests that Humboldt County’s pheasant population has been increasing slightly since 2008. No formal brood surveys are conducted on Pheasants in the Western Region.
Fall Prediction Since 1999, Humboldt County has provided the majority of the statewide harvest. In 2011, Humboldt County supported 84% of the total statewide harvest. This county is expected to provide the bulk of the statewide harvest again in 2012 season; however, harvest is expected to decrease with the expectation of poor production. Pheasant hunting throughout the rest of the Western Region will continue to depend upon pen raised birds for harvest opportunities.
WILD TURKEY WESTERN REGION Harvest Spring 2012 Western Region turkey hunters experienced a 65% success rate for the spring 2012 hunting season. Hunters expended an average of 2.5 days scouting prior to their hunt. Hunter days averaged 3.1, just slightly lower than the statewide average of 3.6 days. Tom turkeys made up 84% of the reported harvest throughout the Western Region. The Western Region experienced decent success within the four areas open to hunting. Table 12. SPRING 2012 TURKEY HARVEST – WESTERN REGION Based Upon Post-Season Questionnaires (Resident and Non-Resident)
Hunt Area # Tags Issued
# Questionnaires Returned
DNH Number
Successful Percent
Success* Mason Valley WMA 15 15 0 7 47% Lovelock Valley 10 10 1 7 78%
Permission slip
Lyon County 27 7 1 4 100% Paradise Valley 32 5 0 2 50% Churchill County 0 0 0 0 0%
Western Region Totals: 84 37 2 20 61%
*Participant success determined by dividing harvest by the number of hunters reporting that they hunted. Population Status Recruitment of young turkeys within the Western Region is expected to be low due to poor precipitation receipts during the winter and spring seasons of 2011-12. Some limited poult production was observed on the Mason Valley Wildlife Management Area in 2012. Production was fair to good during the past two years and will allow for hunter opportunity for the 2013 spring season. Fall Prediction Drought conditions prevailed throughout the spring and summer of 2012 for all of northwestern Nevada. Some late summer storms produced moisture but the timing of these storms as well as the spotty nature of where they produced moisture did little to enhance forage production. Future turkey hunting in northwestern Nevada should be fair due to good carryover of adult birds from previous years.
61
EASTERN REGION Harvest There were 45 tags available in the Eastern Region during the 2012 spring turkey season. There were 5 turkey hunt choices in 7 units located in 3 counties in the Eastern Region that were open for turkey hunting during the 2011 spring season. These hunts included Hunt Unit 091 in Elko County, Hunt Unit 101 in Elko County, Hunt Units 102 and 065 in Elko County, Hunt Unit 115 in White Pine County, and Hunt Units 151 and 152 in Lander County along the Humboldt River. Turkey return card information indicated that hunters took 14 turkeys during the spring 2012 hunt in the Eastern Region. A success rate of 45% was calculated for those individuals that returned their hunter information card. Hunters expended 172 days in the field with 54 additional days spent scouting areas to hunt. The harvest consisted of 10 toms and 4 jakes. Population Status Turkey populations within the region appear to be stable. There has been fluctuations in both production and bird availability to hunters in response to the below average water year that we are experiencing. The dry spring forced turkeys to heavily rely on private lands in several unit groups, which made hunting difficult. The dry conditions also caused the birds to utilize higher elevation sites in some units, which in Unit 091 made the birds unavailable as they were in Utah.
Productivity Potential Reported observations in recent years of turkeys in the Region indicate that they have expanded from original release sites. There have been very few brood observations this year, which may mark population contractions throughout the region. The current drought appears to be partially responsible for hindering regional population growth, and will be a major factor in regional quotas in the near future. SOUTHERN REGION Harvest Lincoln County The Nevada Wildlife Commission authorized four spring wild turkey seasons in Lincoln County. The Resident Junior Spring Wild Turkey Hunt was held under an open quota, and ran April 14th – April 23rd. The spring limited entry drawing in Lincoln County involved three seasons that ran: March 25th – April 3rd, April 4th – April 13th, and April 24th – May 3rd. Ten resident tags and one nonresident tag were allotted for each hunt. In 2012, the number of turkey tags issued reflected a 3% decrease relative to the previous year. Return card information from Lincoln County wild turkey hunters reflected 40% and 58% decreases in harvest compared to last year and the long-term average, respectively. Two hunters reported opportunities to harvest turkeys, but chose not to. Current Lincoln County harvest figures as well as short- and long-term perspectives are presented in Table 13.
62
Table 13. Lincoln County Turkey Harvest REGIONAL TOTALS: Percent Change
2008 2009
2010
2011
2012 2003-12
AVG Previous
Year 10-Year Average
Tags Issued 117 140 130 66 64 104 -3% -38% Questionnaires Returned 99 128 112 50 46 87 -8% ----
Did Not Hunt 9 12 21 4 10 12 150% ---- Birds Harvested 18 10 19 10 6 14 -40% -58% Success* 20% 9% 21% 22% 17% 19% -23% -2.2%
*Participant success determined by dividing harvest by number of hunters that hunted. Clark County (Moapa Valley) The spring limited entry drawing in Moapa Valley involved three consecutive ten-day seasons: March 25th – April 3rd, April 4th – April 13th, and April 14th – April 23rd. Three resident tags were allotted in each of the three seasons. Based on questionnaire data submitted by all nine hunters, eight toms and one jake were harvested. In 2011, three toms and one jake were harvested. One respondent in 2012 reported one wounding loss. Hunter success equated to 100%, and reflected a substantial increase relative to the 57% reported last year. Overall, hunters expended 16 days scouting and 17 days hunting. Four hunters reported no scouting effort. Scouting effort among hunters averaged fractionally less than two days. Similarly, hunting effort among hunters averaged fractionally less than two days. In comparison, hunters scouted fractionally more than one day and hunted two days in 2011. Population Status Lincoln County Wild turkeys were introduced to Lincoln County in 1999. Initial releases proved successful, and a limited hunt was opened in 2001. At that time, turkeys were found primarily in association with private lands. Hunting pressure quickly served to disperse many birds from private lands to adjacent, less productive public lands. Additional releases in various locations in Lincoln County have resulted in a low-density, broadly distributed turkey population. No turkeys were released during the reporting period. Additional release sites remain in Lincoln County and releases will be conducted when birds become available. In central Lincoln County, lightening-caused wildfires burned large expanses of dense pinyon-juniper woodland in the Clover Mountains (Unit 242) and Delamar Mountains (Unit 241). In many of these areas, regenerated varieties of oak now provide excellent mast sources. In addition, increased flow rates at many springs and seeps have improved water and insect availability. Brood surveys conducted in Lincoln County did not result in any meaningful data being collected. Below-average precipitation combined with poor habitat conditions likely resulted in decreases in turkey production. Turkeys still appear to be dispersed in relatively low densities across Lincoln County, although certain areas appear to hold moderate densities of birds.
63
Although the bulk of the turkeys appear to be located on public lands, turkeys may still be found associated with private lands. It is likely that the number of wild turkeys has decreased in Lincoln County and future quotas and management will reflect that and attempt to reverse that trend. Three successive years of poor turkey production has resulted in a dramatic drop in the turkey population. At this point the turkey season will be closed indefinitely until the turkey population increases to a number where they could once again be hunted. Moapa Valley (Moapa Valley) In Moapa Valley, wild turkey habitat exists in a fairly confined, narrow band along the Muddy River. Wild turkeys tend to concentrate throughout the year in a relatively small area that includes the OWMA and nearby croplands in Overton and Logandale. Increasingly, crop fields adjacent to the river are being subdivided and developed for housing and commercial enterprises. It is anticipated in the near future, the loss of habitat, predation, harassment and illegal take coupled with an inevitable no-shooting ordinance will likely result in a reduced turkey population and restriction to hunting. Nevertheless, hunters should experience little difficulty in locating turkeys on private lands and the Overton Wildlife Management Area during the spring wild turkey seasons. A substantial proportion of the Moapa Valley turkey population occurs on private land, and as a result, tagholders generally have to seek landowner consent to access fields. Incidences have arisen where this situation ultimately resulted in lost hunting opportunity for some sportsmen. Overall, 2011 was marked by below average precipitation. Due to increased precipitation receipts in 2012, vegetative abundance and vigor and insect availability have increased from poor-to-fair to fair-to-good. No turkey surveys were conducted in 2011-12.
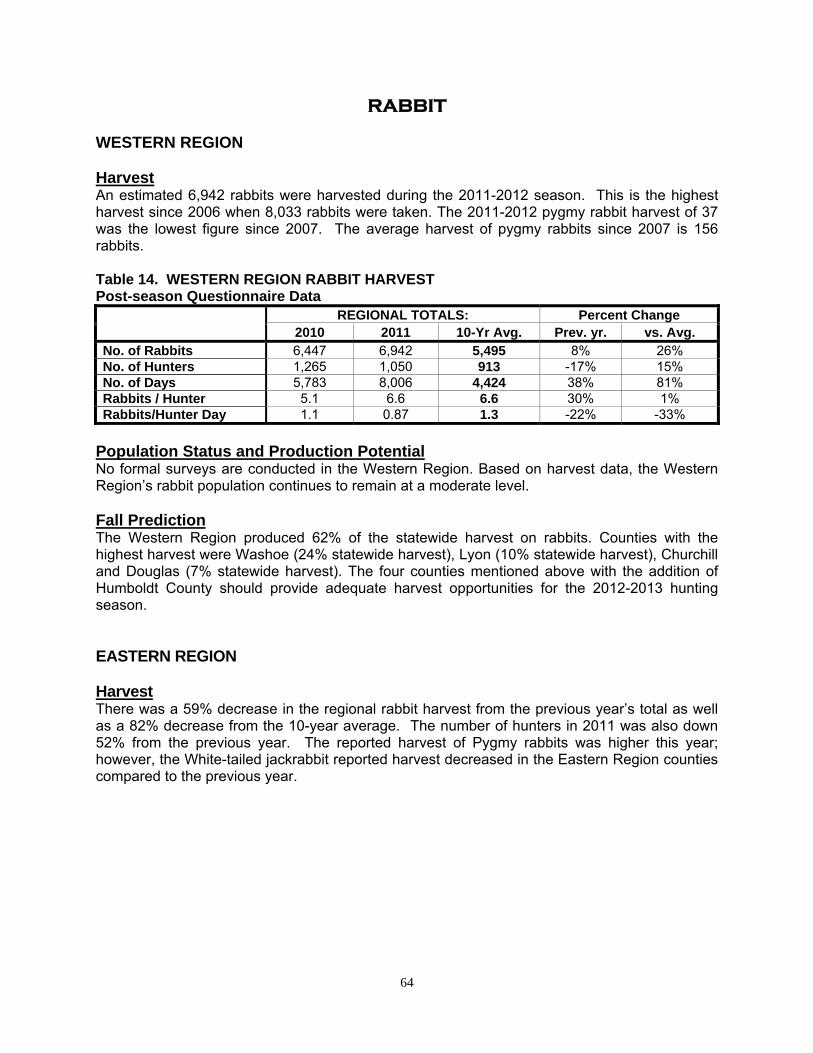
64
RABBIT
WESTERN REGION Harvest An estimated 6,942 rabbits were harvested during the 2011-2012 season. This is the highest harvest since 2006 when 8,033 rabbits were taken. The 2011-2012 pygmy rabbit harvest of 37 was the lowest figure since 2007. The average harvest of pygmy rabbits since 2007 is 156 rabbits. Table 14. WESTERN REGION RABBIT HARVEST Post-season Questionnaire Data
REGIONAL TOTALS: Percent Change 2010 2011 10-Yr Avg. Prev. yr. vs. Avg.
No. of Rabbits 6,447 6,942 5,495 8% 26% No. of Hunters 1,265 1,050 913 -17% 15% No. of Days 5,783 8,006 4,424 38% 81% Rabbits / Hunter 5.1 6.6 6.6 30% 1% Rabbits/Hunter Day 1.1 0.87 1.3 -22% -33%
Population Status and Production Potential No formal surveys are conducted in the Western Region. Based on harvest data, the Western Region’s rabbit population continues to remain at a moderate level. Fall Prediction The Western Region produced 62% of the statewide harvest on rabbits. Counties with the highest harvest were Washoe (24% statewide harvest), Lyon (10% statewide harvest), Churchill and Douglas (7% statewide harvest). The four counties mentioned above with the addition of Humboldt County should provide adequate harvest opportunities for the 2012-2013 hunting season. EASTERN REGION Harvest There was a 59% decrease in the regional rabbit harvest from the previous year’s total as well as a 82% decrease from the 10-year average. The number of hunters in 2011 was also down 52% from the previous year. The reported harvest of Pygmy rabbits was higher this year; however, the White-tailed jackrabbit reported harvest decreased in the Eastern Region counties compared to the previous year.
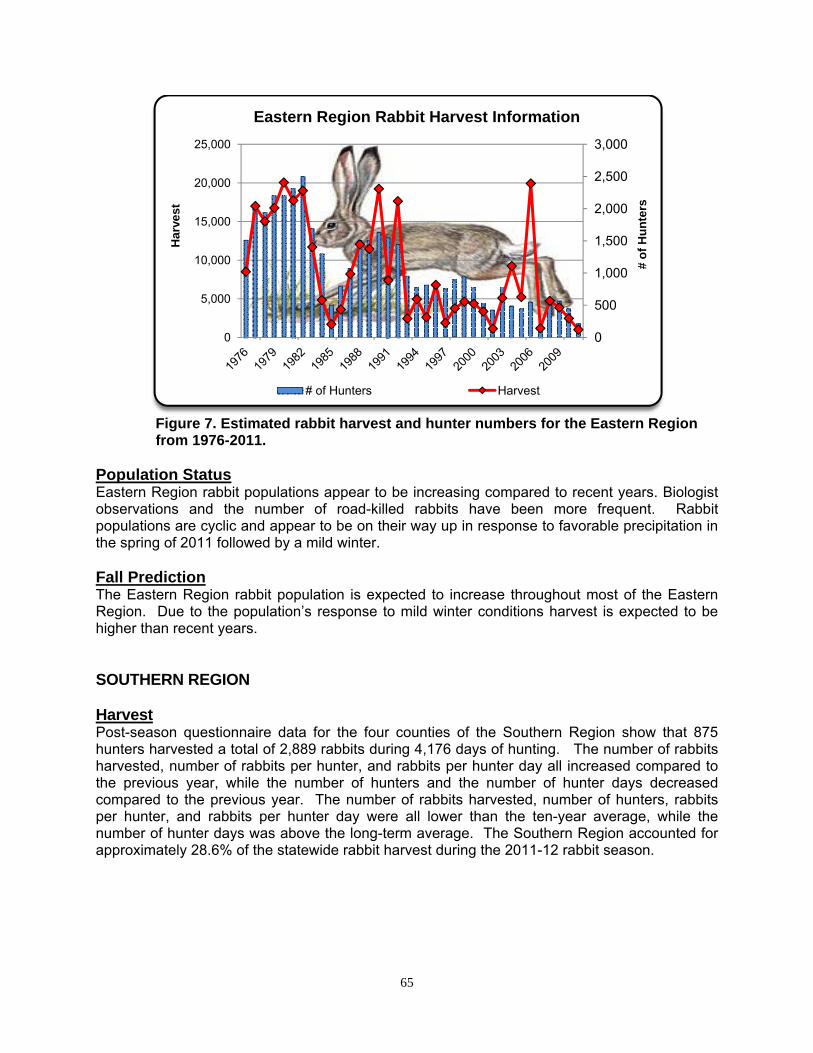
65
Figure 7. Estimated rabbit harvest and hunter numbers for the Eastern Region from 1976-2011.
Population Status Eastern Region rabbit populations appear to be increasing compared to recent years. Biologist observations and the number of road-killed rabbits have been more frequent. Rabbit populations are cyclic and appear to be on their way up in response to favorable precipitation in the spring of 2011 followed by a mild winter. Fall Prediction The Eastern Region rabbit population is expected to increase throughout most of the Eastern Region. Due to the population’s response to mild winter conditions harvest is expected to be higher than recent years. SOUTHERN REGION Harvest Post-season questionnaire data for the four counties of the Southern Region show that 875 hunters harvested a total of 2,889 rabbits during 4,176 days of hunting. The number of rabbits harvested, number of rabbits per hunter, and rabbits per hunter day all increased compared to the previous year, while the number of hunters and the number of hunter days decreased compared to the previous year. The number of rabbits harvested, number of hunters, rabbits per hunter, and rabbits per hunter day were all lower than the ten-year average, while the number of hunter days was above the long-term average. The Southern Region accounted for approximately 28.6% of the statewide rabbit harvest during the 2011-12 rabbit season.
0
500
1,000
1,500
2,000
2,500
3,000
0
5,000
10,000
15,000
20,000
25,000
# o
f H
un
ters
Har
vest
Eastern Region Rabbit Harvest Information
# of Hunters Harvest
66
Table 15. SOUTHERN REGION RABBIT HARVEST Post-season Questionnaire Data REGIONAL TOTALS: Percent Change
2010-11 2011-12 AVG. PRE. YR.10 YR. AVG.
No. of Rabbits 2,889 3192 4,857 10.5% -34.3% No. of Hunters 875 662 812 -24.3% -18.5% No. of Days 4,176 4119 3,846 -1.4% 7.1% Rabbits / Hunter 3.30 4.82 7.2 46.0% -32.7% Rabbits/Hunter Day 0.70 0.77 1.4 12.0% -44.4%
Population Status The Southern Region rabbit population appears to stable at low population levels. One rabbit transect was driven in 2012 and resulted in 18 rabbits being observed along the 21 mile transect. This resulted in 0.9 rabbits being observed per mile, which is up from 2011, but still indicates rabbits are at low population levels. Rabbit populations are generally subject to cyclical changes which are normal to most populations of lagomorphs. Fall Prediction According to the WRCC Weather Data, precipitation in southeastern Nevada is 112% of average. Below-average precipitation during the winter of 2011-12 combined with below average precipitation during the spring of 2012 probably resulted in unfavorable habitat conditions for rabbits. Above average summer precipitation should result in areas with good range conditions that will benefit rabbits. Cottontail rabbit populations appear to be at low levels, however, most areas should be experiencing low-to-moderate production that will likely lead to little change in harvest from the previous year.
A-1
APPENDIX I INDEX TO TABLES
Table Name Page
Upland Game Summary of Upland Game Harvest 1967‐2011 ..................................................................................A‐2, A‐3 Summary of Statewide Turkey Harvest – Spring 2012 .......................................................................A‐4 Summary of Statewide Turkey Harvest 1997‐2012 ............................................................................A‐5
Furbearers Summary of Statewide Fur Harvest 1970‐2012 .................................................................................A‐6 Summary of Fur Harvest by County 2011‐2012 .................................................................................A‐7 Summary of Trappers by Species and County 2011‐2012 ..................................................................A‐8 Fur Harvest Value ...............................................................................................................................A‐9
Waterfowl Summary of Statewide Waterfowl Harvest 1970‐2011......................................................................A‐10 Nevada Mid‐winter Waterfowl Inventory Data..................................................................................A‐11 2012 Breeding Waterfowl Habitat Conditions (figure) ......................................................................A‐12
APPENDIX II SMALL GAME QUESTIONNAIRE DATA
Table Name Page 2011 Harvest Questionnaire Data by Species, by County ..................................................................Q‐1


A-2
SUMMARY OF STATEWIDE UPLAND GAME HARVEST 1967-2011 From Post-season Questionnaire
Year Sage
Grouse Hunters
Blue Grouse
Hunters Chukar Partridge
Hunters Hungarian Partridge
Hunters
1967 7,284 4,584 408 564 48,984 8,376 ND ND 1968 11,765 5,499 975 559 78,064 10,047 ND ND 1969 23,270 7,605 767 611 124,353 14,536 ND ND 1970 23,775 9,180 645 570 16,886 18,615 ND ND 1971 20,805 7,845 660 645 155,895 17,127 ND ND 1972 17,686 9,099 1,301 882 75,520 14,116 ND ND 1973 24,930 8,536 2,529 1,237 131,608 13,936 ND ND 1974 22,924 9,348 3,409 1,696 161,813 17,952 9,625 2,160 1975 16,376 8,331 2,168 1,534 89,408 14,292 2,671 1,185 1976 13,902 5,977 1,752 1,047 56,440 9,626 2,020 870 1977 7,561 4,230 2,257 1,164 52,245 7,853 1,503 606 1978 17,693 6,647 2,663 1,396 108,775 12,296 2,234 796 1979 28,228 8,090 3,123 1,684 151,270 13,960 2,665 1,042 1980 14,648 5,895 1,824 1,112 218,965 15,481 4,895 1,465 1981 15,522 6,731 2,916 1,560 84,498 11,486 8,671 1,469 1982 13,015 6,150 1,792 1,501 55,454 10,738 2,151 1,257 1983 14,495 6,297 939 1,379 79,222 10,979 2,999 1,105 1984 11,555 5,960 1,183 1,043 52,243 9,264 3,299 1,079 1985 ND ND 1,125 1,063 19,514 6,842 1,271 484 1986 3,967 2,361 1,897 950 43,555 9,325 1,802 774 1987 9,104 3,866 1,694 1,063 52,640 10,200 2,609 983 1988 7,564 3,722 1,856 1,317 101,194 13,065 3,888 1,260 1989 9,445 4,320 2,303 1,225 82,464 14,545 1,655 847 1990 13,697 5,331 2,357 1,291 75,834 10,941 3,829 1,247 1991 13,371 5,564 1,161 1,285 46,700 11,364 1,526 858 1992 12,871 5,126 3,179 1,422 46,780 9,206 750 489 1993 9,782 4,352 1,490 1,141 24,232 7,519 368 377 1994 9,004 4,238 847 796 28,563 6,871 938 275 1995 7,529 4,042 1,606 1,127 62,009 11,613 1,985 658 1996 8,111 3,906 1,969 919 61,972 11,041 1,455 760 1997 5,125 3,471 1,105 1,113 36,950 9,178 1,055 480 1998 5,723 3,277 1,550 857 62,289 10,742 2,830 750 1999 6,070 3,097 1,702 997 105,655 15,586 8,759 2,069 2000 4,728 2,520 925 844 61,310 11,721 4,801 992 2001 2,691 1,708 1,168 666 54,350 8,905 2,223 697 2002 3,940 2,412 1,064 801 72,545 10,722 1,504 789 2003 4,557 2,177 1,305 688 115,738 12,491 2,266 892 2004 5,244 2,194 833 523 76,081 9,134 1,482 523 2005 3,175 1,526 2,046 1,268 120,135 14,727 2,767 1,613 2006 3,701 1,981 2,822 1,987 104,408 15,654 4,334 1,866 2007 4,897 3,197 1,699 1,643 61,153 14,448 1,775 1,114 2008 5,775 3,271 1,936 1,670 61,307 11,735 1,334 1,023 2009 8,944 4,461 2,807 1,878 76,851 14,197 2,272 1,438 2010 7,353 3,827 1,599 1,375 83,660 14,770 3,656 1,300 2011 5,295 2,055 1,084 864 105,047 11,273 3,592 1,095

A-3
SUMMARY OF STATEWIDE UPLAND GAME HARVEST 1967-2011 From Post-season Questionnaire (page 2)
Year Quail Hunters Pheasant Hunters Rabbit Hunters Dove Hunters
1967 73,548 8,040 2,676 2,016 27,048 5,748 155,556 10,4761968 134,002 12,275 2,847 3,159 55,465 8,924 110,253 9,658 1969 107,287 11,396 2,938 2,377 56,660 9,662 170,419 11,1251970 105,646 13,533 4,125 3,555 64,181 12,282 131,290 12,0841971 67,027 9,040 4,357 3,191 49,004 9,387 115,761 10,6081972 37,111 7,636 5,274 3,441 29,682 7,376 119,461 10,1491973 41,696 6,532 5,012 2,887 28,059 6,476 129,945 10,5521974 65,674 8,431 7,188 3,842 45,926 9,124 140,639 11,4871975 104,954 8,790 8,046 4,117 58,573 9,122 147,189 12,2341976 68,629 8,694 5,910 3,469 53,133 8,800 146,586 9,571 1977 71,720 7,825 4,969 2,987 71,898 9,592 125,504 9,802 1978 104,939 9,050 5,322 2,946 99,817 10,491 113,048 9,390 1979 171,972 11,338 6,072 3,139 136,502 11,550 125,462 9,123 1980 138,863 11,128 6,740 3,305 105,671 9,904 143,253 9,843 1981 70,882 9,451 5,424 4,031 62,831 8,871 120,424 8,858 1982 54,397 9,620 3,119 3,325 52,168 9,386 112,810 9,948 1983 88,434 9,575 2,461 2,412 45,344 7,375 117,294 8,248 1984 62,981 8,241 3,110 2,839 40,406 6,961 85,501 8,173 1985 59,756 7,511 2,314 1,928 27,266 5,277 80,974 6,435 1986 49,423 7,384 2,535 1,731 25,709 5,481 69,998 6,123 1987 51,404 6,810 1,703 1,223 33,470 5,745 66,348 5,747 1988 60,398 6,484 2,758 1,359 45,215 6,545 55,454 5,371 1989 30,632 5,125 1,246 1,178 33,341 5,533 52,132 5,459 1990 21,471 4,336 1,058 1,054 38,449 5,298 59,863 5,670 1991 32,791 5,195 1,177 1,373 23,565 5,059 58,503 6,255 1992 34,265 4,966 1,041 1,129 39,893 4,994 49,710 4,804 1993 63,723 5,874 681 952 25,817 4,504 54,929 5,242 1994 52,044 5,798 1,973 1,341 20,035 3,900 68,270 6,112 1995 74,223 7,303 1,117 735 17,962 4,030 61,418 5,790 1996 39,989 5,054 557 556 16,694 3,284 54,291 4,923 1997 35,194 5,569 839 935 11,783 3,446 57,244 5,623 1998 62,619 6,814 1,315 1,047 18,404 3,346 53,138 4,895 1999 54,996 6,909 990 1,058 15,183 3,291 41,068 4,270 2000 34,757 5,782 699 808 12,114 2,659 45,955 4,193 2001 35,718 4,006 1,095 574 12,672 2,247 31,749 3,329 2002 24,420 5,006 1,015 686 7,554 2,085 62,977 5,355 2003 49,422 5,939 1,523 639 14,638 2,734 37,750 4,074 2004 38,353 3,725 783 387 17,604 2,196 34,650 3,434 2005 35,662 3,352 338 227 18,269 1,554 49,795 4,110 2006 38,557 4,022 388 218 38,727 1932 53,851 4,590 2007 44,185 8,403 344 360 4,278 494 2008 53,150 8,262 463 588 15,878 2,691 2009 33,139 4,426 741 798 17,553 3,468 2010 29,976 3,937 722 547 11,805 2,587 2011 38,928 3,076 664 353 11,149 1,920

A-4
NEVADA WILD TURKEY RETURN CARD SUMMARY – SPRING 2012 (STATEWIDE TOTALS)
Hunt Area Tag # Tags # Qstr. % Effort Harvest Chose
Not to Harvest
Weapon Type
Quota Issued Rtnd Rtn # Succ. %Succ. Hunter Days
Scout DNH Tom Jake Lost Archery Shotgun
Elko Co. - Unit 091 5 5 2 40% 0 0% 12 3 0 0 0 0 0 0 0 Elko Co. - Unit 101 5 5 5 100% 2 67% 10 0 2 1 2 0 0 0 2 Elko Co. - Unit 102 & 065 17 17 13 76% 5 42% 55 34 1 5 0 0 0 0 5 Lander Co. - Units 151 & 152 3 3 3 100% 1 33% 31 5 0 1 0 0 1 0 1 Lincoln County 33 33 29 88% 5 19% 74 33 3 2 3 0 2 0 5
Lincoln County (Youth) Ope
n 31 17 55% 1 10% 26 14 7 0 1 0 0 0 1
Pershing County 10 10 10 100% 7 78% 19 27 1 6 1 0 1 1 6 Mason Valley WMA 15 15 15 100% 7 47% 49 16 0 7 0 0 4 1 6 Moapa Valley 9 9 9 100% 9 100% 17 16 0 8 1 1 0 0 9 White Pine Co. - Unit 115 15 15 11 73% 6 55% 64 12 0 4 2 0 2 2 4
Lyon Co. except MVWMA Ope
n 27 7 26% 5 83% 20 22 1 5 0 0 0 0 5
Churchill Co. - Units 181 & 182
Open 0 0 N/A 0 N/A 0 0 0 0 0 0 0 0 0
Paradise Valley Ope
n 32 5 16% 2 50% 16 9 1 1 1 0 0 0 2
TOTALS: 202 126 62% 50 45% 393 191 16 40 11 1 10 4 46
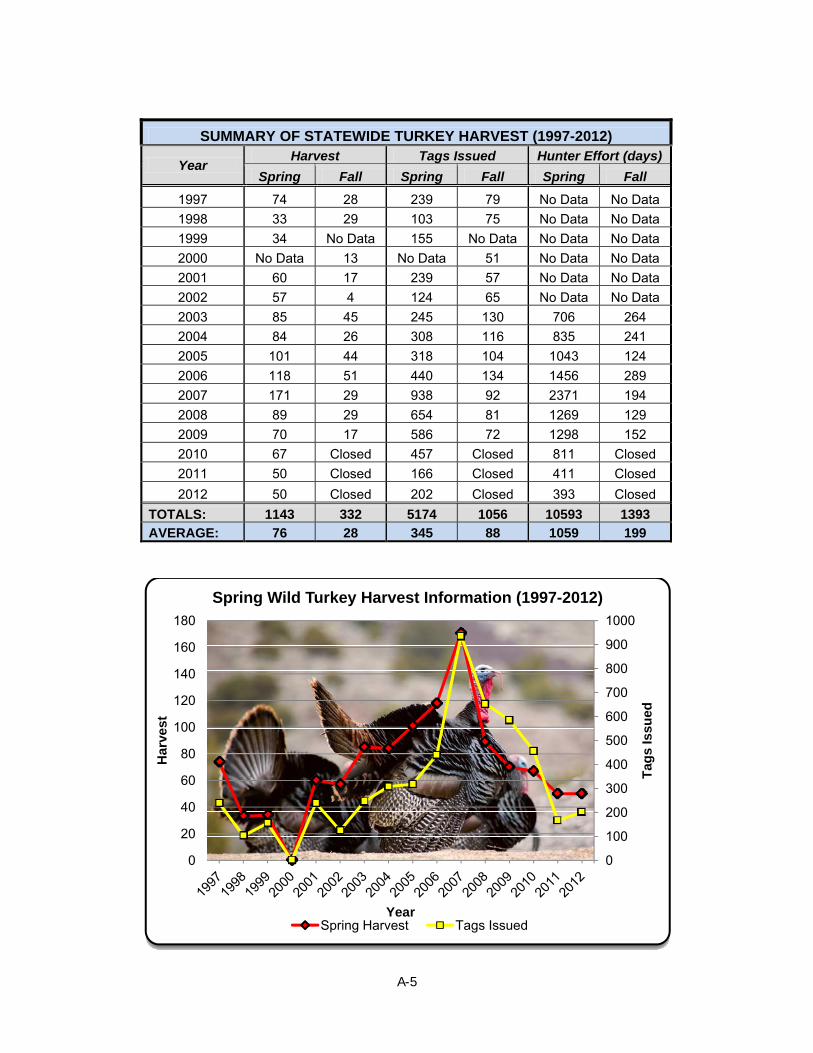
A-5
SUMMARY OF STATEWIDE TURKEY HARVEST (1997-2012)
Year Harvest Tags Issued Hunter Effort (days)
Spring Fall Spring Fall Spring Fall
1997 74 28 239 79 No Data No Data 1998 33 29 103 75 No Data No Data 1999 34 No Data 155 No Data No Data No Data 2000 No Data 13 No Data 51 No Data No Data 2001 60 17 239 57 No Data No Data 2002 57 4 124 65 No Data No Data 2003 85 45 245 130 706 264 2004 84 26 308 116 835 241 2005 101 44 318 104 1043 124 2006 118 51 440 134 1456 289 2007 171 29 938 92 2371 194 2008 89 29 654 81 1269 129 2009 70 17 586 72 1298 152 2010 67 Closed 457 Closed 811 Closed 2011 50 Closed 166 Closed 411 Closed 2012 50 Closed 202 Closed 393 Closed
TOTALS: 1143 332 5174 1056 10593 1393
AVERAGE: 76 28 345 88 1059 199
0
100
200
300
400
500
600
700
800
900
1000
0
20
40
60
80
100
120
140
160
180
Tag
s Is
sued
Har
vest
Year
Spring Wild Turkey Harvest Information (1997-2012)
Spring Harvest Tags Issued

A-6
Year Trappers R-TCat Weasel Beaver Skunk Otter Muskrat Mink Raccoon Kit Fox Gray Fox Red Fox Badger Bobcat Coyote Total Value
1970-71 189 1,005 5 8,677 55 75 361 1,421 1,213 $46,6281971-72 243 1,045 22 18 14,579 26 210 283 34 1,442 1,464 $79,1901972-73 253 1,788 53 23 6,240 63 137 348 226 1,517 2,155 $142,7051973-74 409 10 22 1,890 293 54 6,042 63 170 445 291 2,051 4,125 $290,9571974-75 460 2 5 1,472 213 8 7,946 34 208 126 239 300 1,345 3,730 $173,0411975-76 334 10 2 1,139 153 8 11,365 50 262 72 548 278 1,334 3,008 $339,9981976-77 640 22 9 2,957 179 40 12,966 156 283 537 815 651 1,948 7,718 $742,1711977-78 628 20 14 743 46 11 8,274 98 130 687 865 550 2,814 6,172 $785,5341978-79 1,009 17 14 715 205 12 9,898 115 148 1,173 1,197 750 4,643 8,458 $2,062,6101979-80 2,209 80 25 2,846 396 76 18,946 185 129 2,306 2,119 1,033 5,513 16,229 $1,883,8941980-81 1,567 81 4 2,123 296 46 30,165 245 133 1,103 1,294 589 4,257 10,304 $1,640,9041981-82 1,524 87 12 1,148 209 9 24,227 167 115 865 1,112 536 3,392 14,129 $1,545,1021982-83 1,509 35 0 834 220 7 19,920 143 520 832 937 569 3,786 13,882 $1,499,8081983-84 1,184 49 3 897 209 3 32,128 127 80 914 1,013 362 3,027 10,055 $1,071,4311984-85 1,250 42 10 495 115 5 10,849 24 78 1,205 619 496 3,077 10,306 $1,038,6021985-86 1,051 58 14 1,219 147 0 8,211 100 163 1,373 1,040 353 2,657 6,119 $877,4231986-87 875 28 0 1,722 129 49 14,864 380 106 1,345 767 397 1,305 7,745 $830,1141987-88 875 86 2 675 80 19 12,641 126 108 1,004 630 366 1,458 6,373 $641,4951988-89 512 25 2 367 30 4 2,135 113 52 845 439 141 2,189 2,352 $546,9931989-90 592 29 2 1,020 103 3 149 47 53 397 811 97 2,489 1,717 $336,3941990-91 462 9 1 421 49 0 410 24 14 87 212 55 939 1,252 $122,7671991-92 334 17 1 1,089 118 9 680 80 52 514 443 151 2,476 3,718 $447,1621992-93 488 14 0 254 53 1 100 20 17 488 223 112 1,175 3,746 $176,3541993-94 510 16 0 403 67 8 273 72 56 537 612 233 1,820 4,477 $348,8441994-95 524 25 1 625 45 7 876 116 23 247 354 182 1,270 3,298 $165,3521995-96 373 9 0 398 13 5 1,372 41 14 172 376 53 806 1,791 $157,8611996-97 420 15 2 564 96 8 6,717 75 48 195 498 96 1,509 3,209 $218,4391997-98 482 10 1 780 35 13 9,604 80 62 298 565 58 1,705 2,227 $196,6711998-99 320 7 0 421 21 1 3,415 17 11 154 318 94 899 1,003 $183,2031999-00 382 9 2 544 79 6 3,078 71 46 193 434 91 1,637 1,202 $172,5852000-01 408 12 1 301 32 5 592 22 62 138 448 49 949 1,185 $145,0222001-02 380 8 0 553 71 8 425 33 52 135 497 1 40 1,145 1,071 $229,2842002-03 564 16 0 641 73 13 75 40 105 187 554 2 73 2,198 1,340 $414,8082003-04 580 19 0 666 184 5 546 29 110 414 967 9 256 2,744 2,726 $781,8492004-05 615 7 2 441 74 19 468 45 89 399 536 9 170 2,666 2,003 $644,6882005-06 585 17 1 409 91 7 1,280 33 72 442 720 3 152 3,316 1,776 $1,147,0342006-07 857 11 9 494 295 1 4,546 108 116 516 1,608 12 555 4,911 2,956 $1,248,8732007-08 937 20 3 677 157 2 3,023 29 180 609 1,771 18 269 2,811 3,245 $1,543,8032008-09 1,048 11 1 684 108 5 966 62 172 453 1,172 13 92 2,532 2,425 $726,9012009-10 918 4 11 627 74 5 731 95 114 363 821 4 77 1,240 1,514 $431,4382010-11 868 8 2 515 105 28 2140 125 134 619 715 6 100 2,527 2,147 $1,150,888
2011-12 1,085 36 19 879 204 24 4,047 116 124 963 1,760 44 175 3,992 3,236 $2,005,276
Average 725 25 5 916 125 14 7,276 87 115 603 750 11 272 2,308 4,495 $696,050
Summary of Statewide Fur HarvestFrom post-Season Questionnaire
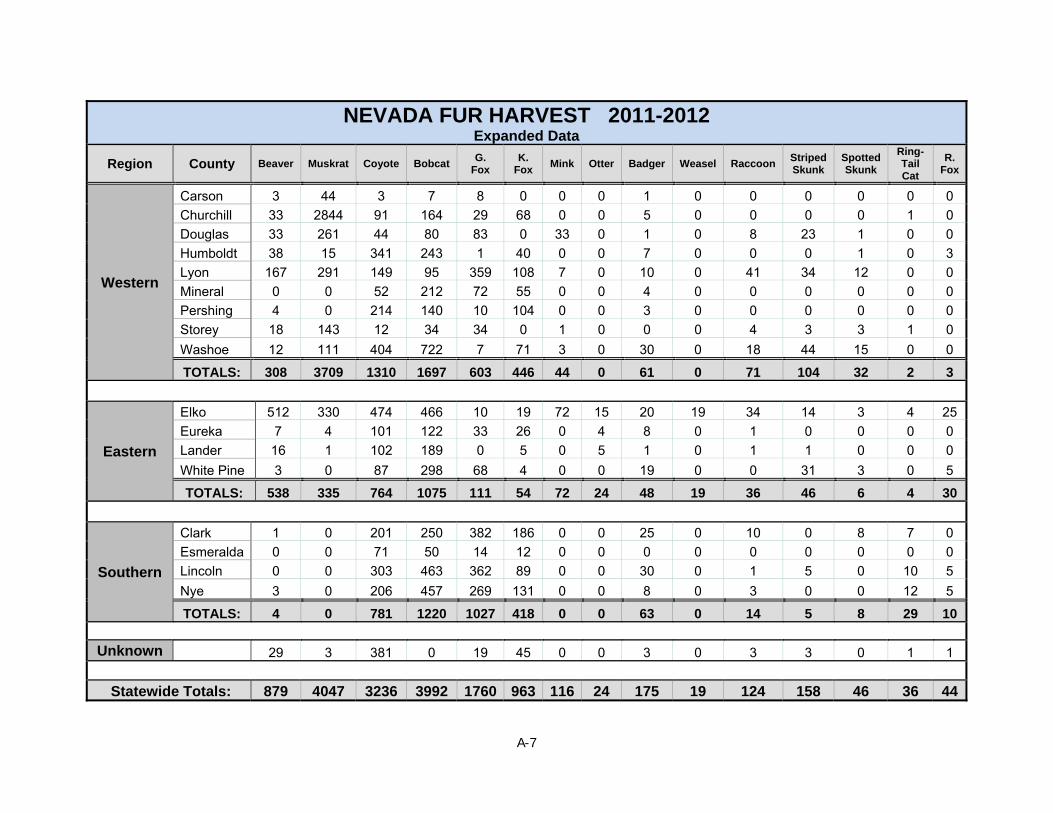
A-7
NEVADA FUR HARVEST 2011-2012 Expanded Data
Region County Beaver Muskrat Coyote Bobcat G.
Fox K.
Fox Mink Otter Badger Weasel Raccoon
Striped Skunk
Spotted Skunk
Ring-Tail Cat
R. Fox
Western
Carson 3 44 3 7 8 0 0 0 1 0 0 0 0 0 0 Churchill 33 2844 91 164 29 68 0 0 5 0 0 0 0 1 0 Douglas 33 261 44 80 83 0 33 0 1 0 8 23 1 0 0 Humboldt 38 15 341 243 1 40 0 0 7 0 0 0 1 0 3 Lyon 167 291 149 95 359 108 7 0 10 0 41 34 12 0 0 Mineral 0 0 52 212 72 55 0 0 4 0 0 0 0 0 0 Pershing 4 0 214 140 10 104 0 0 3 0 0 0 0 0 0 Storey 18 143 12 34 34 0 1 0 0 0 4 3 3 1 0 Washoe 12 111 404 722 7 71 3 0 30 0 18 44 15 0 0
TOTALS: 308 3709 1310 1697 603 446 44 0 61 0 71 104 32 2 3
Eastern
Elko 512 330 474 466 10 19 72 15 20 19 34 14 3 4 25 Eureka 7 4 101 122 33 26 0 4 8 0 1 0 0 0 0 Lander 16 1 102 189 0 5 0 5 1 0 1 1 0 0 0 White Pine 3 0 87 298 68 4 0 0 19 0 0 31 3 0 5
TOTALS: 538 335 764 1075 111 54 72 24 48 19 36 46 6 4 30
Southern
Clark 1 0 201 250 382 186 0 0 25 0 10 0 8 7 0 Esmeralda 0 0 71 50 14 12 0 0 0 0 0 0 0 0 0 Lincoln 0 0 303 463 362 89 0 0 30 0 1 5 0 10 5 Nye 3 0 206 457 269 131 0 0 8 0 3 0 0 12 5
TOTALS: 4 0 781 1220 1027 418 0 0 63 0 14 5 8 29 10
Unknown 29 3 381 0 19 45 0 0 3 0 3 3 0 1 1
Statewide Totals: 879 4047 3236 3992 1760 963 116 24 175 19 124 158 46 36 44
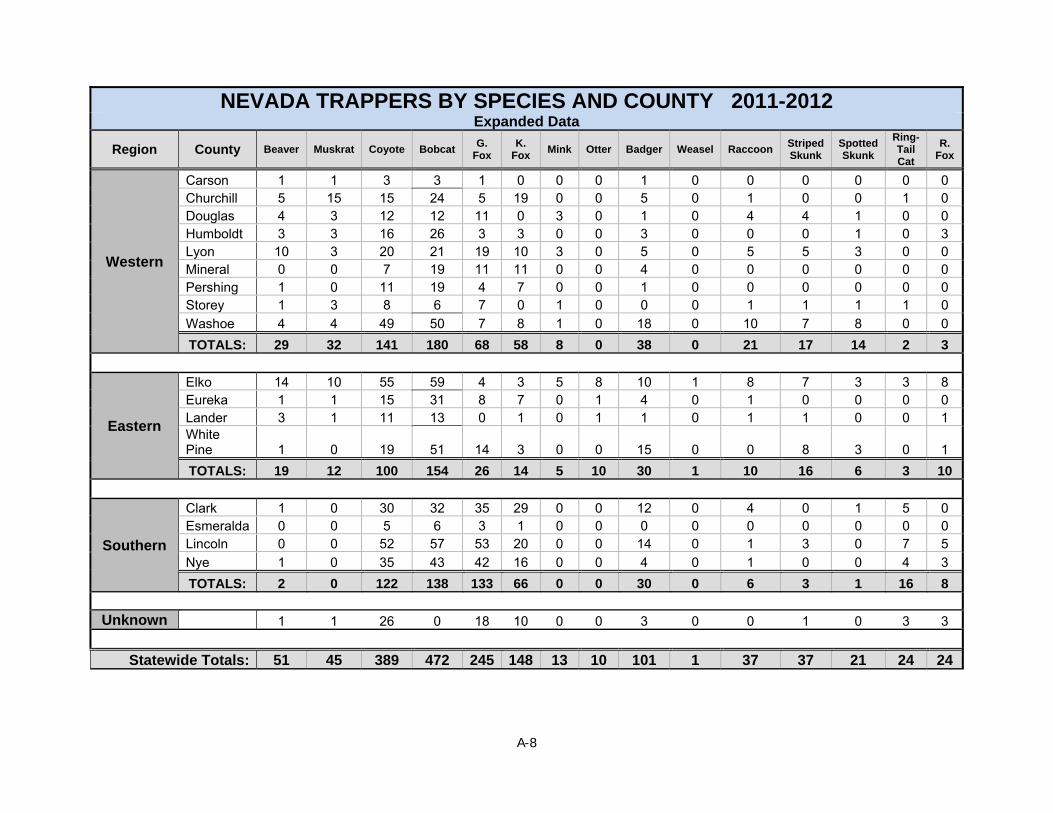
A-8
NEVADA TRAPPERS BY SPECIES AND COUNTY 2011-2012 Expanded Data
Region County Beaver Muskrat Coyote Bobcat G.
Fox K.
Fox Mink Otter Badger Weasel Raccoon
Striped Skunk
Spotted Skunk
Ring-Tail Cat
R. Fox
Western
Carson 1 1 3 3 1 0 0 0 1 0 0 0 0 0 0 Churchill 5 15 15 24 5 19 0 0 5 0 1 0 0 1 0 Douglas 4 3 12 12 11 0 3 0 1 0 4 4 1 0 0 Humboldt 3 3 16 26 3 3 0 0 3 0 0 0 1 0 3 Lyon 10 3 20 21 19 10 3 0 5 0 5 5 3 0 0 Mineral 0 0 7 19 11 11 0 0 4 0 0 0 0 0 0 Pershing 1 0 11 19 4 7 0 0 1 0 0 0 0 0 0 Storey 1 3 8 6 7 0 1 0 0 0 1 1 1 1 0 Washoe 4 4 49 50 7 8 1 0 18 0 10 7 8 0 0 TOTALS: 29 32 141 180 68 58 8 0 38 0 21 17 14 2 3
Eastern
Elko 14 10 55 59 4 3 5 8 10 1 8 7 3 3 8 Eureka 1 1 15 31 8 7 0 1 4 0 1 0 0 0 0 Lander 3 1 11 13 0 1 0 1 1 0 1 1 0 0 1 White Pine 1 0 19 51 14 3 0 0 15 0 0 8 3 0 1 TOTALS: 19 12 100 154 26 14 5 10 30 1 10 16 6 3 10
Southern
Clark 1 0 30 32 35 29 0 0 12 0 4 0 1 5 0 Esmeralda 0 0 5 6 3 1 0 0 0 0 0 0 0 0 0 Lincoln 0 0 52 57 53 20 0 0 14 0 1 3 0 7 5 Nye 1 0 35 43 42 16 0 0 4 0 1 0 0 4 3 TOTALS: 2 0 122 138 133 66 0 0 30 0 6 3 1 16 8
Unknown 1 1 26 0 18 10 0 0 3 0 0 1 0 3 3
Statewide Totals: 51 45 389 472 245 148 13 10 101 1 37 37 21 24 24
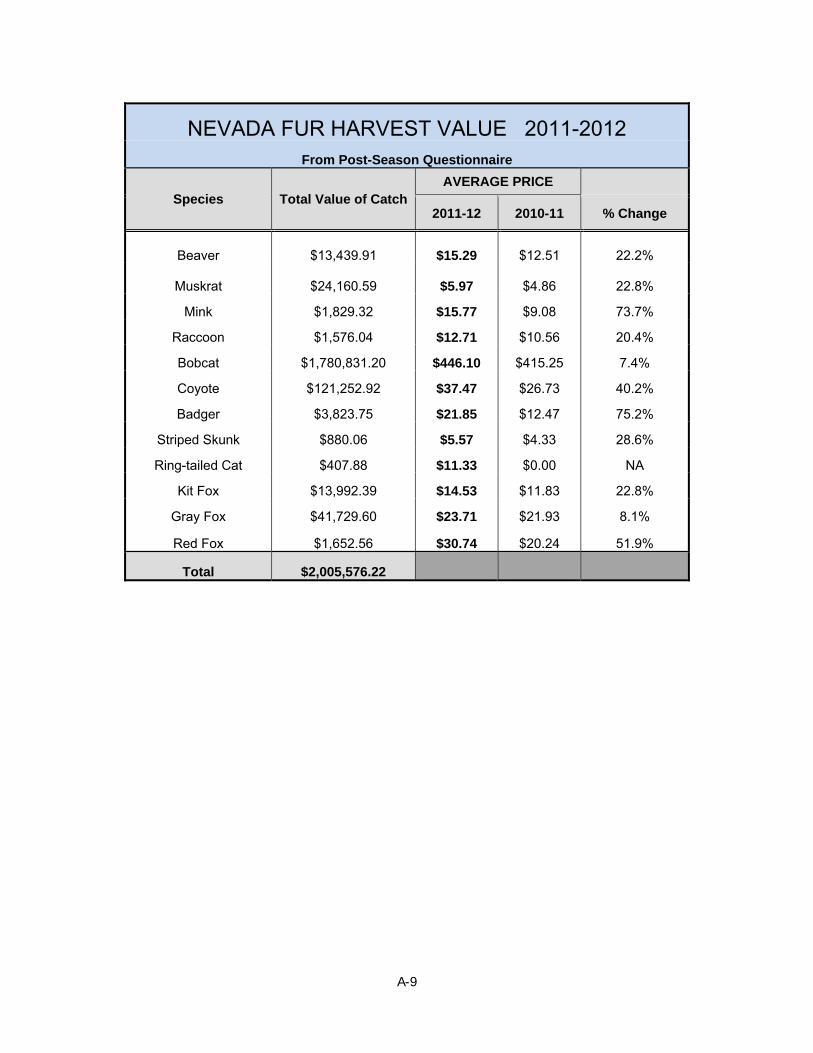
A-9
NEVADA FUR HARVEST VALUE 2011-2012 From Post-Season Questionnaire
Species Total Value of Catch AVERAGE PRICE
2011-12 2010-11 % Change
Beaver $13,439.91 $15.29 $12.51 22.2%
Muskrat $24,160.59 $5.97 $4.86 22.8%
Mink $1,829.32 $15.77 $9.08 73.7%
Raccoon $1,576.04 $12.71 $10.56 20.4%
Bobcat $1,780,831.20 $446.10 $415.25 7.4%
Coyote $121,252.92 $37.47 $26.73 40.2%
Badger $3,823.75 $21.85 $12.47 75.2%
Striped Skunk $880.06 $5.57 $4.33 28.6%
Ring-tailed Cat $407.88 $11.33 $0.00 NA
Kit Fox $13,992.39 $14.53 $11.83 22.8%
Gray Fox $41,729.60 $23.71 $21.93 8.1%
Red Fox $1,652.56 $30.74 $20.24 51.9%
Total $2,005,576.22
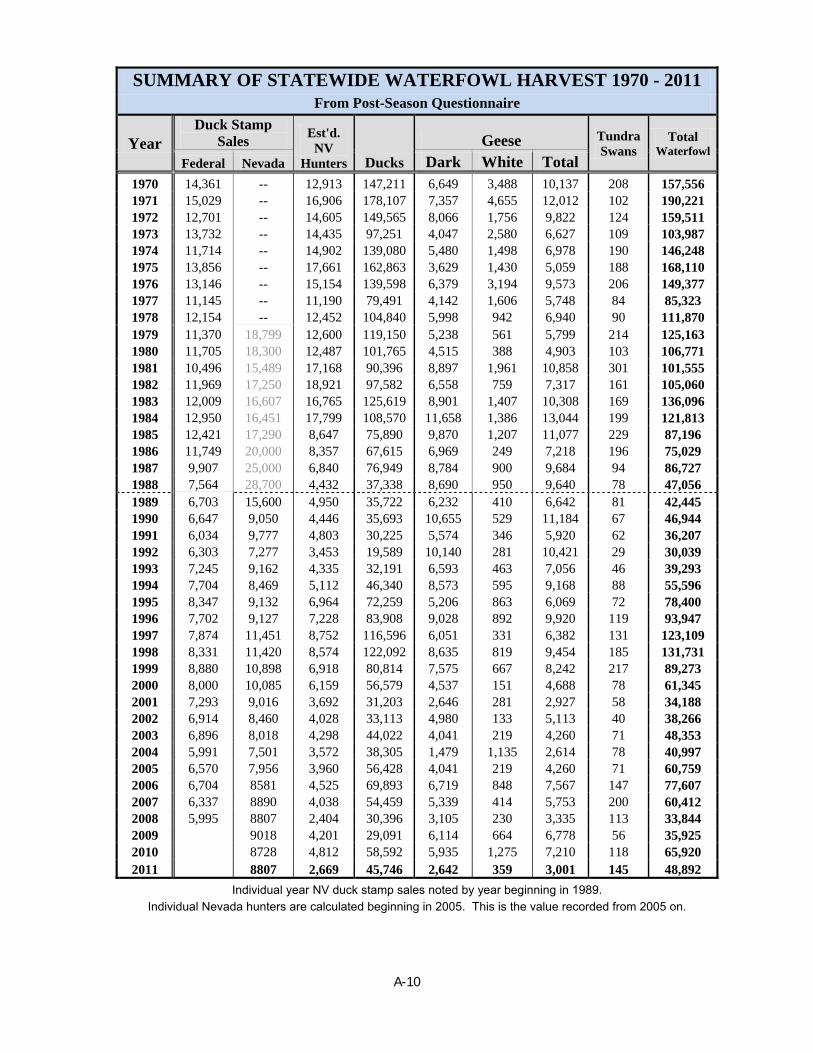
A-10
SUMMARY OF STATEWIDE WATERFOWL HARVEST 1970 - 2011 From Post-Season Questionnaire
Year Duck Stamp
Sales Est'd.
NV Hunters Ducks
Geese Tundra Swans
Total Waterfowl
Federal Nevada Dark White Total 1970 14,361 -- 12,913 147,211 6,649 3,488 10,137 208 157,556 1971 15,029 -- 16,906 178,107 7,357 4,655 12,012 102 190,221 1972 12,701 -- 14,605 149,565 8,066 1,756 9,822 124 159,511 1973 13,732 -- 14,435 97,251 4,047 2,580 6,627 109 103,987 1974 11,714 -- 14,902 139,080 5,480 1,498 6,978 190 146,248 1975 13,856 -- 17,661 162,863 3,629 1,430 5,059 188 168,110 1976 13,146 -- 15,154 139,598 6,379 3,194 9,573 206 149,377 1977 11,145 -- 11,190 79,491 4,142 1,606 5,748 84 85,323 1978 12,154 -- 12,452 104,840 5,998 942 6,940 90 111,870 1979 11,370 18,799 12,600 119,150 5,238 561 5,799 214 125,163 1980 11,705 18,300 12,487 101,765 4,515 388 4,903 103 106,771 1981 10,496 15,489 17,168 90,396 8,897 1,961 10,858 301 101,555 1982 11,969 17,250 18,921 97,582 6,558 759 7,317 161 105,060 1983 12,009 16,607 16,765 125,619 8,901 1,407 10,308 169 136,096 1984 12,950 16,451 17,799 108,570 11,658 1,386 13,044 199 121,813 1985 12,421 17,290 8,647 75,890 9,870 1,207 11,077 229 87,196 1986 11,749 20,000 8,357 67,615 6,969 249 7,218 196 75,029 1987 9,907 25,000 6,840 76,949 8,784 900 9,684 94 86,727 1988 7,564 28,700 4,432 37,338 8,690 950 9,640 78 47,056 1989 6,703 15,600 4,950 35,722 6,232 410 6,642 81 42,445 1990 6,647 9,050 4,446 35,693 10,655 529 11,184 67 46,944 1991 6,034 9,777 4,803 30,225 5,574 346 5,920 62 36,207 1992 6,303 7,277 3,453 19,589 10,140 281 10,421 29 30,0391993 7,245 9,162 4,335 32,191 6,593 463 7,056 46 39,293 1994 7,704 8,469 5,112 46,340 8,573 595 9,168 88 55,596 1995 8,347 9,132 6,964 72,259 5,206 863 6,069 72 78,400 1996 7,702 9,127 7,228 83,908 9,028 892 9,920 119 93,947 1997 7,874 11,451 8,752 116,596 6,051 331 6,382 131 123,109 1998 8,331 11,420 8,574 122,092 8,635 819 9,454 185 131,731 1999 8,880 10,898 6,918 80,814 7,575 667 8,242 217 89,273 2000 8,000 10,085 6,159 56,579 4,537 151 4,688 78 61,345 2001 7,293 9,016 3,692 31,203 2,646 281 2,927 58 34,188 2002 6,914 8,460 4,028 33,113 4,980 133 5,113 40 38,266 2003 6,896 8,018 4,298 44,022 4,041 219 4,260 71 48,353 2004 5,991 7,501 3,572 38,305 1,479 1,135 2,614 78 40,997 2005 6,570 7,956 3,960 56,428 4,041 219 4,260 71 60,759 2006 6,704 8581 4,525 69,893 6,719 848 7,567 147 77,607 2007 6,337 8890 4,038 54,459 5,339 414 5,753 200 60,412 2008 5,995 8807 2,404 30,396 3,105 230 3,335 113 33,844 2009 9018 4,201 29,091 6,114 664 6,778 56 35,925 2010 8728 4,812 58,592 5,935 1,275 7,210 118 65,920 2011 8807 2,669 45,746 2,642 359 3,001 145 48,892
Individual year NV duck stamp sales noted by year beginning in 1989. Individual Nevada hunters are calculated beginning in 2005. This is the value recorded from 2005 on.

A-11
NEVADA MID‐WINTER WATERFOWL INVENTORY DATA
Current year compared to
SPECIES 2007 2008 2009 2010 2011 2012 5 Year 48 Year
Highest Lowest Average Average
Mallard 25,979 28,950 17,326 15,148 19,868 25,213 21,454 14,313 28,950 4,321
Gadwall 4,551 3,055 2,739 1,042 3,253 3,450 2,928 2,919 12,832 550
Widgeon 2,414 820 1,941 1,267 1,534 823 1,595 1,291 4,154 205
G.W. Teal 6,222 3,973 4,601 2,010 7,296 5,405 4,820 6,468 26,150 540
B.W. Teal 0 0 0 0 0 0 0 7 75 0
Cinnamon Teal 0 0 2 55 90 50 29 45 660 0
Shoveler 5,321 5,654 4,679 1,738 8,620 8,543 5,202 3,540 24,700 224
Pintail 11,420 11,360 3,221 1,500 3,290 4,290 6,158 6,196 24,765 446
Wood Duck 10 2 46 35 141 41 47 33 150 0
Redhead 13,330 4,171 2,669 3,595 5,857 8,445 5,924 2,534 13,330 100
Canvasback 7,087 6,484 3,167 5,170 4,920 8,529 5,366 2,944 10,475 233
Scaup 989 262 116 215 222 909 361 248 1,850 10
Ringneck 3,316 2,155 803 728 1,791 849 1,759 817 3,316 13
Goldeneye 661 528 358 357 476 590 476 609 2,093 40
Bufflehead 2,300 1,727 1,480 1,019 1,217 1,525 1,549 896 2,571 153
Ruddy 10,970 5,659 10,432 6,162 9,064 9,656 8,457 4,830 22,532 268
Merganser 868 2,149 1,483 520 558 1,111 1,116 1,682 8,806 241
Miscellaneous 127 82 99 118 32 146 92 53 127 3
Total Ducks 95,565 77,031 55,162 40,679 68,229 79,575 67,333 49,397 128,540 15,739
% Change from Previous Year
4% ‐19% ‐28% ‐26% 68% 17% 18% 61% Dark Geese 24,826 21,590 17,210 17,210 18,070 20,114 19,781 15,660 35,806 3,457
Light Geese 1,578 39 325 325 487 640 551 803 7,678 10
Total Geese 26,404 21,629 17,535 17,535 18,557 20,754 20,332 15,359 33,730 3,651
% Change from Previous Year
43% ‐18% ‐19% 0% 6% 12% 2% 35%
Trumpeter Swan 28 38 31 31 28 9 31 27 60 9
Tundra Swan 2,266 1,191 351 351 606 1,480 953 2,193 10,742 31
Total Waterfowl
124,263 99,889 73,079 58,596 87,420 101,818 88,649 66,975 149,746 22,097
% Change from Previous Year
9% ‐20% ‐27% ‐20% 49% 16% 15% 52%
Coot 33,261 39,330 17,827 43,380 39,130 42,188 34,586 19,985 65,280 3,926

A-12
2012 Breeding Waterfowl Habitat Conditions
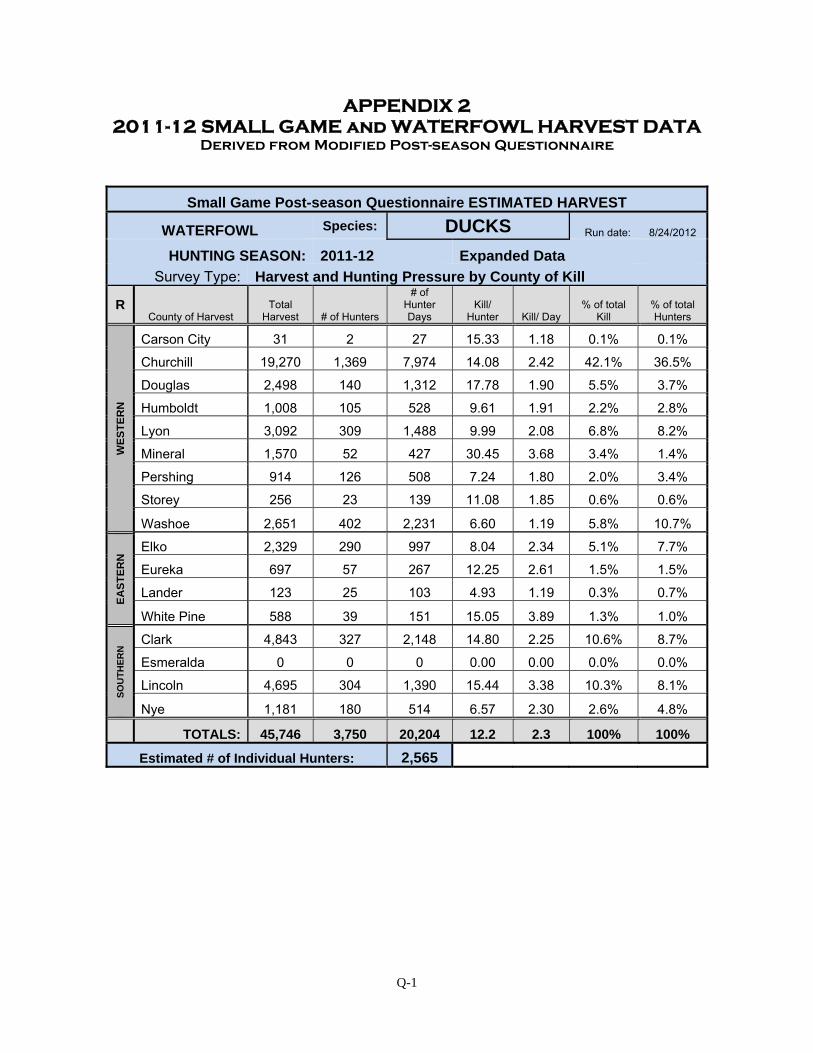
Q-1
APPENDIX 2 2011-12 SMALL GAME and WATERFOWL HARVEST DATA
Derived from Modified Post-season Questionnaire
Small Game Post-season Questionnaire ESTIMATED HARVEST
WATERFOWL Species: DUCKS Run date: 8/24/2012
HUNTING SEASON: 2011-12 Expanded Data Survey Type: Harvest and Hunting Pressure by County of Kill
R County of Harvest
Total Harvest # of Hunters
# of Hunter Days
Kill/ Hunter Kill/ Day
% of total Kill
% of total Hunters
WE
ST
ER
N
Carson City 31 2 27 15.33 1.18 0.1% 0.1%
Churchill 19,270 1,369 7,974 14.08 2.42 42.1% 36.5%
Douglas 2,498 140 1,312 17.78 1.90 5.5% 3.7%
Humboldt 1,008 105 528 9.61 1.91 2.2% 2.8%
Lyon 3,092 309 1,488 9.99 2.08 6.8% 8.2%
Mineral 1,570 52 427 30.45 3.68 3.4% 1.4%
Pershing 914 126 508 7.24 1.80 2.0% 3.4%
Storey 256 23 139 11.08 1.85 0.6% 0.6%
Washoe 2,651 402 2,231 6.60 1.19 5.8% 10.7%
EA
ST
ER
N Elko 2,329 290 997 8.04 2.34 5.1% 7.7%
Eureka 697 57 267 12.25 2.61 1.5% 1.5%
Lander 123 25 103 4.93 1.19 0.3% 0.7%
White Pine 588 39 151 15.05 3.89 1.3% 1.0%
SO
UT
HE
RN
Clark 4,843 327 2,148 14.80 2.25 10.6% 8.7%
Esmeralda 0 0 0 0.00 0.00 0.0% 0.0%
Lincoln 4,695 304 1,390 15.44 3.38 10.3% 8.1%
Nye 1,181 180 514 6.57 2.30 2.6% 4.8%
TOTALS: 45,746 3,750 20,204 12.2 2.3 100% 100%
Estimated # of Individual Hunters: 2,565

Q-2
NEVADA DEPARTMENT OF WILDLIFE
Small Game Post-season Questionnaire ESTIMATED HARVEST
WATERFOWL Species: DARK GEESE Run date: 8/24/2012
HUNTING SEASON: 2011-12 Expanded Data Survey Type: Harvest and Hunting Pressure by County of Kill
R County of Harvest
Total Harvest # of Hunters
# of Hunter Days
Kill/ Hunter Kill/ Day
% of total Kill
% of total Hunters
WE
ST
ER
N
Carson City 0 0 0 0.00 0.00 0.0% 0.0%
Churchill 656 363 2,260 1.81 0.29 24.8% 32.3%
Douglas 437 82 645 5.35 0.68 16.6% 7.3%
Humboldt 94 39 162 2.41 0.58 3.6% 3.5%
Lyon 517 197 624 2.62 0.83 19.6% 17.6%
Mineral 11 5 92 2.00 0.12 0.4% 0.5%
Pershing 94 36 217 2.65 0.43 3.6% 3.2%
Storey 20 7 36 2.75 0.55 0.7% 0.6%
Washoe 185 116 768 1.60 0.24 7.0% 10.3%
EA
ST
ER
N Elko 199 84 313 2.38 0.64 7.5% 7.4%
Eureka 132 32 169 4.11 0.78 5.0% 2.8%
Lander 36 18 92 2.00 0.38 1.3% 1.6%
White Pine 14 12 18 1.14 0.80 0.5% 1.1%
SO
UT
HE
RN
Clark 142 69 533 2.05 0.27 5.4% 6.2%
Esmeralda 0 0 0 0.00 0.00 0.0% 0.0%
Lincoln 94 44 149 2.12 0.63 3.6% 4.0%
Nye 11 20 64 0.55 0.17 0.4% 1.7%
TOTALS: 2,642 1,124 6,143 2.35 0.43 100% 100%
Estimated # of Individual Hunters: 932
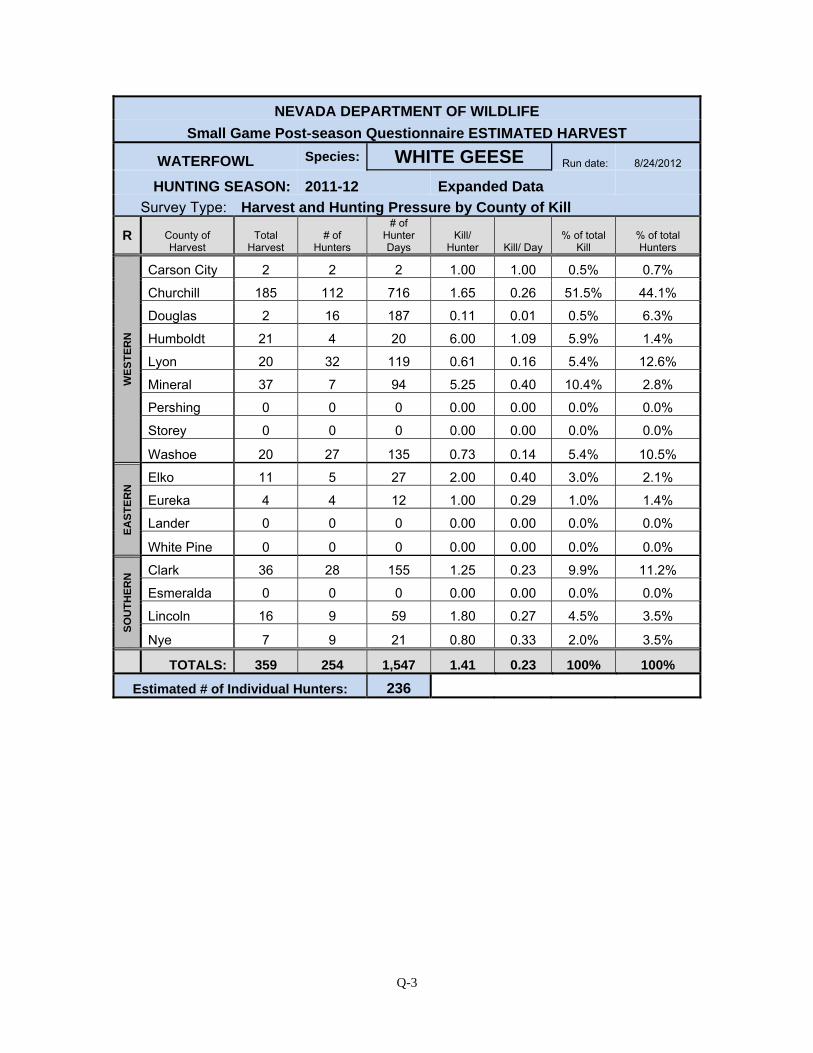
Q-3
NEVADA DEPARTMENT OF WILDLIFE
Small Game Post-season Questionnaire ESTIMATED HARVEST
WATERFOWL Species: WHITE GEESE Run date: 8/24/2012
HUNTING SEASON: 2011-12 Expanded Data Survey Type: Harvest and Hunting Pressure by County of Kill
R County of Harvest
Total Harvest
# of Hunters
# of Hunter Days
Kill/ Hunter Kill/ Day
% of total Kill
% of total Hunters
WE
ST
ER
N
Carson City 2 2 2 1.00 1.00 0.5% 0.7%
Churchill 185 112 716 1.65 0.26 51.5% 44.1%
Douglas 2 16 187 0.11 0.01 0.5% 6.3%
Humboldt 21 4 20 6.00 1.09 5.9% 1.4%
Lyon 20 32 119 0.61 0.16 5.4% 12.6%
Mineral 37 7 94 5.25 0.40 10.4% 2.8%
Pershing 0 0 0 0.00 0.00 0.0% 0.0%
Storey 0 0 0 0.00 0.00 0.0% 0.0%
Washoe 20 27 135 0.73 0.14 5.4% 10.5%
EA
ST
ER
N Elko 11 5 27 2.00 0.40 3.0% 2.1%
Eureka 4 4 12 1.00 0.29 1.0% 1.4%
Lander 0 0 0 0.00 0.00 0.0% 0.0%
White Pine 0 0 0 0.00 0.00 0.0% 0.0%
SO
UT
HE
RN
Clark 36 28 155 1.25 0.23 9.9% 11.2%
Esmeralda 0 0 0 0.00 0.00 0.0% 0.0%
Lincoln 16 9 59 1.80 0.27 4.5% 3.5%
Nye 7 9 21 0.80 0.33 2.0% 3.5%
TOTALS: 359 254 1,547 1.41 0.23 100% 100%
Estimated # of Individual Hunters: 236

Q-4
NEVADA DEPARTMENT OF WILDLIFE
Small Game Post-season Questionnaire ESTIMATED HARVEST
WATERFOWL Species: COOT Run date: 8/24/2012
HUNTING SEASON: 2011-12 Expanded Data Survey Type: Harvest and Hunting Pressure by County of Kill
R County of Harvest
Total Harvest # of Hunters
# of Hunter Days
Kill/ Hunter Kill/ Day
% of total Kill
% of total Hunters
WE
ST
ER
N
Carson City 0 0 0 0.00 0.00 0.0% 0.0%
Churchill 208 43 145 4.78 1.43 25.6% 28.4%
Douglas 36 11 23 3.17 1.58 4.4% 7.4%
Humboldt 0 0 0 0.00 0.00 0.0% 0.0%
Lyon 53 13 96 4.00 0.55 6.5% 8.6%
Mineral 0 0 0 0.00 0.00 0.0% 0.0%
Pershing 0 0 0 0.00 0.00 0.0% 0.0%
Storey 0 0 0 0.00 0.00 0.0% 0.0%
Washoe 164 21 170 7.91 0.97 20.3% 13.6%
EA
ST
ER
N Elko 21 9 51 2.20 0.41 2.6% 6.2%
Eureka 11 6 13 2.00 0.86 1.4% 3.7%
Lander 0 0 0 0.00 0.00 0.0% 0.0%
White Pine 4 2 2 2.00 2.00 0.5% 1.2%
SO
UT
HE
RN
Clark 272 38 364 7.20 0.75 33.6% 24.7%
Esmeralda 0 0 0 0.00 0.00 0.0% 0.0%
Lincoln 9 2 2 5.00 5.00 1.2% 1.2%
Nye 32 8 19 4.25 1.70 4.0% 4.9%
TOTALS: 810 153 885 5.30 0.91 100% 100%
Estimated # of Individual Hunters: 153
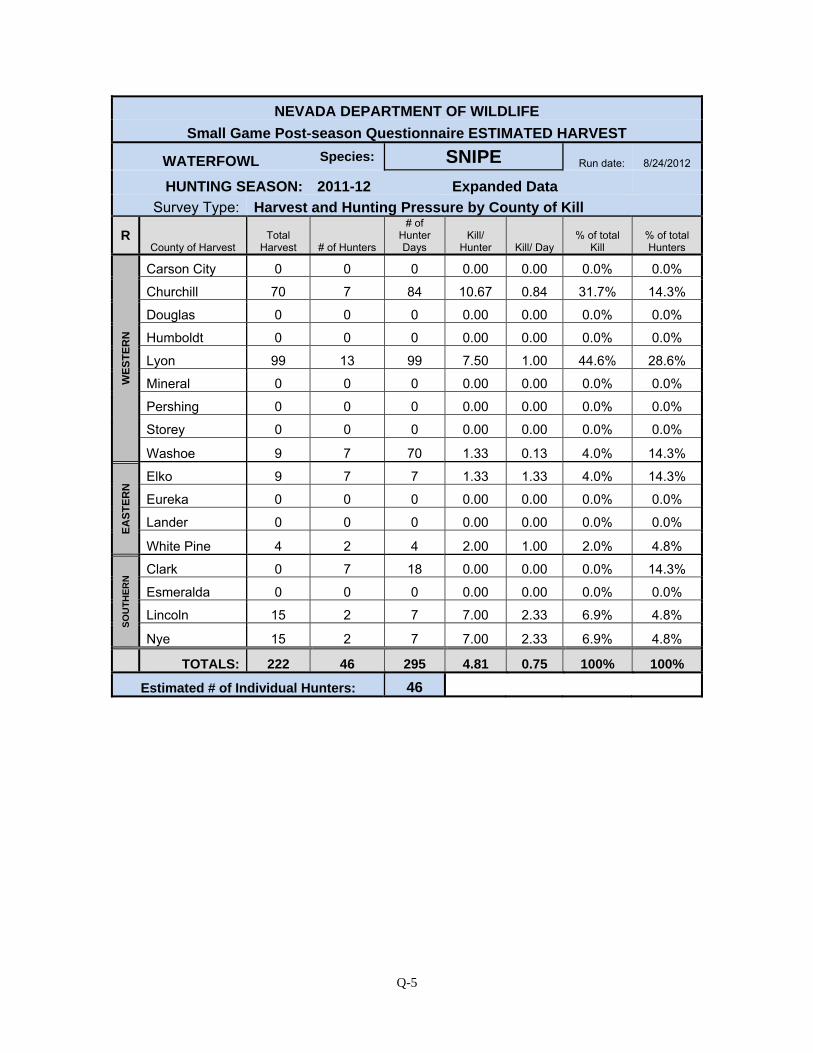
Q-5
NEVADA DEPARTMENT OF WILDLIFE
Small Game Post-season Questionnaire ESTIMATED HARVEST
WATERFOWL Species: SNIPE Run date: 8/24/2012
HUNTING SEASON: 2011-12 Expanded Data Survey Type: Harvest and Hunting Pressure by County of Kill
R County of Harvest
Total Harvest # of Hunters
# of Hunter Days
Kill/ Hunter Kill/ Day
% of total Kill
% of total Hunters
WE
ST
ER
N
Carson City 0 0 0 0.00 0.00 0.0% 0.0%
Churchill 70 7 84 10.67 0.84 31.7% 14.3%
Douglas 0 0 0 0.00 0.00 0.0% 0.0%
Humboldt 0 0 0 0.00 0.00 0.0% 0.0%
Lyon 99 13 99 7.50 1.00 44.6% 28.6%
Mineral 0 0 0 0.00 0.00 0.0% 0.0%
Pershing 0 0 0 0.00 0.00 0.0% 0.0%
Storey 0 0 0 0.00 0.00 0.0% 0.0%
Washoe 9 7 70 1.33 0.13 4.0% 14.3%
EA
ST
ER
N Elko 9 7 7 1.33 1.33 4.0% 14.3%
Eureka 0 0 0 0.00 0.00 0.0% 0.0%
Lander 0 0 0 0.00 0.00 0.0% 0.0%
White Pine 4 2 4 2.00 1.00 2.0% 4.8%
SO
UT
HE
RN
Clark 0 7 18 0.00 0.00 0.0% 14.3%
Esmeralda 0 0 0 0.00 0.00 0.0% 0.0%
Lincoln 15 2 7 7.00 2.33 6.9% 4.8%
Nye 15 2 7 7.00 2.33 6.9% 4.8%
TOTALS: 222 46 295 4.81 0.75 100% 100%
Estimated # of Individual Hunters: 46
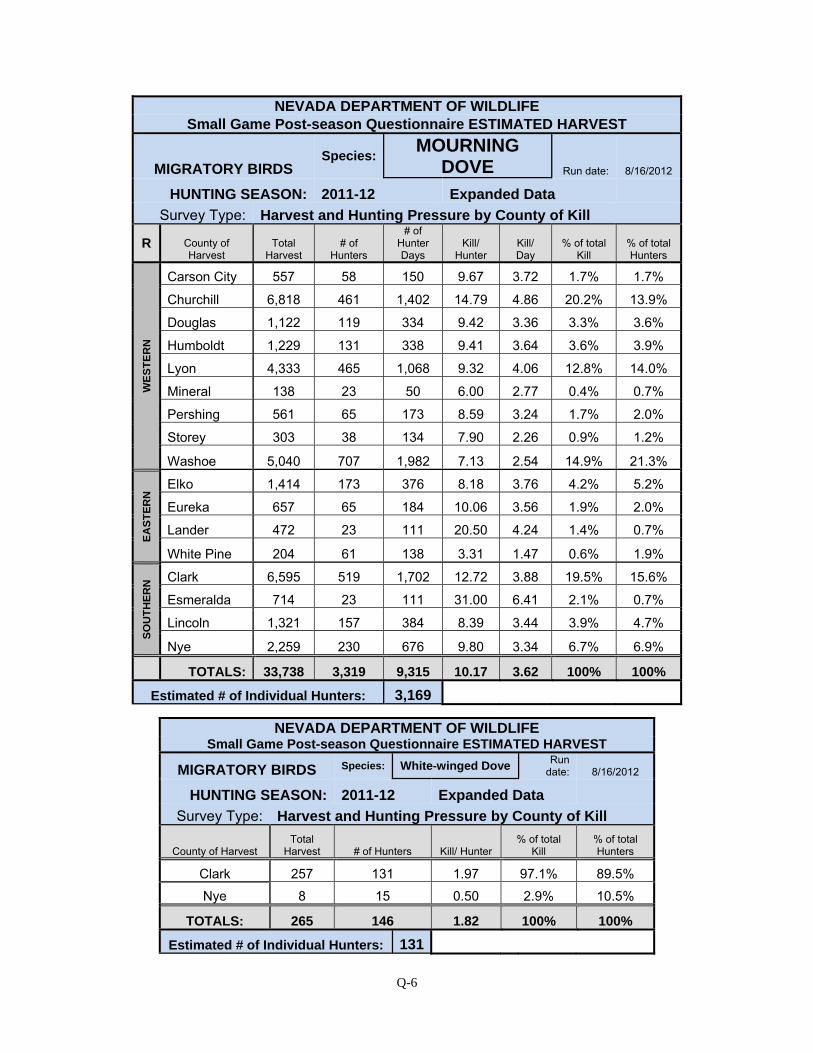
Q-6
NEVADA DEPARTMENT OF WILDLIFE Small Game Post-season Questionnaire ESTIMATED HARVEST
MIGRATORY BIRDS Species:
MOURNING DOVE Run date: 8/16/2012
HUNTING SEASON: 2011-12 Expanded Data
Survey Type: Harvest and Hunting Pressure by County of Kill
R County of Harvest
Total Harvest
# of Hunters
# of Hunter Days
Kill/ Hunter
Kill/ Day
% of total Kill
% of total Hunters
WE
ST
ER
N
Carson City 557 58 150 9.67 3.72 1.7% 1.7%
Churchill 6,818 461 1,402 14.79 4.86 20.2% 13.9%
Douglas 1,122 119 334 9.42 3.36 3.3% 3.6%
Humboldt 1,229 131 338 9.41 3.64 3.6% 3.9%
Lyon 4,333 465 1,068 9.32 4.06 12.8% 14.0%
Mineral 138 23 50 6.00 2.77 0.4% 0.7%
Pershing 561 65 173 8.59 3.24 1.7% 2.0%
Storey 303 38 134 7.90 2.26 0.9% 1.2%
Washoe 5,040 707 1,982 7.13 2.54 14.9% 21.3%
EA
ST
ER
N Elko 1,414 173 376 8.18 3.76 4.2% 5.2%
Eureka 657 65 184 10.06 3.56 1.9% 2.0%
Lander 472 23 111 20.50 4.24 1.4% 0.7%
White Pine 204 61 138 3.31 1.47 0.6% 1.9%
SO
UT
HE
RN
Clark 6,595 519 1,702 12.72 3.88 19.5% 15.6%
Esmeralda 714 23 111 31.00 6.41 2.1% 0.7%
Lincoln 1,321 157 384 8.39 3.44 3.9% 4.7%
Nye 2,259 230 676 9.80 3.34 6.7% 6.9%
TOTALS: 33,738 3,319 9,315 10.17 3.62 100% 100%
Estimated # of Individual Hunters: 3,169
NEVADA DEPARTMENT OF WILDLIFE Small Game Post-season Questionnaire ESTIMATED HARVEST
MIGRATORY BIRDS Species: White-winged Dove Run date: 8/16/2012
HUNTING SEASON: 2011-12 Expanded Data
Survey Type: Harvest and Hunting Pressure by County of Kill
County of Harvest Total
Harvest # of Hunters Kill/ Hunter % of total
Kill % of total Hunters
Clark 257 131 1.97 97.1% 89.5%
Nye 8 15 0.50 2.9% 10.5%
TOTALS: 265 146 1.82 100% 100%
Estimated # of Individual Hunters: 131
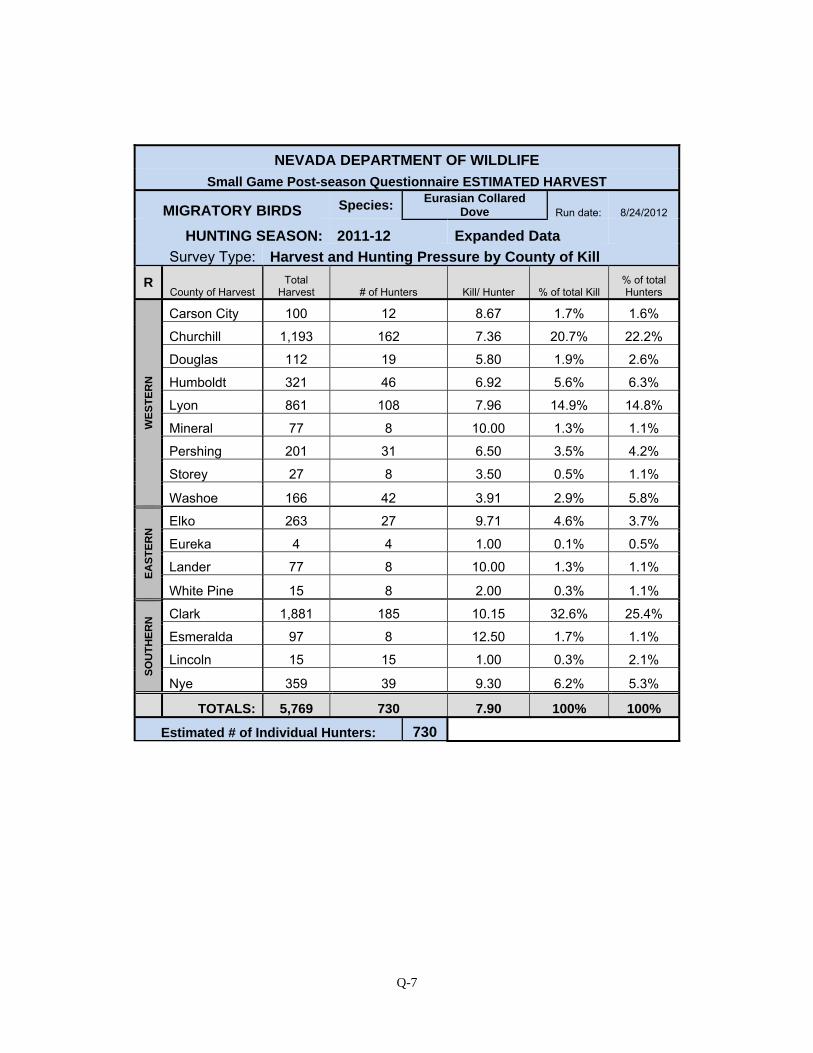
Q-7
NEVADA DEPARTMENT OF WILDLIFE
Small Game Post-season Questionnaire ESTIMATED HARVEST
MIGRATORY BIRDS Species: Eurasian Collared Dove Run date: 8/24/2012
HUNTING SEASON: 2011-12 Expanded Data
Survey Type: Harvest and Hunting Pressure by County of Kill
R County of Harvest
Total Harvest # of Hunters Kill/ Hunter % of total Kill
% of total Hunters
WE
ST
ER
N
Carson City 100 12 8.67 1.7% 1.6%
Churchill 1,193 162 7.36 20.7% 22.2%
Douglas 112 19 5.80 1.9% 2.6%
Humboldt 321 46 6.92 5.6% 6.3%
Lyon 861 108 7.96 14.9% 14.8%
Mineral 77 8 10.00 1.3% 1.1%
Pershing 201 31 6.50 3.5% 4.2%
Storey 27 8 3.50 0.5% 1.1%
Washoe 166 42 3.91 2.9% 5.8%
EA
ST
ER
N Elko 263 27 9.71 4.6% 3.7%
Eureka 4 4 1.00 0.1% 0.5%
Lander 77 8 10.00 1.3% 1.1%
White Pine 15 8 2.00 0.3% 1.1%
SO
UT
HE
RN
Clark 1,881 185 10.15 32.6% 25.4%
Esmeralda 97 8 12.50 1.7% 1.1%
Lincoln 15 15 1.00 0.3% 2.1%
Nye 359 39 9.30 6.2% 5.3%
TOTALS: 5,769 730 7.90 100% 100%
Estimated # of Individual Hunters: 730
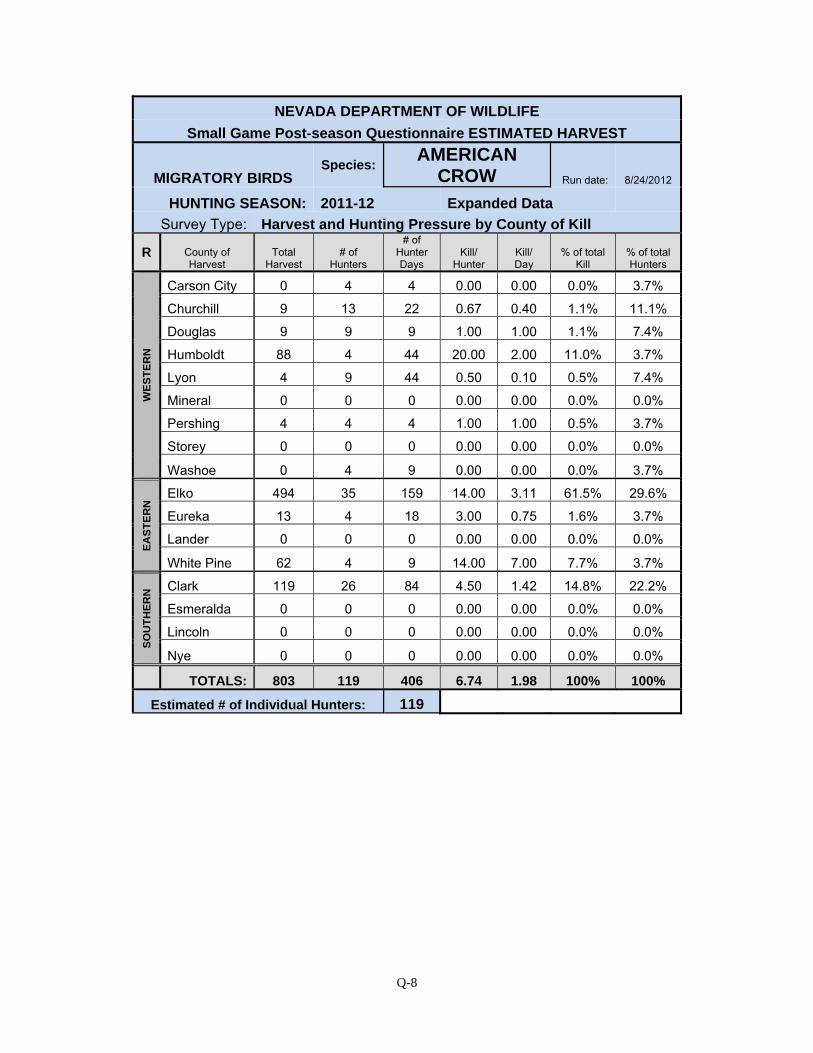
Q-8
NEVADA DEPARTMENT OF WILDLIFE
Small Game Post-season Questionnaire ESTIMATED HARVEST
MIGRATORY BIRDS Species:
AMERICAN CROW Run date: 8/24/2012
HUNTING SEASON: 2011-12 Expanded Data
Survey Type: Harvest and Hunting Pressure by County of Kill
R County of Harvest
Total Harvest
# of Hunters
# of Hunter Days
Kill/ Hunter
Kill/ Day
% of total Kill
% of total Hunters
WE
ST
ER
N
Carson City 0 4 4 0.00 0.00 0.0% 3.7%
Churchill 9 13 22 0.67 0.40 1.1% 11.1%
Douglas 9 9 9 1.00 1.00 1.1% 7.4%
Humboldt 88 4 44 20.00 2.00 11.0% 3.7%
Lyon 4 9 44 0.50 0.10 0.5% 7.4%
Mineral 0 0 0 0.00 0.00 0.0% 0.0%
Pershing 4 4 4 1.00 1.00 0.5% 3.7%
Storey 0 0 0 0.00 0.00 0.0% 0.0%
Washoe 0 4 9 0.00 0.00 0.0% 3.7%
EA
ST
ER
N Elko 494 35 159 14.00 3.11 61.5% 29.6%
Eureka 13 4 18 3.00 0.75 1.6% 3.7%
Lander 0 0 0 0.00 0.00 0.0% 0.0%
White Pine 62 4 9 14.00 7.00 7.7% 3.7%
SO
UT
HE
RN
Clark 119 26 84 4.50 1.42 14.8% 22.2%
Esmeralda 0 0 0 0.00 0.00 0.0% 0.0%
Lincoln 0 0 0 0.00 0.00 0.0% 0.0%
Nye 0 0 0 0.00 0.00 0.0% 0.0%
TOTALS: 803 119 406 6.74 1.98 100% 100%
Estimated # of Individual Hunters: 119

Q-9
NEVADA DEPARTMENT OF WILDLIFE Small Game Post-Season Questionnaire
UPLAND GAME SURVEY SAGE-GROUSE HUNTING SEASON: 2011-12 Expanded Data Survey Type: Upland Game Stamp Holders
Harvest and Hunting Pressure by County of Kill
R County of Kill Total
Harvest# of
Hunters
# of Hunter Days
Kill/ Hunter
Kill/ Day
% of total Kill
% of total
Hunters
WE
ST
ER
N
Carson City 0 0 0 0 0 0% 0%Churchill 215 83 181 2.6 1.2 4% 4%Douglas* 0 0 0 0 0 0% 0%Humboldt 1543 474 1411 3.3 1.1 29% 23%Lyon* 0 0 0 0 0 0% 0%Mineral* 0 0 0 0 0 0% 0%Pershing* 0 0 0 0 0 0% 0%Storey* 0 0 0 0 0 0% 0%Washoe 922 380 1148 2.4 0.8 17% 18%
Western Region Subtotals: 2680 937 2740 2.9 1.0 51% 46%
EA
ST
ER
N Elko 1261 598 1705 2.1 0.7 24% 29%
Eureka 245 128 260 1.9 0.9 5% 6%Lander 557 158 373 3.5 1.5 11% 8%White Pine 252 113 342 2.2 0.7 5% 5%
Eastern Region Subtotals: 2314 997 2680 2.3 0.9 44% 49%
SO
UT
HE
RN
Clark* 0 0 0 0.0 0.0 0% 0%Esmeralda* 0 0 0 0.0 0.0 0% 0%Lincoln* 0 0 0 0.0 0.0 0% 0%Nye 301 120 388 2.5 0.8 6% 6%
Southern Region Subtotals: 301 120 388 2.5 0.8 6% 6%
TOTALS: 5295 2055 5807 2.6 0.9 100% 100%

Q-10
NEVADA DEPARTMENT OF WILDLIFE Small Game Post-season Questionnaire
UPLAND GAME SURVEY BLUE GROUSE HUNTING SEASON: 2011-12 Expanded Data Survey Type: Upland Game Stamp Holders
Harvest and Hunting Pressure by County of Kill
R County of Kill Total
Harvest# of
Hunters
# of Hunter Days
Kill/ Hunter
Kill/ Day
% of total Kill
% of total
Hunters
WE
ST
ER
N
Carson City 83 61 159 1.4 0.5 8% 7%Churchill 0 0 0 0 0 0% 0%Douglas 45 38 87 1.2 0.5 4% 4%Humboldt 0 0 0 0 0 0% 0%Lyon 0 0 0 0 0 0% 0%Mineral 0 0 0 0 0 0% 0%Pershing 0 0 0 0 0 0% 0%Storey 0 0 0 0 0 0% 0%Washoe 254 262 675 1.0 0.4 23% 30%
Western Region Subtotals: 383 360 921 1.1 0.4 35% 42%
EA
ST
ER
N Elko 432 318 853 1.4 0.5 40% 37%
Eureka 15 23 68 0.7 0.2 1% 3%Lander 0 0 0 0 0 0% 0%White Pine 167 110 406 1.5 0.4 15% 13%
Eastern Region Subtotals: 614 451 1327 1.4 0.5 57% 52%
SO
UT
HE
RN
Clark 0 4 45 0.0 0.0 0% 0%Esmeralda 15 8 23 2.0 0.7 1% 1%Lincoln 8 4 4 2.0 2.0 1% 0%Nye 64 38 110 1.7 0.6 6% 4%
Southern Region Subtotals: 87 53 182 1.6 0.5 8% 6%
TOTALS: 1084 864 2430 1.3 0.4 100% 100%
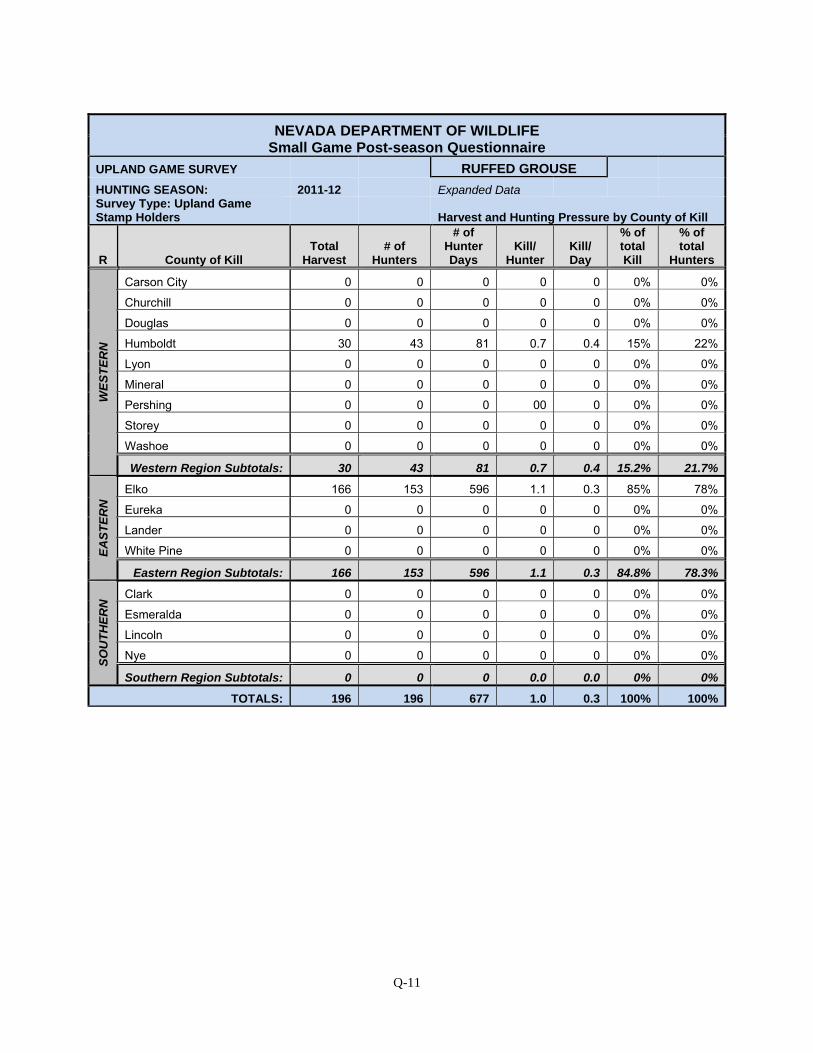
Q-11
NEVADA DEPARTMENT OF WILDLIFE Small Game Post-season Questionnaire
UPLAND GAME SURVEY RUFFED GROUSE
HUNTING SEASON: 2011-12 Expanded Data Survey Type: Upland Game Stamp Holders Harvest and Hunting Pressure by County of Kill
R County of Kill Total
Harvest # of
Hunters
# of Hunter Days
Kill/ Hunter
Kill/ Day
% of total Kill
% of total
Hunters
WE
ST
ER
N
Carson City 0 0 0 0 0 0% 0%
Churchill 0 0 0 0 0 0% 0%
Douglas 0 0 0 0 0 0% 0%
Humboldt 30 43 81 0.7 0.4 15% 22%
Lyon 0 0 0 0 0 0% 0%
Mineral 0 0 0 0 0 0% 0%
Pershing 0 0 0 00 0 0% 0%
Storey 0 0 0 0 0 0% 0%
Washoe 0 0 0 0 0 0% 0%
Western Region Subtotals: 30 43 81 0.7 0.4 15.2% 21.7%
EA
ST
ER
N Elko 166 153 596 1.1 0.3 85% 78%
Eureka 0 0 0 0 0 0% 0%
Lander 0 0 0 0 0 0% 0%
White Pine 0 0 0 0 0 0% 0%
Eastern Region Subtotals: 166 153 596 1.1 0.3 84.8% 78.3%
SO
UT
HE
RN
Clark 0 0 0 0 0 0% 0%
Esmeralda 0 0 0 0 0 0% 0%
Lincoln 0 0 0 0 0 0% 0%
Nye 0 0 0 0 0 0% 0%
Southern Region Subtotals: 0 0 0 0.0 0.0 0% 0%
TOTALS: 196 196 677 1.0 0.3 100% 100%
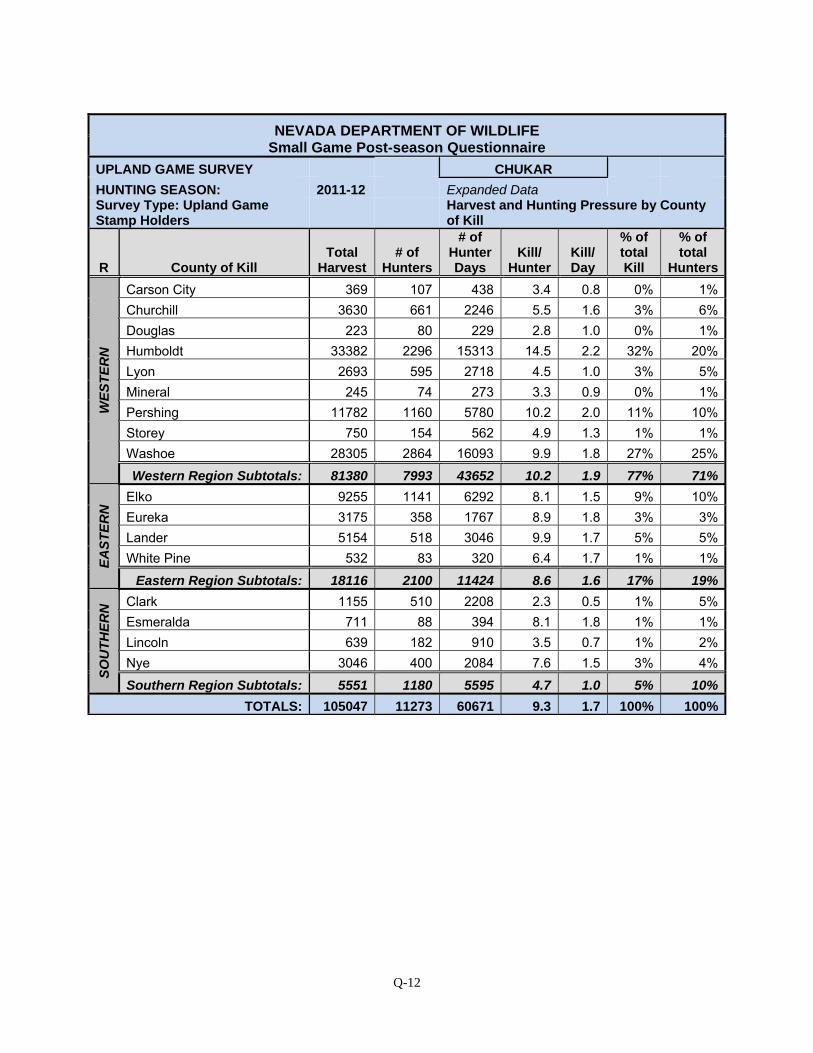
Q-12
NEVADA DEPARTMENT OF WILDLIFE Small Game Post-season Questionnaire
UPLAND GAME SURVEY CHUKAR HUNTING SEASON: 2011-12 Expanded Data Survey Type: Upland Game Stamp Holders
Harvest and Hunting Pressure by County of Kill
R County of Kill Total
Harvest # of
Hunters
# of Hunter Days
Kill/ Hunter
Kill/ Day
% of total Kill
% of total
Hunters
WE
ST
ER
N
Carson City 369 107 438 3.4 0.8 0% 1%Churchill 3630 661 2246 5.5 1.6 3% 6%Douglas 223 80 229 2.8 1.0 0% 1%Humboldt 33382 2296 15313 14.5 2.2 32% 20%Lyon 2693 595 2718 4.5 1.0 3% 5%Mineral 245 74 273 3.3 0.9 0% 1%Pershing 11782 1160 5780 10.2 2.0 11% 10%Storey 750 154 562 4.9 1.3 1% 1%Washoe 28305 2864 16093 9.9 1.8 27% 25%
Western Region Subtotals: 81380 7993 43652 10.2 1.9 77% 71%
EA
ST
ER
N Elko 9255 1141 6292 8.1 1.5 9% 10%
Eureka 3175 358 1767 8.9 1.8 3% 3%Lander 5154 518 3046 9.9 1.7 5% 5%White Pine 532 83 320 6.4 1.7 1% 1%
Eastern Region Subtotals: 18116 2100 11424 8.6 1.6 17% 19%
SO
UT
HE
RN
Clark 1155 510 2208 2.3 0.5 1% 5%Esmeralda 711 88 394 8.1 1.8 1% 1%Lincoln 639 182 910 3.5 0.7 1% 2%Nye 3046 400 2084 7.6 1.5 3% 4%
Southern Region Subtotals: 5551 1180 5595 4.7 1.0 5% 10%
TOTALS: 105047 11273 60671 9.3 1.7 100% 100%
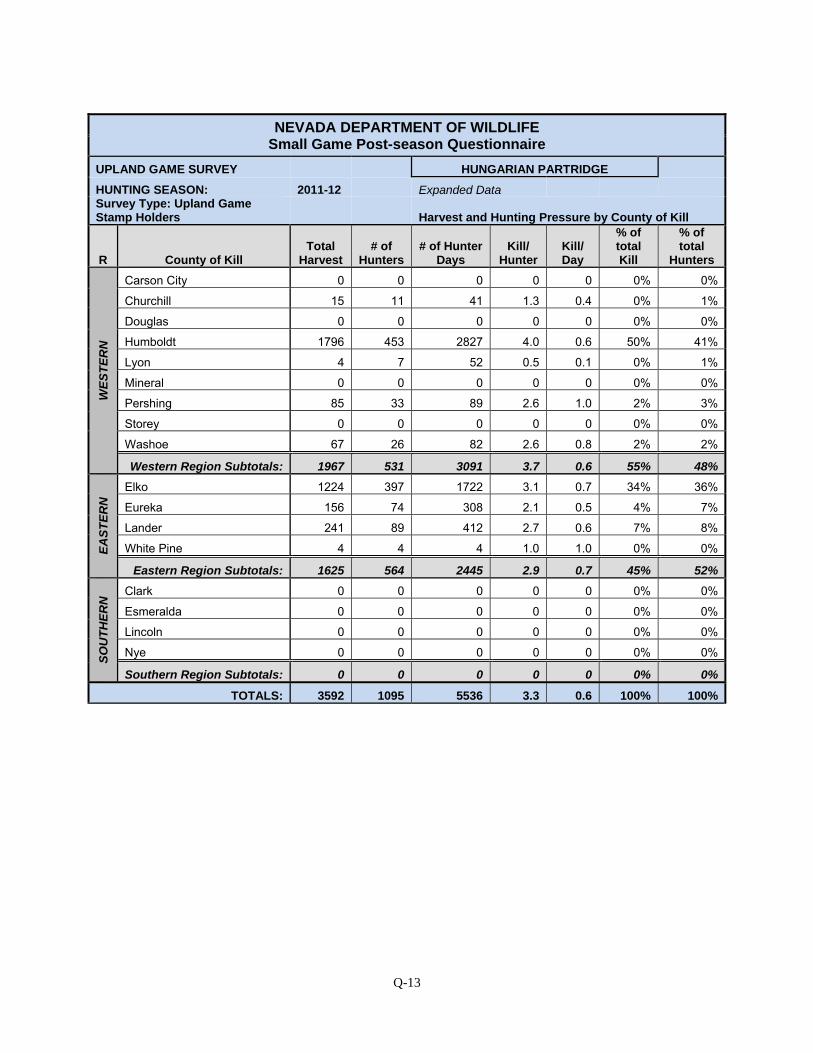
Q-13
NEVADA DEPARTMENT OF WILDLIFE Small Game Post-season Questionnaire
UPLAND GAME SURVEY HUNGARIAN PARTRIDGE
HUNTING SEASON: 2011-12 Expanded Data Survey Type: Upland Game Stamp Holders Harvest and Hunting Pressure by County of Kill
R County of Kill Total
Harvest # of
Hunters # of Hunter
Days Kill/
Hunter Kill/ Day
% of total Kill
% of total
Hunters
WE
ST
ER
N
Carson City 0 0 0 0 0 0% 0%
Churchill 15 11 41 1.3 0.4 0% 1%
Douglas 0 0 0 0 0 0% 0%
Humboldt 1796 453 2827 4.0 0.6 50% 41%
Lyon 4 7 52 0.5 0.1 0% 1%
Mineral 0 0 0 0 0 0% 0%
Pershing 85 33 89 2.6 1.0 2% 3%
Storey 0 0 0 0 0 0% 0%
Washoe 67 26 82 2.6 0.8 2% 2%
Western Region Subtotals: 1967 531 3091 3.7 0.6 55% 48%
EA
ST
ER
N Elko 1224 397 1722 3.1 0.7 34% 36%
Eureka 156 74 308 2.1 0.5 4% 7%
Lander 241 89 412 2.7 0.6 7% 8%
White Pine 4 4 4 1.0 1.0 0% 0%
Eastern Region Subtotals: 1625 564 2445 2.9 0.7 45% 52%
SO
UT
HE
RN
Clark 0 0 0 0 0 0% 0%
Esmeralda 0 0 0 0 0 0% 0%
Lincoln 0 0 0 0 0 0% 0%
Nye 0 0 0 0 0 0% 0%
Southern Region Subtotals: 0 0 0 0 0 0% 0%
TOTALS: 3592 1095 5536 3.3 0.6 100% 100%
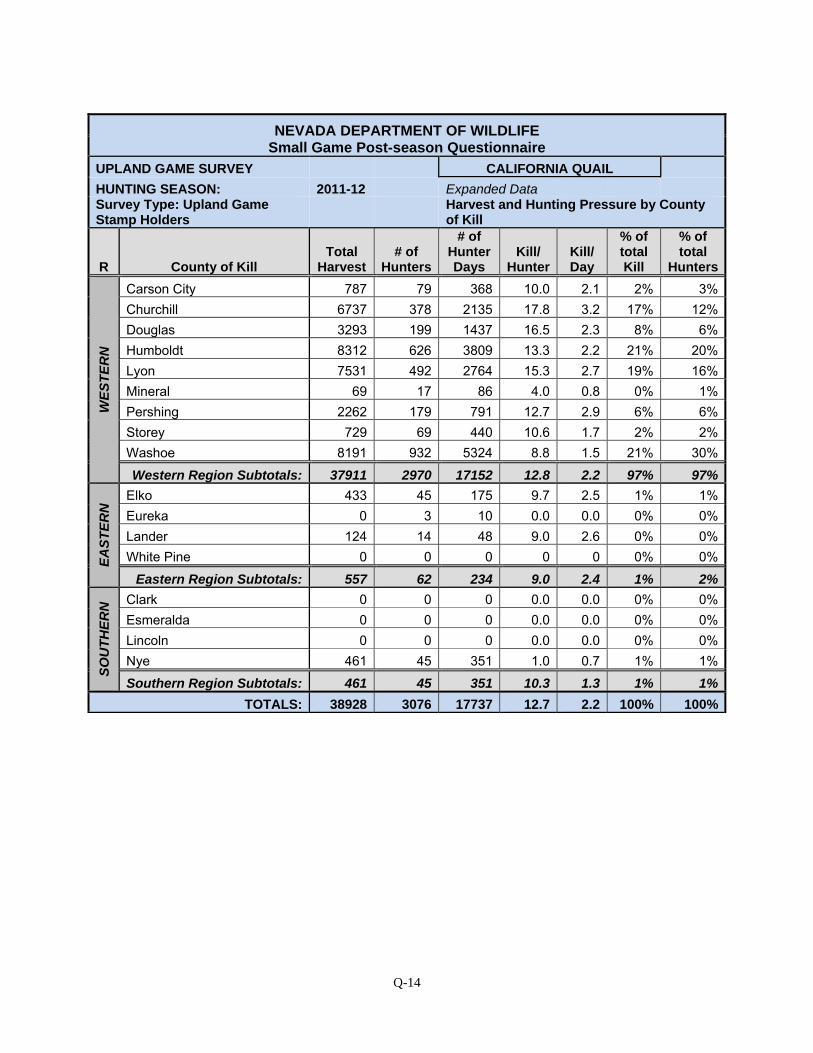
Q-14
NEVADA DEPARTMENT OF WILDLIFE Small Game Post-season Questionnaire
UPLAND GAME SURVEY CALIFORNIA QUAIL
HUNTING SEASON: 2011-12 Expanded Data Survey Type: Upland Game Stamp Holders
Harvest and Hunting Pressure by County of Kill
R County of Kill Total
Harvest # of
Hunters
# of Hunter Days
Kill/ Hunter
Kill/ Day
% of total Kill
% of total
Hunters
WE
ST
ER
N
Carson City 787 79 368 10.0 2.1 2% 3%Churchill 6737 378 2135 17.8 3.2 17% 12%Douglas 3293 199 1437 16.5 2.3 8% 6%Humboldt 8312 626 3809 13.3 2.2 21% 20%Lyon 7531 492 2764 15.3 2.7 19% 16%Mineral 69 17 86 4.0 0.8 0% 1%Pershing 2262 179 791 12.7 2.9 6% 6%Storey 729 69 440 10.6 1.7 2% 2%Washoe 8191 932 5324 8.8 1.5 21% 30%
Western Region Subtotals: 37911 2970 17152 12.8 2.2 97% 97%
EA
ST
ER
N Elko 433 45 175 9.7 2.5 1% 1%
Eureka 0 3 10 0.0 0.0 0% 0%Lander 124 14 48 9.0 2.6 0% 0%White Pine 0 0 0 0 0 0% 0%
Eastern Region Subtotals: 557 62 234 9.0 2.4 1% 2%
SO
UT
HE
RN
Clark 0 0 0 0.0 0.0 0% 0%Esmeralda 0 0 0 0.0 0.0 0% 0%Lincoln 0 0 0 0.0 0.0 0% 0%Nye 461 45 351 1.0 0.7 1% 1%
Southern Region Subtotals: 461 45 351 10.3 1.3 1% 1%
TOTALS: 38928 3076 17737 12.7 2.2 100% 100%
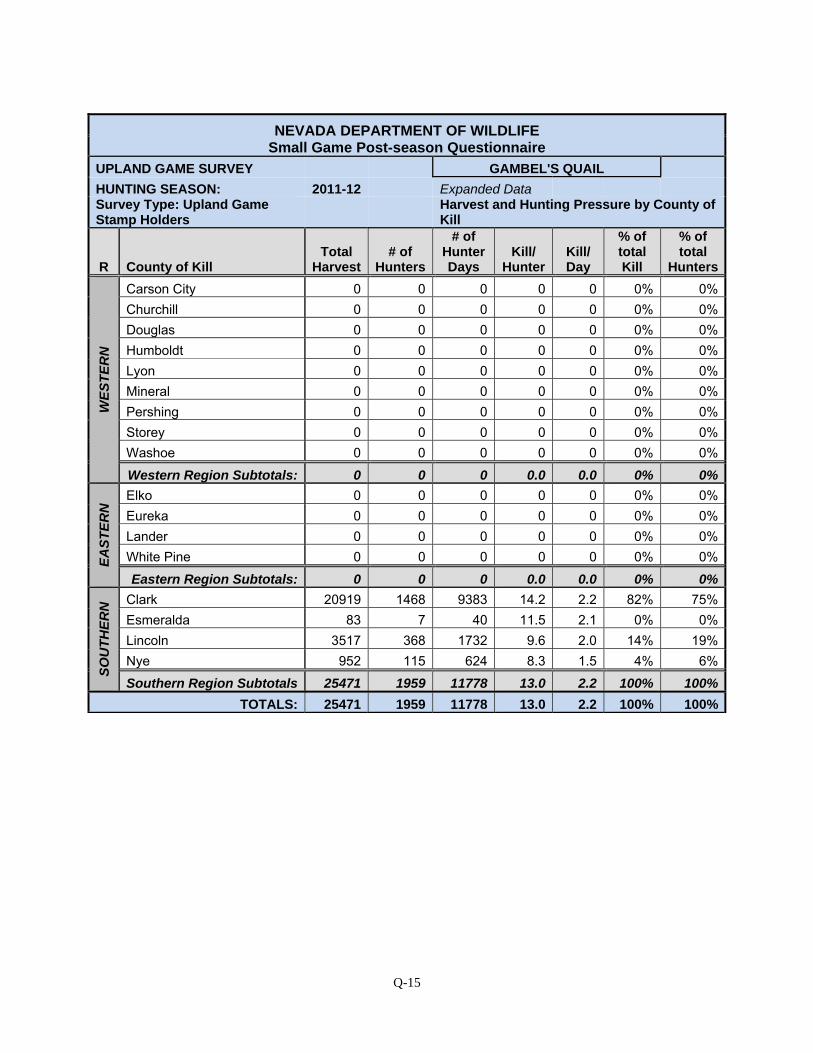
Q-15
NEVADA DEPARTMENT OF WILDLIFE Small Game Post-season Questionnaire
UPLAND GAME SURVEY GAMBEL'S QUAIL HUNTING SEASON: 2011-12 Expanded Data Survey Type: Upland Game Stamp Holders
Harvest and Hunting Pressure by County of Kill
R County of Kill Total
Harvest# of
Hunters
# of Hunter Days
Kill/ Hunter
Kill/ Day
% of total Kill
% of total
Hunters
WE
ST
ER
N
Carson City 0 0 0 0 0 0% 0%Churchill 0 0 0 0 0 0% 0%Douglas 0 0 0 0 0 0% 0%Humboldt 0 0 0 0 0 0% 0%Lyon 0 0 0 0 0 0% 0%Mineral 0 0 0 0 0 0% 0%Pershing 0 0 0 0 0 0% 0%Storey 0 0 0 0 0 0% 0%Washoe 0 0 0 0 0 0% 0%
Western Region Subtotals: 0 0 0 0.0 0.0 0% 0%
EA
ST
ER
N Elko 0 0 0 0 0 0% 0%
Eureka 0 0 0 0 0 0% 0%Lander 0 0 0 0 0 0% 0%White Pine 0 0 0 0 0 0% 0%
Eastern Region Subtotals: 0 0 0 0.0 0.0 0% 0%
SO
UT
HE
RN
Clark 20919 1468 9383 14.2 2.2 82% 75%Esmeralda 83 7 40 11.5 2.1 0% 0%Lincoln 3517 368 1732 9.6 2.0 14% 19%Nye 952 115 624 8.3 1.5 4% 6%
Southern Region Subtotals 25471 1959 11778 13.0 2.2 100% 100%
TOTALS: 25471 1959 11778 13.0 2.2 100% 100%

Q-16
NEVADA DEPARTMENT OF WILDLIFE Small Game Post-season Questionnaire
UPLAND GAME SURVEY MOUNTAIN QUAIL HUNTING SEASON: 2011-12 Expanded Data Survey Type: Upland Game Stamp Holders
Harvest and Hunting Pressure by County of Kill
R County of Kill Total
Harvest# of
Hunters
# of Hunter Days
Kill/ Hunter
Kill/ Day
% of total Kill
% of total
Hunters
WE
ST
ER
N
Carson City 128 19 39 6.6 3.3 15% 5%Churchill 31 39 144 0.8 0.2 4% 10%Douglas 70 50 101 1.4 0.7 8% 14%Humboldt 54 27 81 2.0 0.7 7% 7%Lyon 81 39 93 2.1 0.9 10% 10%Mineral 50 19 78 2.6 0.7 6% 5%Pershing 58 16 70 3.8 0.8 7% 4%Storey 0 0 0 0 0 0% 0%Washoe 272 128 477 2.1 0.6 33% 34%
Western Region Subtotals: 745 338 1083 2.2 0.7 89% 91%
EA
ST
ER
N Elko 31 8 16 4.0 2.0 4% 2%
Eureka 0 0 0 0 0 0% 0%Lander 16 4 16 4.0 1.0 2% 1%White Pine 0 0 0 0 0 0% 0%
Eastern Region Subtotals: 47 12 31 4.0 1.5 6% 3%
SO
UT
HE
RN
Clark 0 0 0 0 0 0% 0%Esmeralda 43 23 58 1.8 0.7 5% 6%Lincoln 0 0 0 0 0 0% 0%Nye 0 0 0 0 0 0% 0%
Southern Region Subtotals: 43 23 58 1.8 0.7 5% 6%
TOTALS: 834 373 1172 2.2 0.7 100% 100%
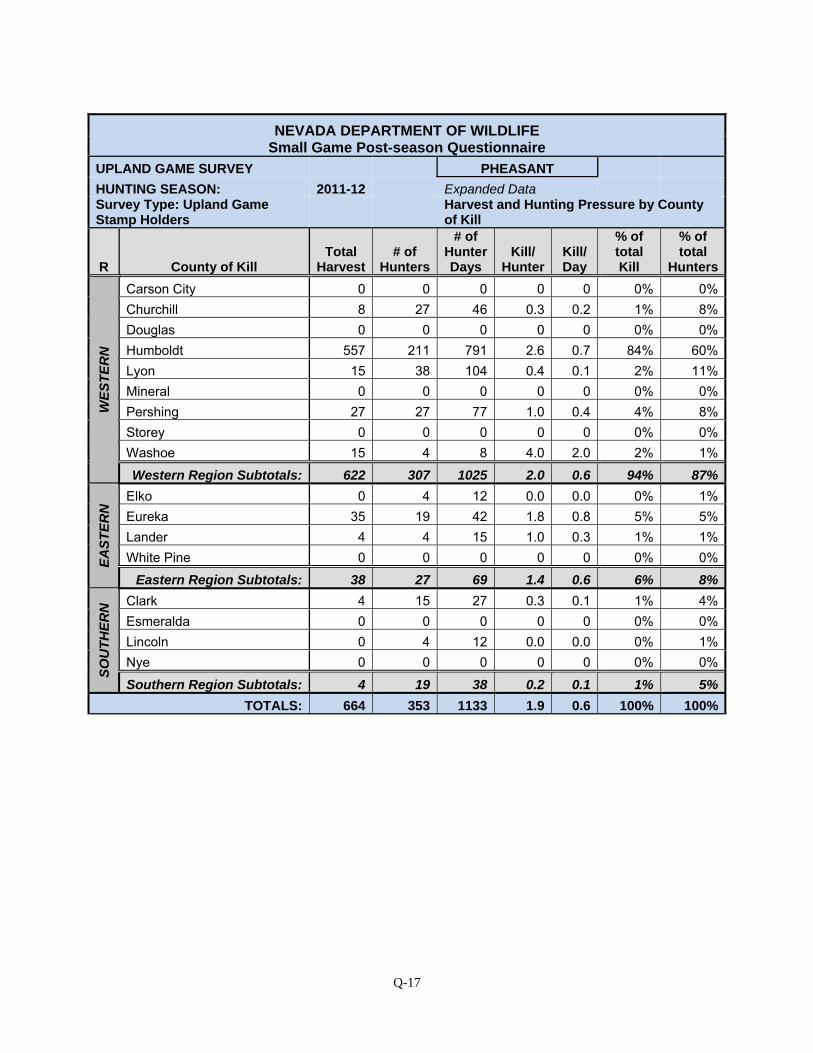
Q-17
NEVADA DEPARTMENT OF WILDLIFE Small Game Post-season Questionnaire
UPLAND GAME SURVEY PHEASANT HUNTING SEASON: 2011-12 Expanded Data Survey Type: Upland Game Stamp Holders
Harvest and Hunting Pressure by County of Kill
R County of Kill Total
Harvest# of
Hunters
# of Hunter Days
Kill/ Hunter
Kill/ Day
% of total Kill
% of total
Hunters
WE
ST
ER
N
Carson City 0 0 0 0 0 0% 0%Churchill 8 27 46 0.3 0.2 1% 8%Douglas 0 0 0 0 0 0% 0%Humboldt 557 211 791 2.6 0.7 84% 60%Lyon 15 38 104 0.4 0.1 2% 11%Mineral 0 0 0 0 0 0% 0%Pershing 27 27 77 1.0 0.4 4% 8%Storey 0 0 0 0 0 0% 0%Washoe 15 4 8 4.0 2.0 2% 1%
Western Region Subtotals: 622 307 1025 2.0 0.6 94% 87%
EA
ST
ER
N Elko 0 4 12 0.0 0.0 0% 1%
Eureka 35 19 42 1.8 0.8 5% 5%Lander 4 4 15 1.0 0.3 1% 1%White Pine 0 0 0 0 0 0% 0%
Eastern Region Subtotals: 38 27 69 1.4 0.6 6% 8%
SO
UT
HE
RN
Clark 4 15 27 0.3 0.1 1% 4%Esmeralda 0 0 0 0 0 0% 0%Lincoln 0 4 12 0.0 0.0 0% 1%Nye 0 0 0 0 0 0% 0%
Southern Region Subtotals: 4 19 38 0.2 0.1 1% 5%
TOTALS: 664 353 1133 1.9 0.6 100% 100%
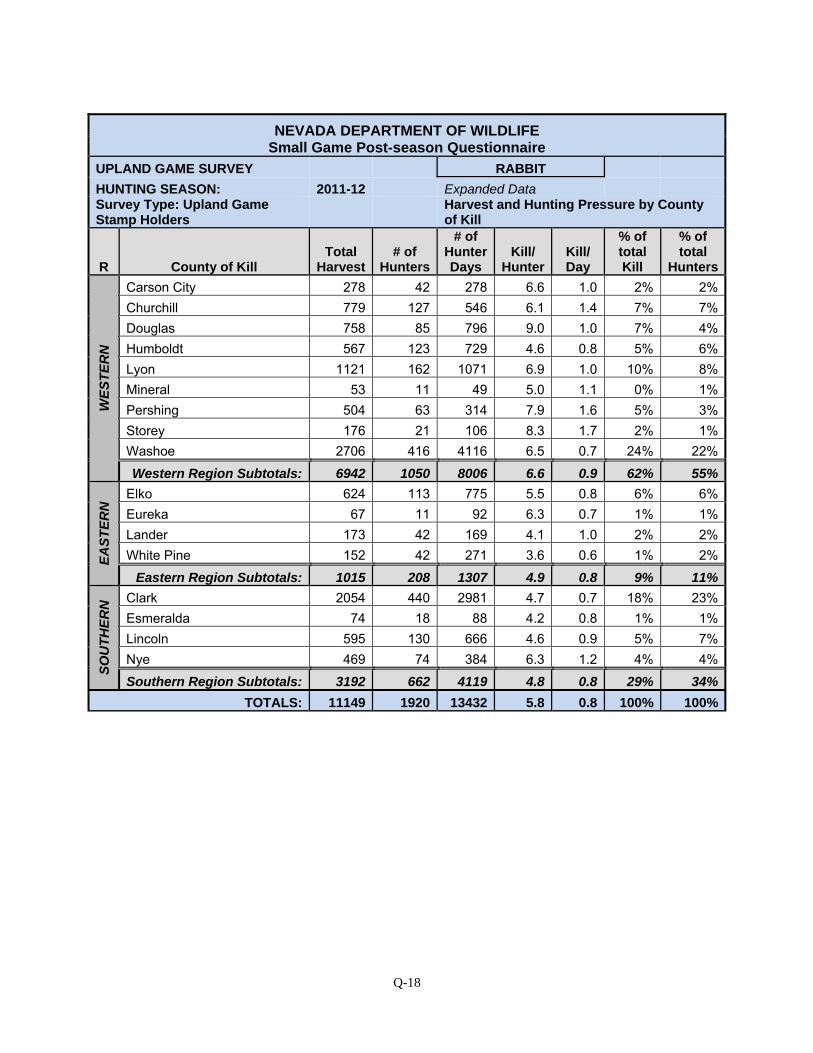
Q-18
NEVADA DEPARTMENT OF WILDLIFE Small Game Post-season Questionnaire
UPLAND GAME SURVEY RABBIT
HUNTING SEASON: 2011-12 Expanded Data Survey Type: Upland Game Stamp Holders
Harvest and Hunting Pressure by County of Kill
R County of Kill Total
Harvest# of
Hunters
# of Hunter Days
Kill/ Hunter
Kill/ Day
% of total Kill
% of total
Hunters
WE
ST
ER
N
Carson City 278 42 278 6.6 1.0 2% 2%Churchill 779 127 546 6.1 1.4 7% 7%Douglas 758 85 796 9.0 1.0 7% 4%Humboldt 567 123 729 4.6 0.8 5% 6%Lyon 1121 162 1071 6.9 1.0 10% 8%Mineral 53 11 49 5.0 1.1 0% 1%Pershing 504 63 314 7.9 1.6 5% 3%Storey 176 21 106 8.3 1.7 2% 1%Washoe 2706 416 4116 6.5 0.7 24% 22%
Western Region Subtotals: 6942 1050 8006 6.6 0.9 62% 55%
EA
ST
ER
N Elko 624 113 775 5.5 0.8 6% 6%
Eureka 67 11 92 6.3 0.7 1% 1%Lander 173 42 169 4.1 1.0 2% 2%White Pine 152 42 271 3.6 0.6 1% 2%
Eastern Region Subtotals: 1015 208 1307 4.9 0.8 9% 11%
SO
UT
HE
RN
Clark 2054 440 2981 4.7 0.7 18% 23%Esmeralda 74 18 88 4.2 0.8 1% 1%Lincoln 595 130 666 4.6 0.9 5% 7%Nye 469 74 384 6.3 1.2 4% 4%
Southern Region Subtotals: 3192 662 4119 4.8 0.8 29% 34%
TOTALS: 11149 1920 13432 5.8 0.8 100% 100%
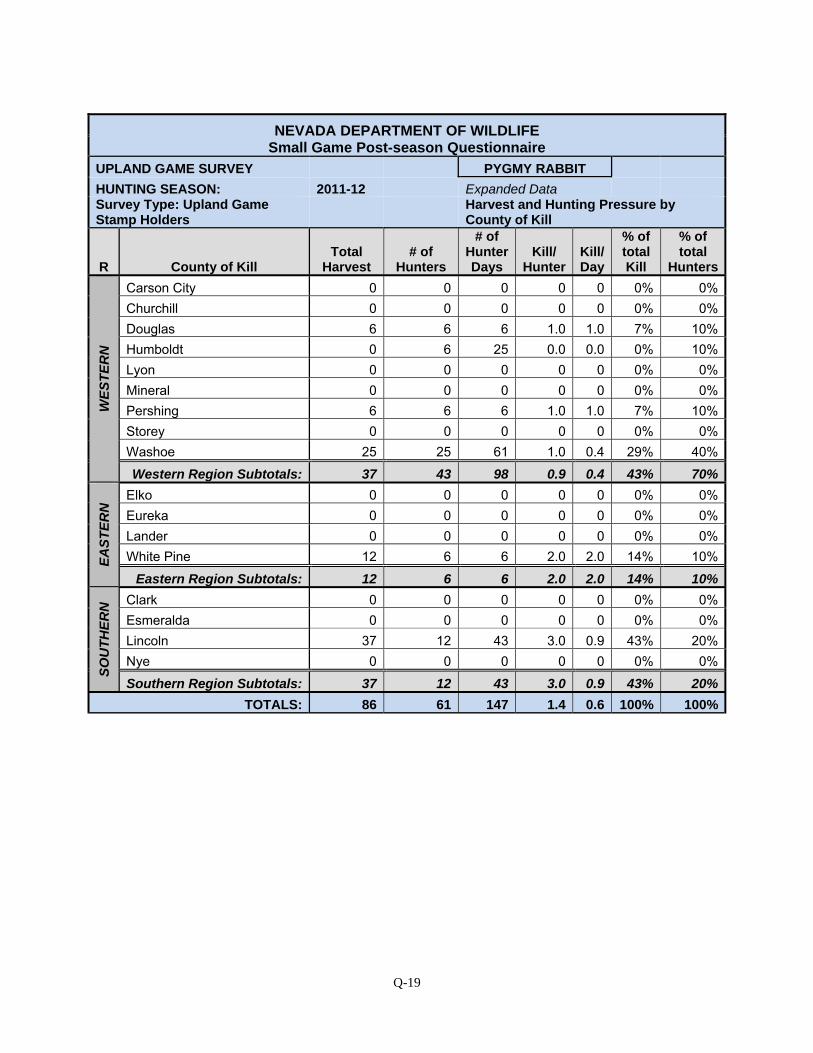
Q-19
NEVADA DEPARTMENT OF WILDLIFE Small Game Post-season Questionnaire
UPLAND GAME SURVEY PYGMY RABBIT
HUNTING SEASON: 2011-12 Expanded Data Survey Type: Upland Game Stamp Holders
Harvest and Hunting Pressure by County of Kill
R County of Kill Total
Harvest # of
Hunters
# of Hunter Days
Kill/ Hunter
Kill/ Day
% of total Kill
% of total
Hunters
WE
ST
ER
N
Carson City 0 0 0 0 0 0% 0%Churchill 0 0 0 0 0 0% 0%Douglas 6 6 6 1.0 1.0 7% 10%Humboldt 0 6 25 0.0 0.0 0% 10%Lyon 0 0 0 0 0 0% 0%Mineral 0 0 0 0 0 0% 0%Pershing 6 6 6 1.0 1.0 7% 10%Storey 0 0 0 0 0 0% 0%Washoe 25 25 61 1.0 0.4 29% 40%
Western Region Subtotals: 37 43 98 0.9 0.4 43% 70%
EA
ST
ER
N Elko 0 0 0 0 0 0% 0%
Eureka 0 0 0 0 0 0% 0%Lander 0 0 0 0 0 0% 0%White Pine 12 6 6 2.0 2.0 14% 10%
Eastern Region Subtotals: 12 6 6 2.0 2.0 14% 10%
SO
UT
HE
RN
Clark 0 0 0 0 0 0% 0%Esmeralda 0 0 0 0 0 0% 0%Lincoln 37 12 43 3.0 0.9 43% 20%Nye 0 0 0 0 0 0% 0%
Southern Region Subtotals: 37 12 43 3.0 0.9 43% 20%
TOTALS: 86 61 147 1.4 0.6 100% 100%
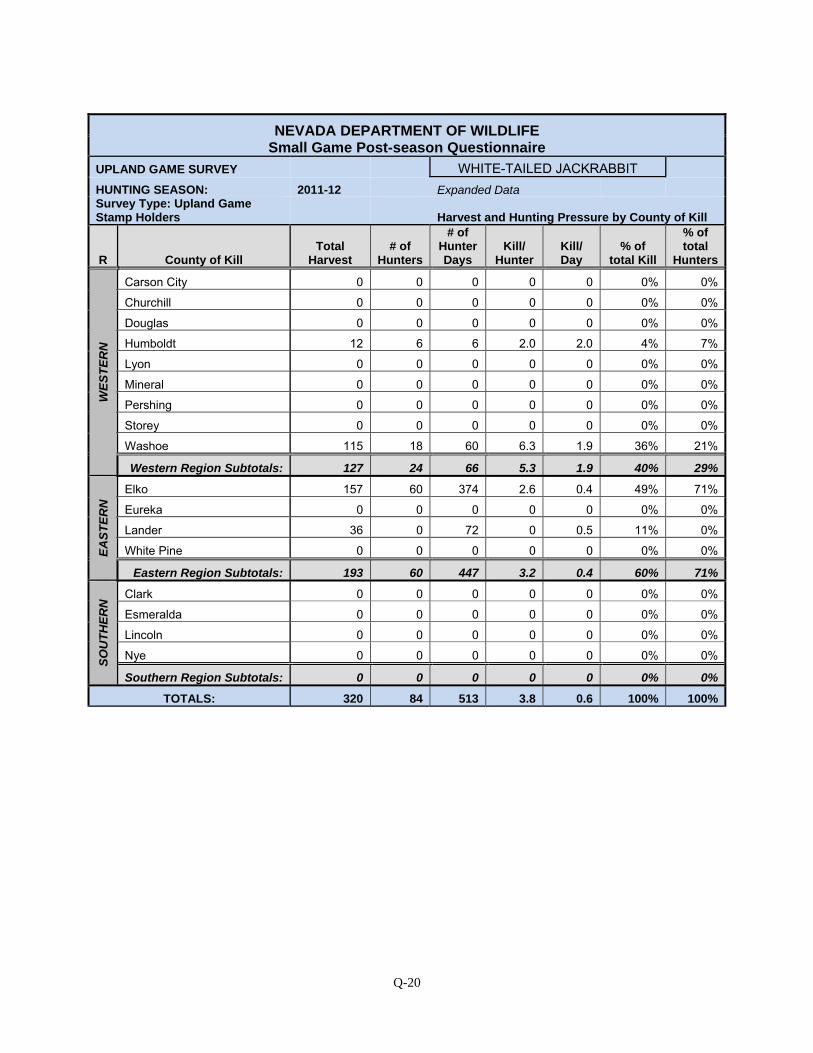
Q-20
NEVADA DEPARTMENT OF WILDLIFE Small Game Post-season Questionnaire
UPLAND GAME SURVEY WHITE-TAILED JACKRABBIT
HUNTING SEASON: 2011-12 Expanded Data Survey Type: Upland Game Stamp Holders Harvest and Hunting Pressure by County of Kill
R County of Kill Total
Harvest # of
Hunters
# of Hunter Days
Kill/ Hunter
Kill/ Day
% of total Kill
% of total
Hunters
WE
ST
ER
N
Carson City 0 0 0 0 0 0% 0%
Churchill 0 0 0 0 0 0% 0%
Douglas 0 0 0 0 0 0% 0%
Humboldt 12 6 6 2.0 2.0 4% 7%
Lyon 0 0 0 0 0 0% 0%
Mineral 0 0 0 0 0 0% 0%
Pershing 0 0 0 0 0 0% 0%
Storey 0 0 0 0 0 0% 0%
Washoe 115 18 60 6.3 1.9 36% 21%
Western Region Subtotals: 127 24 66 5.3 1.9 40% 29%
EA
ST
ER
N Elko 157 60 374 2.6 0.4 49% 71%
Eureka 0 0 0 0 0 0% 0%
Lander 36 0 72 0 0.5 11% 0%
White Pine 0 0 0 0 0 0% 0%
Eastern Region Subtotals: 193 60 447 3.2 0.4 60% 71%
SO
UT
HE
RN
Clark 0 0 0 0 0 0% 0%
Esmeralda 0 0 0 0 0 0% 0%
Lincoln 0 0 0 0 0 0% 0%
Nye 0 0 0 0 0 0% 0%
Southern Region Subtotals: 0 0 0 0 0 0% 0%
TOTALS: 320 84 513 3.8 0.6 100% 100%