nevada housing division nhd apartment facts · 2013-12-10 · las vegas valley, the greater...
TRANSCRIPT

NEVADA HOUSING DIVISION
NHD Apartment Facts
Second Quarter 2012
COVERED AREAS: Greater Las Vegas Valley
Greater Reno/Sparks Area Rural Nevada

This page intentionally left blank

Final Report
2nd Quarter 2012
Point-In-Time Apartment Survey Section I -- Greater Las Vegas Valley
Section II -- Greater Reno/Sparks Area Section III -- Rural Nevada
NHD Apartment Facts
Prepared by:
STATE OF NEVADA DEPARTMENT OF BUSINESS & INDUSTRY
Terry Johnson, Director
HOUSING DIVISION Charles L. Horsey, Administrator
Southern Nevada Office
7220 Bermuda Road, Suite B Las Vegas, Nevada 89119
Tel. 702-486-7220 Tel. 1-888-486-8775
Fax. 702-486-7227 E-mail: [email protected]
Northern Nevada Office
1535 Old Hot Springs Road, Suite 50 Carson City, Nevada 89706
Tel. 775-687-2040 Tel. 1-800-227-4960
Fax. 775-687-4040 E-mail: [email protected]
TDD: 1-800-326-6868
Web Site: www.nvhousing.state.nv.us
NHD Apartment Facts is an annual report published by the Nevada Housing Division, free of taxpayer expense, and
as a service to our partners in providing affordable housing.

TABLE OF CONTENTS
Description Contents Page #
From The Administrator i
The Survey ii
SECTION I GREATER LAS VEGAS VALLEY 1
Greater Las Vegas Valley Apartment Survey Study - Key Points 2
Table 1 Number of Apartments by Type of Unit 3
Table 1-A Number of Apartments by Type of Unit (Database Breakdown) 4
Graph 1 Distribution of Apartments Units by Size 5
Graph 2 Average Apartment Complex Size by 5-year Increments 6
Table 2 Vacancy Rates 7
Table 3 Reported Vacancies by Type of Unit for All Reporting Apartment Complexes 8
Table 4 Total Number of Housing Units and Vacancy Rate by Zip Code 9
Table 5 Total Number of Apartment Units by Zip Code 11
Map 1 High Density Zip Code Areas of Multi-Family Housing 13
Graph 3 Multi-Family Units by Year Built Since 1980 14
Table 6 New Construction of Multi-Family Housing 15
Map 2 Highest Geographic Areas of New Construction for Multi-Family Housing 16
Graph 4 Apartment Unit Types by Year Built 17
Table 7 Mean Rental Rates by Apartment Sizes — Market Units Rental Rate 18
Table 8 Mean Rental Rates Affordable and Market-Rate Multi-Family Mean Rental Rate Comparison by Unit Size 19
Graph 5 Distribution of Rental Rates for Studio Apartments 20
Graph 6 Distribution of Rental Rates for 1-Bedroom Apartments 21
Graph 7 Distribution of Rental Rates for 2-Bedroom Apartments 22
Graph 8 Distribution of Rental Rates for 3-Bedroom Apartments 23
Table 9 Number of Apartments by Type of Unit that House the 55+ Age Group 24
Graph 9 Percentage Distribution of Apartments by Type of Unit that House the 55+ Age Group 25
Graph 10 Distribution by Years of Multi-Family Construction of Units that House the 55+ Age Group 26
Table 10 Number of Apartments by Zip Code that House the 55+ Age Group 27
Map 3 Areas Where More Than 50% of Multi-Family Projects that House the 55+ Age Group Are Located (by zip code) 28
Table 11 Vacancy and Vacancy Rates for Apartments that House the 55+ Age Group 29
Table 12 Mean Rental Rates by Zip Code and by Type of Unit for Apartments that House the 55+ Age Group 30
Table 12-A Mean Rental Rates (Market Rate and Affordable Housing Rental Rate Comparison) that House the 55+ Age Group 31
Table 12-B Market Rate and Affordable Housing Rental Rate Percentage Differences that House the 55+ Age Group 31

Description Contents Page #
SECTION II GREATER RENO/SPARKS AREA 32
Greater Reno/Sparks Area Apartment Survey Study - Key Points 33
Table 13 Number of Apartments by Type of Unit 34
Table 13-A Number of Apartments by Type of Unit, Database Breakdown 34
Graph 11 Distribution of Apartment Units by Size 35
Graph 12 Growth in Average Apartment Project Size by 5-year Increments 36
Table 14 Vacancy Rates 37
Table 15 Reported Vacancies by Type of Unit 38
Table 16 Total Number of Housing Units and Vacancy Rate by Zip Code 39
Table 17 Total Number of Apartment Units by Zip Code 40
Map 4 High Density Zip Code Areas of Residential Multi-Family Housing 41
Graph 13 Multi-Family Units by Year Built Since 1980 42
Graph 14 Apartment Unit Types by Year Built 43
Table 18 Mean Rental Rates by Apartment Sizes 44
Table 19 Market Rate and Affordable Rental Rate Comparison 45
Graph 15 Distribution of Rental Rates for Studio Apartments 46
Graph 16 Distribution of Rental Rates for 1-Bedroom Apartments 47
Graph 17 Distribution of Rental Rates for 2-Bedroom Apartments 48
Graph 18 Distribution of Rental Rates for 3-Bedroom Apartments 49
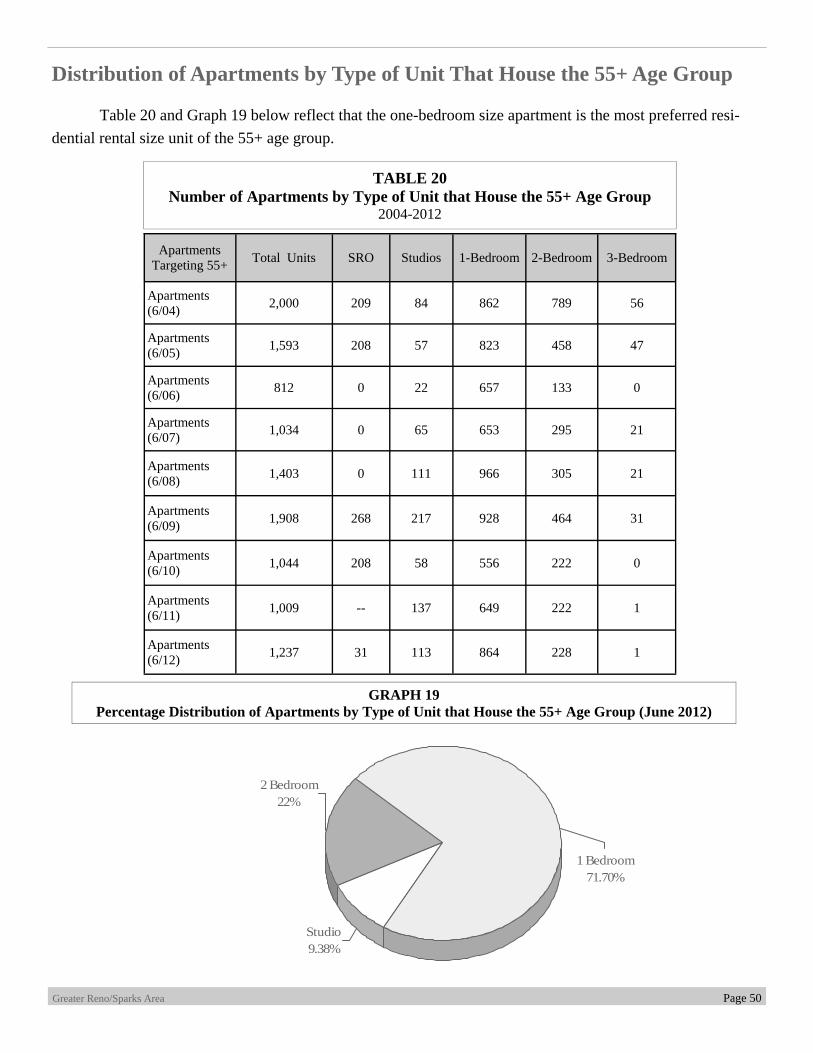
Table 20 Number of Apartments by Type of Unit that House the 55+ Age Group 50
Graph 19 Percentage Distribution of Apartments by Type of Unit that House the 55+ Age Group 50
Table 21 Number of Apartment Units by Zip Code that House the 55+ Age Group 51
Table 22 Vacancy Rates Percentages by Zip Code that House the 55+ Age Group 51
Map 5 Multi-Family Density and Vacancy Rate by Zip Code that House the 55+ Age Group 52
Table 23 Mean Rental Rates by Zip Code and by Type of Unit for Apartments that House the 55+ Age Group (Market Rate and Affordable Units Rental Rates) 53
Table 23-A Mean Rental Rates Market Rate and Affordable Housing Rental Rate Comparison that House the 55+ Age Group 53
TABLE OF CONTENTS

Description Contents Page #
SECTION III RURAL NEVADA 54
Rural Nevada Apartment Survey Study - Key Points 55
Table 24 Market Rate Mean Rental Rates by Apartment Sizes for all Areas in Nevada 55
Table 25 Number of Apartments by Type of Unit 56
Graph 20 Distribution of Apartment Units by Size 56
Table 25-A Number of Apartments by Type of Unit, Database Breakdown 57
Table 26 Vacancy Rates 58
Table 27 Reported Vacancies by Type of Unit 58
Table 28 Mean Rental Rates by Apartment Sizes 59
Table 29 Market Rate and Affordable Rental Rate Comparison 59
Table 30 Number of Multi-Family Rental Residential Units by Geographical Area 60
Table 31 Number of Apartments by Type of Unit, 55+ Age Group 61
Graph 21 Distribution of Apartment Units by Size that House the 55+ Age Group 61
Table 32 Vacancy Rate of Apartment Rental Units, 55+ Age Group 62
TABLE OF CONTENTS

From The Administrator
NHD’s Annual Multi-Family Survey
It is with great pleasure that the Housing Divi-sion is presenting its findings for the second quarter 2012 multi-family housing survey. Research through direct mail questionnaires help the Division each year to systematically identify and compare for analysis the multi-family housing market throughout the state. Through these surveys, the Division is able to evaluate the effectiveness of its financings and to iden-tify housing gaps in Nevada’s residential multi-family housing market. Of continued importance for the Housing Di-vision is the commitment to provide housing that is not only safe, sanitary, and decent but affordable for low- to moderate-income individuals and families. Through the Division’s Low-Income Housing Tax Credit Program hundreds of qualified families have become residents of affordable residential multi-family rental units. This public-private partnership continues to play an important role in providing not only affordable but housing for the elderly and physi-cally challenged populations in our state.
Charles L. Horsey
i
Charles L. Horsey Administrator
“Through the apartment survey, the Division is able
to evaluate the effectiveness of its
financings and to identify housing gaps for serving
the residential multi-family housing needs in
Nevada.”

The Survey Goals and Objectives The Division’s goals for the NHD Apartment Facts report is to assist governmental planners and multi-family market place participants in their short-term and long-range planning processes. The Division, through this data collection, documents new multi-family units and tracks vacancies and rental rates for existing multi-family housing units in the Greater Las Vegas Valley, the Greater Reno/Sparks Area, and for communities in rural Nevada. The primary reasons the Housing Division continues this task are to: 1. Create a comprehensive database of rental
properties; 2. Give interested parties planning tools to target
funding; and 3. Create long-range, monitoring devices to identify
emerging and changing trends in the rental property market.
Methodology A survey methodology was used to gather statistical data and responses from apartment complex owners or management professionals of multi-family housing complexes from specific geographical areas in Nevada. NHD designed and administered a direct mail survey to all identified apartment projects in the Greater Las Vegas Valley, the Greater Reno/Sparks Area, and Rural Nevada.
Implementation of the collection of primary housing data. Data collected was focused on specific housing related questions:
1. total number of housing units in the multi-family housing complex,
2. location by zip code of the property, 3. year property built, 4. number of vacancies,
5. number of vacancies by apartment type, 6. breakdown of total housing units by unit
sizes, 7. rental rates (low to high range) by apart-
ment unit size, 8. percentage of apartment units rented to the
55+ age group, 9. location by zip code of housing for the 55+
age group, 10. location by zip code of new multi-family
development, and 11. housing project size of multi-family devel-
opment. An analysis of data collected through the direct mail survey is prepared by NHD staff. A final report is prepared outlining in table and graph formats findings of the survey. The survey has a 3 percent +/- factor.
Data: All data for the second quarter 2012 study is based upon primary data collection conducted by the Housing Division. From this data collection, 770 apart-ment complexes were identified in the Greater Las Ve-gas Valley representing 109,641 apartment units vali-dated for the database. In the Greater Reno/Sparks Area, 265 apart-ment complexes were identified representing 22,769 apartment units validated for the database. For rural Nevada, 137 apartment complexes were identified representing 5,672 apartment units vali-dated for the database. Survey data analysis is based upon a 70% re-sponse rate for the Greater Las Vegas Valley, a 66% response rate for the Greater Reno/Sparks Area, and a 64% response rate for rural Nevada.¹ All data for the multi-family analysis is based upon market and affordable residential rental properties. Assisted living (group homes), subsidized, and extended stay residential rental properties are not included. _______________ ¹Response rate is based upon response rate of unit count and not re-sponse rate of apartment complexes.
ii
Section I
Greater Las Vegas Valley
Page 1 Greater Las Vegas Valley

Key Points Key findings from the 2nd Quarter 2012 survey re-flect the following: 1. The two-bedroom size apartments continue to remain the
most popular rental unit type. 2. The two-bedroom size apartments comprise one-half
(50%) of the identified multi-family housing units. 3. The Single Room Occupancy (SRO) and four-bedroom
size units continue to represent the smallest demand in the residential rental market.
4. The average apartment size from 1980 to 1999 reflected apartment complex sizes of over 200 residential units per complex.
5. Years 2000 to 2012 reflect a down turn in number of units for apartment complexes constructed.
6. Survey responses from condominium complexes’ man-agement indicate that a significant number of units are available for rental; some rentals are advertised directly by private investors; therefore exact numbers are not available, however property management who directly oversee the rental of units indicate that more than 60% of the complexes’ units are reintroduced into the rental mar-ket.
7. Data reflects, from the survey’s reporting apartment man-agers, an overall vacancy rate of 8.95%, a -.93% change in vacancy rate from the 2011 point-in-time survey data.
8. The single room occupancy (SRO) size apartment rental units reflect the highest vacancy rate at 25.5%.
9. The SRO and studio size apartments for the 2012 va-cancy rate reflected the highest percentage of vacancies at 25.5% and 13.1% respectively while the two-bedroom size reflected the smallest rate at 8.7%.
10. Vacancy rates continue to be higher in those multi-family complexes constructed pre 1985.
11. Multi-family vacancy rates are highest in the older resi-dential areas of the Valley.
12. More than one-half of the Greater Las Vegas Valley’s apartment complexes are located within ten zip code ar-eas, most of which are within the centrally located part of the Greater Las Vegas Valley, within the City Limits of Las Vegas proper and Paradise in incorporated Clark County, and within the City of Henderson.
13. Since 1998, data continues to reflect a downward trend in the number of multi-family housing units being added to
the residential rental housing inventory. 14. New construction of multi-family units has stabilized
between 2000 to 2012 showing a much lower trend of construction than that experienced in the late 1980’s and the mid 1990’s.
15. More than 30% of the Greater Las Vegas Valley’s new construction for the first six months of 2012 has been located within or adjacent to the City of Henderson.
16. Since year 2005, the number of three-bedroom size units constructed have shown the most significant decline.
17. During 2010 and the first six months of 2012 the three-bedroom size units began to show some movement up in correlation to the studio size units.
18. The second quarter 2012 mean rental rates by apartment size for market units shows a slight increase in rents for the one-bedroom size units and a decrease in rents for the studio, two- and three-bedroom size units.
19. The 2012 data did not reflect major changes in market-rate rental rates from the 2011 data.
20. Affordable rents¹ for the one, two and three-bedroom size units continue to be more than 20% lower than unre-stricted market rents for comparable configuration.
21. The one-bedroom and two-bedroom size units are almost equal at 47% and 45.5% respectively on representing the highest percentage of where the 55+ age group prefer to reside.
22. The older established area of downtown City of Hender-son makes up 6.54% of the geographical area where the 55+ age group reside.
23. Other predominant geographical area where the 55+ age group reside in within the City of Las Vegas with more than 16% residing in the downtown area of the City of Las Vegas.
24. Vacancy rates for apartments that house the 55+ age group showed a 1.14% decline in available housing.
25. Affordable rents¹ for studio, one, and two-bedroom size units that house the 55+ population are lower by more than 20% than unrestricted market rents for comparable configuration.
26. Difference in rental rates for apartment units that house the 55+ age group reflect a narrowing in rental rates be-tween these size units.
¹Affordable units denote apartment complex units that are income restricted.
Greater Las Vegas Valley Apartment Survey Study
Greater Las Vegas Valley Page 2

Distribution of Apartments by Type of Unit
TABLE 1 Number of Apartments by Type of Unit
June 1997-2012
Date Total Units¹ SRO² Studios 1-Bedroom 2-Bedroom 3-Bedroom 4-Bedroom
June 1997 121,509 -- 9,314 44,754 57,481 9,804 156
June 1998 131,754 -- 8,837 49,180 62,515 11,044 156
June 1999 143,163 -- 10,173 52,395 67,808 12,526 261
June 2000 148,904 989 8,625 54,063 71,197 13,772 258
June 2001 151,582 1,474 7,509 55,548 72,784 14,009 258
June 2002 160,083 1,459 8,804 56,920 76,996 15,633 271
June 2003 158,433 1,653 9,155 55,198 76,255 15,892 280
June 2004 156,404 1,360 9,693 53,781 75,703 15,589 278
June 2005 147,689 1,224 8,819 52,279 70,651 14,305 411
June 2006 135,696 579 6,684 48,447 66,518 13,069 399
June 2007 131,767 924 7,168 45,734 64,624 12,987 330
June 2008 136,452 854 7,352 47,836 66,755 13,333 322
June 2009 126,901 726 6,227 45,006 62,172 12,489 281
June 2010 106,459 696 5,004 37,566 51,769 10,976 448
June 2011 94,946 496 3,818 32,947 47,437 9,878 370
June 2012 109,641 1,017 3,957 37,110 55,886 11,181 490
Greater Las Vegas Valley Page 3
The split of unit types shows that the two-bedroom size residential rental units continue to be the predominant housing unit size in the Greater Las Vegas Valley’s rental market. The two-bedroom size units reflect a continued trend of representing one-half of identified residential rental apartment units in this market. (Reference Table 1 and Graph 1)
¹ Refusal to participate and a fluctuating survey return rate has resulted in a continued lowering of total units in the survey’s database. ² Single Room Occupancy.
Description June 2007
June 2008
June 2009
June 2010
June 2011
June 2012
Total # of apartment complexes identified 811 822 685 718 734 770
Total # of apartment units identified 153,388 155,479 140,757 148,268 151,096 156,201
# of rental units identified within condomin-ium complexes and other types of non-subsidized housing for rental
1,107 88 1,407 2,071 673* 807
# of identified rental units where there was no response, or owners and/or managers refused to participate
17,172 14,271 10,910 38,280 52,631 44,996
# of identified rental areas where mail was returned, in those cases rental complexes are too small to have on-site management office
2,591 4,345 1,539 1,458 2,412 757
# of rental units identified as under construction with targeted completion dates later in the year
346 186 N/A ** 434*** N/A
Total # of rental units validated for database 131,767 136,452 126,901 106,459 94,946 109,641
Distribution of Apartments by Type of Unit
Table 1-A Number of Apartments by Type of Unit
June 2007 through June 2012 Database Breakdown
Greater Las Vegas Valley Page 4
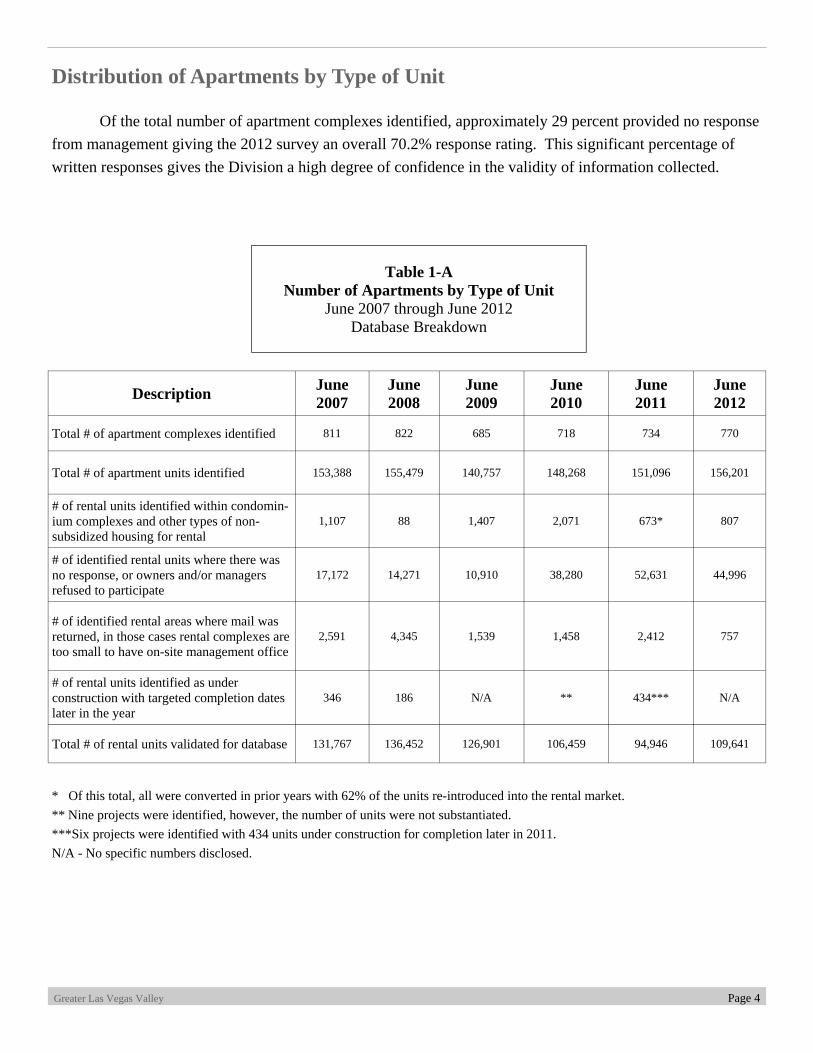
Of the total number of apartment complexes identified, approximately 29 percent provided no response from management giving the 2012 survey an overall 70.2% response rating. This significant percentage of written responses gives the Division a high degree of confidence in the validity of information collected.
* Of this total, all were converted in prior years with 62% of the units re-introduced into the rental market. ** Nine projects were identified, however, the number of units were not substantiated. ***Six projects were identified with 434 units under construction for completion later in 2011. N/A - No specific numbers disclosed.

GRAPH 1 Distribution of Apartment Units by Size
June 2012
SRO1%
Studio4%
2 Bedroom50%3 Bedroom
10%
1 Bedroom35%
Note: Four-Bedroom size units represented .45% of the total number of apartment units in the Greater Las Vegas Valley; therefore, that number is not shown in Graph 1.
Distribution of Apartment Units by Size
Greater Las Vegas Valley Page 5
Graph 1 shows that residents of the multi-family rental market continue to prefer either one-or two-bedroom size units with the two-bedroom size being the predominant favorite. One-half of the multi-family housing inventory is two bedroom in size. The four-bedroom size units continue to represent the smallest demand (.45%) in the residential multi-family rental market.

Growth in Average Apartment Project Size
Growth in the average apartment complex size was highest during the 1980’s and 1990’s. Since year 2000, the average size of apartment projects, i.e., the number of residential units per project, has decreased. The time period of year 2010 to the first 6 months of 2012 reflect the lowest number of residential units per project since the late 1960’s.
GRAPH 2 Average Apartment Complex Size by 5-year Increments
<1960 to 2012
Residential Units Per Project
Year Built
Greater Las Vegas Valley Page 6
71
176159.5
194.2
173.7
196.7
261.5
208.2
245.2
199.7 197.5
161
0
50
100
150
200
250
300
<1960 60-64 65-69 70-74 75-79 80-84 85-89 90-94 95-99 00-04 05-09 10-12

Vacancy Rates
Units Built by Year
2nd Qtr. 2012 # Responding to
vacancy question
Projects Units
2nd Qtr. 2012 # of
Reported Vacant Units
Vacancy Rate 6/30/12
Vacancy Rate 6/30/11
Vacancy Rate 6/30/10
Vacancy Rate 6/30/09
Vacancy Rate 6/30/08
Vacancy Rate 6/30/07
2012 5 721 ** ** ** ** ** ** N/A
2010-2011 19 3,375 ** ** ** ** ** ** **
2005-2009 63 12,443 1,002 8.05% 8.22% 9.60% 9.97% 3.0% **
2000-2004 77 15,376 1,119 7.28% 7.73% 7.99% 7.86% 6.7% 3.4%
1995-1999 91 22,220 1,759 7.92% 8.15% 9.94% 9.72% 8.1% 4.5%
1990-1994 47 9,883 939 9.50% 7.85% 11.51% 11.31% 7.8% 4.2%
1985-1989 74 19,456 1,606 8.25% 9.25% 11.31% 9.84% 7.6% 5.6%
1980-1984 38 7,417 855 11.53% 10.50% 9.08% 9.92% 7.2% 5.3%
1975-1979 37 6,426 661 10.29% 12.70% 12.51% 10.02% 7.3% 4.2%
1970-1974 27 5,245 661 12.60% 21.56% 16.63% 15.38% 7.6% 7.9%
Pre-1970 22 3,038 429 14.12% 19.61% 21.94% 15.62% 9.2% 10.2%
Date unknown
22 2,933 448 15.27% 10.53% 15.35% 16.09% 11.0% 8.9%
Total 497 104,117 9,315 8.95% 9.88% 11.03% 10.40% 7.6% 5.1%
TABLE 2 Vacancy Rates
(Data by Year Project was Built)
*Vacancy data is derived from a 99% survey response rate to the specific vacancy rate question. ** 2012 units are under construction or in first phase of renting. Data for years 2010 and 2011 are not included in determining the Valley’s overall vacancy rate as reasonable rent-up time is allowed prior to determining vacancy rates. N/A - Not applicable. Note: Totals do not include assisted living, group homes, or subsidized housing projects.
Greater Las Vegas Valley Page 7
The vacancy rates in the Division’s second quarter 2012 survey reflects a .93 percent decrease in num-ber of vacancies for the Greater Las Vegas Valley. The 2011 data showed a vacancy rate decrease of 1.15% from the second quarter 2010 point-in-time survey data. The Valley’s vacancy rate has been trending down-ward since 2010 at rates averaging approximately 2 percent for this two-year time period.
TABLE 2 Vacancy Rates
(Data by Year Project was Built)

Vacancy Rates
Table 3 reflects that in the Greater Las Vegas Valley, the 4-bedroom units experienced the largest in-crease in vacancy rates. The one-two- and three-bedroom size units all reflect slight decreases in vacancy rates. The overall vacancy data reflects a more than 10% vacancy rates in all units with exception to the 1- and 2-bedroom size units which reflect rates slightly below 10%. This data could be in direct correlation to the area’s high foreclosure rates, with investors providing rental single-family residences for those families who have lost their homes.
TABLE 3 Reported Vacancies by Type of Unit for All Reporting Apartment Complexes
2012
Apartment Type Number of
Units in Sample¹
Vacancies by Unit Type
Vacancy Rate 2012
Vacancy Rate 2011
% Change (11-12)
Single Room Occupancy (SRO) 1,017 259 25.5% 25.6% - .10%
Studio Apartments 3,582 469 13.1% 8.0% + 5.1%
1-Bedroom Apartments 31,815 2,381 7.5% 12.4% - 4.9%
2-Bedroom Size Apartments 48,441 4,217 8.7% 12.6% - 3.9%
3-Bedroom Size Apartments 9,916 1,125 11.3% 14.7% - 3.4%
4-Bedroom Size Apartments 332 36 10.8% 4.5% + 6.3%
¹Number of units in sample was derived from the responses of apartment complexes that provided a breakdown of num-ber of vacancies by apartment type. Of the number of units in sample, 99% responded to the vacancies by unit type.
Greater Las Vegas Valley Page 8

Zip Code
Total Number of Apartment Units in Zip
Code Area 6/30/12
Vacancy Rate (%) by Zip Code for those Apartment Units
Reporting Vacancies 6/30/12
Vacancy Rate (%) by Zip Code for those Apartment Units
Reporting Vacancies 6/30/11
Vacancy Rate (%) by Zip Code for those Apartment Units
Reporting Vacancies 6/30/10
Vacancy Rate (%) by Zip Code for those Apartment Units
Reporting Vacancies 6/30/09
Vacancy Rate (%) by Zip Code for those Apartment Units
Reporting Vacancies 6/30/08
Vacancy Rate (%) by Zip Code for those Apart-
ment Units Reporting Vacancies
6/30/07
89002 441 8.8% 7.9% 11.7% 2.3% 70.9% **
89005 59 0.0% 5.3% 7.4% 2.2% 0.0% 0.0%
89011 1,029 7.4% 5.8% 7.4% 7.3% 10.6% **
89012 1,889 5.3% 4.2% 5.8% 9.0% 10.7% 3.3%
89014 5,257 5.7% 6.1% 6.8% 7.7% 7.3% 3.5%
89015 1,702 7.6% 5.8% 8.9% 7.5% 2.9% 3.7%
89030 1,573 13.8% 18.9% 14.3% 16.3% 13.2% 9.3%
89031 824 9.8% 7.8% 12.1% 12.0% 7.5% 1.8%
89032 1,328 9.3% 8.6% 16.8% 15.1% 5.8% 4.4%
89036 248 14.1% 17.3% 11.3% 8.1% 8.9% **
89052 1,668 4.4% 4.4% 7.1% 6.2% 2.1% 4.6%
89074 1,713 5.4% 6.0% 6.1% 8.0% 8.8% 4.0%
89081 737 6.1% 9.4% 11.3% 18.6% 19.6% **
89084 1,008 4.6% 5.3% 3.4% 12.4% ** **
89086 727 7.7% 8.5% 9.9% 7.0% 5.5% **
89101 5,356 14.1% 17.2% 15.8% 12.8% 8.4% 4.3%
89102 3,834 12.2% 16.4% 18.2% 14.3% 8.2% 5.9%
89103 6,043 8.0% 5.7% 6.5% 8.1% 4.8% 4.2%
89104 3,062 11.0% 13.6% 14.8% 13.0% 11.6% 7.5%
89106 1,492 17.5% 22.0% 21.4% 12.0% 11.9% 5.6%
89107 863 2.9% 6.2% 6.0% 9.0% 8.7% 2.0%
89108 4,918 8.8% 10.4% 14.3% 8.8% 7.4% 7.3%
89109 4,835 11.6% 16.9% 14.6% 10.9% 7.9% 7.6%
89110 2491 9.3% 9.4% 11.5% 10.7% 10.3% 4.4%
89113 578 4.7% 5.4% ** ** ** **
89115 2,794 17.0% 14.9% 16.7% 18.2% 13.7% 7.7%
89117 6,267 7.9% 5.9% 7.0% 9.1% 5.9% 4.1%
Housing Units and Vacancy Rate by Zip Code
Greater Las Vegas Valley Page 9
TABLE 4 Number of Housing Units and Vacancy Rate by Zip Code¹
Table continued on following page. ¹Numbers based upon number of apartment complex respondents. ** Data not reported

Zip Code
Total Number of Apartment Units who Reported Vacancies
by Zip Code Area 6/30/12
Vacancy Rate (%) by Zip Code for those Apartment Units
Reporting Vacancies 6/30/11
Vacancy Rate (%) by Zip Code for those Apartment Units
Reporting Vacancies 6/30/10
Vacancy Rate (%) by Zip Code for those Apartment Units
Reporting Vacancies 6/30/09
Vacancy Rate (%) by Zip Code for those Apartment Units
Reporting Vacancies 6/30/08
Vacancy Rate (%) by Zip Code for those Apartment Units
Reporting Vacancies 6/30/07
89118 1,420 2.3% 7.6% 6.3% 3.4% 4.7%
89119 8,044 9.9% 12.5% 11.0% 5.5% 4.8%
89120 1,606 7.2% 7.1% 6.9% 3.3% 1.5%
89121 5,397 11.5% 10.2% 10.8% 8.8% 6.6%
89122 3,299 7.4% 11.8% 11.8% 12.7% 3.9%
89123 3,667 6.1% 6.8% 7.1% 4.1% 3.3%
89128 2,138 4.7% 6.2% 4.1% 8.5% 8.2%
89129 1,258 10.9% 6.4% 6.2% 13.0% 3.6%
89130 1,125 7.1% 21.2% 16.9% 6.7% 4.9%
89135 485 6.1% 3.4% 16.3% 7.2% 5.5%
89139 1,385 3.1% 4.8% 4.4% 2.7% 1.0%
89142 1,744 8.7% 4.7% 10.1% 7.5% 6.5%
89145 566 5.1% 5.4% 9.5% 12.4% 2.6%
89146 2,027 5.9% 8.5% 7.5% 8.4% 4.6%
89147 2,487 4.8% 12.1% 9.8% 3.9% 4.4%
89148 1,516 4.6% 5.4% 13.9% 14.0% 2.8%
89149 333 17.2% ** ** ** **
89156 376 16.8% 23.8% 22.4% 16.6% 6.2%
89166 968 22.8% ** ** ** **
89169 193 15.2% 6.5% 10.6% 8.5% **
89183 866 7.8% 5.0% 6.5% 2.4% **
Total Units 104,437
Vacancy Rate (%) by Zip Code for those Apartment Units
Reporting Vacancies 6/30/12
6.8%
10.0%
8.1%
11.4%
7.3%
5.3%
6.6%
10.6%
6.5%
3.9%
4.7%
11.9%
3.2%
7.3%
5.7%
5.5%
28.8%
9.6%
10.1%
45.1%
4.8%
89131 272 1.5% ** ** ** ** **
89138 273 7.7% ** ** ** ** **
89144 256 4.7% ** ** ** ** **
Housing Units and Vacancy Rate by Zip Code
TABLE 4 (continued) Total Number of Housing Units and Vacancy Rate by Zip Code
Greater Las Vegas Valley Page 10
** data not reported Note: Vacancy rate data does not include those units in rent-up phase (2010-2012)

TABLE 5 Total Number of Apartment Units by Zip Code
June 2012
Distribution of Rental Units by Zip Code
Greater Las Vegas Valley Page 11
One-half of the Greater Las Vegas Valley’s Apartment Complexes are located within ten zip code areas. (See Map 1)
Zip Code Total # of Apart-
ment Units by Zip Code
Percent Cumulative %
89119 8,065 7.35 7.35
89117 6,603 6.00 13.35
89103 6,372 5.81 19.16
89101 5,724 5.22 24.38
89121 5,511 5.03 29.41
89014 5,257 4.79 34.20
89108 5,170 4.71 38.91
89109 4,835 4.41 43.32
89123 3,845 3.51 46.83
89102 3,834 3.50 50.33
89122 3,299 3.01 53.34
89104 3,204 2.92 56.26
89115 2,946 2.69 58.95
89110 2,491 2.27 61.22
89147 2,487 2.27 63.49
89128 2,138 1.95 65.44
89148 2,135 1.95 67.39
89146 2,027 1.85 69.24
89074 2,023 1.84 71.08
89012 1,889 1.72 72.80

Zip Code Total # of Apartment Units by Zip Code Percent Cumulative
89015 1,869 1.70 74.50
89142 1,744 1.59 76.09
89030 1,717 1.57 77.66
89052 1,668 1.52 79.18
89106 1,612 1.47 80.65
89120 1,606 1.46 82.11
89118 1,420 1.29 83.40
89139 1,385 1.26 84.66
89129 1,363 1.24 85.90
89032 1,328 1.21 87.11
89183 1,186 1.08 88.19
89130 1,125 1.03 89.22
89011 1,029 .94 90.16
89084 1,008 .92 91.08
89166 968 .88 91.96
89107 863 .79 92.75
89031 824 .75 93.50
89002 785 .71 94.21
89081 737 .67 94.88
89086 727 .66 95.54
89149 712 .65 96.19
89145 606 .55 96.74
89113 578 .53 97.27
89178 539 .49 97.76
89135 485 .44 98.20
89131 437 .40 98.60
89156 376 .34 98.94
89138 273 .25 99.19
89144 256 .23 99.42
89036 248 .23 99.65
89169 193 .18 99.83
89009 60 .05 99.88
89005 59 .05 99.93
Total 109,641
Greater Las Vegas Valley Page 12
Distribution of Rental Units by Zip Code
TABLE 5 (continued) Total Number of Apartment Units by Zip Code
June 2012

MAP 1 High Density Zip Code Areas of Multi-Family Housing
2012 Data
More than one-half of all multi-family housing units are located within ten zip codes (see map below). These zip codes represent areas that are centrally located within the Greater Las Vegas Area. All areas identi-fied are near shopping, medical facilities, schools, and/or gaming activities.
Zip Code Map of the Greater Las Vegas Valley
Greater Las Vegas Valley Page 13

0
2000
4000
6000
8000
10000
12000
14000
80-81
84-85
88-89
92-93
96-97
00-01
04-05
08-09
2012
# of Units
GRAPH 3 Multi-Family Units by Year Built Since 1980
1980-2012
Years 1988 and 1989 experienced the greatest number of new apartment units produced in the Greater Las Vegas Valley, with years 1996 and 1997 representing years of the second highest number of units produced. Data reflects a downward trend in development since 1998 with sharp decline in new construction after 2009 mirroring construction decline during the 1992-1995 recession.
Number of Apartment Units By Year Built Since 1980
Greater Las Vegas Valley Page 14
Year Built
Note: Identified units by year built represents data from those apartment complexes who responded to the survey.

Growth Zip Codes
TABLE 6 New Construction of Multi-Family Housing
During 2011 and First 6 Months of 2012
Greater Las Vegas Valley Page 12
During the first six months of 2012, data collected reflects that approximately 72% of the Greater Las Vegas Valley’s new construction occurred within five zip codes. In 2011, four zip codes reflected the location of more than 78% of all new construction (Refer to Map 2).
Zip Code
New Units Recorded for
Calendar Year 2011
% of new construction Zip Code New Units as
of 6/30/12 % of new
construction
89009 60 10.95 89015 62 4.80
89015 80 14.60 89030 144 11.15
89101 24 4.38 89103 75 5.80
89106 38 6.93 89104 142 10.99
89120 142 25.91 89115 152 11.76
89121 114 20.80 89121 114 8.82
89131 90 16.42 89123 178 13.78
89129 105 8.13
89183 320 24.77
Total 548 99.99 Total 1,292 100.00
2011
Greater Las Vegas Valley Page 15
2012

MAP 2 Highest Geographic Areas of New Construction for Multi-Family Housing
2011 and First 6 Months of 2012
Map 2 shows the areas with the highest percentage of multi-family residential rental growth during 2011 and the first six months of 2012.
Zip Code Map of the Greater Las Vegas Valley
Greater Las Vegas Valley Page 16
2011 2012

Mix of Apartment Unit Types By Year Built
The three-bedroom apartment size apartment construction has outpaced the studio-size units developed for more than the past 30 years. Since year 2005, both the number of three-bedroom size and studio-size units being constructed, compared to other size units offered, has shown a steady decline.
GRAPH 4 Apartment Unit Types by Year Built
1980-2012
# of Units by Type
Year Built
1980
-198
4
1985
-198
9
1990
-199
4
1995
-199
9
2000
-200
4
2005
-200
9
2010
-201
1
2012
Studio3-Bedroom
0
500
1000
1500
2000
2500
3000
Greater Las Vegas Valley Page 17

Distribution of Rents by Apartment Size
TABLE 7 Mean Rental Rates by Apartment Sizes - Market Units Rental Rates
June 2000 through June 2012
Date Studio 1-Bedroom 2-Bedroom 3-Bedroom
June 2001 $459.38 $588.14 $714.05 $883.56
% change 00-01 +1.17% +2.51% +3.05% +2.48%
June 2002 $489.00 $599.29 $726.48 $901.53
% change 01-02 +6.1% +1.9% +1.7% +2.0%
June 2003 $498.55 $607.08 $732.55 $908.67
% change 02-03 +1.9% +1.3% +.8% +.8%
June 2004 $515.48 $618.62 $747.04 $922.65
% change 03-04 +3.28% +1.87% +1.94% +1.52%
June 2005 $533.32 $655.12 $794.95 $962.76
% change 04-05 +3.34% +5.57% +5.97% +4.18%
June 2006 $570.46 $715.20 $855.01 $1,054.61
% change 05-06 +6.51% +8.40% +7.02% +8.71%
June 2007 $597.93 $753.01 $899.03 $1,096.96
% change 06-07 +4.59% +5.02% +4.90% +3.86%
June 2008 $596.68 $760.40 $900.30 $1,115.38
% change 07-08 -.20% +.97% +.14% +1.65%
June 2009 $580.08 $726.95 $869.41 $1,082.27
% change 08-09 -2.78% -4.40% -3.43% -2.97%
June 2010 $528.52 $662.47 $810.10 $1,021.19
% change 09-10 -8.89% -8.87% -6.82% -5.64%
June 2011 $535.32 $669.16 $805.24 $1,014.02
% change 10-11 +1.29% +1.01% -.60% -.70%
June 2012 $518.89 $671.45 $797.70 $993.25
% change 11-12 -3.07% +.34% -.94% -2.05%
June 2000 $454.00 $573.41 $692.24 $861.66
Note: Rental rates for SRO (Single Room Occupancy) and four-bedroom size apartments mean monthly rental rates are not reflected in this table as both of these size units represent less than one percent of the Valley’s total number of multi-family residential units.
Greater Las Vegas Valley Page 18

TABLE 8 Mean Rental Rates
Affordable and Market-Rate Multi-Family Mean Rental Rate Comparison by Unit Size 2011-2012
Type of Units Studio 1-Bedroom 2-Bedroom 3-Bedroom
2012 2011 2012 2011 2012 2011 2012 2011
Market Units Rental Rate $518.89 $535.32 $671.45 $669.16 $797.70 $805.24 $993.25 $1,014.02
Affordable Units¹ Rental Rate $451.00 $480.40 $525.86 $525.59 $623.23 $626.71 $749.85 $769.78
Percentage Difference between Affordable and Market-Rate Multi-Family Residential Unit Rental Rates
-13.08% -10.26% -21.68% -21.46% -21.87% -22.17% -24.50% -24.09%
¹ Affordable units denote apartment complex units that are income restricted.
Distribution of Rents by Apartment Size
Table 8 reflects the difference in mean rental rates between affordable and unrestricted market rate multi-family rental units. The affordable rental rates are lower for all size of apartment units versus the unre-stricted market rental rates for the same bedroom-size units. The one-two- and three-bedroom size units all re-flect rents that have rental rates which are 20% lower in the affordable housing market versus the unrestricted market for comparable size rental units.
Greater Las Vegas Valley Page 19

GRAPH 5 Distribution of Rental Rates for Studio Apartments
Market Units Rental Rate June 2012
Distribution of Rents by Apartment Size
Greater Las Vegas Valley Page 20
0
1
2
3
4
5
6
7
8
400 450 500 550 600 650 700 750 800 850 900 950
Monthly Rents
Average Low = $489.54 down 1.03% since 2011 Average High = $548.25 down 4.81% since 2011 Note: 55 apartment complexes reporting.
# of
Apa
rtmen
t Com
plex
es

Distribution of Rents by Apartment Size (continued)
GRAPH 6 Distribution of Rental Rates for 1-Bedroom Apartments
Market Units Rental Rate June 2012
Greater Las Vegas Valley Page 21
0
5
10
15
20
25
30
400 475 550 625 700 775 850 925 1000 1075 1150
Monthly Rents
Average Low= $629.49 up .32% since 2011 Average High= $713.41 up .36% since 2011 Note: 346 apartment complexes reporting.

Distribution of Rents by Apartment Size (continued)
GRAPH 7 Distribution of Rental Rates for 2-Bedroom Apartments
Market Units Rental Rate June 2012
Greater Las Vegas Valley Page 22
0
5
10
15
20
25
475 600 725 850 975 1100 1225 1350 1475 1600
Monthly Rents
Average Low= $739.62 down 1.33% since 2011 Average High= $855.79 down .59% since 2011 Note: 369 apartment complexes reporting.
# of
Apa
rtmen
t Com
plex
es

Distribution of Rents by Apartment Size (continued)
GRAPH 8 Distribution of Rental Rates for 3-Bedroom Apartments
Market Units Rental Rate June 2012
Greater Las Vegas Valley Page 23
0
2
4
6
8
10
12
14
16
700 800 900 1000 1100 1200 1300 1400 1500 1600 1700 1800
Monthly Rents
Average Low= $945.24 down 2.74% since 2011 Average High= $1,041.26 down 1.41% since 2011 Note: 222 apartment complexes reporting.
# of
Apa
rtmen
t Com
plex
es

Distribution of Apartments by Type of Unit that House the 55+ Age Group
Apartments that House the 55+ Age Group
by year of Development
Total Units SRO Studios 1-Bedroom 2-Bedroom 3-Bedroom
Apartments (6/99) 5,421 * 605 3,168 1,642 2
Apartments (6/00) 7,633 11 861 4,534 2,203 24
Apartments (6/01) 8,836 290 585 5,135 2,810 16
Apartments (6/02) 12,547 290 1,582 6,059 4,573 43
Apartments (6/03) 14,662 555 1,555 7,202 5,230 112
Apartments (6/04) 13,383 276 1,816 6,210 4,975 106
Apartments (6/05) 11,284 248 944 5,521 4,501 70
Apartments (6/06) 9,828 0 469 5,131 4,228 0
Apartments (6/07) 11,431 248 939 5,670 4,518 56
Apartments (6/08) 10,422 248 607 5,230 4,297 40
Apartments (6/09) 11,797 439 780 5,510 4,746 322
Apartments (6/10) 9,897 0 660 4,695 4,286 256
Apartments (6/11) 9,313 0 1,046 4,089 4,035 143
Apartments (6/12) 8,739 320 304 4,104 3,973 38
TABLE 9 Number of Apartments by Type of Unit that House the 55+ Age Group
1999-2012
*SRO (Single Room Occupancy) data was included within studio count for 6/99 period. Note: No four-bedroom size apartment units were reported as housing for the 55+ population.
Table 9 shows that the one-and two-bedroom size apartments are the most predominant size of multi-family rental housing of the 55+ age group.
Greater Las Vegas Valley Page 24

GRAPH 9 Percentage Distribution of Apartments by Type of Unit that House the 55+ Age Group
June 2012
Graph 9 demonstrates the 55+ age group’s living preference of residential size of unit. Within the exist-ing market, the one- and two-bedroom size units reflect the highest percentage (92.5%) of where this age group resides. The most significant change over the 2011 period, was the increase of 3.1% who chose to live in one-bedroom size units. The one-bedroom size unit was the only size unit that showed a slight increase in rental rates, up .34% compared to all other size units showing decreases in rental rates.
Distribution of Apartments by Type of Unit that House the 55+ Age Group
1 Bedroom47.0%
2 Bedroom45.5%
Studio3.5%
SRO3.7%
Greater Las Vegas Valley Page 25
3 Bedroom .43%

Distribution of Apartments by Type of Unit that House the 55+ Age Group
GRAPH 10 Distribution by Years of Multi-Family Construction of Units that House the 55+ Age Group
0500
1,0001,5002,0002,5003,000
<1960 60-64 65-69 70-74 75-79 80-84 85-89 90-94 95-99 00-04 2005-2009
2010-2012
Year Built
Greater Las Vegas Valley Page 26
# of
uni
ts
The Nevada Housing Division (Nevada’s Housing Finance Agency) was established by the Legislature in 1975. The Housing Division’s mission was formulated to encourage the private sector and other government entities in the creation and maintenance of safe, decent and affordable housing throughout Nevada. In 1975, the graph below reflects the upward growth trend in the multi-family rental residential housing market. In 1975, the Housing Finance Agency implemented the multi-family bond program and in 1976 the Low-Income Housing Tax Credit Program. The Housing Division has been a major force in Southern Nevada in providing much needed affordable housing for low- to moderate-income families and the 55+ age group. A significant portion of the 55+ age group are retired and living on fixed incomes.

Distribution of Apartments by Zip Code that House the 55+ Age Group
Greater Las Vegas Valley Page 27
Just over fifty percent of all apartment units that house residents who are in the 55+ age group are lo-cated within six zip code areas. The location of housing where seniors appear to prefer to live are in areas which are near gaming, senior services, medical facilities, shopping and/or mass transportation. (See Map 3, page 28.)
Zip Code Number of Units % of Total Cumulative %
89101 1,406 16.09 16.09
89108 762 8.72 24.81
89103 757 8.66 33.47
89121 682 7.80 41.27
89032 680 7.78 49.05
89015 572 6.54 55.59
89106 494 5.65 61.24
89104 462 5.29 66.53
89052 400 4.58 71.11
89119 348 3.98 75.09
89120 302 3.45 78.54
89128 242 2.77 81.31
89002 228 2.61 83.92
89110 222 2.54 86.46
89012 205 2.34 88.80
89131 165 1.89 90.69
89014 156 1.78 92.47
89030 142 1.62 94.09
89142 122 1.40 95.49
89109 105 1.20 96.69
89009 60 .69 97.38
89102 59 .67 98.05
89005 59 .67 98.72
89115 50 .57 99.29
89145 40 .46 99.75
89146 19 .22 99.97
Total 8,739
Table 10 Number of Apartments by Zip Code that House the 55+ Age Group
2012

Greater Las Vegas Valley Page 28
Multi-Family Units by Zip Code that House the 55+ Age Group
MAP 3 Areas Where More Than 50% of Multi-Family Projects that House the 55+ Age Group Are
Located (by Zip Code) 2012

Vacancy Rates for Apartments that House the 55+ Age Group
TABLE 11 Vacancy and Vacancy Rates for Apartments that House the 55+ Age Group
(Data by Year Project Built and By Unit Type)
Year Apartment Complexes
Built
Number Responding to Vacancy Question
Projects Units
Number of Reported
Vacant Units 2012 Survey
Vacancy Rate 6/30/12
Vacancy Rate 6/30/11
Vacancy Rate 6/30/10
Vacancy Rate 6/30/09
Vacancy Rate 6/30/08
Vacancy Rate 6/30/07
2010-2012 12 877 NA NA NA NA -- -- --
2005-2009 12 1,195 86 7.20% 7.28% 6.58% 9.55% 7.12% NA
2000 –2004 24 2,852 229 8.03% 7.74% 8.01% 5.93% 5.73% 3.76%
1995-1999 11 1,818 166 9.13% 9.55% 10.62% 9.47% 9.30% 6.11%
1990-1994 1 320 27 8.44% 6.40% 9.65% 9.53% 6.81% 3.80%
1985-1989 3 488 40 8.20% 15.96% 5.95% 6.75% 4.55% 3.72%
1980-1984 0 0 -- -- 7.83% 6.05% 1.84% 7.24% 1.96%
1975-1979 1 59 2 3.39% 14.65% 7.71% 7.26% 4.84% 2.87%
1970-1974 0 0 -- -- -- -- -- 7.46% 0.00%
Pre-1970 3 338 13 3.85% 9.37% 25.73% 11.01% 6.33% 4.07%
Date unknown 1 472 18 3.81% 2.17% 2.5% .00% 0.0% 16.67%
Totals 56 7,542 581 7.70% 8.84% 9.00% 8.00% 6.70% 4.28%
Note: Totals include counts from all types of complexes whose units are 75% to 100% occupied by the 55+ age group. Totals reflect findings from apartment complexes who responded to the vacancy question on the NHD Apartment Survey. NA - Units are in the rent-up stage. -- Indicates no response to vacancy question or is a date prior to construction.
Greater Las Vegas Valley Page 29
Table 11 reflects an overall 1.14% decrease in vacancies from 2011 to 2012 for the targeted 55+ age group’s residential rental housing. This information is based upon those complexes who reported vacancy in-formation.
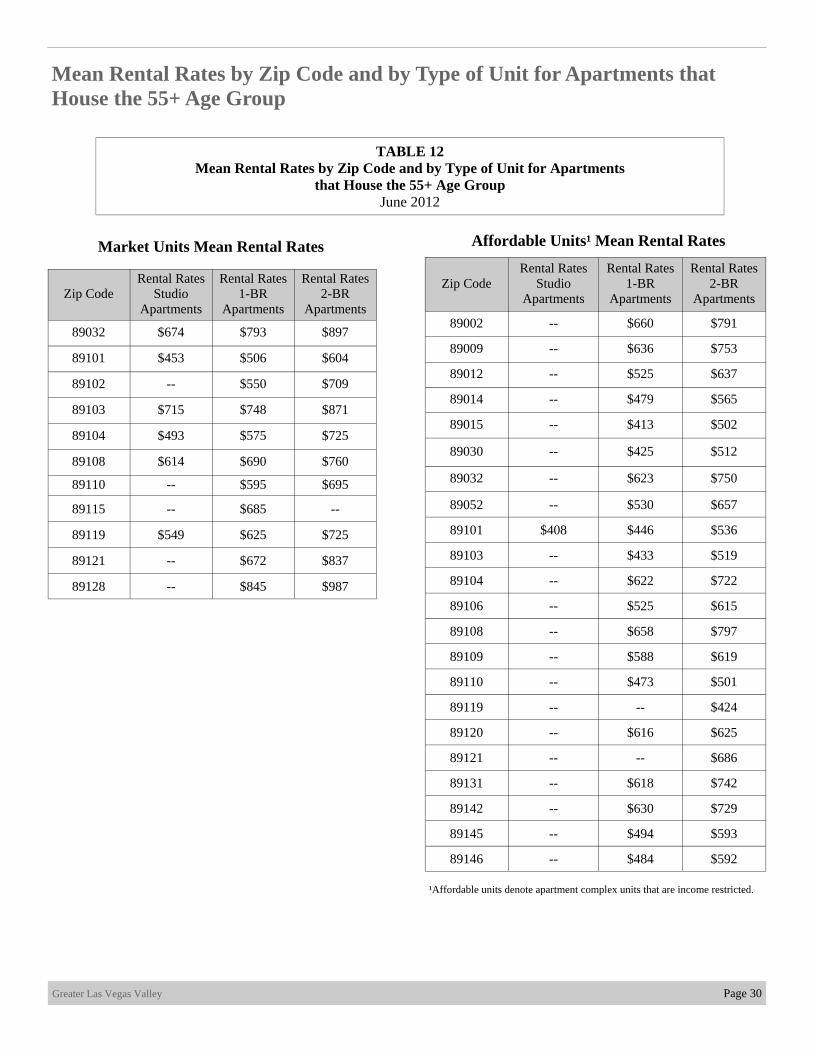
Mean Rental Rates by Zip Code and by Type of Unit for Apartments that House the 55+ Age Group
Zip Code Rental Rates
Studio Apartments
Rental Rates 1-BR
Apartments
Rental Rates 2-BR
Apartments
89032 $674 $793 $897
89101 $453 $506 $604
89102 -- $550 $709
89103 $715 $748 $871
89104 $493 $575 $725
89108 $614 $690 $760
89110 -- $595 $695
89115 -- $685 --
89119 $549 $625 $725
89121 -- $672 $837
89128 -- $845 $987
TABLE 12 Mean Rental Rates by Zip Code and by Type of Unit for Apartments
that House the 55+ Age Group June 2012
Greater Las Vegas Valley Page 30
Zip Code Rental Rates
Studio Apartments
Rental Rates 1-BR
Apartments
Rental Rates 2-BR
Apartments
89002 -- $660 $791
89009 -- $636 $753
89012 -- $525 $637
89014 -- $479 $565
89015 -- $413 $502
89030 -- $425 $512
89032 -- $623 $750
89052 -- $530 $657
89101 $408 $446 $536
89103 -- $433 $519
89104 -- $622 $722
89106 -- $525 $615
89108 -- $658 $797
89109 -- $588 $619
89110 -- $473 $501
89119 -- -- $424
89120 -- $616 $625
89121 -- -- $686
89131 -- $618 $742
89142 -- $630 $729
89145 -- $494 $593
89146 -- $484 $592
Market Units Mean Rental Rates Affordable Units¹ Mean Rental Rates
¹Affordable units denote apartment complex units that are income restricted.

Type of Units Studio 1-Bedroom 2-Bedroom
Market Units Rental Rate $570 $662 $788
Affordable Units¹ Rental Rate $408 $505 $597
Percentage Difference between Affordable and Market-Rate Multi-Family Residential Unit Rental Rates
-28.42% -23.72% -24.24%
TABLE 12-A Mean Rental Rates
Market Rate and Affordable Housing Rental Rate Comparison that House the 55+ Age Group June 2012
Market Rate and Affordable Housing Rental Rate Comparison
The comparative data reflected in Tables 12-A and 12-B clearly shows the impact the economy has had on widening the gap of unrestricted market unit rental rates versus affordable units rental rates. Affordable residential rental rates, for all size units, continues to offer significantly lower rental rates for the 55+ age group’s preferred one- and two-bedroom size housing. (Refer to Graph 9).
Greater Las Vegas Valley Page 31
TABLE 12-B Mean Rental Rates
Market Rate and Affordable Housing Rental Rate Percentage Differences that House the 55+ Age Group June 2011 - June 2012
Type of Units Studio 1-Bedroon 2-Bedroom
2011 Percentage Difference between Affordable and Market-Rate Multi-Family Residential Unit Rental Rates
-1.03% -15.16% -17.00%
2012 Percentage Difference between Affordable and Market-Rate Multi-Family Residential Unit Rental Rates
-28.42% -23.72% -24.24%
Percentage Rate Change from 2011 to 2012
+27.39% +8.56% +7.24%
¹ Affordable units denote apartment complex units that are income restricted.

Greater Reno/Sparks Area Page 32
Section II
Greater Reno/Sparks Area

Key Points Key findings from the 2nd Quarter 2012 survey reflect the following: 1. The two–bedroom size apartments continue to remain
the most popular unit type. 2. The two-bedroom size apartments comprises 45% of
identified multi-family housing units. 3. Approximately 81% of the area’s multi-family hous-
ing inventory consists of one-and two-bedroom size units.
4. Years 1980 to 1984 reflect the highest number of new units constructed as well as apartment projects that had significantly higher number of residential units within the complex.
5. Data reflects an overall trend of smaller projects and fewer number of complexes being built from 1985 to 2012.
6. Data reflects an overall vacancy rate of 7.04%, rep-resenting a decrease of 1.43% in units available in the rental market.
7. The single room occupancy and studio size residen-tial multi-family units experienced a higher vacancy rate than any other size of residential multi-family units.
8. The four-bedroom size units show the lowest vacancy rate at 1.60%.
9. Three zip codes (89501,89502, and 89512) experi-enced higher vacancy rates than any other area within the Greater Reno/Sparks Area. These areas are geo-graphically located in the center of Reno.
10. Starting with year 2000, new multi-family develop-ment has shown a steady decline.
11. Years 1995 through 2004 showed increased construc-tion for both the three-bedroom and studio size units.
12. The 1995 through 2004 time period reflects the high-est number of three-bedroom size residential units added to the Greater Reno/Sparks Area’s housing inventory.
13. Year 2010 and the first six months of 2012 reflect equal numbers of studio- and three-bedroom size units. This activity falls well below construction of these size units constructed from 1995 to 2009.
14. Rental rates, as of June 2012, reflect an increase in
monthly rental rates for all size units. 15. The greatest rental rate change occurred in the studio-
and two-bedroom size units with both size units showing a rental rate increase of 4.63% and 3.45% respectively.
16. Affordable rents¹ for the one, two and three-bedroom size units are an average of 17% lower than market rates for comparable configuration.
17. The studio and three-bedroom size units show the highest rental rate percentage difference for afford-able units, showing rents that are 19% to 20% lower than market-rate rents.
18. The one-bedroom size unit remains the most domi-nant size unit for the 55+ age group, representing nearly 72% of the housing where seniors prefer to reside.
19. Zip code 89512 data reflects that more than 38% of apartment units located in that geographical area are targeted to serve the 55+ age group. This is an area centrally located between the Cities of Reno and Sparks.
20. Zip code 89503 shows the highest vacancy rate at 9.91% that house the 55+ age group.
21. The mean market rental rate that house the 55+ age group ranges from $386 a month for a studio size unit up to $954 for two-bedroom size units.
22. Affordable rents¹ that house the 55+ population are an average of 6.82% lower than market rents for comparable configuration.
23. In comparison to the Greater Las Vegas Area, data supports the Greater Reno/Sparks Area experiencing a lower vacancy rate, higher rental rates, and less of a gap between restricted and unrestricted rental rates.
Greater Reno/Sparks Area Page 33
Greater Reno/Sparks Apartment Survey Study
“ Affordable rents¹ that house the 55+ population are an average of 13.67% lower than market rents for comparable configuration.”
¹Affordable rents denote apartment complex units that are income restricted.

Distribution of Apartments by Type of Unit
Total Units SRO¹ Studios 1-Bedroom 2-Bedroom 3-Bedroom 4-Bedroom
June 2001 24,046 335 1,700 8,562 11,757 1,600 92
June 2002 28,499 473 2,448 9,733 13,541 2,123 181
June 2003 30,346 802 2,922 10,116 13,913 2,364 229
June 2004 29,947 775 2,785 9,930 13,815 2,293 349
June 2005 28,497 316 1,976 10,053 13,537 2,401 214
June 2006 28,278 249 2,236 9,616 13,331 2,514 332
June 2007 27,050 414 2,667 9,047 12,290 2,276 356
June 2008 30,786 537 3,486 10,144 13,782 2,446 391
June 2009 30,057 1,045 2,570 10,280 13,558 2,390 214
June 2010 24,299 534 3,086 7,654 10,829 1,995 201
June 2011 18,482 279 2,459 5,843 7,839 1,737 325
June 2012 22,769 490 1,721 8,149 10,249 1,847 313
The split of unit types shows that the two-bedroom size apartment unit remains the most common type of multi-family rental housing unit in the Greater Reno/Sparks Area.
TABLE 13 Number of Apartments by Type of Unit
June 2001-2012
¹ Single Room Occupancy.
Greater Reno/Sparks Area Page 34
Description June 2008 June 2009 June 2010 June 2011
Total # of apartment complexes identified 253 217 249 257
Total # of apartment units identified 33,562 32,021 34,138 34,637
# of units identified converted from apartment rental units to condominiums 0 0 1,395 1,014
# of identified rental units where there was no response, phone systems allowed for screening calls, or owners and/or managers refused to participate 1,279 1,632 7,324 14,234
# of identified rental areas where mail was returned, in those cases rental complexes are too small to have on-site management office 1,497 332 1,120 907
Total # of apartment rental units validated for database 30,786 30,057 24,299 18,482
June 2012
265
34,367
376
10,311
911
22,769
Table 13-A Number of Apartments by Type of Unit, Database Breakdown

GRAPH 11 Distribution of Apartment Units by Size
June 2012
Distribution of Apartment Units by Size
Greater Reno/Sparks Area Page 35
SRO2.15%
Studio7.56%
2 Bedroom45.01%
3 Bedroom8.11%
1 Bedroom35.79%
4 Bedroom1.37%
Graph 11 shows the highest percentage of apartment units are two-bedroom in size. Nearly 81% of the area’s multi-family rental housing inventory consists of residential rental units that are either one- or two-bedroom in size.

25.9
48.533.2
149.6161.3
257.4
122.4
165.1 168.9 163.6
123.3 122.5
0
50
100
150
200
250
300
<1960 60-64 65-69 70-74 75-79 80-84 85-89 90-94 95-99 00-04 05-09 10-12
Year Built
Units Per Project
Growth in Average Apartment Project Size
GRAPH 12 Growth in Average Apartment Project Size by 5-year Increments
<1960 to 2012
Graph 12 reflects the trend for size of apartment complexes developed in the Greater Reno/Sparks Area since 1960.
Greater Reno/Sparks Area Page 36

Vacancy Rates
Date Units Built
2nd Qtr. 2012 # Responding to
vacancy question Projects Units
2nd Qtr. 2012 # of Reported Vacant
Vacancy Rate
6/30/12
Vacancy Rate
6/30/11
Vacancy Rate
6/30/10
Vacancy Rate
6/30/09
Vacancy Rate
6/30/08
Vacancy Rate
6/30/07
2010-2012* 4 391 * * * NA NA NA N/A
2005-2009 14 1,726 115 6.67% 6.36% 8.7% 14.5% 4.8% 2.6%
2000-2004 21 3,435 208 6.05% 8.13% 9.5% 13.9% 10.6% 8.8%
1995-1999 22 3,715 195 5.25% 7.12% 8.3% 10.7% 6.6% 5.0%
1990-1994 7 1,156 77 6.66% 6.25% 11.5% 8.2% 5.1% 3.5%
1985-1989 9 1,102 103 9.35% 5.50% 7.5% 8.3% 4.5% 2.3%
1980-1984 14 3,603 273 7.58% 7.21% 8.0% 9.9% 6.9% 2.9%
1975-1979 28 4,517 417 9.23% 9.98% 11.4% 13.6% 8.9% 4.5%
1970-1974 16 2,394 145 6.06% 12.42% 12.4% 13.0% 8.0% 7.9%
Pre-1970 14 525 35 6.67% 11.17% 14.8% 16.4% 13.3% 5.5%
Date unknown 4 106 0 0.00% 5.88% 7.6% 16.6% 8.7% 1.8%
Totals 149 22,279 1,568 7.04% 8.47% 10.0% 12.1% 7.9% 5.3%
TABLE 14 Vacancy Rates¹
(Data by Year Project was Built)
The Division’s second quarter 2012 survey shows a 7.04% vacancy rate for the Greater Reno/Sparks Area. This data reflects a decrease of 1.43% in units available in the rental market.
¹Vacancy data is derived from a 100.0% survey response rate to the specific vacancy rate question. *2010-2012 data are not included in determining the overall vacancy rate of the Greater Reno/Sparks area as reasonable rent-up time is allowed prior to determining vacancy rates. N/A - not applicable. Note: Totals do not include assisted living, group homes, or subsidized housing.
Greater Reno/Sparks Area Page 37

Apartment Type Number of
Units in Sample¹
Vacancies by Unit Type
Vacancy Rate
Single Room Occupancy (SRO) 490 108 22.04%
Studio Apartments 1,721 177 10.28%
1-Bedroom Size Apartments 8,149 351 4.31%
2-Bedroom Size Apartments 10,249 581 5.67%
3-Bedroom Size Apartments 1,847 104 5.63%
4-Bedroom Size Apartments 313 5 1.60%
TABLE 15 Reported Vacancies By Type of Unit for All Reporting Apartment Complexes
June 2012
¹Number of units in sample and vacancy rate were derived from the responses of apartment complexes that provided a breakdown of number of vacancies by apartment type.
Table 15 reflects that in the Greater Reno/Sparks Area, the single room occupancy size apartment units, in this point-in- time survey, showed a higher vacancy rate than any other size residential multi-family rental units. The four-bedroom size units reflect the lowest vacancy rate at 1.60%
Vacancy Rates
Greater Reno/Sparks Area Page 38

Housing Units and Vacancy Rate by Zip Code
TABLE 16 Total Number of Housing Units and Vacancy Rate by Zip Code
For all Reporting Apartment Complexes June 2009-2012
Zip Code
Total Number of Apartment Units by
Zip Code 2012
Vacancy Rate (%) by Zip Code for those
Apartment Complexes Reporting # of
Vacancies 2012
Vacancy Rate (%) by Zip Code for those
Apartment Complexes Reporting # of
Vacancies 2011
Vacancy Rate (%) by Zip Code for those
Apartment Complexes Reporting # of
Vacancies 2010
Vacancy Rate (%) by Zip Code for those
Apartment Complexes Reporting # of
Vacancies 2009
89431 3,020 4.2% 5.7% 6.4% 13.4%
89433 397 2.3% 5.5% 3.1% 6.5%
89434 776 4.0% 2.4% 5.9% 8.7%
89436 1,131 5.3% 6.4% 8.2% 11.9%
89501 783 12.4% 8.8% 11.2% 10.0%
89502 4,568 10.0% 13.1% 14.8% 14.8%
89503 1,829 5.8% 9.4% 11.2% 11.1%
89506 936 8.3% 6.2% 12.1% 15.0%
89509 2,472 6.7% 4.3% 6.6% 11.1%
89511 404 7.4% 6.4% 8.4% 10.2%
89512 2,479 10.0% 11.4% 17.0% 12.4%
89521 391 4.3% 8.1% 5.4% 17.9%
89523 3,093 4.6% 8.7% 7.2% 10.4%
Total 22,279 7.0% 8.5% 10.0% 12.1%
Greater Reno/Sparks Area Page 39
Table 16 shows that zip codes 89501, 89502, and 89512 experienced the highest percentage of vacan-cies within the Greater Reno/Sparks Area.
Note: Vacancy rate does not include units that are in a rent-up phase.

Distribution of Rental Units by Zip Code
TABLE 17 Total Number of Apartment Units by Zip Code
June 2012
Zip Code Total Number of Apartment Units
by Zip Code Percent Cumulative %
89502 4,666 20.49 20.49
89523 3,093 13.58 34.07
89431 3,062 13.45 47.52
89512 2,479 10.89 58.41
89509 2,472 10.86 69.27
89503 1,829 8.03 77.30
89436 1,131 4.97 82.27
89506 936 4.11 86.38
89501 783 3.44 89.82
89434 776 3.41 93.23
89511 754 3.31 96.54
89433 397 1.74 98.28
89521 391 1.72 100.00
Total 22,769
Greater Reno/Sparks Area Page 40
Based upon data from survey respondents, four zip code areas house more than one half of multi-
family residential housing units in the Greater Reno/Sparks Area. (See Map 4, page 41.)
89502
89523
89431
89512

Greater Reno/Sparks Area Page 41
MAP 4 High Density Zip Code Areas of Residential Multi-Family Housing
Zip Code Map of the Greater Reno/Sparks Area

Number of Apartment Units By Year Built Since 1980
GRAPH 13 Multi-Family Units by Year Built Since 1980
1982-2012
0
500
1000
1500
2000
2500
3000
82-83
84-85
86-87
88-89
90-91
92-93
94-95
96-97
98-99
00-01
02-03
04-05
06-07
08-09
10-12
# of Units
Year Built
Greater Reno/Sparks Area Page 42
Years 1998 and 1999 saw the greatest number of new apartment units produced in the Greater Reno/Sparks Area. Starting with year 2000, new multi-family development has shown a steady decline. This is a trend being experienced in all geographical areas of the state.

Mix of Apartment Unit Types By Year Built
1975-1979
1980-1984
1985-1989
1990-1994
1995-1999
2000-2004
2005-2009
2010-2012
Studio3-Bedroom
0
200
400
600
800
1000
1200
GRAPH 14 Apartment Unit Types by Year Built
1975-2012
Year Built
# of Units by Type
Greater Reno/Sparks Area Page 43
The 1995 through 2004 time period reflects the highest number of three-bedroom size residential units added to the Greater Reno/Sparks Area’s housing inventory. Whereas, the 2010-2012 time period reflected an unusual trend of almost equal numbers of studio- and three-bedroom size units being constructed.

Distribution of Rents by Apartment Size
Date Studio 1-Bedroom 2-Bedroom 3-Bedroom
June 2002 $464.99 $585.14 $707.06 $919.46
% change 01-02 +4.1% +1.9% +1.6% -.44%
June 2003 $482.67 $595.87 $707.16 $908.55
%change 02-03 +3.7% +1.8% 0.0% -1.2%
June 2004 $478.06 $599.56 $719.18 $930.99
% change 03-04 -.96% +.62% +1.7% +2.5%
June 2005 $501.71 $626.16 $749.86 $960.90
% change 04-05 +4.71% +4.25% +4.09% +3.11%
June 2006 $531.63 $663.41 $772.32 $992.22
% change 05-06 +5.63% +5.61% +2.91% +3.16%
June 2007 $537.48 $688.31 $820.88 $1,071.86
% change 06-07 +1.09% +3.62% +5.92% +7.43%
June 2008 $543.79 $706.24 $855.54 $1,202.22
% change 07-08 +1.16% +2.54% +4.05% +10.84%
June 2009 $548.02 $677.81 $816.28 $1,074.71
% change 08-09 +.78% -4.02% -4.59% -10.61%
June 2010 $520.54 $650.18 $801.44 $1,041.33
% change 09-10 -5.01% -4.08% -1.82% -3.11%
June 2011 $494.77 $647.81 $765.67 $1,015.65
% change 10-11 -4.95% -.36% -4.46% -2.47%
June 2012 $517.70 $665.54 $792.12 $1,028.22
% change 11-12 +4.63% +2.74% +3.45% +1.24%
TABLE 18 Mean Rental Rates by Apartment Sizes
Market Units Rental Rate June 2012
Greater Reno/Sparks Area Page 44
Rental rates, as of June 2012 shown in Table 18, reflect an increase in monthly rental rates for all size units in the Greater Reno/Sparks Area.

Type of Units Studio 1-Bedroom 2-Bedroom 3-Bedroom
2012 2011 2012 2011 2012 2011 2012 2011
Market Units Rental Rate $517.70 $494.77 $665.54 $647.81
$792.12 $765.67
$1,028.22 $1,015.65
Affordable Units¹ Rental Rate $415.83 $503.30 $560.96 $571.17 $681.45 $700.22 $822.84 $855.45
Percentage Difference between Market-Rate and Affordable Multi-family Residential Unit Rental Rates
-19.68% +1.72% -15.71% -11.83% -13.97% -8.55% -19.97% -15.77%
TABLE 19 Mean Rental Rates
Market Rate and Affordable Residential Rental Rate Comparison 2011-2012
¹ Affordable units denote apartment complex units that are income restricted.
Distribution of Rents by Type of Apartment
Greater Reno/Sparks Area Page 45
Table 19 shows comparative data between market and affordable residential rental rates. Data collected from the second quarter 2011 and 2012 multi-family housing survey for the Greater Reno/Sparks Area reflects higher rental rates for market units in 2012 while lower rates are reflected for units located in designated af-fordable housing. The gap between market and affordable units increased significantly in all size units from 2011 to 2012. Affordable rental rates were lower than market rates among all size of units, with affordable rents ranging from 14% to nearly 20% lower than market rates.

Greater Reno/Sparks Area Page 46
GRAPH 15 Distribution of Mean Rental Rates for Studio Apartments
Market Units Rental Rate June 2012
Distribution of Rents by Apartment Size
0
1
2
3
4
5
6
400 425 450 475 500 525 550 575 600 625 650 675 700 725
Monthly Rents
Average Low= $483.12 up .46% since 2011 Average High= $552.29 up 8.6% since 2011 Note: 24 apartment complexes reporting.
# of
Apa
rtmen
t Com
plex
es

Greater Reno/Sparks Area Page 47
Distribution of Rents by Apartment Size (continued)
GRAPH 16 Distribution of Mean Rental Rates for 1-Bedroom Apartments
Market Units Rental Rate June 2012
0
2
4
6
8
10
475 575 675 775 875 975 1075 >1175
Monthly Rents
Average Low= $622.91 up .44% since 2011 Average High= $708.18 up 4.84% since 2011 Note: 83 projects reporting.
# of
Apa
rtmen
t Com
plex
es

Greater Reno/Sparks Area Page 48
Distribution of Rents by Apartment Size (continued)
GRAPH 17 Distribution of Rental Rates for 2-Bedroom Apartments
Market Units Rental Rate June 2012
0123456789
10
525 625 725 825 925 1025 1125 1225 1325
Monthly Rents
Average Low= $731.45 up 1.02% since 2011 Average High= $852.79 up 5.64% since 2011 Note: 81 apartment complexes reporting.
# of
Apa
rtmen
t Com
plex
es
Greater Reno/Sparks Area Page 49
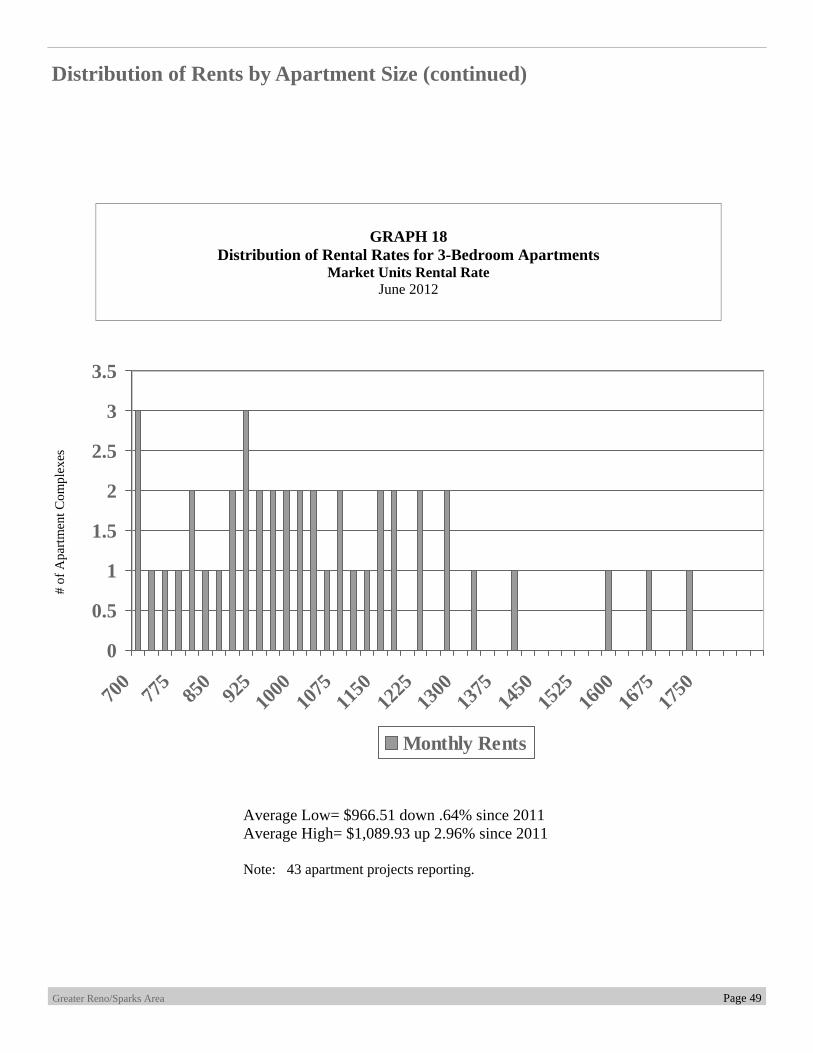
Distribution of Rents by Apartment Size (continued)
GRAPH 18 Distribution of Rental Rates for 3-Bedroom Apartments
Market Units Rental Rate June 2012
0
0.5
1
1.5
2
2.5
3
3.5
700
775
850
925
1000
1075
1150
1225
1300
1375
1450
1525
1600
1675
1750
Monthly Rents
Average Low= $966.51 down .64% since 2011 Average High= $1,089.93 up 2.96% since 2011 Note: 43 apartment projects reporting.
# of
Apa
rtmen
t Com
plex
es
Distribution of Apartments by Type of Unit That House the 55+ Age Group
TABLE 20 Number of Apartments by Type of Unit that House the 55+ Age Group
2004-2012
Apartments Targeting 55+ Total Units SRO Studios 1-Bedroom 2-Bedroom 3-Bedroom
Apartments (6/04) 2,000 209 84 862 789 56
Apartments (6/05) 1,593 208 57 823 458 47
Apartments (6/06) 812 0 22 657 133 0
Apartments (6/07) 1,034 0 65 653 295 21
Apartments (6/08) 1,403 0 111 966 305 21
Apartments (6/09) 1,908 268 217 928 464 31
Apartments (6/10) 1,044 208 58 556 222 0
Apartments (6/11) 1,009 -- 137 649 222 1
Apartments (6/12) 1,237 31 113 864 228 1
GRAPH 19 Percentage Distribution of Apartments by Type of Unit that House the 55+ Age Group (June 2012)
Greater Reno/Sparks Area Page 50
Table 20 and Graph 19 below reflect that the one-bedroom size apartment is the most preferred resi-dential rental size unit of the 55+ age group.
1 Bedroom71.70%
Studio9.38%
2 Bedroom22%

Table 21 data reflects the survey’s inventory of apartments by zip code that target housing for the 55+ age group. More than one-third of this housing inventory is located within zip code 89512. In contrast, the highest vacancy rate is in an area adjacent to zip code 89512 with nearly 18% of the housing targeted or pre-ferred by the 55+ age group. (Refer to map 5, page 52.)
Greater Reno/Sparks Area Page 51
Distribution of Apartments by Zip Code that House the 55+ Age Group
Table 21 Number of Apartment Units by Zip Code that House the 55+ Age Group
2012
Zip Code Number of Units % of Total Cumulative %
89431 197 15.92 15.92
89501 115 9.30 25.22
89502 225 18.19 43.41
89503 222 17.95 61.36
89512 478 38.64 100.00
Total 1,237
Table 22 Vacancy Rates Percentage by Zip Code that House the 55+ Age Group
2012
Zip Code Number of Units # of Vacancies Vacancy Rate
89431 197 1 .51%
89501 115 4 3.48%
89502 225 3 1.33%
89503 222 22 9.91%
89512 478 12 2.51%
Total 1,237 42 3.39%

Greater Reno/Sparks Area Page 52
Multi-Family Units by Zip Code that House the 55+ Age Group
MAP 5 Multi-Family Density and Vacancy Rate by Zip Code that House the 55+ Age Group
Denotes area with highest vacancy rate Denotes area with highest density

Mean Rental Rates by Zip Code and by Type of Unit for Apartments that House the 55+ Age Group
Greater Reno/Sparks Area Page 53
Zip Code
Studio
Apartments
1-BR
Apartments
2-BR
Apartments 89012 -- $455.00 -- 89431 $386.50 -- -- 89502 $769.00 $705.50 $954.00 89503 -- $557.50 $615.00
Market Rate Rental Rates
Zip Code Studio Apartments
1-BR Apartments
2-BR Apartments
89431 -- $486.00 $700.83
89502 -- $474.25 $686.50
89503 -- $602.50 $722.50
89512 $371.00 $641.17 $628.75
89501 -- $587.50 $707.00
Affordable Units¹ Rental Rates
TABLE 23 Mean Rental Rates by Zip Code and by Type of Unit for Apartments
that House the 55+ Age Group
Type of Units Studio 1-Bedroom 2-Bedroom
Market Units Rental Rate $577.75 $605.87 $784.50
Affordable Units¹ Rental Rate $554.25 $583.68 $684.72
Percentage Difference between Affordable and Market Rate Multi-Family Residential Unit Rental Rates
-4.07% -3.66% -12.72%
TABLE 23-A Mean Rental Rates
Market Rate and Affordable Housing Rental Rate Comparison that House the 55+ Age Group
¹Affordable units denote apartment complex units that are income restricted.

Section III
Rural Nevada
Rural Nevada Page 54
Rural Nevada Page 55
Rural Nevada Apartment Survey Study
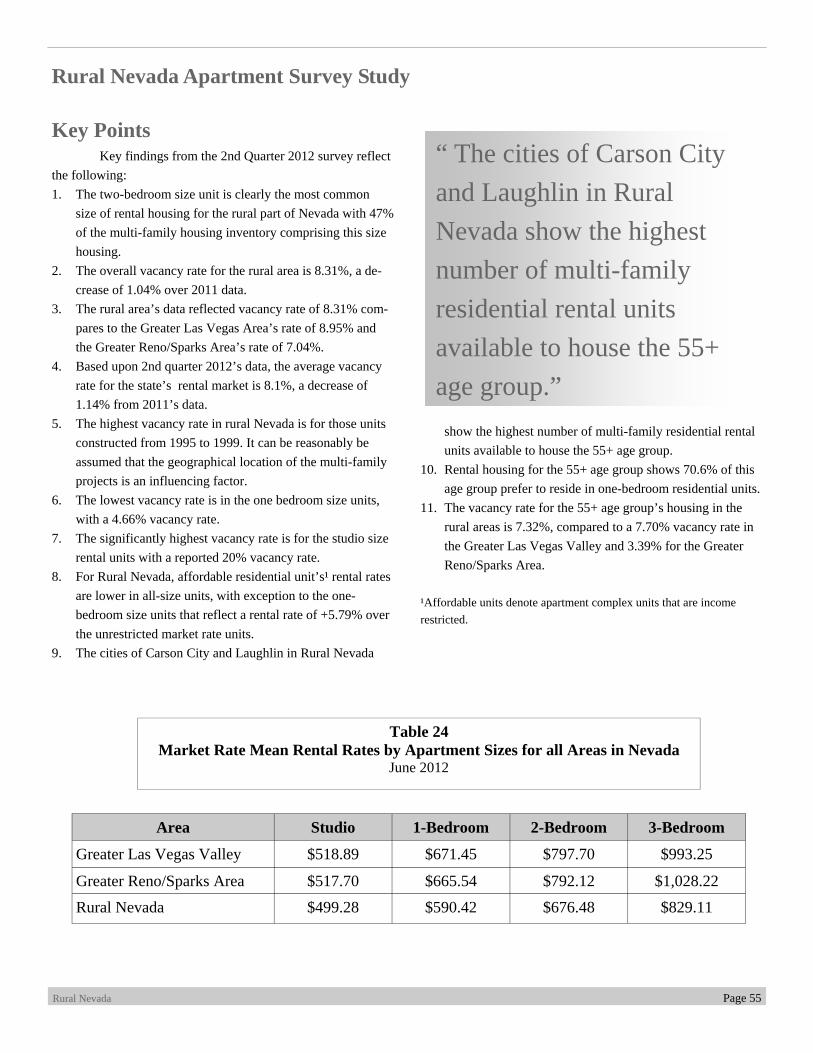
Key Points Key findings from the 2nd Quarter 2012 survey reflect the following: 1. The two-bedroom size unit is clearly the most common
size of rental housing for the rural part of Nevada with 47% of the multi-family housing inventory comprising this size housing.
2. The overall vacancy rate for the rural area is 8.31%, a de-crease of 1.04% over 2011 data.
3. The rural area’s data reflected vacancy rate of 8.31% com-pares to the Greater Las Vegas Area’s rate of 8.95% and the Greater Reno/Sparks Area’s rate of 7.04%.
4. Based upon 2nd quarter 2012’s data, the average vacancy rate for the state’s rental market is 8.1%, a decrease of 1.14% from 2011’s data.
5. The highest vacancy rate in rural Nevada is for those units constructed from 1995 to 1999. It can be reasonably be assumed that the geographical location of the multi-family projects is an influencing factor.
6. The lowest vacancy rate is in the one bedroom size units, with a 4.66% vacancy rate.
7. The significantly highest vacancy rate is for the studio size rental units with a reported 20% vacancy rate.
8. For Rural Nevada, affordable residential unit’s¹ rental rates are lower in all-size units, with exception to the one-bedroom size units that reflect a rental rate of +5.79% over the unrestricted market rate units.
9. The cities of Carson City and Laughlin in Rural Nevada
show the highest number of multi-family residential rental units available to house the 55+ age group.
10. Rental housing for the 55+ age group shows 70.6% of this age group prefer to reside in one-bedroom residential units.
11. The vacancy rate for the 55+ age group’s housing in the rural areas is 7.32%, compared to a 7.70% vacancy rate in the Greater Las Vegas Valley and 3.39% for the Greater Reno/Sparks Area.
¹Affordable units denote apartment complex units that are income restricted.
Area Studio 1-Bedroom 2-Bedroom 3-Bedroom
Greater Las Vegas Valley $518.89 $671.45 $797.70 $993.25
Greater Reno/Sparks Area $517.70 $665.54 $792.12 $1,028.22
Rural Nevada $499.28 $590.42 $676.48 $829.11
Table 24 Market Rate Mean Rental Rates by Apartment Sizes for all Areas in Nevada
June 2012
“ The cities of Carson City and Laughlin in Rural Nevada show the highest number of multi-family residential rental units available to house the 55+ age group.”

Rural Nevada Page 56
TABLE 25 Number of Apartments in Rural Nevada by Type of Unit
June 2012
Distribution of Apartments by Type of Unit
Total Units SRO Studios 1-Bedroom 2-Bedroom 3-Bedroom 4-Bedroom
June 2005 2,355 24 38 723 1,183 355 12
June 2006 5,958 191 204 2,093 2,815 611 44
June 2007 5,104 208 239 1,655 2,320 663 19
June 2008 7,778 25¹ 531 2,376 3,499 1287 60
June 2009 6,264 23 489 1,906 2,769 1,021 56
June 2010 6,745 193 504 1,904 3,002 1,086 56
June 2011 6,248 25¹ 504 2,059 2,659 941 60
June 2012 5,672 0¹ 375 1,757 2,669 815 56
GRAPH 20 Distribution of Apartment Units in Rural Nevada by Size
June 2012
¹Several SRO units were reclassified as studio units.
4 Bedroom1%
Studio7%
2 Bedroom47%
3 Bedroom14%
1 Bedroom31%
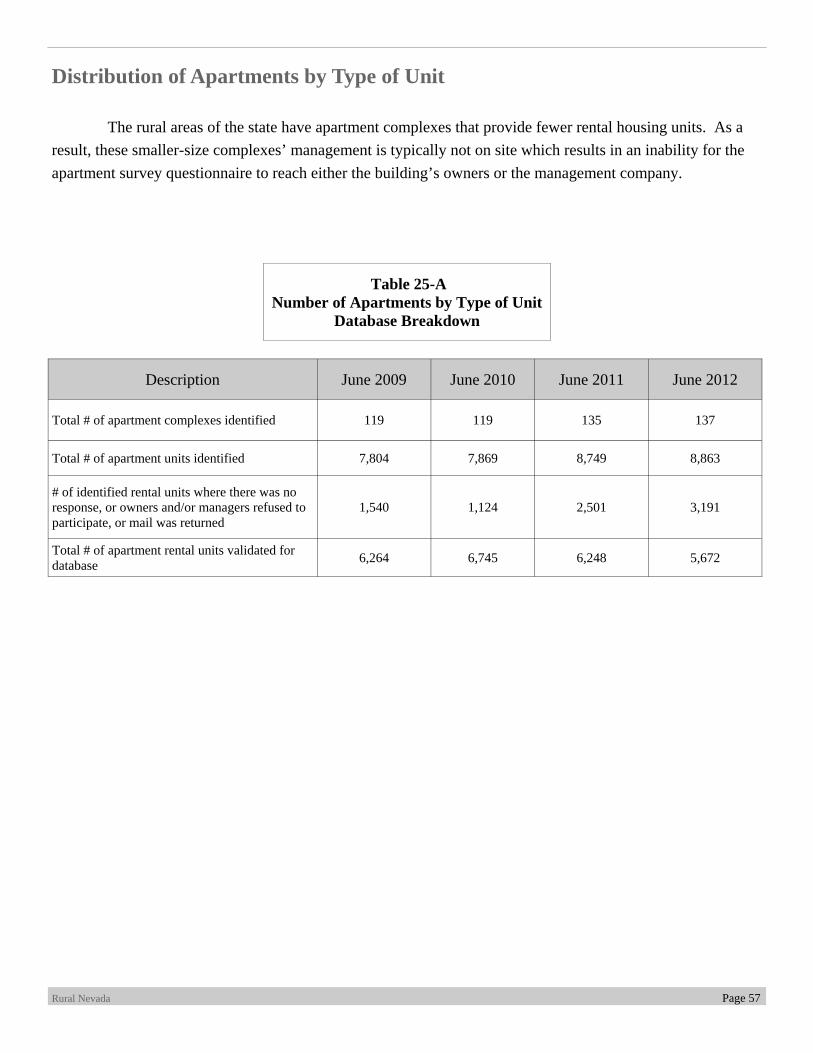
Description June 2009 June 2010 June 2011 June 2012
Total # of apartment complexes identified 119 119 135 137
Total # of apartment units identified 7,804 7,869 8,749 8,863
# of identified rental units where there was no response, or owners and/or managers refused to participate, or mail was returned
1,540 1,124 2,501 3,191
Total # of apartment rental units validated for database 6,264 6,745 6,248 5,672
Table 25-A Number of Apartments by Type of Unit
Database Breakdown
Distribution of Apartments by Type of Unit
Rural Nevada Page 57
The rural areas of the state have apartment complexes that provide fewer rental housing units. As a result, these smaller-size complexes’ management is typically not on site which results in an inability for the apartment survey questionnaire to reach either the building’s owners or the management company.
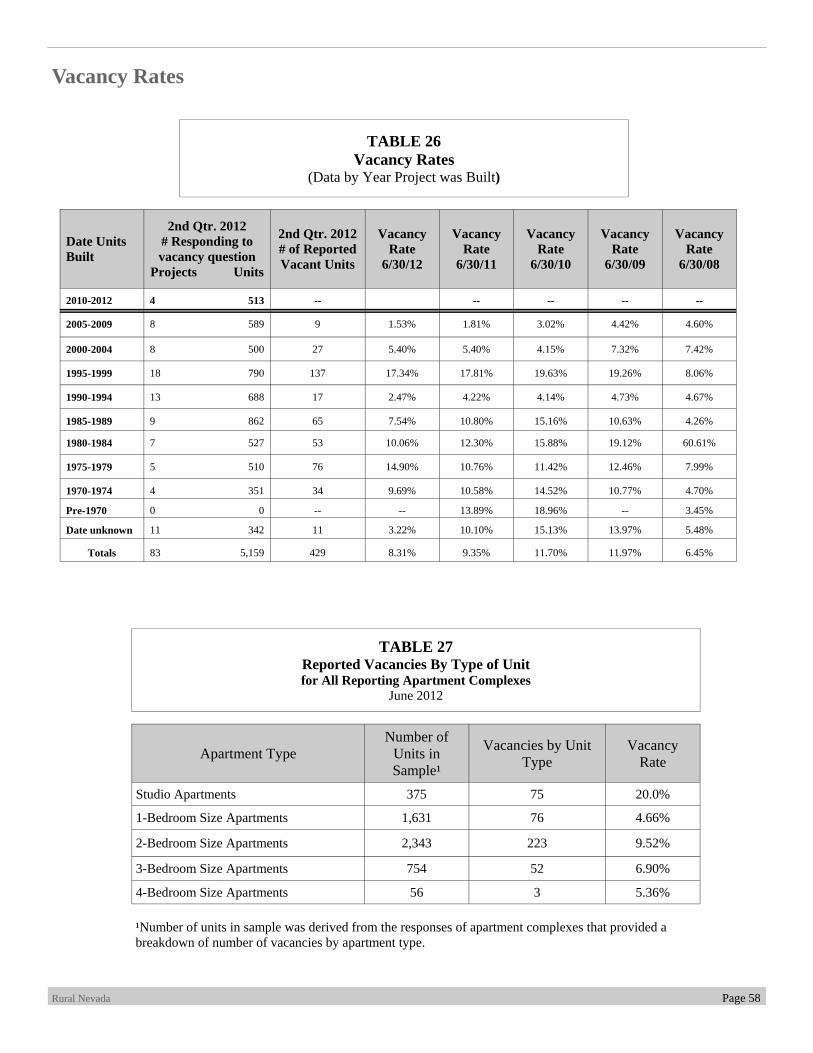
Vacancy Rates
TABLE 26 Vacancy Rates
(Data by Year Project was Built)
Date Units Built
2nd Qtr. 2012 # Responding to vacancy question
Projects Units
2nd Qtr. 2012 # of Reported Vacant Units
Vacancy Rate
6/30/12
Vacancy Rate
6/30/11
Vacancy Rate
6/30/10
Vacancy Rate
6/30/09
Vacancy Rate
6/30/08
2010-2012 4 513 -- -- -- -- --
2005-2009 8 589 9 1.53% 1.81% 3.02% 4.42% 4.60%
2000-2004 8 500 27 5.40% 5.40% 4.15% 7.32% 7.42%
1995-1999 18 790 137 17.34% 17.81% 19.63% 19.26% 8.06%
1990-1994 13 688 17 2.47% 4.22% 4.14% 4.73% 4.67%
1985-1989 9 862 65 7.54% 10.80% 15.16% 10.63% 4.26%
1980-1984 7 527 53 10.06% 12.30% 15.88% 19.12% 60.61%
1975-1979 5 510 76 14.90% 10.76% 11.42% 12.46% 7.99%
1970-1974 4 351 34 9.69% 10.58% 14.52% 10.77% 4.70%
Pre-1970 0 0 -- -- 13.89% 18.96% -- 3.45%
Date unknown 11 342 11 3.22% 10.10% 15.13% 13.97% 5.48%
Totals 83 5,159 429 8.31% 9.35% 11.70% 11.97% 6.45%
TABLE 27 Reported Vacancies By Type of Unit for All Reporting Apartment Complexes
June 2012
Apartment Type Number of
Units in Sample¹
Vacancies by Unit Type
Vacancy Rate
Studio Apartments 375 75 20.0%
1-Bedroom Size Apartments 1,631 76 4.66%
2-Bedroom Size Apartments 2,343 223 9.52%
3-Bedroom Size Apartments 754 52 6.90%
4-Bedroom Size Apartments 56 3 5.36%
¹Number of units in sample was derived from the responses of apartment complexes that provided a breakdown of number of vacancies by apartment type.
Rural Nevada Page 58

Distribution of Rents by Apartment Size
TABLE 28 Mean Rental Rates by Apartment Sizes
Market Units Rental Rates June 2012
TABLE 29 Market Rate and Affordable Rental Rate Comparison
June 2012
¹Affordable units denote apartment complex units that are income restricted.
Rural Nevada Page 59
Date Studio 1-Bedroom 2-Bedroom 3-Bedroom
June 2007 $494.00 $635.94 $712.79 $894.89
% change 06-07 +.99% -3.43% -.52% +8.34%
June 2008 $461.50 $616.94 $711.13 $884.21
% change 07-08 -7.04% -3.08% -.23% -1.21%
June 2009 $462.00 $586.11 $662.77 $792.57
% change 08-09 +.11% -5.00% -6.80% -10.36%
June 2010 $491.50 $593.25 $698.41 $832.95
% change 09-10 +6.38% +1.22% +5.38% +5.09%
June 2011 $451.12 $600.15 $683.30 $835.27
% change 10-11 -8.21% +1.16% -2.16% +.28%
June 2012 $499.28 $590.42 $676.48 $829.11
% change 11-12 +10.67% -1.62% -1.00% -.74%
Type of Units Studio 1-Bedroom 2-Bedroom 3-Bedroom
2012 2011 2012 2011 2012 2011 2012 2011
Market Units Rental Rate $499.28 $451.12 $590.42 $600.15 $676.48 $683.30 $829.11 $835.27
Affordable Units¹ Rental Rate $349.50 $350.00 $624.59 $581.47 $665.41 $610.24 $741.73 $705.57
Percentage Difference between Affordable and Market-Rate Multi-family Residential Unit Rental Rates
-30.0% -22.41% +5.79% -3.11% -1.64% -10.69% -10.54% -15.53%

-- No information submitted from this geographical area
Rural Nevada Page 60
Area Total Number of Units
# of Units Identified for Housing the 55+
Age Group
Battle Mountain -- --
Beatty 20 20
Carson City 2,113 322
Dayton 70 --
Elko 316 92
Ely 185 44
Eureka 12 12
Fallon 319 86
Fernley 172 90
Gardnerville 142 --
Jackpot -- --
Laughlin 1,065 150
Lovelock 64 --
Mesquite 287 24
Minden 57 --
Overton 10 --
Pahrump 60 --
Searchlight 24 24
Silver Springs 24 24
Stateline 70 --
Tonopah 24 --
Wendover 148 --
West Wendover 130 --
Winnemucca 254 68
Yerington 106 52
Total 5,672 1,008
Distribution of Apartments by Geographical Area
Table 30 Number of Multi-Family Rental Residential Units by Geographical Area
Rural Nevada 2012

Distribution of Apartments by Type of Unit that House the 55+ Age Group
Table 31 Number of Apartments by Type of Unit
55+ Age Group 2012
Total # of Units 1-Bedroom 2-Bedroom
1,008 712 261
Studio
35
GRAPH 21 Distribution of Apartment Units by Size
June 2012
Rural Nevada Page 61
The following table and graph show that nearly 71 percent of the preferred rental housing in rural Nevada’s 55+ age group is one-bedroom in size.
1 Bedroom70.6%
2 Bedroom25.9%
Studio3.5%

Distribution of Apartments by Type of Unit that House the 55+ Age Group
Rural Nevada Page 62
Table 32 Vacancy Rate of Apartment Rental Units
55+ Age Group 2012
Geographical Area #of Units Reported to be Vacant Vacancy Rate
Rural Nevada 86 7.32%
Number of Units
1,175
Greater Las Vegas Valley 7,542 581 7.70%
Greater Reno/Sparks Area 1,237 42 3.39%
Vacancy data in this report reflects the highest vacancy rate in residential multi-family units being in Las Vegas where substantially more units are available for the 55+ age group. By comparison the Greater Reno/Sparks Area and Rural Nevada show comparable number of residential units available for the senior population with the Greater Reno/Sparks reflecting the lowest vacancy rate.