nevada system of higher education - csn system of higher education. ... mr. steve sisolak mr....
TRANSCRIPT

Dalu
FACULTY WORKLOAD REPORT 2006
Prepared by the Office of Academic and Student Affairs May 2007
University of Nevada, Las Vegas University of Nevada, Reno Nevada State College Community College of Southern Nevada Great Basin College Truckee Meadows Community College Western Nevada Community College Desert Research Institute
NEVADA SYSTEM OF HIGHER EDUCATION

This page intentionally left blank.
2

BOARD OF REGENTS
Mr. Bret Whipple, Chair Dr. Jack Lund Schofield, Vice Chair
Mr. Mark Alden Dr. Stavros Anthony Mr. Cedric Crear Mrs. Thalia Dondero Mrs. Dorothy Gallagher Dr. Jason Geddes Mr. Ron Knecht Mr. James Dean Leavitt Mr. Howard Rosenberg Dr. Jack Lund Schofield Mr. Steve Sisolak Mr. Michael Wixom
Scott Wasserman, Chief Executive Officer of the Board of Regents
OFFICERS OF THE NEVADA SYSTEM OF HIGHER EDUCATION
James E. Rogers, Chancellor Daniel J. Klaich, Executive Vice Chancellor
Dr. David Ashley, President Dr. Carol Lucey, President University of Nevada, Las Vegas Western Nevada Community College Dr. Richard Carpenter, President Dr. Fred Maryanski, President Community College of Southern Nevada Nevada State College Dr. Milton Glick, President Dr. Philip Ringle, President University of Nevada, Reno Truckee Meadows Community College Dr. Paul Killpatrick, President Dr. Stephen Wells, President Great Basin College Desert Research Institute
Nevada System of Higher Education
3

This page intentionally left blank.
4
Executive Summary .............................................................................................................7 Faculty Workload Overview................................................................................................9 Instructional Workload Summary......................................................................................13 Instructional Workload - Universities................................................................................14 Instructional Workload - State College............................................................................. 16 Instructional Workload - Community Colleges................................................................. 17 Out-of-Classroom Activities - Universities ...................................................................... 19 Out-of-Classroom Activities - State College .....................................................................23 Out-of-Classroom Activities - Community Colleges .........................................................25 APPENDIX Appendix A - Faculty Workload Guidelines (Title 4, Chapter 3, Section 3) ................... 29 Appendix B - Instructional Workload Form, University & State College ........................31 Appendix C - Out-of-Classroom Activities Form, University & State College ................33 Appendix D - Instructional Workload Form, Community College ...................................35 Appendix E - Out-of-Classroom Activities Form, Community Colleges......................... 36 Appendix F - Out-of-Classroom Definitions, University & State College....................... 38 Appendix G - Out-of-Classroom Definitions, Community Colleges ................................41
Table of Contents
5

This page intentionally left blank.
6

UNIVERSITIES – 1,320 faculty FTE represented, 40% in doctoral instruction At the universities, undergraduate faculty are expected to teach at least 9 instructional units per semester. For individual faculty involved in doctoral-level education, the expected load is an average of 6 instructional units per semester.
Fall 2006 Average Instructional Workload
33..88 1122..88 88..11 CCoouurrssee SSeeccttiioonnss TToottaall CCrreeddiitt OOrrggaanniizzeedd CCrreeddiitt TTaauugghhtt HHoouurrss TTaauugghhtt HHoouurrss
University faculty taught an average of 3.8 course sections, equating to a total 12.8 credit hours in both organized and individualized instruction.
Faculty at the two universities taught an average 8.1 credit hours in organized course sections. This aggregated instructional workload summary includes faculty involved in doctoral-level education, as
well as those with administrative release time. STATE COLLEGE – 41 faculty FTE represented, 2% with release time At the state college, faculty are expected to teach at least 12 instructional units per semester.
Fall 2006 Average Instructional Workload
44..11 1133..11 1133..11 CCoouurrssee SSeeccttiioonnss TToottaall CCrreeddiitt OOrrggaanniizzeedd CCrreeddiitt TTaauugghhtt HHoouurrss TTaauugghhtt HHoouurrss
State college faculty taught an average of 4.1 course sections, equating to 13.1 credit hours in both organized and individualized instruction.
Faculty at Nevada State College taught an average of 13.1 credit hours in organized course sections. COMMUNITY COLLEGES – 691 faculty FTE represented, 34% with release time At the community colleges, faculty are expected to teach at least 15 instructional units per semester.
Fall 2006 Average Instructional Workload
55..33 1144..88 1199..55 CCoouurrssee SSeeccttiioonnss TToottaall CCrreeddiitt IInn--ccllaassss CCoonnttaacctt TTaauugghhtt HHoouurrss TTaauugghhtt HHoouurrss
Community college faculty taught an average of 5.3 course sections, equating to 14.8 credit hours in both organized and individualized instruction.
Faculty at the community colleges taught an average 19.5 in-class contact hours per week.
NOTE: Workload averages represent all full-time faculty, including those with a portion of their instructional duties reassigned for administrative purposes and/or special projects.
OUT-OF-CLASSROOM ACTIVITIES It should also be noted that a significant amount of faculty’s time is spent engaged in out-of-classroom activities. Detailed information describing these activities is included within this report.
Executive Summary
7

This page intentionally left blank.
8

Board policy provides that in the fall of every even-numbered year, the Chancellor’s Office shall compile a System report on faculty workloads at NSHE institutions. Faculty workload is collected from the campuses in two parts: 1) in-class instructional data originating from workload databases and validated by department heads; and 2) out-of-classroom data collected at the individual faculty or department level and validated by department heads. Workload Expectations for Full-time Faculty Faculty workload can be separated into two distinct areas: instructional workload (i.e. in-class workload) and out-of-classroom activities. This indicates that at the universities, the state college, and the community colleges the role of full-time faculty extends well beyond classroom instruction. To varying degrees, faculty workload is impacted by requirements to engage in research, develop professionally, participate in public service, as well as contribute to the commitment of shared governance, advise students, and develop new curriculum and programs. Depending upon institutional type and mission, the workload of faculty is further influenced by numerous factors occurring both inside and outside of the classroom. As a result, the NSHE method for measuring workload of full-time faculty employs a two-pronged approach, one method for instructional workload and another for out-of-classroom activities. Instructional Workload
Instructional workload hours spent in-class, including indicators of workload activity (e.g. average class size), are collected from institutional databases. Instructional workload data for full-time faculty are aggregated by institution and compared to the expectations established by the Board of Regents’ (Title 4, Chapter 3, Section 3) as follows:
In recognition of its commitment to accountability and productivity, the Board of Regents will regularly compile information regarding faculty workloads. To aid in this process, the following expected teaching workloads at NSHE institutions shall be established:
a. At the universities, an expectation of 18 instructional units per academic
year, or 9 units each semester. For individual faculty heavily involved in doctoral-level education, the expected load would be an average of 12 instructional units per academic year, or 6 units per semester;
b. At the state college, an expectation of 24 instructional units per academic
year, or 12 units each semester; c. At the community colleges, an expectation of 30 instructional units per
academic year, or 15 units per semester; d. As it applies to a, b, and c, reassignments from the expected teaching load
as well as course overloads must be approved in advance by the appropriate
Faculty Workload Overview
9
vice president, president, or at an alternative level to be determined by the institution; and
e. The aforementioned expectations do not apply to the instructional faculty of
the University of Nevada School of Medicine, the UNLV School of Dental Medicine, and the William S. Boyd School of Law.
It is instructive to compare NSHE’s workload expectations with the recommendations of the American Association of University Professors (AAUP) in its Statement on Faculty Workload. The AAUP recommends a maximum teaching load of 12 hours per week at the undergraduate level and 9 hours per week for instruction partly or entirely at the graduate level. In addition to their recommendations for maximum teaching loads, the AAUP also endorses preferable teaching loads of 9 hours at the undergraduate level and 6 hours when graduate level instruction is included. The preferred teaching loads are those “achieved by our leading colleges and universities … [and] …provide as reliable a guide as may be found for teaching loads in any institutions intending to achieve and maintain excellence in faculty performance.” Out-of-classroom Activities
In addition to instructional workload, faculty throughout the NSHE may be expected to engage in scholarship, research, or other creative activities, in serving the institution and the public. Out-of-classroom activities are collected for each full-time faculty member and aggregated for each institution. Data depicting out-of-classroom activities are reported by individual faculty and collected from information found in annual evaluations. Ultimately, all information is validated by administrative supervisors before it is reported to System Administration. Detailed definitions have been established for each out-of-classroom activity indicator (see Appendix F and Appendix G). Part-time Faculty The American Association of University Professors (AAUP) reports that the use of part-time faculty at degree-granting colleges and universities increased from 30.2% in 1975 to 46.3% in 2003. The AAUP reports the following for Fall 2005:
• 65.6% of faculty were part-time at public community colleges compared to 47% at Nevada community colleges as reported by the institutions for the Fall 2006 semester;
• 40.2% of faculty were part-time at at public baccaleaureate granting institutions compared to 45.9% at Nevada State College as reported by the institution for the Fall 2006 semester;
• 23.5% of faculty were part-time at public doctoral/research institutions compared to 30.3% at Nevada universities as reported by the institutions for the Fall 2006 semester.
Notes on the Data The following caveats point to some of the limitations that impact the analysis and reporting of faculty workload data provided herein.
10

1. Results depict workload of all faculty available for instruction, regardless of assignment. In other words, the workload of all faculty, with the exception of those on sabbatical or some form of leave, are represented in the aggregated institutional workloads. Faculty with all or a portion of their instructional workloads reassigned (e.g. for purposes such as administration, research, oversized classes, professional development, etc.) are included in the data. It should also be noted that workload averages do not include credit hours taught by full-time faculty as overload (e.g. credits taught above expected semester teaching load and with extra compensation received).
2. Workload results for the universities include faculty teaching at the undergraduate,
masters, and doctoral levels, or a mixture of any of the three. Faculty heavily involved in doctoral education have reduced instructional workload expectations, a factor that must be taken into consideration when analyzing aggregated teaching loads at the universities.
3. At the community colleges, course credit hours and actual in-class contact hours with
students may not align in some vocational or allied health programs. As a result, contact hours are collected in addition to credit hours taught and should be considered when reviewing teaching loads at the community colleges.
4. This is the second report in which this new research methodology is employed; therefore,
multi-year data needed for trend analysis are not available. Comparisons between 2004 and 2006 data are presented in this report; however, until at least three years of data are collected, conclusions related to individual institutional workloads are not possible.
Definitions The following are definitions used in reviewing faculty workload results:
Full-time Faculty: Regular, contract faculty available for instruction and funded totally or partially from the state budget, including faculty who are less than 1.0 FTE, not including letters of appointment (LOB or LOA). Full-time Faculty Overload: Full-time faculty teaching credits above their expected semester teaching load and receiving extra compensation over and above their regular contract. Supplemental Instruction: Courses generating state supported FTE that are taught by instructors other than full-time faculty. Faculty Reassignments: Faculty may be reassigned from all or part of their instructional workload for a variety of reasons (e.g. administration, research, oversized classes, professional development, etc.). Organized Instruction: Regularly scheduled classes meeting at designated times and places, including distance education courses.
11

Individualized Instruction: Instruction where regularly-scheduled in-class contact between faculty and students does not occur (e.g. internships, independent studies, dissertation/thesis research).
Class Section: An individual class that is taught by an instructor(s) with a unique set of students. When possible, dual or cross listed class sections taught at the same level of instruction are not double counted.
12
Average Full-time Faculty Workload Course Sections
Taught Credit Hours
TaughtOrganized Credit
Hours TaughtAverage Class
Size% Faculty w/
Reassignments
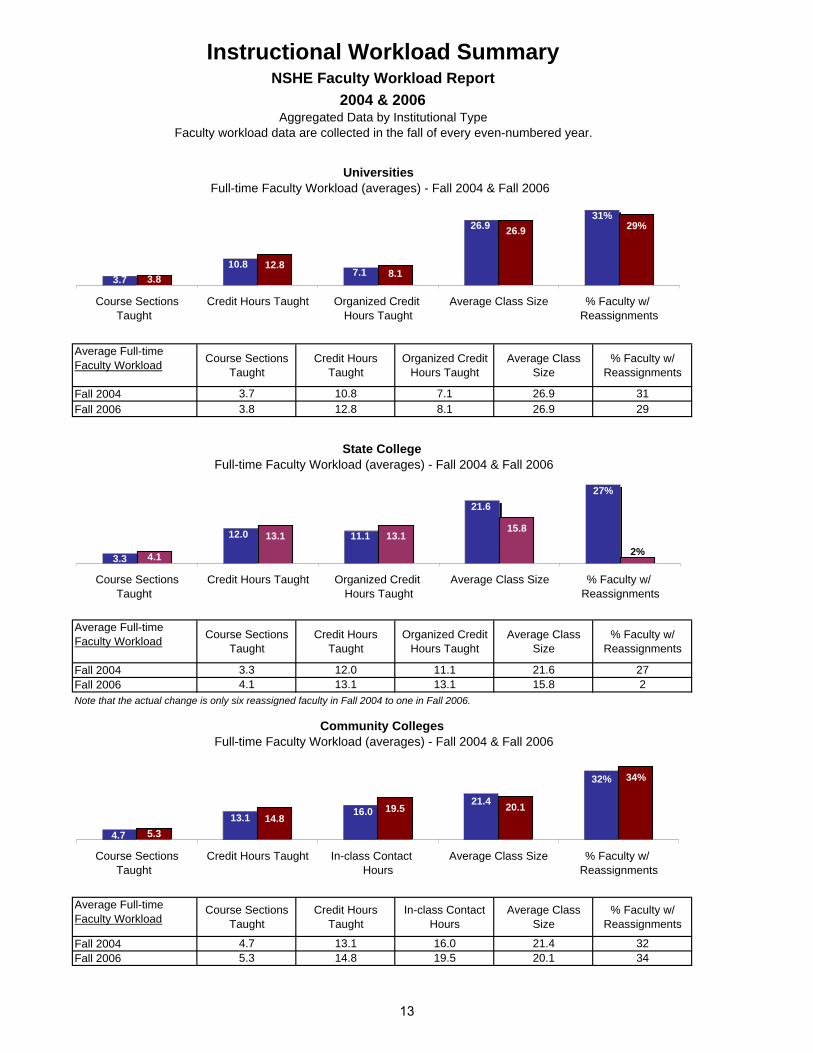
Fall 2004 3.7 10.8 7.1 26.9 31Fall 2006 3.8 12.8 8.1 26.9 29
Average Full-time Faculty Workload Course Sections
Taught Credit Hours
TaughtOrganized Credit
Hours TaughtAverage Class
Size% Faculty w/
Reassignments
Fall 2004 3.3 12.0 11.1 21.6 27Fall 2006 4.1 13.1 13.1 15.8 2
Average Full-time Faculty Workload
Course Sections Taught
Credit Hours Taught
In-class Contact Hours
Average Class Size
% Faculty w/ Reassignments
Fall 2004 4.7 13.1 16.0 21.4 32Fall 2006 5.3 14.8 19.5 20.1 34
Note that the actual change is only six reassigned faculty in Fall 2004 to one in Fall 2006.
Faculty workload data are collected in the fall of every even-numbered year.
Instructional Workload SummaryNSHE Faculty Workload Report
Aggregated Data by Institutional Type2004 & 2006
Community Colleges Full-time Faculty Workload (averages) - Fall 2004 & Fall 2006
14.819.5 20.1
32%
21.416.013.1
4.7
34%
5.3
Course SectionsTaught
Credit Hours Taught In-class Contact Hours
Average Class Size % Faculty w/ Reassignments
Universities Full-time Faculty Workload (averages) - Fall 2004 & Fall 2006
12.88.1
26.931%
26.9
7.110.8
3.7
29%
3.8
Course SectionsTaught
Credit Hours Taught Organized Credit Hours Taught
Average Class Size % Faculty w/ Reassignments
State College Full-time Faculty Workload (averages) - Fall 2004 & Fall 2006
13.1 13.115.8
27%21.6
11.112.0
3.3 4.1 2%
Course SectionsTaught
Credit Hours Taught Organized Credit Hours Taught
Average Class Size % Faculty w/ Reassignments
13

Information depicting workload of faculty occurring in the classroom.
Full-time Faculty FTE Available for Instruction: 1319.6(does not include sabbaticals, faculty on leave, or unfilled faculty positions) 790.0
529.6
University Average 29%
Average Full-time Faculty Reassignments
Faculty reassignments from all or part of their instructional workload for a variety of reasons (administrative, research, oversized classes, professional development, etc.)
% of Faculty with Reassignments
1.2 3.3 4.7
Class Sections Taught
Instructional Workload - UniversitiesNSHE Faculty Workload 2006
Aggregated data for UNLV & UNR
Class Section Enrollment Credit Hours Taught
University Average
Organized Instruction:
Instructional Workload - Fall 2006
Instruction occurring in regularly scheduled classes meeting at designated times and places (includes distance education courses).
Instruction where regular in-class contact between faculty and students does not occur (examples: internships, independent studies, dissertation/thesis research).
UNLVUNR
2.52.7
Class Sections Taught
3.8
2.6 26.9
19.5 12.8
25.9
Class Section Enrollment
UNLV:UNR:
Class Section Enrollment Credit Hours Taught
8.0
20.4
1.74.02.8
4.35.4
8.2
UNLV
Instructional workload averages included all full-time faculty available for instruction, including those with a portion of their instructional duties reassigned for administrative purposes and/or special projects. Workload averages do not include credit hours taught by full-time faculty as overload.
0.8
Total Instruction: Instruction occurring in regularly scheduled classes with in-class contact, as well as individualized instruction where in-class contact does not occur.
28.3
Credit Hours Taught
University Total:
3.3 12.2
8.1
4.5 18.4 13.7
Class Sections Taught
Average Full-time Faculty Workload
Average Full-time Faculty Workload
Average Full-time Faculty Workload
Reassignments:
UNR
University Average
Individualized Instruction:
University Average
UNLV
UNR
38%17%
UNLVUNR
14
Instructional Workload - UniversitiesNSHE Faculty Workload 2006
Aggregated data for UNLV & UNR
Information depicting workload of faculty occurring in the classroom.
University Average UNLV UNR
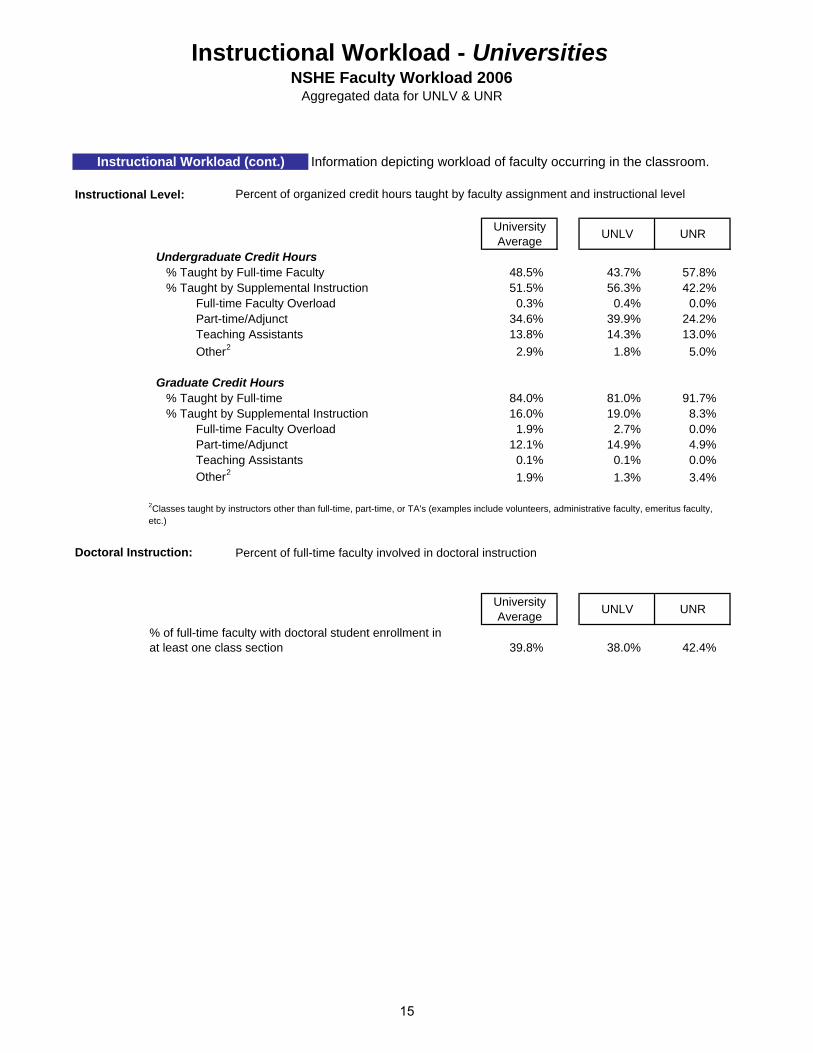
Undergraduate Credit Hours48.5% 43.7% 57.8%51.5% 56.3% 42.2%
0.3% 0.4% 0.0%34.6% 39.9% 24.2%13.8% 14.3% 13.0%
2.9% 1.8% 5.0%
Graduate Credit Hours % Taught by Full-time 84.0% 81.0% 91.7% % Taught by Supplemental Instruction 16.0% 19.0% 8.3% Full-time Faculty Overload 1.9% 2.7% 0.0% Part-time/Adjunct 12.1% 14.9% 4.9% Teaching Assistants 0.1% 0.1% 0.0% Other2 1.9% 1.3% 3.4%
Percent of full-time faculty involved in doctoral instruction
University Average UNLV UNR
39.8% 38.0% 42.4%
Instructional Workload (cont.)
Full-time Faculty Overload Part-time/Adjunct Teaching Assistants
% of full-time faculty with doctoral student enrollment in at least one class section
% Taught by Supplemental Instruction % Taught by Full-time Faculty
Percent of organized credit hours taught by faculty assignment and instructional level
2Classes taught by instructors other than full-time, part-time, or TA's (examples include volunteers, administrative faculty, emeritus faculty, etc.)
Other2
Doctoral Instruction:
Instructional Level:
15
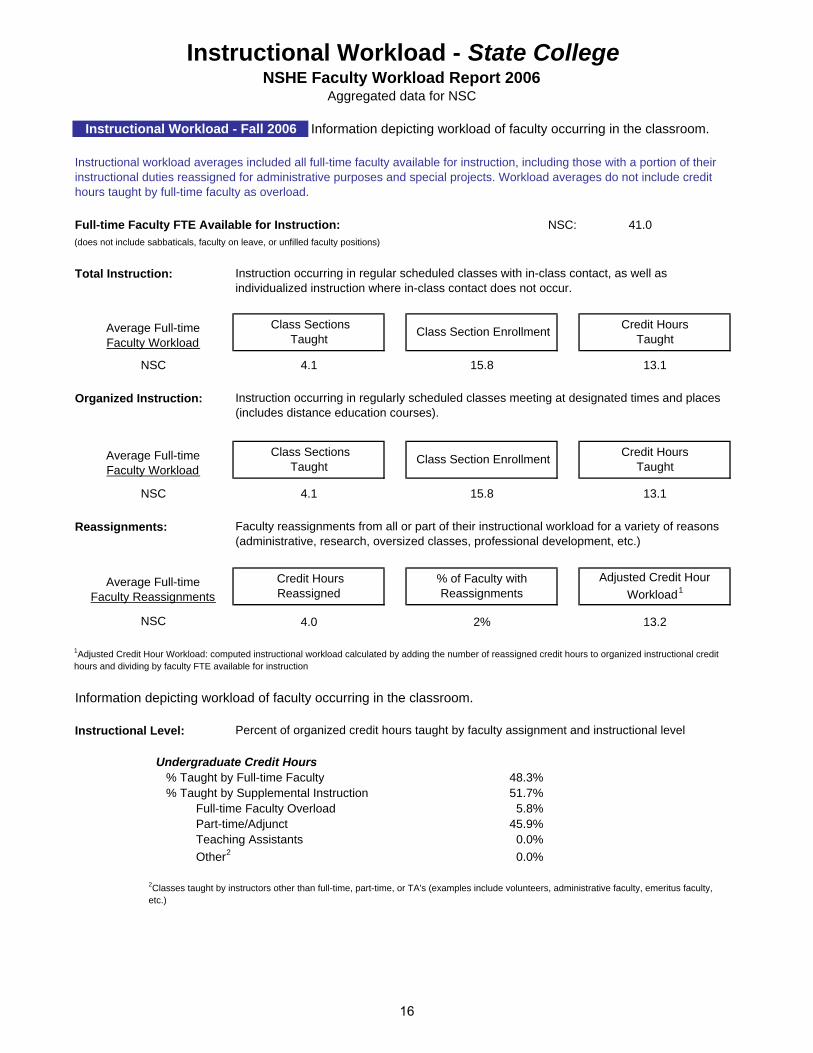
Information depicting workload of faculty occurring in the classroom.
Full-time Faculty FTE Available for Instruction: 41.0(does not include sabbaticals, faculty on leave, or unfilled faculty positions)
Information depicting workload of faculty occurring in the classroom.
Undergraduate Credit Hours48.3%51.7%
5.8%45.9%
0.0%0.0%
2Classes taught by instructors other than full-time, part-time, or TA's (examples include volunteers, administrative faculty, emeritus faculty, etc.)
Other2
Full-time Faculty Overload Part-time/Adjunct Teaching Assistants
% Taught by Supplemental Instruction % Taught by Full-time Faculty
Percent of organized credit hours taught by faculty assignment and instructional level
Instructional Workload - State CollegeNSHE Faculty Workload Report 2006
Aggregated data for NSC
NSC
Organized Instruction:
Instructional Workload - Fall 2006
Instruction occurring in regularly scheduled classes meeting at designated times and places (includes distance education courses).
Class Sections Taught
4.1
4.1 15.8
15.8
Class Section Enrollment Credit Hours Taught
13.1
Class Sections Taught
Instructional workload averages included all full-time faculty available for instruction, including those with a portion of their instructional duties reassigned for administrative purposes and special projects. Workload averages do not include credit hours taught by full-time faculty as overload.
Total Instruction: Instruction occurring in regular scheduled classes with in-class contact, as well as individualized instruction where in-class contact does not occur.
Credit Hours Taught
NSC:
13.1
Class Section Enrollment
Average Full-time Faculty Workload
Average Full-time Faculty Workload
Reassignments:
NSC
Average Full-time Faculty Reassignments
Faculty reassignments from all or part of their instructional workload for a variety of reasons (administrative, research, oversized classes, professional development, etc.)
Credit Hours Reassigned
% of Faculty with Reassignments
Adjusted Credit Hour Workload1
1Adjusted Credit Hour Workload: computed instructional workload calculated by adding the number of reassigned credit hours to organized instructional credit hours and dividing by faculty FTE available for instruction
Instructional Level:
13.24.0 2%NSC
16
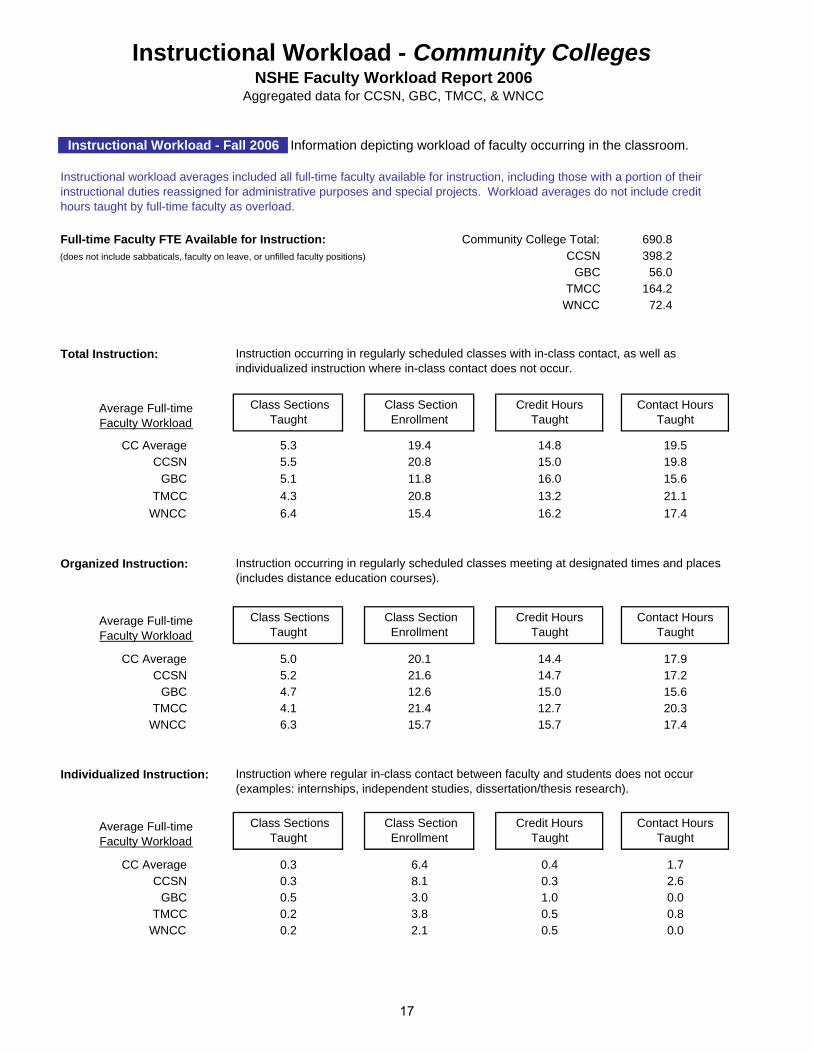
Information depicting workload of faculty occurring in the classroom.
Full-time Faculty FTE Available for Instruction: Community College Total: 690.8(does not include sabbaticals, faculty on leave, or unfilled faculty positions) CCSN 398.2
GBC 56.0TMCC 164.2
WNCC 72.4
1.7
21.4
Contact Hours Taught
14.715.0
17.9
11.8
15.4 16.2
CC Average
Organized Instruction:
Class Sections Taught
6.4
14.4
17.4
Class Sections Taught
5.3
5.0 20.1
19.4
Class Section Enrollment
Class Section Enrollment
5.1
Average Full-time Faculty Workload
Total Instruction:
15.7
Credit Hours Taught
5.5
WNCC
14.815.0
Credit Hours Taught
15.7
2.1
CC Average
Individualized Instruction:
CC Average
CCSN
TMCCWNCC
CCSNGBC
Average Full-time Faculty Workload
Contact Hours Taught
Instruction occurring in regularly scheduled classes meeting at designated times and places (includes distance education courses).
5.24.7
21.615.617.2
GBC
WNCC
12.6
Instruction occurring in regularly scheduled classes with in-class contact, as well as individualized instruction where in-class contact does not occur.
GBCTMCC
0.2
TMCC
19.519.815.621.14.3 20.8 13.2
20.816.0
Average Full-time Faculty Workload
Instructional Workload - Community CollegesNSHE Faculty Workload Report 2006
Aggregated data for CCSN, GBC, TMCC, & WNCC
Instructional workload averages included all full-time faculty available for instruction, including those with a portion of their instructional duties reassigned for administrative purposes and special projects. Workload averages do not include credit hours taught by full-time faculty as overload.
Instructional Workload - Fall 2006
0.3 8.1 0.30.3 6.4 0.4
Instruction where regular in-class contact between faculty and students does not occur (examples: internships, independent studies, dissertation/thesis research).
20.317.4
Contact Hours Taught
4.16.3
Class Section Enrollment
Credit Hours Taught
12.7
Class Sections Taught
2.60.5
0.0
CCSN
0.5
1.0 0.00.2 3.8 0.5 0.8
3.0
17

Instructional Workload - Community CollegesNSHE Faculty Workload Report 2006
Aggregated data for CCSN, GBC, TMCC, & WNCC
Information depicting workload of faculty occurring in the classroom.
CCSN GBC WNCC Undergraduate Credit Hours
47% 47% 44% 48% 50% % Taught by Supplemental Instruction 53% 53% 56% 52% 50%
6% 6% 12% 3% 0%47% 47% 44% 49% 50%
Percent of organized credit hours taught by faculty assignment and instructional level
Reassignments:
4.13.3
TMCCCC Average
34%37%58%
16.7
15.9
Credit Hours Reassigned
Average Full-time Faculty Reassignments
Faculty reassignments from all or part of their instructional workload for a variety of reasons (administrative, research, oversized classes, professional development, etc.)
16.218.55.7
CC AverageCCSN
GBC
Instructional Workload (cont.)
% of Faculty with Reassignments
Adjusted Credit Hour Workload1
Instructional Level:
WNCC5.35.8
26%16%
1Adjusted Credit Hour Workload: computed instructional workload calculated by adding the number of reassigned credit hours to organized instructional credit hours and dividing by faculty FTE available for instruction
TMCC 14.1
Part-time/Adjunct
% Taught by Full-time Faculty
Full-time Faculty Overload
18
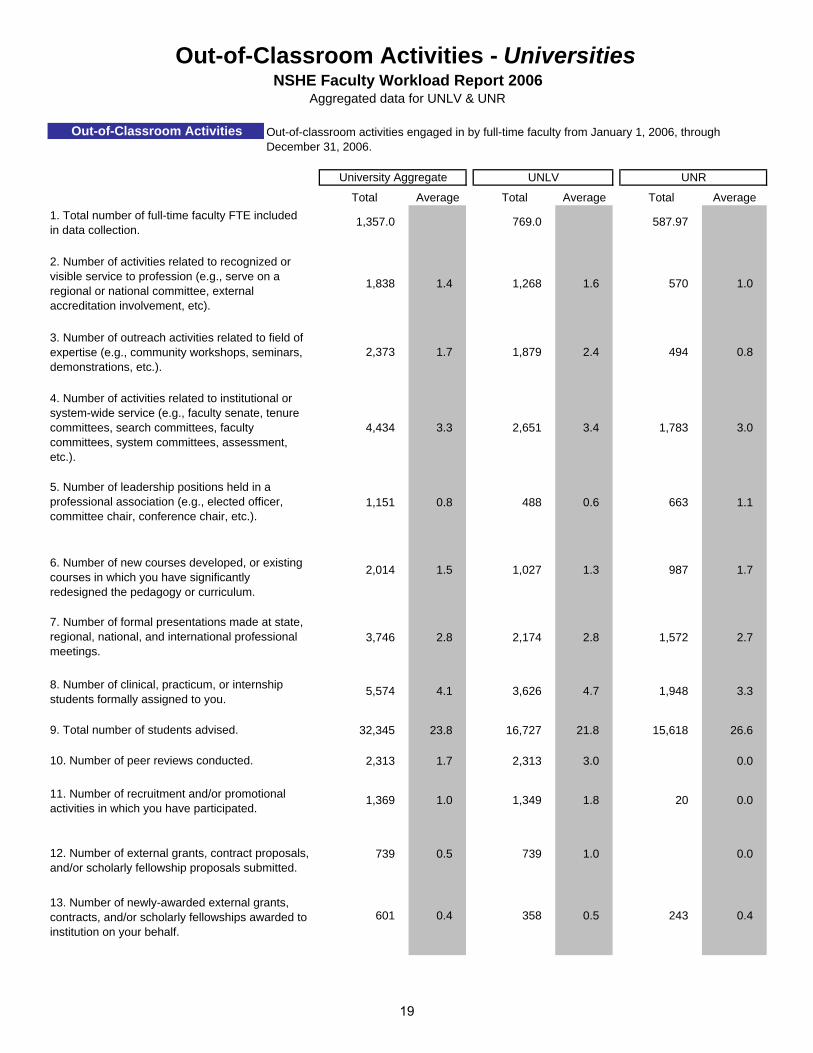
Total Average Total Average Total Average
1,357.0 769.0 587.97
1,838 1.4 1,268 1.6 570 1.0
2,373 1.7 1,879 2.4 494 0.8
4,434 3.3 2,651 3.4 1,783 3.0
1,151 0.8 488 0.6 663 1.1
2,014 1.5 1,027 1.3 987 1.7
3,746 2.8 2,174 2.8 1,572 2.7
5,574 4.1 3,626 4.7 1,948 3.3
32,345 23.8 16,727 21.8 15,618 26.6
2,313 1.7 2,313 3.0 0.0
1,369 1.0 1,349 1.8 20 0.0
739 0.5 739 1.0 0.0
601 0.4 358 0.5 243 0.4
1. Total number of full-time faculty FTE included in data collection.
UNLV
2. Number of activities related to recognized or visible service to profession (e.g., serve on a regional or national committee, external accreditation involvement, etc).
3. Number of outreach activities related to field of expertise (e.g., community workshops, seminars, demonstrations, etc.).
4. Number of activities related to institutional or system-wide service (e.g., faculty senate, tenure committees, search committees, faculty committees, system committees, assessment, etc.).
5. Number of leadership positions held in a professional association (e.g., elected officer, committee chair, conference chair, etc.).
6. Number of new courses developed, or existing courses in which you have significantly redesigned the pedagogy or curriculum.
7. Number of formal presentations made at state, regional, national, and international professional meetings.
8. Number of clinical, practicum, or internship students formally assigned to you.
9. Total number of students advised.
10. Number of peer reviews conducted.
11. Number of recruitment and/or promotional activities in which you have participated.
12. Number of external grants, contract proposals, and/or scholarly fellowship proposals submitted.
13. Number of newly-awarded external grants, contracts, and/or scholarly fellowships awarded to institution on your behalf.
UNRUniversity Aggregate
Out-of-Classroom Activities
Out-of-Classroom Activities - UniversitiesNSHE Faculty Workload Report 2006
Aggregated data for UNLV & UNR
Out-of-classroom activities engaged in by full-time faculty from January 1, 2006, through December 31, 2006.
19

Total Average Total Average Total Average
UNLV UNRUniversity Aggregate
Out-of-Classroom Activities
Out-of-Classroom Activities - UniversitiesNSHE Faculty Workload Report 2006
Aggregated data for UNLV & UNR
Out-of-classroom activities engaged in by full-time faculty from January 1, 2006, through December 31, 2006.
$128,898,514 $94,990 $45,747,539 $59,490 $83,150,975 $141,420
1,076 0.8 554 0.7 522 0.9
1,983 1.5 1,128 1.5 855 1.5
199 0.1 115 0.1 84 0.1
317 0.2 185 0.2 132 0.2
3,685 2.7 1,462 1.9 2223 3.8
527 0.4 480 0.6 47 0.1
597 0.4 361 0.5 236 0.4
51 0.0 21 0.0 30 0.1
2,455 1.8 1,478 1.9 977 1.7
3,844 2.8 2,593 3.4 1251 2.1
1,996 1.5 1,095 1.4 901 1.5
1,830 1.3 452 0.6 1378 2.3
1,452 1.1 693 0.9 759 1.3
14. Total dollar value for the externally funded grants, contracts, and/or scholarly fellowships reported in Item 13.
15. Number of active or ongoing external grants, contracts, and/or scholarly fellowships on which you are working.
16. Number of journal articles and/or book chapters published.
17. Number of single-author or joint-author books or monographs published.
18. Number of books, collections, and monographs edited.
19. Number of invited reviews of books and/or manuscripts.
20. Number of juried shows, commissioned performances, or competitive exhibitions presented in a physical or an electronic venue.
21. Number of editorial positions held.
26. Number of students (undergraduate and/or graduate) who have jointly authored a journal article or book chapter with you as the faculty mentor.
27. Number of students (undergraduate and/or graduate) who have jointly presented a paper at a professional meeting with you as the faculty mentor.
22. Number of provisional or issued licensing agreements or patents registered.
23. Number of active thesis/dissertation committees where you served as first reader or chair.
24. Number of active thesis/dissertation committees where you served in a non-chairing role.
25. Number of undergraduate students formally engaged in research with you as the faculty mentor.
20

Total Average Total Average
1,232.5 1,357.0
2,199 1.8 1,838 1.4
3,875 3.1 2,373 1.7
4,734 3.8 4,434 3.3
856 0.7 1,151 0.8
1,783 1.4 2,014 1.5
3,353 2.7 3,746 2.8
5,565 4.5 5,574 4.1
34,620 28.1 32,345 23.8
4,316 3.5 2,313 1.7
1,987 1.6 1,369 1.0
1,583 1.3 739 0.5
684 0.6 601 0.4
2006
Out-of-Classroom Activities
Out-of-Classroom Activities - UniversitiesNSHE Faculty Workload Report 2004 and 2006 Comparison
Aggregated data for UNLV & UNR
Out-of-classroom activities engaged in by full-time faculty from January 1, 2006, through December 31, 2006.
12. Number of external grants, contract proposals, and/or scholarly fellowship proposals submitted.
13. Number of newly-awarded external grants, contracts, and/or scholarly fellowships awarded to the institution on your behalf.
8. Number of clinical, practicum, or internship students formally assigned to you.
9. Total number of students advised.
10. Number of peer reviews conducted.
11. Number of recruitment and/or promotional activities in which you have participated.
4. Number of activities related to institutional or system-wide service (e.g., faculty senate, tenure committees, search committees, faculty committees, system committees, assessment, etc.).
5. Number of leadership positions held in a professional association (e.g., elected officer, committee chair, conference chair, etc.).
6. Number of new courses developed, or existing courses in which you have significantly redesigned the pedagogy or curriculum.
7. Number of formal presentations made at state, regional, national, and international professional meetings.
1. Total number of full-time faculty FTE included in data collection.
2004
2. Number of activities related to recognized or visible service to profession (e.g., serve on a regional or national committee, external accreditation involvement, etc).
3. Number of outreach activities related to field of expertise (e.g., community workshops, seminars, demonstrations, etc.).
21

Total Average Total Average
2006
Out-of-Classroom Activities
Out-of-Classroom Activities - UniversitiesNSHE Faculty Workload Report 2004 and 2006 Comparison
Aggregated data for UNLV & UNR
Out-of-classroom activities engaged in by full-time faculty from January 1, 2006, through December 31, 2006.
2004
$96,476,761 $78,277 $128,898,514 $94,990
1,264 1.0 1,076 0.8
1,994 1.6 1,983 1.5
242 0.2 199 0.1
304 0.2 317 0.2
2,741 2.2 3,685 2.7
1,175 1.0 527 0.4
590 0.5 597 0.4
59 0.0 51 0.0
1,294 1.0 2,455 1.8
3,297 2.7 3,844 2.8
2,930 2.4 1,996 1.5
1,124 0.9 1,830 1.3
1,033 0.8 1,452 1.1
20. Number of juried shows, commissioned performances, or competitive exhibitions presented in a physical or an electronic venue.
21. Number of editorial positions held.
26. Number of students (undergraduate and/or graduate) who have jointly authored a journal article or book chapter with you as the faculty mentor.
27. Number of students (undergraduate and/or graduate) who have jointly presented a paper at a professional meeting with you as the faculty mentor.
22. Number of provisional or issued licensing agreements or patents registered.
23. Number of active thesis/dissertation committees where you served as first reader or chair.
24. Number of active thesis/dissertation committees where you served in a non-chairing role.
25. Number of undergraduate students formally engaged in research with you as the faculty mentor.
16. Number of journal articles and/or book chapters published.
17. Number of single-author or joint-author books or monographs published.
18. Number of books, collections, and monographs edited.
19. Number of invited reviews of books and/or manuscripts.
14. Total dollar value for the externally funded grants, contracts, and/or scholarly fellowships reported in Item 13.
15. Number of active or ongoing external grants, contracts, and/or scholarly fellowships on which you are working.
22

Total Average Total Average
22 35
29 1.3 79 2.3
54 2.5 70 2.0
102 4.6 120 3.4
22 1.0 25 0.7
65 3.0 76 2.2
24 1.1 26 0.7
253 11.5 337 9.6
1,382 62.8 471 13.5
28 1.3 72 2.1
96 4.4 56 1.6
9 0.4 19 0.5
4 0.2 4 0.1
$673,199 $30,600 $255,000 $7,286
8 0.4 8 0.2
20 0.9 29 0.8
1 0.0 10 0.3
1. Total number of full-time faculty FTE included in data collection.
2. Number of activities related to recognized or visible service to profession (e.g. serve on a regional or national committee, external accreditation involvement, etc).
3. Number of outreach activities related to field of expertise (e.g., community workshops, seminars, demonstrations, etc.).
4. Number of activities related to institutional or system-wide service (e.g., faculty senate, tenure committees, search committees, faculty committees, system committees, assessment, etc.).
5. Number of leadership positions held in a professional association (e.g., elected officer, committee chair, conference chair, etc.).
6. Number of new courses developed, or existing courses in which you have significantly redesigned the pedagogy or curriculum.
9. Total number of students advised.
10. Number of peer reviews conducted.
7. Number of formal presentations made at state, regional, national, and international professional meetings.
8. Number of clinical, practicum, or internship students formally assigned to you.
11. Number of recruitment and/or promotional activities in which you have participated.
12. Number of external grants, contract proposals, and/or scholarly fellowship proposals submitted.
13. Number of newly-awarded external grants, contracts, and/or scholarly fellowships awarded to the institution on your behalf.
14. Total dollar value for the externally funded grants, contracts, and/or scholarly fellowships reported in Item 13.
15. Number of active or ongoing external grants, contracts, and/or scholarly fellowships on which you are working.
16. Number of journal articles and/or book chapters published.
17. Number of single-author or joint-author books or monographs published.
2006
Out-of-Classroom Activities
Out-of-Classroom Activities - State College NSHE Faculty Workload Report 2004 and 2006 Comparison
Aggregated data for NSC
Out-of-classroom activities engaged in by full-time faculty from January 1, 2006, through December 31, 2006.
2004
23

Total Average Total Average
2006
Out-of-Classroom Activities
Out-of-Classroom Activities - State College NSHE Faculty Workload Report 2004 and 2006 Comparison
Aggregated data for NSC
Out-of-classroom activities engaged in by full-time faculty from January 1, 2006, through December 31, 2006.
2004
0 0.0 7 0.2
1 0.0 9 0.3
4 0.2 0 0.0
1 0.0 3 0.1
15 0.7 2 0.1
18. Number of books, collections, and monographs edited.
22. Number of undergraduate students formally engaged in research with you as the faculty mentor.
21. Number of editorial positions held.
19. Number of invited reviews of books and/or manuscripts.
20. Number of juried shows, commissioned performances, or competitive exhibitions presented in a physical or an electronic venue.
24
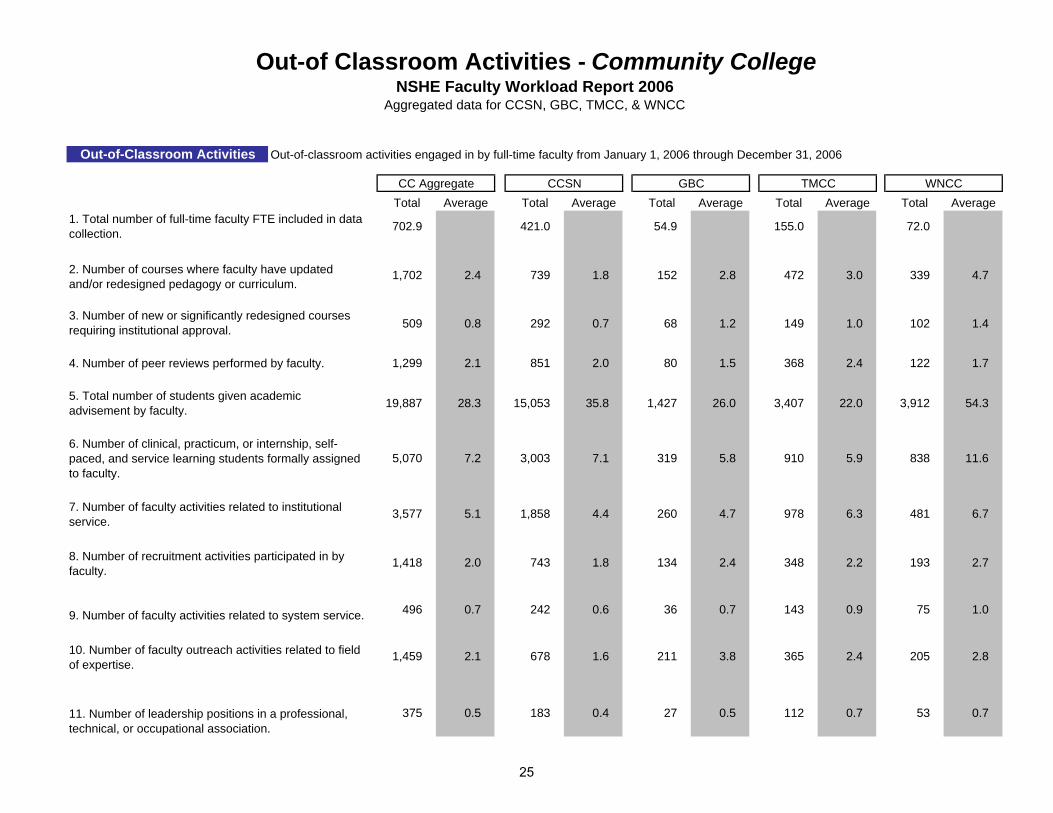
Total Average Total Average Total Average Total Average Total Average
702.9 421.0 54.9 155.0 72.0
1,702 2.4 739 1.8 152 2.8 472 3.0 339 4.7
509 0.8 292 0.7 68 1.2 149 1.0 102 1.4
1,299 2.1 851 2.0 80 1.5 368 2.4 122 1.7
19,887 28.3 15,053 35.8 1,427 26.0 3,407 22.0 3,912 54.3
5,070 7.2 3,003 7.1 319 5.8 910 5.9 838 11.6
3,577 5.1 1,858 4.4 260 4.7 978 6.3 481 6.7
1,418 2.0 743 1.8 134 2.4 348 2.2 193 2.7
496 0.7 242 0.6 36 0.7 143 0.9 75 1.0
1,459 2.1 678 1.6 211 3.8 365 2.4 205 2.8
375 0.5 183 0.4 27 0.5 112 0.7 53 0.7
Aggregated data for CCSN, GBC, TMCC, & WNCC
Out-of-classroom activities engaged in by full-time faculty from January 1, 2006 through December 31, 2006
11. Number of leadership positions in a professional, technical, or occupational association.
7. Number of faculty activities related to institutional service.
8. Number of recruitment activities participated in by faculty.
9. Number of faculty activities related to system service.
10. Number of faculty outreach activities related to field of expertise.
3. Number of new or significantly redesigned courses requiring institutional approval.
4. Number of peer reviews performed by faculty.
5. Total number of students given academic advisement by faculty.
6. Number of clinical, practicum, or internship, self-paced, and service learning students formally assigned to faculty.
2. Number of courses where faculty have updated and/or redesigned pedagogy or curriculum.
Out-of-Classroom Activities
1. Total number of full-time faculty FTE included in data collection.
CC Aggregate
Out-of Classroom Activities - Community College NSHE Faculty Workload Report 2006
TMCC WNCCCCSN GBC
25
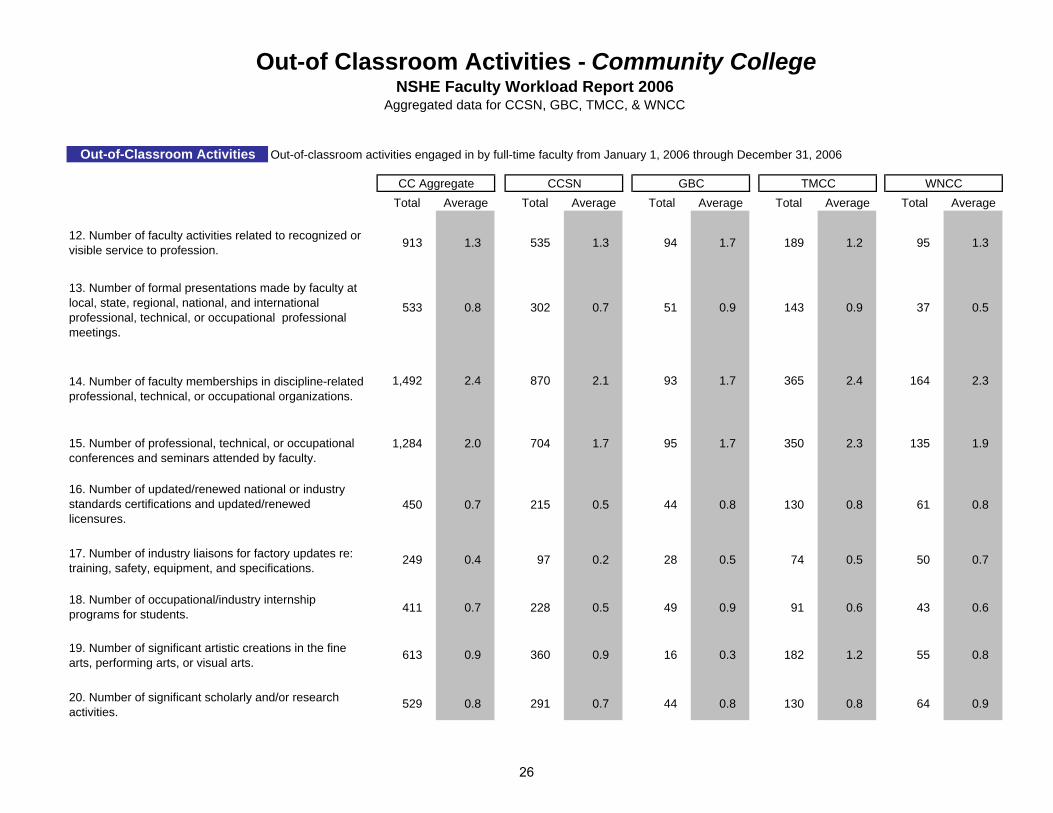
Total Average Total Average Total Average Total Average Total Average
Aggregated data for CCSN, GBC, TMCC, & WNCC
Out-of-classroom activities engaged in by full-time faculty from January 1, 2006 through December 31, 2006Out-of-Classroom Activities
CC Aggregate
Out-of Classroom Activities - Community College NSHE Faculty Workload Report 2006
TMCC WNCCCCSN GBC
913 1.3 535 1.3 94 1.7 189 1.2 95 1.3
533 0.8 302 0.7 51 0.9 143 0.9 37 0.5
1,492 2.4 870 2.1 93 1.7 365 2.4 164 2.3
1,284 2.0 704 1.7 95 1.7 350 2.3 135 1.9
450 0.7 215 0.5 44 0.8 130 0.8 61 0.8
249 0.4 97 0.2 28 0.5 74 0.5 50 0.7
411 0.7 228 0.5 49 0.9 91 0.6 43 0.6
613 0.9 360 0.9 16 0.3 182 1.2 55 0.8
529 0.8 291 0.7 44 0.8 130 0.8 64 0.9
18. Number of occupational/industry internship programs for students.
19. Number of significant artistic creations in the fine arts, performing arts, or visual arts.
20. Number of significant scholarly and/or research activities.
14. Number of faculty memberships in discipline-related professional, technical, or occupational organizations.
15. Number of professional, technical, or occupational conferences and seminars attended by faculty.
16. Number of updated/renewed national or industry standards certifications and updated/renewed licensures.
17. Number of industry liaisons for factory updates re: training, safety, equipment, and specifications.
12. Number of faculty activities related to recognized or visible service to profession.
13. Number of formal presentations made by faculty at local, state, regional, national, and international professional, technical, or occupational professional meetings.
26

Total Average Total Average
550.5 702.9
1,764 3.2 1,702 2.4
658 1.3 509 0.8
1,536 3.1 1,299 2.1
21,336 38.8 19,887 28.3
4,302 7.8 5,070 7.2
3,128 5.7 3,577 5.1
1,550 2.8 1,418 2.0
834 1.5 496 0.7
1,780 3.2 1,459 2.1
397 0.7 375 0.5
881 1.6 913 1.3
878 1.6 533 0.8
1,056 2.2 1,492 2.4
1,154 2.4 1,284 2.0
416 0.9 450 0.7
Out-of Classroom Activities - Community College NSHE Faculty Workload Report 2004 and 2006 Comparison
2004 2006
Out-of-classroom activities engaged in by full-time faculty from January 1, 2006 through December 31, 2006
2. Number of courses where faculty have updated and/or redesigned pedagogy or curriculum.
Out-of-Classroom Activities
1. Total number of full-time faculty FTE included in data collection.
3. Number of new or significantly redesigned courses requiring institutional approval.
4. Number of peer reviews performed by faculty.
5. Total number of students given academic advisement by faculty.
6. Number of clinical, practicum, or internship, self-paced, and service learning students formally assigned to faculty.
12. Number of faculty activities related to recognized or visible service to profession.
7. Number of faculty activities related to institutional service.
8. Number of recruitment activities participated in by faculty.
9. Number of faculty activities related to system service.
10. Number of faculty outreach activities related to field of expertise.
Aggregated data for CCSN, GBC, TMCC, & WNCC
14. Number of faculty memberships in discipline-related professional, technical, or occupational organizations.
15. Number of professional, technical, or occupational conferences and seminars attended by faculty.
16. Number of updated/renewed national or industry standards certifications and updated/renewed licensures.
11. Number of leadership positions in a professional, technical, or occupational association.
13. Number of formal presentations made by faculty at local, state, regional, national, and international professional, technical, or occupational professional meetings.
27

Total Average Total Average
Out-of Classroom Activities - Community College NSHE Faculty Workload Report 2004 and 2006 Comparison
2004 2006
Out-of-classroom activities engaged in by full-time faculty from January 1, 2006 through December 31, 2006
Out-of-Classroom Activities
Aggregated data for CCSN, GBC, TMCC, & WNCC
436 0.9 249 0.4
527 1.1 411 0.7
641 1.2 613 0.9
851 1.5 529 0.8
18. Number of occupational/industry internship programs for students.
19. Number of significant artistic creations in the fine arts, performing arts, or visual arts.
20. Number of significant scholarly and/or research activities.
17. Number of industry liaisons for factory updates re: training, safety, equipment, and specifications.
28
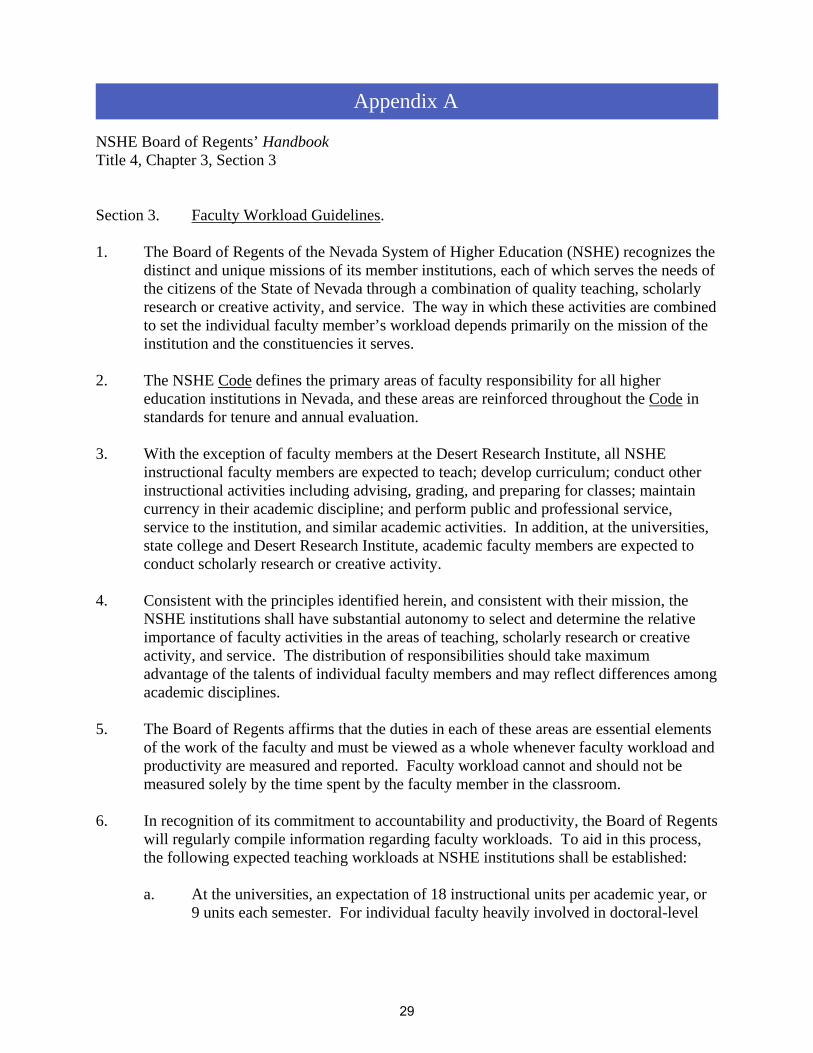
NSHE Board of Regents’ Handbook Title 4, Chapter 3, Section 3 Section 3. Faculty Workload Guidelines. 1. The Board of Regents of the Nevada System of Higher Education (NSHE) recognizes the
distinct and unique missions of its member institutions, each of which serves the needs of the citizens of the State of Nevada through a combination of quality teaching, scholarly research or creative activity, and service. The way in which these activities are combined to set the individual faculty member’s workload depends primarily on the mission of the institution and the constituencies it serves.
2. The NSHE Code defines the primary areas of faculty responsibility for all higher
education institutions in Nevada, and these areas are reinforced throughout the Code in standards for tenure and annual evaluation.
3. With the exception of faculty members at the Desert Research Institute, all NSHE
instructional faculty members are expected to teach; develop curriculum; conduct other instructional activities including advising, grading, and preparing for classes; maintain currency in their academic discipline; and perform public and professional service, service to the institution, and similar academic activities. In addition, at the universities, state college and Desert Research Institute, academic faculty members are expected to conduct scholarly research or creative activity.
4. Consistent with the principles identified herein, and consistent with their mission, the
NSHE institutions shall have substantial autonomy to select and determine the relative importance of faculty activities in the areas of teaching, scholarly research or creative activity, and service. The distribution of responsibilities should take maximum advantage of the talents of individual faculty members and may reflect differences among academic disciplines.
5. The Board of Regents affirms that the duties in each of these areas are essential elements
of the work of the faculty and must be viewed as a whole whenever faculty workload and productivity are measured and reported. Faculty workload cannot and should not be measured solely by the time spent by the faculty member in the classroom.
6. In recognition of its commitment to accountability and productivity, the Board of Regents
will regularly compile information regarding faculty workloads. To aid in this process, the following expected teaching workloads at NSHE institutions shall be established:
a. At the universities, an expectation of 18 instructional units per academic year, or
9 units each semester. For individual faculty heavily involved in doctoral-level
Appendix A
29

education, the expected load would be an average of 12 instructional units per academic year, or 6 units per semester.
b. At the state college, an expectation of 24 instructional units per academic year, or
12 units each semester.
c. At the community colleges, an expectation of 30 instructional units per academic year, or 15 units per semester.
d. As it applies to a, b, and c, reassignments from the expected teaching load as well
as course overloads must be approved in advance by the appropriate vice president, president, or at an alternative level to be determined by the institution.
e. The aforementioned expectations do not apply to the instructional faculty of the
University of Nevada School of Medicine, the UNLV School of Dental Medicine, and the William S. Boyd School of Law.
7. It shall be the responsibility of the president of each NSHE institution to establish
justifiable, equitable instructional workload standards through a process of shared governance with the faculty. It is expected that the institutional policies will provide detailed guidelines for equivalent teaching load credit as well as adjustments of workloads that reflect different kinds of instruction – including, but not limited to, distance education, rural education, internet instruction, vocational education, and clinical education. The policies should also take into account non-instructional activities that may be essential to the work of faculty in particular disciplines and provide equitable recognition for extra contact hours that faculty spend with students in courses that involve studios, laboratories, clinics, independent study, thesis and dissertation, internships, and similar activities related to instruction.
8. In the fall of every even-numbered year, the Chancellor shall compile a System report on
faculty workloads at NSHE institutions. 9. The Board of Regents encourages NSHE institutions to participate in national,
benchmarked studies, and their participation shall be facilitated by System staff.
30

Appendix B
Institution: Total budgeted Full-time FTE faculty positions Total FTE of faculty not available for teaching10
Term: Fall 2006 Total FTE of faculty on sabbatical or other leave Total Headcount of full-time faculty available for instruction Total FTE of unfilled full-time faculty positions Total FTE of full-time faculty available for instruction
# of Class
Sections7Student
EnrollmentsCredits Hours
Student Credit Hours5
# of Class
Sections7Student
EnrollmentsCredits Hours
Student Credit Hours5
# of Class
Sections7Student
EnrollmentsCredits Hours
Student Credit Hours5
Total Full-time Faculty
Full-time Faculty Overload6
Part-time Instruction (LOA, LOB)Teaching AssistantsOther SupplementalTotal Supplemental Instruction
# of Class
Sections7Student
EnrollmentsCredits Hours
Student Credit Hours5
# of Class
Sections7Student
EnrollmentsCredits Hours
Student Credit Hours5
# of Class
Sections7Student
EnrollmentsCredits Hours
Student Credit Hours5
Student FTE
Total Full-time Faculty
Full-time Faculty Overload6
Part-time/Adjunct InstructionTeaching AssistantsOther Supplemental8
Total Supplemental Instruction
Faculty FTE
Full-time Faculty Involved in Doctoral Education9
Faculty FTE
Undergraduate Level Graduate Level Organized Instruction3
400/600 Level Dual Listed
Provide information on the faculty positions at your institution funded totally or partially from the instruction function of the state budget.
University & State College Instructional Workload FormNSHE Faculty Workload Study 2006
Instructions: Report aggregated faculty workloads for all state-supported instructional activity in Fall 2006. When complete, your institution's total student FTE should be accounted for at the time this form was completed. Data must originate from workload databases that have been validated by department heads (i.e. no self-reported faculty data).
Total Number of Credit Hours Taught
Full-time Faculty1
Supplemental Instructors2
Full-time Faculty1
Supplemental Instructors2
Total Individualized Instruction4 Total (sum of organized and individualized)
Total Organized Instruction (sum of Undergraduate, Graduate, & 400/600)
31
Appendix B
University & State College Instructional Workload FormNSHE Faculty Workload Study 2006
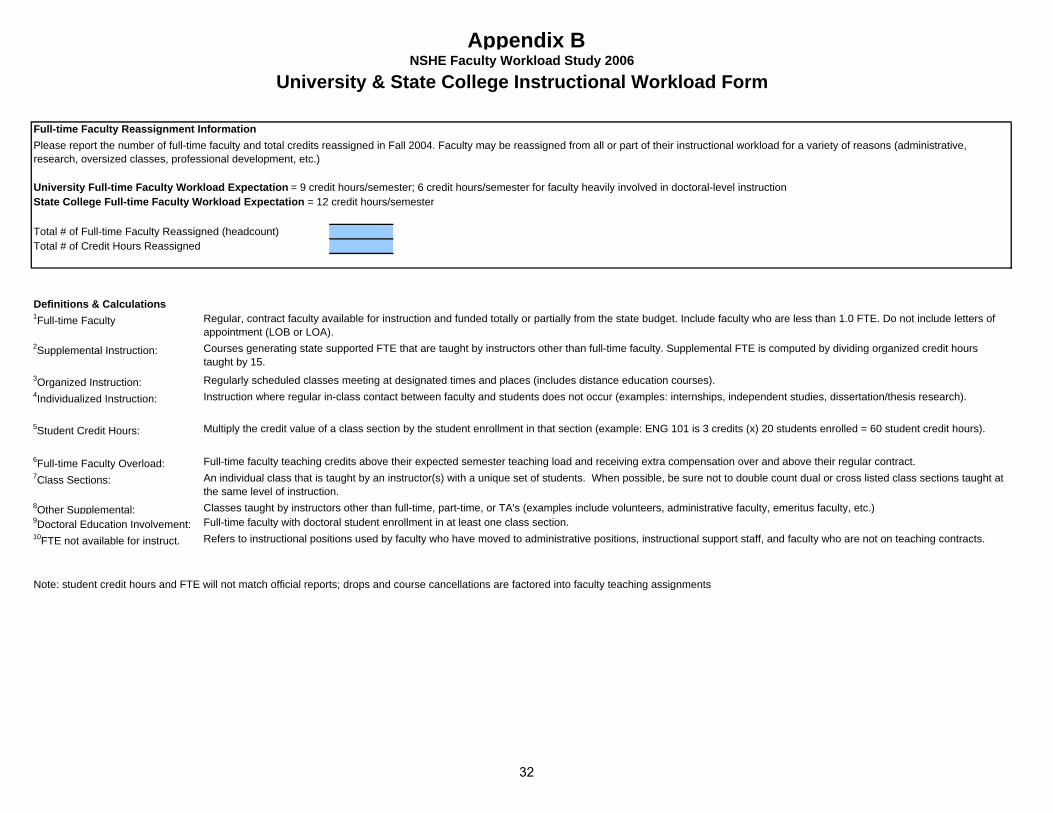
Full-time Faculty Reassignment Information
University Full-time Faculty Workload Expectation = 9 credit hours/semester; 6 credit hours/semester for faculty heavily involved in doctoral-level instructionState College Full-time Faculty Workload Expectation = 12 credit hours/semester
Total # of Full-time Faculty Reassigned (headcount)Total # of Credit Hours Reassigned
Definitions & Calculations1Full-time Faculty
2Supplemental Instruction:
3Organized Instruction:4Individualized Instruction:
5Student Credit Hours:
6Full-time Faculty Overload:7Class Sections:
8Other Supplemental:9Doctoral Education Involvement:10FTE not available for instruct.
Note: student credit hours and FTE will not match official reports; drops and course cancellations are factored into faculty teaching assignments
Full-time faculty with doctoral student enrollment in at least one class section.Classes taught by instructors other than full-time, part-time, or TA's (examples include volunteers, administrative faculty, emeritus faculty, etc.)
An individual class that is taught by an instructor(s) with a unique set of students. When possible, be sure not to double count dual or cross listed class sections taught at the same level of instruction.
Refers to instructional positions used by faculty who have moved to administrative positions, instructional support staff, and faculty who are not on teaching contracts.
Full-time faculty teaching credits above their expected semester teaching load and receiving extra compensation over and above their regular contract.
Multiply the credit value of a class section by the student enrollment in that section (example: ENG 101 is 3 credits (x) 20 students enrolled = 60 student credit hours).
Instruction where regular in-class contact between faculty and students does not occur (examples: internships, independent studies, dissertation/thesis research).
Regular, contract faculty available for instruction and funded totally or partially from the state budget. Include faculty who are less than 1.0 FTE. Do not include letters of appointment (LOB or LOA).Courses generating state supported FTE that are taught by instructors other than full-time faculty. Supplemental FTE is computed by dividing organized credit hours taught by 15.
Regularly scheduled classes meeting at designated times and places (includes distance education courses).
Please report the number of full-time faculty and total credits reassigned in Fall 2004. Faculty may be reassigned from all or part of their instructional workload for a variety of reasons (administrative, research, oversized classes, professional development, etc.)
32
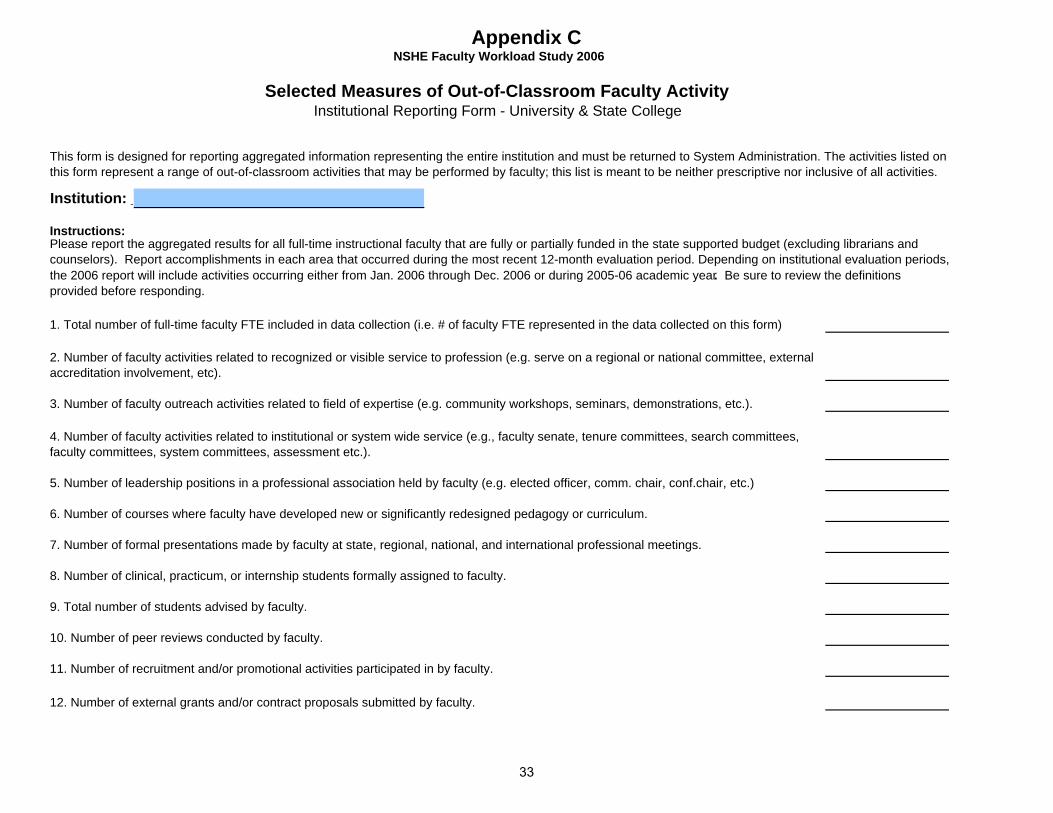
Appendix C
Institution: _
Instructions:
10. Number of peer reviews conducted by faculty.
11. Number of recruitment and/or promotional activities participated in by faculty.
6. Number of courses where faculty have developed new or significantly redesigned pedagogy or curriculum.
7. Number of formal presentations made by faculty at state, regional, national, and international professional meetings.
8. Number of clinical, practicum, or internship students formally assigned to faculty.
9. Total number of students advised by faculty.
NSHE Faculty Workload Study 2006
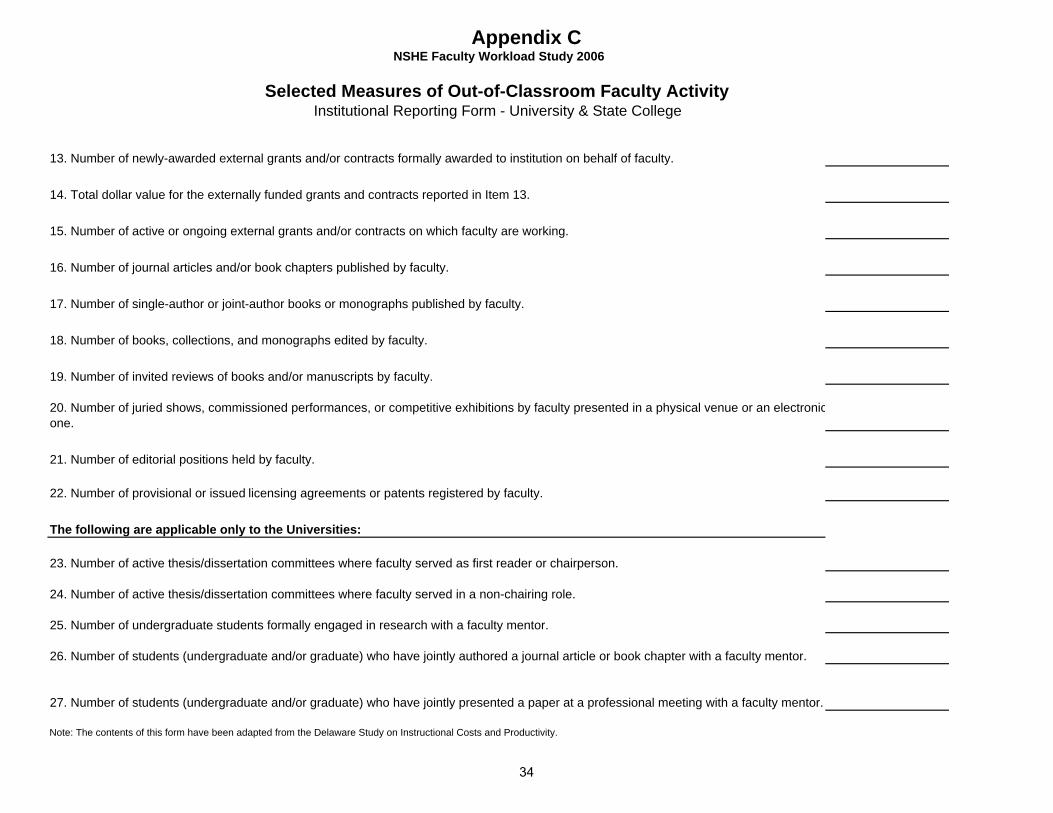
Selected Measures of Out-of-Classroom Faculty Activity Institutional Reporting Form - University & State College
This form is designed for reporting aggregated information representing the entire institution and must be returned to System Administration. The activities listed on this form represent a range of out-of-classroom activities that may be performed by faculty; this list is meant to be neither prescriptive nor inclusive of all activities.
1. Total number of full-time faculty FTE included in data collection (i.e. # of faculty FTE represented in the data collected on this form)
Please report the aggregated results for all full-time instructional faculty that are fully or partially funded in the state supported budget (excluding librarians andcounselors). Report accomplishments in each area that occurred during the most recent 12-month evaluation period. Depending on institutional evaluation periods,the 2006 report will include activities occurring either from Jan. 2006 through Dec. 2006 or during 2005-06 academic year. Be sure to review the definitions provided before responding.
2. Number of faculty activities related to recognized or visible service to profession (e.g. serve on a regional or national committee, external accreditation involvement, etc).
3. Number of faculty outreach activities related to field of expertise (e.g. community workshops, seminars, demonstrations, etc.).
4. Number of faculty activities related to institutional or system wide service (e.g., faculty senate, tenure committees, search committees, faculty committees, system committees, assessment etc.).
5. Number of leadership positions in a professional association held by faculty (e.g. elected officer, comm. chair, conf.chair, etc.)
12. Number of external grants and/or contract proposals submitted by faculty.
33
Appendix CNSHE Faculty Workload Study 2006
Selected Measures of Out-of-Classroom Faculty Activity Institutional Reporting Form - University & State College
The following are applicable only to the Universities:
Note: The contents of this form have been adapted from the Delaware Study on Instructional Costs and Productivity.
15. Number of active or ongoing external grants and/or contracts on which faculty are working.
14. Total dollar value for the externally funded grants and contracts reported in Item 13.
25. Number of undergraduate students formally engaged in research with a faculty mentor.
16. Number of journal articles and/or book chapters published by faculty.
13. Number of newly-awarded external grants and/or contracts formally awarded to institution on behalf of faculty.
17. Number of single-author or joint-author books or monographs published by faculty.
18. Number of books, collections, and monographs edited by faculty.
19. Number of invited reviews of books and/or manuscripts by faculty.
27. Number of students (undergraduate and/or graduate) who have jointly presented a paper at a professional meeting with a faculty mentor.
20. Number of juried shows, commissioned performances, or competitive exhibitions by faculty presented in a physical venue or an electronicone.
21. Number of editorial positions held by faculty.
22. Number of provisional or issued licensing agreements or patents registered by faculty.
26. Number of students (undergraduate and/or graduate) who have jointly authored a journal article or book chapter with a faculty mentor.
23. Number of active thesis/dissertation committees where faculty served as first reader or chairperson.
24. Number of active thesis/dissertation committees where faculty served in a non-chairing role.
34

Appendix D
Institution: Total budgeted Full-time FTE faculty positions Total FTE of faculty not available for teaching9
Term: Fall 2006 Total FTE of faculty on sabbatical or other leave Total Headcount of full-time faculty available for instruction Total FTE of unfilled full-time faculty positions Total FTE of full-time faculty available for instruction
# of Class
Sections7Student
EnrollmentsCredits Hours
Contact Hours/ Week8
Student Credit Hours5
# of Class Sections7
Student Enrollments
Credits Hours
Contact Hours/ Week8
Student Credit Hours5
# of Class Sections7
Student Enrollments
Credits Hours
Contact Hours/ Week8
Student Credit Hours5
Student FTE
Full-time Faculty1
Total Full-time Faculty
Full-time Faculty Overload6
Part-time/Adjunct InstructionTotal Supplemental Instruction
Full-time Faculty Reassignment Information
Community College Full-time Faculty Workload Expectation = 15 credit hours (instructional units)
# of Full-time Faculty Reassigned (headcount)Total # of Credit Hours Reassigned
Definitions & Calculations1Full-time Faculty
2Supplemental Instruction: Courses generating state supported FTE that are taught by instructors other than full-time faculty. Supplemental FTE is computed by dividing organized credit hours taught by 15. 3Organized Instruction: Regularly scheduled classes meeting at designated times and places (includes distance education courses).4Individualized Instruction: Instruction where regular in-class contact between faculty and students does not occur (examples: internships, independent studies, dissertation/thesis research).5Student Credit Hours: Multiply the credit value of a class section by the student enrollment in that section (example: ENG 101 is 3 credits (x) 20 students enrolled = 60 student credit hours).6Full-time Faculty Overload: Full-time faculty teaching credits above their expected semester teaching load and receiving extra compensation over and above their regular contract.7Class Sections: An individual class that is taught by an instructor(s) with a unique set of students. When possible, be sure not to double count dual or cross listed class sections.8Contact Hours/Week: Actual time spent in the classroom each week as the result of scheduled class hours (ex. in occupational programs, credit and contact hours are not always equivalent).9FTE not available for instruct.
NSHE Faculty Workload Study 2006
Community College Instructional Workload Form
Provide information on the faculty positions at your institution funded totally or partially from the instruction function of the state budget.
Faculty FTE
Instructions: Report aggregated faculty workloads for all state-supported instructional activity in Fall 2006. When complete, your institution's total student FTE should be accounted for at the time this form was completed. Data must originate from workload databases that have been validated by department heads (i.e. no self-reported faculty data).
Individualized Instruction4
note: student credit hours and FTE will not match official reports; drops and course cancellations are factored into faculty teaching assignments
Regular, contract faculty available for instruction and funded totally or partially from the state budget. Include faculty who are less than 1.0 FTE. Do not include letters of appointment (LOB or LOA).
Organized Instruction3
Please report the number of full-time faculty and total credits reassigned in Fall 2006. Faculty may be reassigned from all or part of their instructional workload for a variety of reasons (administrative, research, oversized classes, professional development, etc.)
Total (sum of organized and individualized)
Supplemental Instructors2
Refers to instructional positions used by faculty who have moved to administrative positions, instructional support staff, and faculty who are not on teaching contracts.
35
Appendix E
Institution: _
Instructions:
10. Number of faculty outreach activities related to field of expertise.
11. Number of leadership positions in a professional, technical, or occupational association.
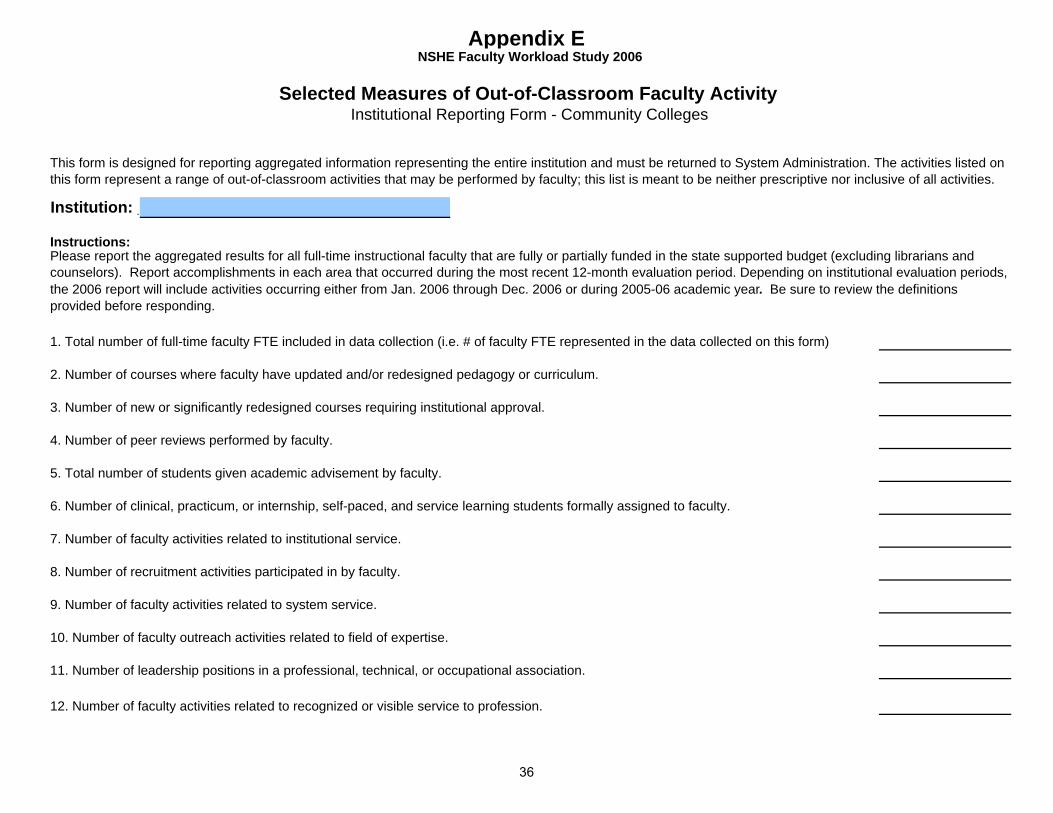
1. Total number of full-time faculty FTE included in data collection (i.e. # of faculty FTE represented in the data collected on this form)
Please report the aggregated results for all full-time instructional faculty that are fully or partially funded in the state supported budget (excluding librarians and counselors). Report accomplishments in each area that occurred during the most recent 12-month evaluation period. Depending on institutional evaluation periods, the 2006 report will include activities occurring either from Jan. 2006 through Dec. 2006 or during 2005-06 academic year. Be sure to review the definitions provided before responding.
2. Number of courses where faculty have updated and/or redesigned pedagogy or curriculum.
3. Number of new or significantly redesigned courses requiring institutional approval.
4. Number of peer reviews performed by faculty.
5. Total number of students given academic advisement by faculty.
12. Number of faculty activities related to recognized or visible service to profession.
6. Number of clinical, practicum, or internship, self-paced, and service learning students formally assigned to faculty.
7. Number of faculty activities related to institutional service.
8. Number of recruitment activities participated in by faculty.
9. Number of faculty activities related to system service.
NSHE Faculty Workload Study 2006
Selected Measures of Out-of-Classroom Faculty Activity Institutional Reporting Form - Community Colleges
This form is designed for reporting aggregated information representing the entire institution and must be returned to System Administration. The activities listed on this form represent a range of out-of-classroom activities that may be performed by faculty; this list is meant to be neither prescriptive nor inclusive of all activities.
36

Appendix ENSHE Faculty Workload Study 2006
Selected Measures of Out-of-Classroom Faculty Activity Institutional Reporting Form - Community Colleges
__________________
14. Number of faculty memberships in discipline-related professional, technical, or occupational organizations. __________________
15. Number of professional, technical, or occupational conferences and seminars attended by faculty. __________________
16. Number of updated/renewed national or industry standards certifications and updated/renewed licensures. __________________
17. Number of industry liaisons for factory updates re: training, safety, equipment, and specifications. __________________
18. Number of occupational/industry internship programs for students. __________________
19. Number of significant artistic creations in the fine arts, performing arts, or visual arts.
20. Number of significant scholarly and/or research activities.
13. Number of formal presentations made by faculty at local, state, regional, national, and international professional, technical, or occupational professional meetings.
37

Definitions for Selected Measures of Out-of Classroom Faculty Activity: Data Collection Forms and Institutional Reporting Forms
This number includes all regular, contract faculty employed at your institution who were funded fully or partially from the state supported budget during the 12 months under examination. This includes:
- Faculty who may have subsequently retired or left the institution, as well as faculty on paid leaves and sabbaticals.
1. Total number of full-time faculty FTE included in data collection (i.e. # of faculty FTE represented in the data collected on this form)
- Each faculty member falling within this 12-month time frame should be counted only once.
2. Number of faculty activities related to recognized or visible service to profession (e.g. serve on a regional or national committee, external accreditation involvement, etc).
This item reports the number of activities where faculty have engaged in high-level service to their profession. The service might be serving on a regional or national committee or serving as a volunteer juror for a show, performance, or exhibition. This item includes external promotion or tenure reviews and external accreditation involvement. This item excludes leadership positions held in professional associations within the 12-month evaluation period.
3. Number of faculty outreach activities related to field of expertise (e.g. community workshops, seminars, demonstrations, etc.).
This item reports the number of activities where faculty have engaged in some form of extension or outreach related to their field of expertise. The outreach might include community workshops, invited talks to community groups, seminars, lectures, or demonstrations. This item excludes formal presentations at state, regional, national, and international professional meetings during the most recent 12-month evaluation period.
4. Number of faculty activities related to institutional or system wide service (e.g., faculty senate, tenure committees, search committees, faculty committees, system committees, assessment, etc.).
This item reports the number of activities where faculty have engaged in some form of service to the NSHE (service may occur at the department, college, institutional, or system level). The service might be committee work (e.g., faculty senate, promotion and tenure), service on the institutional accreditation self-study team, supervising student organizations or student service and community projects, faculty art shows, performances, or creative readings at the home institution within the most recent 12-month evaluation period.
5. Number of leadership positions in a professional association held by faculty (e.g., elected officer, comm. chair, conf. chair, etc.)
This item seeks to report the number of activities where faculty have engaged in high-level service to their profession during the most recent 12-month evaluation period (membership alone in a professional association is insufficient, one must be actively involved). The leadership position might include being a member of the board of directors or holding some other leadership position in a professional association (e.g. elected officer, comm. chairperson, conf. chair).
6. Number of courses where faculty have developed new or significantly redesigned pedagogy or curriculum.
This item seeks the number of existing courses that have formally been redesigned, in each instance, by one or more faculty within the discipline during the most recent 12-month evaluation period. The curriculum development /redesign may be under the auspices of an externally funded instructional grant; part of a course-release sponsored by the department for the specific purpose of enhancing instructional methods and materials; or may include new initiatives in distance education. The key determinant is that this goes beyond the normal updating in course preparation as part of instructional workload.
7. Number of formal presentations made by faculty at state, regional, national, and international professional meetings.
This item seeks the number of invited and contributed papers, panels, performances, exhibitions, etc. by faculty during the most recent 12-month evaluation period. The key determinant is that the presentation was formal (i.e., listed in the meeting program and actually delivered by faculty member).
8. Number of clinical, practicum, or internship students formally assigned to faculty.
This item seeks to report faculty activity associated with supervising students in various types of field experiences in clinical, practicum, internship (non-research), cooperative, and service learning education programs during the most recent 12-month evaluation period.
Appendix F – Out of Classroom Definitions Universities and State College
38

9. Total number of students advised by faculty.
This item reports the number students advised by faculty during the most recent 12-month evaluation period. This item reflects formal academic advising to assigned students, as opposed to informal advice frequently given by faculty to students.
10. Number of peer reviews conducted by faculty.
This item reports the number of peer reviews performed by faculty for professional development, annual evaluations, and promotion/tenure purposes.
11. Number of recruitment and/or promotional activities participated in by faculty.
This item reports the number of recruitment activities participated in, such as school visits, presentations, development of promotional material, appearances at publicity events, and other activities involved in recruiting students and promoting the institution.
12. Number of external grants and/or contract proposals submitted by faculty.
This item seeks the number of external grant, contract, and scholarly fellowship proposals that have been submitted by faculty during the most recent 12-month evaluation period. The proposal may or may not have been accepted.
13. Number of newly-awarded external grants and/or contracts formally awarded to institution on behalf of faculty.
This item asks for the number of new external grants, contracts, and scholarly fellowships (e.g., National Endowment for the Humanities, Guggenheim Foundation) awarded to faculty or the institution on faculty's behalf during the most recent 12-month evaluation period, for which a formal award letter is in hand, regardless of whether the funds have been expended. While grants are often awarded for multiple years and funding is continuous, for purposes of this item, report the grant as awarded only the year where the initial award letter is received.
14. Total dollar value for the externally funded grants and contracts reported in Item 13.
Report the face value of the new grants, contracts, and scholarly fellowships cited in the previous term, whether or not the funds have been expended at the time of reporting. The face value should not include any matching instructional dollars.
15. Number of active or ongoing external grants and/or contracts on which faculty are working.
This item asks for the number of active or ongoing external grants, contracts, and/or scholarly fellowships (e.g., national endowment for the humanities, Guggenheim Foundation) on which faculty are working on during the most recent 12-month evaluation period.
16. Number of journal articles and/or book chapters published by faculty.
Single author articles are counted once. Co-authored journal articles, where faculty are from different institutions, are also counted once. If both faculty are from the same institution and discipline, count the article twice, as it represents out-of-classroom activity for each individual. The work must be published, i.e., initially published either in print or electronically during the most recent 12-month evaluation period.
17. Number of single-author or joint-author books or monographs published by faculty.
This item is seeking information on volumes produced by faculty. These volumes must be published by an academic or commercial press. Use the same counting convention with respect to joint authorship as was the case for journal articles and book chapters. Note: the work must be in print, i.e., initially published either in print or electronically during the most recent 12-month evaluation.
18. Number of books, collections, and monographs edited by faculty.
This item seeks the number of books, collections, and monographs edited by faculty. Use the same counting convention as for journal articles and book chapters. Note: the work must be in print, i.e., initially published either in print or electronically during the most recent 12-month evaluation.
19. Number of invited reviews of books and/manuscripts by faculty.
This item refers to the number of reviews of books or journal articles in print or manuscripts submitted to a publisher. This includes reviews for a university press or a scholarly journal. The review must have occurred during the most recent 12-month evaluation period.
20. Number of juried shows, commissioned performances, or competitive exhibitions by faculty presented in a physical venue or an electronic one.
This item is seeking information on scholarly productions in the fine, performing, and visual arts. Implicit in this measure is the endorsement of a jury or referee. Accordingly, this item seeks an art exhibition at a gallery or museum, as opposed to an all-faculty show at the home institution. Similarly it seeks a musical or theatrical performance where the faculty member is composer, author, performer, conductor, designer, or director. Where the faculty member is performer, he/she is an invited artist as opposed to a participant at an event sponsored by the department. When the exhibition is presented on a website, it must be a juried site where the participants are subject to a selection process by jury or referee.
39

21. Number of editorial positions held by faculty.
This item seeks the number of instances where a faculty member serves as editor, associate editor, assistant editor, or member of an editorial board for a scholarly publication directly related to the knowledge content in the discipline. This includes reviews for a university press or a scholarly journal. The review must have occurred during the most recent 12-month evaluation period.
22. Number of provisional or issued licensing agreements or patents registered by faculty.
This item seeks the number of provisional or issued patents formally conferred by the U.S. Patent Office for faculty products directly related to scholarly research in this discipline during the most recent 12-month evaluation period.
23. Number of active thesis/dissertation committees where faculty served as first reader or chairperson.
This item seeks a count of those committees (master's thesis and doctoral dissertations) where faculty members serve as the first reader or chair, whichever term is more applicable. For each faculty member, we are looking for those committees for which he/she had primary responsibility for directing the study, meeting regularly with the student, and coordinating the overall efforts of the committee during the most recent 12-month evaluation period.
24. Number of active thesis/dissertation committees where faculty served in a non-chairing role.
For each faculty member, this item seeks the number of committees where service was rendered other than as primary reader or committee chair. An "active committee" is defined as one where progress has been made during the most recent 12-month evaluation period.
25. Number of undergraduate students formally engaged in research with a faculty mentor.
This item seeks the number of undergraduate students who have been formally engaged in research during the most recent 12-month evaluation period, in a fashion consistent with practices at your institution. This might include students engaged in independent research, honors research, research with a faculty member for credit or non-credit, or paid research assistantships or research internships. This item excludes paid or unpaid student workers and work study (e.g., students who set up laboratories). Count each student only once within the 12-month period.
26. Number of students (undergraduate and/or graduate) who have jointly authored a journal article or book chapter with a faculty mentor.
Report the number of students who have jointly authored a journal article or book chapter with a faculty member during the most recent 12-month evaluation period. The student must be listed as a joint author in the publication. The work must be in print, i.e., published either in hard copy or online during the most recent 12-month evaluation period.
27. Number of students (undergraduate and/or graduate) who have jointly presented a paper at a professional meeting with a faculty mentor.
Report the number of students who have jointly presented a paper at a professional meeting with a faculty mentor during the most recent 12-month evaluation period. The student must be listed as joint presenter in the meeting program.
40
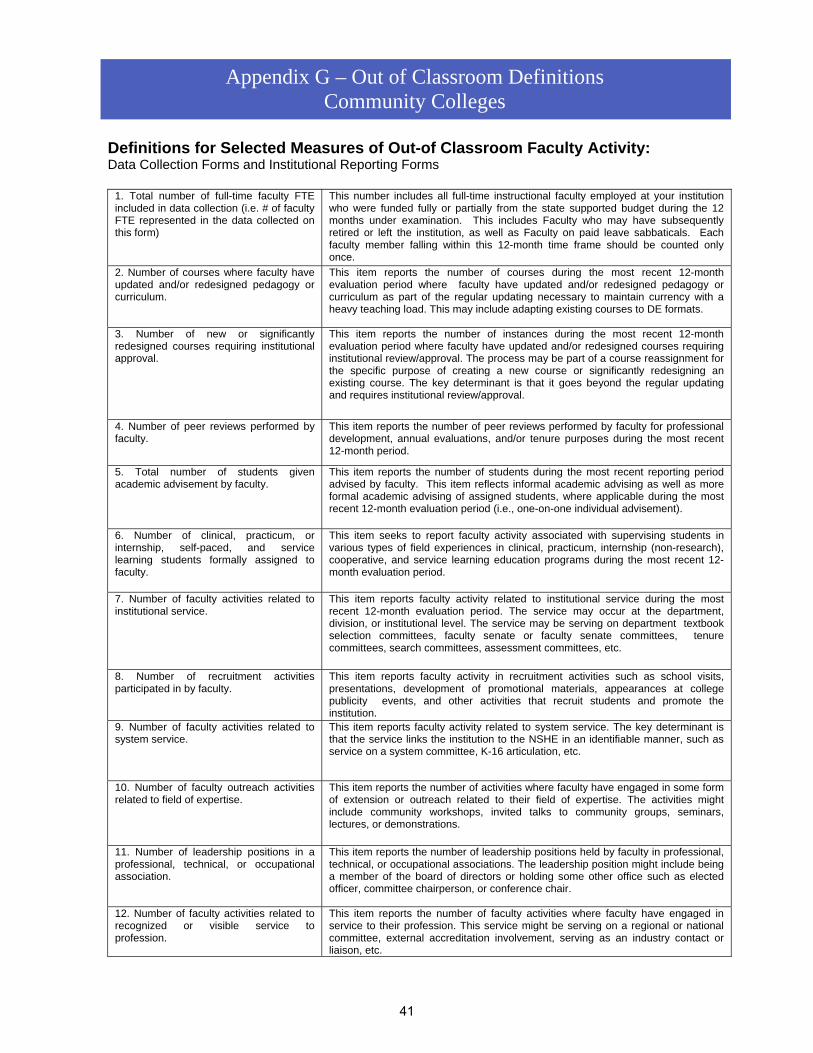
Definitions for Selected Measures of Out-of Classroom Faculty Activity: Data Collection Forms and Institutional Reporting Forms 1. Total number of full-time faculty FTE included in data collection (i.e. # of faculty FTE represented in the data collected on this form)
This number includes all full-time instructional faculty employed at your institution who were funded fully or partially from the state supported budget during the 12 months under examination. This includes Faculty who may have subsequently retired or left the institution, as well as Faculty on paid leave sabbaticals. Each faculty member falling within this 12-month time frame should be counted only once.
2. Number of courses where faculty have updated and/or redesigned pedagogy or curriculum.
This item reports the number of courses during the most recent 12-month evaluation period where faculty have updated and/or redesigned pedagogy or curriculum as part of the regular updating necessary to maintain currency with a heavy teaching load. This may include adapting existing courses to DE formats.
3. Number of new or significantly redesigned courses requiring institutional approval.
This item reports the number of instances during the most recent 12-month evaluation period where faculty have updated and/or redesigned courses requiring institutional review/approval. The process may be part of a course reassignment for the specific purpose of creating a new course or significantly redesigning an existing course. The key determinant is that it goes beyond the regular updating and requires institutional review/approval.
4. Number of peer reviews performed by faculty.
This item reports the number of peer reviews performed by faculty for professional development, annual evaluations, and/or tenure purposes during the most recent 12-month period.
5. Total number of students given academic advisement by faculty.
This item reports the number of students during the most recent reporting period advised by faculty. This item reflects informal academic advising as well as more formal academic advising of assigned students, where applicable during the most recent 12-month evaluation period (i.e., one-on-one individual advisement).
6. Number of clinical, practicum, or internship, self-paced, and service learning students formally assigned to faculty.
This item seeks to report faculty activity associated with supervising students in various types of field experiences in clinical, practicum, internship (non-research), cooperative, and service learning education programs during the most recent 12-month evaluation period.
7. Number of faculty activities related to institutional service.
This item reports faculty activity related to institutional service during the most recent 12-month evaluation period. The service may occur at the department, division, or institutional level. The service may be serving on department textbook selection committees, faculty senate or faculty senate committees, tenure committees, search committees, assessment committees, etc.
8. Number of recruitment activities participated in by faculty.
This item reports faculty activity in recruitment activities such as school visits, presentations, development of promotional materials, appearances at college publicity events, and other activities that recruit students and promote the institution.
9. Number of faculty activities related to system service.
This item reports faculty activity related to system service. The key determinant is that the service links the institution to the NSHE in an identifiable manner, such as service on a system committee, K-16 articulation, etc.
10. Number of faculty outreach activities related to field of expertise.
This item reports the number of activities where faculty have engaged in some form of extension or outreach related to their field of expertise. The activities might include community workshops, invited talks to community groups, seminars, lectures, or demonstrations.
11. Number of leadership positions in a professional, technical, or occupational association.
This item reports the number of leadership positions held by faculty in professional, technical, or occupational associations. The leadership position might include being a member of the board of directors or holding some other office such as elected officer, committee chairperson, or conference chair.
12. Number of faculty activities related to recognized or visible service to profession.
This item reports the number of faculty activities where faculty have engaged in service to their profession. This service might be serving on a regional or national committee, external accreditation involvement, serving as an industry contact or liaison, etc.
Appendix G – Out of Classroom Definitions Community Colleges
41

13. Number of formal presentations made by faculty at local, state, regional, national, and international professional, technical, or occupational professional meetings.
This item reports the number of invited and contributed presentations, papers, panels, performances, exhibitions, etc. by faculty. The key determinant is that the presentation was formal (i.e., listed in the meeting program and delivered by the faculty member).
14. Number of faculty memberships in discipline-related professional, technical, or occupational organizations.
This item reports the number of faculty memberships in discipline-related professional, technical, or occupational organizations. Membership in such organizations reflects currency in the discipline and a level of professional development.
15. Number of professional, technical, or occupational conferences and seminars attended by faculty.
This item reports the number of professional, technical, or occupational conferences and seminars attended by faculty. Attendance at such conferences and seminars reflects engagement in disciplinary professional development.
16. Number of updated/renewed national or industry standards certifications and updated/renewed licensures.
This item reports the number of updated/renewed national or industry standards certifications and updated/renewed licensures, which reflect currency in occupational/technical disciplines as well as professional development. The certifications/licensures may or may not be required.
17. Number of industry liaisons for factory updates re: training, safety, equipment, specifications.
This item reports the number of industry liaisons necessary for factory/industry updates for training, safety, equipment, and specification coordination in the occupational disciplines.
18. Number of occupational/industry internship programs for students.
This item reports the number of occupational/industry internship programs for students. These programs are time intensive regardless of the number of students and reflect a community response/involvement level that reflects a responsiveness to community occupational/industry needs.
19. Number of significant artistic creations in the fine arts, performing arts, or visual arts.
This item reports the number of significant artistic creations in the fine, performing, and visual arts. These may include an art exhibition at a gallery or at the home institution; similarly, it may be a musical or theatrical production where the faculty member is composer, author, performer, conductor, designer, or director. It may include juried shows, commissioned performances, or competitive exhibitions by faculty presented in a physical or electronic venue.
20. Number of significant scholarly and/or research activities.
This item reports the number of significant scholarly and/or research activities completed by faculty. These may include external grants or contracts; journal articles and/or book chapters; single- or joint-author books or monographs; book and/or manuscript reviews; and other significant activity that reflects a scholarly focus.
42