new academic administrators august 2018
TRANSCRIPT

New Academic AdministratorsAugust 2018
Brent JohnstonUniversity Budget Officer Office of Planning and Budgets Michigan State University
1

…the standard model has become unsustainable. To avoid disruptions, institutions of higher education must
develop strategies that transcend imitation.
Clayton M. Christensen, Henry J. Eyring,The Innovative University
2
To begin: from the innovative university

Environmental Scan - National
3
Monitoring Most Recent ValueHistory (5 year)
Forecast(5 Year) Commentary
High school completions (National)
3,037,040(FY15 NCES)
‐10% ~5% Monitor demographic and geographic distribution; program demand
College going rates –4 year (National)
44.0%(FY14 NCES)
4.0% 5%‐8%(2‐3 pp’s)
Increasing demand for 4 year degree; offsetssome demographic changes; differential
demand for program/locations/experience
International Enrollment1,078,037
(FY17 Open Doors)41% TBD Future uncertainty; MSU population;
increasing competition
Federal Discretionary Spending
$560B(FY16 OMB)
9.0%TBD
Subject to new administration
MSU ability to improve competitive position in face of potentially shrinking resource
environment and competing priorities –Potential ACA repeal and follow on impact
unknown

Environmental Scan - State
4
Monitoring Most Recent Value History(5 year)
Forecast(5 year)
Commentary
State of Michigan Jobs4.1M
(Q3 FY17, RSQE) 10% ~1‐2%/yrState recovered over 70% of job loses experienced 2000‐2009
General Fund/General Purpose Revenue Growth
(1.8)% (2017, RSQE) N.A.
2.7% 20181.3% 2019
Recovery of business tax revenue as MBT credits exhausted – competing priorities for incremental resources
Michigan Personal Income3.1%
(2017, RSQE) N.A.4.4% 20184.8% 2019
Continued job growth and non‐wageincome outperformance
DomesticLight Vehicle Market
17.1M(2017 RSQE)
~20% 17.1M 201817.0M 2019
Forecast roughly flat, Detroit 3 market share grows marginally
High School Completions(Michigan)
99,000 (FY17, NCES)
(‐7.4)% (‐4)% National and regional growth,improving MI economy may stem
loss

5
Students• Threats to non‐resident enrollment targets and composition – falling State and regional demographics, increasing
institutional competition – offset by rising college‐going ratesNational recruiting strategies
International recruiting strategies
Need for increasingly sophisticated strategic enrollment planning and market research capability
Opportunities to reach different student markets – online education, Kaplan, etc
• More students with varying levels of academic and/or financial need.
• Growing accountability for student success and addressing achievement gaps by group
• Increasing review of undergraduate placement following graduation – Next mile academy
• Increasing prominence of active learning and STEM disciplines
• Growing prevalence of disruptive/non‐disruptive technologies and educational platforms
• Future will requires different thinking and different types of leaders – design thinking and others
• Continue to monitor evolving tax treatment for graduate assistants tuition waiver
Research Institutions Emerging Environment
6
Stewardship
• Reputational rankings necessitate simultaneous investments in undergraduate, graduate, and research priorities
• Increased competition to recruit and retain top faculty including salary as well as start‐up requirements.
• Need for internal funding for classroom and research facilities
• Intensifying focus on tuition rates, financial hardship and related student debt and completions
• MSU increasingly competitive for federal support. However, federal R&D spending lags inflation, longer term Federal outlook unclear
Focus on Productivity
• Embed culture of high performance
• Streamline internal processes and procedures
• Act on opportunities to improve service and performance
Research Institutions Emerging Environment

2017 All Funds Revenue2007 All Funds Revenue
7Source: MSU financial statementsDollars in Thousands
Fluctuations between annual revenue and expense totals vary with investment performance and State appropriations outcomes
*Modified to include all Advancement activity
MSU All Funds Revenue
$63,000
$137,700
$168,900
$244,300
$252,900
$292,200
$335,000
$406,000
$0 $100,000 $200,000 $300,000 $400,000
Agbio/MSUE
Departmental Activities
University Advancement
Investment Income
Auxiliary Activities
State Appropriations
Sponsored Programs
Tuition and Fees
$61,900
$254,683
$269,900
$275,900
$356,500
$392,056
$482,900
$859,100
$0 $500,000 $1,000,000
Agbio/MSUE
University Advancement
Departmental Activities
State Appropriations
Auxiliary Activities
Investment Income
Sponsored Programs
Tuition and Fees

2017 All Funds Expenditures2007 All Funds Expenditures
8Source: MSU financial statements
MSU All Funds Expense
1.8%, $20,641
2.1%, $28,600
4.4%, $32,300
4.6%, $68,600
4.9%, $72,100
8.6%, $76,700
11.8%, $135,800
14.7%, $185,700
15.5%, $230,200
30.3%, $243,800
$475,800
$0 $400,000 $800,000
Other Expense
Student Services
Scholarships and Fellowships
Institutional Support
Academic Support
Depreciation
Operation/Maintenance of Plant
Public Service
Auxiliary Enterprises
Research
Instruction
1.8%, $45,644
2.1%, $51,190
2.7%, $67,013
5.3%, $131,448
5.2%, $129,603
5.8%, $142,707
6.2%, $154,344
11.6%, $286,991
13.0%, $321,039
15.4%, $380,481
30.8%, $762,112
$0 $400,000 $800,000 $1,200,000
Other Expense
Student Services
Scholarships and Fellowships
Academic Support
Operation/Maintenance of Plant
Institutional Support
Depreciation
Public Service
Auxiliary Enterprises
Research
Instruction

Federal Budget Sources and Uses
Total Federal Budget Sources: $3.8T Total Federal Budget Uses: $3.8T
Income Taxes, $1.48, 39%
Social Insurance and Retirement, $1.07,
28%
Corporate Taxes, $0.34,
9%
Borrowing, $0.58, 16%
Other, $0.29, 8%
Social Security, $0.82, 22%
Medicare, $0.51, 13%
Medicaid, $0.31, 8%
Other Mandatory, $0.63, 16%
Net Interest, $0.23, 6%
Defense Discretionary, $0.62, 16%
Defense R&D, $0.08, 2%
Non‐Defense Discretionary, $0.58, 15%
Non‐Defense R&D, $0.07, 2%
9

Expenditure National Rank Big Ten Rank Expenditure National Rank Big Ten Rank ChangeU. Michigan, Ann Arbor 1,357,228 2 1 1,304,074 2 1 4.1%U. Wisconsin-Madison 1,051,311 7 2 997,523 6 2 5.4%U. Minnesota, Twin Cities 872,514 16 3 834,181 15 3 4.6%Pennsylvania State U. 809,985 20 4 825,011 17 4 ‐1.8%Ohio State U. 751,293 24 5 743,321 21 5 1.1%Northwestern U. 684,767 29 6 612,009 30 7 11.9%Rutgers, State U. 610,648 32 7 474,192 41 11 28.8%U. Illinois, Urbana-Champaign 587,264 35 8 721,587 23 6 ‐18.6%
Michigan State U. 573,204 36 9 479,145 40 10 19.6%Purdue U., West Lafayette 517,879 41 10 528,564 34 8 ‐2.0%U. Maryland, College Park 517,173 42 11 487,345 37 9 6.1%Indiana U. 471,055 45 12 173,464 104 14 171.6%U. Iowa 447,718 47 13 423,097 46 12 5.8%U. Nebraska, Lincoln 264,485 79 14 245,171 79 13 7.9%
20132016
10Source: NSF HERD survey, 2016
Big Ten Sponsored R&D Expenditures
• MSU ranks 3rd in the Big Ten for 3-year change in R&D expenditures
• MSU ranks 36th nationally and 9th in the Big Ten for R&D expenditures
• MSU ranks 39th nationally for Federal R&D expenditures, an improvement of 13 positions over 3 years
11
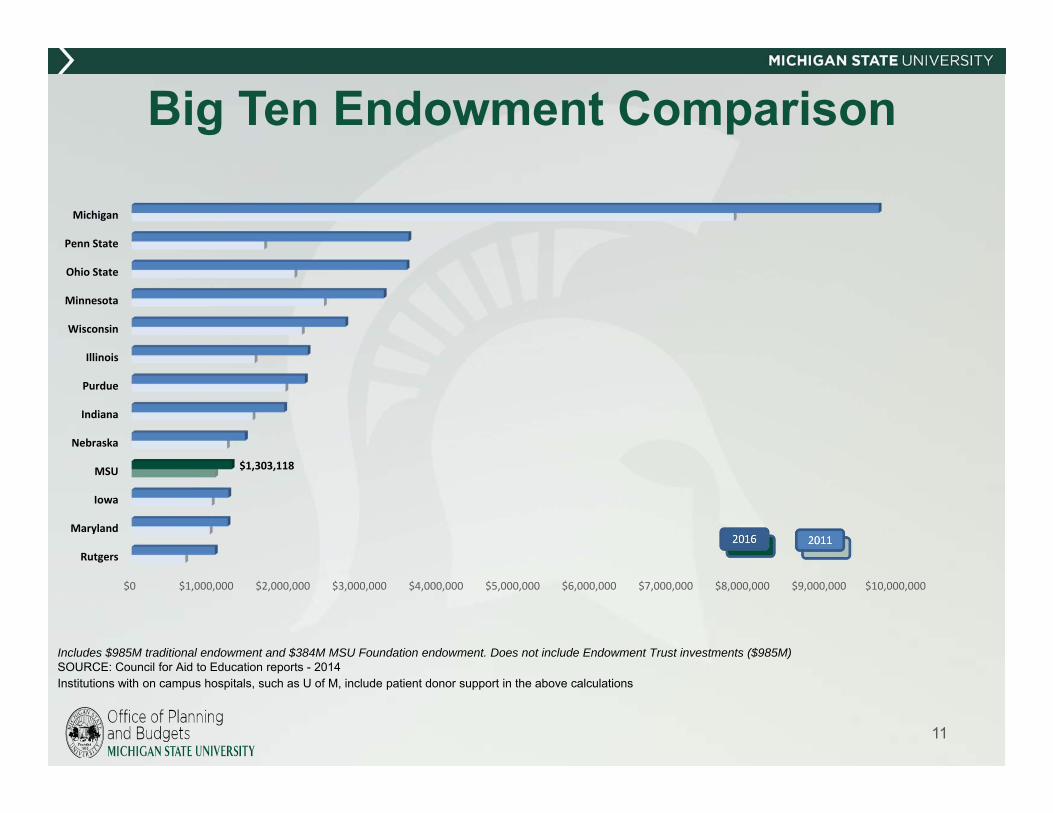
20112016
Institutions with on campus hospitals, such as U of M, include patient donor support in the above calculations
Includes $985M traditional endowment and $384M MSU Foundation endowment. Does not include Endowment Trust investments ($985M)SOURCE: Council for Aid to Education reports - 2014
Big Ten Endowment Comparison
$0 $1,000,000 $2,000,000 $3,000,000 $4,000,000 $5,000,000 $6,000,000 $7,000,000 $8,000,000 $9,000,000 $10,000,000
Rutgers
Maryland
Iowa
MSU
Nebraska
Indiana
Purdue
Illinois
Wisconsin
Minnesota
Ohio State
Penn State
Michigan
$1,303,118

12
Big Ten Endowment Performance
$1,377
$1,138$1,236
$1,504 $1,502
$1,816
$2,249
$2,388$2,332
$2,656$2,753
$916$1,004 $1,036
$1,127$1,238
$1,467
$1,723
$1,906
$2,092$2,188
$2,260
$460
$134$199
$377$264
$349
$526 $482
$240
$468 $493
$194
$206 $214
$228 $255 $267 $287 $300
$311
$345 $378
$0
$500
$1,000
$1,500
$2,000
$2,500
$3,0006/30/08
6/30/09
6/30/10
6/30/11
6/30/12
6/30/13
6/30/14
6/30/15
6/30/16
6/30/17
6/30/18
In M
illions
Actual
Purchasing power surplus and endowment growth (ONLY when Green line is above purple line)
Market Value
Book
Undistributed
Inflation Component

Sample
Sample
Departmental Overview
AAU Comparison (Academic Analytics)
Persistence and Graduation
Sample
Sample
13
Key MetricsIllustrative Overview

Academic Analytics Metrics for Departmental Comparisons
Grant metrics Percentile on Grants per facultyPercentile on Grant dollars per facultyPercentile on Percent of faculty with grantPercentile on Dollars per grant
Publication metrics Percentile on Journal pubs per facultyPercentile on Percent faculty with journal pub
Citation metrics Percentile on Citations per facultyPercentile on Citations per pubPercentile on Percent of faculty with citationPercentile on percent authors with a citation
Book metrics Percentile on Books per facultyPercentile on percent faculty with book
Conference metrics Percentile on conference proceedings per facultyPercentile on percent of faculty with a conference proceeding
Award metrics Percentile on awards per facultyPercentile on Percent of faculty with award
14

• Involves engagement of campus stakeholder groups
• Board of Trustees
• Academic governance
• ASMSU
• COGS
• Refines multi-year planning focused on improving the value
proposition for stakeholder
• University administrators
• Collective bargaining groups
• RHA
• State policy makers
15
MSU Budget Process

November‐December 2018Executive Branch
July 2019State appropriation passed
January 20192019‐20 executive
budget recommendation
March, April, May, 2019Legislative hearings: House and Senate
16
Planning and Financial Process

June‐October 2018Trustees act on 2018‐19/2019‐20 budgets and
2019‐20 State budget request
April‐May 2019Admin/Board review of 2019‐20 budgets
February ‐May 2019Budget Planning Meetings
Fall 2018Budget & Planning ‐ Strategic Issues
June‐July 2019Board action on updated 2019‐20
budgets, GF if necessary
June 2019Preliminary 2020‐21 operating and capital
outlay request formulated
August 2019Administration consultation on
2020‐21 budget request
October 2019Trustees act on 2020‐21 budget request
17
MSU Budget Process

• Continuing discussion: Board of Trustees, President, Provost, Deans, Governance, Community
• Fall--Strategic Planning• Major challenges/opportunities (e.g., intellectual, educational, research, outreach)
facing the unit • Supports sustainable programmatic visions that are dynamic and responsive • Identify requests that align with priorities, build unique advantage, and add value• Build internal and external alliances• Use metrics to demonstrate results and accountability with clear outcomes and
impacts• Investment from multiple sources; both internal and central• Reward high performing units and address non-performing and lower-priority areas
Values-Driven Data-Oriented Planning
18

• Spring- -Internal Budget Issues• Solidify programmatic plans including reductions• Problem/opportunity addressed (current baseline metrics)• What will be done• Accountability: outcomes and milestones related to college metrics• Continue integration of college and university priorities• Continue progress strategic initiatives and links requests with strategic
directions outlined in the fall • State economic condition indicates a period of flat resource growth• Most investments come from reallocated funds from elsewhere in the institution• Seek multiple strategies for achieving goals
Values-Driven Data-Oriented Planning
19

Formula based on budget proposal Salary increments
Operating support
1% reallocation
DifferentialProgram allocations
Reductions
Operating UnitsSeparately Reviewed
Items
Financial aid
Utilities
Health care
Other benefits
Debt
Financial framework
Annual Planning & Budget Development
20

21
MSU Financial FrameworkItem Funding Timing Notes
Global Impact/Academic Excellence
$2.5M R$8M R
FY19FY20‐FY22
Unfunded need of $4.5‐$18.5M over ten years to advance status as top‐100 institution; increasing
competition for federal funds
Technology $16.5 R‐$10M R
FY19‐FY22Pending
IT Modernization & StabilizationEnterprise information technology fee
Financial Aid $25M R
$20M R
Ongoing
Pending
Capital campaign has made progress towards goal –reliant on realization of deferred giving and long‐term
endowment payout
Class composition additional need
Health Care Difference between inflation
and actualOngoing
Funds component over 3% inflationary growthMonitor ACA impact, limit institutional cost growth

22
MSU Financial FrameworkItem Funding Timing Notes
Non‐Recurring Technology $50M‐$125M other NR
Ongoing Strategic Technology (NR)–Student Success, Student Information, Research,
Analytics, SalesForce
Research/Critical Space $42M NR$100M NR
$20M‐$40M NR
When state fundedIn processVariable
STEM teaching and learning buildingInterdisciplinary science facilities
Research infrastructure
Power and Utilities
$48M NR
$35M‐$55M NR
$70M NR
In process
FY19‐FY27
Ongoing
Adequate to address electric and steam capacity and modernization efforts
Anticipated needs for water quality, solar array buyout and other utility projects
HVAC replacements at various locations on campus
Capital Renewal GF
Capital Renewal Auxiliary Units
$230M‐$330M NR
$120M‐$140M NR
Ongoing
Ongoing
Need to prioritize projects and define scope
Project needs recognized in annual plan

2018‐19 Budget Outcomes Appropriations
23
• 2018‐19 appropriation indicated at 1.8%• Base upon performance funding adjustments in the State funding
formula• Legislative tuition restraint threshold established at 3.8%
• 2019‐20 appropriation assumed at 2.0% • Consistent with RSQE forecast for Detroit CPI• Anticipates continuation of State funding formula and tuition
restraint provisions
• Propose to Governor and state legislature that institutions who do not increase base tuition in a given year should receive additional performance funding in the same way that institutions who increase tuition in excess of the restraint limit are ineligible for performance funding

2018‐19 Budget Outcomes
Financial Aid Increase of approximately $6.4 million or 4.5 percent
Campus Safety 13 new Title IX and related positions – includes preventative and
investigative staff 10 new positions in Counseling & Psychiatric Services 4 new MSU Police officers 2 new Employee Assistance positions 2 new FOIA Office positions 2 new Office of Enterprise Risk Management, Ethics, and Compliance
positions
24

Salary proposals One year freeze on salaries for all top administrators
(Including VPs, deans and similar ranks)
Faculty and academic staff raise increment at 1.5% plus 0.5% Provost market
Research assistant salary increase of 2%
Student employee salary increase of 4%
All other increases in accordance with union contracts
25
2018‐19 Budget Outcomes
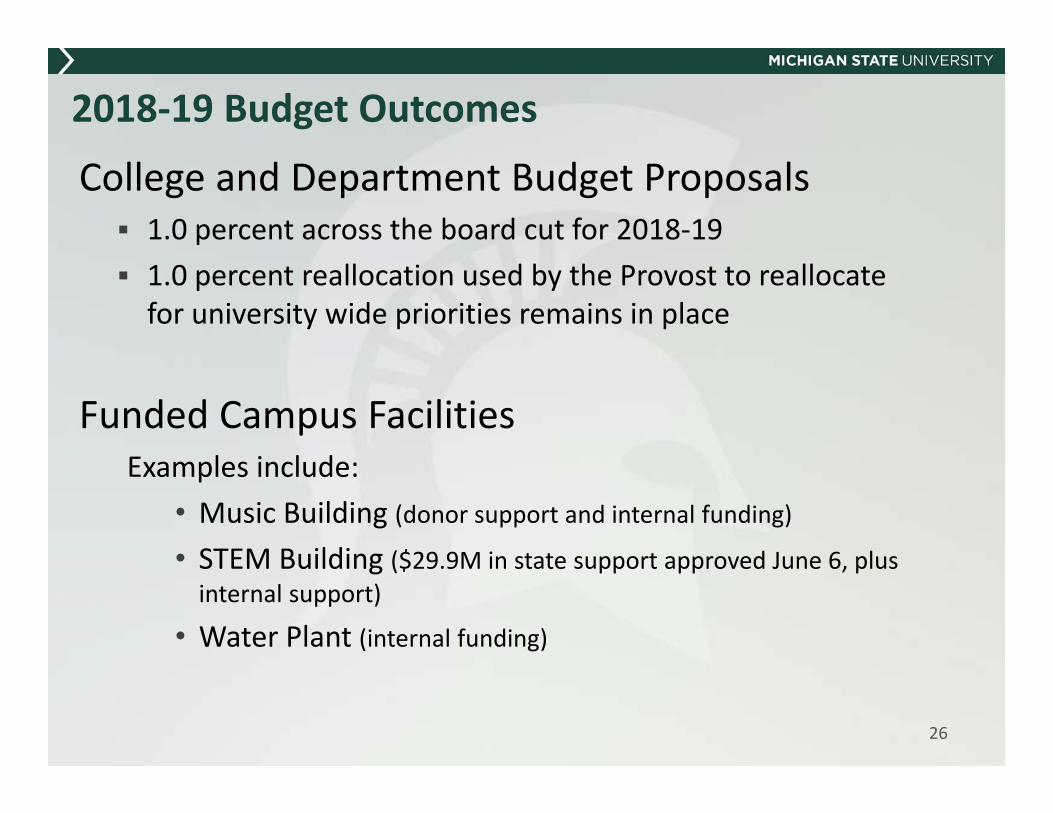
College and Department Budget Proposals 1.0 percent across the board cut for 2018‐19 1.0 percent reallocation used by the Provost to reallocate for university wide priorities remains in place
Funded Campus FacilitiesExamples include:
• Music Building (donor support and internal funding)• STEM Building ($29.9M in state support approved June 6, plus internal support)
• Water Plant (internal funding)
26
2018‐19 Budget Outcomes

2018‐19 and 2019‐20 Budget SummaryBudget Item 2018‐19 Current Proposal 2019‐20 Current ProposalState Appropriations 1.8% 2.0% (assumption)
Tuition and FeesNo increase for resident freshmen,
$360 per academic year for non‐resident freshmen
Increases of $360 per academic year for resident and non‐resident Core/Professional sophomores ‐seniors
$540 per semester for resident and non‐resident junior & senior Business and Engineering students
4.0% for most graduate students
No tuition increase for all undergraduate students
A new rate structure that includes per credit rates for students taking 11 credits or less, block rates for students taking 12‐18 credits, and a hybrid
block/per credit structure for students taking 19+ credits
4.0% for most graduate students
Total Tuition & Fee Revenue $1,002.8 $1,051.5
Financial Aid 4.5% 7.1%
Graduate Assistants 2.0% 2.0%
Faculty Salaries 1.5%+0.5%* 2.5%+0.5%*
Utilities ‐6.1% 0.0%
Health Care 5.0%** 5.0%**
Financial FrameworkCompetitiveness $2.5 $3.2Technology $3.5 $6.5
Performance Efficiency Reallocation ‐1.0% ‐1.0%Base Budget Reduction ‐1.0% 0.0%
Total Budget $1,391.5 $1,449.2
*Includes 1.5% merit and 0.5% Provost market**Health care budget augmented by amounts previously committed to collective bargaining groups due to claims experience 16

Budget Rates of Change
28
FY15 FY16 FY17 FY18 FY19 FY20Base 2.70% 2.69% 2.29% 1.65% 0.94% 2.45%Financial aid 0.40% 0.61% 0.89% 0.69% 0.48% 0.78%Enrollment Growth 0.14% 0.00% 0.00% 0.00% 0.00% 0.00%Indirect Cost Pass-Through 0.00% 0.00% 0.00% 0.23% 0.10% 0.09%
Sub-Total 3.2% 3.3% 3.2% 2.6% 1.5% 3.3%
Financial Framework 1.02% 0.65% 0.40% 0.40% 0.55% 0.70%Sub-Total 4.3% 3.9% 3.6% 3.0% 2.1% 4.0%
Revenue Based Initiative 0.71% 0.73% 0.63% 0.46% 0.08% 0.08%Total 4.97% 4.67% 4.21% 3.42% 2.1% 4.1%

• Consistency with MSU planning initiatives• Reputation for administrative competence • Ability to catalyze longer-term, wider impact initiatives • Multi-disciplinary in nature • History of programmatic success• Willingness to commit internal matching funds • Entrepreneurial talent• Quantify objectives and results• Development of long-term planning model that allows for
identification of financial and operational issues
Predictors of Long-Term Budgetary Success
29

The imagining university works continuously at doing its best within its circumstances, exploiting the spaces available to it, and so even changing
its circumstances in the process
Ronald BarnettImagining the University
30

Dave Byelich AVP & Director 5-9271Bethan Cantwell Institutional Studies 5-9273Brent Johnston Budget, Planning and Analysis 3-5519Barbara Kranz Facility Planning 3-5062Mike Zeig Long-Range Planning 5-5115
31
Faculty Start‐Ups Technology FundingFacility and Renovation Needs
Additional Issues
Questions & Follow Up
AttachmentsFall Planning LetterSpring Budget Planning Letter
www.opb.msu.eduSource for Information