new brunswick mathematics grade 8 ...it is essential the mathematics curriculum reflects current...
TRANSCRIPT
1
Acknowledgements The Department of Education of New Brunswick gratefully acknowledges the contributions of the following groups and individuals toward the development of the New Brunswick Grade 8 Mathematics Curriculum Guide: • The Western and Northern Canadian Protocol (WNCP) for Collaboration in Education: The Common
Curriculum Framework for K-9 Mathematics, May 2006. Reproduced (and/or adapted) by permission. All rights reserved.
• Alberta Education (Department of Education) • Newfoundland and Labrador Department of Education • Prince Edward Island Department of Education • The Middle Level Mathematics Curriculum Development Advisory Committee • The Grade 8 Curriculum Development Team:
• Angela Buggie, School District 16 • Kim Clancy, School District 6 • Craig Crawford, School District 15 • Derrick Grant, School District 18 • Elizabeth Nowlan, School District 2 • Erin Schriver, School District 14
• Cathy Martin, Learning Specialist, K-8 Mathematics and Science, NB Department of Education • The Mathematics Learning Specialists, Numeracy Leads, and Mathematics teachers of New
Brunswick who provided invaluable input and feedback throughout the development and implementation of this document.
2009 Department of Education
Educational Programs and Services
Additional copies of this document may be obtained using the Title Code: 844480
_________________________________________________________________________________________________________ NEW BRUNSWICK MATHEMATICS GRADE 8 CURRICULUM GUIDE Page 1
Table of Contents Curriculum Overview for K-9 Mathematics Background and Rationale ............................................................................................... 2 Beliefs about Students and Mathematics Learning ....................................................... 2 Goals for Mathematically Literate Students .............................................. 3 Opportunities for Success ......................................................................... 3 Diverse Cultural Perspectives ................................................................... 4 Adapting to the Needs of All Learners ...................................................... 4 Connections Across the Curriculum .......................................................... 4 Assessment ....................................................................................................................... 5 Conceptual Framework for K – 9 Mathematics .............................................................. 6 Mathematical Processes .................................................................................................. 7 Communication ......................................................................................... 7 Connections .............................................................................................. 7 Reasoning ................................................................................................. 7 Mental Mathematics and Estimation ......................................................... 8 Problem Solving ........................................................................................ 8 Technology ................................................................................................ 9 Visualization .............................................................................................. 9 Nature of Mathematics .................................................................................................... 10 Change .................................................................................................... 10 Constancy ............................................................................................... 10 Number Sense ........................................................................................ 10 Relationships ........................................................................................... 10 Patterns ................................................................................................... 11 Spatial Sense .......................................................................................... 11 Uncertainty .............................................................................................. 11 Structure of the Mathematics Curriculum .................................................................... 12 Curriculum Document Format ....................................................................................... 13 Specific Curriculum Outcomes .................................................................................................. 14 Number ................................................................................................... 14 Patterns and Relations ............................................................................ 42 Shape and Space .................................................................................... 50 Statistics and Probability ......................................................................... 74 Appendix A: Glossary of Models ................................................................................................ 82 Appendix B: List of Grade 8 Specific Curriculum Outcomes .................................................. 89 Appendix C: References .............................................................................................................. 90
CURRICULUM OVERVIEW FOR K – 9 MATHEMATICS
_________________________________________________________________________________________________________ Page 2 NEW BRUNSWICK MATHEMATICS GRADE 8 CURRICULUM GUIDE
BACKGROUND AND RATIONALE Mathematics curriculum is shaped by a vision which fosters the development of mathematically literate students who can extend and apply their learning and who are effective participants in society. It is essential the mathematics curriculum reflects current research in mathematics instruction. To achieve this goal, the Western and Northern Canadian Protocol (WNCP) Common Curriculum Framework for K-9 Mathematics (2006) has been adopted as the basis for a revised mathematics curriculum in New Brunswick. The Common Curriculum Framework was developed by the seven ministries of education (Alberta, British Columbia, Manitoba, Northwest Territories, Nunavut, Saskatchewan and Yukon Territory) in collaboration with teachers, administrators, parents, business representatives, post-secondary educators and others. The framework identifies beliefs about mathematics, general and specific student outcomes, and achievement indicators agreed upon by the seven jurisdictions. This document is based on both national and international research by the WNCP and the NCTM. There is an emphasis in the New Brunswick curriculum on particular key concepts at each grade which will result in greater depth of understanding and ultimately stronger student achievement. There is also a greater emphasis on number sense and operations concepts in the early grades to ensure students develop a solid foundation in numeracy. The intent of this document is to clearly communicate high expectations for students in mathematics education to all education partners. Because of the emphasis placed on key concepts at each grade level, time needs to be taken to ensure mastery of these concepts. Students must learn mathematics with understanding, actively building new knowledge from experience and prior knowledge (NCTM Principles and Standards, 2000). BELIEFS ABOUT STUDENTS AND MATHEMATICS LEARNING The New Brunswick Mathematics Curriculum is based upon several key assumptions or beliefs about mathematics learning which have grown out of research and practice. These beliefs include:
• mathematics learning is an active and constructive process; • learners are individuals who bring a wide range of prior knowledge and experiences, and
who learn via various styles and at different rates; • learning is most likely to occur when placed in meaningful contexts and in an environment
that supports exploration, risk taking, and critical thinking and that nurtures positive attitudes and sustained effort; and
• learning is most effective when standards of expectation are made clear with on-going assessment and feedback.
Students are curious, active learners with individual interests, abilities and needs. They come to classrooms with varying knowledge, life experiences and backgrounds. A key component in successfully developing numeracy is making connections to these backgrounds and experiences. Students develop a variety of mathematical ideas before they enter school. Children make sense of their environment through observations and interactions at home and in the community. Mathematics learning is embedded in everyday activities, such as playing, reading, storytelling and helping around the home. Such activities can contribute to the development of number and spatial sense in children. Curiosity about mathematics is fostered when children are
CURRICULUM OVERVIEW FOR K – 9 MATHEMATICS
_________________________________________________________________________________________________________ NEW BRUNSWICK MATHEMATICS GRADE 8 CURRICULUM GUIDE Page 3
engaged in activities such as comparing quantities, searching for patterns, sorting objects, ordering objects, creating designs, building with blocks and talking about these activities. Positive early experiences in mathematics are as critical to child development as are early literacy experiences. Students learn by attaching meaning to what they do and need to construct their own meaning of mathematics. This meaning is best developed when learners encounter mathematical experiences that proceed from the simple to the complex and from the concrete to the abstract. The use of models and a variety of pedagogical approaches can address the diversity of learning styles and developmental stages of students, and enhance the formation of sound, transferable, mathematical concepts. At all levels, students benefit from working with and translating through a variety of materials, tools and contexts when constructing meaning about new mathematical ideas. Meaningful discussions can provide essential links among concrete, pictorial and symbolic representations of mathematics. The learning environment should value and respect all students’ experiences and ways of thinking, so that learners are comfortable taking intellectual risks, asking questions and posing conjectures. Students need to explore problem-solving situations in order to develop personal strategies and become mathematically literate. Learners must realize that it is acceptable to solve problems in different ways and that solutions may vary. GOALS FOR MATHEMATICALLY LITERATE STUDENTS The main goals of mathematics education are to prepare students to: • use mathematics confidently to solve problems • communicate and reason mathematically • appreciate and value mathematics • make connections between mathematics and its applications • commit themselves to lifelong learning • become mathematically literate adults, using mathematics to contribute to society. Students who have met these goals will: • gain understanding and appreciation of the contributions of mathematics as a science,
philosophy and art • exhibit a positive attitude toward mathematics • engage and persevere in mathematical tasks and projects • contribute to mathematical discussions • take risks in performing mathematical tasks • exhibit curiosity OPPORTUNITIES FOR SUCCESS A positive attitude has a profound effect on learning. Environments that create a sense of belonging, encourage risk taking, and provide opportunities for success help develop and maintain positive attitudes and self-confidence. Students with positive attitudes toward learning mathematics are likely to be motivated and prepared to learn, participate willingly in classroom activities, persist in challenging situations and engage in reflective practices. Teachers, students and parents need to recognize the relationship between the affective and cognitive domains, and attempt to nurture those aspects of the affective domain that contribute to positive attitudes. To experience success, students must be taught to set achievable goals and assess themselves as they work toward these goals. Striving toward success, and becoming autonomous and responsible learners are ongoing, reflective processes that involve revisiting the setting and assessing of personal goals.
CURRICULUM OVERVIEW FOR K – 9 MATHEMATICS
_________________________________________________________________________________________________________ Page 4 NEW BRUNSWICK MATHEMATICS GRADE 8 CURRICULUM GUIDE
DIVERSE CULTURAL PERSPECTIVES Students attend schools in a variety of settings including urban, rural and isolated communities. Teachers need to understand the diversity of cultures and experiences of all students. Aboriginal students often have a whole-world view of the environment in which they live and learn best in a holistic way. This means that students look for connections in learning and learn best when mathematics is contextualized and not taught as discrete components. Aboriginal students come from cultures where learning takes place through active participation. Traditionally, little emphasis was placed upon the written word. Oral communication along with practical applications and experiences are important to student learning and understanding. It is also vital that teachers understand and respond to non-verbal cues so that student learning and mathematical understanding are optimized. It is important to note that these general instructional strategies may not apply to all students. A variety of teaching and assessment strategies is required to build upon the diverse knowledge, cultures, communication styles, skills, attitudes, experiences and learning styles of students. The strategies used must go beyond the incidental inclusion of topics and objects unique to a culture or region, and strive to achieve higher levels of multicultural education (Banks and Banks, 1993). ADAPTING TO THE NEEDS OF ALL LEARNERS Teachers must adapt instruction to accommodate differences in student development as they enter school and as they progress, but they must also avoid gender and cultural biases. Ideally, every student should find his/her learning opportunities maximized in the mathematics classroom. The reality of individual student differences must not be ignored when making instructional decisions. As well, teachers must understand and design instruction to accommodate differences in student learning styles. Different instructional modes are clearly appropriate, for example, for those students who are primarily visual learners versus those who learn best by doing. Designing classroom activities to support a variety of learning styles must also be reflected in assessment strategies. CONNECTIONS ACROSS THE CURRICULUM The teacher should take advantage of the various opportunities available to integrate mathematics and other subjects. This integration not only serves to show students how mathematics is used in daily life, but it helps strengthen the students’ understanding of mathematical concepts and provides them with opportunities to practise mathematical skills. There are many possibilities for integrating mathematics in literacy, science, social studies, music, art, and physical education.
CURRICULUM OVERVIEW FOR K – 9 MATHEMATICS
_________________________________________________________________________________________________________ NEW BRUNSWICK MATHEMATICS GRADE 8 CURRICULUM GUIDE Page 5
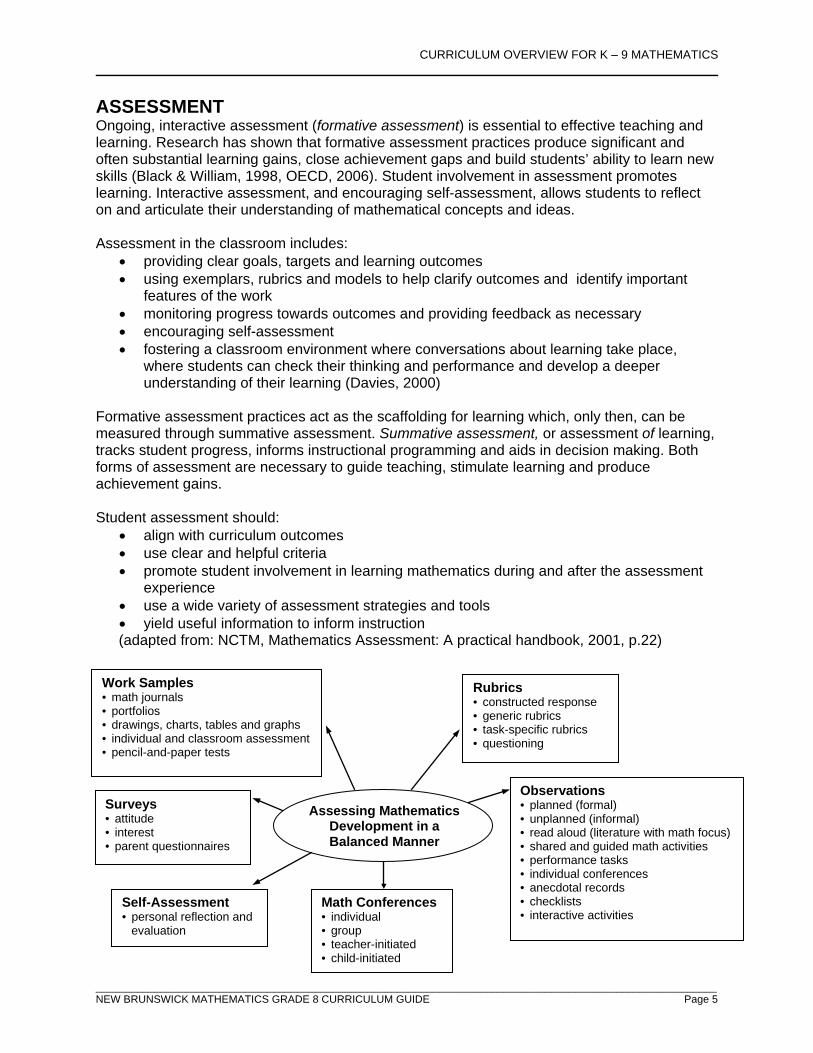
ASSESSMENT Ongoing, interactive assessment (formative assessment) is essential to effective teaching and learning. Research has shown that formative assessment practices produce significant and often substantial learning gains, close achievement gaps and build students’ ability to learn new skills (Black & William, 1998, OECD, 2006). Student involvement in assessment promotes learning. Interactive assessment, and encouraging self-assessment, allows students to reflect on and articulate their understanding of mathematical concepts and ideas. Assessment in the classroom includes:
• providing clear goals, targets and learning outcomes • using exemplars, rubrics and models to help clarify outcomes and identify important
features of the work • monitoring progress towards outcomes and providing feedback as necessary • encouraging self-assessment • fostering a classroom environment where conversations about learning take place,
where students can check their thinking and performance and develop a deeper understanding of their learning (Davies, 2000)
Formative assessment practices act as the scaffolding for learning which, only then, can be measured through summative assessment. Summative assessment, or assessment of learning, tracks student progress, informs instructional programming and aids in decision making. Both forms of assessment are necessary to guide teaching, stimulate learning and produce achievement gains. Student assessment should:
• align with curriculum outcomes • use clear and helpful criteria • promote student involvement in learning mathematics during and after the assessment
experience • use a wide variety of assessment strategies and tools • yield useful information to inform instruction
(adapted from: NCTM, Mathematics Assessment: A practical handbook, 2001, p.22)
Assessing Mathematics Development in a Balanced Manner
Work Samples • math journals • portfolios • drawings, charts, tables and graphs • individual and classroom assessment • pencil-and-paper tests
Observations • planned (formal) • unplanned (informal) • read aloud (literature with math focus) • shared and guided math activities • performance tasks • individual conferences • anecdotal records • checklists • interactive activities
Rubrics • constructed response • generic rubrics • task-specific rubrics • questioning
Math Conferences • individual • group • teacher-initiated • child-initiated
Surveys • attitude • interest • parent questionnaires
Self-Assessment • personal reflection and
evaluation
CURRICULUM OVERVIEW FOR K – 9 MATHEMATICS
_________________________________________________________________________________________________________ Page 6 NEW BRUNSWICK MATHEMATICS GRADE 8 CURRICULUM GUIDE
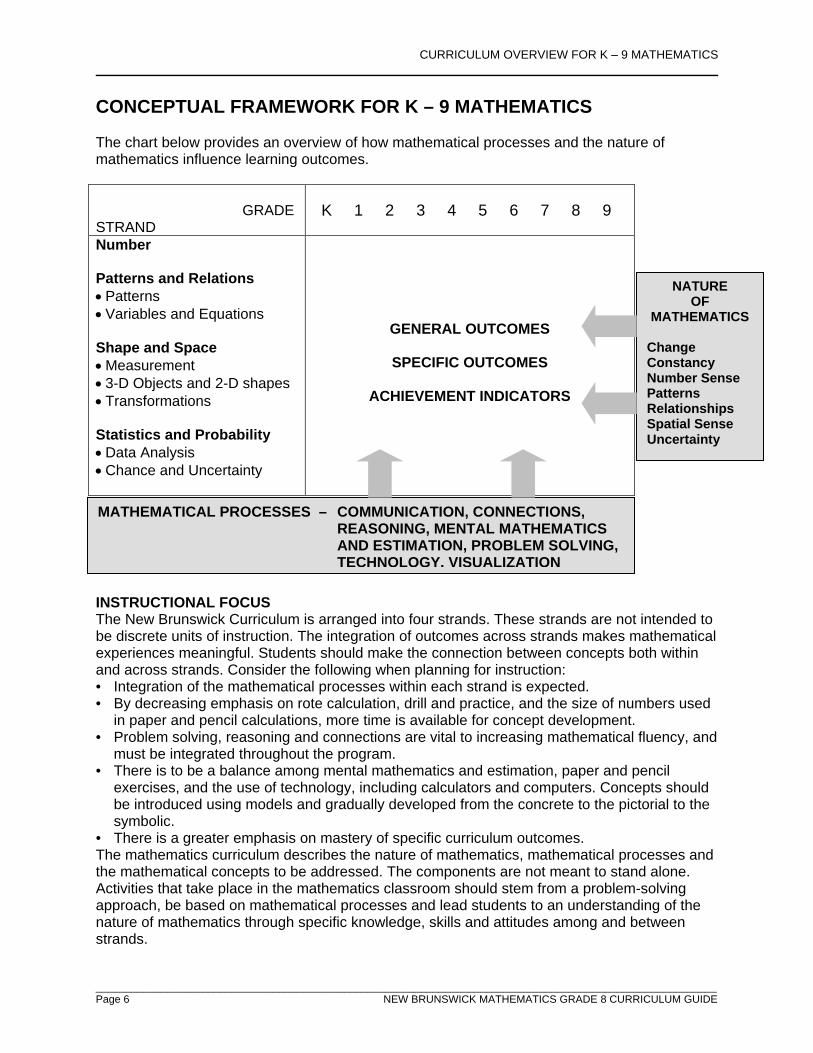
CONCEPTUAL FRAMEWORK FOR K – 9 MATHEMATICS The chart below provides an overview of how mathematical processes and the nature of mathematics influence learning outcomes. GRADE STRAND
K 1 2 3 4 5 6 7 8 9
Number Patterns and Relations • Patterns • Variables and Equations Shape and Space • Measurement • 3-D Objects and 2-D shapes • Transformations Statistics and Probability • Data Analysis • Chance and Uncertainty
GENERAL OUTCOMES
SPECIFIC OUTCOMES
ACHIEVEMENT INDICATORS
INSTRUCTIONAL FOCUS The New Brunswick Curriculum is arranged into four strands. These strands are not intended to be discrete units of instruction. The integration of outcomes across strands makes mathematical experiences meaningful. Students should make the connection between concepts both within and across strands. Consider the following when planning for instruction: • Integration of the mathematical processes within each strand is expected. • By decreasing emphasis on rote calculation, drill and practice, and the size of numbers used
in paper and pencil calculations, more time is available for concept development. • Problem solving, reasoning and connections are vital to increasing mathematical fluency, and
must be integrated throughout the program. • There is to be a balance among mental mathematics and estimation, paper and pencil
exercises, and the use of technology, including calculators and computers. Concepts should be introduced using models and gradually developed from the concrete to the pictorial to the symbolic.
• There is a greater emphasis on mastery of specific curriculum outcomes. The mathematics curriculum describes the nature of mathematics, mathematical processes and the mathematical concepts to be addressed. The components are not meant to stand alone. Activities that take place in the mathematics classroom should stem from a problem-solving approach, be based on mathematical processes and lead students to an understanding of the nature of mathematics through specific knowledge, skills and attitudes among and between strands.
MATHEMATICAL PROCESSES – COMMUNICATION, CONNECTIONS, REASONING, MENTAL MATHEMATICS
AND ESTIMATION, PROBLEM SOLVING, TECHNOLOGY, VISUALIZATION
NATURE OF
MATHEMATICS
Change Constancy Number Sense Patterns Relationships Spatial Sense Uncertainty
CURRICULUM OVERVIEW FOR K – 9 MATHEMATICS
_________________________________________________________________________________________________________ NEW BRUNSWICK MATHEMATICS GRADE 8 CURRICULUM GUIDE Page 7
MATHEMATICAL PROCESSES There are critical components that students must encounter in a mathematics program in order to achieve the goals of mathematics education and encourage lifelong learning in mathematics. Students are expected to: • communicate in order to learn and express their understanding of mathematics
(Communications: C) • connect mathematical ideas to other concepts in mathematics, to everyday experiences and
to other disciplines (Connections: CN) • demonstrate fluency with mental mathematics and estimation (Mental Mathematics and
Estimation: ME) • develop and apply new mathematical knowledge through problem solving (Problem Solving:
PS) • develop mathematical reasoning (Reasoning: R) • select and use technologies as tools for learning and solving problems (Technology: T) • develop visualization skills to assist in processing information, making connections and
solving problems (Visualization: V). The New Brunswick Curriculum incorporates these seven interrelated mathematical processes that are intended to permeate teaching and learning. Communication [C] Students need opportunities to read about, represent, view, write about, listen to and discuss mathematical ideas. These opportunities allow students to create links between their own language and ideas, and the formal language and symbols of mathematics. Communication is important in clarifying, reinforcing and modifying ideas, knowledge, attitudes and beliefs about mathematics. Students should be encouraged to use a variety of forms of communication while learning mathematics. Students also need to communicate their learning using mathematical terminology. Communication can help students make connections among concrete, pictorial, symbolic, verbal, written and mental representations of mathematical ideas. Connections [CN] Contextualization and making connections to the experiences of learners are powerful processes in developing mathematical understanding. When mathematical ideas are connected to each other or to real-world phenomena, students can begin to view mathematics as useful, relevant and integrated. Learning mathematics within contexts and making connections relevant to learners can validate past experiences, and increase student willingness to participate and be actively engaged. The brain is constantly looking for and making connections. “Because the learner is constantly searching for connections on many levels, educators need to orchestrate the experiences from which learners extract understanding… Brain research establishes and confirms that multiple complex and concrete experiences are essential for meaningful learning and teaching” (Caine and Caine, 1991, p. 5). Reasoning [R] Mathematical reasoning helps students think logically and make sense of mathematics. Students need to develop confidence in their abilities to reason and justify their mathematical thinking. High-order questions challenge students to think and develop a sense of wonder about mathematics. Mathematical experiences in and out of the classroom provide opportunities for inductive and deductive reasoning. Inductive reasoning occurs when students explore and record results, analyze observations, make generalizations from patterns and test these
CURRICULUM OVERVIEW FOR K – 9 MATHEMATICS
_________________________________________________________________________________________________________ Page 8 NEW BRUNSWICK MATHEMATICS GRADE 8 CURRICULUM GUIDE
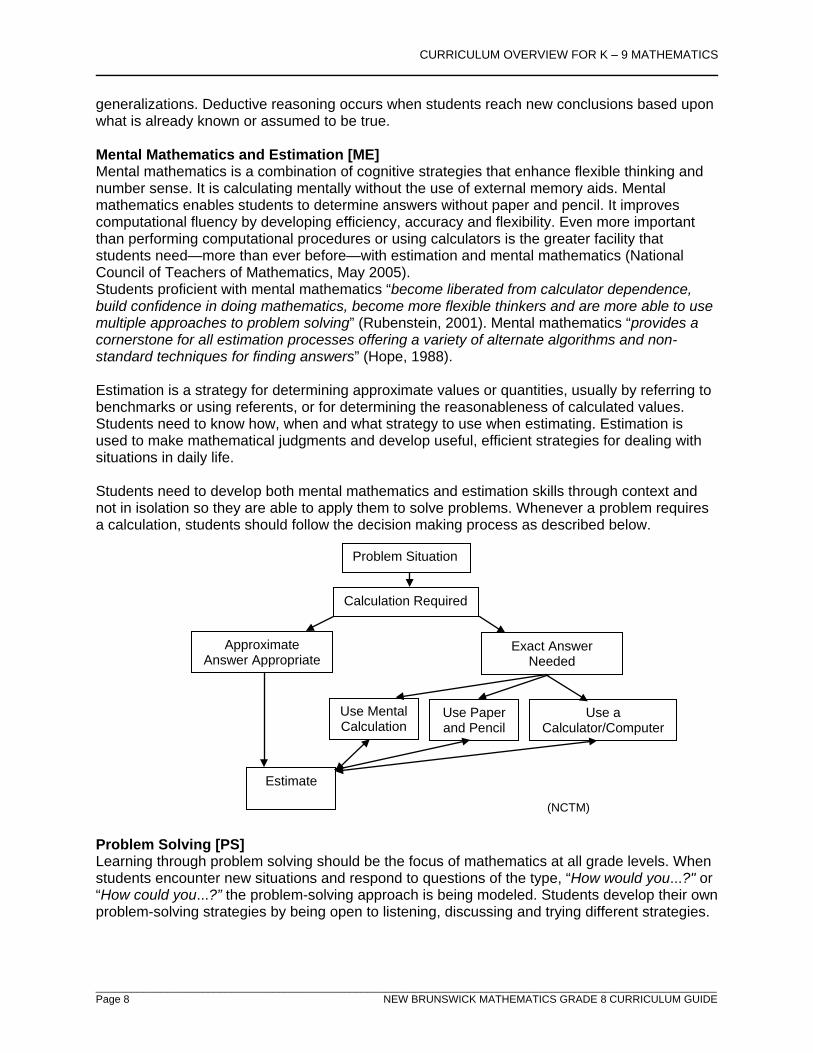
generalizations. Deductive reasoning occurs when students reach new conclusions based upon what is already known or assumed to be true. Mental Mathematics and Estimation [ME] Mental mathematics is a combination of cognitive strategies that enhance flexible thinking and number sense. It is calculating mentally without the use of external memory aids. Mental mathematics enables students to determine answers without paper and pencil. It improves computational fluency by developing efficiency, accuracy and flexibility. Even more important than performing computational procedures or using calculators is the greater facility that students need—more than ever before—with estimation and mental mathematics (National Council of Teachers of Mathematics, May 2005). Students proficient with mental mathematics “become liberated from calculator dependence, build confidence in doing mathematics, become more flexible thinkers and are more able to use multiple approaches to problem solving” (Rubenstein, 2001). Mental mathematics “provides a cornerstone for all estimation processes offering a variety of alternate algorithms and non-standard techniques for finding answers” (Hope, 1988). Estimation is a strategy for determining approximate values or quantities, usually by referring to benchmarks or using referents, or for determining the reasonableness of calculated values. Students need to know how, when and what strategy to use when estimating. Estimation is used to make mathematical judgments and develop useful, efficient strategies for dealing with situations in daily life. Students need to develop both mental mathematics and estimation skills through context and not in isolation so they are able to apply them to solve problems. Whenever a problem requires a calculation, students should follow the decision making process as described below. Problem Solving [PS] Learning through problem solving should be the focus of mathematics at all grade levels. When students encounter new situations and respond to questions of the type, “How would you...?" or “How could you...?” the problem-solving approach is being modeled. Students develop their own problem-solving strategies by being open to listening, discussing and trying different strategies.
Problem Situation
Calculation Required
Approximate Answer Appropriate
Exact Answer Needed
Use Mental Calculation
Use Paper and Pencil
Use a Calculator/Computer
Estimate
(NCTM)
CURRICULUM OVERVIEW FOR K – 9 MATHEMATICS
_________________________________________________________________________________________________________ NEW BRUNSWICK MATHEMATICS GRADE 8 CURRICULUM GUIDE Page 9
In order for an activity to be problem-solving based, it must ask students to determine a way to get from what is known to what is sought. If students have already been given ways to solve the problem, it is not a problem, but practice. A true problem requires students to use prior learning in new ways and contexts. Problem solving requires and builds depth of conceptual understanding and student engagement. Problem solving is also a powerful teaching tool that fosters multiple, creative and innovative solutions. Creating an environment where students openly look for and engage in finding a variety of strategies for solving problems empowers students to explore alternatives and develops confident, cognitive, mathematical risk takers. Technology [T] Technology contributes to the learning of a wide range of mathematical outcomes and enables students to explore and create patterns, examine relationships, test conjectures and solve problems. Calculators and computers can be used to: • explore and demonstrate mathematical relationships and patterns • organize and display data • extrapolate and interpolate • assist with calculation procedures as part of solving problems • decrease the time spent on computations when other mathematical learning is the focus • reinforce the learning of basic facts and test properties • develop personal procedures for mathematical operations • create geometric displays • simulate situations • develop number sense. Technology contributes to a learning environment in which the growing curiosity of students can lead to rich mathematical discoveries at all grade levels. While technology can be used in K–3 to enrich learning, it is expected that students will meet all outcomes without the use of technology. Visualization [V] Visualization “involves thinking in pictures and images, and the ability to perceive, transform and recreate different aspects of the visual-spatial world” (Armstrong, 1993, p. 10). The use of visualization in the study of mathematics provides students with opportunities to understand mathematical concepts and make connections among them. Visual images and visual reasoning are important components of number, spatial and measurement sense. Number visualization occurs when students create mental representations of numbers. Being able to create, interpret and describe a visual representation is part of spatial sense and spatial reasoning. Spatial visualization and reasoning enable students to describe the relationships among and between 3-D objects and 2-D shapes. Measurement visualization goes beyond the acquisition of specific measurement skills. Measurement sense includes the ability to determine when to measure, when to estimate and to know several estimation strategies (Shaw & Cliatt, 1989). Visualization is fostered through the use of concrete materials, technology and a variety of visual representations.
CURRICULUM OVERVIEW FOR K – 9 MATHEMATICS
_________________________________________________________________________________________________________ Page 10 NEW BRUNSWICK MATHEMATICS GRADE 8 CURRICULUM GUIDE
NATURE OF MATHEMATICS Mathematics is one way of trying to understand, interpret and describe our world. There are a number of components that define the nature of mathematics and these are woven throughout this document. These components include: change, constancy, number sense, relationships, patterns, spatial sense and uncertainty. Change It is important for students to understand that mathematics is dynamic and not static. As a result, recognizing change is a key component in understanding and developing mathematics. Within mathematics, students encounter conditions of change and are required to search for explanations of that change. To make predictions, students need to describe and quantify their observations, look for patterns, and describe those quantities that remain fixed and those that change. For example, the sequence 4, 6, 8, 10, 12, … can be described as: • skip counting by 2s, starting from 4 • an arithmetic sequence, with first term 4 and a common difference of 2 • a linear function with a discrete domain (Steen, 1990, p. 184). Constancy Different aspects of constancy are described by the terms stability, conservation, equilibrium, steady state and symmetry (AAAS–Benchmarks, 1993, p. 270). Many important properties in mathematics and science relate to properties that do not change when outside conditions change. Examples of constancy include: • the area of a rectangular region is the same regardless of the methods used to determine the
solution • the sum of the interior angles of any triangle is 180° • the theoretical probability of flipping a coin and getting heads is 0.5. Some problems in mathematics require students to focus on properties that remain constant. The recognition of constancy enables students to solve problems involving constant rates of change, lines with constant slope, direct variation situations or the angle sums of polygons. Number Sense Number sense, which can be thought of as intuition about numbers, is the most important foundation of numeracy (The Primary Program, B.C., 2000, p. 146). A true sense of number goes well beyond the skills of simply counting, memorizing facts and the situational rote use of algorithms. Number sense develops when students connect numbers to real-life experiences, and use benchmarks and referents. This results in students who are computationally fluent, flexible with numbers and have intuition about numbers. The evolving number sense typically comes as a by-product of learning rather than through direct instruction. However, number sense can be developed by providing rich mathematical tasks that allow students to make connections. Relationships Mathematics is used to describe and explain relationships. As part of the study of mathematics, students look for relationships among numbers, sets, shapes, objects and concepts. The search for possible relationships involves the collection and analysis of data, and describing relationships visually, symbolically, orally or in written form.
CURRICULUM OVERVIEW FOR K – 9 MATHEMATICS
_________________________________________________________________________________________________________ NEW BRUNSWICK MATHEMATICS GRADE 8 CURRICULUM GUIDE Page 11
Patterns Mathematics is about recognizing, describing and working with numerical and non-numerical patterns. Patterns exist in all strands and it is important that connections are made among strands. Working with patterns enables students to make connections within and beyond mathematics. These skills contribute to students’ interaction with and understanding of their environment. Patterns may be represented in concrete, visual or symbolic form. Students should develop fluency in moving from one representation to another. Students must learn to recognize, extend, create and use mathematical patterns. Patterns allow students to make predictions, and justify their reasoning when solving problems. Learning to work with patterns in the early grades helps develop students’ algebraic thinking that is foundational for working with more abstract mathematics in higher grades. Spatial Sense Spatial sense involves visualization, mental imagery and spatial reasoning. These skills are central to the understanding of mathematics. Spatial sense enables students to reason and interpret among and between 3-D and 2-D representations and identify relationships to mathematical strands. Spatial sense is developed through a variety of experiences and interactions within the environment. The development of spatial sense enables students to solve problems involving 3-D objects and 2-D shapes. Spatial sense offers a way to interpret and reflect on the physical environment and its 3-D or 2-D representations. Some problems involve attaching numerals and appropriate units (measurement) to dimensions of objects. Spatial sense allows students to make predictions about the results of changing these dimensions. For example: • knowing the dimensions of an object enables students to communicate about the object and
create representations • the volume of a rectangular solid can be calculated from given dimensions • doubling the length of the side of a square increases the area by a factor of four. Uncertainty In mathematics, interpretations of data and the predictions made from data may lack certainty. Events and experiments generate statistical data that can be used to make predictions. It is important to recognize that these predictions (interpolations and extrapolations) are based upon patterns that have a degree of uncertainty. The quality of the interpretation is directly related to the quality of the data. An awareness of uncertainty allows students to assess the reliability of data and data interpretation. Chance addresses the predictability of the occurrence of an outcome. As students develop their understanding of probability, the language of mathematics becomes more specific and describes the degree of uncertainty more accurately.
CURRICULUM OVERVIEW FOR K – 9 MATHEMATICS
_________________________________________________________________________________________________________ Page 12 NEW BRUNSWICK MATHEMATICS GRADE 8 CURRICULUM GUIDE
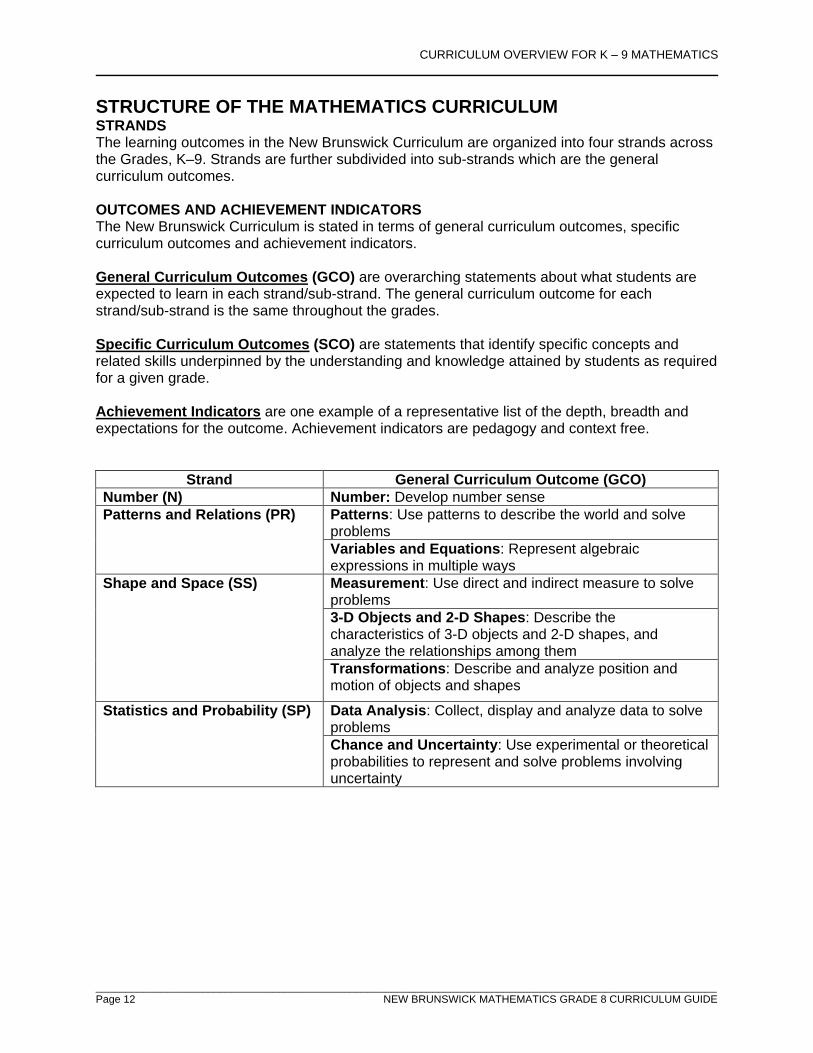
STRUCTURE OF THE MATHEMATICS CURRICULUM STRANDS The learning outcomes in the New Brunswick Curriculum are organized into four strands across the Grades, K–9. Strands are further subdivided into sub-strands which are the general curriculum outcomes. OUTCOMES AND ACHIEVEMENT INDICATORS The New Brunswick Curriculum is stated in terms of general curriculum outcomes, specific curriculum outcomes and achievement indicators. General Curriculum Outcomes (GCO) are overarching statements about what students are expected to learn in each strand/sub-strand. The general curriculum outcome for each strand/sub-strand is the same throughout the grades. Specific Curriculum Outcomes (SCO) are statements that identify specific concepts and related skills underpinned by the understanding and knowledge attained by students as required for a given grade. Achievement Indicators are one example of a representative list of the depth, breadth and expectations for the outcome. Achievement indicators are pedagogy and context free.
Strand General Curriculum Outcome (GCO) Number (N) Number: Develop number sense Patterns and Relations (PR)
Patterns: Use patterns to describe the world and solve problems Variables and Equations: Represent algebraic expressions in multiple ways
Shape and Space (SS) Measurement: Use direct and indirect measure to solve problems 3-D Objects and 2-D Shapes: Describe the characteristics of 3-D objects and 2-D shapes, and analyze the relationships among them Transformations: Describe and analyze position and motion of objects and shapes
Statistics and Probability (SP) Data Analysis: Collect, display and analyze data to solve problems Chance and Uncertainty: Use experimental or theoretical probabilities to represent and solve problems involving uncertainty
CURRICULUM OVERVIEW FOR K – 9 MATHEMATICS
_________________________________________________________________________________________________________ NEW BRUNSWICK MATHEMATICS GRADE 8 CURRICULUM GUIDE Page 13
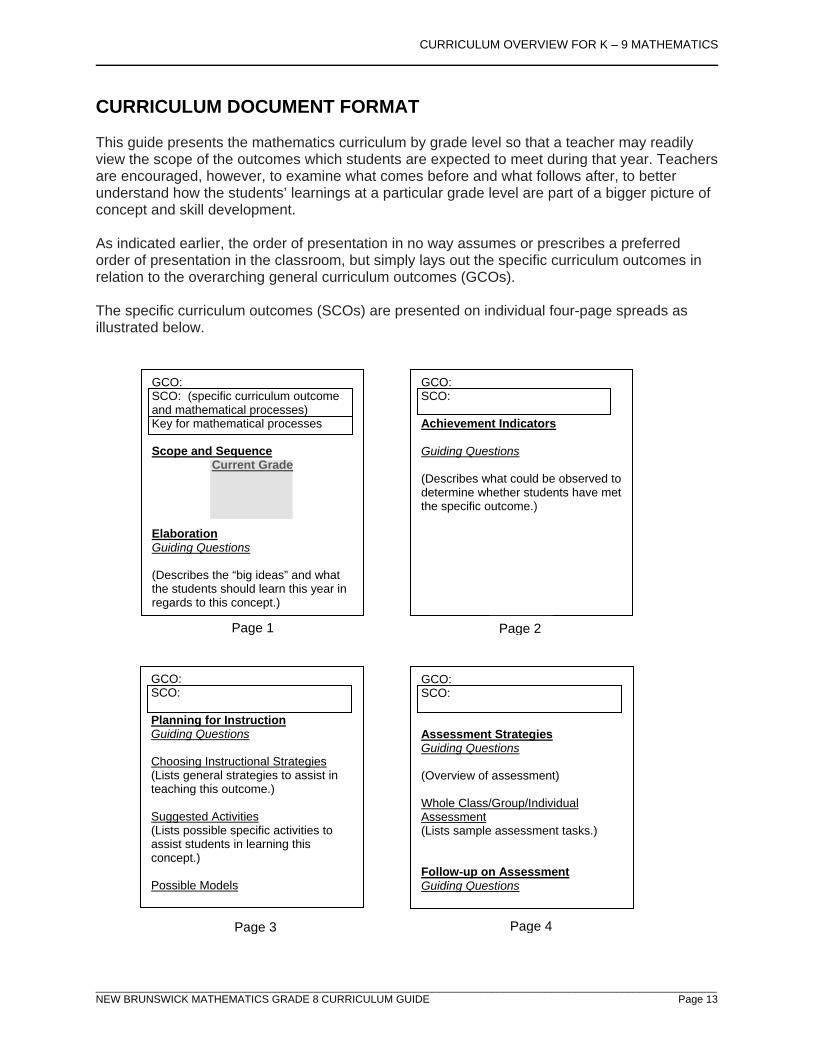
CURRICULUM DOCUMENT FORMAT This guide presents the mathematics curriculum by grade level so that a teacher may readily view the scope of the outcomes which students are expected to meet during that year. Teachers are encouraged, however, to examine what comes before and what follows after, to better understand how the students’ learnings at a particular grade level are part of a bigger picture of concept and skill development. As indicated earlier, the order of presentation in no way assumes or prescribes a preferred order of presentation in the classroom, but simply lays out the specific curriculum outcomes in relation to the overarching general curriculum outcomes (GCOs). The specific curriculum outcomes (SCOs) are presented on individual four-page spreads as illustrated below.
GCO: SCO: Planning for Instruction Guiding Questions Choosing Instructional Strategies (Lists general strategies to assist in teaching this outcome.) Suggested Activities (Lists possible specific activities to assist students in learning this concept.) Possible Models
GCO: SCO: Assessment Strategies Guiding Questions (Overview of assessment) Whole Class/Group/Individual Assessment (Lists sample assessment tasks.) Follow-up on Assessment Guiding Questions
GCO: SCO: (specific curriculum outcome and mathematical processes) Key for mathematical processes Scope and Sequence
Current Grade
Elaboration Guiding Questions (Describes the “big ideas” and what the students should learn this year in regards to this concept.)
GCO: SCO: Achievement Indicators Guiding Questions (Describes what could be observed to determine whether students have met the specific outcome.)
Page 1 Page 2
Page 3 Page 4

GCO: Number (N): Develop number sense GRADE 8 ______________________________________________________________________
_________________________________________________________________________________________________________ Page 14 NEW BRUNSWICK MATHEMATICS GRADE 8 CURRICULUM GUIDE
Scope and Sequence of Outcomes
Grade Seven Grade Eight Grade Nine N1 Determine and explain why a number is divisible by 2, 3, 4, 5, 6, 8, 9 or 10, and why a number cannot be divided by 0.
N1 Demonstrate an understanding of perfect squares and square roots, concretely, pictorially and symbolically (limited to whole numbers).
N5 Determine the square root of positive rational numbers that are perfect squares. N6 Determine an approximate square root of positive rational numbers that are non-perfect squares.
ELABORATION
• What do I want my students to learn? Guiding Questions:
• What do I want my students to understand and be able to do? Students should be able to model perfect squares (the product of multiplying any whole number by itself) and square roots through the use of colour tiles or grid paper. They should make a link between these concrete and pictorial representations of square roots and the numerical representations. In the figure below, students should be encouraged to view the area as the perfect square, and any dimension of the square as the square root. Students should be able to recognize automatically each of the perfect squares from 1 to 144. They should also note that there are many whole numbers that are not perfect squares and that the square numbers get farther apart as the numbers being squared increase. It is also valuable to bring out the patterns that emerge from a list of perfect squares; that is, students should recognize that the differences between the perfect squares increase in a consistent way as shown in the pattern below:
1 4 9 16 25 36 49 3 5 7 9 11 13
In working with patterns they should also be exposed to and predict other perfect squares. Prime factorization is a method used to find the square root of perfect squares. This will build on what students learned in Grade 6 on prime factors and factor trees. For example, 144 . Since 144 = 2 × 72 = 2 × 2 × 36
= 2 × 2 × 6 × 6 [the process could be stopped at this point if students recognize this as 12 × 12: (2 × 6) × (2 × 6)]
= 2 ×2 × 2 × 3 × 2 × 3 = (2 × 2 × 3) × (2 × 2 × 3) [group factors in two equal groups] = 12 × 12, then 144 = 12.
SCO: N1: Demonstrate an understanding of perfect squares and square roots, concretely, pictorially and symbolically (limited to whole numbers). [C, CN, R, V]
[C] Communication [PS] Problem Solving [CN] Connections [ME] Mental Math [T] Technology [V] Visualization [R] Reasoning and Estimation
GCO: Number (N): Develop number sense GRADE 8 ______________________________________________________________________
_________________________________________________________________________________________________________ NEW BRUNSWICK MATHEMATICS GRADE 8 CURRICULUM GUIDE Page 15
ACHIEVEMENT INDICATORS Guiding Questions: • What evidence will I look for to know that learning has occurred? • What should students demonstrate to show their understanding of the mathematical concepts
and skills? Use the following set of indicators as a guide to determine whether students have met the corresponding specific outcome. ° Represent a given perfect square as a square region using materials, such as grid paper or square
shapes. ° Determine the factors of a given perfect square, and explain why one of the factors is the square root
and the others are not. ° Determine whether or not a given number is a perfect square using materials and strategies, such as
square shapes, grid paper or prime factorization, and explain the reasoning. ° Determine the square root of a given perfect square and record it symbolically. ° Determine the square of a given number.
SCO: N1: Demonstrate an understanding of perfect squares and square roots, concretely, pictorially and symbolically (limited to whole numbers). [C, CN, R, V]
GCO: Number (N): Develop number sense GRADE 8 ______________________________________________________________________
_________________________________________________________________________________________________________ Page 16 NEW BRUNSWICK MATHEMATICS GRADE 8 CURRICULUM GUIDE
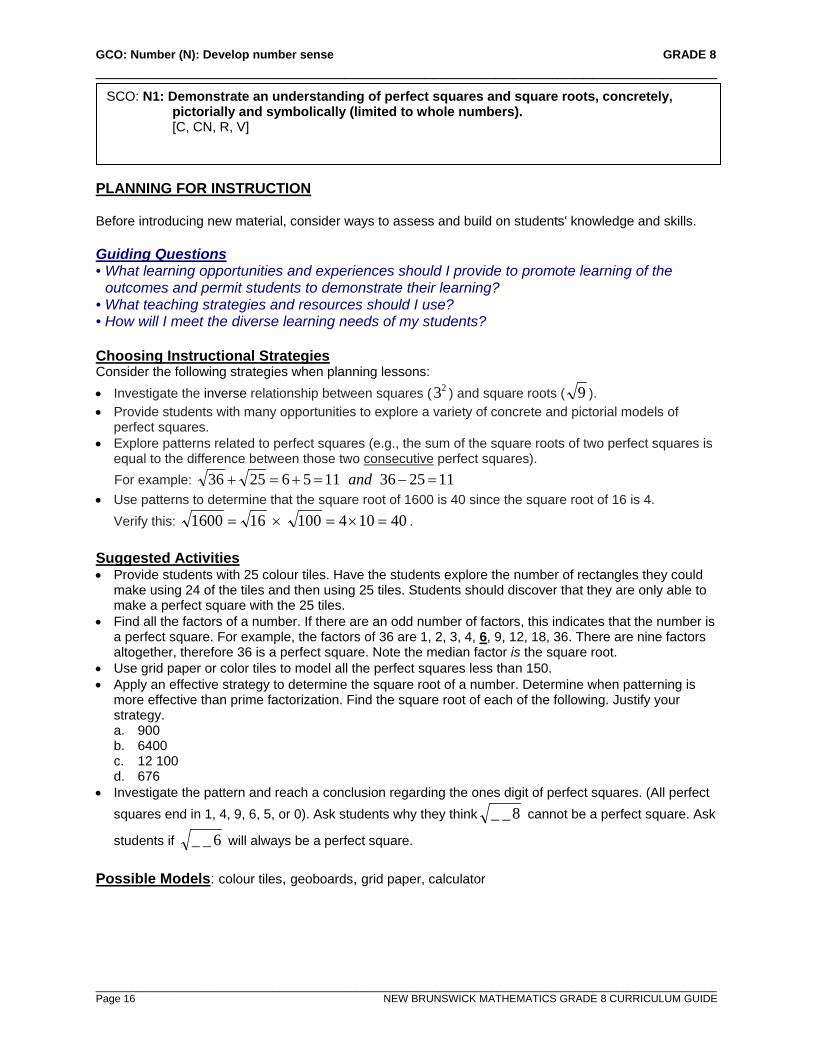
PLANNING FOR INSTRUCTION Before introducing new material, consider ways to assess and build on students' knowledge and skills.
• What learning opportunities and experiences should I provide to promote learning of the outcomes and permit students to demonstrate their learning?
Guiding Questions
• What teaching strategies and resources should I use? • How will I meet the diverse learning needs of my students? Choosing Instructional Strategies Consider the following strategies when planning lessons: • Investigate the inverse relationship between squares ( 23 ) and square roots ( 9 ). • Provide students with many opportunities to explore a variety of concrete and pictorial models of
perfect squares. • Explore patterns related to perfect squares (e.g., the sum of the square roots of two perfect squares is
equal to the difference between those two consecutive perfect squares). For example: 11253611562536 =−=+=+ and • Use patterns to determine that the square root of 1600 is 40 since the square root of 16 is 4.
Verify this: 40104100161600 =×=×= . Suggested Activities • Provide students with 25 colour tiles. Have the students explore the number of rectangles they could
make using 24 of the tiles and then using 25 tiles. Students should discover that they are only able to make a perfect square with the 25 tiles.
• Find all the factors of a number. If there are an odd number of factors, this indicates that the number is a perfect square. For example, the factors of 36 are 1, 2, 3, 4, 6, 9, 12, 18, 36. There are nine factors altogether, therefore 36 is a perfect square. Note the median factor is the square root.
• Use grid paper or color tiles to model all the perfect squares less than 150. • Apply an effective strategy to determine the square root of a number. Determine when patterning is
more effective than prime factorization. Find the square root of each of the following. Justify your strategy. a. 900 b. 6400 c. 12 100 d. 676
• Investigate the pattern and reach a conclusion regarding the ones digit of perfect squares. (All perfect squares end in 1, 4, 9, 6, 5, or 0). Ask students why they think 8__ cannot be a perfect square. Ask
students if 6__ will always be a perfect square. Possible Models: colour tiles, geoboards, grid paper, calculator
SCO: N1: Demonstrate an understanding of perfect squares and square roots, concretely, pictorially and symbolically (limited to whole numbers). [C, CN, R, V]
GCO: Number (N): Develop number sense GRADE 8 ______________________________________________________________________
_________________________________________________________________________________________________________ NEW BRUNSWICK MATHEMATICS GRADE 8 CURRICULUM GUIDE Page 17
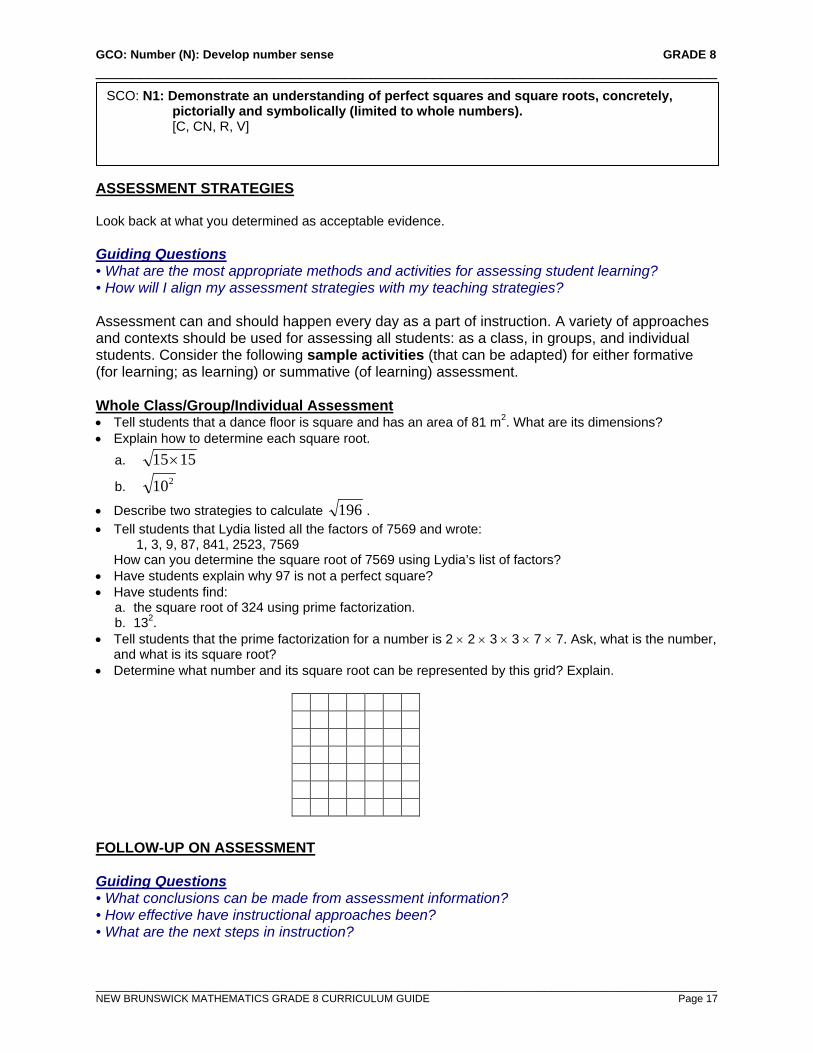
ASSESSMENT STRATEGIES Look back at what you determined as acceptable evidence. Guiding Questions • What are the most appropriate methods and activities for assessing student learning? • How will I align my assessment strategies with my teaching strategies? Assessment can and should happen every day as a part of instruction. A variety of approaches and contexts should be used for assessing all students: as a class, in groups, and individual students. Consider the following sample activities (that can be adapted) for either formative (for learning; as learning) or summative (of learning) assessment. Whole Class/Group/Individual Assessment • Tell students that a dance floor is square and has an area of 81 m2. What are its dimensions? • Explain how to determine each square root.
a. 1515×
b. 210
• Describe two strategies to calculate 196 . • Tell students that Lydia listed all the factors of 7569 and wrote: 1, 3, 9, 87, 841, 2523, 7569
How can you determine the square root of 7569 using Lydia’s list of factors? • Have students explain why 97 is not a perfect square? • Have students find:
a. the square root of 324 using prime factorization. b. 132.
• Tell students that the prime factorization for a number is 2 × 2 × 3 × 3 × 7 × 7. Ask, what is the number, and what is its square root?
• Determine what number and its square root can be represented by this grid? Explain.
FOLLOW-UP ON ASSESSMENT Guiding Questions • What conclusions can be made from assessment information? • How effective have instructional approaches been? • What are the next steps in instruction?
SCO: N1: Demonstrate an understanding of perfect squares and square roots, concretely, pictorially and symbolically (limited to whole numbers). [C, CN, R, V]
GCO: Number (N): Develop number sense GRADE 8 ______________________________________________________________________
_________________________________________________________________________________________________________ Page 18 NEW BRUNSWICK MATHEMATICS GRADE 8 CURRICULUM GUIDE
Scope and Sequence of Outcomes
Grade Seven Grade Eight Grade Nine N2 Determine the approximate
square root of numbers that are not perfect squares (limited to whole numbers).
N5 Determine the square root of positive rational numbers that are perfect squares. N6 Determine an approximate square root of positive rational numbers that are non-perfect squares.
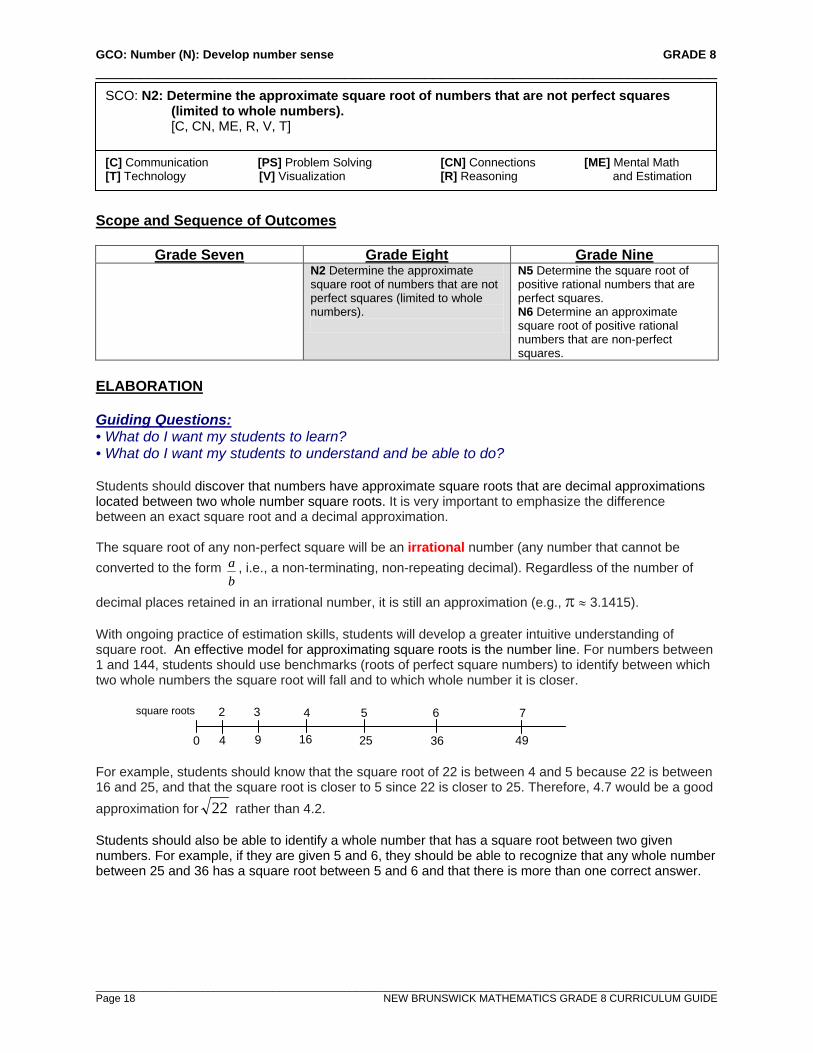
ELABORATION Guiding Questions: • What do I want my students to learn? • What do I want my students to understand and be able to do? Students should discover that numbers have approximate square roots that are decimal approximations located between two whole number square roots. It is very important to emphasize the difference between an exact square root and a decimal approximation. The square root of any non-perfect square will be an irrational number (any number that cannot be converted to the form
ba , i.e., a non-terminating, non-repeating decimal). Regardless of the number of
decimal places retained in an irrational number, it is still an approximation (e.g., π ≈ 3.1415). With ongoing practice of estimation skills, students will develop a greater intuitive understanding of square root. An effective model for approximating square roots is the number line. For numbers between 1 and 144, students should use benchmarks (roots of perfect square numbers) to identify between which two whole numbers the square root will fall and to which whole number it is closer. For example, students should know that the square root of 22 is between 4 and 5 because 22 is between 16 and 25, and that the square root is closer to 5 since 22 is closer to 25. Therefore, 4.7 would be a good approximation for 22 rather than 4.2. Students should also be able to identify a whole number that has a square root between two given numbers. For example, if they are given 5 and 6, they should be able to recognize that any whole number between 25 and 36 has a square root between 5 and 6 and that there is more than one correct answer.
SCO: N2: Determine the approximate square root of numbers that are not perfect squares (limited to whole numbers). [C, CN, ME, R, V, T]
[C] Communication [PS] Problem Solving [CN] Connections [ME] Mental Math [T] Technology [V] Visualization [R] Reasoning and Estimation
square roots
0 4 25 36 49
2
9
3 4
16
5 6 7

GCO: Number (N): Develop number sense GRADE 8 ______________________________________________________________________
_________________________________________________________________________________________________________ NEW BRUNSWICK MATHEMATICS GRADE 8 CURRICULUM GUIDE Page 19
ACHIEVEMENT INDICATORS Guiding Questions: • What evidence will I look for to know that learning has occurred? • What should students demonstrate to show their understanding of the mathematical concepts
and skills? Use the following set of indicators as a guide to determine whether students have met the corresponding specific outcome. ° Estimate the square root of a given number that is not a perfect square using the roots of perfect
squares as benchmarks. ° Explain how technology (e.g., calculator) can be used to estimate the square root of a given number
that is not a perfect square. ° Explain why the square root of a number shown on a calculator may be an approximation. ° Identify a number with a square root that is between two given numbers.
SCO: N2: Determine the approximate square root of numbers that are not perfect squares (limited to whole numbers). [C, CN, ME, R, V, T]
GCO: Number (N): Develop number sense GRADE 8 ______________________________________________________________________
_________________________________________________________________________________________________________ Page 20 NEW BRUNSWICK MATHEMATICS GRADE 8 CURRICULUM GUIDE
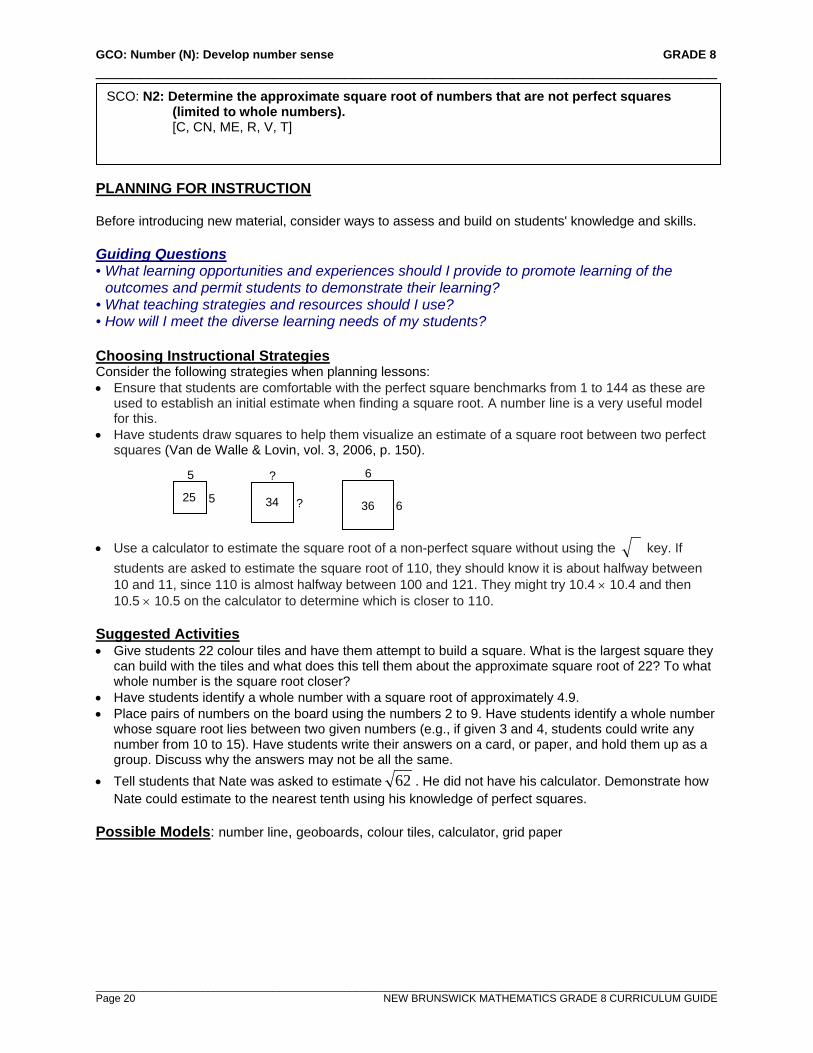
PLANNING FOR INSTRUCTION Before introducing new material, consider ways to assess and build on students' knowledge and skills. Guiding Questions • What learning opportunities and experiences should I provide to promote learning of the
outcomes and permit students to demonstrate their learning? • What teaching strategies and resources should I use? • How will I meet the diverse learning needs of my students? Choosing Instructional Strategies Consider the following strategies when planning lessons: • Ensure that students are comfortable with the perfect square benchmarks from 1 to 144 as these are
used to establish an initial estimate when finding a square root. A number line is a very useful model for this.
• Have students draw squares to help them visualize an estimate of a square root between two perfect squares (Van de Walle & Lovin, vol. 3, 2006, p. 150).
• Use a calculator to estimate the square root of a non-perfect square without using the key. If
students are asked to estimate the square root of 110, they should know it is about halfway between 10 and 11, since 110 is almost halfway between 100 and 121. They might try 10.4 × 10.4 and then 10.5 × 10.5 on the calculator to determine which is closer to 110.
Suggested Activities • Give students 22 colour tiles and have them attempt to build a square. What is the largest square they
can build with the tiles and what does this tell them about the approximate square root of 22? To what whole number is the square root closer?
• Have students identify a whole number with a square root of approximately 4.9. • Place pairs of numbers on the board using the numbers 2 to 9. Have students identify a whole number
whose square root lies between two given numbers (e.g., if given 3 and 4, students could write any number from 10 to 15). Have students write their answers on a card, or paper, and hold them up as a group. Discuss why the answers may not be all the same.
• Tell students that Nate was asked to estimate 62 . He did not have his calculator. Demonstrate how Nate could estimate to the nearest tenth using his knowledge of perfect squares.
Possible Models: number line, geoboards, colour tiles, calculator, grid paper
SCO: N2: Determine the approximate square root of numbers that are not perfect squares (limited to whole numbers). [C, CN, ME, R, V, T]
5
5 25
?
?
6
6 34 36
GCO: Number (N): Develop number sense GRADE 8 ______________________________________________________________________
_________________________________________________________________________________________________________ NEW BRUNSWICK MATHEMATICS GRADE 8 CURRICULUM GUIDE Page 21
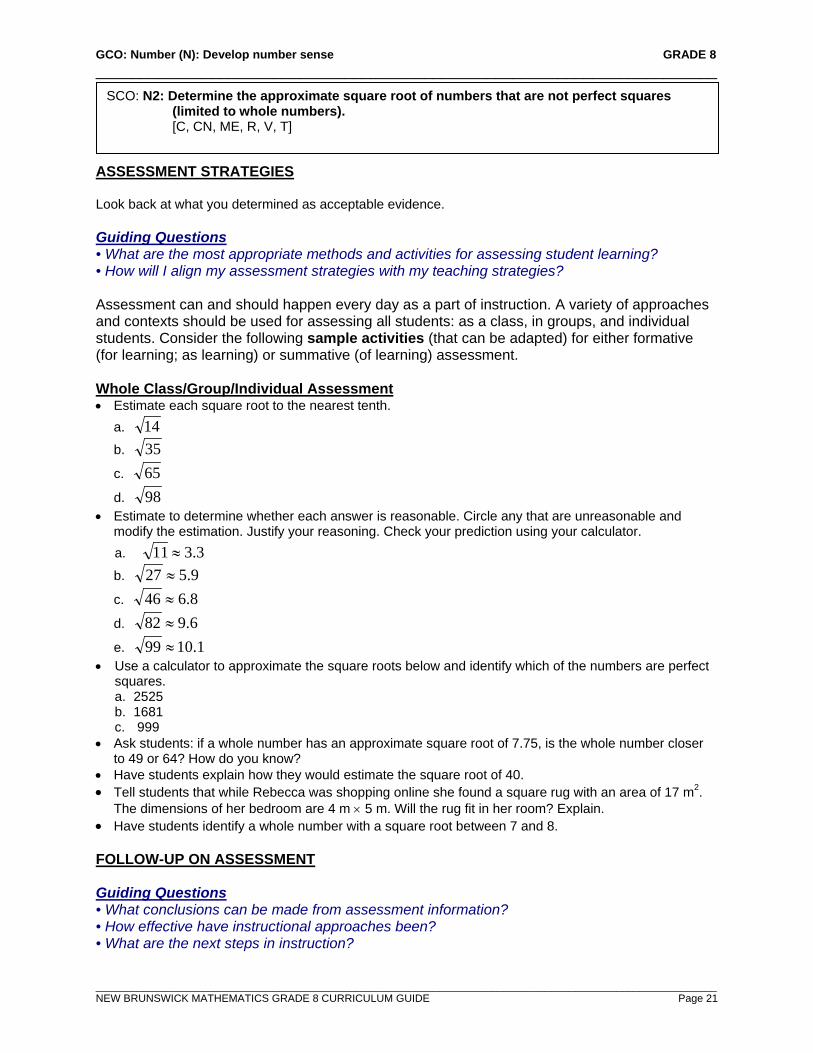
ASSESSMENT STRATEGIES Look back at what you determined as acceptable evidence. Guiding Questions • What are the most appropriate methods and activities for assessing student learning? • How will I align my assessment strategies with my teaching strategies? Assessment can and should happen every day as a part of instruction. A variety of approaches and contexts should be used for assessing all students: as a class, in groups, and individual students. Consider the following sample activities (that can be adapted) for either formative (for learning; as learning) or summative (of learning) assessment. Whole Class/Group/Individual Assessment • Estimate each square root to the nearest tenth.
a. 14
b. 35
c. 65
d. 98 • Estimate to determine whether each answer is reasonable. Circle any that are unreasonable and
modify the estimation. Justify your reasoning. Check your prediction using your calculator. a. 3.311 ≈
b. 9.527 ≈
c. 8.646 ≈
d. 6.982 ≈
e. 1.1099 ≈ • Use a calculator to approximate the square roots below and identify which of the numbers are perfect
squares. a. 2525 b. 1681 c. 999
• Ask students: if a whole number has an approximate square root of 7.75, is the whole number closer to 49 or 64? How do you know?
• Have students explain how they would estimate the square root of 40. • Tell students that while Rebecca was shopping online she found a square rug with an area of 17 m2.
The dimensions of her bedroom are 4 m × 5 m. Will the rug fit in her room? Explain. • Have students identify a whole number with a square root between 7 and 8. FOLLOW-UP ON ASSESSMENT Guiding Questions • What conclusions can be made from assessment information? • How effective have instructional approaches been? • What are the next steps in instruction?
SCO: N2: Determine the approximate square root of numbers that are not perfect squares (limited to whole numbers). [C, CN, ME, R, V, T]
GCO: Number (N): Develop number sense GRADE 8 ______________________________________________________________________
_________________________________________________________________________________________________________ Page 22 NEW BRUNSWICK MATHEMATICS GRADE 8 CURRICULUM GUIDE
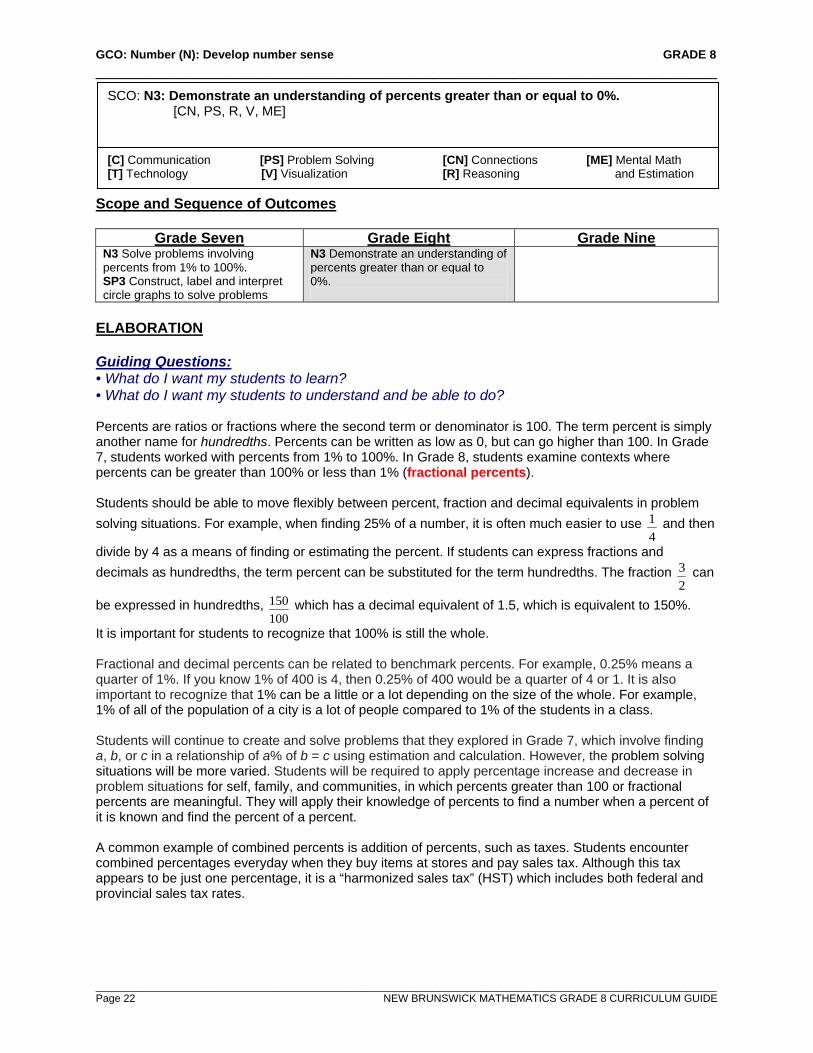
Scope and Sequence of Outcomes
Grade Seven Grade Eight Grade Nine N3 Solve problems involving percents from 1% to 100%. SP3 Construct, label and interpret circle graphs to solve problems
N3 Demonstrate an understanding of percents greater than or equal to 0%.
ELABORATION Guiding Questions: • What do I want my students to learn? • What do I want my students to understand and be able to do? Percents are ratios or fractions where the second term or denominator is 100. The term percent is simply another name for hundredths. Percents can be written as low as 0, but can go higher than 100. In Grade 7, students worked with percents from 1% to 100%. In Grade 8, students examine contexts where percents can be greater than 100% or less than 1% (fractional percents). Students should be able to move flexibly between percent, fraction and decimal equivalents in problem solving situations. For example, when finding 25% of a number, it is often much easier to use
41 and then
divide by 4 as a means of finding or estimating the percent. If students can express fractions and decimals as hundredths, the term percent can be substituted for the term hundredths. The fraction
23 can
be expressed in hundredths, 100150 which has a decimal equivalent of 1.5, which is equivalent to 150%.
It is important for students to recognize that 100% is still the whole. Fractional and decimal percents can be related to benchmark percents. For example, 0.25% means a quarter of 1%. If you know 1% of 400 is 4, then 0.25% of 400 would be a quarter of 4 or 1. It is also important to recognize that 1% can be a little or a lot depending on the size of the whole. For example, 1% of all of the population of a city is a lot of people compared to 1% of the students in a class. Students will continue to create and solve problems that they explored in Grade 7, which involve finding a, b, or c in a relationship of a% of b = c using estimation and calculation. However, the problem solving situations will be more varied. Students will be required to apply percentage increase and decrease in problem situations for self, family, and communities, in which percents greater than 100 or fractional percents are meaningful. They will apply their knowledge of percents to find a number when a percent of it is known and find the percent of a percent. A common example of combined percents is addition of percents, such as taxes. Students encounter combined percentages everyday when they buy items at stores and pay sales tax. Although this tax appears to be just one percentage, it is a “harmonized sales tax” (HST) which includes both federal and provincial sales tax rates.
SCO: N3: Demonstrate an understanding of percents greater than or equal to 0%. [CN, PS, R, V, ME]
[C] Communication [PS] Problem Solving [CN] Connections [ME] Mental Math [T] Technology [V] Visualization [R] Reasoning and Estimation

GCO: Number (N): Develop number sense GRADE 8 ______________________________________________________________________
_________________________________________________________________________________________________________ NEW BRUNSWICK MATHEMATICS GRADE 8 CURRICULUM GUIDE Page 23
ACHIEVEMENT INDICATORS Guiding Questions: • What evidence will I look for to know that learning has occurred? • What should students demonstrate to show their understanding of the mathematical concepts
and skills? Use the following set of indicators as a guide to determine whether students have met the corresponding specific outcome. ° Provide a context where a percent may be more than 100% or between 0% and 1%. ° Represent a given fractional percent using grid paper. ° Represent a given percent greater than 100 using grid paper. ° Determine the percent represented by a given shaded region on a grid, and record it in decimal,
fractional and percent form. ° Express a given percent in decimal or fractional form. ° Express a given decimal in percent or fractional form. ° Express a given fraction in decimal or percent form. ° Solve a given problem involving percents. ° Solve a given problem involving combined percents. ° Solve a given problem that involves finding the percent of a percent, e.g., a population increased by
10% one year and then increased by 15% the next year. Explain why there was not a 25% increase in population over the two years.
SCO: N3: Demonstrate an understanding of percents greater than or equal to 0%. [CN, PS, R, V, ME]
GCO: Number (N): Develop number sense GRADE 8 ______________________________________________________________________
_________________________________________________________________________________________________________ Page 24 NEW BRUNSWICK MATHEMATICS GRADE 8 CURRICULUM GUIDE
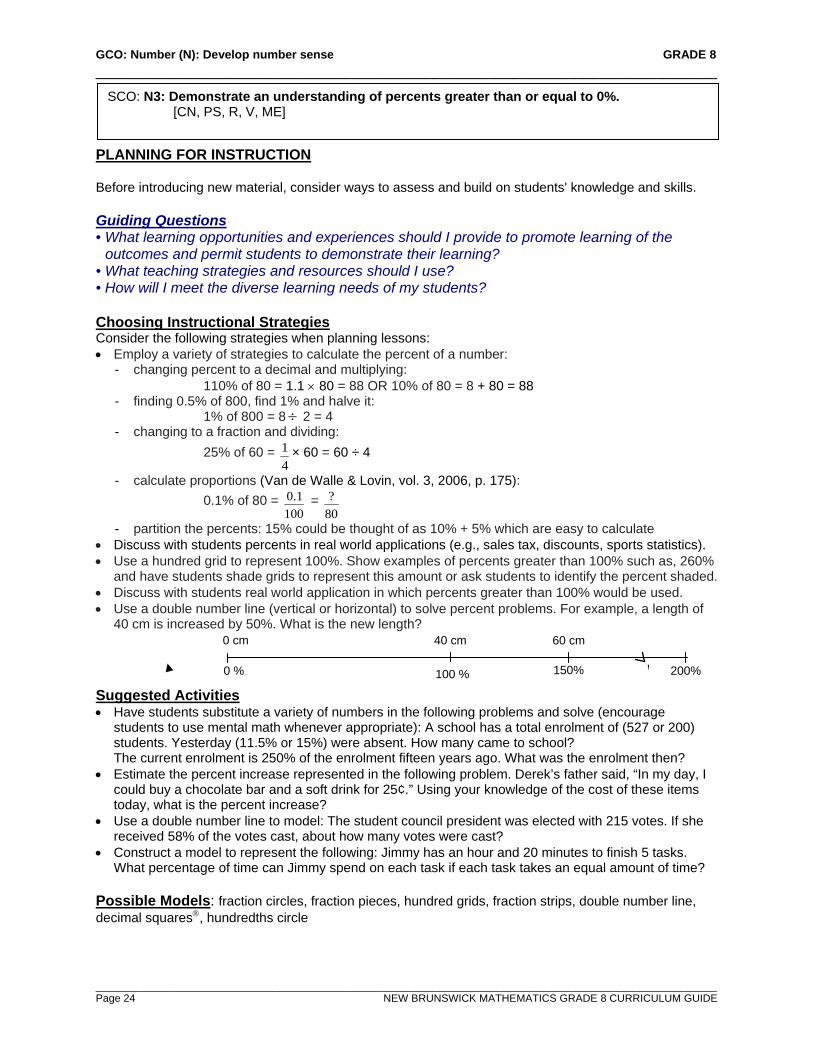
PLANNING FOR INSTRUCTION Before introducing new material, consider ways to assess and build on students' knowledge and skills. Guiding Questions • What learning opportunities and experiences should I provide to promote learning of the
outcomes and permit students to demonstrate their learning? • What teaching strategies and resources should I use? • How will I meet the diverse learning needs of my students? Choosing Instructional Strategies Consider the following strategies when planning lessons: • Employ a variety of strategies to calculate the percent of a number:
- changing percent to a decimal and multiplying: 110% of 80 = 1.1 × 80 = 88 OR 10% of 80 = 8 + 80 = 88
- finding 0.5% of 800, find 1% and halve it: 1% of 800 = 8 ÷ 2 = 4
- changing to a fraction and dividing: 25% of 60 =
41 × 60 = 60 ÷ 4
- calculate proportions (Van de Walle & Lovin, vol. 3, 2006, p. 175): 0.1% of 80 =
1001.0 =
80?
- partition the percents: 15% could be thought of as 10% + 5% which are easy to calculate • Discuss with students percents in real world applications (e.g., sales tax, discounts, sports statistics). • Use a hundred grid to represent 100%. Show examples of percents greater than 100% such as, 260%
and have students shade grids to represent this amount or ask students to identify the percent shaded. • Discuss with students real world application in which percents greater than 100% would be used. • Use a double number line (vertical or horizontal) to solve percent problems. For example, a length of
40 cm is increased by 50%. What is the new length?
Suggested Activities • Have students substitute a variety of numbers in the following problems and solve (encourage
students to use mental math whenever appropriate): A school has a total enrolment of (527 or 200) students. Yesterday (11.5% or 15%) were absent. How many came to school? The current enrolment is 250% of the enrolment fifteen years ago. What was the enrolment then?
• Estimate the percent increase represented in the following problem. Derek’s father said, “In my day, I could buy a chocolate bar and a soft drink for 25¢.” Using your knowledge of the cost of these items today, what is the percent increase?
• Use a double number line to model: The student council president was elected with 215 votes. If she received 58% of the votes cast, about how many votes were cast?
• Construct a model to represent the following: Jimmy has an hour and 20 minutes to finish 5 tasks. What percentage of time can Jimmy spend on each task if each task takes an equal amount of time?
Possible Models: fraction circles, fraction pieces, hundred grids, fraction strips, double number line, decimal squares, hundredths circle
SCO: N3: Demonstrate an understanding of percents greater than or equal to 0%. [CN, PS, R, V, ME]
0 cm
0 % 100 %
40 cm
200% 150%
60 cm
GCO: Number (N): Develop number sense GRADE 8 ______________________________________________________________________
_________________________________________________________________________________________________________ NEW BRUNSWICK MATHEMATICS GRADE 8 CURRICULUM GUIDE Page 25
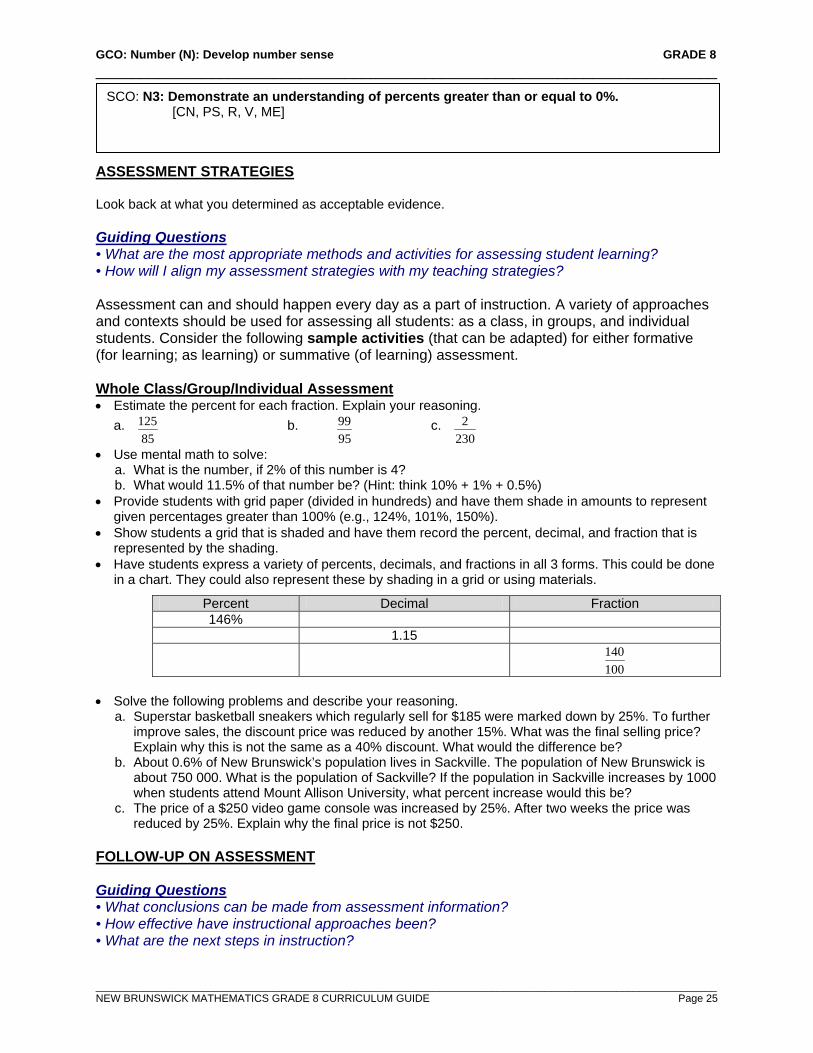
ASSESSMENT STRATEGIES Look back at what you determined as acceptable evidence. Guiding Questions • What are the most appropriate methods and activities for assessing student learning? • How will I align my assessment strategies with my teaching strategies? Assessment can and should happen every day as a part of instruction. A variety of approaches and contexts should be used for assessing all students: as a class, in groups, and individual students. Consider the following sample activities (that can be adapted) for either formative (for learning; as learning) or summative (of learning) assessment. Whole Class/Group/Individual Assessment • Estimate the percent for each fraction. Explain your reasoning.
a. 85
125 b. 9599 c.
2302
• Use mental math to solve: a. What is the number, if 2% of this number is 4? b. What would 11.5% of that number be? (Hint: think 10% + 1% + 0.5%)
• Provide students with grid paper (divided in hundreds) and have them shade in amounts to represent given percentages greater than 100% (e.g., 124%, 101%, 150%).
• Show students a grid that is shaded and have them record the percent, decimal, and fraction that is represented by the shading.
• Have students express a variety of percents, decimals, and fractions in all 3 forms. This could be done in a chart. They could also represent these by shading in a grid or using materials.
Percent Decimal Fraction 146%
1.15
100140
• Solve the following problems and describe your reasoning.
a. Superstar basketball sneakers which regularly sell for $185 were marked down by 25%. To further improve sales, the discount price was reduced by another 15%. What was the final selling price? Explain why this is not the same as a 40% discount. What would the difference be?
b. About 0.6% of New Brunswick’s population lives in Sackville. The population of New Brunswick is about 750 000. What is the population of Sackville? If the population in Sackville increases by 1000 when students attend Mount Allison University, what percent increase would this be?
c. The price of a $250 video game console was increased by 25%. After two weeks the price was reduced by 25%. Explain why the final price is not $250.
FOLLOW-UP ON ASSESSMENT Guiding Questions • What conclusions can be made from assessment information? • How effective have instructional approaches been? • What are the next steps in instruction?
SCO: N3: Demonstrate an understanding of percents greater than or equal to 0%. [CN, PS, R, V, ME]
GCO: Number (N): Develop number sense GRADE 8 ______________________________________________________________________
_________________________________________________________________________________________________________ Page 26 NEW BRUNSWICK MATHEMATICS GRADE 8 CURRICULUM GUIDE
Scope and Sequence of Outcomes
Grade Seven Grade Eight Grade Nine N3 Solve problems involving percents from 1% to 100%. SP4 Express probabilities as ratios, fractions and percents.
N4 Demonstrate an understanding of ratio and rate. N5 Solve problems that involve rates, ratios and proportional reasoning.
N3 Demonstrate an understanding of rational numbers by: comparing and ordering rational numbers; solving problems that involve arithmetic operations on rational numbers.
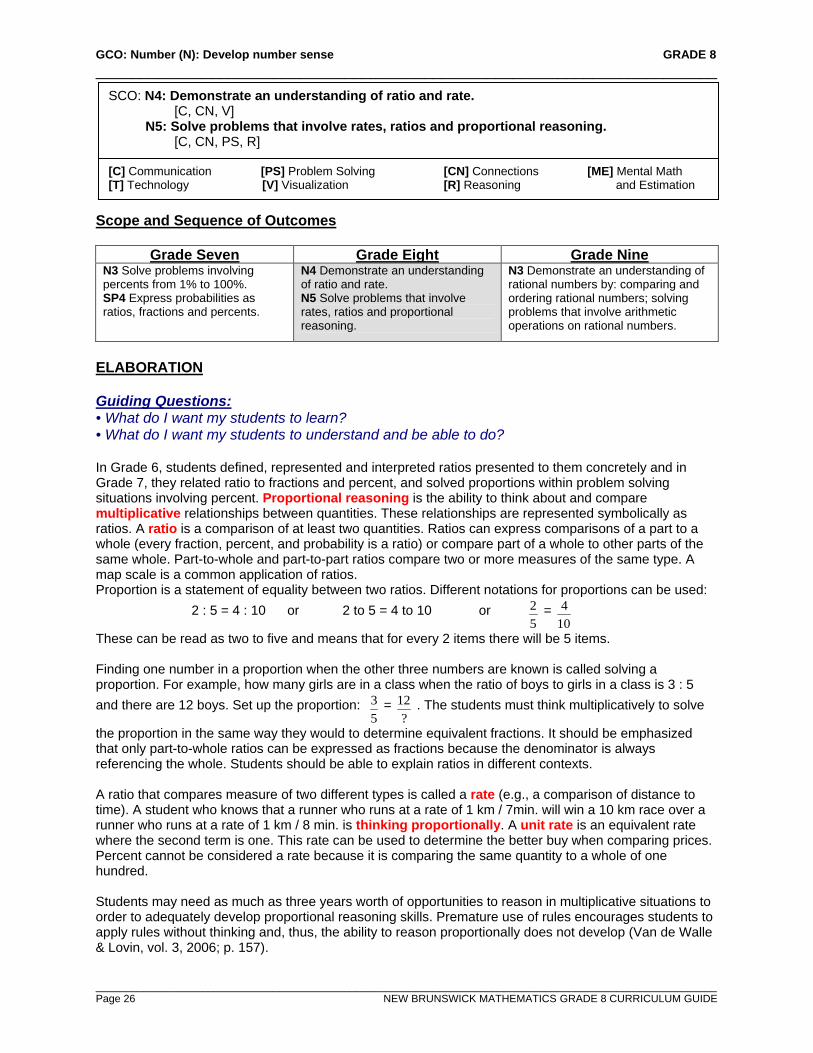
ELABORATION Guiding Questions: • What do I want my students to learn? • What do I want my students to understand and be able to do? In Grade 6, students defined, represented and interpreted ratios presented to them concretely and in Grade 7, they related ratio to fractions and percent, and solved proportions within problem solving situations involving percent. Proportional reasoning is the ability to think about and compare multiplicative relationships between quantities. These relationships are represented symbolically as ratios. A ratio is a comparison of at least two quantities. Ratios can express comparisons of a part to a whole (every fraction, percent, and probability is a ratio) or compare part of a whole to other parts of the same whole. Part-to-whole and part-to-part ratios compare two or more measures of the same type. A map scale is a common application of ratios. Proportion is a statement of equality between two ratios. Different notations for proportions can be used: 2 : 5 = 4 : 10 or 2 to 5 = 4 to 10 or
52 =
104
These can be read as two to five and means that for every 2 items there will be 5 items. Finding one number in a proportion when the other three numbers are known is called solving a proportion. For example, how many girls are in a class when the ratio of boys to girls in a class is 3 : 5 and there are 12 boys. Set up the proportion:
53 =
?12 . The students must think multiplicatively to solve
the proportion in the same way they would to determine equivalent fractions. It should be emphasized that only part-to-whole ratios can be expressed as fractions because the denominator is always referencing the whole. Students should be able to explain ratios in different contexts. A ratio that compares measure of two different types is called a rate (e.g., a comparison of distance to time). A student who knows that a runner who runs at a rate of 1 km / 7min. will win a 10 km race over a runner who runs at a rate of 1 km / 8 min. is thinking proportionally. A unit rate is an equivalent rate where the second term is one. This rate can be used to determine the better buy when comparing prices. Percent cannot be considered a rate because it is comparing the same quantity to a whole of one hundred. Students may need as much as three years worth of opportunities to reason in multiplicative situations to order to adequately develop proportional reasoning skills. Premature use of rules encourages students to apply rules without thinking and, thus, the ability to reason proportionally does not develop (Van de Walle & Lovin, vol. 3, 2006; p. 157).
SCO: N4: Demonstrate an understanding of ratio and rate. [C, CN, V]
N5: Solve problems that involve rates, ratios and proportional reasoning. [C, CN, PS, R]
[C] Communication [PS] Problem Solving [CN] Connections [ME] Mental Math [T] Technology [V] Visualization [R] Reasoning and Estimation
GCO: Number (N): Develop number sense GRADE 8 ______________________________________________________________________
_________________________________________________________________________________________________________ NEW BRUNSWICK MATHEMATICS GRADE 8 DRAFT CURRICULUM GUIDE Page 27
ACHIEVEMENT INDICATORS Guiding Questions: • What evidence will I look for to know that learning has occurred? • What should students demonstrate to show their understanding of the mathematical concepts
and skills? Use the following set of indicators as a guide to determine whether students have met the corresponding specific outcome. N4 ° Express a two-term ratio from a given context in the forms 3:5 or 3 to 5. ° Express a three-term ratio from a given context in the forms 4:7:3 or 4 to 7 to 3. ° Express a part to part ratio as a part to whole fraction, e.g., frozen juice to water; 1 can concentrate to
4 cans of water can be represented as 51 , which is the ratio of concentrate to solution, or
54 , which is
the ratio of water to solution. ° Identify and describe ratios and rates from real-life examples, and record them symbolically. ° Express a given rate using words or symbols, e.g., 20 L per 100 km or 20 L/100 km. ° Express a given ratio as a percent and explain why a rate cannot be represented as a percent. N5 ° Explain the meaning of
ba within a given context.
° Provide a context in which ba represents a:
• fraction • rate • ratio • quotient • probability.
° Solve a given problem involving rate, ratio or percent.
SCO: N4: Demonstrate an understanding of ratio and rate. [C, CN, V]
N5: Solve problems that involve rates, ratios and proportional reasoning. [C, CN, PS, R]
GCO: Number (N): Develop number sense GRADE 8 ______________________________________________________________________
_________________________________________________________________________________________________________ Page 28 NEW BRUNSWICK MATHEMATICS GRADE 8 CURRICULUM GUIDE
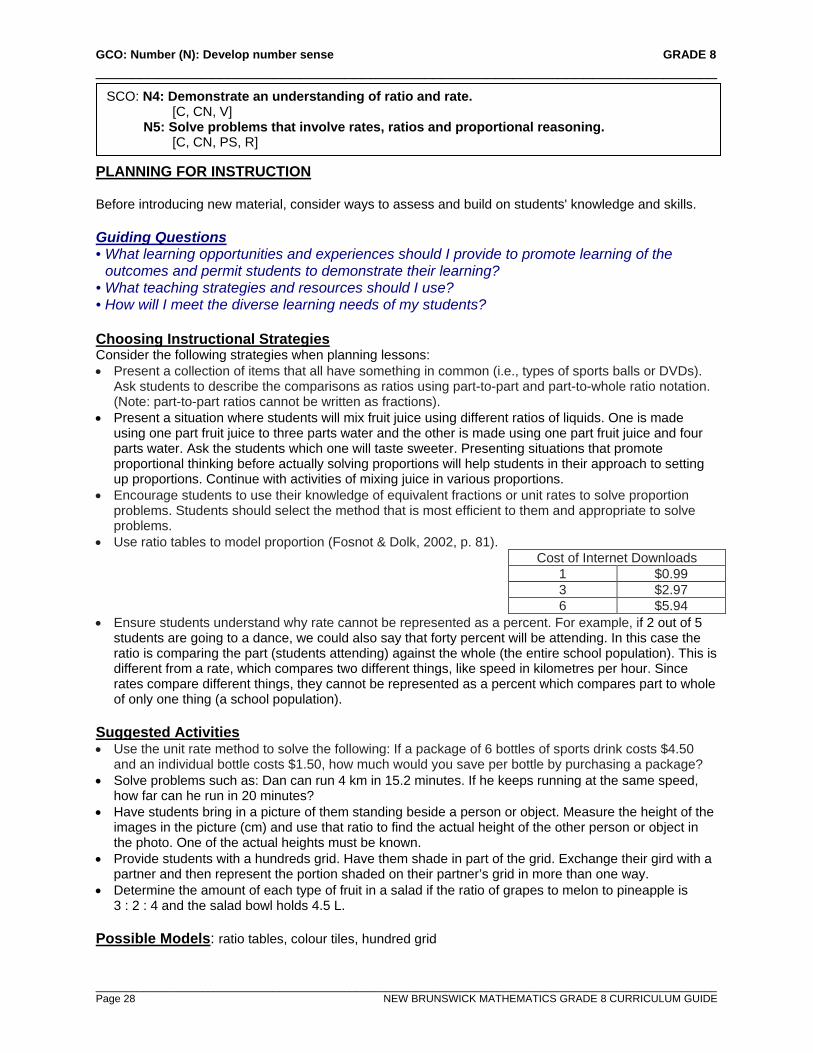
PLANNING FOR INSTRUCTION Before introducing new material, consider ways to assess and build on students' knowledge and skills. Guiding Questions • What learning opportunities and experiences should I provide to promote learning of the
outcomes and permit students to demonstrate their learning? • What teaching strategies and resources should I use? • How will I meet the diverse learning needs of my students? Choosing Instructional Strategies Consider the following strategies when planning lessons: • Present a collection of items that all have something in common (i.e., types of sports balls or DVDs).
Ask students to describe the comparisons as ratios using part-to-part and part-to-whole ratio notation. (Note: part-to-part ratios cannot be written as fractions).
• Present a situation where students will mix fruit juice using different ratios of liquids. One is made using one part fruit juice to three parts water and the other is made using one part fruit juice and four parts water. Ask the students which one will taste sweeter. Presenting situations that promote proportional thinking before actually solving proportions will help students in their approach to setting up proportions. Continue with activities of mixing juice in various proportions.
• Encourage students to use their knowledge of equivalent fractions or unit rates to solve proportion problems. Students should select the method that is most efficient to them and appropriate to solve problems.
• Use ratio tables to model proportion (Fosnot & Dolk, 2002, p. 81). Cost of Internet Downloads
1 $0.99 3 $2.97 6 $5.94
• Ensure students understand why rate cannot be represented as a percent. For example, if 2 out of 5 students are going to a dance, we could also say that forty percent will be attending. In this case the ratio is comparing the part (students attending) against the whole (the entire school population). This is different from a rate, which compares two different things, like speed in kilometres per hour. Since rates compare different things, they cannot be represented as a percent which compares part to whole of only one thing (a school population).
Suggested Activities • Use the unit rate method to solve the following: If a package of 6 bottles of sports drink costs $4.50
and an individual bottle costs $1.50, how much would you save per bottle by purchasing a package? • Solve problems such as: Dan can run 4 km in 15.2 minutes. If he keeps running at the same speed,
how far can he run in 20 minutes? • Have students bring in a picture of them standing beside a person or object. Measure the height of the
images in the picture (cm) and use that ratio to find the actual height of the other person or object in the photo. One of the actual heights must be known.
• Provide students with a hundreds grid. Have them shade in part of the grid. Exchange their gird with a partner and then represent the portion shaded on their partner’s grid in more than one way.
• Determine the amount of each type of fruit in a salad if the ratio of grapes to melon to pineapple is 3 : 2 : 4 and the salad bowl holds 4.5 L.
Possible Models: ratio tables, colour tiles, hundred grid
SCO: N4: Demonstrate an understanding of ratio and rate. [C, CN, V]
N5: Solve problems that involve rates, ratios and proportional reasoning. [C, CN, PS, R]

GCO: Number (N): Develop number sense GRADE 8 ______________________________________________________________________
_________________________________________________________________________________________________________ NEW BRUNSWICK MATHEMATICS GRADE 8 CURRICULUM GUIDE Page 29
ASSESSMENT STRATEGIES Look back at what you determined as acceptable evidence. Guiding Questions • What are the most appropriate methods and activities for assessing student learning? • How will I align my assessment strategies with my teaching strategies? Assessment can and should happen every day as a part of instruction. A variety of approaches and contexts should be used for assessing all students: as a class, in groups, and individual students. Consider the following sample activities (that can be adapted) for either formative (for learning; as learning) or summative (of learning) assessment. Whole Class/Group/Individual Assessment • Write a part: part: whole ratio for each situation below.
- A bag contains 3 jujubes and 5 lollipops. - In the parking lot there are two types of vehicles: cars and trucks. There are 30 vehicles in total and
seven of them are trucks. • Find the actual distance between two cities if the distance measured on the map is 6 cm, and 4 cm on
the map represents a distance of 2400 km. What would that distance be on a map if the scale was 1 : 1 000 000?
• Determine who would get the bigger portion of pizza if nine girls share 4 pepperoni pizzas while seven boys share 3 vegetarian pizzas. Explain your reasoning. What assumptions are you making?
• Ask the student to select three different colours of tiles, and model the following ratios. 4 to 3 2 : 1
31 2 : 3 : 5
• Determine the number of students in the class if the ratio of boys to girls in a Grade 8 classroom is 6 : 4 and there are 12 girls in the class.
• Solve problems such as the following. - During a heavy rain storm, 40 mm of rain fell in 30 minutes. How much rain would you expect to fall
in one hour? In three hours? What assumptions are you making? - A recipe uses 500 mL of flour for every 125 mL of sugar. How much flour would be needed when
500 mL of sugar is used? • Have students write a response to the following situation. If a tap is dripping at a rate of 50 mL an
hour, can you describe that as a percentage? Explain why or why not. • Ask students to provide a real world context in which
ba would represent a:
a. fraction b. rate c. ratio d. quotient e. probability (SCO SP2) FOLLOW-UP ON ASSESSMENT Guiding Questions • What conclusions can be made from assessment information? • How effective have instructional approaches been? • What are the next steps in instruction?
SCO: N4: Demonstrate an understanding of ratio and rate. [C, CN, V]
N5: Solve problems that involve rates, ratios and proportional reasoning. [C, CN, PS, R]
GCO: Number (N): Develop number sense GRADE 8 ______________________________________________________________________
_________________________________________________________________________________________________________ Page 30 NEW BRUNSWICK MATHEMATICS GRADE 8 CURRICULUM GUIDE
Scope and Sequence of Outcomes
Grade Seven Grade Eight Grade Nine N5 Demonstrate an understanding of adding and subtracting positive fractions and mixed numbers, with like and unlike denominators, concretely, pictorially and symbolically (limited to positive sums and differences).
N6 Demonstrate an understanding of multiplying and dividing positive fractions and mixed numbers, concretely, pictorially and symbolically.
N3 Demonstrate an understanding of rational numbers by: comparing and ordering rational numbers; solving problems that involve arithmetic operations on rational numbers.
ELABORATION Guiding Questions: • What do I want my students to learn? • What do I want my students to understand and be able to do? In Grade 7 students learned to add and subtract positive fractions and mixed numbers. Even though multiplying and dividing fractions are presented separately in this document, these operations should be learned in relation to each other. The following guidelines should be kept in mind when developing computational strategies for fractions. It is important to not rush to computational rules. - Begin with simple contextual tasks (include sets, area models, distance). - Connect the meaning of fraction computation with whole number computation. - Let estimation and informal methods play a big role in the development of strategies. - Explore each of the operations using models (Van de Walle & Lovin, vol. 3, 2006, p. 88). It is important for students to understand that the meaning for multiplication (e.g., 3 × 5 means 3 groups of 5) is the same for fractions. When multiplying a fraction by a whole number, it can be thought of as groups of the fraction or fractions of a group (e.g., 3 ×
31 means 3 groups of
31 OR
31 × 3 means one third
of a group of three). When multiplying a proper fraction by another number, students struggle with the product being less than each of the factors. Students need to keep in mind they are multiplying by a number that is less than one. Language is very important. Exploring operations with fractions through the use of models such as number lines, the area model, counters, fraction circles and strips helps solidify understanding of such concepts. The area model should be used as a key model for exploring fraction computation. Investigating concrete and pictorial representations of the problem will lead to an understanding of multiplying fractions symbolically. Estimation should be an integral part of computation development to keep students’ attention on the meanings of the operations and the expected size of the results (Van de Walle & Lovin, vol. 3, 2006, p. 66). Relating multiplication of fractions to real-life situations helps solidify student understanding.
SCO: N6: Demonstrate an understanding of multiplying and dividing positive fractions and mixed numbers, concretely, pictorially and symbolically. [C, CN, ME, PS]
[C] Communication [PS] Problem Solving [CN] Connections [ME] Mental Math [T] Technology [V] Visualization [R] Reasoning and Estimation
32
52
52× =
154
32
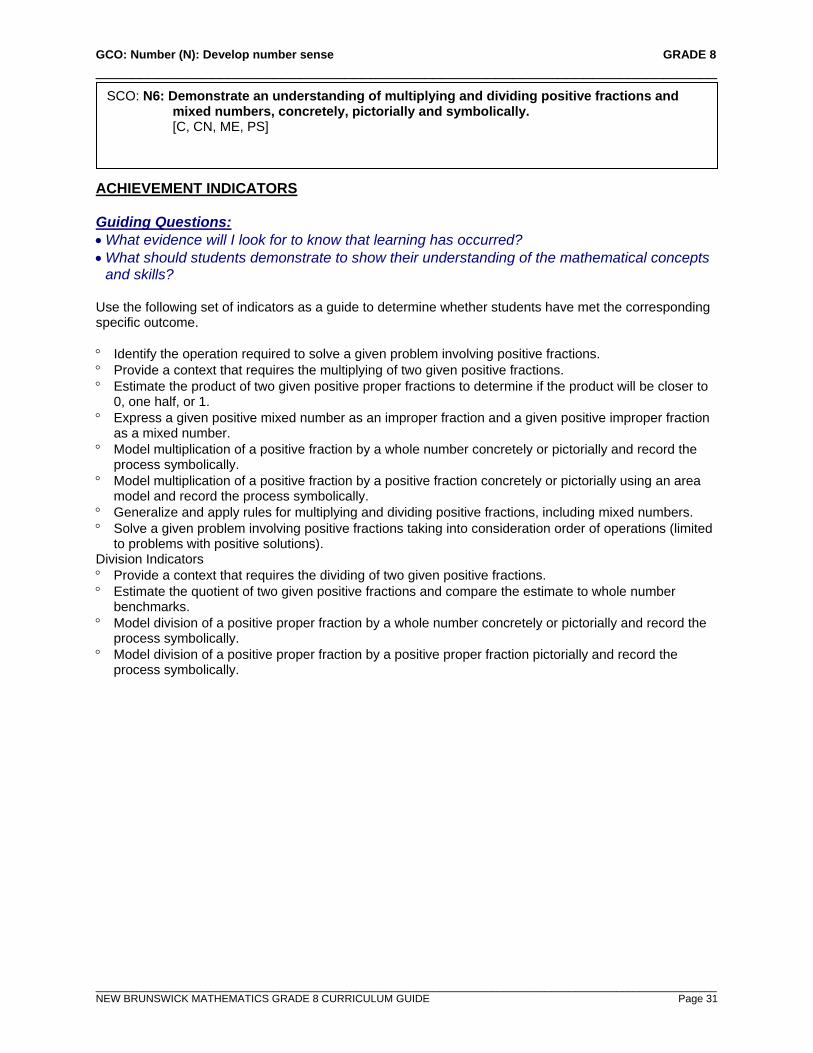
GCO: Number (N): Develop number sense GRADE 8 ______________________________________________________________________
_________________________________________________________________________________________________________ NEW BRUNSWICK MATHEMATICS GRADE 8 CURRICULUM GUIDE Page 31
ACHIEVEMENT INDICATORS Guiding Questions: • What evidence will I look for to know that learning has occurred? • What should students demonstrate to show their understanding of the mathematical concepts
and skills? Use the following set of indicators as a guide to determine whether students have met the corresponding specific outcome. ° Identify the operation required to solve a given problem involving positive fractions. ° Provide a context that requires the multiplying of two given positive fractions. ° Estimate the product of two given positive proper fractions to determine if the product will be closer to
0, one half, or 1. ° Express a given positive mixed number as an improper fraction and a given positive improper fraction
as a mixed number. ° Model multiplication of a positive fraction by a whole number concretely or pictorially and record the
process symbolically. ° Model multiplication of a positive fraction by a positive fraction concretely or pictorially using an area
model and record the process symbolically. ° Generalize and apply rules for multiplying and dividing positive fractions, including mixed numbers. ° Solve a given problem involving positive fractions taking into consideration order of operations (limited
to problems with positive solutions). Division Indicators ° Provide a context that requires the dividing of two given positive fractions. ° Estimate the quotient of two given positive fractions and compare the estimate to whole number
benchmarks. ° Model division of a positive proper fraction by a whole number concretely or pictorially and record the
process symbolically. ° Model division of a positive proper fraction by a positive proper fraction pictorially and record the
process symbolically.
SCO: N6: Demonstrate an understanding of multiplying and dividing positive fractions and mixed numbers, concretely, pictorially and symbolically. [C, CN, ME, PS]
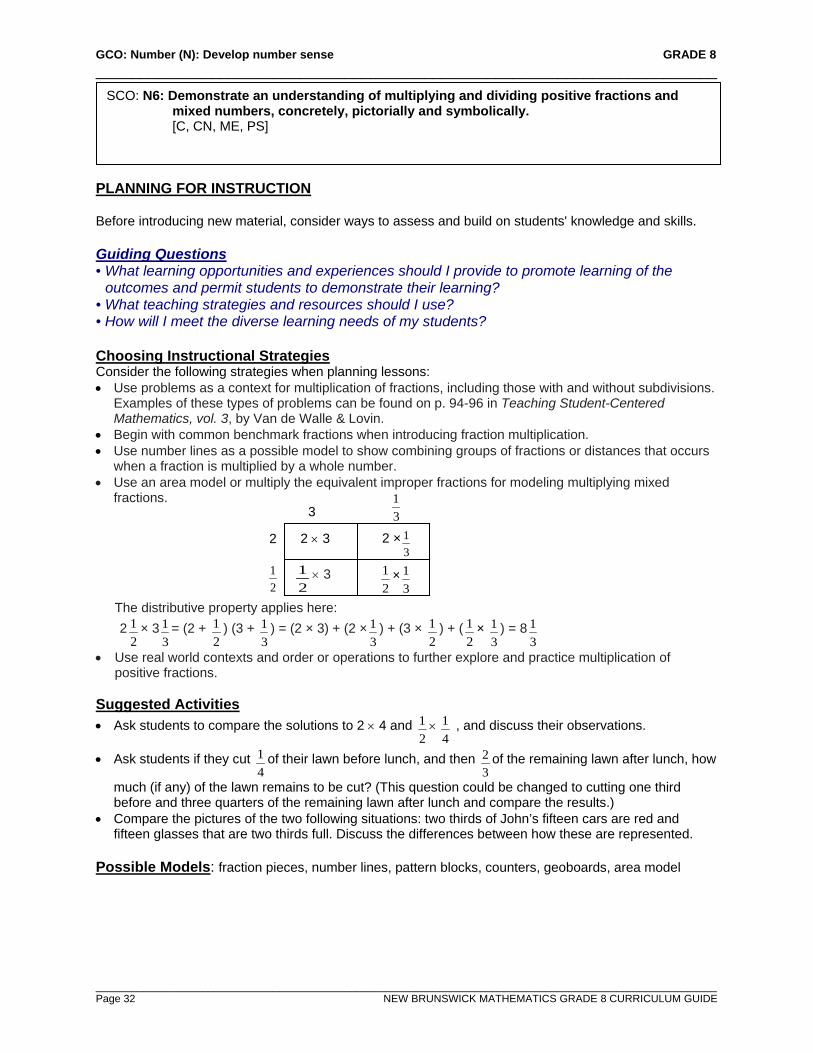
GCO: Number (N): Develop number sense GRADE 8 ______________________________________________________________________
_________________________________________________________________________________________________________ Page 32 NEW BRUNSWICK MATHEMATICS GRADE 8 CURRICULUM GUIDE
PLANNING FOR INSTRUCTION Before introducing new material, consider ways to assess and build on students' knowledge and skills. Guiding Questions • What learning opportunities and experiences should I provide to promote learning of the
outcomes and permit students to demonstrate their learning? • What teaching strategies and resources should I use? • How will I meet the diverse learning needs of my students? Choosing Instructional Strategies Consider the following strategies when planning lessons: • Use problems as a context for multiplication of fractions, including those with and without subdivisions.
Examples of these types of problems can be found on p. 94-96 in Teaching Student-Centered Mathematics, vol. 3, by Van de Walle & Lovin.
• Begin with common benchmark fractions when introducing fraction multiplication. • Use number lines as a possible model to show combining groups of fractions or distances that occurs
when a fraction is multiplied by a whole number. • Use an area model or multiply the equivalent improper fractions for modeling multiplying mixed
fractions.
The distributive property applies here: 2
21 × 3
31 = (2 +
21 ) (3 +
31 ) = (2 × 3) + (2 ×
31 ) + (3 ×
21 ) + (
21 ×
31 ) = 8
31
• Use real world contexts and order or operations to further explore and practice multiplication of positive fractions.
Suggested Activities • Ask students to compare the solutions to 2 × 4 and
21 ×
41 , and discuss their observations.
• Ask students if they cut 41 of their lawn before lunch, and then
32 of the remaining lawn after lunch, how
much (if any) of the lawn remains to be cut? (This question could be changed to cutting one third before and three quarters of the remaining lawn after lunch and compare the results.)
• Compare the pictures of the two following situations: two thirds of John’s fifteen cars are red and fifteen glasses that are two thirds full. Discuss the differences between how these are represented.
Possible Models: fraction pieces, number lines, pattern blocks, counters, geoboards, area model
SCO: N6: Demonstrate an understanding of multiplying and dividing positive fractions and mixed numbers, concretely, pictorially and symbolically. [C, CN, ME, PS]
2
21
2 × 3
21 × 3
21 ×
31
2 ×31
31
3
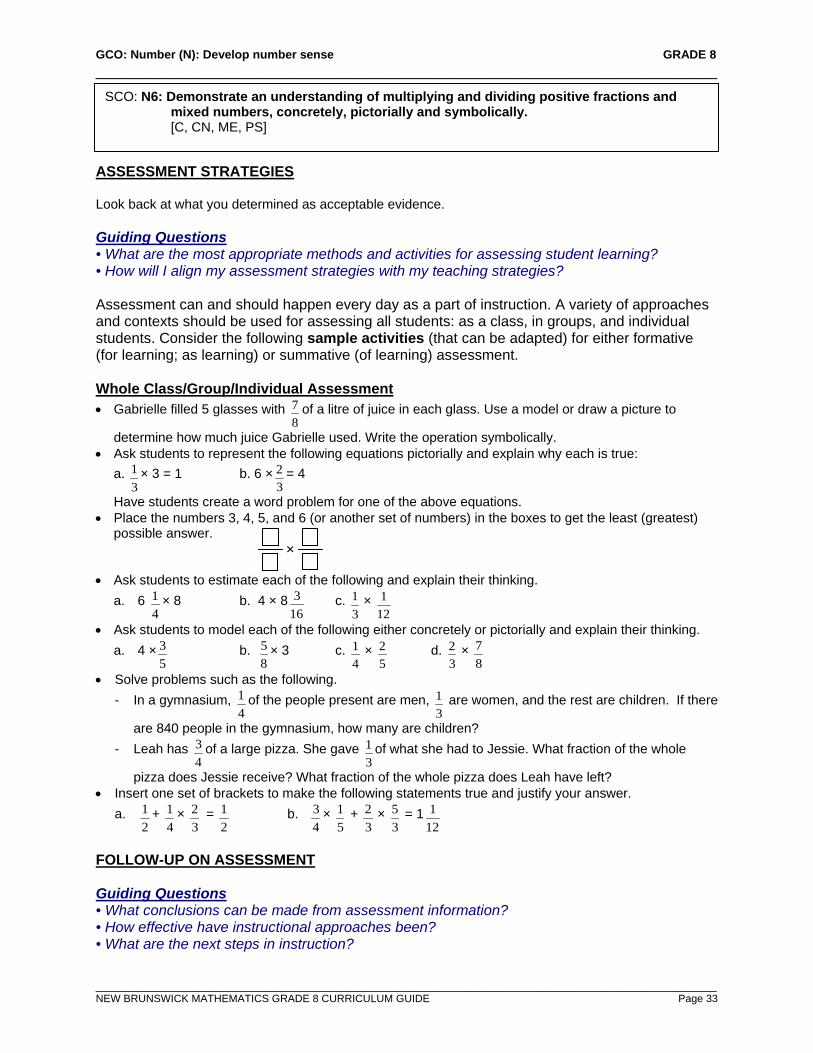
GCO: Number (N): Develop number sense GRADE 8 ______________________________________________________________________
_________________________________________________________________________________________________________ NEW BRUNSWICK MATHEMATICS GRADE 8 CURRICULUM GUIDE Page 33
ASSESSMENT STRATEGIES Look back at what you determined as acceptable evidence. Guiding Questions • What are the most appropriate methods and activities for assessing student learning? • How will I align my assessment strategies with my teaching strategies? Assessment can and should happen every day as a part of instruction. A variety of approaches and contexts should be used for assessing all students: as a class, in groups, and individual students. Consider the following sample activities (that can be adapted) for either formative (for learning; as learning) or summative (of learning) assessment. Whole Class/Group/Individual Assessment • Gabrielle filled 5 glasses with
87 of a litre of juice in each glass. Use a model or draw a picture to
determine how much juice Gabrielle used. Write the operation symbolically. • Ask students to represent the following equations pictorially and explain why each is true:
a. 31 × 3 = 1 b. 6 ×
32 = 4
Have students create a word problem for one of the above equations. • Place the numbers 3, 4, 5, and 6 (or another set of numbers) in the boxes to get the least (greatest)
possible answer. • Ask students to estimate each of the following and explain their thinking.
a. 6 41 × 8 b. 4 × 8
163 c.
31 ×
121
• Ask students to model each of the following either concretely or pictorially and explain their thinking. a. 4 ×
53 b.
85 × 3 c.
41 ×
52 d.
32 ×
87
• Solve problems such as the following. - In a gymnasium,
41 of the people present are men,
31 are women, and the rest are children. If there
are 840 people in the gymnasium, how many are children? - Leah has
43 of a large pizza. She gave
31 of what she had to Jessie. What fraction of the whole
pizza does Jessie receive? What fraction of the whole pizza does Leah have left? • Insert one set of brackets to make the following statements true and justify your answer.
a. 21 +
41 ×
32 =
21 b.
43 ×
51 +
32 ×
35 = 1
121
FOLLOW-UP ON ASSESSMENT Guiding Questions • What conclusions can be made from assessment information? • How effective have instructional approaches been? • What are the next steps in instruction?
SCO: N6: Demonstrate an understanding of multiplying and dividing positive fractions and mixed numbers, concretely, pictorially and symbolically. [C, CN, ME, PS]
×
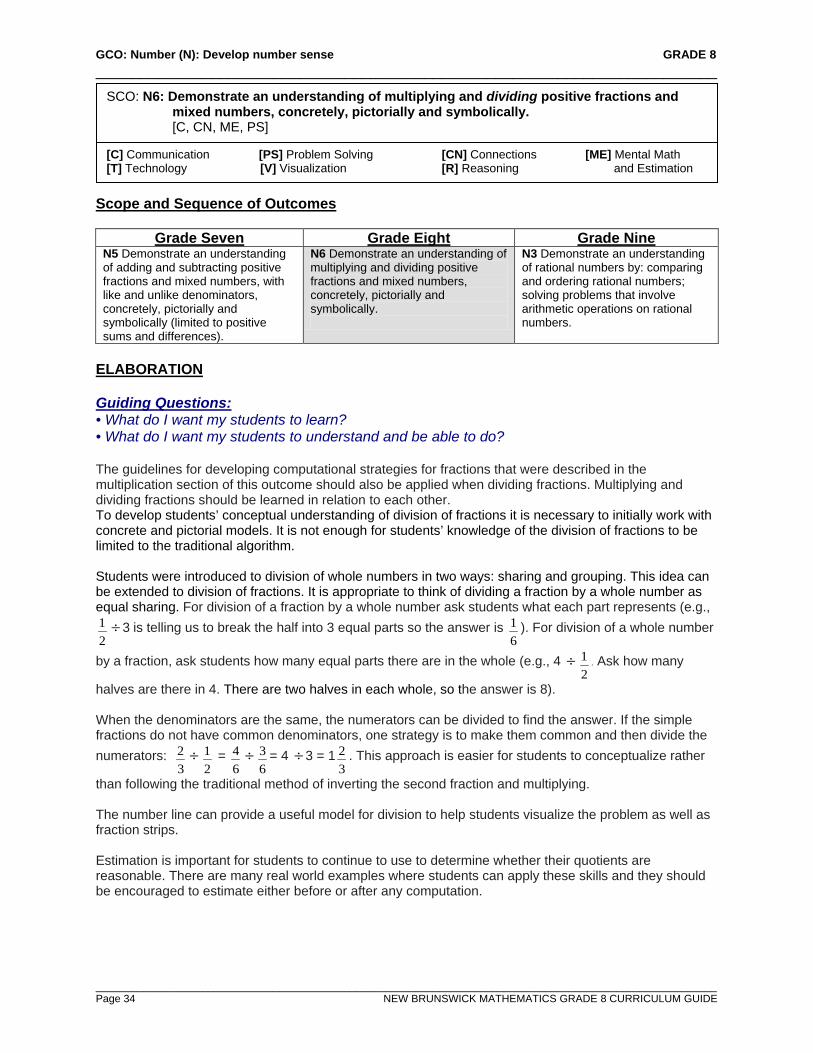
GCO: Number (N): Develop number sense GRADE 8 ______________________________________________________________________
_________________________________________________________________________________________________________ Page 34 NEW BRUNSWICK MATHEMATICS GRADE 8 CURRICULUM GUIDE
Scope and Sequence of Outcomes
Grade Seven Grade Eight Grade Nine N5 Demonstrate an understanding of adding and subtracting positive fractions and mixed numbers, with like and unlike denominators, concretely, pictorially and symbolically (limited to positive sums and differences).
N6 Demonstrate an understanding of multiplying and dividing positive fractions and mixed numbers, concretely, pictorially and symbolically.
N3 Demonstrate an understanding of rational numbers by: comparing and ordering rational numbers; solving problems that involve arithmetic operations on rational numbers.
ELABORATION Guiding Questions: • What do I want my students to learn? • What do I want my students to understand and be able to do? The guidelines for developing computational strategies for fractions that were described in the multiplication section of this outcome should also be applied when dividing fractions. Multiplying and dividing fractions should be learned in relation to each other. To develop students’ conceptual understanding of division of fractions it is necessary to initially work with concrete and pictorial models. It is not enough for students’ knowledge of the division of fractions to be limited to the traditional algorithm. Students were introduced to division of whole numbers in two ways: sharing and grouping. This idea can be extended to division of fractions. It is appropriate to think of dividing a fraction by a whole number as equal sharing. For division of a fraction by a whole number ask students what each part represents (e.g.,
21 ÷ 3 is telling us to break the half into 3 equal parts so the answer is
61 ). For division of a whole number
by a fraction, ask students how many equal parts there are in the whole (e.g., 4 ÷21 . Ask how many
halves are there in 4. There are two halves in each whole, so the answer is 8). When the denominators are the same, the numerators can be divided to find the answer. If the simple fractions do not have common denominators, one strategy is to make them common and then divide the numerators:
32 ÷
21 =
64 ÷
63 = 4 ÷ 3 = 1
32 . This approach is easier for students to conceptualize rather
than following the traditional method of inverting the second fraction and multiplying. The number line can provide a useful model for division to help students visualize the problem as well as fraction strips. Estimation is important for students to continue to use to determine whether their quotients are reasonable. There are many real world examples where students can apply these skills and they should be encouraged to estimate either before or after any computation.
SCO: N6: Demonstrate an understanding of multiplying and dividing positive fractions and mixed numbers, concretely, pictorially and symbolically. [C, CN, ME, PS]
[C] Communication [PS] Problem Solving [CN] Connections [ME] Mental Math [T] Technology [V] Visualization [R] Reasoning and Estimation
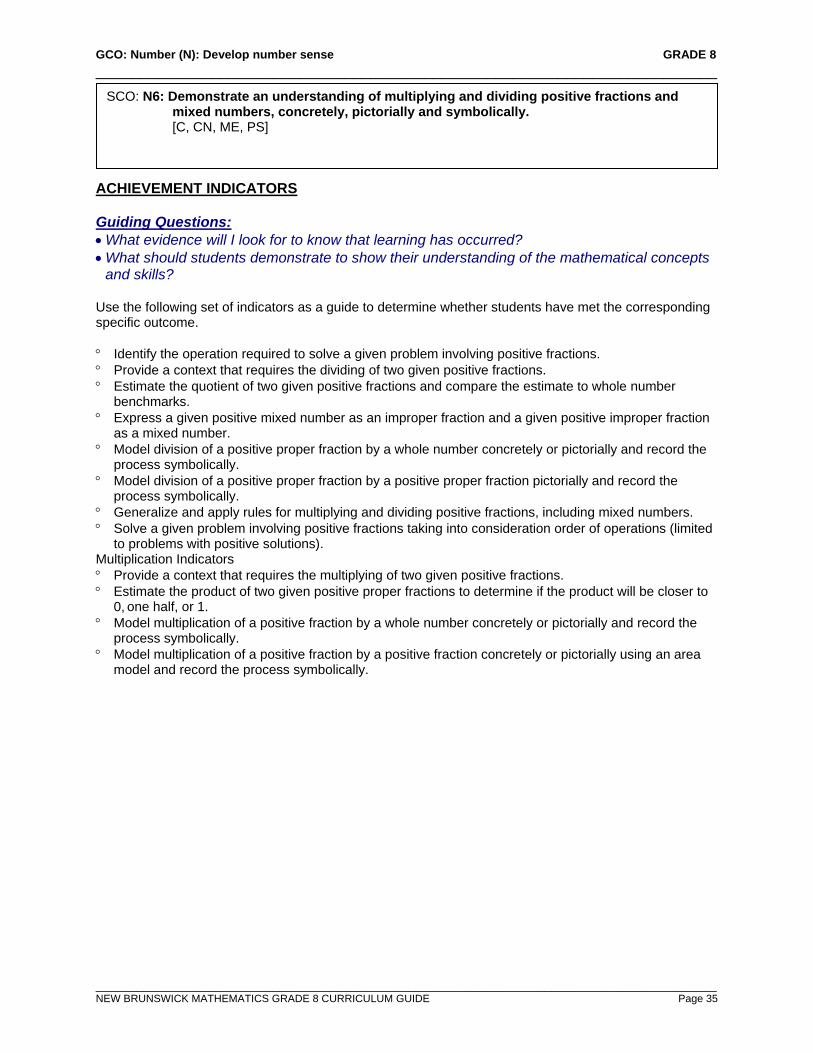
GCO: Number (N): Develop number sense GRADE 8 ______________________________________________________________________
_________________________________________________________________________________________________________ NEW BRUNSWICK MATHEMATICS GRADE 8 CURRICULUM GUIDE Page 35
ACHIEVEMENT INDICATORS Guiding Questions: • What evidence will I look for to know that learning has occurred? • What should students demonstrate to show their understanding of the mathematical concepts
and skills? Use the following set of indicators as a guide to determine whether students have met the corresponding specific outcome. ° Identify the operation required to solve a given problem involving positive fractions. ° Provide a context that requires the dividing of two given positive fractions. ° Estimate the quotient of two given positive fractions and compare the estimate to whole number
benchmarks. ° Express a given positive mixed number as an improper fraction and a given positive improper fraction
as a mixed number. ° Model division of a positive proper fraction by a whole number concretely or pictorially and record the
process symbolically. ° Model division of a positive proper fraction by a positive proper fraction pictorially and record the
process symbolically. ° Generalize and apply rules for multiplying and dividing positive fractions, including mixed numbers. ° Solve a given problem involving positive fractions taking into consideration order of operations (limited
to problems with positive solutions). Multiplication Indicators ° Provide a context that requires the multiplying of two given positive fractions. ° Estimate the product of two given positive proper fractions to determine if the product will be closer to
0, one half, or 1. ° Model multiplication of a positive fraction by a whole number concretely or pictorially and record the
process symbolically. ° Model multiplication of a positive fraction by a positive fraction concretely or pictorially using an area
model and record the process symbolically.
SCO: N6: Demonstrate an understanding of multiplying and dividing positive fractions and mixed numbers, concretely, pictorially and symbolically. [C, CN, ME, PS]
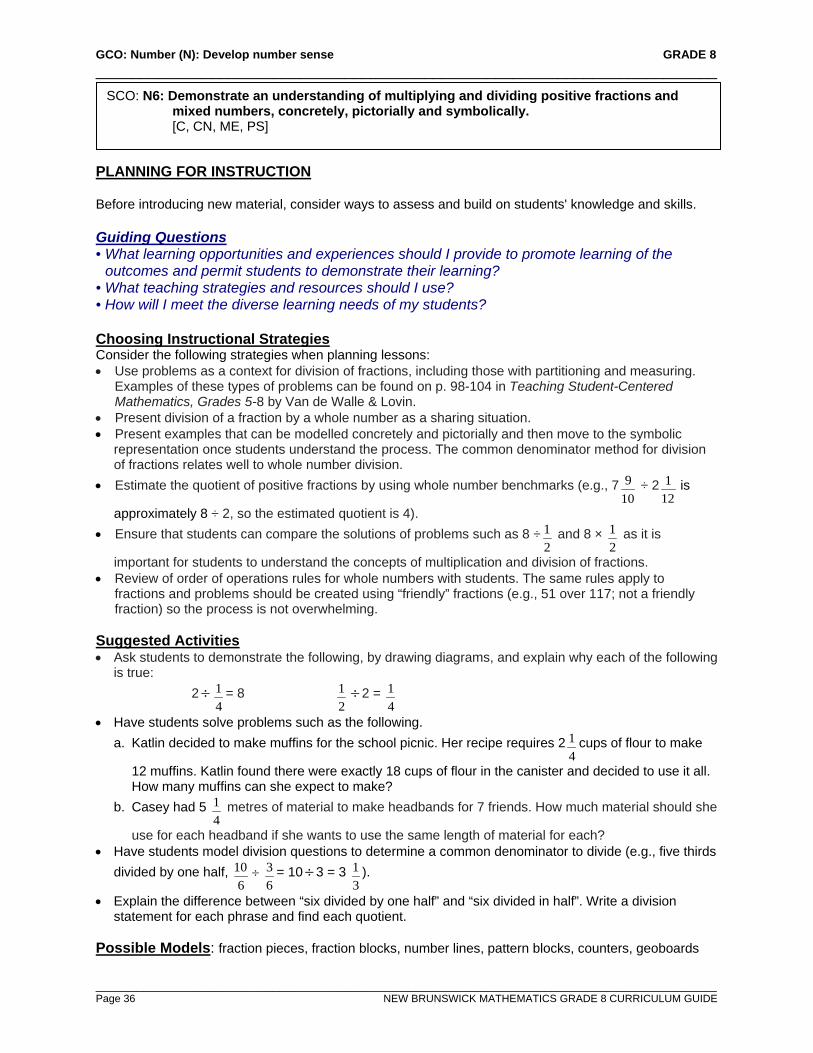
GCO: Number (N): Develop number sense GRADE 8 ______________________________________________________________________
_________________________________________________________________________________________________________ Page 36 NEW BRUNSWICK MATHEMATICS GRADE 8 CURRICULUM GUIDE
PLANNING FOR INSTRUCTION Before introducing new material, consider ways to assess and build on students' knowledge and skills. Guiding Questions • What learning opportunities and experiences should I provide to promote learning of the
outcomes and permit students to demonstrate their learning? • What teaching strategies and resources should I use? • How will I meet the diverse learning needs of my students? Choosing Instructional Strategies Consider the following strategies when planning lessons: • Use problems as a context for division of fractions, including those with partitioning and measuring.
Examples of these types of problems can be found on p. 98-104 in Teaching Student-Centered Mathematics, Grades 5-8 by Van de Walle & Lovin.
• Present division of a fraction by a whole number as a sharing situation. • Present examples that can be modelled concretely and pictorially and then move to the symbolic
representation once students understand the process. The common denominator method for division of fractions relates well to whole number division.
• Estimate the quotient of positive fractions by using whole number benchmarks (e.g., 7109 ÷ 2
121 is
approximately 8 ÷ 2, so the estimated quotient is 4). • Ensure that students can compare the solutions of problems such as 8 ÷
21 and 8 ×
21 as it is
important for students to understand the concepts of multiplication and division of fractions. • Review of order of operations rules for whole numbers with students. The same rules apply to
fractions and problems should be created using “friendly” fractions (e.g., 51 over 117; not a friendly fraction) so the process is not overwhelming.
Suggested Activities • Ask students to demonstrate the following, by drawing diagrams, and explain why each of the following
is true: 2 ÷
41 = 8
21 ÷ 2 =
41
• Have students solve problems such as the following. a. Katlin decided to make muffins for the school picnic. Her recipe requires 2
41 cups of flour to make
12 muffins. Katlin found there were exactly 18 cups of flour in the canister and decided to use it all. How many muffins can she expect to make?
b. Casey had 5 41 metres of material to make headbands for 7 friends. How much material should she
use for each headband if she wants to use the same length of material for each? • Have students model division questions to determine a common denominator to divide (e.g., five thirds
divided by one half, 6
10 ÷ 63 = 10 ÷ 3 = 3
31 ).
• Explain the difference between “six divided by one half” and “six divided in half”. Write a division statement for each phrase and find each quotient.
Possible Models: fraction pieces, fraction blocks, number lines, pattern blocks, counters, geoboards
SCO: N6: Demonstrate an understanding of multiplying and dividing positive fractions and mixed numbers, concretely, pictorially and symbolically. [C, CN, ME, PS]
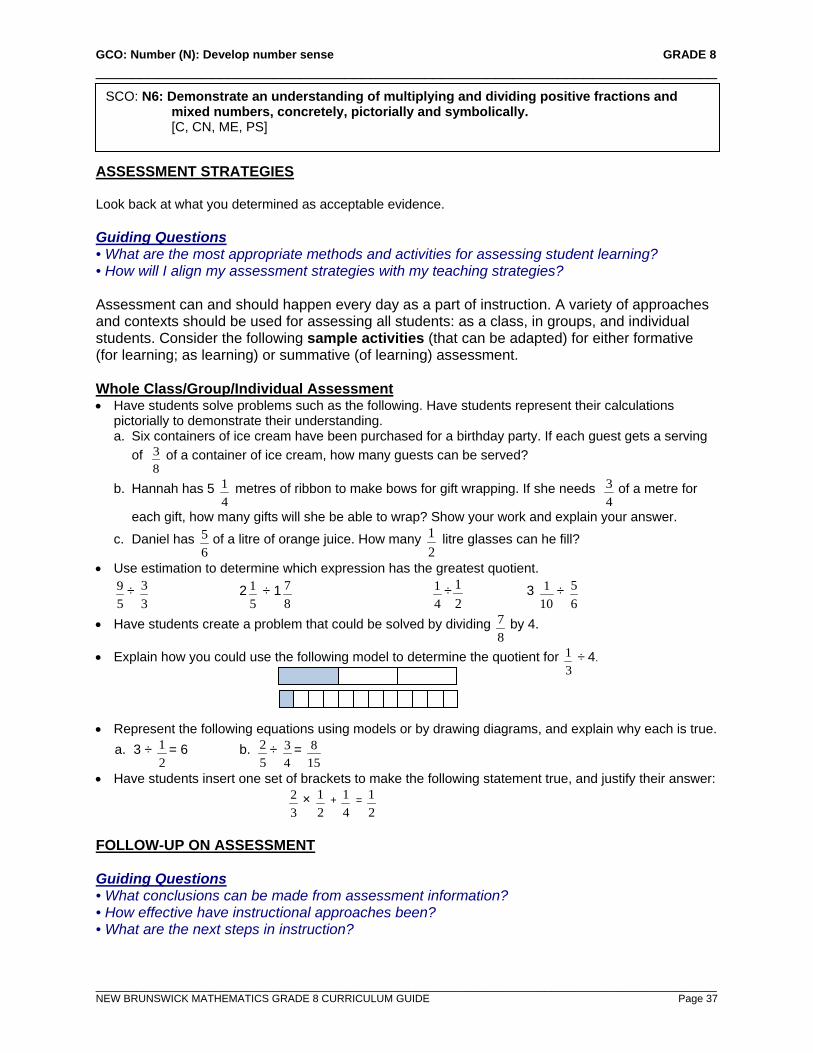
GCO: Number (N): Develop number sense GRADE 8 ______________________________________________________________________
_________________________________________________________________________________________________________ NEW BRUNSWICK MATHEMATICS GRADE 8 CURRICULUM GUIDE Page 37
ASSESSMENT STRATEGIES Look back at what you determined as acceptable evidence. Guiding Questions • What are the most appropriate methods and activities for assessing student learning? • How will I align my assessment strategies with my teaching strategies? Assessment can and should happen every day as a part of instruction. A variety of approaches and contexts should be used for assessing all students: as a class, in groups, and individual students. Consider the following sample activities (that can be adapted) for either formative (for learning; as learning) or summative (of learning) assessment. Whole Class/Group/Individual Assessment • Have students solve problems such as the following. Have students represent their calculations
pictorially to demonstrate their understanding. a. Six containers of ice cream have been purchased for a birthday party. If each guest gets a serving
of 83 of a container of ice cream, how many guests can be served?
b. Hannah has 5 41 metres of ribbon to make bows for gift wrapping. If she needs
43 of a metre for
each gift, how many gifts will she be able to wrap? Show your work and explain your answer.
c. Daniel has 65 of a litre of orange juice. How many
21 litre glasses can he fill?
• Use estimation to determine which expression has the greatest quotient.
59 ÷
33 2
51 ÷ 1
87
41 ÷
21 3
101 ÷
65
• Have students create a problem that could be solved by dividing 87 by 4.
• Explain how you could use the following model to determine the quotient for 31 ÷ 4.
• Represent the following equations using models or by drawing diagrams, and explain why each is true.
a. 3 ÷ 21 = 6 b.
52 ÷
43 =
158
• Have students insert one set of brackets to make the following statement true, and justify their answer:
32 ×
21 +
41 =
21
FOLLOW-UP ON ASSESSMENT Guiding Questions • What conclusions can be made from assessment information? • How effective have instructional approaches been? • What are the next steps in instruction?
SCO: N6: Demonstrate an understanding of multiplying and dividing positive fractions and mixed numbers, concretely, pictorially and symbolically. [C, CN, ME, PS]
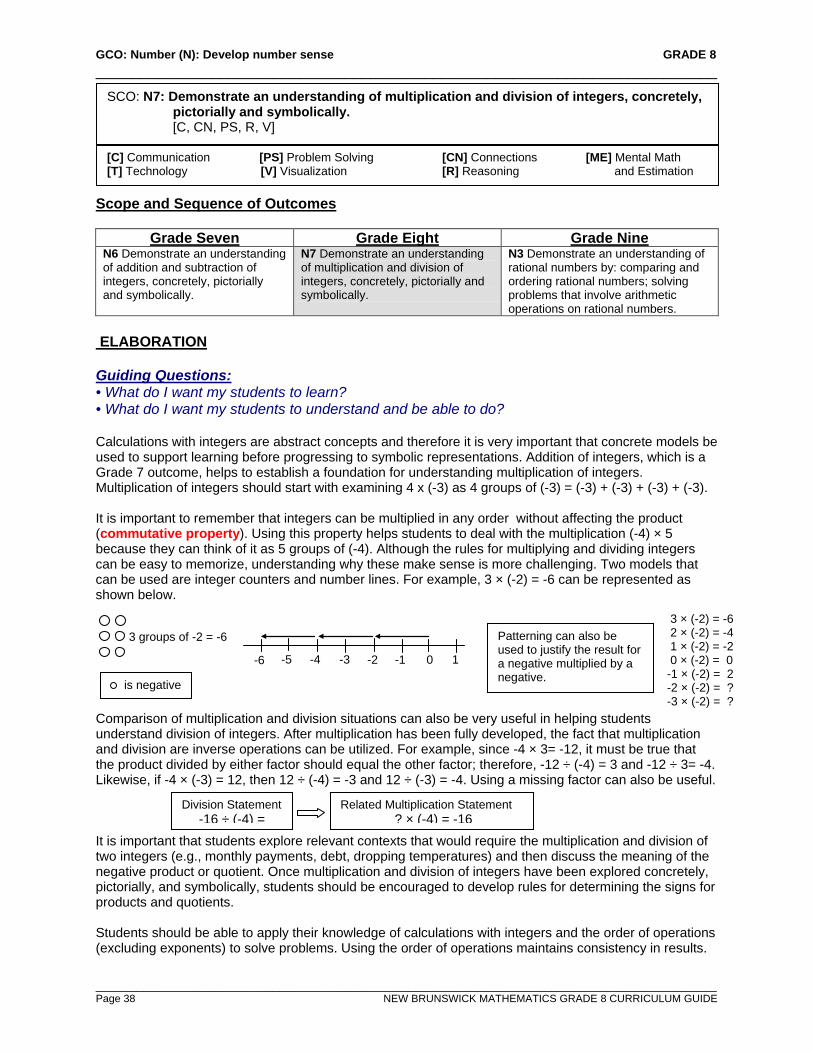
GCO: Number (N): Develop number sense GRADE 8 ______________________________________________________________________
_________________________________________________________________________________________________________ Page 38 NEW BRUNSWICK MATHEMATICS GRADE 8 CURRICULUM GUIDE
Scope and Sequence of Outcomes
Grade Seven Grade Eight Grade Nine N6 Demonstrate an understanding of addition and subtraction of integers, concretely, pictorially and symbolically.
N7 Demonstrate an understanding of multiplication and division of integers, concretely, pictorially and symbolically.
N3 Demonstrate an understanding of rational numbers by: comparing and ordering rational numbers; solving problems that involve arithmetic operations on rational numbers.
ELABORATION Guiding Questions: • What do I want my students to learn? • What do I want my students to understand and be able to do? Calculations with integers are abstract concepts and therefore it is very important that concrete models be used to support learning before progressing to symbolic representations. Addition of integers, which is a Grade 7 outcome, helps to establish a foundation for understanding multiplication of integers. Multiplication of integers should start with examining 4 x (-3) as 4 groups of (-3) = (-3) + (-3) + (-3) + (-3). It is important to remember that integers can be multiplied in any order without affecting the product (commutative property). Using this property helps students to deal with the multiplication (-4) × 5 because they can think of it as 5 groups of (-4). Although the rules for multiplying and dividing integers can be easy to memorize, understanding why these make sense is more challenging. Two models that can be used are integer counters and number lines. For example, 3 × (-2) = -6 can be represented as shown below.
Comparison of multiplication and division situations can also be very useful in helping students understand division of integers. After multiplication has been fully developed, the fact that multiplication and division are inverse operations can be utilized. For example, since -4 × 3= -12, it must be true that the product divided by either factor should equal the other factor; therefore, -12 ÷ (-4) = 3 and -12 ÷ 3= -4. Likewise, if -4 × (-3) = 12, then 12 ÷ (-4) = -3 and 12 ÷ (-3) = -4. Using a missing factor can also be useful. It is important that students explore relevant contexts that would require the multiplication and division of two integers (e.g., monthly payments, debt, dropping temperatures) and then discuss the meaning of the negative product or quotient. Once multiplication and division of integers have been explored concretely, pictorially, and symbolically, students should be encouraged to develop rules for determining the signs for products and quotients. Students should be able to apply their knowledge of calculations with integers and the order of operations (excluding exponents) to solve problems. Using the order of operations maintains consistency in results.
SCO: N7: Demonstrate an understanding of multiplication and division of integers, concretely, pictorially and symbolically. [C, CN, PS, R, V]
[C] Communication [PS] Problem Solving [CN] Connections [ME] Mental Math [T] Technology [V] Visualization [R] Reasoning and Estimation
3 × (-2) = -6 2 × (-2) = -4 1 × (-2) = -2 0 × (-2) = 0 -1 × (-2) = 2 -2 × (-2) = ? -3 × (-2) = ?
Patterning can also be used to justify the result for a negative multiplied by a negative.
0 -1 -2 -3 -4 1 -5 -6
Division Statement -16 ÷ (-4) =
Related Multiplication Statement ? × (-4) = -16
is negative
3 groups of -2 = -6
GCO: Number (N): Develop number sense GRADE 8 ______________________________________________________________________
_________________________________________________________________________________________________________ NEW BRUNSWICK MATHEMATICS GRADE 8 CURRICULUM GUIDE Page 39
ACHIEVEMENT INDICATORS Guiding Questions: • What evidence will I look for to know that learning has occurred? • What should students demonstrate to show their understanding of the mathematical concepts
and skills? Use the following set of indicators as a guide to determine whether students have met the corresponding specific outcome. ° Identify the operation required to solve a given problem involving integers. ° Provide a context that requires multiplying two integers. ° Provide a context that requires dividing two integers. ° Model the process of multiplying two integers using concrete materials or pictorial representations and
record the process. ° Model the process of dividing an integer by an integer using concrete materials or pictorial
representations and record the process. ° Solve a given problem involving the division of integers (2-digit by 1-digit) without the use of
technology. ° Solve a given problem involving the division of integers (2-digit by 2-digit) with the use of technology. ° Generalize and apply a rule for determining the sign of the product and quotient of integers. ° Solve a given problem involving integers taking into consideration order of operations.
SCO: N7: Demonstrate an understanding of multiplication and division of integers, concretely, pictorially and symbolically. [C, CN, PS, R, V]
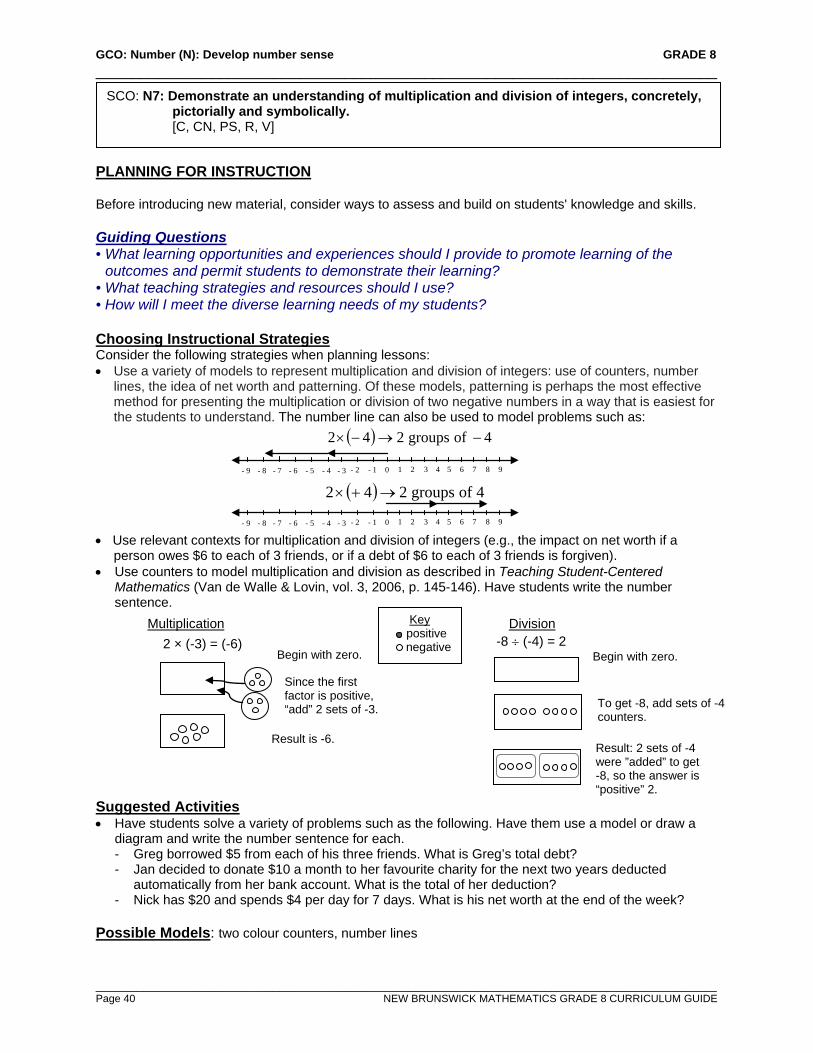
GCO: Number (N): Develop number sense GRADE 8 ______________________________________________________________________
_________________________________________________________________________________________________________ Page 40 NEW BRUNSWICK MATHEMATICS GRADE 8 CURRICULUM GUIDE
PLANNING FOR INSTRUCTION Before introducing new material, consider ways to assess and build on students' knowledge and skills. Guiding Questions • What learning opportunities and experiences should I provide to promote learning of the
outcomes and permit students to demonstrate their learning? • What teaching strategies and resources should I use? • How will I meet the diverse learning needs of my students? Choosing Instructional Strategies Consider the following strategies when planning lessons: • Use a variety of models to represent multiplication and division of integers: use of counters, number
lines, the idea of net worth and patterning. Of these models, patterning is perhaps the most effective method for presenting the multiplication or division of two negative numbers in a way that is easiest for the students to understand. The number line can also be used to model problems such as:
• Use relevant contexts for multiplication and division of integers (e.g., the impact on net worth if a
person owes $6 to each of 3 friends, or if a debt of $6 to each of 3 friends is forgiven). • Use counters to model multiplication and division as described in Teaching Student-Centered
Mathematics (Van de Walle & Lovin, vol. 3, 2006, p. 145-146). Have students write the number sentence.
Suggested Activities • Have students solve a variety of problems such as the following. Have them use a model or draw a
diagram and write the number sentence for each. - Greg borrowed $5 from each of his three friends. What is Greg’s total debt? - Jan decided to donate $10 a month to her favourite charity for the next two years deducted
automatically from her bank account. What is the total of her deduction? - Nick has $20 and spends $4 per day for 7 days. What is his net worth at the end of the week?
Possible Models: two colour counters, number lines
SCO: N7: Demonstrate an understanding of multiplication and division of integers, concretely, pictorially and symbolically. [C, CN, PS, R, V]
Begin with zero.
( ) 4ofgroups242 −→−×
3 4 5 6 - 4 - 2 1 - 8 - 6 - 9 - 7 - 5 - 3 - 1 0 2 7 8 9
3 4 5 6 - 4 - 2 1 - 8 - 6 - 9 - 7 - 5 - 3 - 1 0 2 7 8 9
( ) 4ofgroups242 →+×
Division -8 ÷ (-4) = 2
Key positive
negative
To get -8, add sets of -4 counters. Result: 2 sets of -4 were ”added” to get -8, so the answer is “positive” 2.
Multiplication 2 × (-3) = (-6)
Begin with zero.
Since the first factor is positive, “add” 2 sets of -3.
Result is -6.

GCO: Number (N): Develop number sense GRADE 8 ______________________________________________________________________
_________________________________________________________________________________________________________ NEW BRUNSWICK MATHEMATICS GRADE 8 CURRICULUM GUIDE Page 41
ASSESSMENT STRATEGIES Look back at what you determined as acceptable evidence. Guiding Questions • What are the most appropriate methods and activities for assessing student learning? • How will I align my assessment strategies with my teaching strategies? Assessment can and should happen every day as a part of instruction. A variety of approaches and contexts should be used for assessing all students: as a class, in groups, and individual students. Consider the following sample activities (that can be adapted) for either formative (for learning; as learning) or summative (of learning) assessment. Whole Class/Group/Individual Assessment • Start with a container with an equal number of items representing positives and negatives (e.g., a
glass container with two colours of marbles). a. Have students take out 4 groups of -2 from the container. Ask what is left in the container. Have
them sketch diagrams to illustrate this and write a number sentence to model it. (-4 × -2 = 8). b. Have students add 3 groups of -3 to the container. Ask what is represented in the container. Have
them sketch diagrams to illustrate this and write a number sentence to model it. (3 × -3) • Tell students the without doing any calculations, Katie said that the quotients (−468)÷ (−26) and
(+468)÷ (+26) must be the same. How did she know? • Write a number sentence for each of the following problems and use a diagram to model them.
a. Michelle withdrew $25 from her bank account each week for 16 weeks. How much did she withdraw in total?
b. Fran lost 3 points in each round (hand) of cards that was played. If she played 4 rounds (hands), what was her score at the end of the game?
c. The temperature in Edmundston was falling 2°C each hour. How many hours did it take for the temperature to fall 10°C?
d. Mike and his four friends together owe $12. They agree to share the debt equally. What is each person’s share of the debt?
• Have students write the number sentence that is represented by the number line below.
• Tell students that the sum of two integers is -2. The product of the same two integers is -24. What are
the two integers? Explain your reasoning. • Have students complete the following equations in as many ways as possible using integers.
-24 ÷ ___ = ___ +36 = ___ × ___ • Tell students that to win a free trip, they must answer the following skill-testing question correctly:
-3 × (-4) + (-18) ÷ 6 – (-5). Tell students that the contest organizers say that the answer is +4. Ask them to write a note to the organizers explaining why there is a problem with their solution.
• Have students find the mean temperature for their town for the past twelve months. FOLLOW-UP ON ASSESSMENT Guiding Questions • What conclusions can be made from assessment information? • How effective have instructional approaches been? • What are the next steps in instruction?
SCO: N7: Demonstrate an understanding of multiplication and division of integers, concretely, pictorially and symbolically. [C, CN, PS, R, V]
3 4 5 6 - 4 - 2 1 - 8 - 6 - 9 - 7 - 5 - 3 - 1 0 2 7 8 9
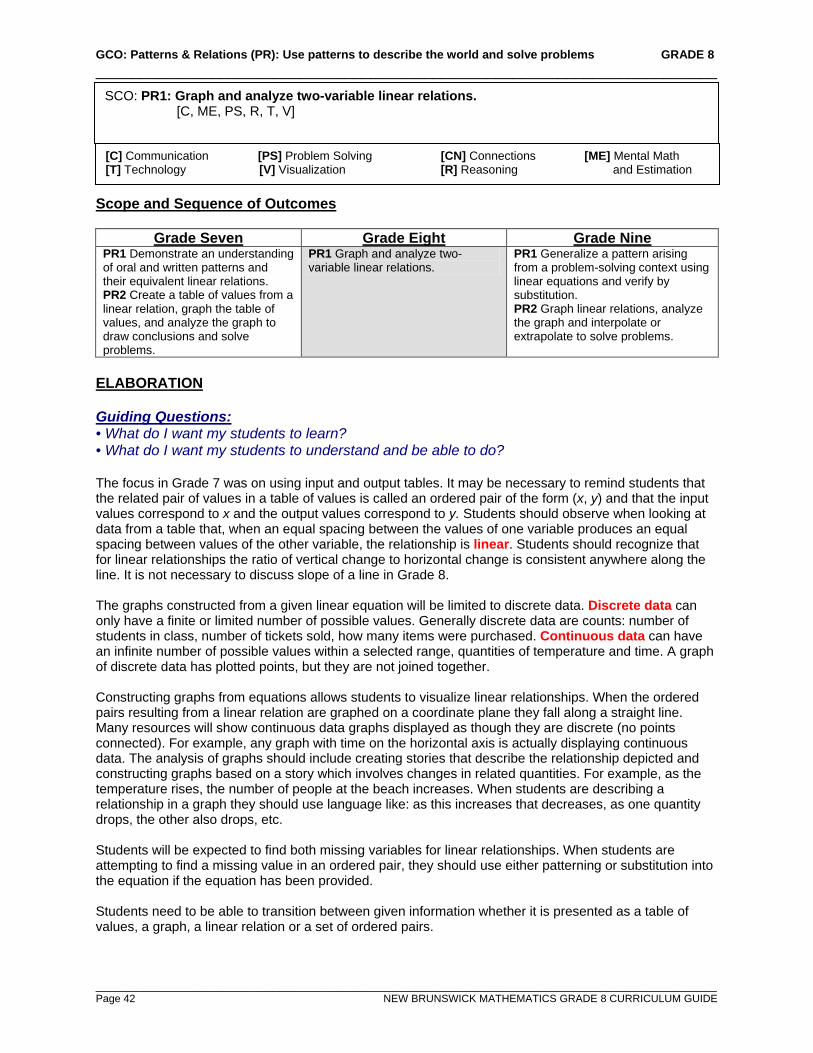
GCO: Patterns & Relations (PR): Use patterns to describe the world and solve problems GRADE 8 ______________________________________________________________________
_________________________________________________________________________________________________________ Page 42 NEW BRUNSWICK MATHEMATICS GRADE 8 CURRICULUM GUIDE
Scope and Sequence of Outcomes
Grade Seven Grade Eight Grade Nine PR1 Demonstrate an understanding of oral and written patterns and their equivalent linear relations. PR2 Create a table of values from a linear relation, graph the table of values, and analyze the graph to draw conclusions and solve problems.
PR1 Graph and analyze two-variable linear relations.
PR1 Generalize a pattern arising from a problem-solving context using linear equations and verify by substitution. PR2 Graph linear relations, analyze the graph and interpolate or extrapolate to solve problems.
ELABORATION Guiding Questions: • What do I want my students to learn? • What do I want my students to understand and be able to do? The focus in Grade 7 was on using input and output tables. It may be necessary to remind students that the related pair of values in a table of values is called an ordered pair of the form (x, y) and that the input values correspond to x and the output values correspond to y. Students should observe when looking at data from a table that, when an equal spacing between the values of one variable produces an equal spacing between values of the other variable, the relationship is linear. Students should recognize that for linear relationships the ratio of vertical change to horizontal change is consistent anywhere along the line. It is not necessary to discuss slope of a line in Grade 8. The graphs constructed from a given linear equation will be limited to discrete data. Discrete data can only have a finite or limited number of possible values. Generally discrete data are counts: number of students in class, number of tickets sold, how many items were purchased. Continuous data can have an infinite number of possible values within a selected range, quantities of temperature and time. A graph of discrete data has plotted points, but they are not joined together. Constructing graphs from equations allows students to visualize linear relationships. When the ordered pairs resulting from a linear relation are graphed on a coordinate plane they fall along a straight line. Many resources will show continuous data graphs displayed as though they are discrete (no points connected). For example, any graph with time on the horizontal axis is actually displaying continuous data. The analysis of graphs should include creating stories that describe the relationship depicted and constructing graphs based on a story which involves changes in related quantities. For example, as the temperature rises, the number of people at the beach increases. When students are describing a relationship in a graph they should use language like: as this increases that decreases, as one quantity drops, the other also drops, etc. Students will be expected to find both missing variables for linear relationships. When students are attempting to find a missing value in an ordered pair, they should use either patterning or substitution into the equation if the equation has been provided. Students need to be able to transition between given information whether it is presented as a table of values, a graph, a linear relation or a set of ordered pairs.
SCO: PR1: Graph and analyze two-variable linear relations. [C, ME, PS, R, T, V]
[C] Communication [PS] Problem Solving [CN] Connections [ME] Mental Math [T] Technology [V] Visualization [R] Reasoning and Estimation
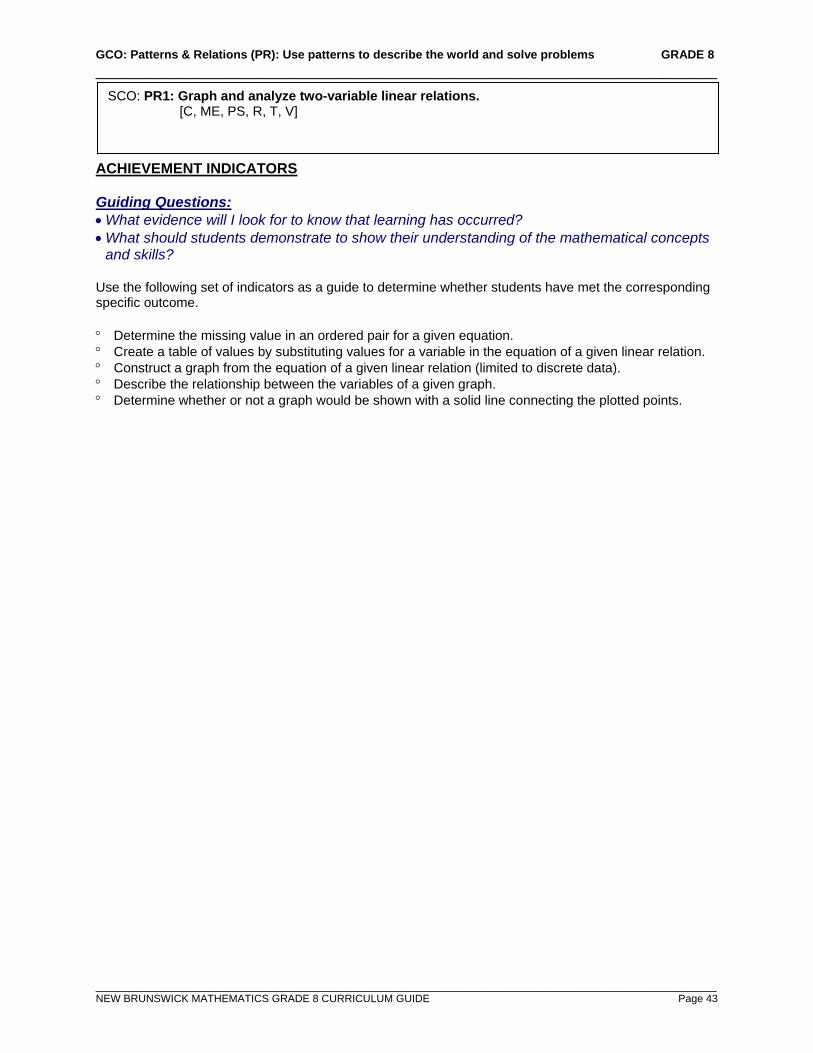
GCO: Patterns & Relations (PR): Use patterns to describe the world and solve problems GRADE 8 ______________________________________________________________________
_________________________________________________________________________________________________________ NEW BRUNSWICK MATHEMATICS GRADE 8 CURRICULUM GUIDE Page 43
ACHIEVEMENT INDICATORS Guiding Questions: • What evidence will I look for to know that learning has occurred? • What should students demonstrate to show their understanding of the mathematical concepts
and skills? Use the following set of indicators as a guide to determine whether students have met the corresponding specific outcome. ° Determine the missing value in an ordered pair for a given equation. ° Create a table of values by substituting values for a variable in the equation of a given linear relation. ° Construct a graph from the equation of a given linear relation (limited to discrete data). ° Describe the relationship between the variables of a given graph. ° Determine whether or not a graph would be shown with a solid line connecting the plotted points.
SCO: PR1: Graph and analyze two-variable linear relations. [C, ME, PS, R, T, V]

GCO: Patterns & Relations (PR): Use patterns to describe the world and solve problems GRADE 8 ______________________________________________________________________
_________________________________________________________________________________________________________ Page 44 NEW BRUNSWICK MATHEMATICS GRADE 8 CURRICULUM GUIDE
PLANNING FOR INSTRUCTION Before introducing new material, consider ways to assess and build on students' knowledge and skills. Guiding Questions • What learning opportunities and experiences should I provide to promote learning of the
outcomes and permit students to demonstrate their learning? • What teaching strategies and resources should I use? • How will I meet the diverse learning needs of my students? Choosing Instructional Strategies Consider the following strategies when planning lessons: • Encourage the use of proper algebraic vocabulary and terminology. • Emphasize that all related pairs in a table of values may be written as ordered pairs. • Have students arrange ordered pairs in ascending order based on the x-coordinate to establish a
pattern to determine a missing value in a set. Suggested Activities • Create a table of values for the equation, k = 6(n + 2), by substituting values for 1 to 5 for n.
n 1 2 3 4 5 k
• Ask students which graph should have the points connected? Explain why? • Show the students a table of values that represents a linear relation and complete the activities below.
a. Graph the ordered pairs in the table. b. What is the difference in value for consecutive x-
values? y-values? c. Describe the relationship between the x-and y-values. d. Write an expression for y in terms of x.
• Provide students with table of values for a linear relation with missing coordinates. a. How could you use a pattern to find the missing
y-coordinates? b. What are the missing coordinates?
• Tell students that a community centre has a new banquet facility. They charge $8 per person to rent the centre. a. Make a table of values showing the rental cost for 30, 60, 90, 120 and 150 people. b. Graph the ordered pairs. c. What is an expression for the rental cost in terms of the number of people?
• Determine the missing values in the following set of ordered pairs. a. (0, 0), (1, 12), (2, 24), (3, __) b. (-4, __),(-2, -6), (0, 2), (2, 10), (__, 18)
Possible Models: grid paper, pattern blocks
x 1 2 3 4 5 6 7 y 4 8 12 16 20 24 28
x -3 -2 -1 0 1 2 y 7 9 11
SCO: PR1: Graph and analyze two-variable linear relations. [C, ME, PS, R, T, V]
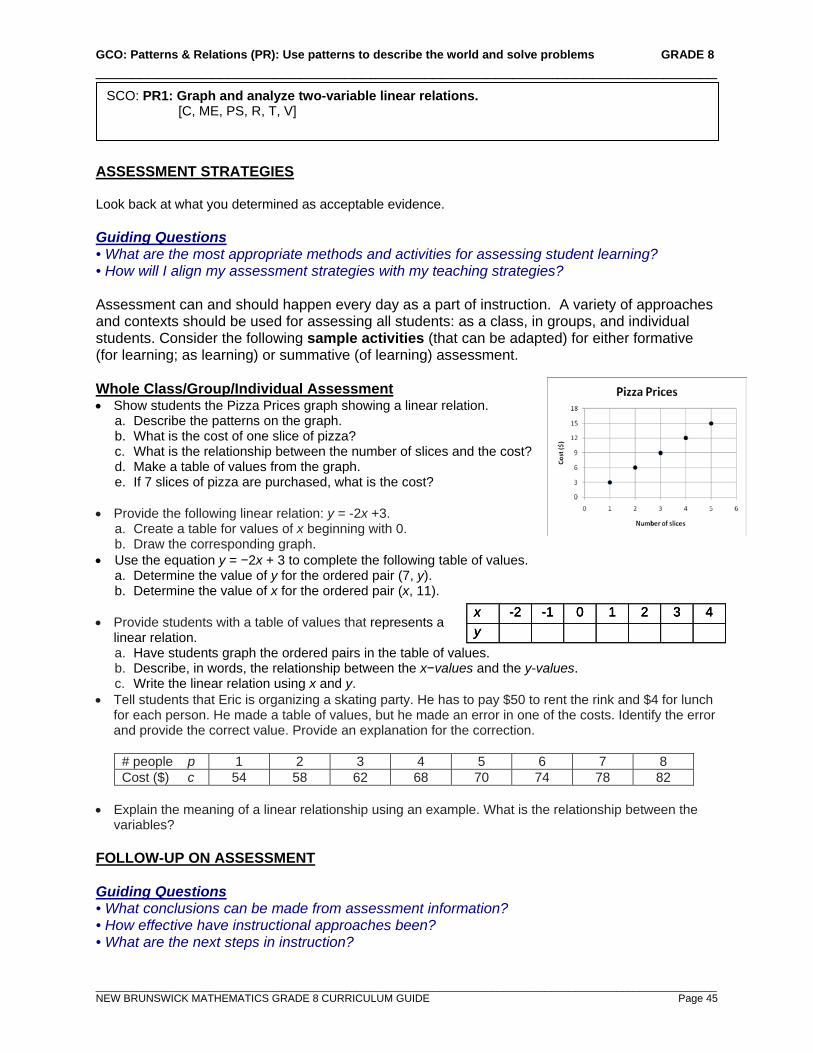
GCO: Patterns & Relations (PR): Use patterns to describe the world and solve problems GRADE 8 ______________________________________________________________________
_________________________________________________________________________________________________________ NEW BRUNSWICK MATHEMATICS GRADE 8 CURRICULUM GUIDE Page 45
ASSESSMENT STRATEGIES Look back at what you determined as acceptable evidence. Guiding Questions • What are the most appropriate methods and activities for assessing student learning? • How will I align my assessment strategies with my teaching strategies? Assessment can and should happen every day as a part of instruction. A variety of approaches and contexts should be used for assessing all students: as a class, in groups, and individual students. Consider the following sample activities (that can be adapted) for either formative (for learning; as learning) or summative (of learning) assessment. Whole Class/Group/Individual Assessment • Show students the Pizza Prices graph showing a linear relation.
a. Describe the patterns on the graph. b. What is the cost of one slice of pizza? c. What is the relationship between the number of slices and the cost? d. Make a table of values from the graph. e. If 7 slices of pizza are purchased, what is the cost?
• Provide the following linear relation: y = -2x +3. a. Create a table for values of x beginning with 0. b. Draw the corresponding graph.
• Use the equation y = −2x + 3 to complete the following table of values. a. Determine the value of y for the ordered pair (7, y). b. Determine the value of x for the ordered pair (x, 11).
• Provide students with a table of values that represents a
linear relation. a. Have students graph the ordered pairs in the table of values. b. Describe, in words, the relationship between the x−values and the y-values. c. Write the linear relation using x and y.
• Tell students that Eric is organizing a skating party. He has to pay $50 to rent the rink and $4 for lunch for each person. He made a table of values, but he made an error in one of the costs. Identify the error and provide the correct value. Provide an explanation for the correction.
# people p 1 2 3 4 5 6 7 8 Cost ($) c 54 58 62 68 70 74 78 82
• Explain the meaning of a linear relationship using an example. What is the relationship between the
variables? FOLLOW-UP ON ASSESSMENT Guiding Questions • What conclusions can be made from assessment information? • How effective have instructional approaches been? • What are the next steps in instruction?
x -2 -1 0 1 2 3 4 y x -2 -1 0 1 2 3 4 y x -2 -1 0 1 2 3 4 y
SCO: PR1: Graph and analyze two-variable linear relations. [C, ME, PS, R, T, V]
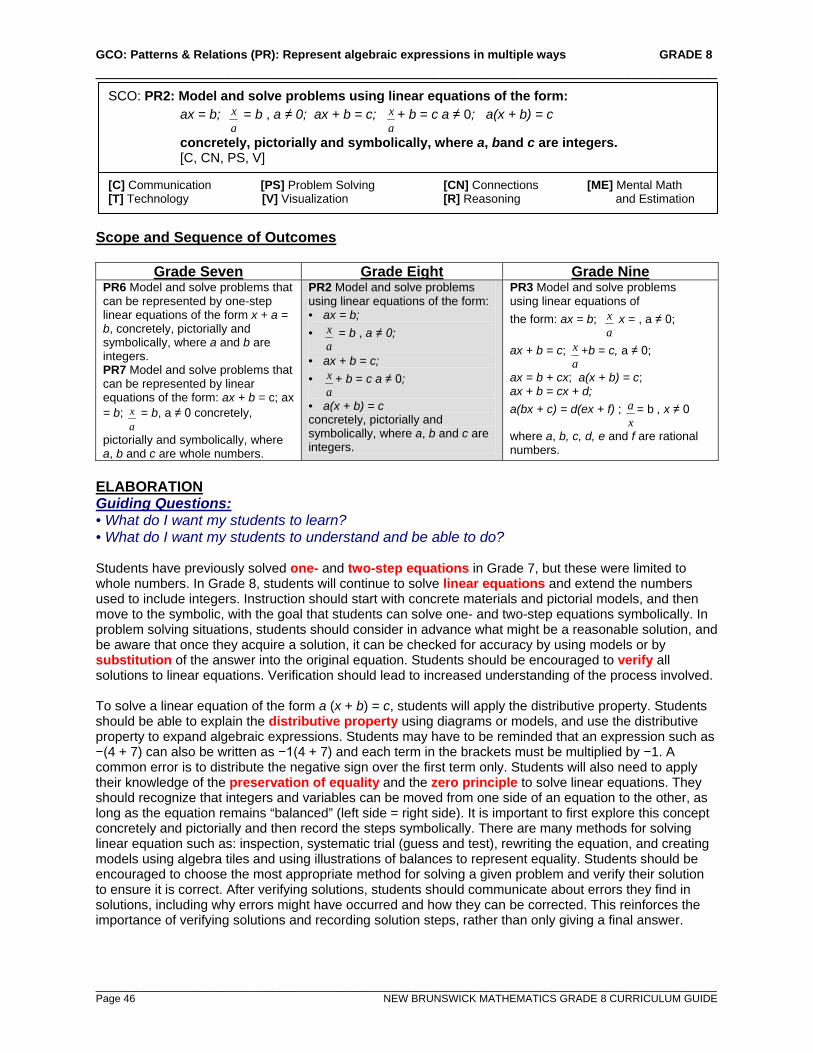
GCO: Patterns & Relations (PR): Represent algebraic expressions in multiple ways GRADE 8 ______________________________________________________________________
_________________________________________________________________________________________________________ Page 46 NEW BRUNSWICK MATHEMATICS GRADE 8 CURRICULUM GUIDE
Scope and Sequence of Outcomes
Grade Seven Grade Eight Grade Nine PR6 Model and solve problems that can be represented by one-step linear equations of the form x + a = b, concretely, pictorially and symbolically, where a and b are integers. PR7 Model and solve problems that can be represented by linear equations of the form: ax + b = c; ax = b;
ax = b, a ≠ 0 concretely,
pictorially and symbolically, where a, b and c are whole numbers.
PR2 Model and solve problems using linear equations of the form: • ax = b; •
ax = b , a ≠ 0;
• ax + b = c; •
ax + b = c a ≠ 0;
• a(x + b) = c concretely, pictorially and symbolically, where a, b and c are integers.
PR3 Model and solve problems using linear equations of the form: ax = b;
ax x = , a ≠ 0;
ax + b = c; ax +b = c, a ≠ 0;
ax = b + cx; a(x + b) = c; ax + b = cx + d; a(bx + c) = d(ex + f) ;
xa = b , x ≠ 0
where a, b, c, d, e and f are rational numbers.
ELABORATION Guiding Questions: • What do I want my students to learn? • What do I want my students to understand and be able to do? Students have previously solved one- and two-step equations in Grade 7, but these were limited to whole numbers. In Grade 8, students will continue to solve linear equations and extend the numbers used to include integers. Instruction should start with concrete materials and pictorial models, and then move to the symbolic, with the goal that students can solve one- and two-step equations symbolically. In problem solving situations, students should consider in advance what might be a reasonable solution, and be aware that once they acquire a solution, it can be checked for accuracy by using models or by substitution of the answer into the original equation. Students should be encouraged to verify all solutions to linear equations. Verification should lead to increased understanding of the process involved. To solve a linear equation of the form a (x + b) = c, students will apply the distributive property. Students should be able to explain the distributive property using diagrams or models, and use the distributive property to expand algebraic expressions. Students may have to be reminded that an expression such as −(4 + 7) can also be written as −1(4 + 7) and each term in the brackets must be multiplied by −1. A common error is to distribute the negative sign over the first term only. Students will also need to apply their knowledge of the preservation of equality and the zero principle to solve linear equations. They should recognize that integers and variables can be moved from one side of an equation to the other, as long as the equation remains “balanced” (left side = right side). It is important to first explore this concept concretely and pictorially and then record the steps symbolically. There are many methods for solving linear equation such as: inspection, systematic trial (guess and test), rewriting the equation, and creating models using algebra tiles and using illustrations of balances to represent equality. Students should be encouraged to choose the most appropriate method for solving a given problem and verify their solution to ensure it is correct. After verifying solutions, students should communicate about errors they find in solutions, including why errors might have occurred and how they can be corrected. This reinforces the importance of verifying solutions and recording solution steps, rather than only giving a final answer.
SCO: PR2: Model and solve problems using linear equations of the form: ax = b;
ax = b , a ≠ 0; ax + b = c;
ax + b = c a ≠ 0; a(x + b) = c
concretely, pictorially and symbolically, where a, band c are integers. [C, CN, PS, V]
[C] Communication [PS] Problem Solving [CN] Connections [ME] Mental Math [T] Technology [V] Visualization [R] Reasoning and Estimation
GCO: Patterns & Relations (PR): Represent algebraic expressions in multiple ways GRADE 8 ______________________________________________________________________
_________________________________________________________________________________________________________ NEW BRUNSWICK MATHEMATICS GRADE 8 CURRICULUM GUIDE Page 47
ACHIEVEMENT INDICATORS Guiding Questions: • What evidence will I look for to know that learning has occurred? • What should students demonstrate to show their understanding of the mathematical concepts
and skills? Use the following set of indicators as a guide to determine whether students have met the corresponding specific outcome. ° Model a given problem with a linear equation and solve the equation using concrete models, e.g.,
counters, integer tiles. ° Verify the solution to a given linear equation using a variety of methods, including concrete materials,
diagrams and substitution. Draw a visual representation of the steps used to solve a given linear equation and record each step symbolically.
° Solve a given linear equation symbolically. ° Identify and correct an error in a given incorrect solution of a linear equation. ° Apply the distributive property to solve a given linear equation, e.g., 2(x + 3) = 5; 2x + 6 = 5;… ° Solve a given problem using a linear equation and record the process.
SCO: PR2: Model and solve problems using linear equations of the form: ax = b;
ax = b , a ≠ 0; ax + b = c;
ax + b = c a ≠ 0; a(x + b) = c
concretely, pictorially and symbolically, where a, band c are integers. [C, CN, PS, V]
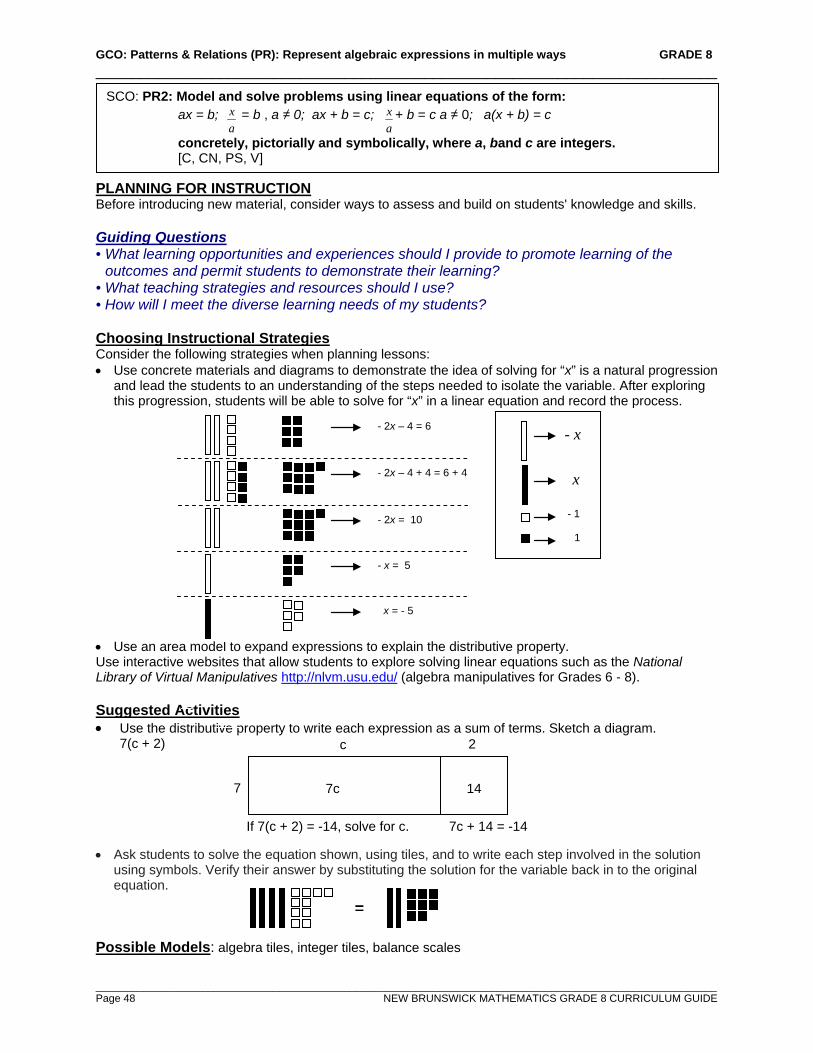
GCO: Patterns & Relations (PR): Represent algebraic expressions in multiple ways GRADE 8 ______________________________________________________________________
_________________________________________________________________________________________________________ Page 48 NEW BRUNSWICK MATHEMATICS GRADE 8 CURRICULUM GUIDE
PLANNING FOR INSTRUCTION Before introducing new material, consider ways to assess and build on students' knowledge and skills. Guiding Questions • What learning opportunities and experiences should I provide to promote learning of the
outcomes and permit students to demonstrate their learning? • What teaching strategies and resources should I use? • How will I meet the diverse learning needs of my students? Choosing Instructional Strategies Consider the following strategies when planning lessons: • Use concrete materials and diagrams to demonstrate the idea of solving for “x” is a natural progression
and lead the students to an understanding of the steps needed to isolate the variable. After exploring this progression, students will be able to solve for “x” in a linear equation and record the process.
• Use an area model to expand expressions to explain the distributive property. Use interactive websites that allow students to explore solving linear equations such as the National Library of Virtual Manipulatives http://nlvm.usu.edu/ (algebra manipulatives for Grades 6 - 8). Suggested Activities • Use the distributive property to write each expression as a sum of terms. Sketch a diagram.
7(c + 2)
• Ask students to solve the equation shown, using tiles, and to write each step involved in the solution using symbols. Verify their answer by substituting the solution for the variable back in to the original equation.
Possible Models: algebra tiles, integer tiles, balance scales
SCO: PR2: Model and solve problems using linear equations of the form: ax = b;
ax = b , a ≠ 0; ax + b = c;
ax + b = c a ≠ 0; a(x + b) = c
concretely, pictorially and symbolically, where a, band c are integers. [C, CN, PS, V]
- 2x – 4 = 6 - x
x
- 1
1
- 2x – 4 + 4 = 6 + 4
- 2x = 10
- x = 5
x = - 5
7c 14 7
c 2
=
If 7(c + 2) = -14, solve for c. 7c + 14 = -14
GCO: Patterns & Relations (PR): Represent algebraic expressions in multiple ways GRADE 8 ______________________________________________________________________
_________________________________________________________________________________________________________ NEW BRUNSWICK MATHEMATICS GRADE 8 CURRICULUM GUIDE Page 49
ASSESSMENT STRATEGIES Look back at what you determined as acceptable evidence. Guiding Questions • What are the most appropriate methods and activities for assessing student learning? • How will I align my assessment strategies with my teaching strategies? Assessment can and should happen every day as a part of instruction. A variety of approaches and contexts should be used for assessing all students: as a class, in groups, and individual students. Consider the following sample activities (that can be adapted) for either formative (for learning; as learning) or summative (of learning) assessment. Whole Class/Group/Individual Assessment • Solve the following problems. Write the equation, solve it and verify your answer.
a. The Grade 8 students had a dance. The disc jockey charged $150 for setting up the music plus $3.00 per student who attended the dance. The disc jockey was paid $375. How many students attended the dance?
b. The high temperature today is 6 C higher than twice the high temperature yesterday. The high temperature toady is 12 C. What was the high temperature yesterday?
• Tell students that Kim used the distributive property to solve the following equation: 12(x – 3) = 72. Check her work to see if her solution is correct. If there is an error, correct it.
12(x – 3) = 72 12x – 36 = 72 12x – 36 – 36 = 72 – 36 12x = 36
1212 x =
1236
x = 3 • Ask students which of the following produces the smallest value for d?
a. 7d = 42 b. 5d = -2 c. 3d + 4 = -5 d.
4d + 12 = 36 e. 5(d + 4) = -15
• Solve the following problem. Some cows and some chickens live on a farm. If the total number of legs is 38, and the total number of heads is 16, use algebra to find how many cows and how many chickens live on the farm. (Hint: If there are x cows, there are 16 – x chickens.)
• Have students explain each step in this solution to the equation 16 + 5m = 6. Step 1: 16 −16 + 5m = 6 −16 Step 2: 5m = −10 Step 3: m = −2
Verify that the solution m = −2 is correct.
FOLLOW-UP ON ASSESSMENT Guiding Questions • What conclusions can be made from assessment information? • How effective have instructional approaches been? • What are the next steps in instruction?
SCO: PR2: Model and solve problems using linear equations of the form: ax = b;
ax = b , a ≠ 0; ax + b = c;
ax + b = c a ≠ 0; a(x + b) = c
concretely, pictorially and symbolically, where a, band c are integers. [C, CN, PS, V]
GCO: Shape & Space (SS): Use direct and indirect measurement to solve problems GRADE 8 ______________________________________________________________________
_________________________________________________________________________________________________________ Page 50 NEW BRUNSWICK MATHEMATICS GRADE 8 CURRICULUM GUIDE
Scope and Sequence of Outcomes
Grade Seven Grade Eight Grade Nine SS2 Develop and apply a formula for determining the area of: parallelograms; triangles; circles.
SS1 Develop and apply the Pythagorean theorem to solve problems.
.
ELABORATION Guiding Questions: • What do I want my students to learn? • What do I want my students to understand and be able to do? Pythagoras of Samos, c. 560-c.480 BC, was a Greek philosopher who is credited with providing the first proof of the Pythagorean theorem, also known as the Pythagorean relationship. It states that the area of the square on the hypotenuse is equal to the sum of the areas of the squares on the other two sides. The conventional formula for the Pythagorean relationship, c2= a2 + b2, should be developed through investigations. It is also important for students to recognize that the Pythagorean relationship can be labelled differently from the conventional a, b, c. The hypotenuse, or the longest side, is c and two shorter sides, or legs, are a and b. A Pythagorean triple is any set of three whole numbers a, b, and c, for which a2 + b2 = c2. It is believed that the Egyptians and other ancient cultures used a 3–4–5 rule (a = 3, b = 4, c = 5) in construction to ensure buildings were square. The 3–4–5 rule allowed them a quick method of establishing a right angle. This is still used today in construction. In presenting diagrams of right triangles, it is important to use triangles in various orientations. Students should recognize the hypotenuse as being the side opposite the right angle, regardless of the orientation of the figure. Whenever a triangle has a right angle and two known side lengths, the Pythagorean relationship should be recognized by students. Students should be given experiences with side lengths of triangles that do not make right angle triangles. Students should also be provided with experiences that involve finding the length of the hypotenuse, as well as situations where the hypotenuse and one side is known and the other side is to be found. Finally, students should be able to use the Pythagorean relationship to determine whether three side lengths could be the sides of a right triangle. Students should be to reach the understanding that if the Pythagorean theorem works for a given triangle, then it is a right triangle. There are many opportunities to use the Pythagorean relationship to solve other problems, such as determining the height of a building, finding the shortest distance across a rectangular field and the size of television screens and monitors which are measured diagonally, and determining how high a ladder will reach. Students need to be provided with opportunities to model and explain the Pythagorean theorem concretely, pictorially, and symbolically. - Concretely – cutting up areas represented by a2 and b2 and fitting the two areas onto c2. - Pictorially – using grid paper or technology. - Symbolically – confirming through calculations that a2 + b2 = c2 form a right triangle.
SCO: SS1: Develop and apply the Pythagorean theorem to solve problems. [CN, PS, R, T, V]
[C] Communication [PS] Problem Solving [CN] Connections [ME] Mental Math [T] Technology [V] Visualization [R] Reasoning and Estimation
GCO: Shape & Space (SS): Use direct and indirect measurement to solve problems GRADE 8 ______________________________________________________________________
_________________________________________________________________________________________________________ NEW BRUNSWICK MATHEMATICS GRADE 8 CURRICULUM GUIDE Page 51
ACHIEVEMENT INDICATORS Guiding Questions: • What evidence will I look for to know that learning has occurred? • What should students demonstrate to show their understanding of the mathematical concepts
and skills? Use the following set of indicators as a guide to determine whether students have met the corresponding specific outcome. ° Model and explain the Pythagorean theorem concretely, pictorially or using technology, and
symbolically. ° Explain, using examples, that the Pythagorean theorem applies only to right triangles. ° Determine whether or not a given triangle is a right triangle by applying the Pythagorean theorem. ° Determine the measure of the third side of a right triangle, given the measures of the other two sides,
to solve a given problem. ° Solve a given problem that involves Pythagorean triples, e.g., 3, 4, 5 or 5, 12, 13.
SCO: SS1: Develop and apply the Pythagorean theorem to solve problems. [CN, PS, R, T, V]
GCO: Shape & Space (SS): Use direct and indirect measurement to solve problems GRADE 8 ______________________________________________________________________
_________________________________________________________________________________________________________ Page 52 NEW BRUNSWICK MATHEMATICS GRADE 8 CURRICULUM GUIDE
PLANNING FOR INSTRUCTION Before introducing new material, consider ways to assess and build on students' knowledge and skills. Guiding Questions • What learning opportunities and experiences should I provide to promote learning of the
outcomes and permit students to demonstrate their learning? • What teaching strategies and resources should I use? • How will I meet the diverse learning needs of my students? Choosing Instructional Strategies Consider the following strategies when planning lessons: • Use concrete materials, such as geoboards, grid paper, dot paper, tangrams, etc., to establish the
relationship between the hypotenuse and legs of a right triangle. • Provide students with a variety of problems that involve finding the hypotenuse, finding the measure of
a missing side, and determining whether a triangle is a right triangle by applying the theorem. • Use online models to explore other proofs, such as, NCTM’s Illuminations: Proof Without Words
Applet -- http://illuminations.nctm.org/Activities.aspx?grade=3. Suggested Activities • Give or have students draw a variety of right triangles which have whole number sides, such as the
3 cm-4 cm-5 cm triangle, the 6 cm-8 cm-10 cm triangle, or the 5 cm-12 cm-13 cm triangle. Have students cut out squares from centimetre grid paper so the sides of each square are the same as the side lengths for each triangle. Place the squares on the sides of the triangle as shown. Find the area of each square. Ask students what they notice. The Pythagorean relationship can be further explored using sets of tangrams and geoboards.
• Use a grid on which the diagonals of each square in the grid are drawn to explore the Pythagorean
relationship. Students can select any triangle in the grid and find squares on the two shorter sides and a square on the hypotenuse.
• Use dot paper or geoboards and make squares of area 1 square unit, 4 square units, 5 square units, 9
square units, and 10 square units. Use the diagram below, which shows squares of 2 square units and of 8 square units, to help.
• Explore Pythagorean triples such as 3, 4, 5. Multiply each number by 2. Determine whether the resulting three numbers form a Pythagorean triple. Explore by multiplying by other whole numbers. Is there any whole number that does not make a Pythagorean triple when 3, 4, 5 are multiplied by it?
Possible Models: geoboards, tangrams, triangular dot paper or diagonal grid paper, Geometer’s Sketchpad, grid paper, Cuisenaire rods®, colour tiles
SCO: SS1: Develop and apply the Pythagorean theorem to solve problems. [CN, PS, R, T, V]
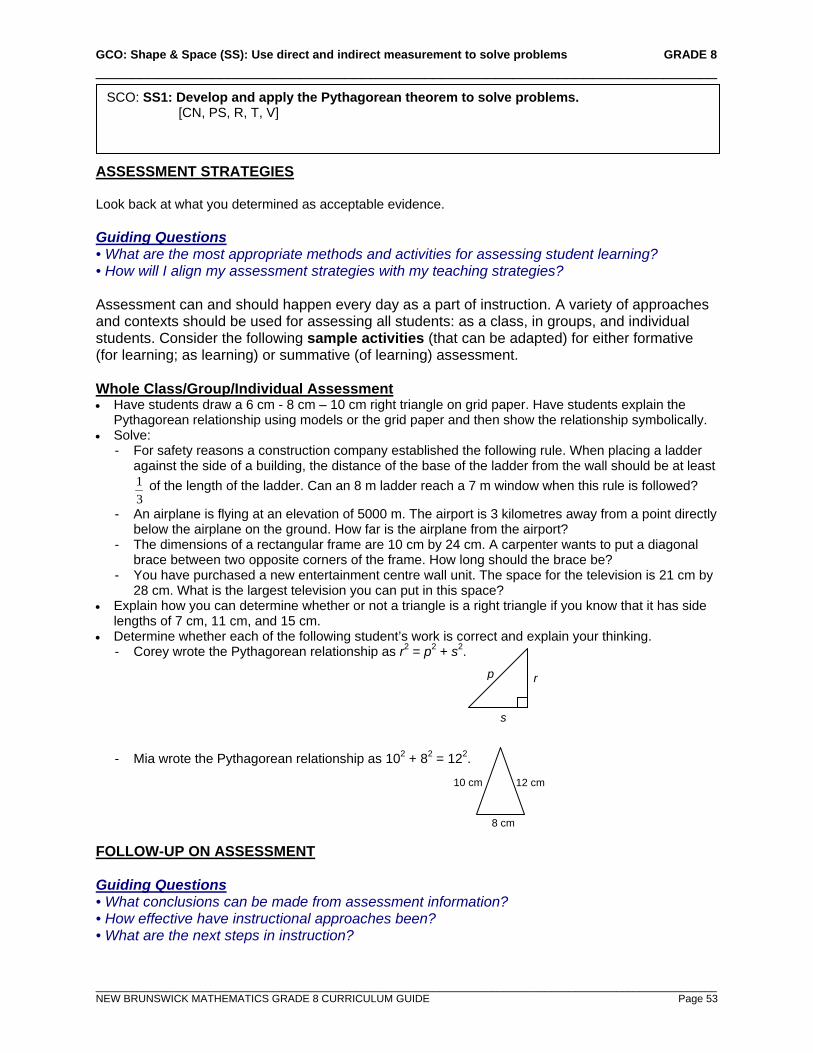
GCO: Shape & Space (SS): Use direct and indirect measurement to solve problems GRADE 8 ______________________________________________________________________
_________________________________________________________________________________________________________ NEW BRUNSWICK MATHEMATICS GRADE 8 CURRICULUM GUIDE Page 53
ASSESSMENT STRATEGIES Look back at what you determined as acceptable evidence. Guiding Questions • What are the most appropriate methods and activities for assessing student learning? • How will I align my assessment strategies with my teaching strategies? Assessment can and should happen every day as a part of instruction. A variety of approaches and contexts should be used for assessing all students: as a class, in groups, and individual students. Consider the following sample activities (that can be adapted) for either formative (for learning; as learning) or summative (of learning) assessment. Whole Class/Group/Individual Assessment • Have students draw a 6 cm - 8 cm – 10 cm right triangle on grid paper. Have students explain the
Pythagorean relationship using models or the grid paper and then show the relationship symbolically. • Solve:
- For safety reasons a construction company established the following rule. When placing a ladder against the side of a building, the distance of the base of the ladder from the wall should be at least
31 of the length of the ladder. Can an 8 m ladder reach a 7 m window when this rule is followed?
- An airplane is flying at an elevation of 5000 m. The airport is 3 kilometres away from a point directly below the airplane on the ground. How far is the airplane from the airport?
- The dimensions of a rectangular frame are 10 cm by 24 cm. A carpenter wants to put a diagonal brace between two opposite corners of the frame. How long should the brace be?
- You have purchased a new entertainment centre wall unit. The space for the television is 21 cm by 28 cm. What is the largest television you can put in this space?
• Explain how you can determine whether or not a triangle is a right triangle if you know that it has side lengths of 7 cm, 11 cm, and 15 cm.
• Determine whether each of the following student’s work is correct and explain your thinking. - Corey wrote the Pythagorean relationship as r2 = p2 + s2.
- Mia wrote the Pythagorean relationship as 102 + 82 = 122.
FOLLOW-UP ON ASSESSMENT Guiding Questions • What conclusions can be made from assessment information? • How effective have instructional approaches been? • What are the next steps in instruction?
SCO: SS1: Develop and apply the Pythagorean theorem to solve problems. [CN, PS, R, T, V]
r p
s
10 cm 12 cm
8 cm
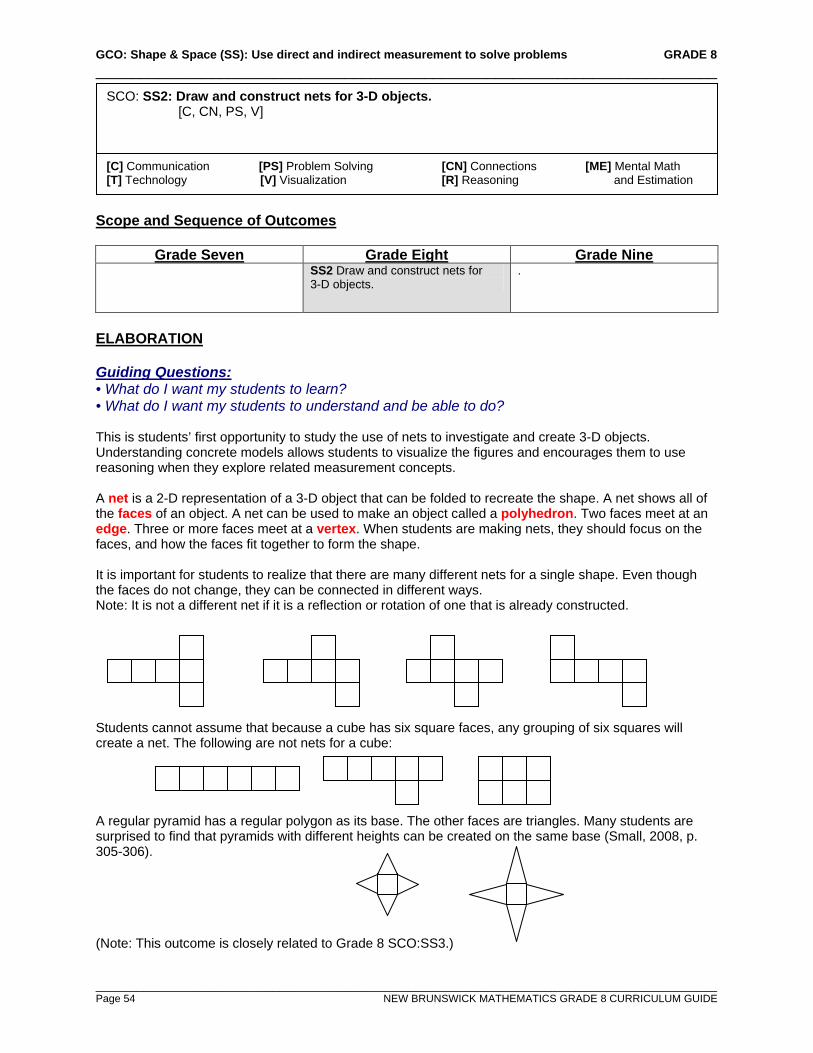
GCO: Shape & Space (SS): Use direct and indirect measurement to solve problems GRADE 8 ______________________________________________________________________
_________________________________________________________________________________________________________ Page 54 NEW BRUNSWICK MATHEMATICS GRADE 8 CURRICULUM GUIDE
Scope and Sequence of Outcomes
Grade Seven Grade Eight Grade Nine SS2 Draw and construct nets for
3-D objects. .
ELABORATION Guiding Questions: • What do I want my students to learn? • What do I want my students to understand and be able to do? This is students’ first opportunity to study the use of nets to investigate and create 3-D objects. Understanding concrete models allows students to visualize the figures and encourages them to use reasoning when they explore related measurement concepts. A net is a 2-D representation of a 3-D object that can be folded to recreate the shape. A net shows all of the faces of an object. A net can be used to make an object called a polyhedron. Two faces meet at an edge. Three or more faces meet at a vertex. When students are making nets, they should focus on the faces, and how the faces fit together to form the shape. It is important for students to realize that there are many different nets for a single shape. Even though the faces do not change, they can be connected in different ways. Note: It is not a different net if it is a reflection or rotation of one that is already constructed. Students cannot assume that because a cube has six square faces, any grouping of six squares will create a net. The following are not nets for a cube:
A regular pyramid has a regular polygon as its base. The other faces are triangles. Many students are surprised to find that pyramids with different heights can be created on the same base (Small, 2008, p. 305-306). (Note: This outcome is closely related to Grade 8 SCO:SS3.)
SCO: SS2: Draw and construct nets for 3-D objects. [C, CN, PS, V]
[C] Communication [PS] Problem Solving [CN] Connections [ME] Mental Math [T] Technology [V] Visualization [R] Reasoning and Estimation
GCO: Shape & Space (SS): Use direct and indirect measurement to solve problems GRADE 8 ______________________________________________________________________
_________________________________________________________________________________________________________ NEW BRUNSWICK MATHEMATICS GRADE 8 CURRICULUM GUIDE Page 55
ACHIEVEMENT INDICATORS Guiding Questions: • What evidence will I look for to know that learning has occurred? • What should students demonstrate to show their understanding of the mathematical concepts
and skills? Use the following set of indicators as a guide to determine whether students have met the corresponding specific outcome. ° Match a given net to the 3-D object it represents. ° Construct a 3-D object from a given net. ° Draw nets for a given right circular cylinder, right rectangular prism and right triangular prism, and
verify by constructing the 3-D objects from the nets. ° Predict 3-D objects that can be created from a given net and verify the prediction.
SCO: SS2: Draw and construct nets for 3-D objects. [C, CN, PS, V]
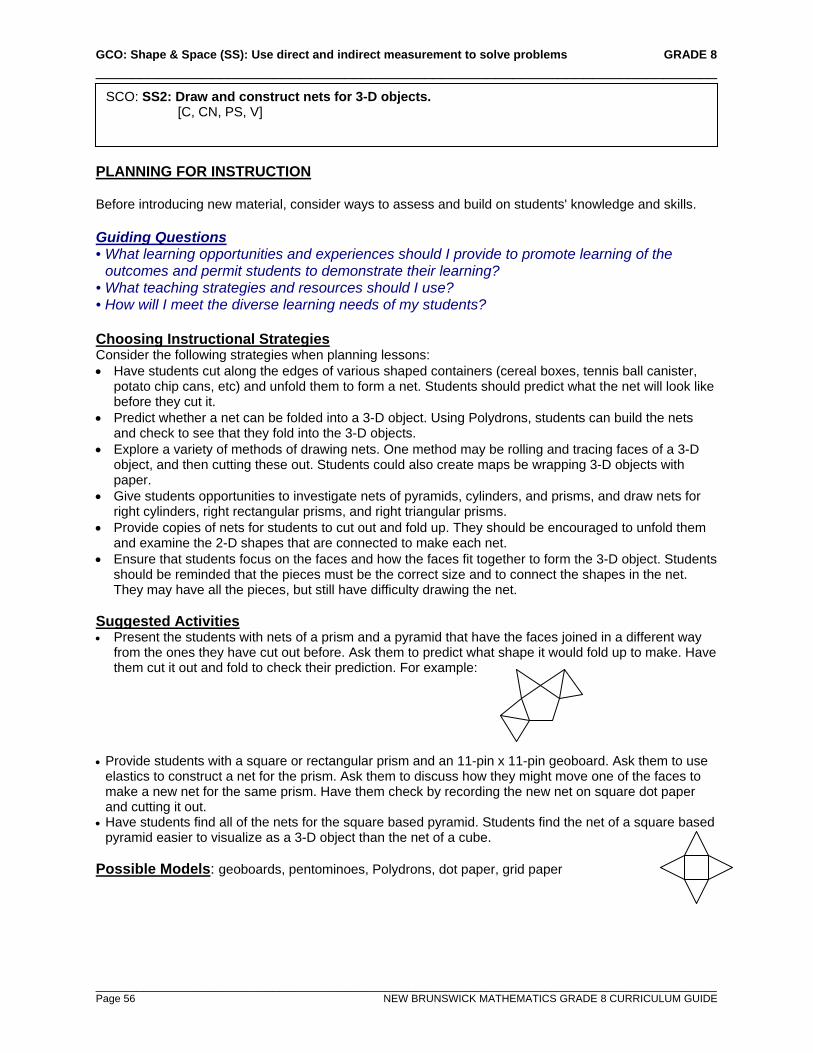
GCO: Shape & Space (SS): Use direct and indirect measurement to solve problems GRADE 8 ______________________________________________________________________
_________________________________________________________________________________________________________ Page 56 NEW BRUNSWICK MATHEMATICS GRADE 8 CURRICULUM GUIDE
PLANNING FOR INSTRUCTION Before introducing new material, consider ways to assess and build on students' knowledge and skills. Guiding Questions • What learning opportunities and experiences should I provide to promote learning of the
outcomes and permit students to demonstrate their learning? • What teaching strategies and resources should I use? • How will I meet the diverse learning needs of my students? Choosing Instructional Strategies Consider the following strategies when planning lessons: • Have students cut along the edges of various shaped containers (cereal boxes, tennis ball canister,
potato chip cans, etc) and unfold them to form a net. Students should predict what the net will look like before they cut it.
• Predict whether a net can be folded into a 3-D object. Using Polydrons, students can build the nets and check to see that they fold into the 3-D objects.
• Explore a variety of methods of drawing nets. One method may be rolling and tracing faces of a 3-D object, and then cutting these out. Students could also create maps be wrapping 3-D objects with paper.
• Give students opportunities to investigate nets of pyramids, cylinders, and prisms, and draw nets for right cylinders, right rectangular prisms, and right triangular prisms.
• Provide copies of nets for students to cut out and fold up. They should be encouraged to unfold them and examine the 2-D shapes that are connected to make each net.
• Ensure that students focus on the faces and how the faces fit together to form the 3-D object. Students should be reminded that the pieces must be the correct size and to connect the shapes in the net. They may have all the pieces, but still have difficulty drawing the net.
Suggested Activities • Present the students with nets of a prism and a pyramid that have the faces joined in a different way
from the ones they have cut out before. Ask them to predict what shape it would fold up to make. Have them cut it out and fold to check their prediction. For example:
• Provide students with a square or rectangular prism and an 11-pin x 11-pin geoboard. Ask them to use
elastics to construct a net for the prism. Ask them to discuss how they might move one of the faces to make a new net for the same prism. Have them check by recording the new net on square dot paper and cutting it out.
• Have students find all of the nets for the square based pyramid. Students find the net of a square based pyramid easier to visualize as a 3-D object than the net of a cube.
Possible Models: geoboards, pentominoes, Polydrons, dot paper, grid paper
SCO: SS2: Draw and construct nets for 3-D objects. [C, CN, PS, V]
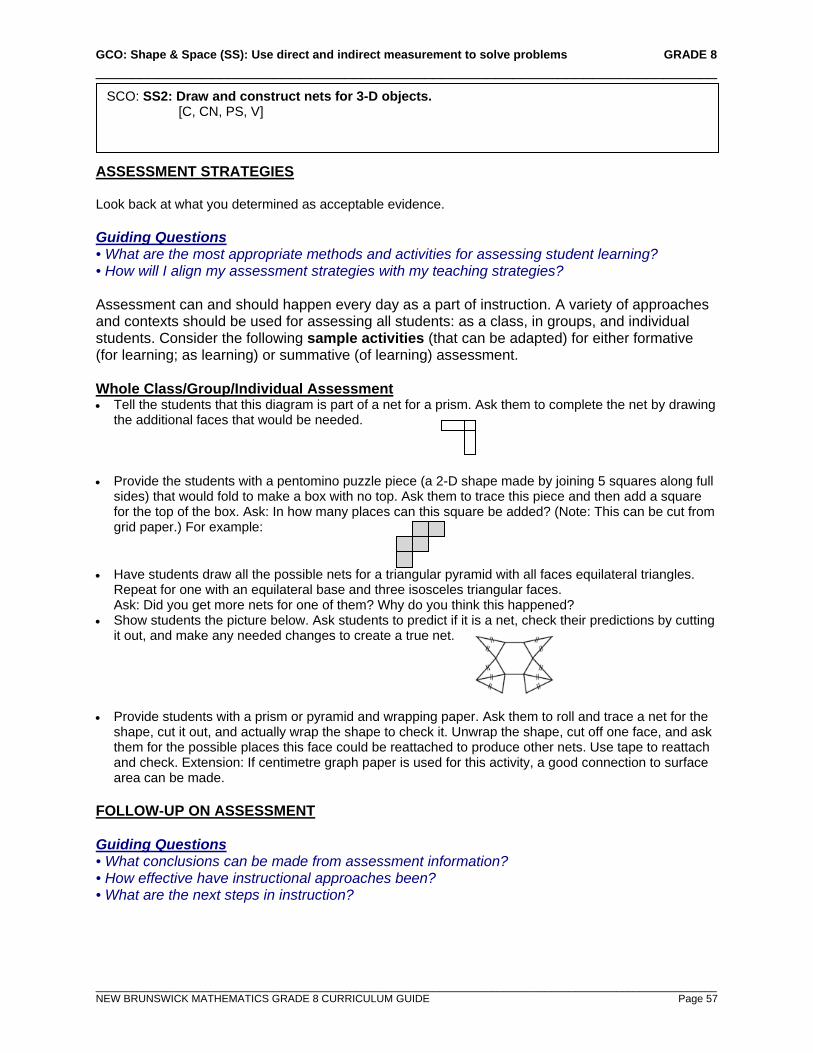
GCO: Shape & Space (SS): Use direct and indirect measurement to solve problems GRADE 8 ______________________________________________________________________
_________________________________________________________________________________________________________ NEW BRUNSWICK MATHEMATICS GRADE 8 CURRICULUM GUIDE Page 57
ASSESSMENT STRATEGIES Look back at what you determined as acceptable evidence. Guiding Questions • What are the most appropriate methods and activities for assessing student learning? • How will I align my assessment strategies with my teaching strategies? Assessment can and should happen every day as a part of instruction. A variety of approaches and contexts should be used for assessing all students: as a class, in groups, and individual students. Consider the following sample activities (that can be adapted) for either formative (for learning; as learning) or summative (of learning) assessment. Whole Class/Group/Individual Assessment • Tell the students that this diagram is part of a net for a prism. Ask them to complete the net by drawing
the additional faces that would be needed. • Provide the students with a pentomino puzzle piece (a 2-D shape made by joining 5 squares along full
sides) that would fold to make a box with no top. Ask them to trace this piece and then add a square for the top of the box. Ask: In how many places can this square be added? (Note: This can be cut from grid paper.) For example:
• Have students draw all the possible nets for a triangular pyramid with all faces equilateral triangles.
Repeat for one with an equilateral base and three isosceles triangular faces. Ask: Did you get more nets for one of them? Why do you think this happened?
• Show students the picture below. Ask students to predict if it is a net, check their predictions by cutting it out, and make any needed changes to create a true net.
• Provide students with a prism or pyramid and wrapping paper. Ask them to roll and trace a net for the
shape, cut it out, and actually wrap the shape to check it. Unwrap the shape, cut off one face, and ask them for the possible places this face could be reattached to produce other nets. Use tape to reattach and check. Extension: If centimetre graph paper is used for this activity, a good connection to surface area can be made.
FOLLOW-UP ON ASSESSMENT Guiding Questions • What conclusions can be made from assessment information? • How effective have instructional approaches been? • What are the next steps in instruction?
SCO: SS2: Draw and construct nets for 3-D objects. [C, CN, PS, V]
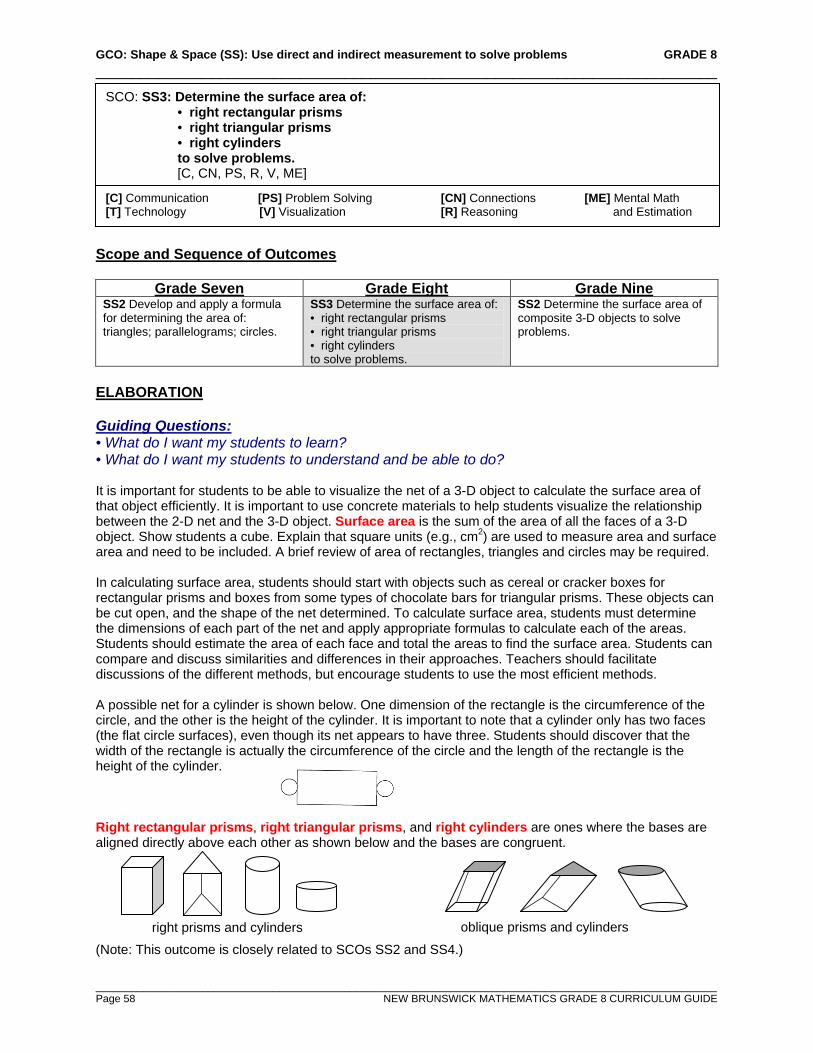
GCO: Shape & Space (SS): Use direct and indirect measurement to solve problems GRADE 8 ______________________________________________________________________
_________________________________________________________________________________________________________ Page 58 NEW BRUNSWICK MATHEMATICS GRADE 8 CURRICULUM GUIDE
Scope and Sequence of Outcomes
Grade Seven Grade Eight Grade Nine SS2 Develop and apply a formula for determining the area of: triangles; parallelograms; circles.
SS3 Determine the surface area of: • right rectangular prisms • right triangular prisms • right cylinders to solve problems.
SS2 Determine the surface area of composite 3-D objects to solve problems.
ELABORATION Guiding Questions: • What do I want my students to learn? • What do I want my students to understand and be able to do? It is important for students to be able to visualize the net of a 3-D object to calculate the surface area of that object efficiently. It is important to use concrete materials to help students visualize the relationship between the 2-D net and the 3-D object. Surface area is the sum of the area of all the faces of a 3-D object. Show students a cube. Explain that square units (e.g., cm2) are used to measure area and surface area and need to be included. A brief review of area of rectangles, triangles and circles may be required. In calculating surface area, students should start with objects such as cereal or cracker boxes for rectangular prisms and boxes from some types of chocolate bars for triangular prisms. These objects can be cut open, and the shape of the net determined. To calculate surface area, students must determine the dimensions of each part of the net and apply appropriate formulas to calculate each of the areas. Students should estimate the area of each face and total the areas to find the surface area. Students can compare and discuss similarities and differences in their approaches. Teachers should facilitate discussions of the different methods, but encourage students to use the most efficient methods. A possible net for a cylinder is shown below. One dimension of the rectangle is the circumference of the circle, and the other is the height of the cylinder. It is important to note that a cylinder only has two faces (the flat circle surfaces), even though its net appears to have three. Students should discover that the width of the rectangle is actually the circumference of the circle and the length of the rectangle is the height of the cylinder. Right rectangular prisms, right triangular prisms, and right cylinders are ones where the bases are aligned directly above each other as shown below and the bases are congruent. (Note: This outcome is closely related to SCOs SS2 and SS4.)
SCO: SS3: Determine the surface area of: • right rectangular prisms • right triangular prisms • right cylinders to solve problems. [C, CN, PS, R, V, ME]
[C] Communication [PS] Problem Solving [CN] Connections [ME] Mental Math [T] Technology [V] Visualization [R] Reasoning and Estimation
right prisms and cylinders oblique prisms and cylinders
GCO: Shape & Space (SS): Use direct and indirect measurement to solve problems GRADE 8 ______________________________________________________________________
_________________________________________________________________________________________________________ NEW BRUNSWICK MATHEMATICS GRADE 8 CURRICULUM GUIDE Page 59
ACHIEVEMENT INDICATORS Guiding Questions: • What evidence will I look for to know that learning has occurred? • What should students demonstrate to show their understanding of the mathematical concepts
and skills? Use the following set of indicators as a guide to determine whether students have met the corresponding specific outcome. ° Explain, using examples, the relationship between the area of 2-D shapes and the surface area of a
given 3-D object. ° Identify all the faces of a given cylinder and prism, including right rectangular and right triangular
prisms. ° Describe and apply strategies for determining the surface area of a given right rectangular or right
triangular prism. ° Describe and apply strategies for determining the surface area of a given right cylinder. ° Solve a given problem involving surface area.
SCO: SS3: Determine the surface area of: • right rectangular prisms • right triangular prisms • right cylinders to solve problems. [C, CN, PS, R, V, ME]

GCO: Shape & Space (SS): Use direct and indirect measurement to solve problems GRADE 8 ______________________________________________________________________
_________________________________________________________________________________________________________ Page 60 NEW BRUNSWICK MATHEMATICS GRADE 8 CURRICULUM GUIDE
PLANNING FOR INSTRUCTION Before introducing new material, consider ways to assess and build on students' knowledge and skills. Guiding Questions • What learning opportunities and experiences should I provide to promote learning of the
outcomes and permit students to demonstrate their learning? • What teaching strategies and resources should I use? • How will I meet the diverse learning needs of my students? Choosing Instructional Strategies Consider the following strategies when planning lessons: • Provide paper copies of nets for students who are having difficulty visualizing the parts of a 3-D object,
for them to cut and fold or use Polydrons. • Allow students to use Polydrons to find all of the possible nets for a given 3-D object. • Use a variety of different shapes of boxes and containers for cutting and calculating surface area. • Allow students the opportunity to roll an object and trace on grid paper. • Provide students with the opportunity to build rectangular prisms from cube-a-links and determine the
number of squares needed to cover the prism. • Encourage students to estimate the surface area before calculating the exact answer to check the
reasonableness of their calculations. • Discuss with students why surface area is an important consideration for companies when they are
deciding on the shape and sizes of their packages. Suggested Activities • Tell students that the owners of a cracker factory are trying to choose a box to hold their new flavour of
cracker. They want a box that uses the least amount of cardboard. Which box should they choose? Provide students with grid paper and calculators to work through the problem.
• Have students work through problems where they have to explain how two cylinders can have the
same height, but different surface areas. • Have students explore which of the twelve pentominoes could fold to make an “open” box. Why is the
surface area the same for all of the boxes? • Ask students to explain how calculating the surface area of a cylinder and calculating the surface area
for a prism are alike and how are they different. • Use the following question as a more challenging problem that can be worked on as a class and
should be used after students have had some experience with the outcome. A cylindrical CD case has surface area of 225.0 cm2. Each CD is 0.1 cm thick and 11.0 cm in diameter. How many CDs can the case hold? Explain, with the help of formulas, what you did to solve the problem.
Possible Models: grid paper, linking cubes, boxes of various shapes and sizes, Polydrons, paper templates for folding
SCO: SS3: Determine the surface area of: • right rectangular prisms • right triangular prisms • right cylinders to solve problems. [C, CN, PS, R, V, ME]
8 cm
13 cm 5 cm 8.5 cm
d = 2 cm
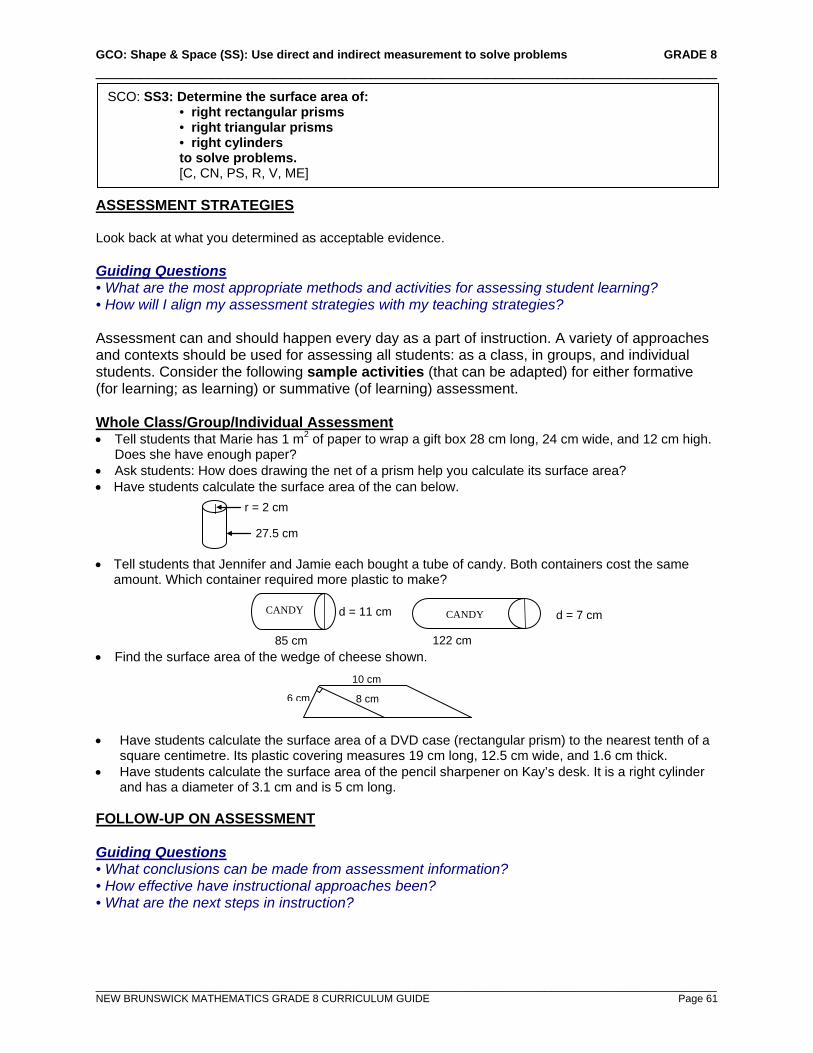
GCO: Shape & Space (SS): Use direct and indirect measurement to solve problems GRADE 8 ______________________________________________________________________
_________________________________________________________________________________________________________ NEW BRUNSWICK MATHEMATICS GRADE 8 CURRICULUM GUIDE Page 61
ASSESSMENT STRATEGIES Look back at what you determined as acceptable evidence. Guiding Questions • What are the most appropriate methods and activities for assessing student learning? • How will I align my assessment strategies with my teaching strategies? Assessment can and should happen every day as a part of instruction. A variety of approaches and contexts should be used for assessing all students: as a class, in groups, and individual students. Consider the following sample activities (that can be adapted) for either formative (for learning; as learning) or summative (of learning) assessment. Whole Class/Group/Individual Assessment • Tell students that Marie has 1 m2 of paper to wrap a gift box 28 cm long, 24 cm wide, and 12 cm high.
Does she have enough paper? • Ask students: How does drawing the net of a prism help you calculate its surface area? • Have students calculate the surface area of the can below.
• Tell students that Jennifer and Jamie each bought a tube of candy. Both containers cost the same amount. Which container required more plastic to make?
• Find the surface area of the wedge of cheese shown.
• Have students calculate the surface area of a DVD case (rectangular prism) to the nearest tenth of a square centimetre. Its plastic covering measures 19 cm long, 12.5 cm wide, and 1.6 cm thick.
• Have students calculate the surface area of the pencil sharpener on Kay’s desk. It is a right cylinder and has a diameter of 3.1 cm and is 5 cm long.
FOLLOW-UP ON ASSESSMENT Guiding Questions • What conclusions can be made from assessment information? • How effective have instructional approaches been? • What are the next steps in instruction?
SCO: SS3: Determine the surface area of: • right rectangular prisms • right triangular prisms • right cylinders to solve problems. [C, CN, PS, R, V, ME]
CANDY
85 cm
d = 11 cm CANDY d = 7 cm
122 cm
6 cm 8 cm
10 cm
r = 2 cm
27.5 cm
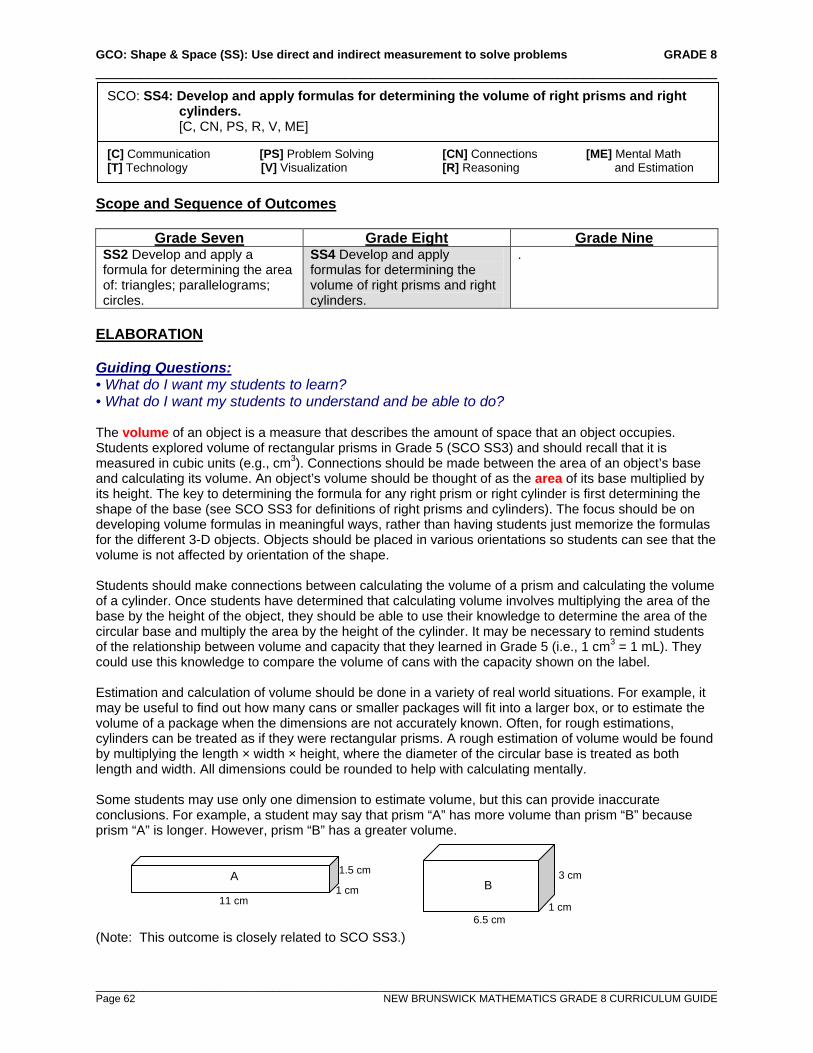
GCO: Shape & Space (SS): Use direct and indirect measurement to solve problems GRADE 8 ______________________________________________________________________
_________________________________________________________________________________________________________ Page 62 NEW BRUNSWICK MATHEMATICS GRADE 8 CURRICULUM GUIDE
Scope and Sequence of Outcomes
Grade Seven Grade Eight Grade Nine SS2 Develop and apply a formula for determining the area of: triangles; parallelograms; circles.
SS4 Develop and apply formulas for determining the volume of right prisms and right cylinders.
.
ELABORATION Guiding Questions: • What do I want my students to learn? • What do I want my students to understand and be able to do? The volume of an object is a measure that describes the amount of space that an object occupies. Students explored volume of rectangular prisms in Grade 5 (SCO SS3) and should recall that it is measured in cubic units (e.g., cm3). Connections should be made between the area of an object’s base and calculating its volume. An object’s volume should be thought of as the area of its base multiplied by its height. The key to determining the formula for any right prism or right cylinder is first determining the shape of the base (see SCO SS3 for definitions of right prisms and cylinders). The focus should be on developing volume formulas in meaningful ways, rather than having students just memorize the formulas for the different 3-D objects. Objects should be placed in various orientations so students can see that the volume is not affected by orientation of the shape. Students should make connections between calculating the volume of a prism and calculating the volume of a cylinder. Once students have determined that calculating volume involves multiplying the area of the base by the height of the object, they should be able to use their knowledge to determine the area of the circular base and multiply the area by the height of the cylinder. It may be necessary to remind students of the relationship between volume and capacity that they learned in Grade 5 (i.e., 1 cm3 = 1 mL). They could use this knowledge to compare the volume of cans with the capacity shown on the label. Estimation and calculation of volume should be done in a variety of real world situations. For example, it may be useful to find out how many cans or smaller packages will fit into a larger box, or to estimate the volume of a package when the dimensions are not accurately known. Often, for rough estimations, cylinders can be treated as if they were rectangular prisms. A rough estimation of volume would be found by multiplying the length × width × height, where the diameter of the circular base is treated as both length and width. All dimensions could be rounded to help with calculating mentally. Some students may use only one dimension to estimate volume, but this can provide inaccurate conclusions. For example, a student may say that prism “A” has more volume than prism “B” because prism “A” is longer. However, prism “B” has a greater volume. (Note: This outcome is closely related to SCO SS3.)
SCO: SS4: Develop and apply formulas for determining the volume of right prisms and right cylinders. [C, CN, PS, R, V, ME]
[C] Communication [PS] Problem Solving [CN] Connections [ME] Mental Math [T] Technology [V] Visualization [R] Reasoning and Estimation
A
11 cm 1 cm
1.5 cm B
6.5 cm
3 cm
1 cm
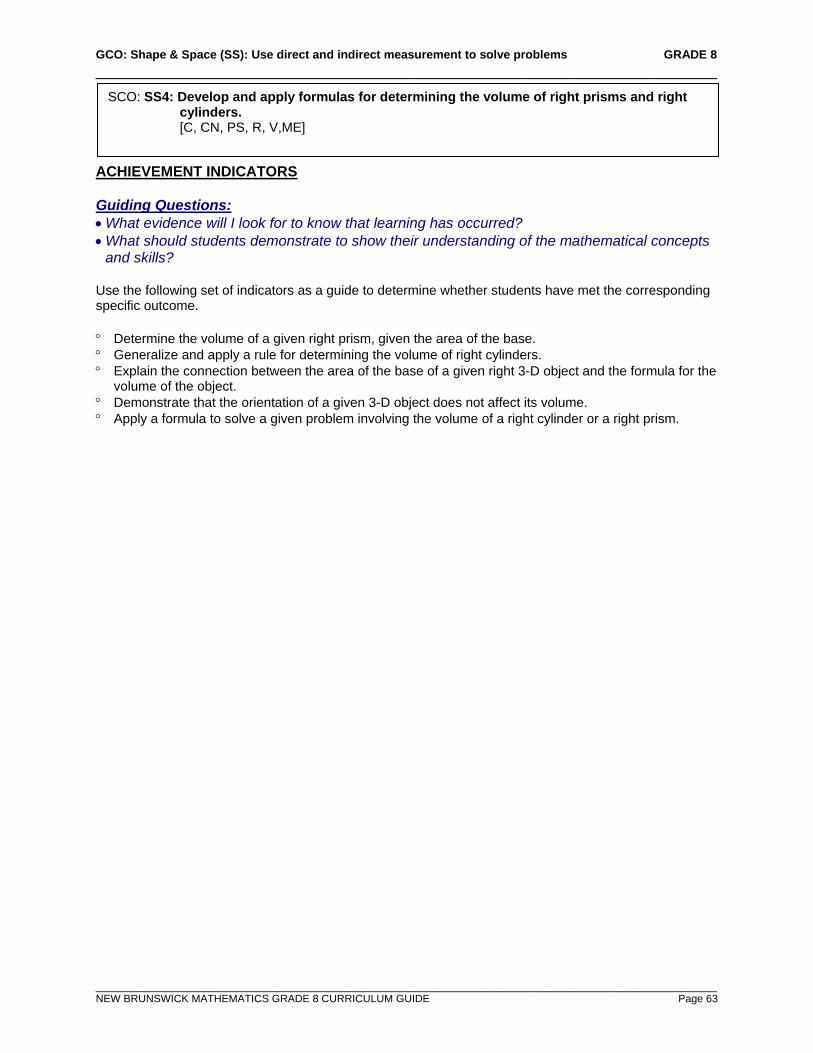
GCO: Shape & Space (SS): Use direct and indirect measurement to solve problems GRADE 8 ______________________________________________________________________
_________________________________________________________________________________________________________ NEW BRUNSWICK MATHEMATICS GRADE 8 CURRICULUM GUIDE Page 63
ACHIEVEMENT INDICATORS Guiding Questions: • What evidence will I look for to know that learning has occurred? • What should students demonstrate to show their understanding of the mathematical concepts
and skills? Use the following set of indicators as a guide to determine whether students have met the corresponding specific outcome. ° Determine the volume of a given right prism, given the area of the base. ° Generalize and apply a rule for determining the volume of right cylinders. ° Explain the connection between the area of the base of a given right 3-D object and the formula for the
volume of the object. ° Demonstrate that the orientation of a given 3-D object does not affect its volume. ° Apply a formula to solve a given problem involving the volume of a right cylinder or a right prism.
SCO: SS4: Develop and apply formulas for determining the volume of right prisms and right cylinders. [C, CN, PS, R, V,ME]
GCO: Shape & Space (SS): Use direct and indirect measurement to solve problems GRADE 8 ______________________________________________________________________
_________________________________________________________________________________________________________ Page 64 NEW BRUNSWICK MATHEMATICS GRADE 8 CURRICULUM GUIDE
PLANNING FOR INSTRUCTION Before introducing new material, consider ways to assess and build on students' knowledge and skills. Guiding Questions • What learning opportunities and experiences should I provide to promote learning of the
outcomes and permit students to demonstrate their learning? • What teaching strategies and resources should I use? • How will I meet the diverse learning needs of my students? Choosing Instructional Strategies Consider the following strategies when planning lessons: • Start discussions of volume using informal measurement methods, such as linking cubes. Show and
discuss the centimetre cube. Explain that just as square units are used to measure area and surface area, cubic units are used to measure volume.
• Have students use centimetre cubes (standard measurement) or linking cubes (non-standard measurement) to help them visualize the volume of solids.
• Bring in small boxes of various shapes and sizes and have students use centimetre cubes to determine the volume of each box.
• Provide students with relevant contexts for determining volume. Suggested Activities • Have students create open-topped boxes from a sheet of centimetre grid paper by cutting away
squares from the four corners and folding the sides up. Students can experiment to determine the dimensions of a box with the greatest volume given the same size grid paper. They will have to decide between flat, wide boxes, or tall, narrow boxes.
• Provide the students with linking cubes. Have students construct rectangular prisms with the following dimensions: 3 × 5 × 2 and 6 × 5 × 2. Have the students find the volume of each. Ask: How could you have anticipated that the second volume would be twice the first? How do you think a 6 × 5 × 4 prism would compare to one 3 × 5 × 2?
• Tell students that an aquarium has the following dimensions: length 80 cm, width 35 cm, height 50 cm. You must fill the aquarium up to 4 cm from the top. How much water will you put in the aquarium?
• Bring in various shaped boxes or cans. Determine how you can estimate and find the volume of these containers. What would be your formula?
• Tell students that a triangular prism has a volume of 128 cm3. Its height is 8 cm. What is the area of its base?
• Have students predict and explore whether the volume of the cylinder created by rolling a sheet of paper lengthwise or by its width will be the same volume or a different volume. If the volumes are different, which will have the greatest volume? Discuss why this would be an important fact for companies to know.
• Tell students that a tube of chocolate chip cookie dough has a volume of 785 cm3 and a diameter of 10 cm. Each cookie will be 1 cm thick. How many cookies can Nicole make? Explore this problem with a partner.
Possible Models: centimetre cubes (from base ten blocks or Cuisenaire rods®), linking cubes, grid paper, Polydrons, various shaped boxes and/or jars
SCO: SS4: Develop and apply formulas for determining the volume of right prisms and right cylinders. [C, CN, PS, R, V, ME]
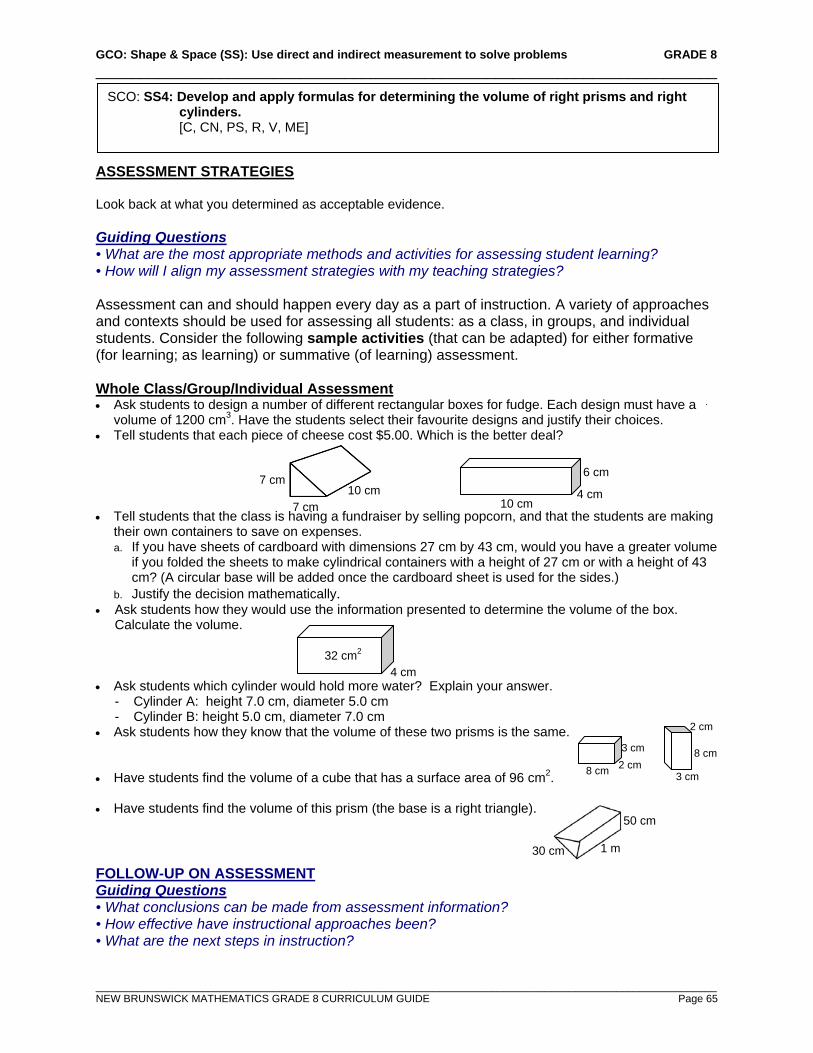
GCO: Shape & Space (SS): Use direct and indirect measurement to solve problems GRADE 8 ______________________________________________________________________
_________________________________________________________________________________________________________ NEW BRUNSWICK MATHEMATICS GRADE 8 CURRICULUM GUIDE Page 65
ASSESSMENT STRATEGIES Look back at what you determined as acceptable evidence. Guiding Questions • What are the most appropriate methods and activities for assessing student learning? • How will I align my assessment strategies with my teaching strategies? Assessment can and should happen every day as a part of instruction. A variety of approaches and contexts should be used for assessing all students: as a class, in groups, and individual students. Consider the following sample activities (that can be adapted) for either formative (for learning; as learning) or summative (of learning) assessment. Whole Class/Group/Individual Assessment • Ask students to design a number of different rectangular boxes for fudge. Each design must have a
volume of 1200 cm3. Have the students select their favourite designs and justify their choices. • Tell students that each piece of cheese cost $5.00. Which is the better deal?
• Tell students that the class is having a fundraiser by selling popcorn, and that the students are making their own containers to save on expenses. a. If you have sheets of cardboard with dimensions 27 cm by 43 cm, would you have a greater volume
if you folded the sheets to make cylindrical containers with a height of 27 cm or with a height of 43 cm? (A circular base will be added once the cardboard sheet is used for the sides.)
b. Justify the decision mathematically. • Ask students how they would use the information presented to determine the volume of the box.
Calculate the volume. • Ask students which cylinder would hold more water? Explain your answer.
- Cylinder A: height 7.0 cm, diameter 5.0 cm - Cylinder B: height 5.0 cm, diameter 7.0 cm
• Ask students how they know that the volume of these two prisms is the same. • Have students find the volume of a cube that has a surface area of 96 cm2. • Have students find the volume of this prism (the base is a right triangle).
FOLLOW-UP ON ASSESSMENT Guiding Questions • What conclusions can be made from assessment information? • How effective have instructional approaches been? • What are the next steps in instruction?
SCO: SS4: Develop and apply formulas for determining the volume of right prisms and right cylinders. [C, CN, PS, R, V, ME]
10 cm 7 cm
7 cm
32 cm2 4 cm
50 cm
30 cm 1 m
6 cm
4 cm 10 cm
8 cm 2 cm 3 cm 8 cm
2 cm
3 cm
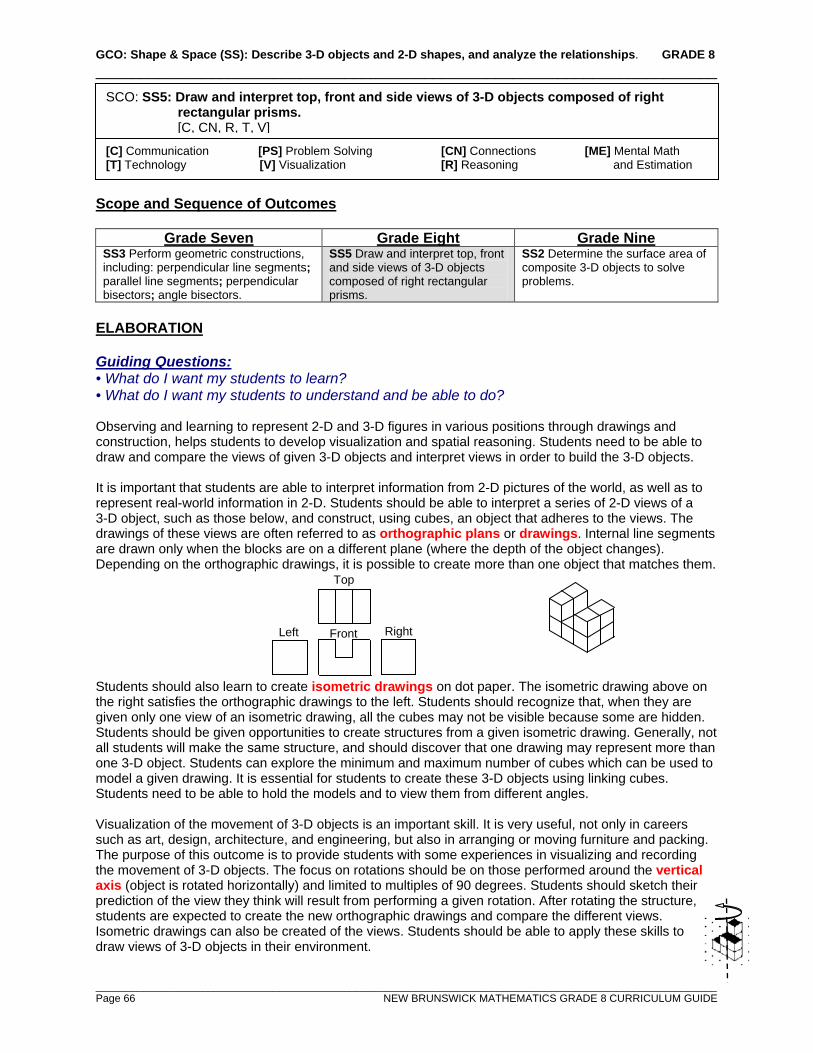
GCO: Shape & Space (SS): Describe 3-D objects and 2-D shapes, and analyze the relationships. GRADE 8 ______________________________________________________________________
_________________________________________________________________________________________________________ Page 66 NEW BRUNSWICK MATHEMATICS GRADE 8 CURRICULUM GUIDE
Scope and Sequence of Outcomes
Grade Seven Grade Eight Grade Nine SS3 Perform geometric constructions, including: perpendicular line segments; parallel line segments; perpendicular bisectors; angle bisectors.
SS5 Draw and interpret top, front and side views of 3-D objects composed of right rectangular prisms.
SS2 Determine the surface area of composite 3-D objects to solve problems.
ELABORATION Guiding Questions: • What do I want my students to learn? • What do I want my students to understand and be able to do? Observing and learning to represent 2-D and 3-D figures in various positions through drawings and construction, helps students to develop visualization and spatial reasoning. Students need to be able to draw and compare the views of given 3-D objects and interpret views in order to build the 3-D objects. It is important that students are able to interpret information from 2-D pictures of the world, as well as to represent real-world information in 2-D. Students should be able to interpret a series of 2-D views of a 3-D object, such as those below, and construct, using cubes, an object that adheres to the views. The drawings of these views are often referred to as orthographic plans or drawings. Internal line segments are drawn only when the blocks are on a different plane (where the depth of the object changes). Depending on the orthographic drawings, it is possible to create more than one object that matches them. Students should also learn to create isometric drawings on dot paper. The isometric drawing above on the right satisfies the orthographic drawings to the left. Students should recognize that, when they are given only one view of an isometric drawing, all the cubes may not be visible because some are hidden. Students should be given opportunities to create structures from a given isometric drawing. Generally, not all students will make the same structure, and should discover that one drawing may represent more than one 3-D object. Students can explore the minimum and maximum number of cubes which can be used to model a given drawing. It is essential for students to create these 3-D objects using linking cubes. Students need to be able to hold the models and to view them from different angles. Visualization of the movement of 3-D objects is an important skill. It is very useful, not only in careers such as art, design, architecture, and engineering, but also in arranging or moving furniture and packing. The purpose of this outcome is to provide students with some experiences in visualizing and recording the movement of 3-D objects. The focus on rotations should be on those performed around the vertical axis (object is rotated horizontally) and limited to multiples of 90 degrees. Students should sketch their prediction of the view they think will result from performing a given rotation. After rotating the structure, students are expected to create the new orthographic drawings and compare the different views. Isometric drawings can also be created of the views. Students should be able to apply these skills to draw views of 3-D objects in their environment.
SCO: SS5: Draw and interpret top, front and side views of 3-D objects composed of right rectangular prisms. [C, CN, R, T, V]
[C] Communication [PS] Problem Solving [CN] Connections [ME] Mental Math [T] Technology [V] Visualization [R] Reasoning and Estimation
Right
Top
Left Front

GCO: Shape & Space (SS): Describe 3-D objects and 2-D shapes, and analyze the relationships. GRADE 8 ______________________________________________________________________
_________________________________________________________________________________________________________ NEW BRUNSWICK MATHEMATICS GRADE 8 CURRICULUM GUIDE Page 67
ACHIEVEMENT INDICATORS Guiding Questions: • What evidence will I look for to know that learning has occurred? • What should students demonstrate to show their understanding of the mathematical concepts
and skills? Use the following set of indicators as a guide to determine whether students have met the corresponding specific outcome. ° Draw and label the top, front and side views for a given 3-D object on isometric dot paper. ° Draw and label a 3-D object on isometric dot paper given the top, front, and side views. ° Compare different views of a given 3-D object to the object. ° Predict the top, front and side views that will result from a described rotation (around the vertical axis
and limited to multiples of 90 degrees) and verify predictions. ° Draw and label the top, front and side views that result from a given rotation (around the vertical axis
and limited to multiples of 90 degrees). ° Build a 3-D block object, given the top, front and side views, with or without the use of technology. ° Sketch and label the top, front and side views of a 3-D object in the environment with or without the
use of technology.
SCO: SS5: Draw and interpret top, front and side views of 3-D objects composed of right rectangular prisms. [C, CN, R, T, V]
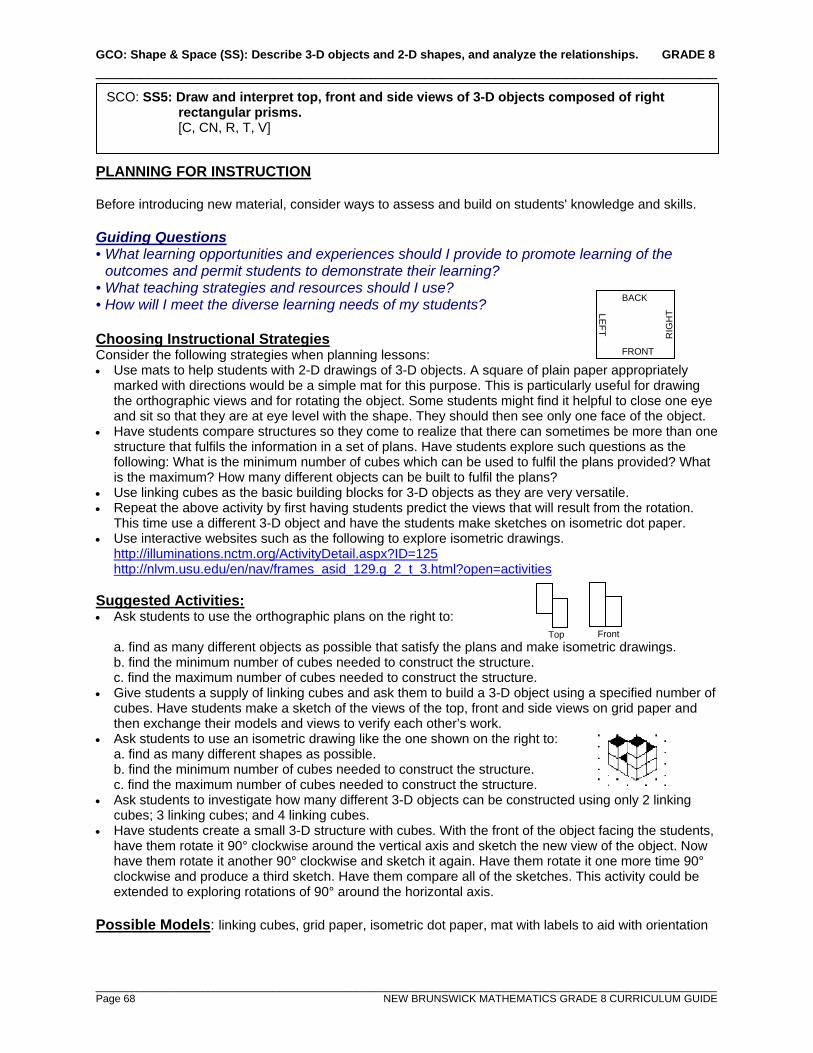
GCO: Shape & Space (SS): Describe 3-D objects and 2-D shapes, and analyze the relationships. GRADE 8 ______________________________________________________________________
_________________________________________________________________________________________________________ Page 68 NEW BRUNSWICK MATHEMATICS GRADE 8 CURRICULUM GUIDE
PLANNING FOR INSTRUCTION Before introducing new material, consider ways to assess and build on students' knowledge and skills. Guiding Questions • What learning opportunities and experiences should I provide to promote learning of the
outcomes and permit students to demonstrate their learning? • What teaching strategies and resources should I use? • How will I meet the diverse learning needs of my students? Choosing Instructional Strategies Consider the following strategies when planning lessons: • Use mats to help students with 2-D drawings of 3-D objects. A square of plain paper appropriately
marked with directions would be a simple mat for this purpose. This is particularly useful for drawing the orthographic views and for rotating the object. Some students might find it helpful to close one eye and sit so that they are at eye level with the shape. They should then see only one face of the object.
• Have students compare structures so they come to realize that there can sometimes be more than one structure that fulfils the information in a set of plans. Have students explore such questions as the following: What is the minimum number of cubes which can be used to fulfil the plans provided? What is the maximum? How many different objects can be built to fulfil the plans?
• Use linking cubes as the basic building blocks for 3-D objects as they are very versatile. • Repeat the above activity by first having students predict the views that will result from the rotation.
This time use a different 3-D object and have the students make sketches on isometric dot paper. • Use interactive websites such as the following to explore isometric drawings.
http://illuminations.nctm.org/ActivityDetail.aspx?ID=125 http://nlvm.usu.edu/en/nav/frames_asid_129.g_2_t_3.html?open=activities
Suggested Activities: • Ask students to use the orthographic plans on the right to:
a. find as many different objects as possible that satisfy the plans and make isometric drawings. b. find the minimum number of cubes needed to construct the structure. c. find the maximum number of cubes needed to construct the structure.
• Give students a supply of linking cubes and ask them to build a 3-D object using a specified number of cubes. Have students make a sketch of the views of the top, front and side views on grid paper and then exchange their models and views to verify each other’s work.
• Ask students to use an isometric drawing like the one shown on the right to: a. find as many different shapes as possible. b. find the minimum number of cubes needed to construct the structure. c. find the maximum number of cubes needed to construct the structure.
• Ask students to investigate how many different 3-D objects can be constructed using only 2 linking cubes; 3 linking cubes; and 4 linking cubes.
• Have students create a small 3-D structure with cubes. With the front of the object facing the students, have them rotate it 90° clockwise around the vertical axis and sketch the new view of the object. Now have them rotate it another 90° clockwise and sketch it again. Have them rotate it one more time 90° clockwise and produce a third sketch. Have them compare all of the sketches. This activity could be extended to exploring rotations of 90° around the horizontal axis.
Possible Models: linking cubes, grid paper, isometric dot paper, mat with labels to aid with orientation
SCO: SS5: Draw and interpret top, front and side views of 3-D objects composed of right rectangular prisms. [C, CN, R, T, V]
FRONT
RIG
HT LE
FT
BACK
Front Top
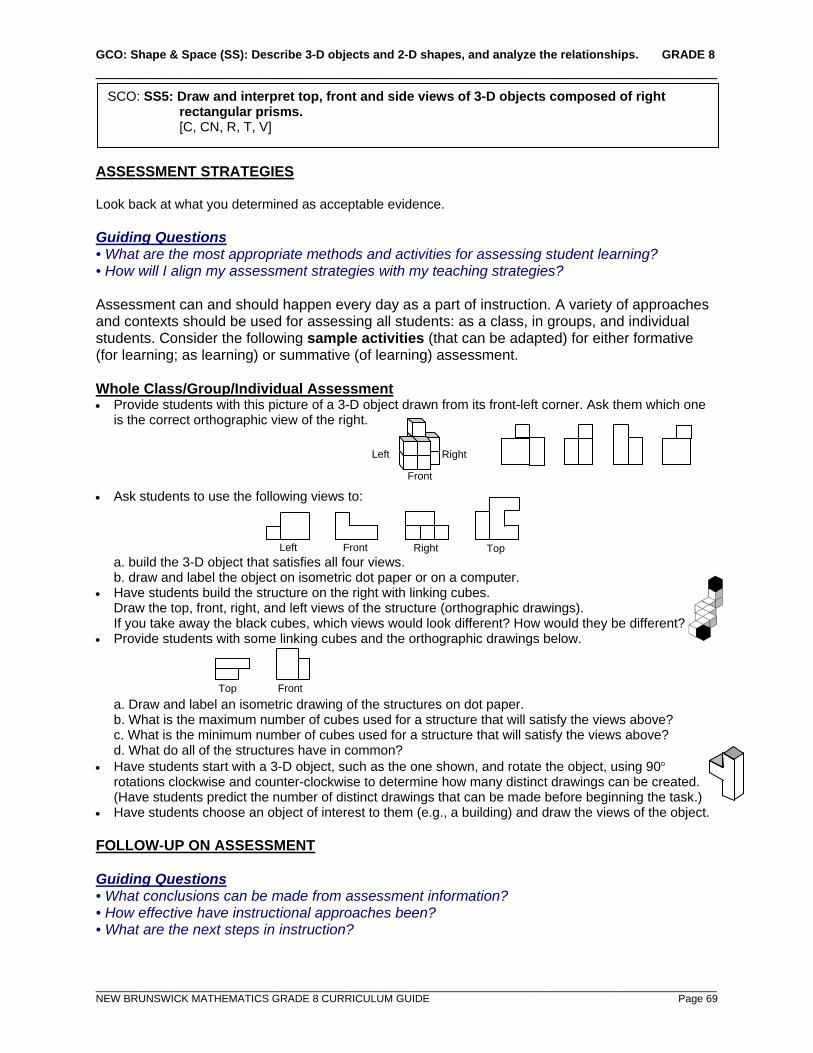
GCO: Shape & Space (SS): Describe 3-D objects and 2-D shapes, and analyze the relationships. GRADE 8 ______________________________________________________________________
_________________________________________________________________________________________________________ NEW BRUNSWICK MATHEMATICS GRADE 8 CURRICULUM GUIDE Page 69
ASSESSMENT STRATEGIES Look back at what you determined as acceptable evidence. Guiding Questions • What are the most appropriate methods and activities for assessing student learning? • How will I align my assessment strategies with my teaching strategies? Assessment can and should happen every day as a part of instruction. A variety of approaches and contexts should be used for assessing all students: as a class, in groups, and individual students. Consider the following sample activities (that can be adapted) for either formative (for learning; as learning) or summative (of learning) assessment. Whole Class/Group/Individual Assessment • Provide students with this picture of a 3-D object drawn from its front-left corner. Ask them which one
is the correct orthographic view of the right.
• Ask students to use the following views to:
a. build the 3-D object that satisfies all four views. b. draw and label the object on isometric dot paper or on a computer.
• Have students build the structure on the right with linking cubes. Draw the top, front, right, and left views of the structure (orthographic drawings). If you take away the black cubes, which views would look different? How would they be different?
• Provide students with some linking cubes and the orthographic drawings below.
a. Draw and label an isometric drawing of the structures on dot paper. b. What is the maximum number of cubes used for a structure that will satisfy the views above? c. What is the minimum number of cubes used for a structure that will satisfy the views above? d. What do all of the structures have in common?
• Have students start with a 3-D object, such as the one shown, and rotate the object, using 90° rotations clockwise and counter-clockwise to determine how many distinct drawings can be created. (Have students predict the number of distinct drawings that can be made before beginning the task.)
• Have students choose an object of interest to them (e.g., a building) and draw the views of the object. FOLLOW-UP ON ASSESSMENT Guiding Questions • What conclusions can be made from assessment information? • How effective have instructional approaches been? • What are the next steps in instruction?
SCO: SS5: Draw and interpret top, front and side views of 3-D objects composed of right rectangular prisms. [C, CN, R, T, V]
Front
Left Right
Front Top
Front Left Right Top
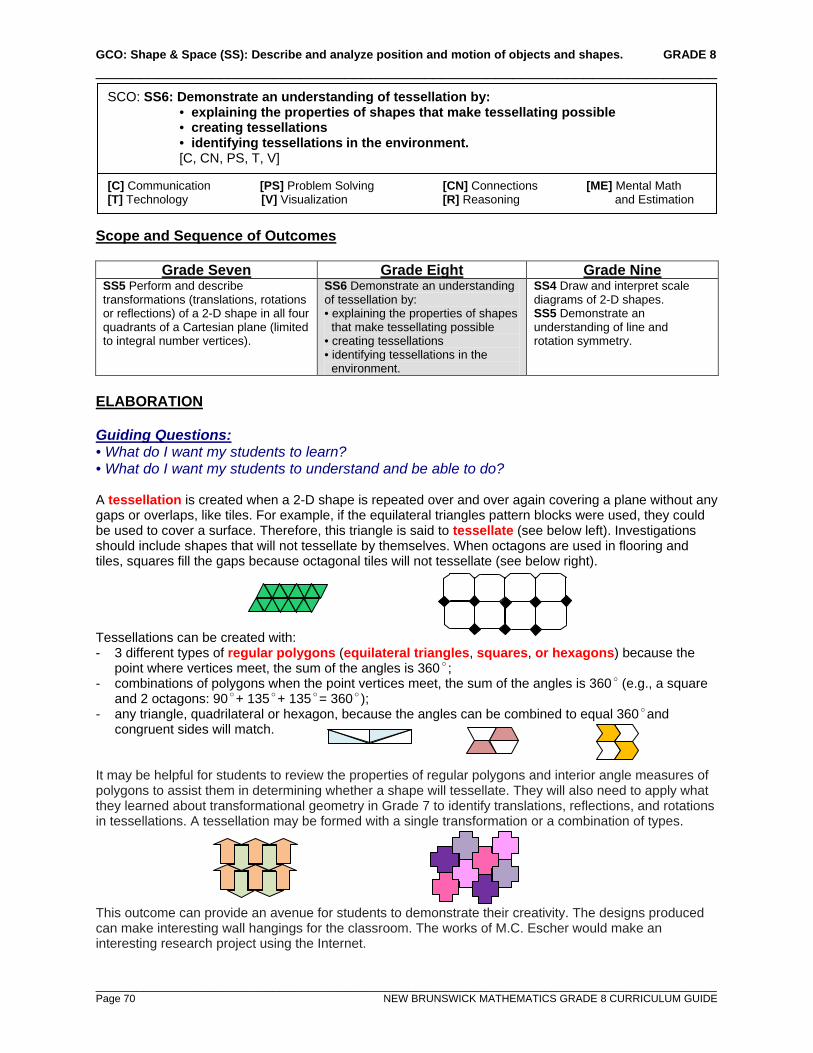
GCO: Shape & Space (SS): Describe and analyze position and motion of objects and shapes. GRADE 8 ______________________________________________________________________
_________________________________________________________________________________________________________ Page 70 NEW BRUNSWICK MATHEMATICS GRADE 8 CURRICULUM GUIDE
Scope and Sequence of Outcomes
Grade Seven Grade Eight Grade Nine SS5 Perform and describe transformations (translations, rotations or reflections) of a 2-D shape in all four quadrants of a Cartesian plane (limited to integral number vertices).
SS6 Demonstrate an understanding of tessellation by: • explaining the properties of shapes
that make tessellating possible • creating tessellations • identifying tessellations in the
environment.
SS4 Draw and interpret scale diagrams of 2-D shapes. SS5 Demonstrate an understanding of line and rotation symmetry.
ELABORATION Guiding Questions: • What do I want my students to learn? • What do I want my students to understand and be able to do? A tessellation is created when a 2-D shape is repeated over and over again covering a plane without any gaps or overlaps, like tiles. For example, if the equilateral triangles pattern blocks were used, they could be used to cover a surface. Therefore, this triangle is said to tessellate (see below left). Investigations should include shapes that will not tessellate by themselves. When octagons are used in flooring and tiles, squares fill the gaps because octagonal tiles will not tessellate (see below right). Tessellations can be created with: - 3 different types of regular polygons (equilateral triangles, squares, or hexagons) because the
point where vertices meet, the sum of the angles is 360; - combinations of polygons when the point vertices meet, the sum of the angles is 360 (e.g., a square
and 2 octagons: 90+ 135+ 135= 360); - any triangle, quadrilateral or hexagon, because the angles can be combined to equal 360and
congruent sides will match.
It may be helpful for students to review the properties of regular polygons and interior angle measures of polygons to assist them in determining whether a shape will tessellate. They will also need to apply what they learned about transformational geometry in Grade 7 to identify translations, reflections, and rotations in tessellations. A tessellation may be formed with a single transformation or a combination of types. This outcome can provide an avenue for students to demonstrate their creativity. The designs produced can make interesting wall hangings for the classroom. The works of M.C. Escher would make an interesting research project using the Internet.
SCO: SS6: Demonstrate an understanding of tessellation by: • explaining the properties of shapes that make tessellating possible • creating tessellations • identifying tessellations in the environment. [C, CN, PS, T, V]
[C] Communication [PS] Problem Solving [CN] Connections [ME] Mental Math [T] Technology [V] Visualization [R] Reasoning and Estimation
GCO: Shape & Space (SS): Describe and analyze position and motion of objects and shapes. GRADE 8 ______________________________________________________________________
_________________________________________________________________________________________________________ NEW BRUNSWICK MATHEMATICS GRADE 8 CURRICULUM GUIDE Page 71
ACHIEVEMENT INDICATORS Guiding Questions: • What evidence will I look for to know that learning has occurred? • What should students demonstrate to show their understanding of the mathematical concepts
and skills? Use the following set of indicators as a guide to determine whether students have met the corresponding specific outcome. ° Identify, in a given set of regular polygons, those shapes and combinations of shapes that will
tessellate, and use angle measurements to justify choices, e.g., squares, regular n-gons. ° Identify, in a given set of irregular polygons, those shapes and combinations of shapes that will
tessellate, and use angle measurements to justify choices. ° Identify a translation, reflection or rotation in a given tessellation. ° Identify a combination of transformations in a given tessellation. ° Create a tessellation using one or more 2-D shapes, and describe the tessellation in terms of
transformations and conservation of area. ° Create a new tessellating shape (polygon or non-polygon) by transforming a portion of a given
tessellating polygon, e.g., one by M. C. Escher, and describe the resulting tessellation in terms of transformations and conservation of area.
° Identify and describe tessellations in the environment.
SCO: SS6: Demonstrate an understanding of tessellation by: • explaining the properties of shapes that make tessellating possible • creating tessellations • identifying tessellations in the environment. [C, CN, PS, T, V]
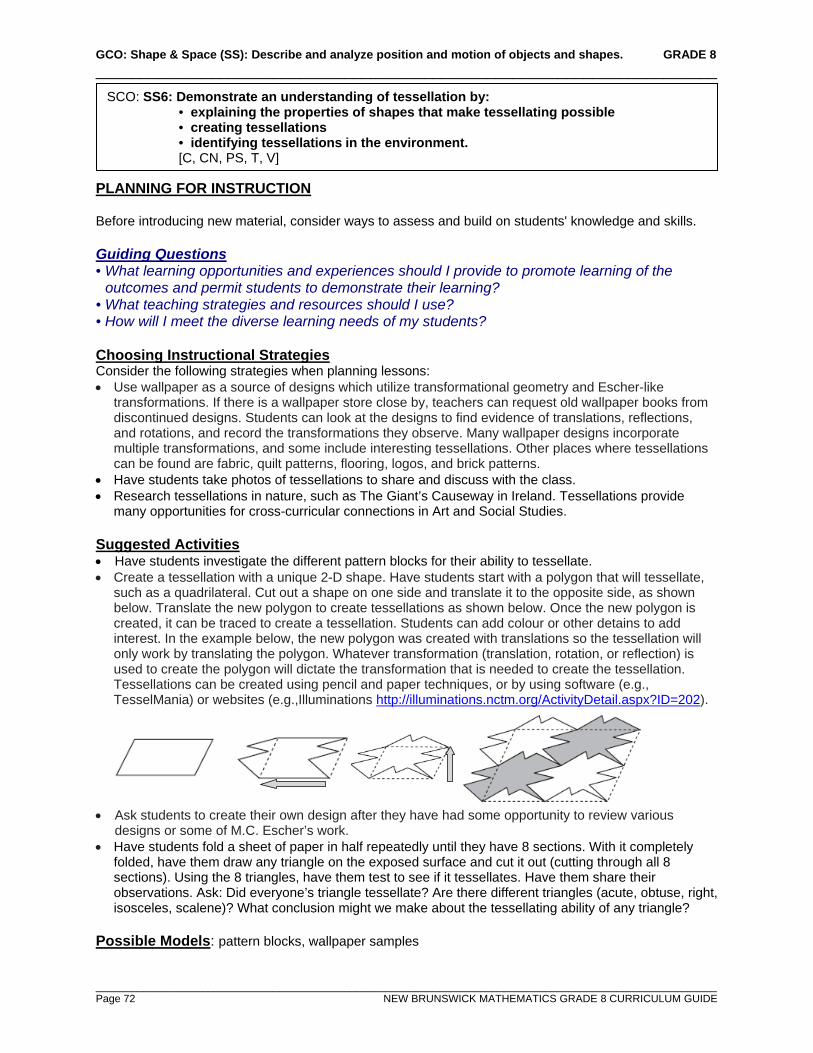
GCO: Shape & Space (SS): Describe and analyze position and motion of objects and shapes. GRADE 8 ______________________________________________________________________
_________________________________________________________________________________________________________ Page 72 NEW BRUNSWICK MATHEMATICS GRADE 8 CURRICULUM GUIDE
PLANNING FOR INSTRUCTION Before introducing new material, consider ways to assess and build on students' knowledge and skills. Guiding Questions • What learning opportunities and experiences should I provide to promote learning of the
outcomes and permit students to demonstrate their learning? • What teaching strategies and resources should I use? • How will I meet the diverse learning needs of my students? Choosing Instructional Strategies Consider the following strategies when planning lessons: • Use wallpaper as a source of designs which utilize transformational geometry and Escher-like
transformations. If there is a wallpaper store close by, teachers can request old wallpaper books from discontinued designs. Students can look at the designs to find evidence of translations, reflections, and rotations, and record the transformations they observe. Many wallpaper designs incorporate multiple transformations, and some include interesting tessellations. Other places where tessellations can be found are fabric, quilt patterns, flooring, logos, and brick patterns.
• Have students take photos of tessellations to share and discuss with the class. • Research tessellations in nature, such as The Giant’s Causeway in Ireland. Tessellations provide
many opportunities for cross-curricular connections in Art and Social Studies. Suggested Activities • Have students investigate the different pattern blocks for their ability to tessellate. • Create a tessellation with a unique 2-D shape. Have students start with a polygon that will tessellate,
such as a quadrilateral. Cut out a shape on one side and translate it to the opposite side, as shown below. Translate the new polygon to create tessellations as shown below. Once the new polygon is created, it can be traced to create a tessellation. Students can add colour or other detains to add interest. In the example below, the new polygon was created with translations so the tessellation will only work by translating the polygon. Whatever transformation (translation, rotation, or reflection) is used to create the polygon will dictate the transformation that is needed to create the tessellation. Tessellations can be created using pencil and paper techniques, or by using software (e.g., TesselMania) or websites (e.g.,Illuminations http://illuminations.nctm.org/ActivityDetail.aspx?ID=202).
• Ask students to create their own design after they have had some opportunity to review various
designs or some of M.C. Escher’s work. • Have students fold a sheet of paper in half repeatedly until they have 8 sections. With it completely
folded, have them draw any triangle on the exposed surface and cut it out (cutting through all 8 sections). Using the 8 triangles, have them test to see if it tessellates. Have them share their observations. Ask: Did everyone’s triangle tessellate? Are there different triangles (acute, obtuse, right, isosceles, scalene)? What conclusion might we make about the tessellating ability of any triangle?
Possible Models: pattern blocks, wallpaper samples
SCO: SS6: Demonstrate an understanding of tessellation by: • explaining the properties of shapes that make tessellating possible • creating tessellations • identifying tessellations in the environment. [C, CN, PS, T, V]
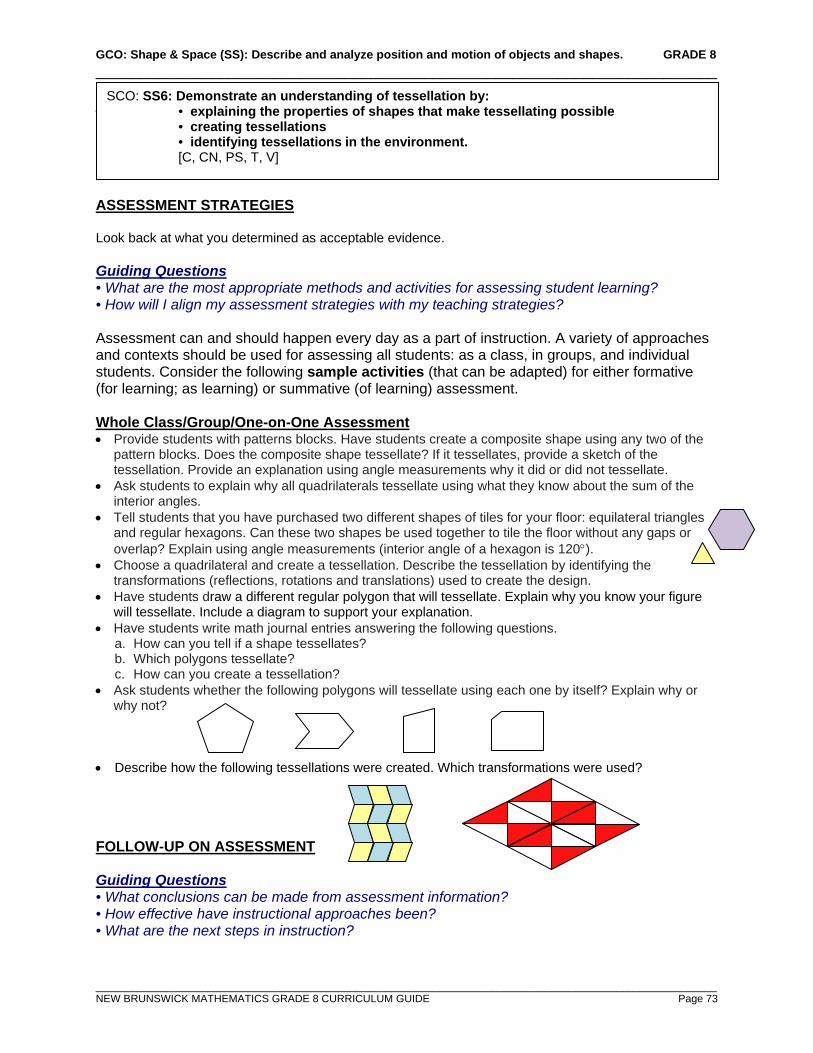
GCO: Shape & Space (SS): Describe and analyze position and motion of objects and shapes. GRADE 8 ______________________________________________________________________
_________________________________________________________________________________________________________ NEW BRUNSWICK MATHEMATICS GRADE 8 CURRICULUM GUIDE Page 73
ASSE ASSESSMENT STRATEGIES Look back at what you determined as acceptable evidence. Guiding Questions • What are the most appropriate methods and activities for assessing student learning? • How will I align my assessment strategies with my teaching strategies? Assessment can and should happen every day as a part of instruction. A variety of approaches and contexts should be used for assessing all students: as a class, in groups, and individual students. Consider the following sample activities (that can be adapted) for either formative (for learning; as learning) or summative (of learning) assessment. Whole Class/Group/One-on-One Assessment • Provide students with patterns blocks. Have students create a composite shape using any two of the
pattern blocks. Does the composite shape tessellate? If it tessellates, provide a sketch of the tessellation. Provide an explanation using angle measurements why it did or did not tessellate.
• Ask students to explain why all quadrilaterals tessellate using what they know about the sum of the interior angles.
• Tell students that you have purchased two different shapes of tiles for your floor: equilateral triangles and regular hexagons. Can these two shapes be used together to tile the floor without any gaps or overlap? Explain using angle measurements (interior angle of a hexagon is 120°).
• Choose a quadrilateral and create a tessellation. Describe the tessellation by identifying the transformations (reflections, rotations and translations) used to create the design.
• Have students draw a different regular polygon that will tessellate. Explain why you know your figure will tessellate. Include a diagram to support your explanation.
• Have students write math journal entries answering the following questions. a. How can you tell if a shape tessellates? b. Which polygons tessellate? c. How can you create a tessellation?
• Ask students whether the following polygons will tessellate using each one by itself? Explain why or why not?
• Describe how the following tessellations were created. Which transformations were used? FOLLOW-UP ON ASSESSMENT Guiding Questions • What conclusions can be made from assessment information? • How effective have instructional approaches been? • What are the next steps in instruction?
SCO: SS6: Demonstrate an understanding of tessellation by: • explaining the properties of shapes that make tessellating possible • creating tessellations • identifying tessellations in the environment. [C, CN, PS, T, V]
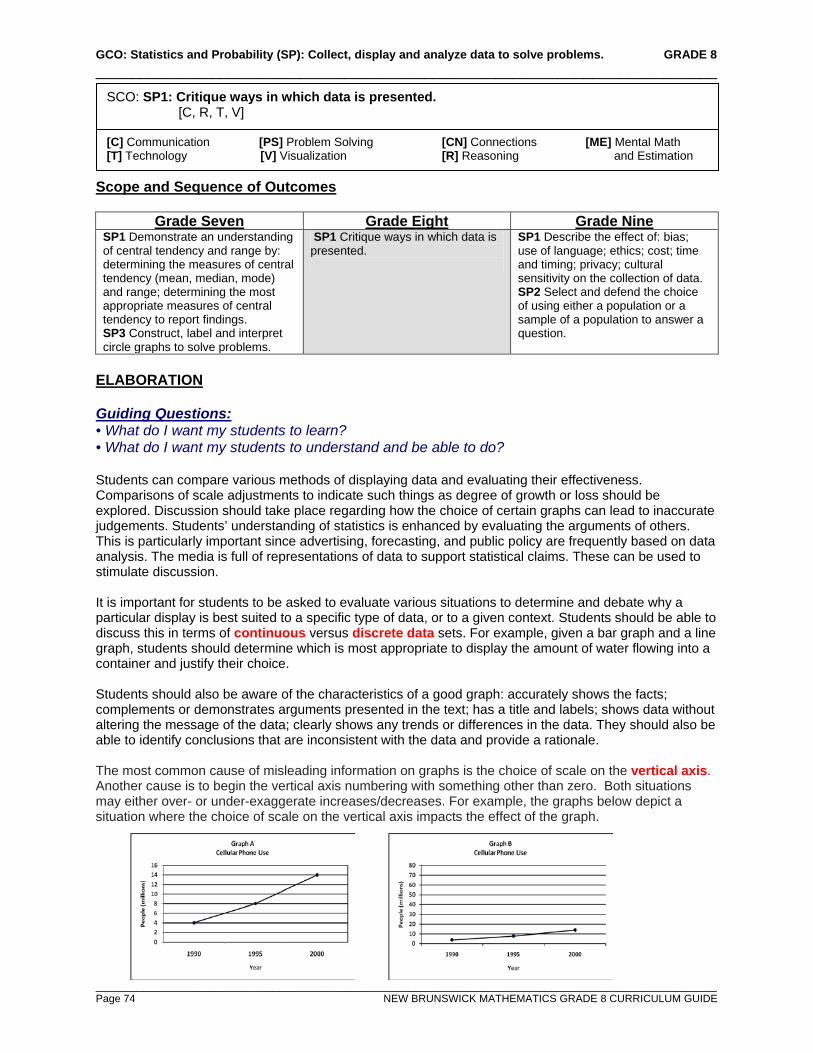
GCO: Statistics and Probability (SP): Collect, display and analyze data to solve problems. GRADE 8 ______________________________________________________________________
_________________________________________________________________________________________________________ Page 74 NEW BRUNSWICK MATHEMATICS GRADE 8 CURRICULUM GUIDE
Scope and Sequence of Outcomes
Grade Seven Grade Eight Grade Nine SP1 Demonstrate an understanding of central tendency and range by: determining the measures of central tendency (mean, median, mode) and range; determining the most appropriate measures of central tendency to report findings. SP3 Construct, label and interpret circle graphs to solve problems.
SP1 Critique ways in which data is presented.
SP1 Describe the effect of: bias; use of language; ethics; cost; time and timing; privacy; cultural sensitivity on the collection of data. SP2 Select and defend the choice of using either a population or a sample of a population to answer a question.
ELABORATION Guiding Questions: • What do I want my students to learn? • What do I want my students to understand and be able to do? Students can compare various methods of displaying data and evaluating their effectiveness. Comparisons of scale adjustments to indicate such things as degree of growth or loss should be explored. Discussion should take place regarding how the choice of certain graphs can lead to inaccurate judgements. Students’ understanding of statistics is enhanced by evaluating the arguments of others. This is particularly important since advertising, forecasting, and public policy are frequently based on data analysis. The media is full of representations of data to support statistical claims. These can be used to stimulate discussion. It is important for students to be asked to evaluate various situations to determine and debate why a particular display is best suited to a specific type of data, or to a given context. Students should be able to discuss this in terms of continuous versus discrete data sets. For example, given a bar graph and a line graph, students should determine which is most appropriate to display the amount of water flowing into a container and justify their choice. Students should also be aware of the characteristics of a good graph: accurately shows the facts; complements or demonstrates arguments presented in the text; has a title and labels; shows data without altering the message of the data; clearly shows any trends or differences in the data. They should also be able to identify conclusions that are inconsistent with the data and provide a rationale. The most common cause of misleading information on graphs is the choice of scale on the vertical axis. Another cause is to begin the vertical axis numbering with something other than zero. Both situations may either over- or under-exaggerate increases/decreases. For example, the graphs below depict a situation where the choice of scale on the vertical axis impacts the effect of the graph.
SCO: SP1: Critique ways in which data is presented. [C, R, T, V]
[C] Communication [PS] Problem Solving [CN] Connections [ME] Mental Math [T] Technology [V] Visualization [R] Reasoning and Estimation
GCO: Statistics and Probability (SP): Collect, display and analyze data to solve problems. GRADE 8 ______________________________________________________________________
_________________________________________________________________________________________________________ NEW BRUNSWICK MATHEMATICS GRADE 8 CURRICULUM GUIDE Page 75
ACHIEVEMENT INDICATORS Guiding Questions: • What evidence will I look for to know that learning has occurred? • What should students demonstrate to show their understanding of the mathematical concepts
and skills? Use the following set of indicators as a guide to determine whether students have met the corresponding specific outcome. o Compare the information that is provided for the same data set by a given set of graphs, including
circle graphs, line graphs, bar graphs, double bar graphs and pictographs, to determine the strengths and limitations of each graph.
o Identify the advantages and disadvantages of different graphs, including circle graphs, line graphs, bar graphs, double bar graphs and pictographs, in representing a specific given set of data.
o Justify the choice of a graphical representation for a given situation and its corresponding data set. o Explain how the format of a given graph, such as the size of the intervals, the width of bars and the
visual representation, may lead to misinterpretation of the data. o Explain how a given formatting choice could misrepresent the data. o Identify conclusions that are inconsistent with a given data set or graph and explain the
misinterpretation.
SCO: SP1: Critique ways in which data is presented. [C, R, T, V]
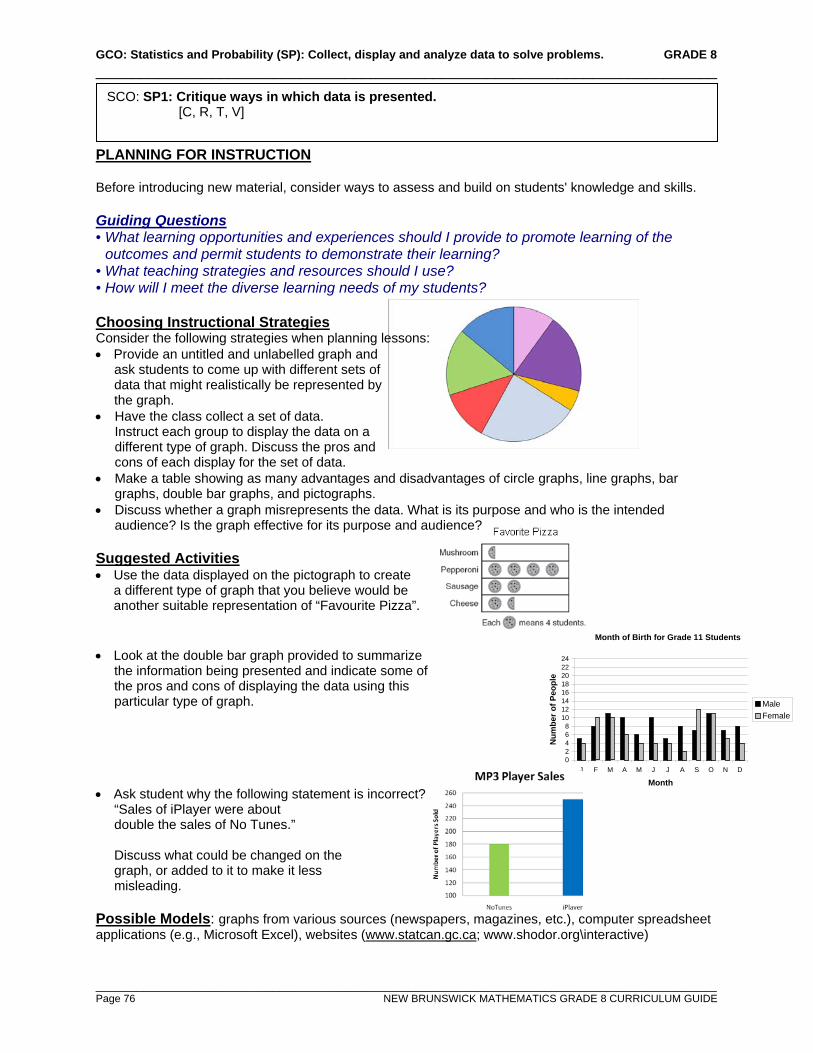
GCO: Statistics and Probability (SP): Collect, display and analyze data to solve problems. GRADE 8 ______________________________________________________________________
_________________________________________________________________________________________________________ Page 76 NEW BRUNSWICK MATHEMATICS GRADE 8 CURRICULUM GUIDE
Month of Birth for Grade 11 Students
02468
1012141618202224
J F M A M J J A S O N D
Month
Num
ber o
f Peo
ple
MaleFemale
PLANNING FOR INSTRUCTION Before introducing new material, consider ways to assess and build on students' knowledge and skills. Guiding Questions • What learning opportunities and experiences should I provide to promote learning of the
outcomes and permit students to demonstrate their learning? • What teaching strategies and resources should I use? • How will I meet the diverse learning needs of my students? Choosing Instructional Strategies Consider the following strategies when planning lessons: • Provide an untitled and unlabelled graph and ask students to come up with different sets of data that might realistically be represented by the graph. • Have the class collect a set of data.
Instruct each group to display the data on a different type of graph. Discuss the pros and cons of each display for the set of data. • Make a table showing as many advantages and disadvantages of circle graphs, line graphs, bar
graphs, double bar graphs, and pictographs. • Discuss whether a graph misrepresents the data. What is its purpose and who is the intended
audience? Is the graph effective for its purpose and audience? Suggested Activities • Use the data displayed on the pictograph to create
a different type of graph that you believe would be another suitable representation of “Favourite Pizza”.
• Look at the double bar graph provided to summarize the information being presented and indicate some of the pros and cons of displaying the data using this particular type of graph.
• Ask student why the following statement is incorrect? “Sales of iPlayer were about double the sales of No Tunes.”
Discuss what could be changed on the graph, or added to it to make it less misleading. Possible Models: graphs from various sources (newspapers, magazines, etc.), computer spreadsheet applications (e.g., Microsoft Excel), websites (www.statcan.gc.ca; www.shodor.org\interactive)
SCO: SP1: Critique ways in which data is presented. [C, R, T, V]
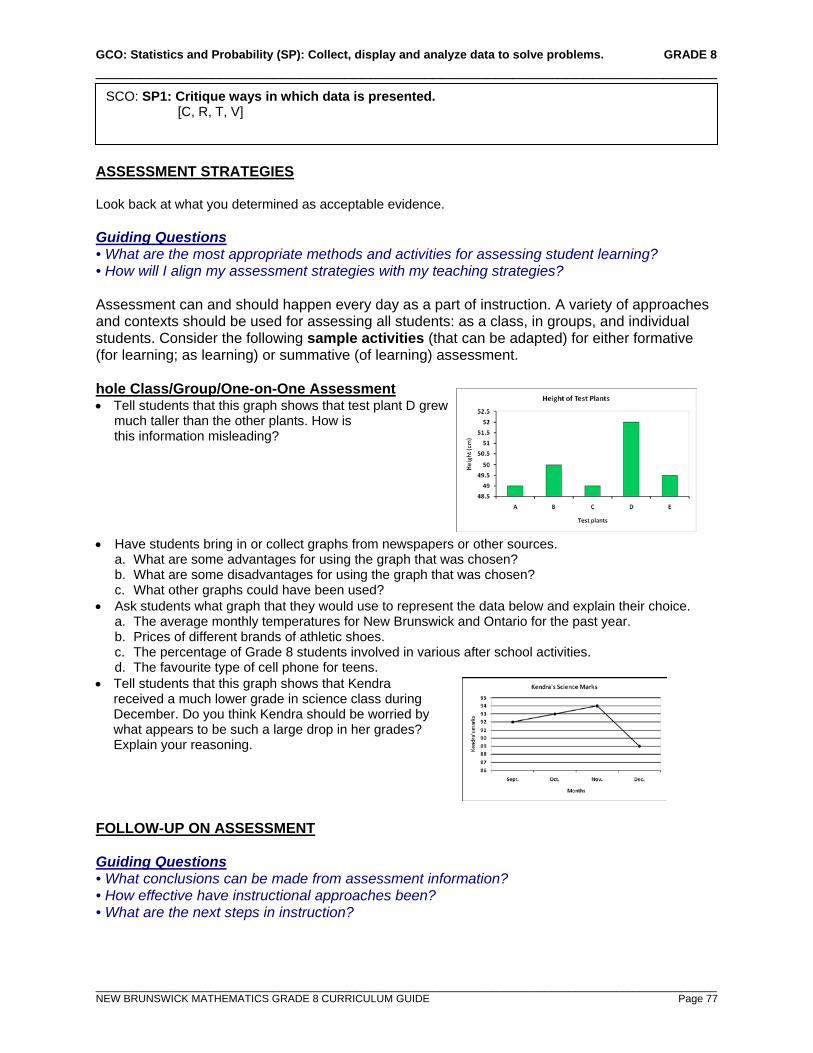
GCO: Statistics and Probability (SP): Collect, display and analyze data to solve problems. GRADE 8 ______________________________________________________________________
_________________________________________________________________________________________________________ NEW BRUNSWICK MATHEMATICS GRADE 8 CURRICULUM GUIDE Page 77
ASSESSMENT STRATEGIES Look back at what you determined as acceptable evidence. Guiding Questions • What are the most appropriate methods and activities for assessing student learning? • How will I align my assessment strategies with my teaching strategies? Assessment can and should happen every day as a part of instruction. A variety of approaches and contexts should be used for assessing all students: as a class, in groups, and individual students. Consider the following sample activities (that can be adapted) for either formative (for learning; as learning) or summative (of learning) assessment. hole Class/Group/One-on-One Assessment • Tell students that this graph shows that test plant D grew much taller than the other plants. How is this information misleading? • Have students bring in or collect graphs from newspapers or other sources.
a. What are some advantages for using the graph that was chosen? b. What are some disadvantages for using the graph that was chosen? c. What other graphs could have been used?
• Ask students what graph that they would use to represent the data below and explain their choice. a. The average monthly temperatures for New Brunswick and Ontario for the past year. b. Prices of different brands of athletic shoes. c. The percentage of Grade 8 students involved in various after school activities. d. The favourite type of cell phone for teens.
• Tell students that this graph shows that Kendra received a much lower grade in science class during December. Do you think Kendra should be worried by what appears to be such a large drop in her grades? Explain your reasoning. FOLLOW-UP ON ASSESSMENT Guiding Questions • What conclusions can be made from assessment information? • How effective have instructional approaches been? • What are the next steps in instruction?
SCO: SP1: Critique ways in which data is presented. [C, R, T, V]
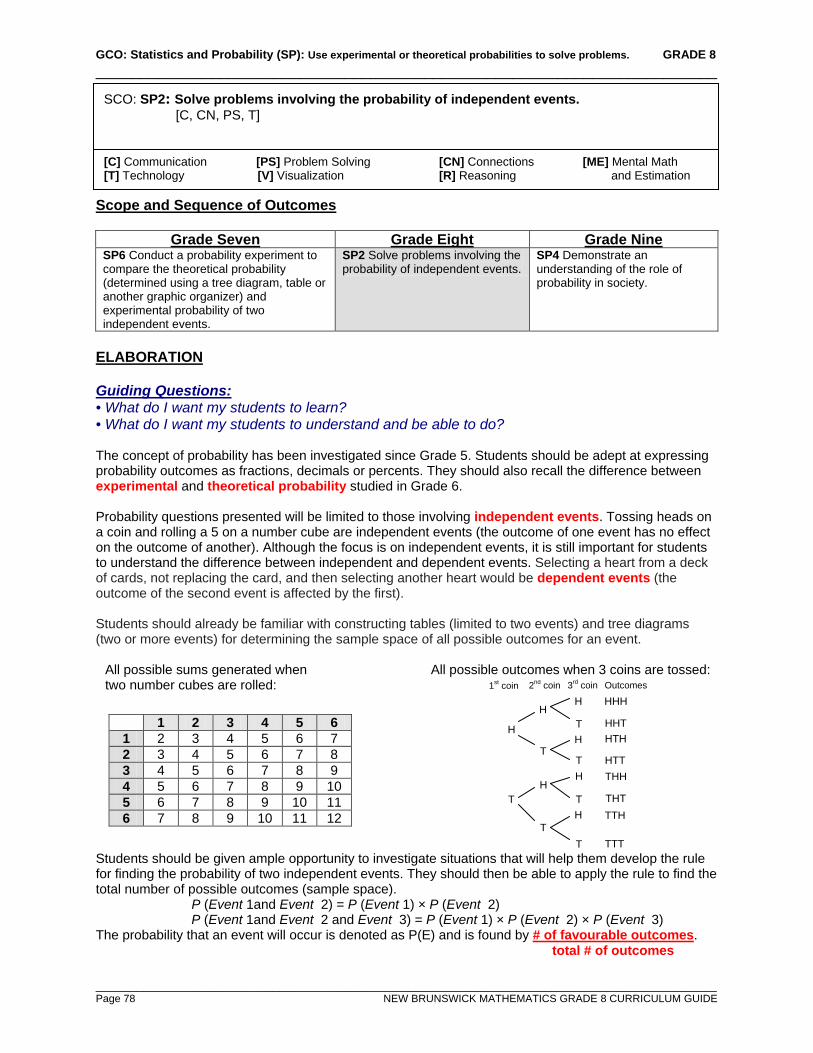
GCO: Statistics and Probability (SP): Use experimental or theoretical probabilities to solve problems. GRADE 8 ______________________________________________________________________
_________________________________________________________________________________________________________ Page 78 NEW BRUNSWICK MATHEMATICS GRADE 8 CURRICULUM GUIDE
total # of outcomes
Scope and Sequence of Outcomes
Grade Seven Grade Eight Grade Nine SP6 Conduct a probability experiment to compare the theoretical probability (determined using a tree diagram, table or another graphic organizer) and experimental probability of two independent events.
SP2 Solve problems involving the probability of independent events.
SP4 Demonstrate an understanding of the role of probability in society.
ELABORATION Guiding Questions: • What do I want my students to learn? • What do I want my students to understand and be able to do? The concept of probability has been investigated since Grade 5. Students should be adept at expressing probability outcomes as fractions, decimals or percents. They should also recall the difference between experimental and theoretical probability studied in Grade 6. Probability questions presented will be limited to those involving independent events. Tossing heads on a coin and rolling a 5 on a number cube are independent events (the outcome of one event has no effect on the outcome of another). Although the focus is on independent events, it is still important for students to understand the difference between independent and dependent events. Selecting a heart from a deck of cards, not replacing the card, and then selecting another heart would be dependent events (the outcome of the second event is affected by the first). Students should already be familiar with constructing tables (limited to two events) and tree diagrams (two or more events) for determining the sample space of all possible outcomes for an event.
All possible sums generated when All possible outcomes when 3 coins are tossed: two number cubes are rolled:
Students should be given ample opportunity to investigate situations that will help them develop the rule for finding the probability of two independent events. They should then be able to apply the rule to find the total number of possible outcomes (sample space).
P (Event 1and Event 2) = P (Event 1) × P (Event 2) P (Event 1and Event 2 and Event 3) = P (Event 1) × P (Event 2) × P (Event 3)
The probability that an event will occur is denoted as P(E) and is found by # of favourable outcomes.
1 2 3 4 5 6 1 2 3 4 5 6 7 2 3 4 5 6 7 8 3 4 5 6 7 8 9 4 5 6 7 8 9 10 5 6 7 8 9 10 11 6 7 8 9 10 11 12
SCO: SP2: Solve problems involving the probability of independent events. [C, CN, PS, T]
[C] Communication [PS] Problem Solving [CN] Connections [ME] Mental Math [T] Technology [V] Visualization [R] Reasoning and Estimation
1st coin 2nd coin 3rd coin
H
T
T
T
H
H
H
H
H
H
T
T
T
T
HHH
HHT HTH
HTT THH
THT TTH
TTT
Outcomes
GCO: Statistics and Probability (SP): Use experimental or theoretical probabilities to solve problems. GRADE 8 ______________________________________________________________________
_________________________________________________________________________________________________________ NEW BRUNSWICK MATHEMATICS GRADE 8 CURRICULUM GUIDE Page 79
ACHIEVEMENT INDICATORS Guiding Questions: • What evidence will I look for to know that learning has occurred? • What should students demonstrate to show their understanding of the mathematical concepts
and skills? Use the following set of indicators as a guide to determine whether students have met the corresponding specific outcome. ° Determine the theoretical probability of a given outcome involving two independent events. ° Conduct a probability experiment for an outcome involving two independent events, with and without
technology, to compare the experimental probability to the theoretical probability. ° Solve a given probability problem involving two independent events. ° Distinguish between dependent and independent events.
SCO: SP2: Solve problems involving the probability of independent events. [C, CN, PS, T]
GCO: Statistics and Probability (SP): Use experimental or theoretical probabilities to solve problems. GRADE 8 ______________________________________________________________________
_________________________________________________________________________________________________________ Page 80 NEW BRUNSWICK MATHEMATICS GRADE 8 CURRICULUM GUIDE
PLANNING FOR INSTRUCTION Before introducing new material, consider ways to assess and build on students' knowledge and skills. Guiding Questions • What learning opportunities and experiences should I provide to promote learning of the
outcomes and permit students to demonstrate their learning? • What teaching strategies and resources should I use? • How will I meet the diverse learning needs of my students? Choosing Instructional Strategies Consider the following strategies when planning lessons: • Explore both experimental and theoretical probabilities through a variety of situations and materials. • Review the approaches for determining a sample space (tree diagrams and tables) and extend this to
establish the fact that the space can be determined by simply multiplying the outcomes together. For example: A menu offers a lunch special of either a hot dog or a hamburger with a choice of an apple, orange or banana for dessert. How many different meal combinations could be ordered? (2 x 3 = 6)
• Do not explicitly present a rule for determining the probability of two or more independent events to the students. Rather, through the use of tree diagrams and/or tables students should be given the opportunity to discover a rule themselves. It is also important to realize that the idea of multiplying individual probabilities can be extended to include more than just two events.
Suggested Activities • Have each student in the class flip three coins 5 times to simulate the genders of the children in
families with three kids. Use heads to indicate a girl, and tails to indicate a boy. Combine class results for all outcomes. a. What is the experimental probability of getting 3 girls? b. What is the theoretical probability of getting 3 girls? Use one of three methods to determine your
answer. c. Compare the experimental and theoretical probabilities. Why are the two values different?
• Use the SMARTBoard Gallery or websites such as the National Library of Virtual Manipulatives to access digital manipulatives that can be used for simulation purposes (e.g., coin toss, spinner, number cubes, playing cards, random number generator)
Possible Models: number cubes and other polyhedral dice, number cards (playing cards), coins, spinners
SCO: SP2: Solve problems involving the probability of independent events. [C, CN, PS, T]
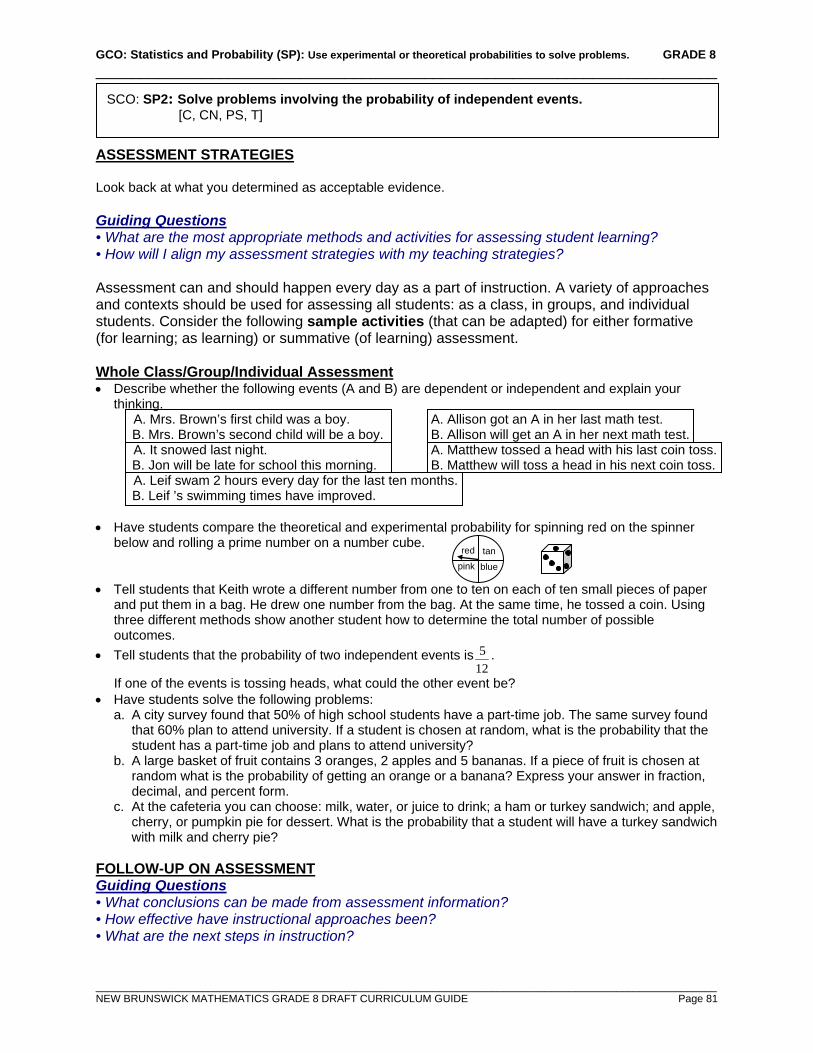
GCO: Statistics and Probability (SP): Use experimental or theoretical probabilities to solve problems. GRADE 8 ______________________________________________________________________
_________________________________________________________________________________________________________ NEW BRUNSWICK MATHEMATICS GRADE 8 DRAFT CURRICULUM GUIDE Page 81
ASSESSMENT STRATEGIES Look back at what you determined as acceptable evidence. Guiding Questions • What are the most appropriate methods and activities for assessing student learning? • How will I align my assessment strategies with my teaching strategies? Assessment can and should happen every day as a part of instruction. A variety of approaches and contexts should be used for assessing all students: as a class, in groups, and individual students. Consider the following sample activities (that can be adapted) for either formative (for learning; as learning) or summative (of learning) assessment. Whole Class/Group/Individual Assessment • Describe whether the following events (A and B) are dependent or independent and explain your
thinking. A. Mrs. Brown’s first child was a boy. A. Allison got an A in her last math test. B. Mrs. Brown’s second child will be a boy. B. Allison will get an A in her next math test.
A. It snowed last night. A. Matthew tossed a head with his last coin toss. B. Jon will be late for school this morning. B. Matthew will toss a head in his next coin toss.
A. Leif swam 2 hours every day for the last ten months. B. Leif ’s swimming times have improved.
• Have students compare the theoretical and experimental probability for spinning red on the spinner below and rolling a prime number on a number cube.
• Tell students that Keith wrote a different number from one to ten on each of ten small pieces of paper and put them in a bag. He drew one number from the bag. At the same time, he tossed a coin. Using three different methods show another student how to determine the total number of possible outcomes.
• Tell students that the probability of two independent events is125 .
If one of the events is tossing heads, what could the other event be? • Have students solve the following problems:
a. A city survey found that 50% of high school students have a part-time job. The same survey found that 60% plan to attend university. If a student is chosen at random, what is the probability that the student has a part-time job and plans to attend university?
b. A large basket of fruit contains 3 oranges, 2 apples and 5 bananas. If a piece of fruit is chosen at random what is the probability of getting an orange or a banana? Express your answer in fraction, decimal, and percent form.
c. At the cafeteria you can choose: milk, water, or juice to drink; a ham or turkey sandwich; and apple, cherry, or pumpkin pie for dessert. What is the probability that a student will have a turkey sandwich with milk and cherry pie?
FOLLOW-UP ON ASSESSMENT Guiding Questions • What conclusions can be made from assessment information? • How effective have instructional approaches been? • What are the next steps in instruction?
SCO: SP2: Solve problems involving the probability of independent events. [C, CN, PS, T]
red
blue
tan pink
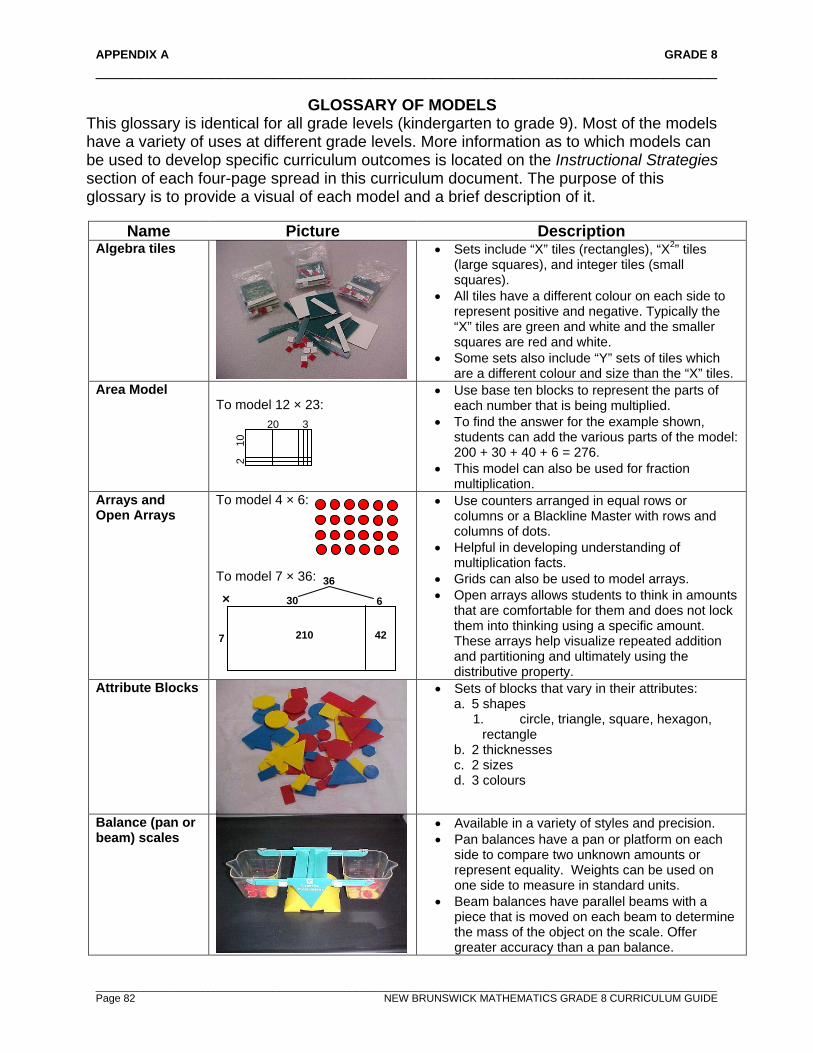
APPENDIX A GRADE 8 ______________________________________________________________________
_________________________________________________________________________________________________________ Page 82 NEW BRUNSWICK MATHEMATICS GRADE 8 CURRICULUM GUIDE
GLOSSARY OF MODELS This glossary is identical for all grade levels (kindergarten to grade 9). Most of the models have a variety of uses at different grade levels. More information as to which models can be used to develop specific curriculum outcomes is located on the Instructional Strategies section of each four-page spread in this curriculum document. The purpose of this glossary is to provide a visual of each model and a brief description of it.
Name Picture Description
Algebra tiles
• Sets include “X” tiles (rectangles), “X2” tiles (large squares), and integer tiles (small squares).
• All tiles have a different colour on each side to represent positive and negative. Typically the “X” tiles are green and white and the smaller squares are red and white.
• Some sets also include “Y” sets of tiles which are a different colour and size than the “X” tiles.
Area Model To model 12 × 23:
• Use base ten blocks to represent the parts of each number that is being multiplied.
• To find the answer for the example shown, students can add the various parts of the model: 200 + 30 + 40 + 6 = 276.
• This model can also be used for fraction multiplication.
Arrays and Open Arrays
To model 4 × 6: To model 7 × 36:
• Use counters arranged in equal rows or columns or a Blackline Master with rows and columns of dots.
• Helpful in developing understanding of multiplication facts.
• Grids can also be used to model arrays. • Open arrays allows students to think in amounts
that are comfortable for them and does not lock them into thinking using a specific amount. These arrays help visualize repeated addition and partitioning and ultimately using the distributive property.
Attribute Blocks
• Sets of blocks that vary in their attributes: a. 5 shapes
1. circle, triangle, square, hexagon, rectangle
b. 2 thicknesses c. 2 sizes d. 3 colours
Balance (pan or beam) scales
• Available in a variety of styles and precision. • Pan balances have a pan or platform on each
side to compare two unknown amounts or represent equality. Weights can be used on one side to measure in standard units.
• Beam balances have parallel beams with a piece that is moved on each beam to determine the mass of the object on the scale. Offer greater accuracy than a pan balance.
20 3
2
10
× 30 6
36
7 210 42
APPENDIX A GRADE 8 ______________________________________________________________________
_________________________________________________________________________________________________________ NEW BRUNSWICK MATHEMATICS GRADE 8 CURRICULUM GUIDE Page 83
Base Ten Blocks
• Include unit cubes, rods, flats, and large cubes. • Available in a variety of colours and materials
(plastic, wood, foam). • Usually 3-D.
Beam Balance
see Balance (pan or beam)
Carroll Diagram Example: 1-digit 2-digit Even 2, 4, 6, 8 26, 34 Odd 1, 3, 5, 7, 9 15, 21
• Used for classification of different attributes. • The table shows the four possible combinations
for the two attributes. • Similar to a Venn Diagram.
Colour Tiles
• Square tiles in 4 colours (red, yellow, green, blue)
• Available in a variety of materials (plastic, wood, foam).
Counters (two colour)
• Counters have a different colour on each side. • Available in a variety of colour combinations, but
usually are red & white or red & yellow. • Available in different shapes (circles, squares,
bean).
Cubes (Linking)
• Set of interlocking 2 cm cubes. • Most connect on all sides. • Available in a wide variety of colours (usually 10
colours in each set). • Brand names include: Multilink, Hex-a-Link,
Cube-A-Link. • Some types only connect on two sides (brand
name example: Unifix).
Cuisenaire Rods®
• Set includes 10 different colours of rods. • Each colour represents a different length and
can represent different number values or units of measurement.
• Usual set includes 74 rods (22 white, 12 red, 10 light green, 6 purple, 4 yellow, 4 dark green, 4 black, 4 brown, 4 blue, 4 orange).
• Available in plastic or wood.
APPENDIX A GRADE 8 ______________________________________________________________________
_________________________________________________________________________________________________________ Page 84 NEW BRUNSWICK MATHEMATICS GRADE 8 CURRICULUM GUIDE
Decimal Squares®
• Tenths and hundredths grids that are manufactured with parts of the grids shaded.
• Can substitute a Blackline Master and create your own class set.
Dice (Number Cubes)
• Standard type is a cube with numbers or dots from 1 to 6 (number cubes).
• Cubes can have different symbols or words. • Also available in:
° 4-sided (tetrahedral dice) ° 8-sided (octahedral dice) ° 10-sided (decahedra dice) ° 12-sided, 20-sided, and higher ° Place value dice
Dominoes
• Rectangular tiles divided in two-halves. • Each half shows a number of dots: 0 to 6 or • 0 to 9. • Sets include tiles with all the possible number
combinations for that set. • Double-six sets include 28 dominoes. • Double-nine sets include 56 dominoes.
Dot Cards
• Sets of cards that display different number of dots (1 to 10) in a variety of arrangements.
• Available as free Blackline Master online on the “Teaching Student-Centered Mathematics K-3” website (BLM 3-8).
Double Number Line
see Number lines (standard, open, and double)
Five-frames see Frames (five- and ten-) Fraction Blocks
• Also known as Fraction Pattern blocks. • 4 types available: pink “double hexagon”, black
chevron, brown trapezoid, and purple triangle. • Use with basic pattern blocks to help study a
wider range of denominators and fraction computation.
Fraction Circles
• Sets can include these fraction pieces: 1,
21 ,
41 ,
31 ,
51 ,
61 ,
81 ,
101 ,
121
• Each fraction graduation has its own colour. • It is helpful to use ones without the fractions
marked on the pieces for greater flexibility (using different piece to represent 1 whole).
APPENDIX A GRADE 8 ______________________________________________________________________
_________________________________________________________________________________________________________ NEW BRUNSWICK MATHEMATICS GRADE 8 CURRICULUM GUIDE Page 85
Fraction Pieces
• Rectangular pieces that can be used to represent the following fractions:
21 ,
41 ,
31 ,
51 ,
61 ,
81 ,
101 ,
121
• Offers more flexibility as different pieces can be used to represent 1 whole.
• Each fraction graduation has its own colour. • Sets available in different quantities of pieces.
Frames (five- and ten-)
• Available as a Blackline Master in many resources or you can create your own.
• Use with any type of counter to fill in the frame as needed.
Geoboards
• Available in a variety of sizes and styles. ° 5 × 5 pins ° 11 × 11 pins ° Circular 24 pin ° Isometric
• Clear plastic models can be used by teachers and students on an overhead.
• Some models can be linked to increase the size of the grid.
Geometric Solids
• Sets typically include a variety of prisms, pyramids, cones, cylinders, and spheres.
• The number of pieces in a set will vary. • Available in different materials (wood, plastic,
foam) and different sizes.
Geo-strips
• Plastic strips that can be fastened together with brass fasteners to form a variety of angles and geometric shapes.
• Strips come in 5 different lengths. Each length is a different colour.
Hundred Chart
• 10 × 10 grid filled in with numbers 1-100 or 0 - 99.
• Available as a Blackline Master in many resources or you can create your own.
• Also available as wall charts or “Pocket” charts where cards with the numbers can be inserted or removed.
APPENDIX A GRADE 8 ______________________________________________________________________
_________________________________________________________________________________________________________ Page 86 NEW BRUNSWICK MATHEMATICS GRADE 8 CURRICULUM GUIDE
Hundred Grid
• 10 × 10 grid. • Available as Blackline Master in many
resources.
Hundredths Circle
• Circle divided into tenths and hundredths. • Also known as “percent circles”.
Learning Carpet®
http://www.thelearningcarpet.ca
• 10 × 10 grid printed on a floor rug that is six feet square.
• Number cards and other accessories are available to use with the carpet.
Linking Cubes see Cubes (Linking) Mira®
• Clear red plastic with a bevelled edge that projects reflected image on the other side.
• Other brand names include: Reflect-View and Math-Vu.
Number Cubes see Dice (Number Cubes) Number Lines (standard, open, and double)
• Number lines can begin at 0 or extend in both directions.
• Open number lines do not include pre-marked
numbers or divisions. Students place these as needed.
• Double number lines have numbers written
above and below the line to show equivalence. Open Arrays see Arrays and Open Arrays Open Number Lines
see Number Lines (standard, open, and double)
Pan Balance see Balance (pan or beam)
5
21
10
0 1 2 3 4 5 6 7 8 9 10
52 60 64
+8 +4
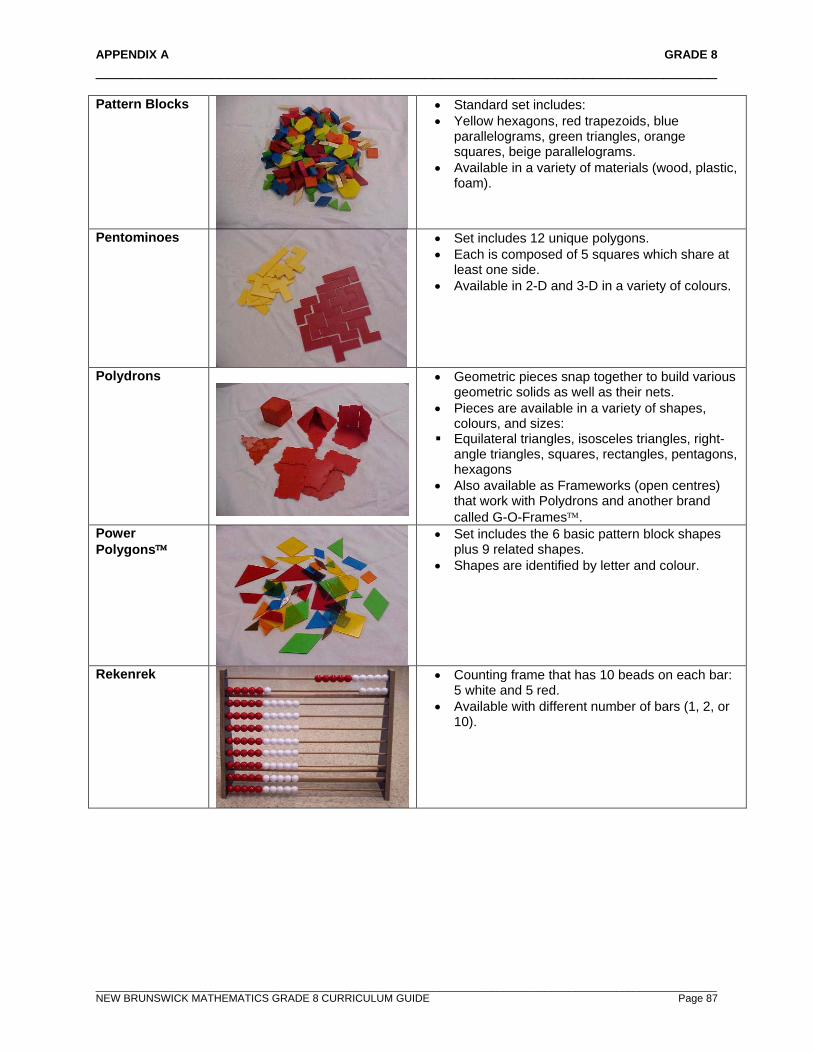
APPENDIX A GRADE 8 ______________________________________________________________________
_________________________________________________________________________________________________________ NEW BRUNSWICK MATHEMATICS GRADE 8 CURRICULUM GUIDE Page 87
Pattern Blocks
• Standard set includes: • Yellow hexagons, red trapezoids, blue
parallelograms, green triangles, orange squares, beige parallelograms.
• Available in a variety of materials (wood, plastic, foam).
Pentominoes
• Set includes 12 unique polygons. • Each is composed of 5 squares which share at
least one side. • Available in 2-D and 3-D in a variety of colours.
Polydrons
• Geometric pieces snap together to build various geometric solids as well as their nets.
• Pieces are available in a variety of shapes, colours, and sizes:
Equilateral triangles, isosceles triangles, right-angle triangles, squares, rectangles, pentagons, hexagons
• Also available as Frameworks (open centres) that work with Polydrons and another brand called G-O-Frames.
Power Polygons
• Set includes the 6 basic pattern block shapes plus 9 related shapes.
• Shapes are identified by letter and colour.
Rekenrek
• Counting frame that has 10 beads on each bar: 5 white and 5 red.
• Available with different number of bars (1, 2, or 10).
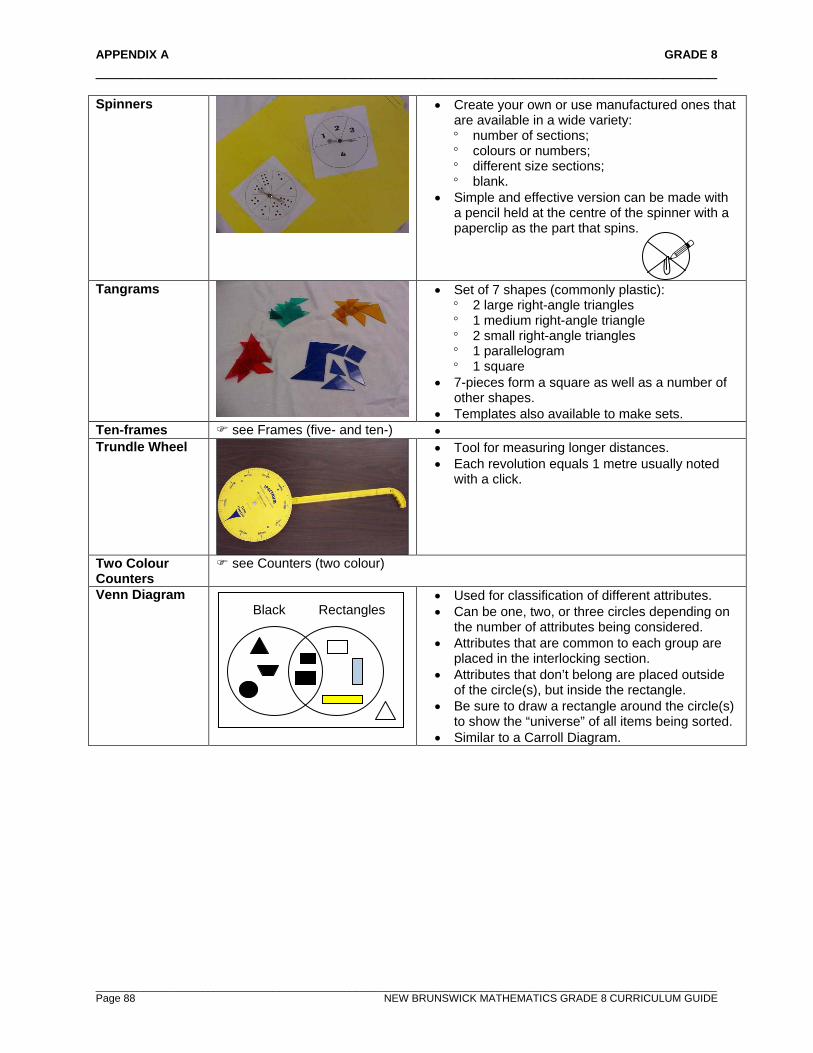
APPENDIX A GRADE 8 ______________________________________________________________________
_________________________________________________________________________________________________________ Page 88 NEW BRUNSWICK MATHEMATICS GRADE 8 CURRICULUM GUIDE
Spinners
• Create your own or use manufactured ones that are available in a wide variety: ° number of sections; ° colours or numbers; ° different size sections; ° blank.
• Simple and effective version can be made with a pencil held at the centre of the spinner with a paperclip as the part that spins.
Tangrams
• Set of 7 shapes (commonly plastic): ° 2 large right-angle triangles ° 1 medium right-angle triangle ° 2 small right-angle triangles ° 1 parallelogram ° 1 square
• 7-pieces form a square as well as a number of other shapes.
• Templates also available to make sets. Ten-frames see Frames (five- and ten-) • Trundle Wheel
• Tool for measuring longer distances. • Each revolution equals 1 metre usually noted
with a click.
Two Colour Counters
see Counters (two colour)
Venn Diagram Black Rectangles
• Used for classification of different attributes. • Can be one, two, or three circles depending on
the number of attributes being considered. • Attributes that are common to each group are
placed in the interlocking section. • Attributes that don’t belong are placed outside
of the circle(s), but inside the rectangle. • Be sure to draw a rectangle around the circle(s)
to show the “universe” of all items being sorted. • Similar to a Carroll Diagram.

APPENDIX B GRADE 8 ______________________________________________________________________
_________________________________________________________________________________________________________ NEW BRUNSWICK MATHEMATICS GRADE 8 CURRICULUM GUIDE Page 89
List of Grade 8 Specific Curriculum Outcomes Number (N) 1. Demonstrate an understanding of perfect squares and square roots, concretely, pictorially and symbolically
(limited to whole numbers). 2. Determine the approximate square root of numbers that are not perfect squares (limited to whole numbers). 3. Demonstrate an understanding of percents greater than or equal to 0%. 4. Demonstrate an understanding of ratio and rate. 5. Solve problems that involve rates, ratios and proportional reasoning. 6. Demonstrate an understanding of multiplying and dividing positive fractions and mixed numbers, concretely,
pictorially and symbolically. 7. Demonstrate an understanding of multiplication and division of integers, concretely, pictorially and symbolically.
Patterns & Relations (PR) (Patterns) 1. Graph and analyze two variable linear relations. (Variables and Equations) 2. Model and solve problems using linear equations of the form:
ax = b; ax = b , a ≠ 0; ax + b = c;
ax +b=c, a ≠ 0; a(x + b) = c
concretely, pictorially and symbolically, where a, b and c are integers. Shape and Space (SS) (Measurement) 1. Develop and apply the Pythagorean Theorem to solve problems. 2. Draw and construct nets for 3-D objects. 3. Determine the surface area of: right rectangular prisms; right triangular prisms; right cylinders to solve problems. 4. Develop and apply formulas for determining the volume of right prisms and right cylinders. (3-D Objects and 2-D Shapes) 5. Draw and interpret top, front and side views of 3-D objects composed of right rectangular prisms. (Transformations) 6. Demonstrate an understanding of tessellation by: explaining the properties of shapes that make tessellating
possible; creating tessellations; identifying tessellations in the environment. Statistics and Probability (SP) (Data Analysis) 1. Critique ways in which data is presented. (Chance and Uncertainty) 2. Solve problems involving the probability of independent events.

APPENDIX C GRADE 8 ______________________________________________________________________
_________________________________________________________________________________________________________ Page 91 NEW BRUNSWICK MATHEMATICS GRADE 8 CURRICULUM GUIDE
REFERENCES Alberta Education. LearnAlberta.ca: Planning Guides K, 1, 4, and 7, 2005-2008. American Association for the Advancement of Science [AAAS-Benchmarks]. Benchmark for Science
Literacy. New York, NY: Oxford University Press, 1993. Banks, J.A. and C.A.M. Banks. Multicultural Education: Issues and Perspectives. Boston: Allyn and
Bacon, 1993. Black, Paul and Dylan Wiliam. “Inside the Black Box: Raising Standards Through Classroom
Assessment.” Phi Delta Kappan, 20, October 1998, pp.139-148. British Columbia. Ministry of Education. The Primary Program: A Framework for Teaching, 2000. Caine, Renate Numella and Geoffrey Caine. Making Connections: Teaching and the Human Brain. Menlo
Park, CA: Addison-Wesley Publishing Company, 1991. Computation, Calculators, and Common Sense. May 2005, NCTM. Davies, Anne. Making Classroom Assessment Work. British Columbia: Classroom Connections
International, Inc., 2000. Hope, Jack A. et.al. Mental Math in the Primary Grades (p. v). Dale Seymour Publications, 1988. National Council of Teachers of Mathematics (NCTM). Curriculum Focal Points for Prekindergarten
through Grade 8: A Quest for Coherence. Reston, VA: NCTM, 2006. _____, Mathematics Assessment Sampler, Grades 3-5. edited by Jane Reston, VA: NCTM, 2000. _____, Principles and Standards for School Mathematics. Reston, VA: NCTM, 2000. OECD Centre for Educational Research and Innovation. Formative Assessment: Improving Learning in
Secondary Classrooms. Paris, France: Organization for Economic Co-operation and Development (OECD) Publishing, 2006.
Rubenstein, Rheta N. Mental Mathematics beyond the Middle School: Why? What? How? September
2001, Vol. 94, Issue 6, p. 442. Shaw, J.M. and Cliatt, M.F.P. (1989). “Developing Measurement Sense.” In P.R. Trafton (Ed.), New
Directions for Elementary School Mathematics (pp. 149–155). Reston, VA: National Council of Teachers of Mathematics.
Small, M. Making Math Meaningful to Canadian Students, K-8. Toronto: Nelson Education Ltd., 2008. Steen, L.A. (ed.). On the Shoulders of Giants – New Approaches to Numeracy. Washington, DC: National
Research Council, 1990. Stenmark, Jean Kerr and William S. Bush, Editor. Mathematics Assessment: A Practical Handbook for
Grades 3-5. Reston, VA: National Council of Teachers of Mathematics, Inc., 2001. Twomey Fosnot, Catherine and Maarten Dolk. Young Mathematicians at Work: Constructing Fractions,
Decimals, and Percents. Portsmouth, NH: Heinemann, 2002. Van de Walle, John A. and Louann H. Lovin. Teaching Student-Centered Mathematics, Grades K-3.
Boston: Pearson Education, Inc. 2006.
APPENDIX C GRADE 8 ______________________________________________________________________
_________________________________________________________________________________________________________ Page 91 NEW BRUNSWICK MATHEMATICS GRADE 8 CURRICULUM GUIDE
Van de Walle, John A. and Louann H. Lovin. Teaching Student-Centered Mathematics, Grades 3-5.
Boston: Pearson Education, Inc. 2006. Van de Walle, John A. and Louann H. Lovin. Teaching Student-Centered Mathematics, Grades 5-8.
Boston: Pearson Education, Inc. 2006. Western and Northern Canadian Protocol. Common Curriculum Framework for K-9 Mathematics, 2006.