new business information packet welcome to … · new business information packet . welcome to the...
TRANSCRIPT
NEW BUSINESS INFORMATION PACKET
Welcome to the Village of West Dundee! We are so happy that you have chosen to open your doors to this community. We want to ensure that the process of opening your business goes as smoothly as possible, so we are providing you this New Business Information Packet. This packet will provide you with the necessary forms and applications needed during your business’s licensing and registration process, as well as some background on the Village community you are entering. We wish you and your business nothing but the best. Should you have any questions or comments, please do not hesitate to contact the Community Development Department at 847-551-3805.
VILLAGE HISTORY
In 1835 Elder John and Nancy Oatman established a tavern and a store that became the core of the community. Others settlers came, and in 1837 they held a lottery to determine who would name the town. Alexander Gardiner won and named the town Dundee in honor of his Scottish hometown. In 1843 Scotsman Allan Pinkerton, later the renowned detective, set up business as a cooper. The town was incorporated in 1887. West Dundee was hemmed in from development for years. The river formed a natural eastern barrier. To the north and west, the D. Hill Nursery, founded in 1855 by William Hill, specialized in fruit trees. The business grew to include evergreens, some of which were sent to Chicago for the World's Columbian Exposition in 1893. Expanding to 900 acres, the nursery survived the Great Depression by running a cattle feed operation that continued through World War II. Some of the thousands of seasonal workers traveled to work from Chicago by electric car, while the majority lived on the nursery grounds. In the 1950s a segment of the Hill property was sold and turned into the Highlands subdivision, which was annexed into West Dundee in 1956. The community also annexed property west of Illinois 31 in 1957, Royal Lane in 1960, and the Old World subdivision in 1966. The nursery eventually sold all of its land and moved to McHenry County. Plans for the Spring Hill Mall on Hill's land began in 1973 and the project was completed in 1980. The 1.1 million-square-foot mall's retail sales boosted West Dundee's economy and created an estimated 1,600 jobs by 1982. New subdivisions were built to the west of Spring Hill. With a population of 7,331 (2010 Census data), West Dundee has managed to keep its quaintness and small-town feeling intact.

Table of Contents
General Information
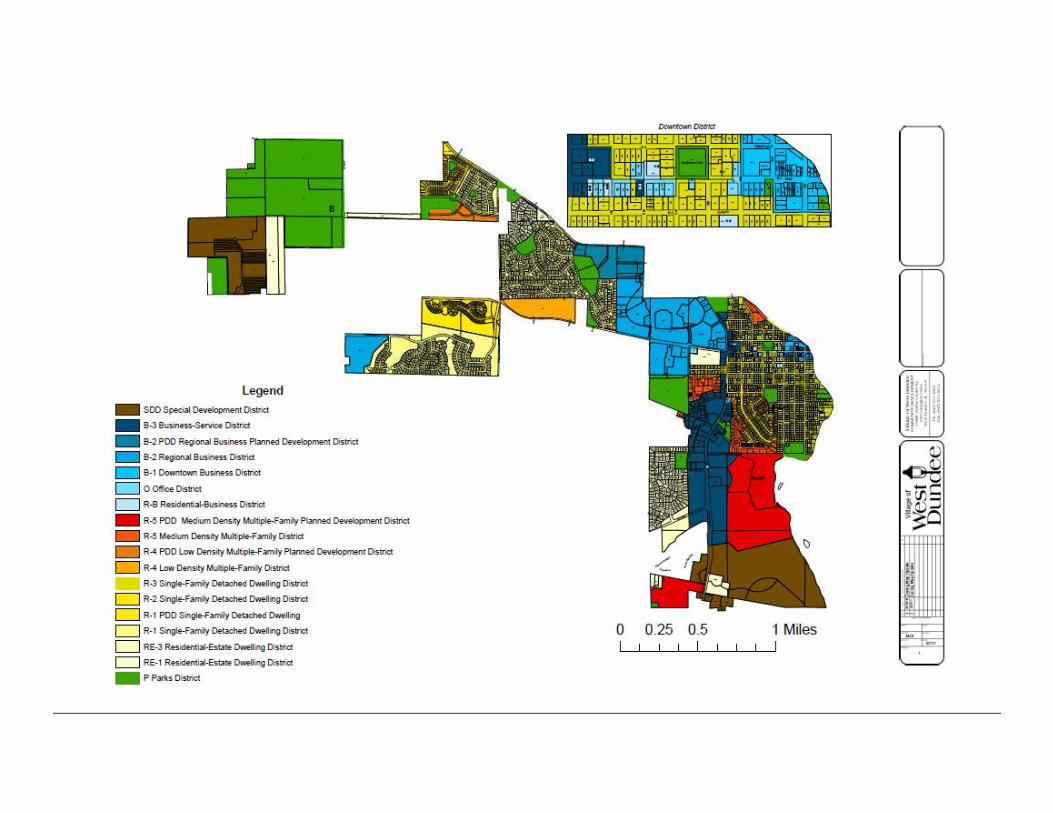
• Village Administration: Contact Information • Village of West Dundee: Zoning Map • Village of West Dundee: Executive Demographic Summary • Village of West Dundee: Demographics (Detailed) • Traffic Counts
Market Characteristics
• Existing Business Summary • Retail Market Profile • Retail Market Potential • Restaurant Market Potential
For ALL Businesses (except Home Based)
• Certificate of Occupancy, Business Registration & License Application • Police/Fire/Quadcom Emergency Information • Shop Local Program & Smartphone App Information
Required for Construction & Signage
• Appearance Review Commission Application • Building Permit • Sign Application
Required for Food-Serving Businesses
• Kane County Food Permit Application • Food and Beverage Tax Registration/Remittance Forms
Required for Gas Stations
• Local Motor Fuel Tax Registration/Remittance Forms
Required for Home Based Businesses
• Home Based Business Registration and License Application
Required for Liquor Sales
• Application for Liquor License • Food/Beverage Tax Registration/Remittance Forms
Required for Massage Therapy
• Massage Therapy License Application
Required for Video Gaming Machines
• Video Gaming License Application
4
VILLAGE OFFICES & HOURS OF OPERATION Police, Fire and Medical Emergency Dial 9-1-1
Village Administration and Finance (847) 551-3800 8:00 am - 4:30 pm M - F
Village Hall 102 South Second Street
Community Development/Building Dept (847) 551-3805 8:00 am - 4:30 pm M - F Public Safety Center II 100 Carrington Drive
Fire Department - Non Emergency (847) 551-3805 8:00 am - 4:30 pm M - F Public Safety Center II 100 Carrington Drive
Police Department - Non Emergency (847) 551-3810 8:00 am - 5:00 pm M - F Public Safety Center I 555 South Eighth Street
Public Works Department (847) 551-3815 8:00 am - 4:30 pm M - F 900 Angle Tarn
ADMINISTRATION & FINANCE
Administration and Finance are companion departments, responsible for the overall management of Village employees and finances, maintenance of official records and files, dissemination of information to the Village Board, staff and residents, and coordination of community events among other areas of responsibility.
COMMUNITY DEVELOPMENT / BUILDING DEPT
The Community Development Department is responsible for the review and issuance of building permits and inspections of work for conformance with the building codes. Before making any additions, alterations or changes to the structure of your home, contact the Community Development Department. For building code requirements for any project you are considering, please contact the Community Development Department by phone at (847) 551-3805 or by email at [email protected]. The Community Development Department also promotes economic growth and well-being for the community’s tax base by working closely with our local businesses and pursuing economic development opportunities for the community. The Community Development Department provides support to the Planning and Zoning Commission and Appearance Review Commission.
FIRE DEPARTMENT
The Village of West Dundee’s Fire Department is located at Public Safety Center #2, 100 Carrington Drive and also at Public Safety Center #1, 555 S. Eighth Street. It is manned 24 hours and is rated in the top 5% statewide.

5
All West Dundee firefighters are state certified in firefighting techniques and many are certified as paramedics. The department provides advanced life support emergency medical care, fire suppression, hazardous material mitigation, above & below grade technical rescue, and dive rescue & recovery operations. The Fire Department administers public education and safety programs and life safety inspections in an effort to further reduce personal injury, loss of life, and property loss.
POLICE DEPARTMENT The Village of West Dundee Police Department, located in Public Safety Center #1, 555 S. Eighth St. (Rt. 31), provides a full service Police Department.
The Police Department provides 24 hour protection for both residents and the thousands of shopping patrons who support the Village’s business community.
Residents going away from home for an extended period of time can register with the Police Department for the House Watch program. A police officer will check your house at least once per night and monitor for suspicious activity. Please visit wdundee.org/?page=police for additional programs and information.
PUBLIC WORKS
The Village’s Public Works Department located in at 900 Angle Tarn, off Route 31 north of Boncosky Rd, and consists of three divisions: Water & Sewer, Streets and Buildings & Grounds. The Water & Sewer Division operates the Village’s water system, which includes 3 deep-well water sources, 3 elevated water storage towers, 2 water treatment facilities that incorporate an ion exchange treatment process to improve the overall quality of the water, 46 miles of water mains and over 540 fire hydrants. The Streets Division maintains more than 88 lane miles of streets, over 430 street lights, curbs and sidewalks. Street sweeping, storm sewer maintenance, traffic control, snow removal and the free fall leaf collection program are all provided through this division. The Buildings and Grounds Department is responsible for the maintenance and upkeep of the public parkways, public areas such as the Riverwalk, Downtown Business District, and the public buildings such as the Village Hall and Public Safety Centers. Requests for services such as parkway tree trimming, sidewalk repair, pothole repair, inoperable streetlights, etc, can be directed to the Public Works Department by calling (847) 551-3815 between the hours of 7:30 am and 4:00 pm, or by emailing [email protected]. If your request is an emergency, please call 911.
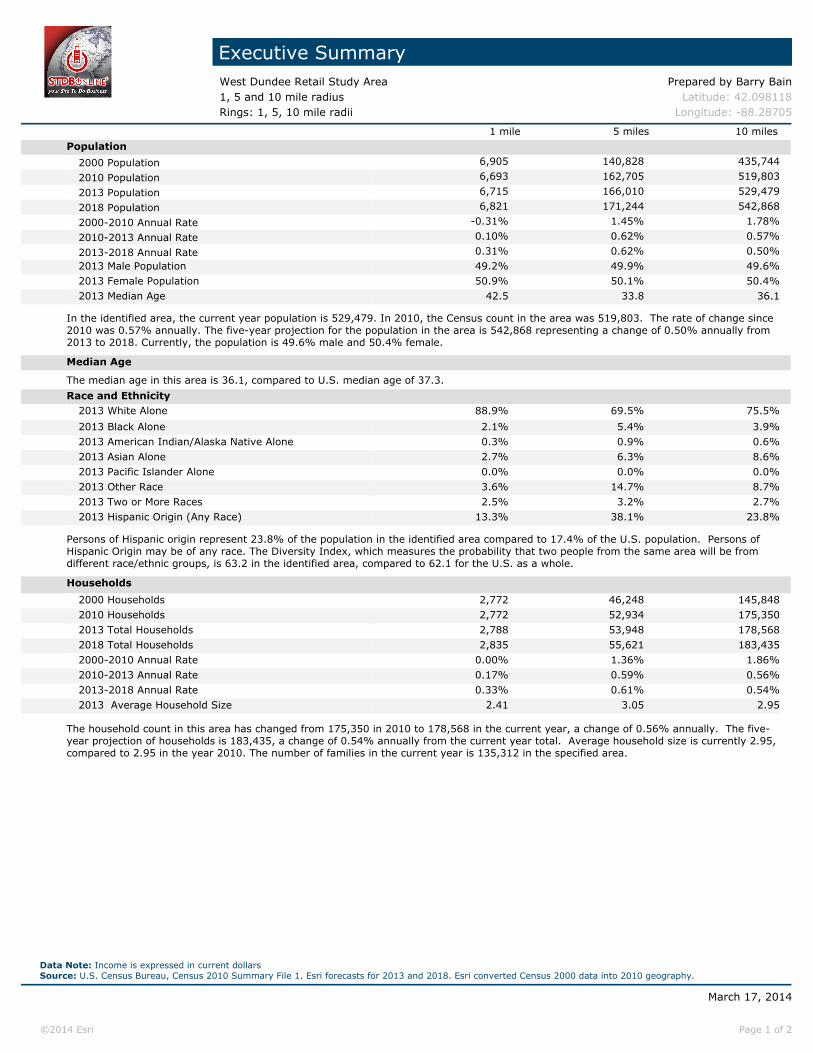
Executive SummaryWest Dundee Retail Study Area Prepared by Barry Bain1, 5 and 10 mile radius Latitude: 42.098118Rings: 1, 5, 10 mile radii Longitude: -88.28705
1 mile 5 miles 10 milesPopulation
2000 Population 6,905 140,828 435,744
2010 Population 6,693 162,705 519,803
2013 Population 6,715 166,010 529,479
2018 Population 6,821 171,244 542,868
2000-2010 Annual Rate -0.31% 1.45% 1.78%
2010-2013 Annual Rate 0.10% 0.62% 0.57%
2013-2018 Annual Rate 0.31% 0.62% 0.50%2013 Male Population 49.2% 49.9% 49.6%2013 Female Population 50.9% 50.1% 50.4%2013 Median Age 42.5 33.8 36.1
In the identified area, the current year population is 529,479. In 2010, the Census count in the area was 519,803. The rate of change since2010 was 0.57% annually. The five-year projection for the population in the area is 542,868 representing a change of 0.50% annually from2013 to 2018. Currently, the population is 49.6% male and 50.4% female.
Median Age
The median age in this area is 36.1, compared to U.S. median age of 37.3.
Race and Ethnicity2013 White Alone 88.9% 69.5% 75.5%
2013 Black Alone 2.1% 5.4% 3.9%2013 American Indian/Alaska Native Alone 0.3% 0.9% 0.6%2013 Asian Alone 2.7% 6.3% 8.6%2013 Pacific Islander Alone 0.0% 0.0% 0.0%2013 Other Race 3.6% 14.7% 8.7%2013 Two or More Races 2.5% 3.2% 2.7%2013 Hispanic Origin (Any Race) 13.3% 38.1% 23.8%
Persons of Hispanic origin represent 23.8% of the population in the identified area compared to 17.4% of the U.S. population. Persons ofHispanic Origin may be of any race. The Diversity Index, which measures the probability that two people from the same area will be fromdifferent race/ethnic groups, is 63.2 in the identified area, compared to 62.1 for the U.S. as a whole.
Households
2000 Households 2,772 46,248 145,8482010 Households 2,772 52,934 175,3502013 Total Households 2,788 53,948 178,5682018 Total Households 2,835 55,621 183,4352000-2010 Annual Rate 0.00% 1.36% 1.86%2010-2013 Annual Rate 0.17% 0.59% 0.56%2013-2018 Annual Rate 0.33% 0.61% 0.54%2013 Average Household Size 2.41 3.05 2.95
The household count in this area has changed from 175,350 in 2010 to 178,568 in the current year, a change of 0.56% annually. The five-year projection of households is 183,435, a change of 0.54% annually from the current year total. Average household size is currently 2.95,compared to 2.95 in the year 2010. The number of families in the current year is 135,312 in the specified area.
March 17, 2014
©2014 Esri Page 1 of 2
Data Note: Income is expressed in current dollarsSource: U.S. Census Bureau, Census 2010 Summary File 1. Esri forecasts for 2013 and 2018. Esri converted Census 2000 data into 2010 geography.

Executive SummaryWest Dundee Retail Study Area Prepared by Barry Bain1, 5 and 10 mile radius Latitude: 42.098118Rings: 1, 5, 10 mile radii Longitude: -88.28705
1 mile 5 miles 10 milesMedian Household Income
2013 Median Household Income $69,036 $63,328 $76,4092018 Median Household Income $81,686 $76,996 $86,2542013-2018 Annual Rate 3.42% 3.99% 2.45%
Average Household Income
2013 Average Household Income $86,346 $82,740 $94,9772018 Average Household Income $99,647 $94,345 $107,8072013-2018 Annual Rate 2.91% 2.66% 2.57%
Per Capita Income
2013 Per Capita Income $34,692 $27,107 $32,1682018 Per Capita Income $40,094 $30,860 $36,5622013-2018 Annual Rate 2.94% 2.63% 2.59%
Households by Income
Current median household income is $76,409 in the area, compared to $51,314 for all U.S. households. Median household income isprojected to be $86,254 in five years, compared to $59,580 for all U.S. households
Current average household income is $94,977 in this area, compared to $71,842 for all U.S households. Average household income isprojected to be $107,807 in five years, compared to $83,667 for all U.S. households
Current per capita income is $32,168 in the area, compared to the U.S. per capita income of $27,567. The per capita income is projected tobe $36,562 in five years, compared to $32,073 for all U.S. households Housing
2000 Total Housing Units 2,860 47,767 149,9062000 Owner Occupied Housing Units 2,015 35,163 120,4762000 Owner Occupied Housing Units 757 11,085 25,3722000 Vacant Housing Units 88 1,519 4,058
2010 Total Housing Units 2,951 56,599 185,0932010 Owner Occupied Housing Units 2,007 39,567 144,1192010 Renter Occupied Housing Units 765 13,367 31,2312010 Vacant Housing Units 179 3,665 9,743
2013 Total Housing Units 2,962 57,457 188,2742013 Owner Occupied Housing Units 1,964 39,538 144,8252013 Renter Occupied Housing Units 824 14,410 33,7422013 Vacant Housing Units 174 3,509 9,706
2018 Total Housing Units 3,046 58,989 192,0422018 Owner Occupied Housing Units 2,041 41,297 150,1502018 Renter Occupied Housing Units 794 14,323 33,2852018 Vacant Housing Units 211 3,368 8,607
Currently, 76.9% of the 188,274 housing units in the area are owner occupied; 17.9%, renter occupied; and 5.2% are vacant. Currently, inthe U.S., 56.4% of the housing units in the area are owner occupied; 32.3% are renter occupied; and 11.3% are vacant. In 2010, therewere 185,093 housing units in the area - 77.9% owner occupied, 16.9% renter occupied, and 5.3% vacant. The annual rate of change inhousing units since 2010 is 0.76%. Median home value in the area is $219,926, compared to a median home value of $177,257 for the U.S.In five years, median value is projected to change by 2.70% annually to $251,254.
March 17, 2014
©2014 Esri Page 2 of 2
Data Note: Income is expressed in current dollarsSource: U.S. Census Bureau, Census 2010 Summary File 1. Esri forecasts for 2013 and 2018. Esri converted Census 2000 data into 2010 geography.
Demographic and Income ProfileWest Dundee Retail Study Area Prepared by Barry Bain1, 5 and 10 mile radius Latitude: 42.098118Ring: 1 mile radius Longitude: -88.28705
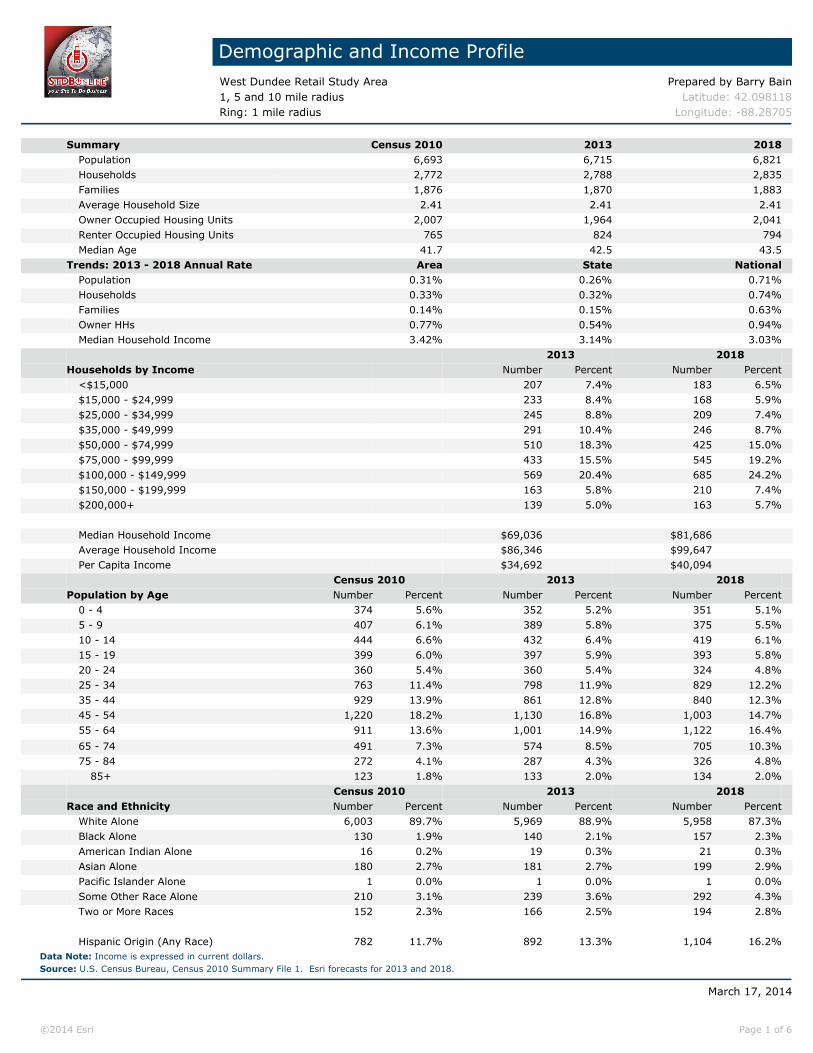
Summary Census 2010 2013 2018Population 6,693 6,715 6,821Households 2,772 2,788 2,835Families 1,876 1,870 1,883Average Household Size 2.41 2.41 2.41Owner Occupied Housing Units 2,007 1,964 2,041Renter Occupied Housing Units 765 824 794Median Age 41.7 42.5 43.5
Trends: 2013 - 2018 Annual Rate Area State NationalPopulation 0.31% 0.26% 0.71%Households 0.33% 0.32% 0.74%Families 0.14% 0.15% 0.63%Owner HHs 0.77% 0.54% 0.94%Median Household Income 3.42% 3.14% 3.03%
2013 2018 Households by Income Number Percent Number Percent
<$15,000 207 7.4% 183 6.5%$15,000 - $24,999 233 8.4% 168 5.9%$25,000 - $34,999 245 8.8% 209 7.4%$35,000 - $49,999 291 10.4% 246 8.7%$50,000 - $74,999 510 18.3% 425 15.0%$75,000 - $99,999 433 15.5% 545 19.2%$100,000 - $149,999 569 20.4% 685 24.2%$150,000 - $199,999 163 5.8% 210 7.4%$200,000+ 139 5.0% 163 5.7%
Median Household Income $69,036 $81,686Average Household Income $86,346 $99,647Per Capita Income $34,692 $40,094
Census 2010 2013 2018 Population by Age Number Percent Number Percent Number Percent
0 - 4 374 5.6% 352 5.2% 351 5.1%5 - 9 407 6.1% 389 5.8% 375 5.5%10 - 14 444 6.6% 432 6.4% 419 6.1%15 - 19 399 6.0% 397 5.9% 393 5.8%20 - 24 360 5.4% 360 5.4% 324 4.8%25 - 34 763 11.4% 798 11.9% 829 12.2%35 - 44 929 13.9% 861 12.8% 840 12.3%45 - 54 1,220 18.2% 1,130 16.8% 1,003 14.7%55 - 64 911 13.6% 1,001 14.9% 1,122 16.4%
65 - 74 491 7.3% 574 8.5% 705 10.3%75 - 84 272 4.1% 287 4.3% 326 4.8%
85+ 123 1.8% 133 2.0% 134 2.0%Census 2010 2013 2018
Race and Ethnicity Number Percent Number Percent Number PercentWhite Alone 6,003 89.7% 5,969 88.9% 5,958 87.3%Black Alone 130 1.9% 140 2.1% 157 2.3%American Indian Alone 16 0.2% 19 0.3% 21 0.3%Asian Alone 180 2.7% 181 2.7% 199 2.9%Pacific Islander Alone 1 0.0% 1 0.0% 1 0.0%Some Other Race Alone 210 3.1% 239 3.6% 292 4.3%Two or More Races 152 2.3% 166 2.5% 194 2.8%
Hispanic Origin (Any Race) 782 11.7% 892 13.3% 1,104 16.2%Data Note: Income is expressed in current dollars.
March 17, 2014
©2014 Esri Page 1 of 6
Source: U.S. Census Bureau, Census 2010 Summary File 1. Esri forecasts for 2013 and 2018.

Demographic and Income ProfileWest Dundee Retail Study Area Prepared by Barry Bain1, 5 and 10 mile radius Latitude: 42.098118Ring: 1 mile radius Longitude: -88.28705
AreaStateUSA
Trends 2013-2018
Population Households Families Owner HHs Median HH Income
Annual
Rat
e (i
n p
erce
nt)
3
2.5
2
1.5
1
0.5
0
20132018
Population by Age
0-4 5-9 10-14 15-19 20-24 25-34 35-44 45-54 55-64 65-74 75-84 85+
Perc
ent
16
14
12
10
8
6
4
2
0
2013 Household Income
<$15K7.4%
$15K - $24K8.4%
$25K - $34K8.8%
$35K - $49K10.4%
$50K - $74K18.3%
$75K - $99K15.5%
$100K - $149K20.4%
$150K - $199K5.8%
$200K+5.0%
2013 Population by Race
White Black Am. Ind. Asian Pacific Other Two+
Perc
ent
80
70
60
50
40
30
20
10
0
2013 Percent Hispanic Origin: 13.3%
March 17, 2014
©2014 Esri Page 2 of 6
Source: U.S. Census Bureau, Census 2010 Summary File 1. Esri forecasts for 2013 and 2018.

Demographic and Income ProfileWest Dundee Retail Study Area Prepared by Barry Bain1, 5 and 10 mile radius Latitude: 42.098118Ring: 5 mile radius Longitude: -88.28705
Summary Census 2010 2013 2018Population 162,705 166,010 171,244Households 52,934 53,948 55,621Families 39,574 40,072 41,037Average Household Size 3.04 3.05 3.05Owner Occupied Housing Units 39,567 39,538 41,297Renter Occupied Housing Units 13,367 14,410 14,323Median Age 33.4 33.8 34.4
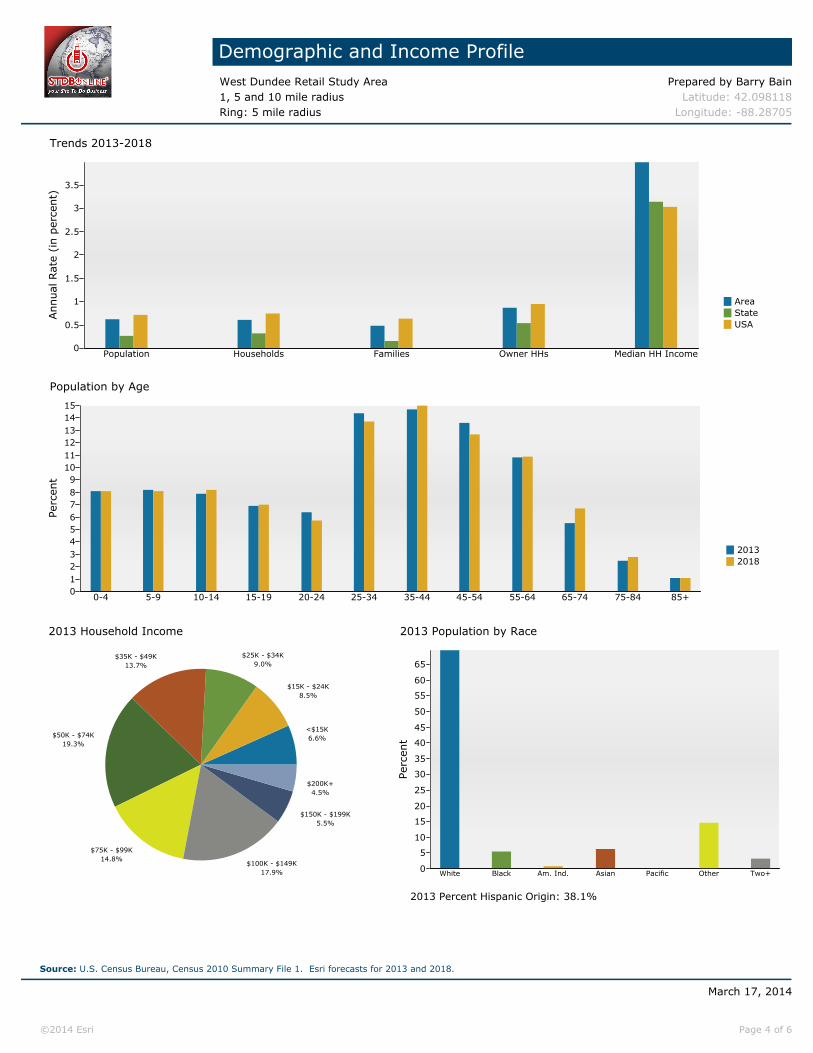
Trends: 2013 - 2018 Annual Rate Area State NationalPopulation 0.62% 0.26% 0.71%Households 0.61% 0.32% 0.74%Families 0.48% 0.15% 0.63%Owner HHs 0.87% 0.54% 0.94%Median Household Income 3.99% 3.14% 3.03%
2013 2018 Households by Income Number Percent Number Percent
<$15,000 3,569 6.6% 3,384 6.1%$15,000 - $24,999 4,589 8.5% 3,530 6.3%$25,000 - $34,999 4,854 9.0% 4,485 8.1%$35,000 - $49,999 7,412 13.7% 6,462 11.6%$50,000 - $74,999 10,439 19.4% 8,810 15.8%$75,000 - $99,999 8,000 14.8% 10,300 18.5%$100,000 - $149,999 9,667 17.9% 11,875 21.3%$150,000 - $199,999 2,978 5.5% 3,941 7.1%$200,000+ 2,442 4.5% 2,834 5.1%
Median Household Income $63,328 $76,996Average Household Income $82,740 $94,345Per Capita Income $27,107 $30,860
Census 2010 2013 2018 Population by Age Number Percent Number Percent Number Percent
0 - 4 13,585 8.3% 13,440 8.1% 13,910 8.1%5 - 9 13,515 8.3% 13,542 8.2% 13,866 8.1%10 - 14 12,536 7.7% 13,139 7.9% 14,036 8.2%15 - 19 11,562 7.1% 11,422 6.9% 11,931 7.0%20 - 24 10,148 6.2% 10,668 6.4% 9,750 5.7%25 - 34 23,965 14.7% 23,899 14.4% 23,490 13.7%35 - 44 24,588 15.1% 24,371 14.7% 25,652 15.0%45 - 54 22,967 14.1% 22,560 13.6% 21,791 12.7%55 - 64 16,245 10.0% 17,909 10.8% 18,749 10.9%
65 - 74 7,733 4.8% 9,081 5.5% 11,423 6.7%75 - 84 4,091 2.5% 4,128 2.5% 4,738 2.8%
85+ 1,769 1.1% 1,852 1.1% 1,908 1.1%Census 2010 2013 2018
Race and Ethnicity Number Percent Number Percent Number PercentWhite Alone 114,862 70.6% 115,451 69.5% 115,986 67.7%Black Alone 8,883 5.5% 9,037 5.4% 9,231 5.4%American Indian Alone 1,389 0.9% 1,446 0.9% 1,605 0.9%Asian Alone 10,180 6.3% 10,401 6.3% 11,188 6.5%Pacific Islander Alone 62 0.0% 68 0.0% 72 0.0%Some Other Race Alone 22,386 13.8% 24,346 14.7% 27,420 16.0%Two or More Races 4,943 3.0% 5,261 3.2% 5,742 3.4%
Hispanic Origin (Any Race) 58,319 35.8% 63,177 38.1% 71,264 41.6%Data Note: Income is expressed in current dollars.
March 17, 2014
©2014 Esri Page 3 of 6
Source: U.S. Census Bureau, Census 2010 Summary File 1. Esri forecasts for 2013 and 2018.
Demographic and Income ProfileWest Dundee Retail Study Area Prepared by Barry Bain1, 5 and 10 mile radius Latitude: 42.098118Ring: 5 mile radius Longitude: -88.28705
AreaStateUSA
Trends 2013-2018
Population Households Families Owner HHs Median HH Income
Annual
Rat
e (i
n p
erce
nt)
3.5
3
2.5
2
1.5
1
0.5
0
20132018
Population by Age
0-4 5-9 10-14 15-19 20-24 25-34 35-44 45-54 55-64 65-74 75-84 85+
Perc
ent
1514131211109876543210
2013 Household Income
<$15K6.6%
$15K - $24K8.5%
$25K - $34K9.0%
$35K - $49K13.7%
$50K - $74K19.3%
$75K - $99K14.8%
$100K - $149K17.9%
$150K - $199K5.5%
$200K+4.5%
2013 Population by Race
White Black Am. Ind. Asian Pacific Other Two+
Perc
ent
65
60
55
50
45
40
35
30
25
20
15
10
5
0
2013 Percent Hispanic Origin: 38.1%
March 17, 2014
©2014 Esri Page 4 of 6
Source: U.S. Census Bureau, Census 2010 Summary File 1. Esri forecasts for 2013 and 2018.

Demographic and Income ProfileWest Dundee Retail Study Area Prepared by Barry Bain1, 5 and 10 mile radius Latitude: 42.098118Ring: 10 mile radius Longitude: -88.28705
Summary Census 2010 2013 2018Population 519,803 529,479 542,868Households 175,350 178,568 183,435Families 133,627 135,312 138,178Average Household Size 2.95 2.95 2.94Owner Occupied Housing Units 144,119 144,825 150,150Renter Occupied Housing Units 31,231 33,742 33,285Median Age 35.7 36.1 36.7
Trends: 2013 - 2018 Annual Rate Area State NationalPopulation 0.50% 0.26% 0.71%Households 0.54% 0.32% 0.74%Families 0.42% 0.15% 0.63%Owner HHs 0.72% 0.54% 0.94%Median Household Income 2.45% 3.14% 3.03%
2013 2018 Households by Income Number Percent Number Percent
<$15,000 9,547 5.3% 8,831 4.8%$15,000 - $24,999 12,435 7.0% 9,260 5.0%$25,000 - $34,999 12,779 7.2% 11,383 6.2%$35,000 - $49,999 19,404 10.9% 16,478 9.0%$50,000 - $74,999 32,948 18.5% 26,858 14.6%$75,000 - $99,999 28,348 15.9% 35,397 19.3%$100,000 - $149,999 37,770 21.2% 44,742 24.4%$150,000 - $199,999 14,031 7.9% 17,791 9.7%$200,000+ 11,302 6.3% 12,691 6.9%
Median Household Income $76,409 $86,254Average Household Income $94,977 $107,807Per Capita Income $32,168 $36,562
Census 2010 2013 2018 Population by Age Number Percent Number Percent Number Percent
0 - 4 38,694 7.4% 38,096 7.2% 39,250 7.2%5 - 9 41,506 8.0% 40,962 7.7% 41,729 7.7%10 - 14 41,333 8.0% 41,997 7.9% 43,735 8.1%15 - 19 37,133 7.1% 36,416 6.9% 36,488 6.7%20 - 24 27,381 5.3% 30,128 5.7% 27,527 5.1%25 - 34 68,310 13.1% 68,581 13.0% 68,252 12.6%35 - 44 81,471 15.7% 78,877 14.9% 81,896 15.1%45 - 54 79,392 15.3% 78,230 14.8% 74,551 13.7%55 - 64 55,968 10.8% 61,334 11.6% 64,475 11.9%
65 - 74 28,849 5.5% 33,733 6.4% 40,818 7.5%75 - 84 14,256 2.7% 15,141 2.9% 17,672 3.3%
85+ 5,510 1.1% 5,985 1.1% 6,475 1.2%Census 2010 2013 2018
Race and Ethnicity Number Percent Number Percent Number PercentWhite Alone 397,038 76.4% 399,542 75.5% 400,063 73.7%Black Alone 19,824 3.8% 20,674 3.9% 22,004 4.1%American Indian Alone 3,100 0.6% 3,219 0.6% 3,594 0.7%Asian Alone 43,916 8.4% 45,402 8.6% 49,071 9.0%Pacific Islander Alone 148 0.0% 159 0.0% 176 0.0%Some Other Race Alone 42,573 8.2% 46,278 8.7% 52,225 9.6%Two or More Races 13,204 2.5% 14,204 2.7% 15,736 2.9%
Hispanic Origin (Any Race) 116,298 22.4% 126,094 23.8% 142,889 26.3%Data Note: Income is expressed in current dollars.
March 17, 2014
©2014 Esri Page 5 of 6
Source: U.S. Census Bureau, Census 2010 Summary File 1. Esri forecasts for 2013 and 2018.

Demographic and Income ProfileWest Dundee Retail Study Area Prepared by Barry Bain1, 5 and 10 mile radius Latitude: 42.098118Ring: 10 mile radius Longitude: -88.28705
AreaStateUSA
Trends 2013-2018
Population Households Families Owner HHs Median HH Income
Annual
Rat
e (i
n p
erce
nt)
3
2.5
2
1.5
1
0.5
0
20132018
Population by Age
0-4 5-9 10-14 15-19 20-24 25-34 35-44 45-54 55-64 65-74 75-84 85+
Perc
ent
1514131211109876543210
2013 Household Income
<$15K5.3%
$15K - $24K7.0%
$25K - $34K7.2%
$35K - $49K10.9%
$50K - $74K18.5%
$75K - $99K15.9%
$100K - $149K21.2%
$150K - $199K7.9%
$200K+6.3%
2013 Population by Race
White Black Am. Ind. Asian Pacific Other Two+
Perc
ent
75
70
65
60
55
50
45
40
35
30
25
20
15
10
5
0
2013 Percent Hispanic Origin: 23.8%
March 17, 2014
©2014 Esri Page 6 of 6
Source: U.S. Census Bureau, Census 2010 Summary File 1. Esri forecasts for 2013 and 2018.

Business SummaryWest Dundee Retail Study Area Prepared by Barry Bain1, 5 and 10 mile radius Latitude: 42.098118Rings: 1, 5, 10 mile radii Longitude: -88.28705
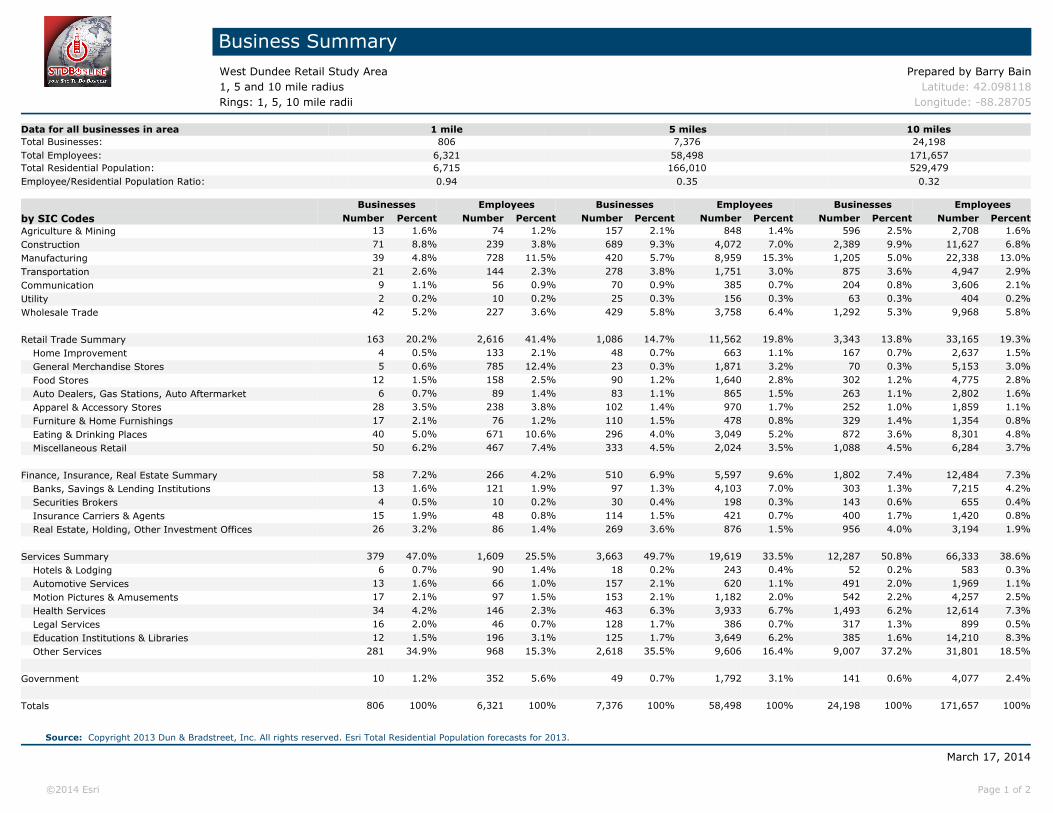
Data for all businesses in area 1 mile 5 miles 10 milesTotal Businesses: 806 7,376 24,198Total Employees: 6,321 58,498 171,657Total Residential Population: 6,715 166,010 529,479Employee/Residential Population Ratio: 0.94 0.35 0.32
Businesses Employees Businesses Employees Businesses Employees
by SIC Codes Number Percent Number Percent Number Percent Number Percent Number Percent Number PercentAgriculture & Mining 13 1.6% 74 1.2% 157 2.1% 848 1.4% 596 2.5% 2,708 1.6%Construction 71 8.8% 239 3.8% 689 9.3% 4,072 7.0% 2,389 9.9% 11,627 6.8%Manufacturing 39 4.8% 728 11.5% 420 5.7% 8,959 15.3% 1,205 5.0% 22,338 13.0%Transportation 21 2.6% 144 2.3% 278 3.8% 1,751 3.0% 875 3.6% 4,947 2.9%Communication 9 1.1% 56 0.9% 70 0.9% 385 0.7% 204 0.8% 3,606 2.1%Utility 2 0.2% 10 0.2% 25 0.3% 156 0.3% 63 0.3% 404 0.2%Wholesale Trade 42 5.2% 227 3.6% 429 5.8% 3,758 6.4% 1,292 5.3% 9,968 5.8%
Retail Trade Summary 163 20.2% 2,616 41.4% 1,086 14.7% 11,562 19.8% 3,343 13.8% 33,165 19.3%Home Improvement 4 0.5% 133 2.1% 48 0.7% 663 1.1% 167 0.7% 2,637 1.5%General Merchandise Stores 5 0.6% 785 12.4% 23 0.3% 1,871 3.2% 70 0.3% 5,153 3.0%Food Stores 12 1.5% 158 2.5% 90 1.2% 1,640 2.8% 302 1.2% 4,775 2.8%Auto Dealers, Gas Stations, Auto Aftermarket 6 0.7% 89 1.4% 83 1.1% 865 1.5% 263 1.1% 2,802 1.6%Apparel & Accessory Stores 28 3.5% 238 3.8% 102 1.4% 970 1.7% 252 1.0% 1,859 1.1%Furniture & Home Furnishings 17 2.1% 76 1.2% 110 1.5% 478 0.8% 329 1.4% 1,354 0.8%Eating & Drinking Places 40 5.0% 671 10.6% 296 4.0% 3,049 5.2% 872 3.6% 8,301 4.8%Miscellaneous Retail 50 6.2% 467 7.4% 333 4.5% 2,024 3.5% 1,088 4.5% 6,284 3.7%
Finance, Insurance, Real Estate Summary 58 7.2% 266 4.2% 510 6.9% 5,597 9.6% 1,802 7.4% 12,484 7.3%Banks, Savings & Lending Institutions 13 1.6% 121 1.9% 97 1.3% 4,103 7.0% 303 1.3% 7,215 4.2%Securities Brokers 4 0.5% 10 0.2% 30 0.4% 198 0.3% 143 0.6% 655 0.4%Insurance Carriers & Agents 15 1.9% 48 0.8% 114 1.5% 421 0.7% 400 1.7% 1,420 0.8%Real Estate, Holding, Other Investment Offices 26 3.2% 86 1.4% 269 3.6% 876 1.5% 956 4.0% 3,194 1.9%
Services Summary 379 47.0% 1,609 25.5% 3,663 49.7% 19,619 33.5% 12,287 50.8% 66,333 38.6%Hotels & Lodging 6 0.7% 90 1.4% 18 0.2% 243 0.4% 52 0.2% 583 0.3%Automotive Services 13 1.6% 66 1.0% 157 2.1% 620 1.1% 491 2.0% 1,969 1.1%Motion Pictures & Amusements 17 2.1% 97 1.5% 153 2.1% 1,182 2.0% 542 2.2% 4,257 2.5%Health Services 34 4.2% 146 2.3% 463 6.3% 3,933 6.7% 1,493 6.2% 12,614 7.3%Legal Services 16 2.0% 46 0.7% 128 1.7% 386 0.7% 317 1.3% 899 0.5%Education Institutions & Libraries 12 1.5% 196 3.1% 125 1.7% 3,649 6.2% 385 1.6% 14,210 8.3%Other Services 281 34.9% 968 15.3% 2,618 35.5% 9,606 16.4% 9,007 37.2% 31,801 18.5%
Government 10 1.2% 352 5.6% 49 0.7% 1,792 3.1% 141 0.6% 4,077 2.4%
Totals 806 100% 6,321 100% 7,376 100% 58,498 100% 24,198 100% 171,657 100%
March 17, 2014
©2014 Esri Page 1 of 2
Source: Copyright 2013 Dun & Bradstreet, Inc. All rights reserved. Esri Total Residential Population forecasts for 2013.

Business SummaryWest Dundee Retail Study Area Prepared by Barry Bain1, 5 and 10 mile radius Latitude: 42.098118Rings: 1, 5, 10 mile radii Longitude: -88.28705
Businesses Employees Businesses Employees Businesses Employees
by NAICS Codes Number Percent Number Percent Number Percent Number Percent Number Percent Number PercentAgriculture, Forestry, Fishing & Hunting 1 0.1% 9 0.1% 27 0.4% 113 0.2% 149 0.6% 473 0.3%Mining 1 0.1% 5 0.1% 6 0.1% 61 0.1% 13 0.1% 137 0.1%Utilities 1 0.1% 6 0.1% 8 0.1% 58 0.1% 21 0.1% 123 0.1%Construction 72 8.9% 240 3.8% 705 9.6% 4,110 7.0% 2,440 10.1% 11,756 6.8%Manufacturing 41 5.1% 735 11.6% 433 5.9% 8,943 15.3% 1,219 5.0% 22,266 13.0%Wholesale Trade 42 5.2% 227 3.6% 425 5.8% 3,752 6.4% 1,277 5.3% 9,927 5.8%Retail Trade 120 14.9% 1,916 30.3% 768 10.4% 8,361 14.3% 2,423 10.0% 24,558 14.3%
Motor Vehicle & Parts Dealers 4 0.5% 72 1.1% 53 0.7% 705 1.2% 181 0.7% 2,380 1.4%Furniture & Home Furnishings Stores 10 1.2% 42 0.7% 57 0.8% 186 0.3% 168 0.7% 627 0.4%Electronics & Appliance Stores 8 1.0% 44 0.7% 46 0.6% 279 0.5% 155 0.6% 723 0.4%Bldg Material & Garden Equipment & Supplies Dealers 4 0.5% 133 2.1% 48 0.7% 663 1.1% 165 0.7% 2,633 1.5%Food & Beverage Stores 9 1.1% 134 2.1% 84 1.1% 1,617 2.8% 281 1.2% 4,652 2.7%Health & Personal Care Stores 11 1.4% 243 3.8% 64 0.9% 955 1.6% 201 0.8% 2,737 1.6%Gasoline Stations 3 0.4% 17 0.3% 30 0.4% 160 0.3% 82 0.3% 422 0.2%Clothing & Clothing Accessories Stores 33 4.1% 262 4.1% 129 1.7% 1,041 1.8% 316 1.3% 2,034 1.2%Sport Goods, Hobby, Book, & Music Stores 10 1.2% 101 1.6% 55 0.7% 282 0.5% 175 0.7% 929 0.5%General Merchandise Stores 5 0.6% 785 12.4% 23 0.3% 1,871 3.2% 70 0.3% 5,153 3.0%Miscellaneous Store Retailers 19 2.4% 77 1.2% 144 2.0% 522 0.9% 489 2.0% 1,980 1.2%Nonstore Retailers 4 0.5% 5 0.1% 34 0.5% 80 0.1% 141 0.6% 288 0.2%
Transportation & Warehousing 17 2.1% 129 2.0% 259 3.5% 1,644 2.8% 789 3.3% 4,651 2.7%Information 20 2.5% 151 2.4% 165 2.2% 949 1.6% 520 2.1% 5,631 3.3%Finance & Insurance 36 4.5% 193 3.1% 273 3.7% 4,803 8.2% 1,004 4.1% 9,626 5.6%
Central Bank/Credit Intermediation & Related Activities 13 1.6% 121 1.9% 96 1.3% 4,094 7.0% 300 1.2% 7,194 4.2%Securities, Commodity Contracts & Other Financial 7 0.9% 24 0.4% 60 0.8% 281 0.5% 294 1.2% 992 0.6%Insurance Carriers & Related Activities; Funds, Trusts & 15 1.9% 48 0.8% 118 1.6% 428 0.7% 409 1.7% 1,439 0.8%
Real Estate, Rental & Leasing 26 3.2% 89 1.4% 263 3.6% 975 1.7% 863 3.6% 3,310 1.9%Professional, Scientific & Tech Services 127 15.8% 427 6.8% 1,044 14.2% 3,700 6.3% 3,662 15.1% 11,372 6.6%
Legal Services 16 2.0% 47 0.7% 132 1.8% 391 0.7% 332 1.4% 971 0.6%Management of Companies & Enterprises 3 0.4% 8 0.1% 15 0.2% 65 0.1% 45 0.2% 165 0.1%Administrative & Support & Waste Management & Remediation 95 11.8% 293 4.6% 1,086 14.7% 3,216 5.5% 3,765 15.6% 12,670 7.4%Educational Services 12 1.5% 181 2.9% 134 1.8% 3,477 5.9% 458 1.9% 13,983 8.1%Health Care & Social Assistance 44 5.5% 196 3.1% 571 7.7% 5,000 8.5% 1,871 7.7% 15,257 8.9%Arts, Entertainment & Recreation 14 1.7% 70 1.1% 118 1.6% 1,079 1.8% 391 1.6% 3,645 2.1%Accommodation & Food Services 46 5.7% 763 12.1% 319 4.3% 3,351 5.7% 936 3.9% 8,990 5.2%
Accommodation 6 0.7% 90 1.4% 17 0.2% 242 0.4% 50 0.2% 575 0.3%Food Services & Drinking Places 40 5.0% 673 10.6% 302 4.1% 3,109 5.3% 886 3.7% 8,415 4.9%
Other Services (except Public Administration) 79 9.8% 334 5.3% 708 9.6% 3,050 5.2% 2,213 9.1% 9,117 5.3%Automotive Repair & Maintenance 11 1.4% 62 1.0% 137 1.9% 513 0.9% 421 1.7% 1,658 1.0%
Public Administration 10 1.2% 352 5.6% 49 0.7% 1,792 3.1% 140 0.6% 4,000 2.3%
Total 806 100% 6,321 100% 7,376 100% 58,498 100% 24,198 100% 171,657 100%
March 17, 2014
©2014 Esri Page 2 of 2
Source: Copyright 2013 Dun & Bradstreet, Inc. All rights reserved. Esri Total Residential Population forecasts for 2013.
Retail MarketPlace ProfileWest Dundee Retail Study Area Prepared by Barry Bain1, 5 and 10 mile radius Latitude: 42.098118Ring: 1 mile radius Longitude: -88.28705
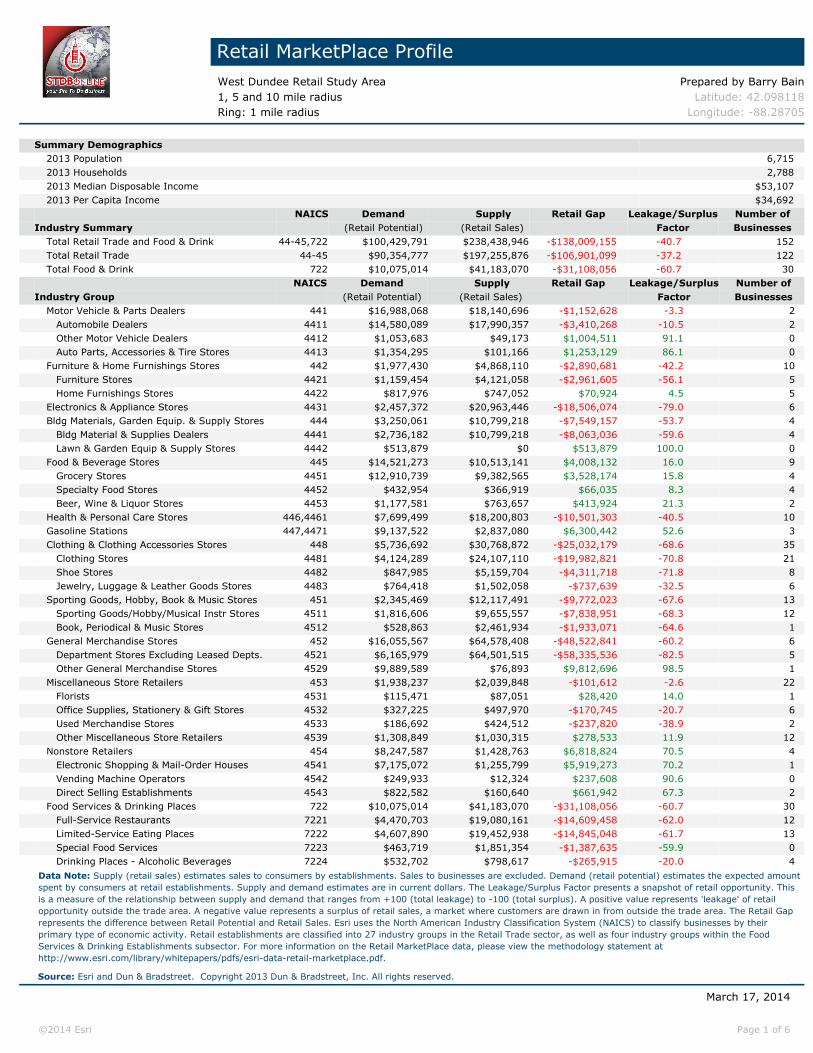
Summary Demographics2013 Population 6,7152013 Households 2,7882013 Median Disposable Income $53,1072013 Per Capita Income $34,692
NAICS Demand Supply Retail Gap Leakage/Surplus Number ofIndustry Summary (Retail Potential) (Retail Sales) Factor Businesses
Total Retail Trade and Food & Drink 44-45,722 $100,429,791 $238,438,946 -$138,009,155 -40.7 152Total Retail Trade 44-45 $90,354,777 $197,255,876 -$106,901,099 -37.2 122Total Food & Drink 722 $10,075,014 $41,183,070 -$31,108,056 -60.7 30
NAICS Demand Supply Retail Gap Leakage/Surplus Number ofIndustry Group (Retail Potential) (Retail Sales) Factor Businesses
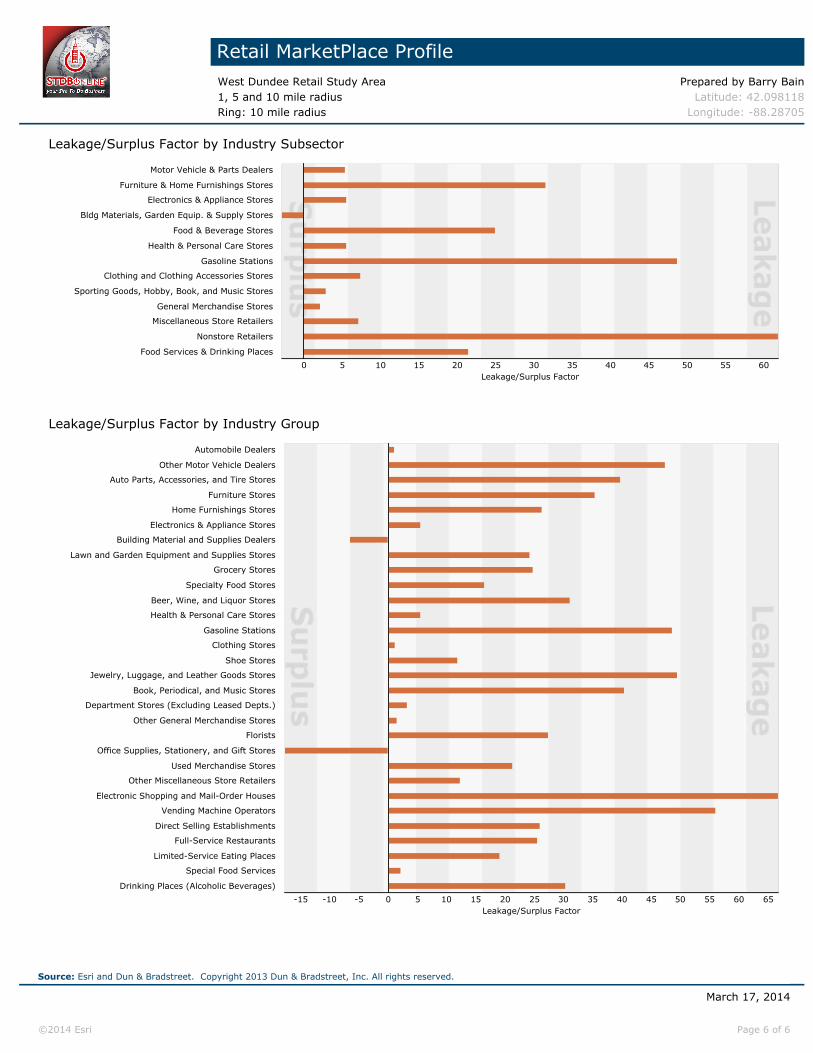
Motor Vehicle & Parts Dealers 441 $16,988,068 $18,140,696 -$1,152,628 -3.3 2 Automobile Dealers 4411 $14,580,089 $17,990,357 -$3,410,268 -10.5 2 Other Motor Vehicle Dealers 4412 $1,053,683 $49,173 $1,004,511 91.1 0 Auto Parts, Accessories & Tire Stores 4413 $1,354,295 $101,166 $1,253,129 86.1 0Furniture & Home Furnishings Stores 442 $1,977,430 $4,868,110 -$2,890,681 -42.2 10 Furniture Stores 4421 $1,159,454 $4,121,058 -$2,961,605 -56.1 5 Home Furnishings Stores 4422 $817,976 $747,052 $70,924 4.5 5Electronics & Appliance Stores 4431 $2,457,372 $20,963,446 -$18,506,074 -79.0 6Bldg Materials, Garden Equip. & Supply Stores 444 $3,250,061 $10,799,218 -$7,549,157 -53.7 4 Bldg Material & Supplies Dealers 4441 $2,736,182 $10,799,218 -$8,063,036 -59.6 4 Lawn & Garden Equip & Supply Stores 4442 $513,879 $0 $513,879 100.0 0Food & Beverage Stores 445 $14,521,273 $10,513,141 $4,008,132 16.0 9 Grocery Stores 4451 $12,910,739 $9,382,565 $3,528,174 15.8 4 Specialty Food Stores 4452 $432,954 $366,919 $66,035 8.3 4 Beer, Wine & Liquor Stores 4453 $1,177,581 $763,657 $413,924 21.3 2Health & Personal Care Stores 446,4461 $7,699,499 $18,200,803 -$10,501,303 -40.5 10Gasoline Stations 447,4471 $9,137,522 $2,837,080 $6,300,442 52.6 3Clothing & Clothing Accessories Stores 448 $5,736,692 $30,768,872 -$25,032,179 -68.6 35 Clothing Stores 4481 $4,124,289 $24,107,110 -$19,982,821 -70.8 21 Shoe Stores 4482 $847,985 $5,159,704 -$4,311,718 -71.8 8 Jewelry, Luggage & Leather Goods Stores 4483 $764,418 $1,502,058 -$737,639 -32.5 6Sporting Goods, Hobby, Book & Music Stores 451 $2,345,469 $12,117,491 -$9,772,023 -67.6 13 Sporting Goods/Hobby/Musical Instr Stores 4511 $1,816,606 $9,655,557 -$7,838,951 -68.3 12 Book, Periodical & Music Stores 4512 $528,863 $2,461,934 -$1,933,071 -64.6 1General Merchandise Stores 452 $16,055,567 $64,578,408 -$48,522,841 -60.2 6 Department Stores Excluding Leased Depts. 4521 $6,165,979 $64,501,515 -$58,335,536 -82.5 5 Other General Merchandise Stores 4529 $9,889,589 $76,893 $9,812,696 98.5 1Miscellaneous Store Retailers 453 $1,938,237 $2,039,848 -$101,612 -2.6 22 Florists 4531 $115,471 $87,051 $28,420 14.0 1 Office Supplies, Stationery & Gift Stores 4532 $327,225 $497,970 -$170,745 -20.7 6 Used Merchandise Stores 4533 $186,692 $424,512 -$237,820 -38.9 2 Other Miscellaneous Store Retailers 4539 $1,308,849 $1,030,315 $278,533 11.9 12Nonstore Retailers 454 $8,247,587 $1,428,763 $6,818,824 70.5 4 Electronic Shopping & Mail-Order Houses 4541 $7,175,072 $1,255,799 $5,919,273 70.2 1 Vending Machine Operators 4542 $249,933 $12,324 $237,608 90.6 0 Direct Selling Establishments 4543 $822,582 $160,640 $661,942 67.3 2Food Services & Drinking Places 722 $10,075,014 $41,183,070 -$31,108,056 -60.7 30 Full-Service Restaurants 7221 $4,470,703 $19,080,161 -$14,609,458 -62.0 12 Limited-Service Eating Places 7222 $4,607,890 $19,452,938 -$14,845,048 -61.7 13 Special Food Services 7223 $463,719 $1,851,354 -$1,387,635 -59.9 0 Drinking Places - Alcoholic Beverages 7224 $532,702 $798,617 -$265,915 -20.0 4
Data Note: Supply (retail sales) estimates sales to consumers by establishments. Sales to businesses are excluded. Demand (retail potential) estimates the expected amountspent by consumers at retail establishments. Supply and demand estimates are in current dollars. The Leakage/Surplus Factor presents a snapshot of retail opportunity. Thisis a measure of the relationship between supply and demand that ranges from +100 (total leakage) to -100 (total surplus). A positive value represents 'leakage' of retailopportunity outside the trade area. A negative value represents a surplus of retail sales, a market where customers are drawn in from outside the trade area. The Retail Gaprepresents the difference between Retail Potential and Retail Sales. Esri uses the North American Industry Classification System (NAICS) to classify businesses by theirprimary type of economic activity. Retail establishments are classified into 27 industry groups in the Retail Trade sector, as well as four industry groups within the FoodServices & Drinking Establishments subsector. For more information on the Retail MarketPlace data, please view the methodology statement athttp://www.esri.com/library/whitepapers/pdfs/esri-data-retail-marketplace.pdf.
March 17, 2014
©2014 Esri Page 1 of 6
Source: Esri and Dun & Bradstreet. Copyright 2013 Dun & Bradstreet, Inc. All rights reserved.

Retail MarketPlace ProfileWest Dundee Retail Study Area Prepared by Barry Bain1, 5 and 10 mile radius Latitude: 42.098118Ring: 1 mile radius Longitude: -88.28705
Leakage/Surplus Factor by Industry Subsector
Leakage/Surplus Factor706050403020100-10-20-30-40-50-60-70
Food Services & Drinking Places
Nonstore Retailers
Miscellaneous Store Retailers
General Merchandise Stores
Sporting Goods, Hobby, Book, and Music Stores
Clothing and Clothing Accessories Stores
Gasoline Stations
Health & Personal Care Stores
Food & Beverage Stores
Bldg Materials, Garden Equip. & Supply Stores
Electronics & Appliance Stores
Furniture & Home Furnishings Stores
Motor Vehicle & Parts Dealers
Leakage/Surplus Factor by Industry Group
Leakage/Surplus Factor1009080706050403020100-10-20-30-40-50-60-70-80
Drinking Places (Alcoholic Beverages)
Special Food Services
Limited-Service Eating Places
Full-Service Restaurants
Direct Selling Establishments
Vending Machine Operators
Electronic Shopping and Mail-Order Houses
Other Miscellaneous Store Retailers
Used Merchandise Stores
Office Supplies, Stationery, and Gift Stores
Florists
Other General Merchandise Stores
Department Stores (Excluding Leased Depts.)
Book, Periodical, and Music Stores
Jewelry, Luggage, and Leather Goods Stores
Shoe Stores
Clothing Stores
Gasoline Stations
Health & Personal Care Stores
Beer, Wine, and Liquor Stores
Specialty Food Stores
Grocery Stores
Lawn and Garden Equipment and Supplies Stores
Building Material and Supplies Dealers
Electronics & Appliance Stores
Home Furnishings Stores
Furniture Stores
Auto Parts, Accessories, and Tire Stores
Other Motor Vehicle Dealers
Automobile Dealers
March 17, 2014
©2014 Esri Page 2 of 6
Source: Esri and Dun & Bradstreet. Copyright 2013 Dun & Bradstreet, Inc. All rights reserved.

Retail MarketPlace ProfileWest Dundee Retail Study Area Prepared by Barry Bain1, 5 and 10 mile radius Latitude: 42.098118Ring: 5 mile radius Longitude: -88.28705
Summary Demographics2013 Population 166,0102013 Households 53,9482013 Median Disposable Income $50,6162013 Per Capita Income $27,107
NAICS Demand Supply Retail Gap Leakage/Surplus Number ofIndustry Summary (Retail Potential) (Retail Sales) Factor Businesses
Total Retail Trade and Food & Drink 44-45,722 $1,843,784,919 $1,322,139,099 $521,645,820 16.5 932Total Retail Trade 44-45 $1,656,861,891 $1,168,378,144 $488,483,747 17.3 761Total Food & Drink 722 $186,923,028 $153,760,955 $33,162,073 9.7 171
NAICS Demand Supply Retail Gap Leakage/Surplus Number ofIndustry Group (Retail Potential) (Retail Sales) Factor Businesses
Motor Vehicle & Parts Dealers 441 $314,224,389 $232,542,236 $81,682,153 14.9 51 Automobile Dealers 4411 $270,934,452 $223,305,302 $47,629,150 9.6 26 Other Motor Vehicle Dealers 4412 $18,735,791 $2,418,703 $16,317,088 77.1 6 Auto Parts, Accessories & Tire Stores 4413 $24,554,146 $6,818,232 $17,735,915 56.5 18Furniture & Home Furnishings Stores 442 $36,077,353 $18,394,517 $17,682,836 32.5 59 Furniture Stores 4421 $21,463,798 $10,930,138 $10,533,660 32.5 25 Home Furnishings Stores 4422 $14,613,555 $7,464,379 $7,149,177 32.4 34Electronics & Appliance Stores 4431 $45,481,818 $70,574,137 -$25,092,319 -21.6 39Bldg Materials, Garden Equip. & Supply Stores 444 $57,922,282 $43,224,237 $14,698,045 14.5 53 Bldg Material & Supplies Dealers 4441 $49,277,470 $38,868,404 $10,409,066 11.8 49 Lawn & Garden Equip & Supply Stores 4442 $8,644,812 $4,355,834 $4,288,978 33.0 4Food & Beverage Stores 445 $267,408,956 $201,439,008 $65,969,948 14.1 81 Grocery Stores 4451 $237,938,628 $183,484,449 $54,454,179 12.9 47 Specialty Food Stores 4452 $7,979,210 $4,887,393 $3,091,818 24.0 18 Beer, Wine & Liquor Stores 4453 $21,491,117 $13,067,166 $8,423,951 24.4 16Health & Personal Care Stores 446,4461 $138,448,458 $114,764,259 $23,684,199 9.4 57Gasoline Stations 447,4471 $170,407,347 $36,471,841 $133,935,506 64.7 29Clothing & Clothing Accessories Stores 448 $105,215,801 $150,927,979 -$45,712,178 -17.8 130 Clothing Stores 4481 $75,412,410 $127,697,102 -$52,284,692 -25.7 84 Shoe Stores 4482 $15,698,694 $15,836,270 -$137,577 -0.4 18 Jewelry, Luggage & Leather Goods Stores 4483 $14,104,696 $7,394,606 $6,710,090 31.2 27Sporting Goods, Hobby, Book & Music Stores 451 $43,654,737 $27,140,191 $16,514,546 23.3 66 Sporting Goods/Hobby/Musical Instr Stores 4511 $33,851,681 $21,486,557 $12,365,123 22.3 55 Book, Periodical & Music Stores 4512 $9,803,057 $5,653,634 $4,149,423 26.8 11General Merchandise Stores 452 $296,166,160 $220,233,445 $75,932,715 14.7 19 Department Stores Excluding Leased Depts. 4521 $114,232,784 $193,142,744 -$78,909,960 -25.7 16 Other General Merchandise Stores 4529 $181,933,376 $27,090,700 $154,842,675 74.1 4Miscellaneous Store Retailers 453 $35,243,823 $19,781,093 $15,462,730 28.1 147 Florists 4531 $1,945,953 $568,973 $1,376,980 54.8 9 Office Supplies, Stationery & Gift Stores 4532 $5,991,533 $5,680,163 $311,370 2.7 40 Used Merchandise Stores 4533 $3,431,377 $2,357,495 $1,073,882 18.6 19 Other Miscellaneous Store Retailers 4539 $23,874,959 $11,174,462 $12,700,497 36.2 79Nonstore Retailers 454 $146,610,767 $32,885,202 $113,725,565 63.4 31 Electronic Shopping & Mail-Order Houses 4541 $129,577,754 $17,498,260 $112,079,494 76.2 8 Vending Machine Operators 4542 $4,617,994 $569,702 $4,048,292 78.0 4 Direct Selling Establishments 4543 $12,415,020 $14,817,240 -$2,402,220 -8.8 18Food Services & Drinking Places 722 $186,923,028 $153,760,955 $33,162,073 9.7 171 Full-Service Restaurants 7221 $82,866,344 $53,250,392 $29,615,952 21.8 56 Limited-Service Eating Places 7222 $85,887,205 $74,853,462 $11,033,743 6.9 77 Special Food Services 7223 $8,541,560 $18,867,260 -$10,325,700 -37.7 13 Drinking Places - Alcoholic Beverages 7224 $9,627,919 $6,789,841 $2,838,078 17.3 26
Data Note: Supply (retail sales) estimates sales to consumers by establishments. Sales to businesses are excluded. Demand (retail potential) estimates the expected amountspent by consumers at retail establishments. Supply and demand estimates are in current dollars. The Leakage/Surplus Factor presents a snapshot of retail opportunity. Thisis a measure of the relationship between supply and demand that ranges from +100 (total leakage) to -100 (total surplus). A positive value represents 'leakage' of retailopportunity outside the trade area. A negative value represents a surplus of retail sales, a market where customers are drawn in from outside the trade area. The Retail Gaprepresents the difference between Retail Potential and Retail Sales. Esri uses the North American Industry Classification System (NAICS) to classify businesses by theirprimary type of economic activity. Retail establishments are classified into 27 industry groups in the Retail Trade sector, as well as four industry groups within the FoodServices & Drinking Establishments subsector. For more information on the Retail MarketPlace data, please view the methodology statement athttp://www.esri.com/library/whitepapers/pdfs/esri-data-retail-marketplace.pdf.
March 17, 2014
©2014 Esri Page 3 of 6
Source: Esri and Dun & Bradstreet. Copyright 2013 Dun & Bradstreet, Inc. All rights reserved.

Retail MarketPlace ProfileWest Dundee Retail Study Area Prepared by Barry Bain1, 5 and 10 mile radius Latitude: 42.098118Ring: 5 mile radius Longitude: -88.28705
Leakage/Surplus Factor by Industry Subsector
Leakage/Surplus Factor605550454035302520151050-5-10-15-20
Food Services & Drinking Places
Nonstore Retailers
Miscellaneous Store Retailers
General Merchandise Stores
Sporting Goods, Hobby, Book, and Music Stores
Clothing and Clothing Accessories Stores
Gasoline Stations
Health & Personal Care Stores
Food & Beverage Stores
Bldg Materials, Garden Equip. & Supply Stores
Electronics & Appliance Stores
Furniture & Home Furnishings Stores
Motor Vehicle & Parts Dealers
Leakage/Surplus Factor by Industry Group
Leakage/Surplus Factor757065605550454035302520151050-5-10-15-20-25-30-35
Drinking Places (Alcoholic Beverages)
Special Food Services
Limited-Service Eating Places
Full-Service Restaurants
Direct Selling Establishments
Vending Machine Operators
Electronic Shopping and Mail-Order Houses
Other Miscellaneous Store Retailers
Used Merchandise Stores
Office Supplies, Stationery, and Gift Stores
Florists
Other General Merchandise Stores
Department Stores (Excluding Leased Depts.)
Book, Periodical, and Music Stores
Jewelry, Luggage, and Leather Goods Stores
Shoe Stores
Clothing Stores
Gasoline Stations
Health & Personal Care Stores
Beer, Wine, and Liquor Stores
Specialty Food Stores
Grocery Stores
Lawn and Garden Equipment and Supplies Stores
Building Material and Supplies Dealers
Electronics & Appliance Stores
Home Furnishings Stores
Furniture Stores
Auto Parts, Accessories, and Tire Stores
Other Motor Vehicle Dealers
Automobile Dealers
March 17, 2014
©2014 Esri Page 4 of 6
Source: Esri and Dun & Bradstreet. Copyright 2013 Dun & Bradstreet, Inc. All rights reserved.

Retail MarketPlace ProfileWest Dundee Retail Study Area Prepared by Barry Bain1, 5 and 10 mile radius Latitude: 42.098118Ring: 10 mile radius Longitude: -88.28705
Summary Demographics2013 Population 529,4792013 Households 178,5682013 Median Disposable Income $56,7062013 Per Capita Income $32,168
NAICS Demand Supply Retail Gap Leakage/Surplus Number ofIndustry Summary (Retail Potential) (Retail Sales) Factor Businesses
Total Retail Trade and Food & Drink 44-45,722 $6,762,138,272 $4,942,241,501 $1,819,896,771 15.5 2,907Total Retail Trade 44-45 $6,079,462,718 $4,501,406,425 $1,578,056,293 14.9 2,410Total Food & Drink 722 $682,675,554 $440,835,076 $241,840,478 21.5 497
NAICS Demand Supply Retail Gap Leakage/Surplus Number ofIndustry Group (Retail Potential) (Retail Sales) Factor Businesses
Motor Vehicle & Parts Dealers 441 $1,158,554,229 $1,039,707,828 $118,846,401 5.4 160 Automobile Dealers 4411 $997,084,095 $975,410,426 $21,673,669 1.1 71 Other Motor Vehicle Dealers 4412 $71,010,128 $25,363,870 $45,646,258 47.4 31 Auto Parts, Accessories & Tire Stores 4413 $90,460,006 $38,933,532 $51,526,474 39.8 58Furniture & Home Furnishings Stores 442 $133,875,995 $69,594,115 $64,281,879 31.6 159 Furniture Stores 4421 $79,194,304 $37,772,655 $41,421,649 35.4 57 Home Furnishings Stores 4422 $54,681,691 $31,821,461 $22,860,230 26.4 102Electronics & Appliance Stores 4431 $167,181,505 $149,502,090 $17,679,415 5.6 145Bldg Materials, Garden Equip. & Supply Stores 444 $219,671,858 $232,787,810 -$13,115,953 -2.9 178 Bldg Material & Supplies Dealers 4441 $186,982,166 $212,862,044 -$25,879,878 -6.5 160 Lawn & Garden Equip & Supply Stores 4442 $32,689,692 $19,925,767 $12,763,925 24.3 18Food & Beverage Stores 445 $970,132,493 $581,563,116 $388,569,378 25.0 265 Grocery Stores 4451 $862,183,713 $519,390,584 $342,793,129 24.8 149 Specialty Food Stores 4452 $28,887,039 $20,701,375 $8,185,664 16.5 71 Beer, Wine & Liquor Stores 4453 $79,061,741 $41,471,156 $37,590,585 31.2 45Health & Personal Care Stores 446,4461 $509,685,591 $455,480,018 $54,205,573 5.6 190Gasoline Stations 447,4471 $619,859,481 $214,066,181 $405,793,300 48.7 78Clothing & Clothing Accessories Stores 448 $386,792,541 $333,345,553 $53,446,988 7.4 312 Clothing Stores 4481 $276,980,500 $270,648,845 $6,331,655 1.2 212 Shoe Stores 4482 $57,039,813 $44,894,238 $12,145,575 11.9 35 Jewelry, Luggage & Leather Goods Stores 4483 $52,772,228 $17,802,470 $34,969,758 49.5 64Sporting Goods, Hobby, Book & Music Stores 451 $160,111,239 $150,974,515 $9,136,724 2.9 190 Sporting Goods/Hobby/Musical Instr Stores 4511 $124,271,852 $135,791,328 -$11,519,475 -4.4 157 Book, Periodical & Music Stores 4512 $35,839,387 $15,183,188 $20,656,199 40.5 33General Merchandise Stores 452 $1,080,243,465 $1,033,793,556 $46,449,909 2.2 68 Department Stores Excluding Leased Depts. 4521 $418,634,951 $391,911,365 $26,723,586 3.3 40 Other General Merchandise Stores 4529 $661,608,514 $641,882,191 $19,726,322 1.5 27Miscellaneous Store Retailers 453 $130,039,259 $112,536,255 $17,503,004 7.2 526 Florists 4531 $7,430,989 $4,234,754 $3,196,235 27.4 39 Office Supplies, Stationery & Gift Stores 4532 $22,052,336 $31,575,903 -$9,523,567 -17.8 140 Used Merchandise Stores 4533 $12,594,026 $8,164,327 $4,429,699 21.3 48 Other Miscellaneous Store Retailers 4539 $87,961,907 $68,561,270 $19,400,637 12.4 298Nonstore Retailers 454 $543,315,063 $128,055,387 $415,259,676 61.9 138 Electronic Shopping & Mail-Order Houses 4541 $478,962,044 $95,390,581 $383,571,463 66.8 24 Vending Machine Operators 4542 $16,727,665 $4,709,102 $12,018,563 56.1 29 Direct Selling Establishments 4543 $47,625,354 $27,955,704 $19,669,649 26.0 85Food Services & Drinking Places 722 $682,675,554 $440,835,076 $241,840,478 21.5 497 Full-Service Restaurants 7221 $302,873,638 $179,427,399 $123,446,239 25.6 178 Limited-Service Eating Places 7222 $312,727,913 $212,283,490 $100,444,423 19.1 222 Special Food Services 7223 $31,474,348 $30,115,800 $1,358,548 2.2 30 Drinking Places - Alcoholic Beverages 7224 $35,599,655 $19,008,387 $16,591,268 30.4 66
Data Note: Supply (retail sales) estimates sales to consumers by establishments. Sales to businesses are excluded. Demand (retail potential) estimates the expected amountspent by consumers at retail establishments. Supply and demand estimates are in current dollars. The Leakage/Surplus Factor presents a snapshot of retail opportunity. Thisis a measure of the relationship between supply and demand that ranges from +100 (total leakage) to -100 (total surplus). A positive value represents 'leakage' of retailopportunity outside the trade area. A negative value represents a surplus of retail sales, a market where customers are drawn in from outside the trade area. The Retail Gaprepresents the difference between Retail Potential and Retail Sales. Esri uses the North American Industry Classification System (NAICS) to classify businesses by theirprimary type of economic activity. Retail establishments are classified into 27 industry groups in the Retail Trade sector, as well as four industry groups within the FoodServices & Drinking Establishments subsector. For more information on the Retail MarketPlace data, please view the methodology statement athttp://www.esri.com/library/whitepapers/pdfs/esri-data-retail-marketplace.pdf.
March 17, 2014
©2014 Esri Page 5 of 6
Source: Esri and Dun & Bradstreet. Copyright 2013 Dun & Bradstreet, Inc. All rights reserved.
Retail MarketPlace ProfileWest Dundee Retail Study Area Prepared by Barry Bain1, 5 and 10 mile radius Latitude: 42.098118Ring: 10 mile radius Longitude: -88.28705
Leakage/Surplus Factor by Industry Subsector
Leakage/Surplus Factor605550454035302520151050
Food Services & Drinking Places
Nonstore Retailers
Miscellaneous Store Retailers
General Merchandise Stores
Sporting Goods, Hobby, Book, and Music Stores
Clothing and Clothing Accessories Stores
Gasoline Stations
Health & Personal Care Stores
Food & Beverage Stores
Bldg Materials, Garden Equip. & Supply Stores
Electronics & Appliance Stores
Furniture & Home Furnishings Stores
Motor Vehicle & Parts Dealers
Leakage/Surplus Factor by Industry Group
Leakage/Surplus Factor65605550454035302520151050-5-10-15
Drinking Places (Alcoholic Beverages)
Special Food Services
Limited-Service Eating Places
Full-Service Restaurants
Direct Selling Establishments
Vending Machine Operators
Electronic Shopping and Mail-Order Houses
Other Miscellaneous Store Retailers
Used Merchandise Stores
Office Supplies, Stationery, and Gift Stores
Florists
Other General Merchandise Stores
Department Stores (Excluding Leased Depts.)
Book, Periodical, and Music Stores
Jewelry, Luggage, and Leather Goods Stores
Shoe Stores
Clothing Stores
Gasoline Stations
Health & Personal Care Stores
Beer, Wine, and Liquor Stores
Specialty Food Stores
Grocery Stores
Lawn and Garden Equipment and Supplies Stores
Building Material and Supplies Dealers
Electronics & Appliance Stores
Home Furnishings Stores
Furniture Stores
Auto Parts, Accessories, and Tire Stores
Other Motor Vehicle Dealers
Automobile Dealers
March 17, 2014
©2014 Esri Page 6 of 6
Source: Esri and Dun & Bradstreet. Copyright 2013 Dun & Bradstreet, Inc. All rights reserved.

Retail Market Potential
West Dundee Retail Study Area Prepared by Barry Bain1, 5 and 10 mile radius Latitude: 42.098118Ring: 1 mile radius Longitude: -88.28705
Demographic Summary 2013 2018Population 6,715 6,821Population 18+ 5,301 5,436Households 2,788 2,835Median Household Income $69,036 $81,686
Expected Number Percent ofProduct/Consumer Behavior Adults/HHs Adults/HHs MPIApparel (Adults)
Bought any men's apparel in last 12 months 2,973 56.1% 113Bought any women's apparel in last 12 months 2,454 46.3% 102Bought apparel for child <13 in last 6 months 1,459 27.5% 97Bought any shoes in last 12 months 2,987 56.4% 108Bought costume jewelry in last 12 months 1,185 22.4% 107Bought any fine jewelry in last 12 months 1,182 22.3% 101Bought a watch in last 12 months 1,000 18.9% 98
Automobiles (Households)HH owns/leases any vehicle 2,568 92.1% 107HH bought/leased new vehicle last 12 mo 338 12.1% 126
Automotive Aftermarket (Adults)Bought gasoline in last 6 months 4,881 92.1% 106Bought/changed motor oil in last 12 months 2,741 51.7% 100Had tune-up in last 12 months 1,876 35.4% 114
Beverages (Adults)Drank bottled water/seltzer in last 6 months 3,423 64.6% 104Drank regular cola in last 6 months 2,529 47.7% 94Drank beer/ale in last 6 months 2,558 48.3% 113
Cameras & Film (Adults)Bought any camera in last 12 months 726 13.7% 107Bought film in last 12 months 1,078 20.3% 107Bought digital camera in last 12 months 443 8.4% 122Bought memory card for camera in last 12 months 496 9.4% 123
Cell Phones/PDAs & Service (Adults)Bought cell/mobile phone/PDA in last 12 months 1,906 35.9% 102Avg monthly cell/mobile phone/PDA bill: $1-$49 1,235 23.3% 109Avg monthly cell/mobile phone/PDA bill: $50-99 1,777 33.5% 103Avg monthly cell/mobile phone/PDA bill: $100+ 1,271 24.0% 113
Computers (Households)HH owns a personal computer 2,378 85.3% 115Spent <$500 on most recent home PC purchase 253 9.1% 105Spent $500-$999 on most recent home PC purchase 577 20.7% 116Spent $1000-$1499 on most recent home PC purchase 477 17.1% 130Spent $1500-$1999 on most recent home PC purchase 239 8.6% 120Spent $2000+ on most recent home PC purchase 204 7.3% 117
March 17, 2014
©2014 Esri Page 1 of 12
Data Note: An MPI (Market Potential Index) measures the relative likelihood of the adults in the specified trade area to exhibit certain consumer behavior or purchasingpatterns compared to the U.S. An MPI of 100 represents the U.S. average.Source: These data are based upon national propensities to use various products and services, applied to local demographic composition. Usage data were collected byGfK MRI in a nationally representative survey of U.S. households. Esri forecasts for 2013 and 2018.
Retail Market Potential
West Dundee Retail Study Area Prepared by Barry Bain1, 5 and 10 mile radius Latitude: 42.098118Ring: 1 mile radius Longitude: -88.28705
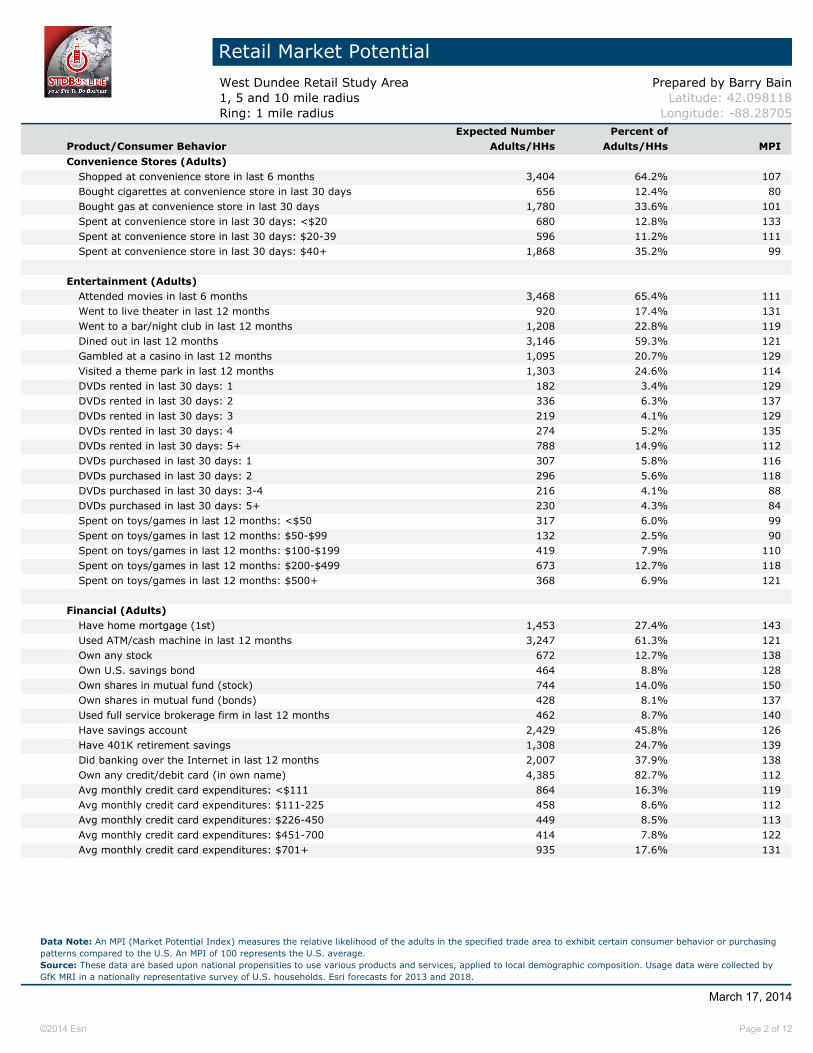
Expected Number Percent ofProduct/Consumer Behavior Adults/HHs Adults/HHs MPI
Convenience Stores (Adults)Shopped at convenience store in last 6 months 3,404 64.2% 107Bought cigarettes at convenience store in last 30 days 656 12.4% 80Bought gas at convenience store in last 30 days 1,780 33.6% 101Spent at convenience store in last 30 days: <$20 680 12.8% 133Spent at convenience store in last 30 days: $20-39 596 11.2% 111Spent at convenience store in last 30 days: $40+ 1,868 35.2% 99
Entertainment (Adults)Attended movies in last 6 months 3,468 65.4% 111Went to live theater in last 12 months 920 17.4% 131Went to a bar/night club in last 12 months 1,208 22.8% 119Dined out in last 12 months 3,146 59.3% 121Gambled at a casino in last 12 months 1,095 20.7% 129Visited a theme park in last 12 months 1,303 24.6% 114DVDs rented in last 30 days: 1 182 3.4% 129DVDs rented in last 30 days: 2 336 6.3% 137DVDs rented in last 30 days: 3 219 4.1% 129DVDs rented in last 30 days: 4 274 5.2% 135DVDs rented in last 30 days: 5+ 788 14.9% 112DVDs purchased in last 30 days: 1 307 5.8% 116DVDs purchased in last 30 days: 2 296 5.6% 118DVDs purchased in last 30 days: 3-4 216 4.1% 88DVDs purchased in last 30 days: 5+ 230 4.3% 84Spent on toys/games in last 12 months: <$50 317 6.0% 99Spent on toys/games in last 12 months: $50-$99 132 2.5% 90Spent on toys/games in last 12 months: $100-$199 419 7.9% 110Spent on toys/games in last 12 months: $200-$499 673 12.7% 118Spent on toys/games in last 12 months: $500+ 368 6.9% 121
Financial (Adults)Have home mortgage (1st) 1,453 27.4% 143Used ATM/cash machine in last 12 months 3,247 61.3% 121Own any stock 672 12.7% 138Own U.S. savings bond 464 8.8% 128Own shares in mutual fund (stock) 744 14.0% 150Own shares in mutual fund (bonds) 428 8.1% 137Used full service brokerage firm in last 12 months 462 8.7% 140Have savings account 2,429 45.8% 126Have 401K retirement savings 1,308 24.7% 139Did banking over the Internet in last 12 months 2,007 37.9% 138Own any credit/debit card (in own name) 4,385 82.7% 112Avg monthly credit card expenditures: <$111 864 16.3% 119Avg monthly credit card expenditures: $111-225 458 8.6% 112Avg monthly credit card expenditures: $226-450 449 8.5% 113Avg monthly credit card expenditures: $451-700 414 7.8% 122Avg monthly credit card expenditures: $701+ 935 17.6% 131
March 17, 2014
©2014 Esri Page 2 of 12
Data Note: An MPI (Market Potential Index) measures the relative likelihood of the adults in the specified trade area to exhibit certain consumer behavior or purchasingpatterns compared to the U.S. An MPI of 100 represents the U.S. average.Source: These data are based upon national propensities to use various products and services, applied to local demographic composition. Usage data were collected byGfK MRI in a nationally representative survey of U.S. households. Esri forecasts for 2013 and 2018.

Retail Market Potential
West Dundee Retail Study Area Prepared by Barry Bain1, 5 and 10 mile radius Latitude: 42.098118Ring: 1 mile radius Longitude: -88.28705
Expected Number Percent ofProduct/Consumer Behavior Adults/HHs Adults/HHs MPIGrocery (Adults)
Used beef (fresh/frozen) in last 6 months 3,921 74.0% 105Used bread in last 6 months 5,173 97.6% 101Used chicken/turkey (fresh or frozen) in last 6 months 4,250 80.2% 104Used fish/seafood (fresh or frozen) in last 6 months 3,038 57.3% 109Used fresh fruit/vegetables in last 6 months 4,823 91.0% 104Used fresh milk in last 6 months 4,962 93.6% 103
Health (Adults)Exercise at home 2+ times per week 1,865 35.2% 117Exercise at club 2+ times per week 833 15.7% 126Visited a doctor in last 12 months 4,380 82.6% 107Used vitamin/dietary supplement in last 6 months 2,901 54.7% 113
Home (Households)Any home improvement in last 12 months 1,033 37.1% 117Used housekeeper/maid/prof HH cleaning service in the last 12 months 523 18.7% 119Purchased any HH furnishing in last 12 months 1,016 36.5% 121Purchased bedding/bath goods in last 12 months 1,600 57.4% 105Purchased cooking/serving product in last 12 months 807 28.9% 105Bought any kitchen appliance in last 12 months 533 19.1% 110
Insurance (Adults)Currently carry any life insurance 2,911 54.9% 116Have medical/hospital/accident insurance 4,175 78.8% 110Carry homeowner insurance 3,264 61.6% 118Carry renter insurance 340 6.4% 104Have auto/other vehicle insurance 4,773 90.0% 109
Pets (Households)HH owns any pet 1,530 54.9% 107HH owns any cat 743 26.7% 111HH owns any dog 1,078 38.7% 103
Reading Materials (Adults)Bought book in last 12 months 3,130 59.0% 118Read any daily newspaper 2,509 47.3% 115Heavy magazine reader 1,098 20.7% 104
Restaurants (Adults)Went to family restaurant/steak house in last 6 mo 4,265 80.4% 112Went to family restaurant/steak house last mo: <2 times 1,385 26.1% 102Went to family restaurant/steak house last mo: 2-4 times 1,729 32.6% 121Went to family restaurant/steak house last mo: 5+ times 1,151 21.7% 112Went to fast food/drive-in restaurant in last 6 mo 4,804 90.6% 102Went to fast food/drive-in restaurant <6 times/mo 1,821 34.3% 98Went to fast food/drive-in restaurant 6-13 times/mo 1,623 30.6% 106Went to fast food/drive-in restaurant 14+ times/mo 1,360 25.6% 103Fast food/drive-in last 6 mo: eat in 2,137 40.3% 107Fast food/drive-in last 6 mo: home delivery 596 11.2% 108Fast food/drive-in last 6 mo: take-out/drive-thru 2,992 56.4% 108Fast food/drive-in last 6 mo: take-out/walk-in 1,506 28.4% 116
March 17, 2014
©2014 Esri Page 3 of 12
Data Note: An MPI (Market Potential Index) measures the relative likelihood of the adults in the specified trade area to exhibit certain consumer behavior or purchasingpatterns compared to the U.S. An MPI of 100 represents the U.S. average.Source: These data are based upon national propensities to use various products and services, applied to local demographic composition. Usage data were collected byGfK MRI in a nationally representative survey of U.S. households. Esri forecasts for 2013 and 2018.
Retail Market Potential
West Dundee Retail Study Area Prepared by Barry Bain1, 5 and 10 mile radius Latitude: 42.098118Ring: 1 mile radius Longitude: -88.28705
Expected Number Percent ofProduct/Consumer Behavior Adults/HHs Adults/HHs MPI
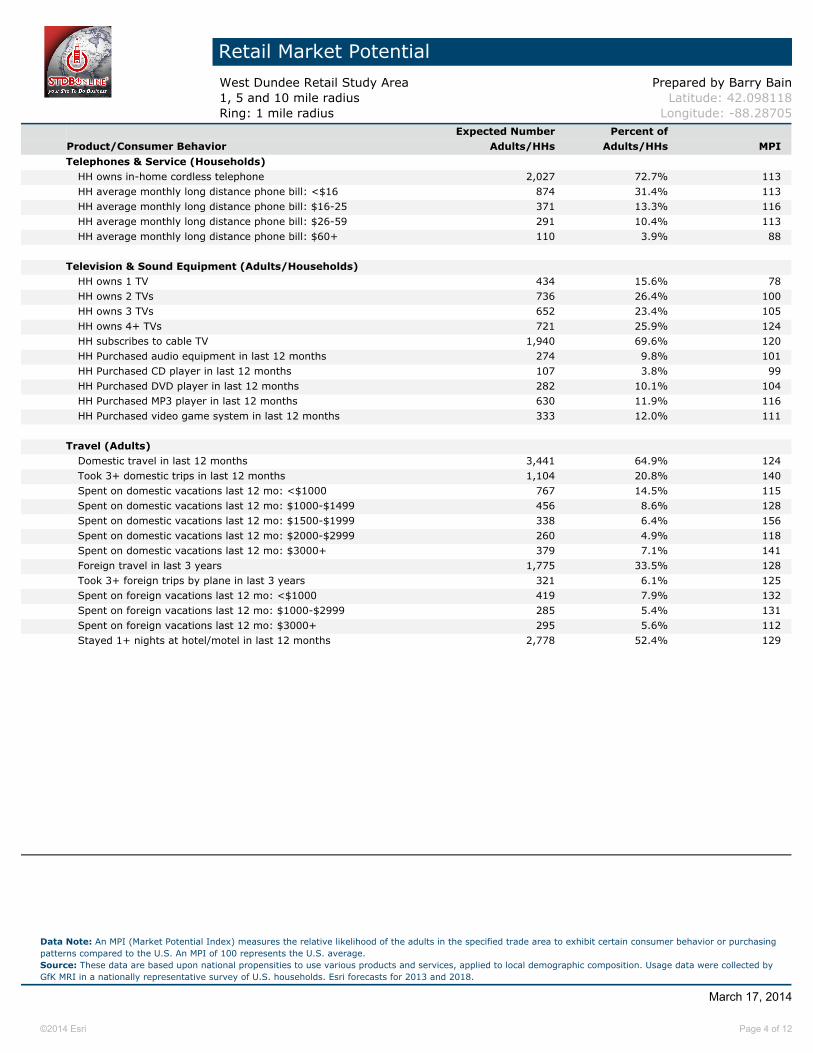
Telephones & Service (Households)HH owns in-home cordless telephone 2,027 72.7% 113HH average monthly long distance phone bill: <$16 874 31.4% 113HH average monthly long distance phone bill: $16-25 371 13.3% 116HH average monthly long distance phone bill: $26-59 291 10.4% 113HH average monthly long distance phone bill: $60+ 110 3.9% 88
Television & Sound Equipment (Adults/Households)HH owns 1 TV 434 15.6% 78HH owns 2 TVs 736 26.4% 100HH owns 3 TVs 652 23.4% 105HH owns 4+ TVs 721 25.9% 124HH subscribes to cable TV 1,940 69.6% 120HH Purchased audio equipment in last 12 months 274 9.8% 101HH Purchased CD player in last 12 months 107 3.8% 99HH Purchased DVD player in last 12 months 282 10.1% 104HH Purchased MP3 player in last 12 months 630 11.9% 116HH Purchased video game system in last 12 months 333 12.0% 111
Travel (Adults)Domestic travel in last 12 months 3,441 64.9% 124Took 3+ domestic trips in last 12 months 1,104 20.8% 140Spent on domestic vacations last 12 mo: <$1000 767 14.5% 115Spent on domestic vacations last 12 mo: $1000-$1499 456 8.6% 128Spent on domestic vacations last 12 mo: $1500-$1999 338 6.4% 156Spent on domestic vacations last 12 mo: $2000-$2999 260 4.9% 118Spent on domestic vacations last 12 mo: $3000+ 379 7.1% 141Foreign travel in last 3 years 1,775 33.5% 128Took 3+ foreign trips by plane in last 3 years 321 6.1% 125Spent on foreign vacations last 12 mo: <$1000 419 7.9% 132Spent on foreign vacations last 12 mo: $1000-$2999 285 5.4% 131Spent on foreign vacations last 12 mo: $3000+ 295 5.6% 112Stayed 1+ nights at hotel/motel in last 12 months 2,778 52.4% 129
March 17, 2014
©2014 Esri Page 4 of 12
Data Note: An MPI (Market Potential Index) measures the relative likelihood of the adults in the specified trade area to exhibit certain consumer behavior or purchasingpatterns compared to the U.S. An MPI of 100 represents the U.S. average.Source: These data are based upon national propensities to use various products and services, applied to local demographic composition. Usage data were collected byGfK MRI in a nationally representative survey of U.S. households. Esri forecasts for 2013 and 2018.

Retail Market Potential
West Dundee Retail Study Area Prepared by Barry Bain1, 5 and 10 mile radius Latitude: 42.098118Ring: 5 mile radius Longitude: -88.28705
Demographic Summary 2013 2018Population 166,010 171,244Population 18+ 118,958 122,103Households 53,948 55,621Median Household Income $63,328 $76,996
Expected Number Percent ofProduct/Consumer Behavior Adults/HHs Adults/HHs MPIApparel (Adults)
Bought any men's apparel in last 12 months 62,588 52.6% 106Bought any women's apparel in last 12 months 54,400 45.7% 101Bought apparel for child <13 in last 6 months 39,039 32.8% 116Bought any shoes in last 12 months 63,817 53.6% 103Bought costume jewelry in last 12 months 25,640 21.6% 103Bought any fine jewelry in last 12 months 26,774 22.5% 102Bought a watch in last 12 months 23,012 19.3% 100
Automobiles (Households)HH owns/leases any vehicle 48,133 89.2% 104HH bought/leased new vehicle last 12 mo 6,189 11.5% 119
Automotive Aftermarket (Adults)Bought gasoline in last 6 months 105,677 88.8% 102Bought/changed motor oil in last 12 months 59,034 49.6% 96Had tune-up in last 12 months 40,382 33.9% 109
Beverages (Adults)Drank bottled water/seltzer in last 6 months 79,092 66.5% 107Drank regular cola in last 6 months 63,043 53.0% 104Drank beer/ale in last 6 months 53,909 45.3% 107
Cameras & Film (Adults)Bought any camera in last 12 months 15,599 13.1% 102Bought film in last 12 months 22,109 18.6% 98Bought digital camera in last 12 months 9,094 7.6% 112Bought memory card for camera in last 12 months 10,374 8.7% 114
Cell Phones/PDAs & Service (Adults)Bought cell/mobile phone/PDA in last 12 months 44,231 37.2% 105Avg monthly cell/mobile phone/PDA bill: $1-$49 23,070 19.4% 91Avg monthly cell/mobile phone/PDA bill: $50-99 42,089 35.4% 109Avg monthly cell/mobile phone/PDA bill: $100+ 28,652 24.1% 114
Computers (Households)HH owns a personal computer 43,876 81.3% 110Spent <$500 on most recent home PC purchase 4,474 8.3% 96Spent $500-$999 on most recent home PC purchase 10,098 18.7% 105Spent $1000-$1499 on most recent home PC purchase 7,946 14.7% 112Spent $1500-$1999 on most recent home PC purchase 4,384 8.1% 114Spent $2000+ on most recent home PC purchase 3,912 7.3% 115
March 17, 2014
©2014 Esri Page 5 of 12
Data Note: An MPI (Market Potential Index) measures the relative likelihood of the adults in the specified trade area to exhibit certain consumer behavior or purchasingpatterns compared to the U.S. An MPI of 100 represents the U.S. average.Source: These data are based upon national propensities to use various products and services, applied to local demographic composition. Usage data were collected byGfK MRI in a nationally representative survey of U.S. households. Esri forecasts for 2013 and 2018.

Retail Market Potential
West Dundee Retail Study Area Prepared by Barry Bain1, 5 and 10 mile radius Latitude: 42.098118Ring: 5 mile radius Longitude: -88.28705
Expected Number Percent ofProduct/Consumer Behavior Adults/HHs Adults/HHs MPI
Convenience Stores (Adults)Shopped at convenience store in last 6 months 73,432 61.7% 103Bought cigarettes at convenience store in last 30 days 15,411 13.0% 84Bought gas at convenience store in last 30 days 37,423 31.5% 94Spent at convenience store in last 30 days: <$20 13,234 11.1% 115Spent at convenience store in last 30 days: $20-39 12,968 10.9% 107Spent at convenience store in last 30 days: $40+ 40,615 34.1% 96
Entertainment (Adults)Attended movies in last 6 months 76,881 64.6% 110Went to live theater in last 12 months 17,191 14.5% 109Went to a bar/night club in last 12 months 21,916 18.4% 96Dined out in last 12 months 60,771 51.1% 104Gambled at a casino in last 12 months 21,867 18.4% 115Visited a theme park in last 12 months 31,732 26.7% 124DVDs rented in last 30 days: 1 3,505 2.9% 111DVDs rented in last 30 days: 2 5,621 4.7% 102DVDs rented in last 30 days: 3 4,179 3.5% 110DVDs rented in last 30 days: 4 5,059 4.3% 111DVDs rented in last 30 days: 5+ 18,777 15.8% 119DVDs purchased in last 30 days: 1 6,977 5.9% 118DVDs purchased in last 30 days: 2 5,809 4.9% 103DVDs purchased in last 30 days: 3-4 5,606 4.7% 102DVDs purchased in last 30 days: 5+ 6,423 5.4% 104Spent on toys/games in last 12 months: <$50 7,535 6.3% 104Spent on toys/games in last 12 months: $50-$99 3,524 3.0% 108Spent on toys/games in last 12 months: $100-$199 8,972 7.5% 105Spent on toys/games in last 12 months: $200-$499 13,764 11.6% 107Spent on toys/games in last 12 months: $500+ 7,556 6.4% 111
Financial (Adults)Have home mortgage (1st) 26,211 22.0% 115Used ATM/cash machine in last 12 months 66,388 55.8% 110Own any stock 11,517 9.7% 105Own U.S. savings bond 8,349 7.0% 103Own shares in mutual fund (stock) 12,232 10.3% 110Own shares in mutual fund (bonds) 7,368 6.2% 105Used full service brokerage firm in last 12 months 7,738 6.5% 105Have savings account 44,685 37.6% 104Have 401K retirement savings 23,700 19.9% 113Did banking over the Internet in last 12 months 37,599 31.6% 115Own any credit/debit card (in own name) 89,536 75.3% 102Avg monthly credit card expenditures: <$111 15,742 13.2% 96Avg monthly credit card expenditures: $111-225 9,303 7.8% 101Avg monthly credit card expenditures: $226-450 9,435 7.9% 106Avg monthly credit card expenditures: $451-700 8,307 7.0% 110Avg monthly credit card expenditures: $701+ 18,528 15.6% 116
March 17, 2014
©2014 Esri Page 6 of 12
Data Note: An MPI (Market Potential Index) measures the relative likelihood of the adults in the specified trade area to exhibit certain consumer behavior or purchasingpatterns compared to the U.S. An MPI of 100 represents the U.S. average.Source: These data are based upon national propensities to use various products and services, applied to local demographic composition. Usage data were collected byGfK MRI in a nationally representative survey of U.S. households. Esri forecasts for 2013 and 2018.
Retail Market Potential
West Dundee Retail Study Area Prepared by Barry Bain1, 5 and 10 mile radius Latitude: 42.098118Ring: 5 mile radius Longitude: -88.28705
Expected Number Percent ofProduct/Consumer Behavior Adults/HHs Adults/HHs MPIGrocery (Adults)
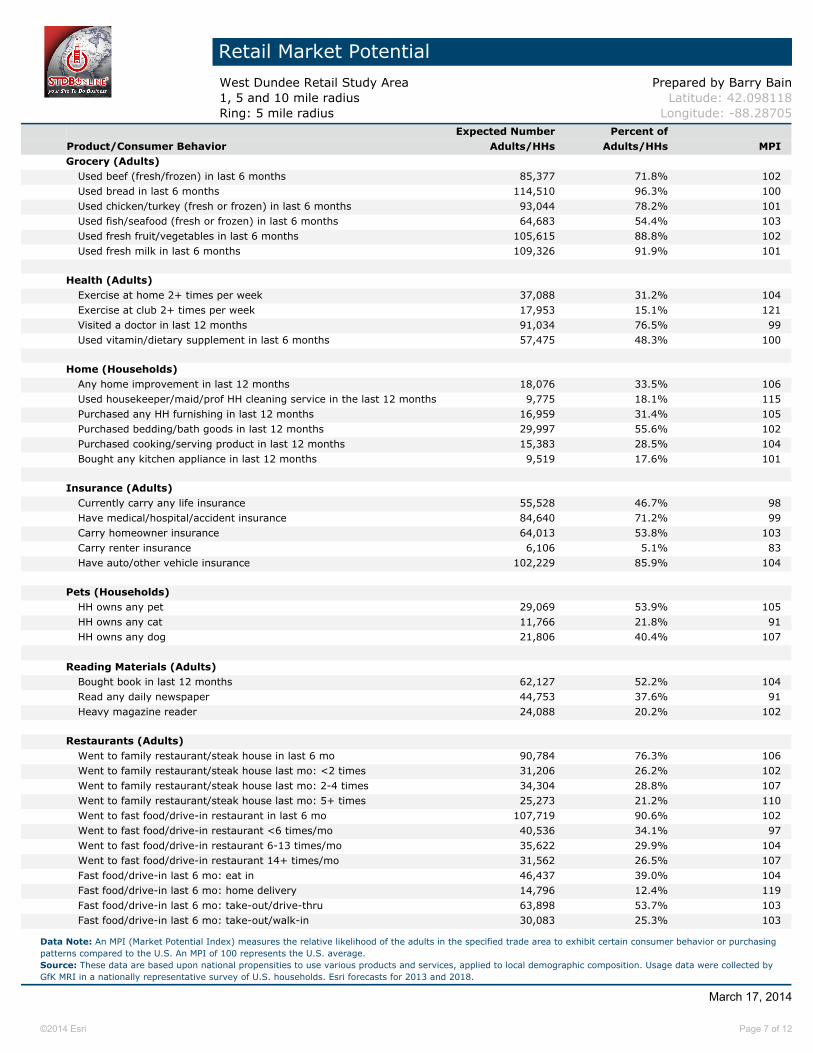
Used beef (fresh/frozen) in last 6 months 85,377 71.8% 102Used bread in last 6 months 114,510 96.3% 100Used chicken/turkey (fresh or frozen) in last 6 months 93,044 78.2% 101Used fish/seafood (fresh or frozen) in last 6 months 64,683 54.4% 103Used fresh fruit/vegetables in last 6 months 105,615 88.8% 102Used fresh milk in last 6 months 109,326 91.9% 101
Health (Adults)Exercise at home 2+ times per week 37,088 31.2% 104Exercise at club 2+ times per week 17,953 15.1% 121Visited a doctor in last 12 months 91,034 76.5% 99Used vitamin/dietary supplement in last 6 months 57,475 48.3% 100
Home (Households)Any home improvement in last 12 months 18,076 33.5% 106Used housekeeper/maid/prof HH cleaning service in the last 12 months 9,775 18.1% 115Purchased any HH furnishing in last 12 months 16,959 31.4% 105Purchased bedding/bath goods in last 12 months 29,997 55.6% 102Purchased cooking/serving product in last 12 months 15,383 28.5% 104Bought any kitchen appliance in last 12 months 9,519 17.6% 101
Insurance (Adults)Currently carry any life insurance 55,528 46.7% 98Have medical/hospital/accident insurance 84,640 71.2% 99Carry homeowner insurance 64,013 53.8% 103Carry renter insurance 6,106 5.1% 83Have auto/other vehicle insurance 102,229 85.9% 104
Pets (Households)HH owns any pet 29,069 53.9% 105HH owns any cat 11,766 21.8% 91HH owns any dog 21,806 40.4% 107
Reading Materials (Adults)Bought book in last 12 months 62,127 52.2% 104Read any daily newspaper 44,753 37.6% 91Heavy magazine reader 24,088 20.2% 102
Restaurants (Adults)Went to family restaurant/steak house in last 6 mo 90,784 76.3% 106Went to family restaurant/steak house last mo: <2 times 31,206 26.2% 102Went to family restaurant/steak house last mo: 2-4 times 34,304 28.8% 107Went to family restaurant/steak house last mo: 5+ times 25,273 21.2% 110Went to fast food/drive-in restaurant in last 6 mo 107,719 90.6% 102Went to fast food/drive-in restaurant <6 times/mo 40,536 34.1% 97Went to fast food/drive-in restaurant 6-13 times/mo 35,622 29.9% 104Went to fast food/drive-in restaurant 14+ times/mo 31,562 26.5% 107Fast food/drive-in last 6 mo: eat in 46,437 39.0% 104Fast food/drive-in last 6 mo: home delivery 14,796 12.4% 119Fast food/drive-in last 6 mo: take-out/drive-thru 63,898 53.7% 103Fast food/drive-in last 6 mo: take-out/walk-in 30,083 25.3% 103
March 17, 2014
©2014 Esri Page 7 of 12
Data Note: An MPI (Market Potential Index) measures the relative likelihood of the adults in the specified trade area to exhibit certain consumer behavior or purchasingpatterns compared to the U.S. An MPI of 100 represents the U.S. average.Source: These data are based upon national propensities to use various products and services, applied to local demographic composition. Usage data were collected byGfK MRI in a nationally representative survey of U.S. households. Esri forecasts for 2013 and 2018.
Retail Market Potential
West Dundee Retail Study Area Prepared by Barry Bain1, 5 and 10 mile radius Latitude: 42.098118Ring: 5 mile radius Longitude: -88.28705
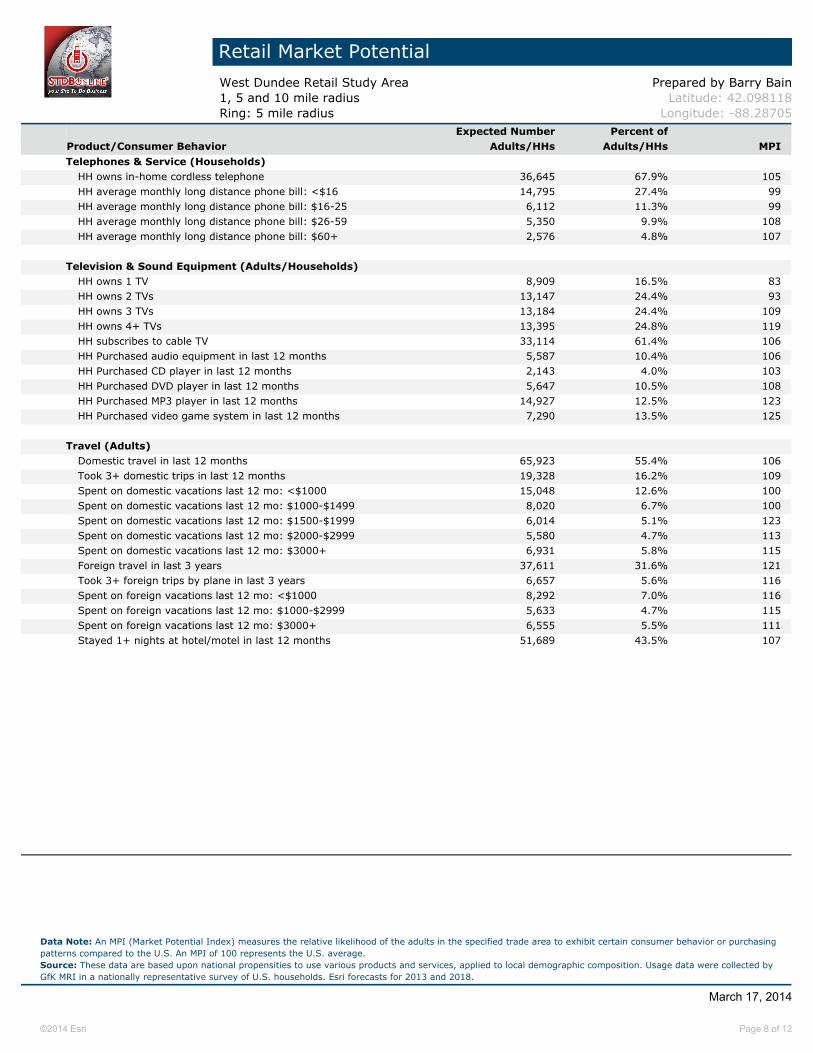
Expected Number Percent ofProduct/Consumer Behavior Adults/HHs Adults/HHs MPI
Telephones & Service (Households)HH owns in-home cordless telephone 36,645 67.9% 105HH average monthly long distance phone bill: <$16 14,795 27.4% 99HH average monthly long distance phone bill: $16-25 6,112 11.3% 99HH average monthly long distance phone bill: $26-59 5,350 9.9% 108HH average monthly long distance phone bill: $60+ 2,576 4.8% 107
Television & Sound Equipment (Adults/Households)HH owns 1 TV 8,909 16.5% 83HH owns 2 TVs 13,147 24.4% 93HH owns 3 TVs 13,184 24.4% 109HH owns 4+ TVs 13,395 24.8% 119HH subscribes to cable TV 33,114 61.4% 106HH Purchased audio equipment in last 12 months 5,587 10.4% 106HH Purchased CD player in last 12 months 2,143 4.0% 103HH Purchased DVD player in last 12 months 5,647 10.5% 108HH Purchased MP3 player in last 12 months 14,927 12.5% 123HH Purchased video game system in last 12 months 7,290 13.5% 125
Travel (Adults)Domestic travel in last 12 months 65,923 55.4% 106Took 3+ domestic trips in last 12 months 19,328 16.2% 109Spent on domestic vacations last 12 mo: <$1000 15,048 12.6% 100Spent on domestic vacations last 12 mo: $1000-$1499 8,020 6.7% 100Spent on domestic vacations last 12 mo: $1500-$1999 6,014 5.1% 123Spent on domestic vacations last 12 mo: $2000-$2999 5,580 4.7% 113Spent on domestic vacations last 12 mo: $3000+ 6,931 5.8% 115Foreign travel in last 3 years 37,611 31.6% 121Took 3+ foreign trips by plane in last 3 years 6,657 5.6% 116Spent on foreign vacations last 12 mo: <$1000 8,292 7.0% 116Spent on foreign vacations last 12 mo: $1000-$2999 5,633 4.7% 115Spent on foreign vacations last 12 mo: $3000+ 6,555 5.5% 111Stayed 1+ nights at hotel/motel in last 12 months 51,689 43.5% 107
March 17, 2014
©2014 Esri Page 8 of 12
Data Note: An MPI (Market Potential Index) measures the relative likelihood of the adults in the specified trade area to exhibit certain consumer behavior or purchasingpatterns compared to the U.S. An MPI of 100 represents the U.S. average.Source: These data are based upon national propensities to use various products and services, applied to local demographic composition. Usage data were collected byGfK MRI in a nationally representative survey of U.S. households. Esri forecasts for 2013 and 2018.

Retail Market Potential
West Dundee Retail Study Area Prepared by Barry Bain1, 5 and 10 mile radius Latitude: 42.098118Ring: 10 mile radius Longitude: -88.28705
Demographic Summary 2013 2018Population 529,479 542,868Population 18+ 385,547 395,027Households 178,568 183,435Median Household Income $76,409 $86,254
Expected Number Percent ofProduct/Consumer Behavior Adults/HHs Adults/HHs MPIApparel (Adults)
Bought any men's apparel in last 12 months 206,141 53.5% 107Bought any women's apparel in last 12 months 182,759 47.4% 104Bought apparel for child <13 in last 6 months 125,651 32.6% 115Bought any shoes in last 12 months 214,886 55.7% 107Bought costume jewelry in last 12 months 88,818 23.0% 110Bought any fine jewelry in last 12 months 87,865 22.8% 104Bought a watch in last 12 months 74,930 19.4% 101
Automobiles (Households)HH owns/leases any vehicle 163,978 91.8% 107HH bought/leased new vehicle last 12 mo 23,381 13.1% 136
Automotive Aftermarket (Adults)Bought gasoline in last 6 months 352,586 91.5% 105Bought/changed motor oil in last 12 months 193,291 50.1% 97Had tune-up in last 12 months 131,961 34.2% 110
Beverages (Adults)Drank bottled water/seltzer in last 6 months 259,732 67.4% 109Drank regular cola in last 6 months 192,286 49.9% 98Drank beer/ale in last 6 months 178,983 46.4% 109
Cameras & Film (Adults)Bought any camera in last 12 months 52,747 13.7% 107Bought film in last 12 months 71,278 18.5% 97Bought digital camera in last 12 months 32,181 8.3% 122Bought memory card for camera in last 12 months 35,756 9.3% 122
Cell Phones/PDAs & Service (Adults)Bought cell/mobile phone/PDA in last 12 months 145,232 37.7% 107Avg monthly cell/mobile phone/PDA bill: $1-$49 77,314 20.1% 94Avg monthly cell/mobile phone/PDA bill: $50-99 136,350 35.4% 109Avg monthly cell/mobile phone/PDA bill: $100+ 100,238 26.0% 123
Computers (Households)HH owns a personal computer 153,925 86.2% 116Spent <$500 on most recent home PC purchase 14,981 8.4% 97Spent $500-$999 on most recent home PC purchase 36,186 20.3% 114Spent $1000-$1499 on most recent home PC purchase 28,961 16.2% 124Spent $1500-$1999 on most recent home PC purchase 16,072 9.0% 126Spent $2000+ on most recent home PC purchase 14,922 8.4% 133
March 17, 2014
©2014 Esri Page 9 of 12
Data Note: An MPI (Market Potential Index) measures the relative likelihood of the adults in the specified trade area to exhibit certain consumer behavior or purchasingpatterns compared to the U.S. An MPI of 100 represents the U.S. average.Source: These data are based upon national propensities to use various products and services, applied to local demographic composition. Usage data were collected byGfK MRI in a nationally representative survey of U.S. households. Esri forecasts for 2013 and 2018.
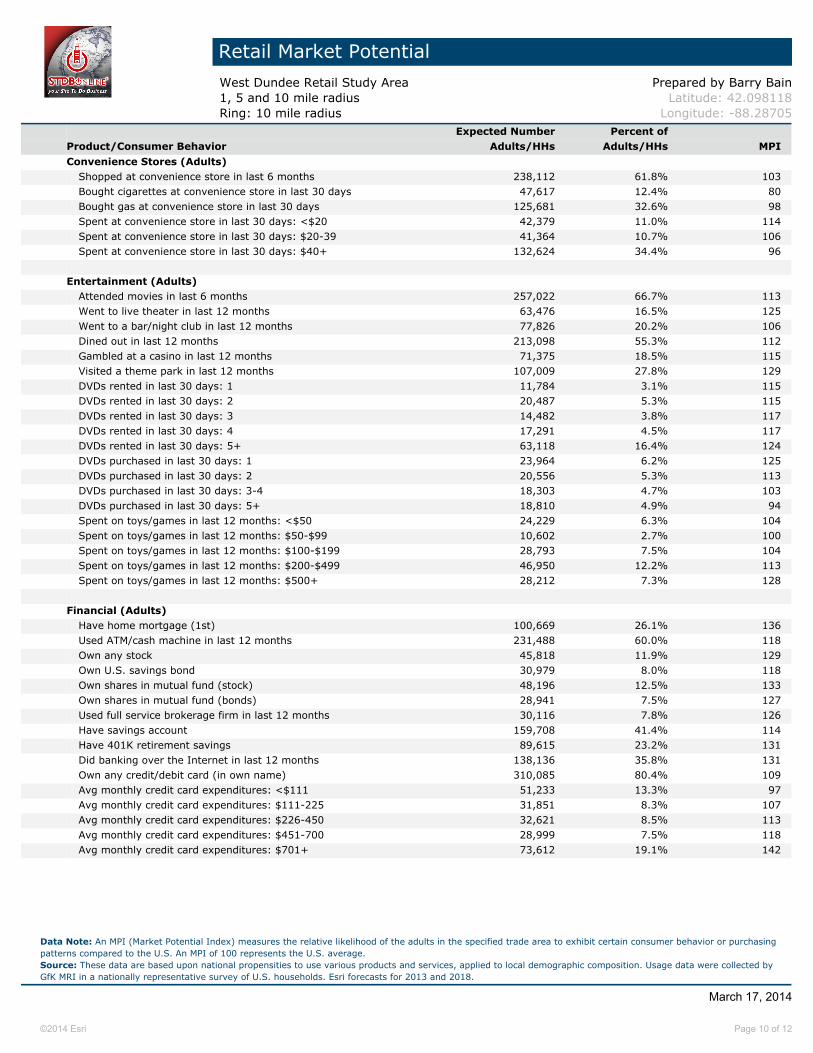
Retail Market Potential
West Dundee Retail Study Area Prepared by Barry Bain1, 5 and 10 mile radius Latitude: 42.098118Ring: 10 mile radius Longitude: -88.28705
Expected Number Percent ofProduct/Consumer Behavior Adults/HHs Adults/HHs MPI
Convenience Stores (Adults)Shopped at convenience store in last 6 months 238,112 61.8% 103Bought cigarettes at convenience store in last 30 days 47,617 12.4% 80Bought gas at convenience store in last 30 days 125,681 32.6% 98Spent at convenience store in last 30 days: <$20 42,379 11.0% 114Spent at convenience store in last 30 days: $20-39 41,364 10.7% 106Spent at convenience store in last 30 days: $40+ 132,624 34.4% 96
Entertainment (Adults)Attended movies in last 6 months 257,022 66.7% 113Went to live theater in last 12 months 63,476 16.5% 125Went to a bar/night club in last 12 months 77,826 20.2% 106Dined out in last 12 months 213,098 55.3% 112Gambled at a casino in last 12 months 71,375 18.5% 115Visited a theme park in last 12 months 107,009 27.8% 129DVDs rented in last 30 days: 1 11,784 3.1% 115DVDs rented in last 30 days: 2 20,487 5.3% 115DVDs rented in last 30 days: 3 14,482 3.8% 117DVDs rented in last 30 days: 4 17,291 4.5% 117DVDs rented in last 30 days: 5+ 63,118 16.4% 124DVDs purchased in last 30 days: 1 23,964 6.2% 125DVDs purchased in last 30 days: 2 20,556 5.3% 113DVDs purchased in last 30 days: 3-4 18,303 4.7% 103DVDs purchased in last 30 days: 5+ 18,810 4.9% 94Spent on toys/games in last 12 months: <$50 24,229 6.3% 104Spent on toys/games in last 12 months: $50-$99 10,602 2.7% 100Spent on toys/games in last 12 months: $100-$199 28,793 7.5% 104Spent on toys/games in last 12 months: $200-$499 46,950 12.2% 113Spent on toys/games in last 12 months: $500+ 28,212 7.3% 128
Financial (Adults)Have home mortgage (1st) 100,669 26.1% 136Used ATM/cash machine in last 12 months 231,488 60.0% 118Own any stock 45,818 11.9% 129Own U.S. savings bond 30,979 8.0% 118Own shares in mutual fund (stock) 48,196 12.5% 133Own shares in mutual fund (bonds) 28,941 7.5% 127Used full service brokerage firm in last 12 months 30,116 7.8% 126Have savings account 159,708 41.4% 114Have 401K retirement savings 89,615 23.2% 131Did banking over the Internet in last 12 months 138,136 35.8% 131Own any credit/debit card (in own name) 310,085 80.4% 109Avg monthly credit card expenditures: <$111 51,233 13.3% 97Avg monthly credit card expenditures: $111-225 31,851 8.3% 107Avg monthly credit card expenditures: $226-450 32,621 8.5% 113Avg monthly credit card expenditures: $451-700 28,999 7.5% 118Avg monthly credit card expenditures: $701+ 73,612 19.1% 142
March 17, 2014
©2014 Esri Page 10 of 12
Data Note: An MPI (Market Potential Index) measures the relative likelihood of the adults in the specified trade area to exhibit certain consumer behavior or purchasingpatterns compared to the U.S. An MPI of 100 represents the U.S. average.Source: These data are based upon national propensities to use various products and services, applied to local demographic composition. Usage data were collected byGfK MRI in a nationally representative survey of U.S. households. Esri forecasts for 2013 and 2018.

Retail Market Potential
West Dundee Retail Study Area Prepared by Barry Bain1, 5 and 10 mile radius Latitude: 42.098118Ring: 10 mile radius Longitude: -88.28705
Expected Number Percent ofProduct/Consumer Behavior Adults/HHs Adults/HHs MPIGrocery (Adults)
Used beef (fresh/frozen) in last 6 months 281,119 72.9% 103Used bread in last 6 months 372,747 96.7% 100Used chicken/turkey (fresh or frozen) in last 6 months 306,727 79.6% 103Used fish/seafood (fresh or frozen) in last 6 months 215,328 55.8% 106Used fresh fruit/vegetables in last 6 months 345,208 89.5% 103Used fresh milk in last 6 months 355,498 92.2% 102
Health (Adults)Exercise at home 2+ times per week 128,136 33.2% 111Exercise at club 2+ times per week 66,125 17.2% 138Visited a doctor in last 12 months 305,973 79.4% 103Used vitamin/dietary supplement in last 6 months 197,639 51.3% 106
Home (Households)Any home improvement in last 12 months 65,537 36.7% 116Used housekeeper/maid/prof HH cleaning service in the last 12 months 36,701 20.6% 131Purchased any HH furnishing in last 12 months 59,871 33.5% 112Purchased bedding/bath goods in last 12 months 100,998 56.6% 103Purchased cooking/serving product in last 12 months 51,820 29.0% 106Bought any kitchen appliance in last 12 months 33,582 18.8% 108
Insurance (Adults)Currently carry any life insurance 201,058 52.1% 110Have medical/hospital/accident insurance 292,271 75.8% 106Carry homeowner insurance 232,789 60.4% 115Carry renter insurance 20,694 5.4% 87Have auto/other vehicle insurance 341,615 88.6% 107
Pets (Households)HH owns any pet 100,036 56.0% 109HH owns any cat 41,103 23.0% 96HH owns any dog 74,940 42.0% 112
Reading Materials (Adults)Bought book in last 12 months 217,498 56.4% 112Read any daily newspaper 157,074 40.7% 99Heavy magazine reader 83,659 21.7% 109
Restaurants (Adults)Went to family restaurant/steak house in last 6 mo 305,279 79.2% 110Went to family restaurant/steak house last mo: <2 times 102,640 26.6% 104Went to family restaurant/steak house last mo: 2-4 times 115,659 30.0% 111Went to family restaurant/steak house last mo: 5+ times 86,989 22.6% 116Went to fast food/drive-in restaurant in last 6 mo 351,545 91.2% 103Went to fast food/drive-in restaurant <6 times/mo 129,915 33.7% 96Went to fast food/drive-in restaurant 6-13 times/mo 118,738 30.8% 107Went to fast food/drive-in restaurant 14+ times/mo 102,891 26.7% 107Fast food/drive-in last 6 mo: eat in 152,899 39.7% 105Fast food/drive-in last 6 mo: home delivery 46,799 12.1% 116Fast food/drive-in last 6 mo: take-out/drive-thru 216,824 56.2% 108Fast food/drive-in last 6 mo: take-out/walk-in 100,337 26.0% 106
March 17, 2014
©2014 Esri Page 11 of 12
Data Note: An MPI (Market Potential Index) measures the relative likelihood of the adults in the specified trade area to exhibit certain consumer behavior or purchasingpatterns compared to the U.S. An MPI of 100 represents the U.S. average.Source: These data are based upon national propensities to use various products and services, applied to local demographic composition. Usage data were collected byGfK MRI in a nationally representative survey of U.S. households. Esri forecasts for 2013 and 2018.
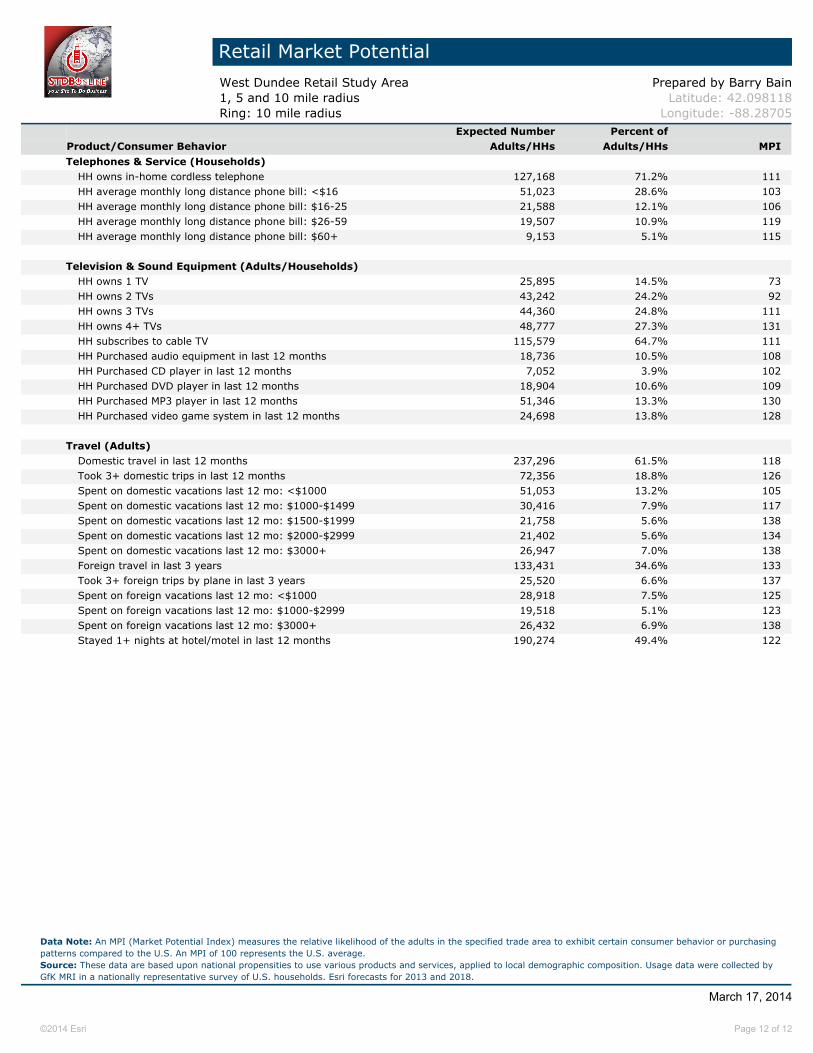
Retail Market Potential
West Dundee Retail Study Area Prepared by Barry Bain1, 5 and 10 mile radius Latitude: 42.098118Ring: 10 mile radius Longitude: -88.28705
Expected Number Percent ofProduct/Consumer Behavior Adults/HHs Adults/HHs MPI
Telephones & Service (Households)HH owns in-home cordless telephone 127,168 71.2% 111HH average monthly long distance phone bill: <$16 51,023 28.6% 103HH average monthly long distance phone bill: $16-25 21,588 12.1% 106HH average monthly long distance phone bill: $26-59 19,507 10.9% 119HH average monthly long distance phone bill: $60+ 9,153 5.1% 115
Television & Sound Equipment (Adults/Households)HH owns 1 TV 25,895 14.5% 73HH owns 2 TVs 43,242 24.2% 92HH owns 3 TVs 44,360 24.8% 111HH owns 4+ TVs 48,777 27.3% 131HH subscribes to cable TV 115,579 64.7% 111HH Purchased audio equipment in last 12 months 18,736 10.5% 108HH Purchased CD player in last 12 months 7,052 3.9% 102HH Purchased DVD player in last 12 months 18,904 10.6% 109HH Purchased MP3 player in last 12 months 51,346 13.3% 130HH Purchased video game system in last 12 months 24,698 13.8% 128
Travel (Adults)Domestic travel in last 12 months 237,296 61.5% 118Took 3+ domestic trips in last 12 months 72,356 18.8% 126Spent on domestic vacations last 12 mo: <$1000 51,053 13.2% 105Spent on domestic vacations last 12 mo: $1000-$1499 30,416 7.9% 117Spent on domestic vacations last 12 mo: $1500-$1999 21,758 5.6% 138Spent on domestic vacations last 12 mo: $2000-$2999 21,402 5.6% 134Spent on domestic vacations last 12 mo: $3000+ 26,947 7.0% 138Foreign travel in last 3 years 133,431 34.6% 133Took 3+ foreign trips by plane in last 3 years 25,520 6.6% 137Spent on foreign vacations last 12 mo: <$1000 28,918 7.5% 125Spent on foreign vacations last 12 mo: $1000-$2999 19,518 5.1% 123Spent on foreign vacations last 12 mo: $3000+ 26,432 6.9% 138Stayed 1+ nights at hotel/motel in last 12 months 190,274 49.4% 122
March 17, 2014
©2014 Esri Page 12 of 12
Data Note: An MPI (Market Potential Index) measures the relative likelihood of the adults in the specified trade area to exhibit certain consumer behavior or purchasingpatterns compared to the U.S. An MPI of 100 represents the U.S. average.Source: These data are based upon national propensities to use various products and services, applied to local demographic composition. Usage data were collected byGfK MRI in a nationally representative survey of U.S. households. Esri forecasts for 2013 and 2018.
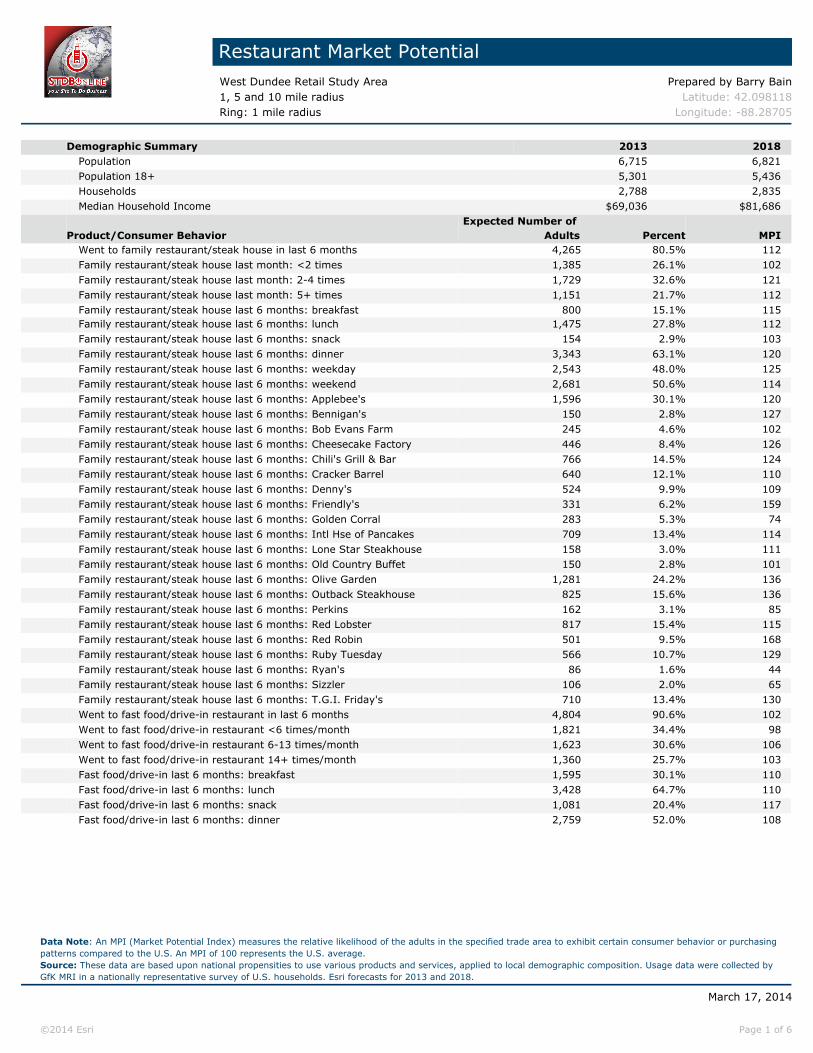
Restaurant Market PotentialWest Dundee Retail Study Area Prepared by Barry Bain1, 5 and 10 mile radius Latitude: 42.098118Ring: 1 mile radius Longitude: -88.28705
Demographic Summary 2013 2018Population 6,715 6,821Population 18+ 5,301 5,436Households 2,788 2,835Median Household Income $69,036 $81,686
Expected Number of Product/Consumer Behavior Adults Percent MPI
Went to family restaurant/steak house in last 6 months 4,265 80.5% 112Family restaurant/steak house last month: <2 times 1,385 26.1% 102Family restaurant/steak house last month: 2-4 times 1,729 32.6% 121Family restaurant/steak house last month: 5+ times 1,151 21.7% 112Family restaurant/steak house last 6 months: breakfast 800 15.1% 115Family restaurant/steak house last 6 months: lunch 1,475 27.8% 112Family restaurant/steak house last 6 months: snack 154 2.9% 103Family restaurant/steak house last 6 months: dinner 3,343 63.1% 120Family restaurant/steak house last 6 months: weekday 2,543 48.0% 125Family restaurant/steak house last 6 months: weekend 2,681 50.6% 114Family restaurant/steak house last 6 months: Applebee's 1,596 30.1% 120Family restaurant/steak house last 6 months: Bennigan's 150 2.8% 127Family restaurant/steak house last 6 months: Bob Evans Farm 245 4.6% 102Family restaurant/steak house last 6 months: Cheesecake Factory 446 8.4% 126Family restaurant/steak house last 6 months: Chili's Grill & Bar 766 14.5% 124Family restaurant/steak house last 6 months: Cracker Barrel 640 12.1% 110Family restaurant/steak house last 6 months: Denny's 524 9.9% 109Family restaurant/steak house last 6 months: Friendly's 331 6.2% 159Family restaurant/steak house last 6 months: Golden Corral 283 5.3% 74Family restaurant/steak house last 6 months: Intl Hse of Pancakes 709 13.4% 114Family restaurant/steak house last 6 months: Lone Star Steakhouse 158 3.0% 111Family restaurant/steak house last 6 months: Old Country Buffet 150 2.8% 101Family restaurant/steak house last 6 months: Olive Garden 1,281 24.2% 136Family restaurant/steak house last 6 months: Outback Steakhouse 825 15.6% 136Family restaurant/steak house last 6 months: Perkins 162 3.1% 85Family restaurant/steak house last 6 months: Red Lobster 817 15.4% 115Family restaurant/steak house last 6 months: Red Robin 501 9.5% 168Family restaurant/steak house last 6 months: Ruby Tuesday 566 10.7% 129Family restaurant/steak house last 6 months: Ryan's 86 1.6% 44Family restaurant/steak house last 6 months: Sizzler 106 2.0% 65Family restaurant/steak house last 6 months: T.G.I. Friday's 710 13.4% 130Went to fast food/drive-in restaurant in last 6 months 4,804 90.6% 102Went to fast food/drive-in restaurant <6 times/month 1,821 34.4% 98Went to fast food/drive-in restaurant 6-13 times/month 1,623 30.6% 106Went to fast food/drive-in restaurant 14+ times/month 1,360 25.7% 103Fast food/drive-in last 6 months: breakfast 1,595 30.1% 110Fast food/drive-in last 6 months: lunch 3,428 64.7% 110Fast food/drive-in last 6 months: snack 1,081 20.4% 117Fast food/drive-in last 6 months: dinner 2,759 52.0% 108
March 17, 2014
©2014 Esri Page 1 of 6
Data Note: An MPI (Market Potential Index) measures the relative likelihood of the adults in the specified trade area to exhibit certain consumer behavior or purchasingpatterns compared to the U.S. An MPI of 100 represents the U.S. average.Source: These data are based upon national propensities to use various products and services, applied to local demographic composition. Usage data were collected byGfK MRI in a nationally representative survey of U.S. households. Esri forecasts for 2013 and 2018.
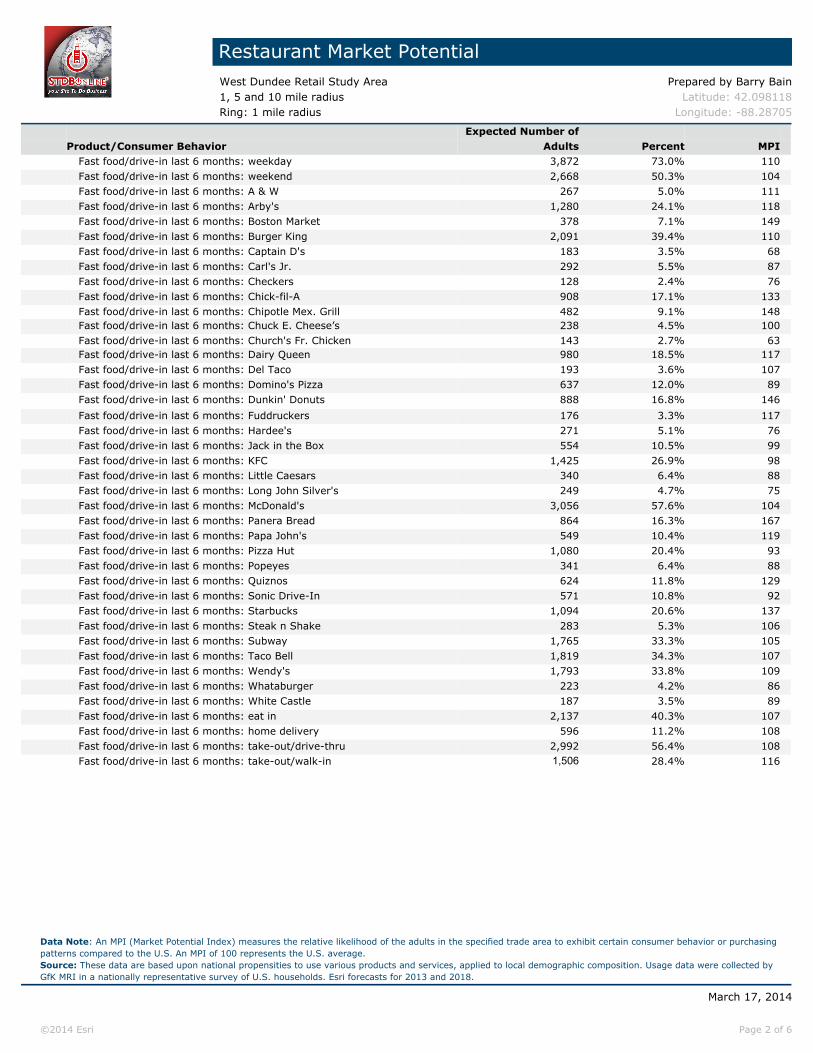
Restaurant Market PotentialWest Dundee Retail Study Area Prepared by Barry Bain1, 5 and 10 mile radius Latitude: 42.098118Ring: 1 mile radius Longitude: -88.28705
Expected Number ofProduct/Consumer Behavior Adults Percent MPI
Fast food/drive-in last 6 months: weekday 3,872 73.0% 110Fast food/drive-in last 6 months: weekend 2,668 50.3% 104Fast food/drive-in last 6 months: A & W 267 5.0% 111Fast food/drive-in last 6 months: Arby's 1,280 24.1% 118Fast food/drive-in last 6 months: Boston Market 378 7.1% 149Fast food/drive-in last 6 months: Burger King 2,091 39.4% 110Fast food/drive-in last 6 months: Captain D's 183 3.5% 68Fast food/drive-in last 6 months: Carl's Jr. 292 5.5% 87Fast food/drive-in last 6 months: Checkers 128 2.4% 76Fast food/drive-in last 6 months: Chick-fil-A 908 17.1% 133Fast food/drive-in last 6 months: Chipotle Mex. Grill 482 9.1% 148Fast food/drive-in last 6 months: Chuck E. Cheese’s 238 4.5% 100Fast food/drive-in last 6 months: Church's Fr. Chicken 143 2.7% 63Fast food/drive-in last 6 months: Dairy Queen 980 18.5% 117Fast food/drive-in last 6 months: Del Taco 193 3.6% 107Fast food/drive-in last 6 months: Domino's Pizza 637 12.0% 89Fast food/drive-in last 6 months: Dunkin' Donuts 888 16.8% 146
Fast food/drive-in last 6 months: Fuddruckers 176 3.3% 117Fast food/drive-in last 6 months: Hardee's 271 5.1% 76Fast food/drive-in last 6 months: Jack in the Box 554 10.5% 99Fast food/drive-in last 6 months: KFC 1,425 26.9% 98Fast food/drive-in last 6 months: Little Caesars 340 6.4% 88Fast food/drive-in last 6 months: Long John Silver's 249 4.7% 75Fast food/drive-in last 6 months: McDonald's 3,056 57.6% 104Fast food/drive-in last 6 months: Panera Bread 864 16.3% 167Fast food/drive-in last 6 months: Papa John's 549 10.4% 119Fast food/drive-in last 6 months: Pizza Hut 1,080 20.4% 93Fast food/drive-in last 6 months: Popeyes 341 6.4% 88Fast food/drive-in last 6 months: Quiznos 624 11.8% 129Fast food/drive-in last 6 months: Sonic Drive-In 571 10.8% 92Fast food/drive-in last 6 months: Starbucks 1,094 20.6% 137Fast food/drive-in last 6 months: Steak n Shake 283 5.3% 106Fast food/drive-in last 6 months: Subway 1,765 33.3% 105Fast food/drive-in last 6 months: Taco Bell 1,819 34.3% 107Fast food/drive-in last 6 months: Wendy's 1,793 33.8% 109Fast food/drive-in last 6 months: Whataburger 223 4.2% 86Fast food/drive-in last 6 months: White Castle 187 3.5% 89Fast food/drive-in last 6 months: eat in 2,137 40.3% 107Fast food/drive-in last 6 months: home delivery 596 11.2% 108Fast food/drive-in last 6 months: take-out/drive-thru 2,992 56.4% 108Fast food/drive-in last 6 months: take-out/walk-in 1,506 28.4% 116
March 17, 2014
©2014 Esri Page 2 of 6
Data Note: An MPI (Market Potential Index) measures the relative likelihood of the adults in the specified trade area to exhibit certain consumer behavior or purchasingpatterns compared to the U.S. An MPI of 100 represents the U.S. average.Source: These data are based upon national propensities to use various products and services, applied to local demographic composition. Usage data were collected byGfK MRI in a nationally representative survey of U.S. households. Esri forecasts for 2013 and 2018.
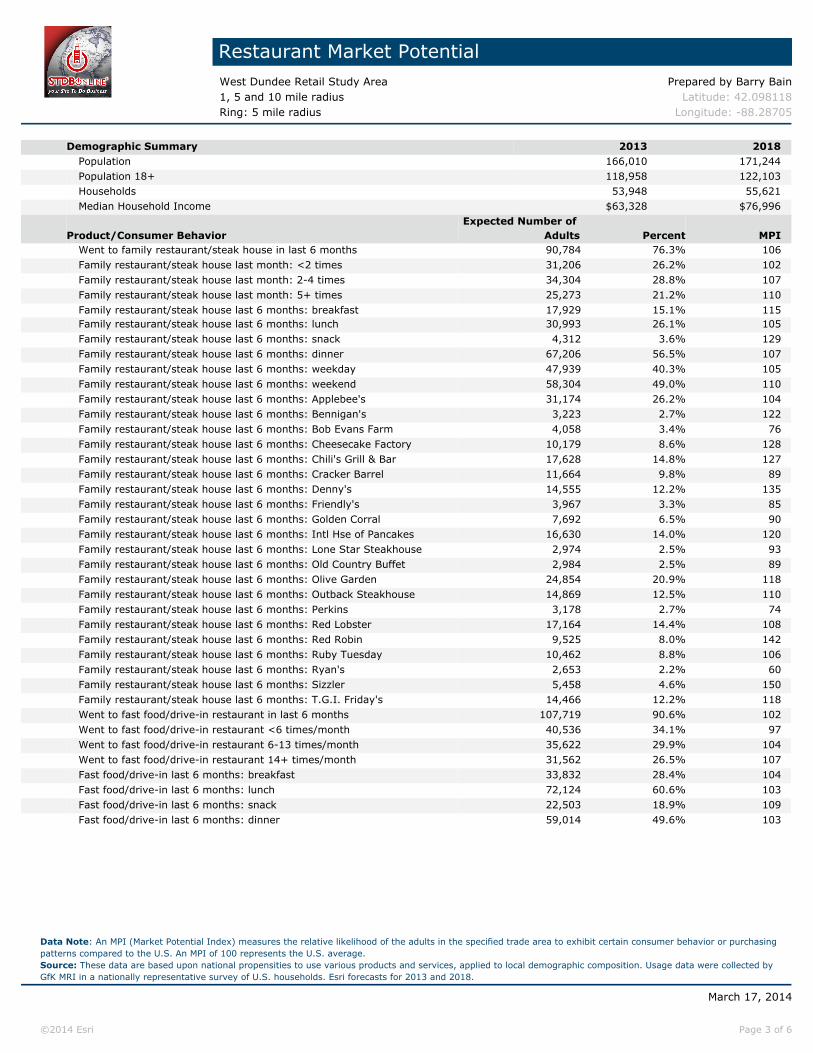
Restaurant Market PotentialWest Dundee Retail Study Area Prepared by Barry Bain1, 5 and 10 mile radius Latitude: 42.098118Ring: 5 mile radius Longitude: -88.28705
Demographic Summary 2013 2018Population 166,010 171,244Population 18+ 118,958 122,103Households 53,948 55,621Median Household Income $63,328 $76,996
Expected Number of Product/Consumer Behavior Adults Percent MPI
Went to family restaurant/steak house in last 6 months 90,784 76.3% 106Family restaurant/steak house last month: <2 times 31,206 26.2% 102Family restaurant/steak house last month: 2-4 times 34,304 28.8% 107Family restaurant/steak house last month: 5+ times 25,273 21.2% 110Family restaurant/steak house last 6 months: breakfast 17,929 15.1% 115Family restaurant/steak house last 6 months: lunch 30,993 26.1% 105Family restaurant/steak house last 6 months: snack 4,312 3.6% 129Family restaurant/steak house last 6 months: dinner 67,206 56.5% 107Family restaurant/steak house last 6 months: weekday 47,939 40.3% 105Family restaurant/steak house last 6 months: weekend 58,304 49.0% 110Family restaurant/steak house last 6 months: Applebee's 31,174 26.2% 104Family restaurant/steak house last 6 months: Bennigan's 3,223 2.7% 122Family restaurant/steak house last 6 months: Bob Evans Farm 4,058 3.4% 76Family restaurant/steak house last 6 months: Cheesecake Factory 10,179 8.6% 128Family restaurant/steak house last 6 months: Chili's Grill & Bar 17,628 14.8% 127Family restaurant/steak house last 6 months: Cracker Barrel 11,664 9.8% 89Family restaurant/steak house last 6 months: Denny's 14,555 12.2% 135Family restaurant/steak house last 6 months: Friendly's 3,967 3.3% 85Family restaurant/steak house last 6 months: Golden Corral 7,692 6.5% 90Family restaurant/steak house last 6 months: Intl Hse of Pancakes 16,630 14.0% 120Family restaurant/steak house last 6 months: Lone Star Steakhouse 2,974 2.5% 93Family restaurant/steak house last 6 months: Old Country Buffet 2,984 2.5% 89Family restaurant/steak house last 6 months: Olive Garden 24,854 20.9% 118Family restaurant/steak house last 6 months: Outback Steakhouse 14,869 12.5% 110Family restaurant/steak house last 6 months: Perkins 3,178 2.7% 74Family restaurant/steak house last 6 months: Red Lobster 17,164 14.4% 108Family restaurant/steak house last 6 months: Red Robin 9,525 8.0% 142Family restaurant/steak house last 6 months: Ruby Tuesday 10,462 8.8% 106Family restaurant/steak house last 6 months: Ryan's 2,653 2.2% 60Family restaurant/steak house last 6 months: Sizzler 5,458 4.6% 150Family restaurant/steak house last 6 months: T.G.I. Friday's 14,466 12.2% 118Went to fast food/drive-in restaurant in last 6 months 107,719 90.6% 102Went to fast food/drive-in restaurant <6 times/month 40,536 34.1% 97Went to fast food/drive-in restaurant 6-13 times/month 35,622 29.9% 104Went to fast food/drive-in restaurant 14+ times/month 31,562 26.5% 107Fast food/drive-in last 6 months: breakfast 33,832 28.4% 104Fast food/drive-in last 6 months: lunch 72,124 60.6% 103Fast food/drive-in last 6 months: snack 22,503 18.9% 109Fast food/drive-in last 6 months: dinner 59,014 49.6% 103
March 17, 2014
©2014 Esri Page 3 of 6
Data Note: An MPI (Market Potential Index) measures the relative likelihood of the adults in the specified trade area to exhibit certain consumer behavior or purchasingpatterns compared to the U.S. An MPI of 100 represents the U.S. average.Source: These data are based upon national propensities to use various products and services, applied to local demographic composition. Usage data were collected byGfK MRI in a nationally representative survey of U.S. households. Esri forecasts for 2013 and 2018.
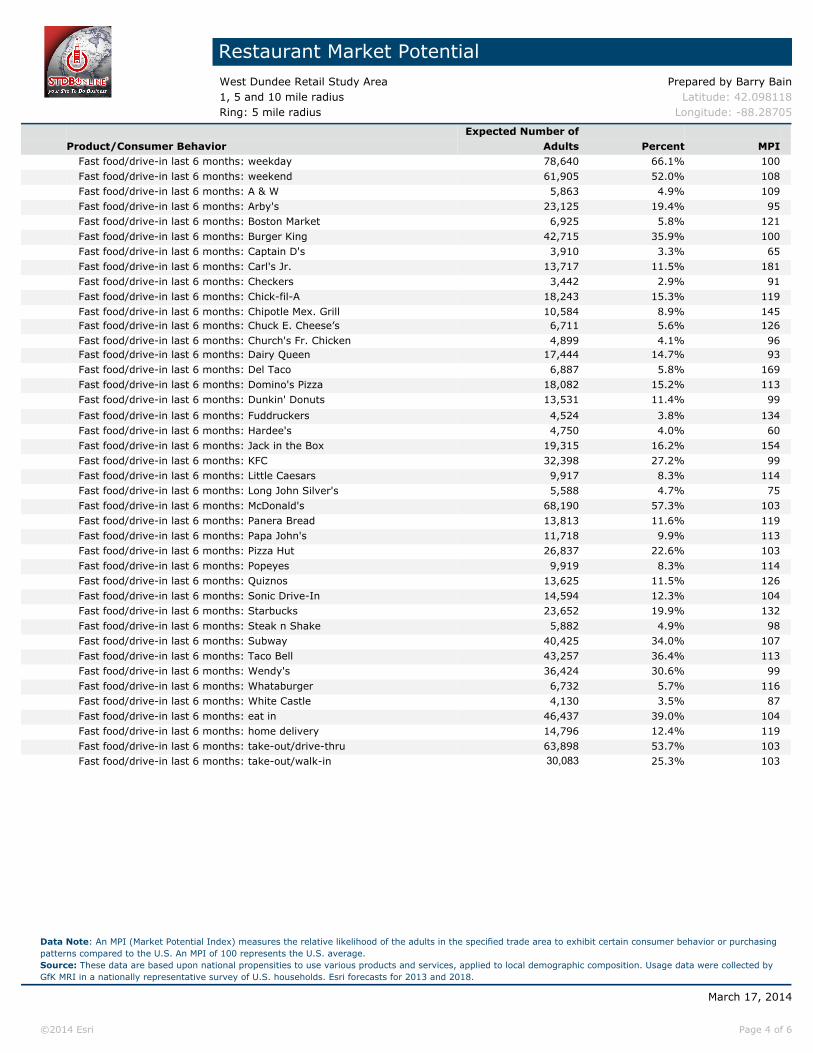
Restaurant Market PotentialWest Dundee Retail Study Area Prepared by Barry Bain1, 5 and 10 mile radius Latitude: 42.098118Ring: 5 mile radius Longitude: -88.28705
Expected Number ofProduct/Consumer Behavior Adults Percent MPI
Fast food/drive-in last 6 months: weekday 78,640 66.1% 100Fast food/drive-in last 6 months: weekend 61,905 52.0% 108Fast food/drive-in last 6 months: A & W 5,863 4.9% 109Fast food/drive-in last 6 months: Arby's 23,125 19.4% 95Fast food/drive-in last 6 months: Boston Market 6,925 5.8% 121Fast food/drive-in last 6 months: Burger King 42,715 35.9% 100Fast food/drive-in last 6 months: Captain D's 3,910 3.3% 65Fast food/drive-in last 6 months: Carl's Jr. 13,717 11.5% 181Fast food/drive-in last 6 months: Checkers 3,442 2.9% 91Fast food/drive-in last 6 months: Chick-fil-A 18,243 15.3% 119Fast food/drive-in last 6 months: Chipotle Mex. Grill 10,584 8.9% 145Fast food/drive-in last 6 months: Chuck E. Cheese’s 6,711 5.6% 126Fast food/drive-in last 6 months: Church's Fr. Chicken 4,899 4.1% 96Fast food/drive-in last 6 months: Dairy Queen 17,444 14.7% 93Fast food/drive-in last 6 months: Del Taco 6,887 5.8% 169Fast food/drive-in last 6 months: Domino's Pizza 18,082 15.2% 113Fast food/drive-in last 6 months: Dunkin' Donuts 13,531 11.4% 99
Fast food/drive-in last 6 months: Fuddruckers 4,524 3.8% 134Fast food/drive-in last 6 months: Hardee's 4,750 4.0% 60Fast food/drive-in last 6 months: Jack in the Box 19,315 16.2% 154Fast food/drive-in last 6 months: KFC 32,398 27.2% 99Fast food/drive-in last 6 months: Little Caesars 9,917 8.3% 114Fast food/drive-in last 6 months: Long John Silver's 5,588 4.7% 75Fast food/drive-in last 6 months: McDonald's 68,190 57.3% 103Fast food/drive-in last 6 months: Panera Bread 13,813 11.6% 119Fast food/drive-in last 6 months: Papa John's 11,718 9.9% 113Fast food/drive-in last 6 months: Pizza Hut 26,837 22.6% 103Fast food/drive-in last 6 months: Popeyes 9,919 8.3% 114Fast food/drive-in last 6 months: Quiznos 13,625 11.5% 126Fast food/drive-in last 6 months: Sonic Drive-In 14,594 12.3% 104Fast food/drive-in last 6 months: Starbucks 23,652 19.9% 132Fast food/drive-in last 6 months: Steak n Shake 5,882 4.9% 98Fast food/drive-in last 6 months: Subway 40,425 34.0% 107Fast food/drive-in last 6 months: Taco Bell 43,257 36.4% 113Fast food/drive-in last 6 months: Wendy's 36,424 30.6% 99Fast food/drive-in last 6 months: Whataburger 6,732 5.7% 116Fast food/drive-in last 6 months: White Castle 4,130 3.5% 87Fast food/drive-in last 6 months: eat in 46,437 39.0% 104Fast food/drive-in last 6 months: home delivery 14,796 12.4% 119Fast food/drive-in last 6 months: take-out/drive-thru 63,898 53.7% 103Fast food/drive-in last 6 months: take-out/walk-in 30,083 25.3% 103
March 17, 2014
©2014 Esri Page 4 of 6
Data Note: An MPI (Market Potential Index) measures the relative likelihood of the adults in the specified trade area to exhibit certain consumer behavior or purchasingpatterns compared to the U.S. An MPI of 100 represents the U.S. average.Source: These data are based upon national propensities to use various products and services, applied to local demographic composition. Usage data were collected byGfK MRI in a nationally representative survey of U.S. households. Esri forecasts for 2013 and 2018.
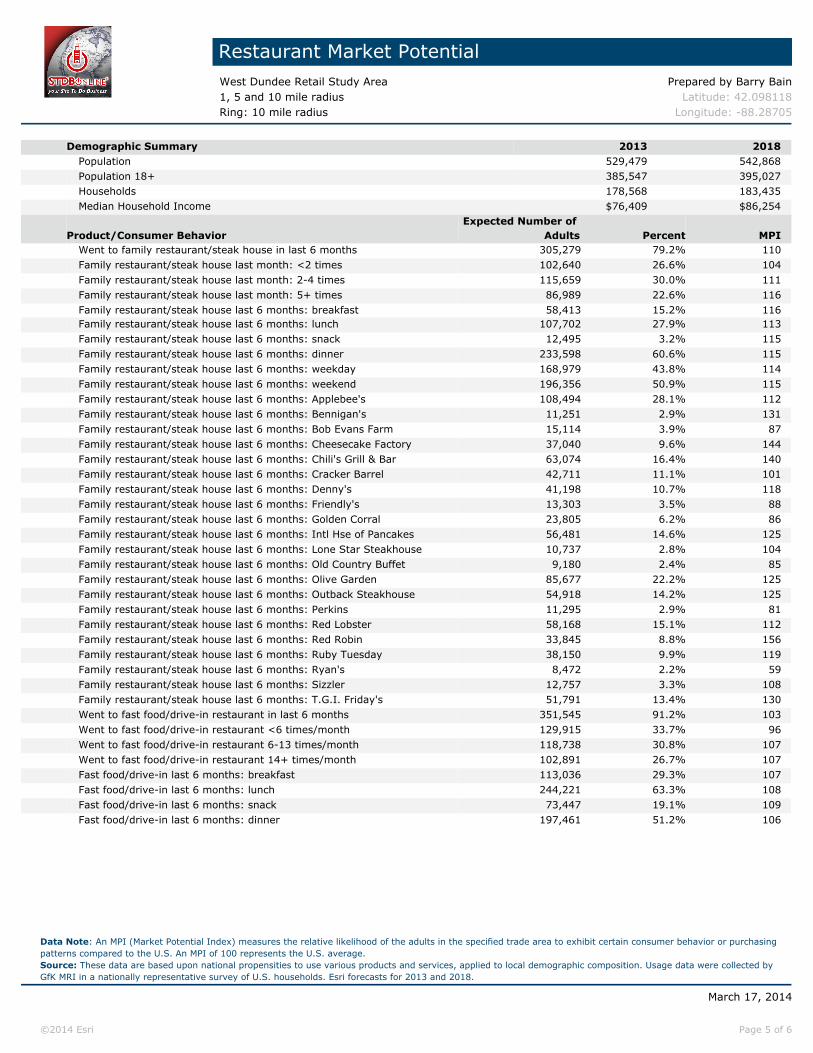
Restaurant Market PotentialWest Dundee Retail Study Area Prepared by Barry Bain1, 5 and 10 mile radius Latitude: 42.098118Ring: 10 mile radius Longitude: -88.28705
Demographic Summary 2013 2018Population 529,479 542,868Population 18+ 385,547 395,027Households 178,568 183,435Median Household Income $76,409 $86,254
Expected Number of Product/Consumer Behavior Adults Percent MPI
Went to family restaurant/steak house in last 6 months 305,279 79.2% 110Family restaurant/steak house last month: <2 times 102,640 26.6% 104Family restaurant/steak house last month: 2-4 times 115,659 30.0% 111Family restaurant/steak house last month: 5+ times 86,989 22.6% 116Family restaurant/steak house last 6 months: breakfast 58,413 15.2% 116Family restaurant/steak house last 6 months: lunch 107,702 27.9% 113Family restaurant/steak house last 6 months: snack 12,495 3.2% 115Family restaurant/steak house last 6 months: dinner 233,598 60.6% 115Family restaurant/steak house last 6 months: weekday 168,979 43.8% 114Family restaurant/steak house last 6 months: weekend 196,356 50.9% 115Family restaurant/steak house last 6 months: Applebee's 108,494 28.1% 112Family restaurant/steak house last 6 months: Bennigan's 11,251 2.9% 131Family restaurant/steak house last 6 months: Bob Evans Farm 15,114 3.9% 87Family restaurant/steak house last 6 months: Cheesecake Factory 37,040 9.6% 144Family restaurant/steak house last 6 months: Chili's Grill & Bar 63,074 16.4% 140Family restaurant/steak house last 6 months: Cracker Barrel 42,711 11.1% 101Family restaurant/steak house last 6 months: Denny's 41,198 10.7% 118Family restaurant/steak house last 6 months: Friendly's 13,303 3.5% 88Family restaurant/steak house last 6 months: Golden Corral 23,805 6.2% 86Family restaurant/steak house last 6 months: Intl Hse of Pancakes 56,481 14.6% 125Family restaurant/steak house last 6 months: Lone Star Steakhouse 10,737 2.8% 104Family restaurant/steak house last 6 months: Old Country Buffet 9,180 2.4% 85Family restaurant/steak house last 6 months: Olive Garden 85,677 22.2% 125Family restaurant/steak house last 6 months: Outback Steakhouse 54,918 14.2% 125Family restaurant/steak house last 6 months: Perkins 11,295 2.9% 81Family restaurant/steak house last 6 months: Red Lobster 58,168 15.1% 112Family restaurant/steak house last 6 months: Red Robin 33,845 8.8% 156Family restaurant/steak house last 6 months: Ruby Tuesday 38,150 9.9% 119Family restaurant/steak house last 6 months: Ryan's 8,472 2.2% 59Family restaurant/steak house last 6 months: Sizzler 12,757 3.3% 108Family restaurant/steak house last 6 months: T.G.I. Friday's 51,791 13.4% 130Went to fast food/drive-in restaurant in last 6 months 351,545 91.2% 103Went to fast food/drive-in restaurant <6 times/month 129,915 33.7% 96Went to fast food/drive-in restaurant 6-13 times/month 118,738 30.8% 107Went to fast food/drive-in restaurant 14+ times/month 102,891 26.7% 107Fast food/drive-in last 6 months: breakfast 113,036 29.3% 107Fast food/drive-in last 6 months: lunch 244,221 63.3% 108Fast food/drive-in last 6 months: snack 73,447 19.1% 109Fast food/drive-in last 6 months: dinner 197,461 51.2% 106
March 17, 2014
©2014 Esri Page 5 of 6
Data Note: An MPI (Market Potential Index) measures the relative likelihood of the adults in the specified trade area to exhibit certain consumer behavior or purchasingpatterns compared to the U.S. An MPI of 100 represents the U.S. average.Source: These data are based upon national propensities to use various products and services, applied to local demographic composition. Usage data were collected byGfK MRI in a nationally representative survey of U.S. households. Esri forecasts for 2013 and 2018.

Restaurant Market PotentialWest Dundee Retail Study Area Prepared by Barry Bain1, 5 and 10 mile radius Latitude: 42.098118Ring: 10 mile radius Longitude: -88.28705
Expected Number ofProduct/Consumer Behavior Adults Percent MPI
Fast food/drive-in last 6 months: weekday 268,947 69.8% 105Fast food/drive-in last 6 months: weekend 200,538 52.0% 108Fast food/drive-in last 6 months: A & W 18,444 4.8% 106Fast food/drive-in last 6 months: Arby's 80,885 21.0% 103Fast food/drive-in last 6 months: Boston Market 24,975 6.5% 135Fast food/drive-in last 6 months: Burger King 137,141 35.6% 99Fast food/drive-in last 6 months: Captain D's 13,496 3.5% 69Fast food/drive-in last 6 months: Carl's Jr. 35,470 9.2% 145Fast food/drive-in last 6 months: Checkers 11,456 3.0% 93Fast food/drive-in last 6 months: Chick-fil-A 68,335 17.7% 137Fast food/drive-in last 6 months: Chipotle Mex. Grill 38,016 9.9% 160Fast food/drive-in last 6 months: Chuck E. Cheese’s 20,769 5.4% 120Fast food/drive-in last 6 months: Church's Fr. Chicken 14,008 3.6% 85Fast food/drive-in last 6 months: Dairy Queen 60,383 15.7% 99Fast food/drive-in last 6 months: Del Taco 19,454 5.0% 148Fast food/drive-in last 6 months: Domino's Pizza 55,892 14.5% 108Fast food/drive-in last 6 months: Dunkin' Donuts 47,420 12.3% 107
Fast food/drive-in last 6 months: Fuddruckers 16,647 4.3% 153Fast food/drive-in last 6 months: Hardee's 16,024 4.2% 62Fast food/drive-in last 6 months: Jack in the Box 53,512 13.9% 132Fast food/drive-in last 6 months: KFC 102,835 26.7% 97Fast food/drive-in last 6 months: Little Caesars 30,050 7.8% 107Fast food/drive-in last 6 months: Long John Silver's 18,387 4.8% 76Fast food/drive-in last 6 months: McDonald's 223,315 57.9% 104Fast food/drive-in last 6 months: Panera Bread 52,952 13.7% 141Fast food/drive-in last 6 months: Papa John's 40,568 10.5% 121Fast food/drive-in last 6 months: Pizza Hut 84,952 22.0% 100Fast food/drive-in last 6 months: Popeyes 30,230 7.8% 107Fast food/drive-in last 6 months: Quiznos 47,770 12.4% 136Fast food/drive-in last 6 months: Sonic Drive-In 48,844 12.7% 108Fast food/drive-in last 6 months: Starbucks 83,595 21.7% 144Fast food/drive-in last 6 months: Steak n Shake 21,473 5.6% 111Fast food/drive-in last 6 months: Subway 134,925 35.0% 111Fast food/drive-in last 6 months: Taco Bell 139,345 36.1% 113Fast food/drive-in last 6 months: Wendy's 125,042 32.4% 105Fast food/drive-in last 6 months: Whataburger 22,113 5.7% 118Fast food/drive-in last 6 months: White Castle 13,400 3.5% 87Fast food/drive-in last 6 months: eat in 152,899 39.7% 105Fast food/drive-in last 6 months: home delivery 46,799 12.1% 116Fast food/drive-in last 6 months: take-out/drive-thru 216,824 56.2% 108Fast food/drive-in last 6 months: take-out/walk-in 100,337 26.0% 106
March 17, 2014
©2014 Esri Page 6 of 6
Data Note: An MPI (Market Potential Index) measures the relative likelihood of the adults in the specified trade area to exhibit certain consumer behavior or purchasingpatterns compared to the U.S. An MPI of 100 represents the U.S. average.Source: These data are based upon national propensities to use various products and services, applied to local demographic composition. Usage data were collected byGfK MRI in a nationally representative survey of U.S. households. Esri forecasts for 2013 and 2018.
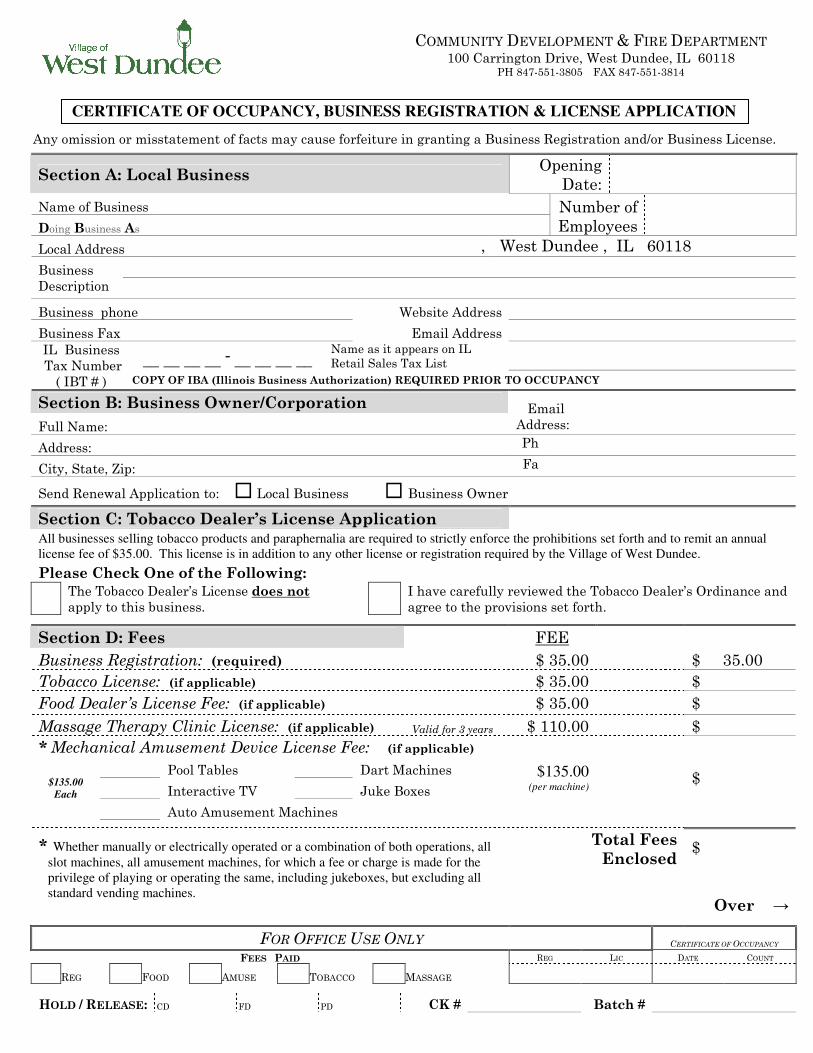
Any omission or misstatement of facts may cause forfeiture in granting a Business Registration and/or Business License.
Section A: Local Business Opening
Date:
Name of Business
Doing Business As Number of
Employees
Local Address , West Dundee , IL 60118
Business
Description
Business phone Website Address
Business Fax Email Address
__ __ __ __ - __ __ __ __ Name as it appears on IL
Retail Sales Tax List IL Business
Tax Number
( IBT # ) COPY OF IBA (Illinois Business Authorization) REQUIRED PRIOR TO OCCUPANCY
Section B: Business Owner/Corporation
Full Name: Email
Address:
Address: Ph
one
City, State, Zip: Fa
x:
Send Renewal Application to: � Local Business � Business Owner
Section C: Tobacco Dealer’s License Application All businesses selling tobacco products and paraphernalia are required to strictly enforce the prohibitions set forth and to remit an annual license fee of $35.00. This license is in addition to any other license or registration required by the Village of West Dundee.
Please Check One of the Following:
The Tobacco Dealer’s License does not
apply to this business. I have carefully reviewed the Tobacco Dealer’s Ordinance and
agree to the provisions set forth. Section D: Fees FEE
Business Registration: (required) $ 35.00 $ 35.00
Tobacco License: (if applicable) $ 35.00 $
Food Dealer’s License Fee: (if applicable) $ 35.00 $
Massage Therapy Clinic License: (if applicable) Valid for 3 years $ 110.00 $
* Mechanical Amusement Device License Fee: (if applicable)
Pool Tables Dart Machines
Interactive TV Juke Boxes $135.00
Each
Auto Amusement Machines
$135.00 (per machine)
$
Total Fees
Enclosed
* Whether manually or electrically operated or a combination of both operations, all slot machines, all amusement machines, for which a fee or charge is made for the privilege of playing or operating the same, including jukeboxes, but excluding all standard vending machines.
$
Over →
FOR OFFICE USE ONLY CERTIFICATE OF OCCUPANCY
FEES PAID REG LIC DATE COUNT
REG FOOD AMUSE TOBACCO MASSAGE
HOLD / RELEASE: CD FD PD CK # Batch #
COMMUNITY DEVELOPMENT & FIRE DEPARTMENT 100 Carrington Drive, West Dundee, IL 60118
PH 847-551-3805 FAX 847-551-3814
CERTIFICATE OF OCCUPANCY, BUSINESS REGISTRATION & LICENSE APPLICATION
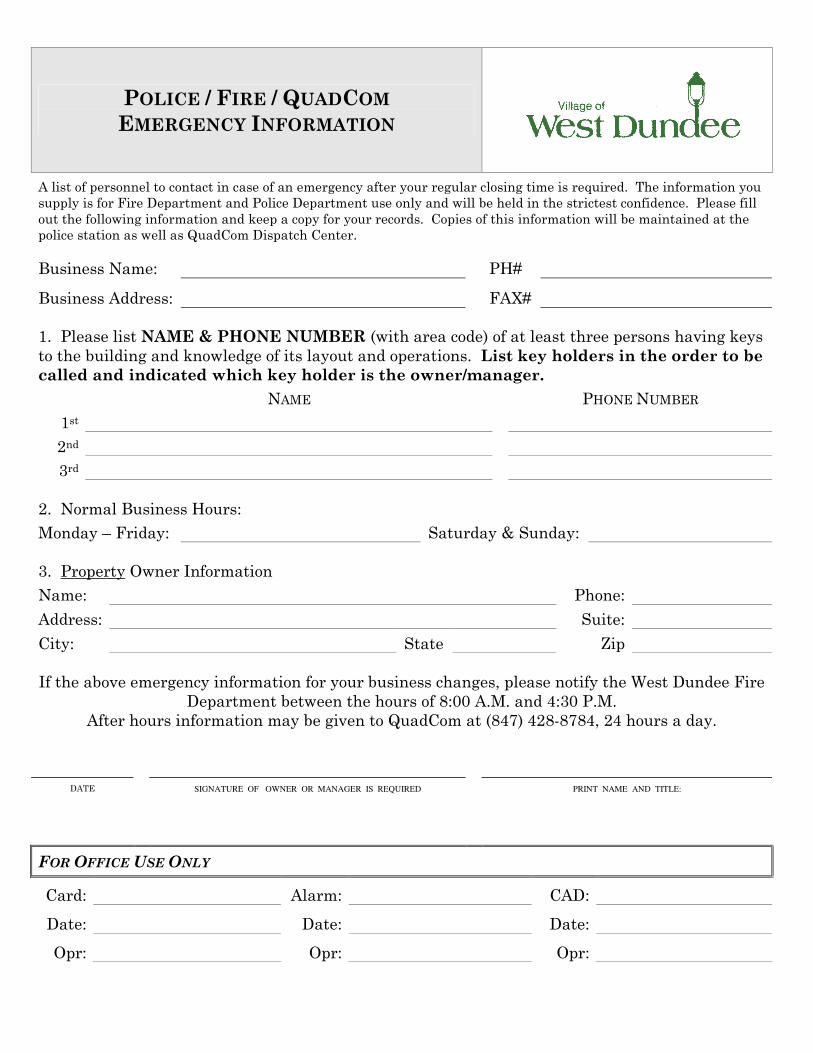
POLICE / FIRE / QUADCOM
EMERGENCY INFORMATION
A list of personnel to contact in case of an emergency after your regular closing time is required. The information you
supply is for Fire Department and Police Department use only and will be held in the strictest confidence. Please fill
out the following information and keep a copy for your records. Copies of this information will be maintained at the
police station as well as QuadCom Dispatch Center.
Business Name:
PH#
Business Address:
FAX#
1. Please list NAME & PHONE NUMBER (with area code) of at least three persons having keys
to the building and knowledge of its layout and operations. List key holders in the order to be
called and indicated which key holder is the owner/manager.
NAME PHONE NUMBER
1st
2nd
3rd
2. Normal Business Hours:
Monday – Friday: Saturday & Sunday:
3. Property Owner Information
Name: Phone:
Address: Suite:
City: State Zip
If the above emergency information for your business changes, please notify the West Dundee Fire
Department between the hours of 8:00 A.M. and 4:30 P.M.
After hours information may be given to QuadCom at (847) 428-8784, 24 hours a day.
DATE SIGNATURE OF OWNER OR MANAGER IS REQUIRED PRINT NAME AND TITLE:
FOR OFFICE USE ONLY
Card: Alarm: CAD:
Date: Date: Date:
Opr: Opr: Opr:
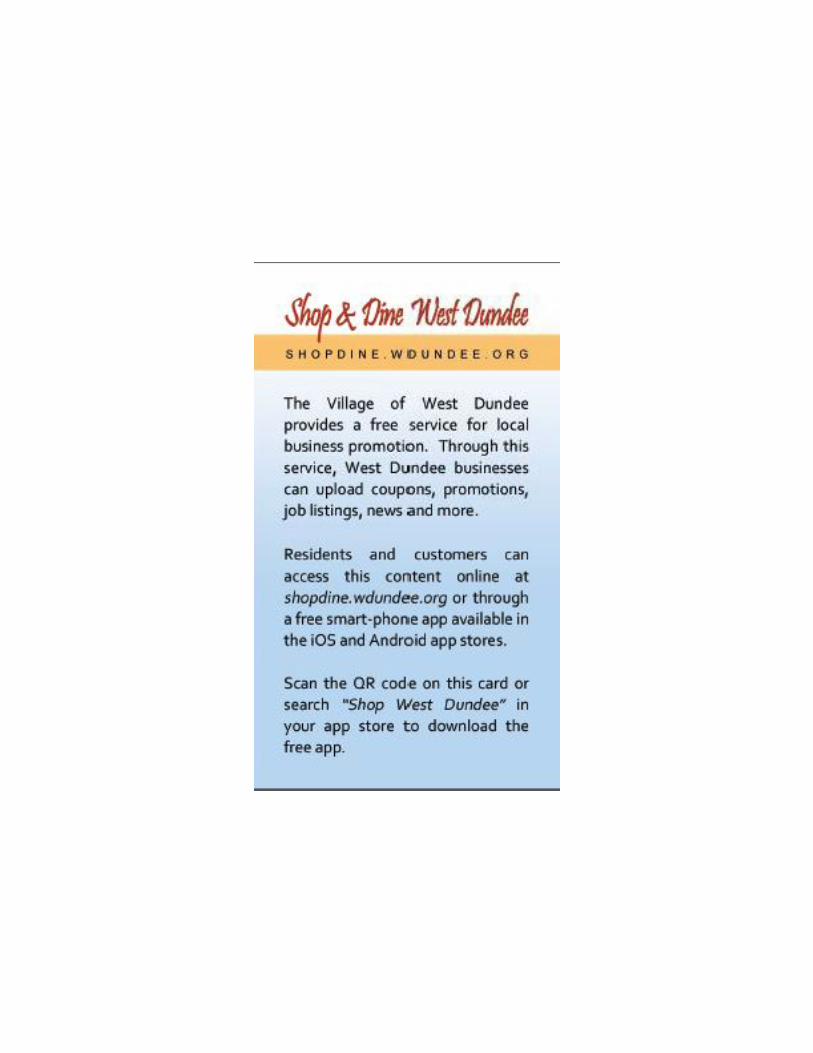


MEMORANDUM
TO: Appearance Review Applicants
FROM: West Dundee Community Development Department
The Appearance Review Commission meets the first Tuesday of each month. These meetings are
held at the Village Hall located at 102 South Second St., West Dundee at 7:30 p.m.
Meetings are subject to change.
Initial Submittal – Pre-application Conference
All applicants are encouraged to meet with the Community Development Director prior to
submitting an application for consideration, in order to determine ordinance compliance. The
following items shall be submitted at this time.
� Completed Appearance Review Appropriateness Approval Application � Application for Sign Permit (if applicable) � Permit Application for Construction (if applicable) � Plat of Survey (if applicable) � One set of plans, specifications, & color samples
Final Submittal
� Eleven additional sets of plans, specifications, & color samples, (twelve if the above set was not in compliance).
� Twenty-five ($25) application fee
Final submittals are required to be at the Community Development Department ten (10)
business days prior to the meeting in order to be considered for the next month’s Appearance
Review meeting.
If you have any questions please do not hesitate to call the Community Development
Department at the number below.
Community Development & Fire Department 100 Carrington Drive, West Dundee, IL 60118
(847) 551-3805 * FAX (847) 551-3814

Community Development 100 Carrington Drive
West Dundee, IL 60118
847-551-3805 FAX 847-551-3814
Appearance Review Appropriateness Approval Application
Twelve sets of plans, specifications, color samples & a fee of $25,
are required as part of this application.
Date:
Job Address:
Business Name:
Manager / Owner:
Phone: Fax:
Building Owner:
Owner Address:
Phone: Fax:
New Construction �
Exterior Alteration �
Signage �
TYPE OF WORK PROPOSED:
Total Cost:
Explanation:
Contractor: Phone:
Address:
Contact Person: Phone
Fax:

Community Development & Fire Department 100 Carrington Drive, West Dundee, IL 60118
(847) 551-3805 * FAX (847) 551-3814
BUILDING PERMIT APPLICATION Name of Applicant: Date: Job Address: Parcel # # of Sq. Ft: Total Cost of Job $ Owner:
NAME ADDRESS CITY, STATE PHONE #
Current Use of Building: Description of Work: YES N/A COPY OF HOMEOWNER’S ASSOC. APPROVAL YES N/A COPY OF CONTRACT OR HOMEOWNER’S AUTHORIZATION
C O N T R A C T O R I N F O R M A T I O N GENERAL:
ELECTRICAL:
ADDRESS: ADDRESS:
PH: FX: PH: FX:
ROOFING:
SPRINKLER: ADDRESS: ADDRESS: PH: FX: PH: FX:
LICENSE # : EXP. DATE: LICENSE # : EXP. DATE:
PLUMBING:
FIRE ALARM: ADDRESS: ADDRESS: PH: FX: PH: FX:
CONTRACTOR’S REGISTRATION # EXP. DATE: LICENSE #: EXP. DATE:
I, the undersigned, certify that if a permit is issued to me I will comply with all provisions of the building, plumbing, electric, and other applicable ordinances of the Village of West Dundee, and shall perform all work, or cause all work to be performed according to the provisions of said ordinances. I, or my agent shall personally supervise the work and shall do, or cause to have done, said work according to plans, specifications, and other written information supplied as a part of this application. I am familiar with the applicable ordinances and the provisions therein and in signing this certificate do willing become responsible for all work accomplished under the permit by all contractors, tradesmen, craftsmen, laborers, and workmen, and shall call for inspections required, twenty-four (24) hours before they become due. SIGNED:
REMARKS:
ACCEPTED: REJECTED: DATE:
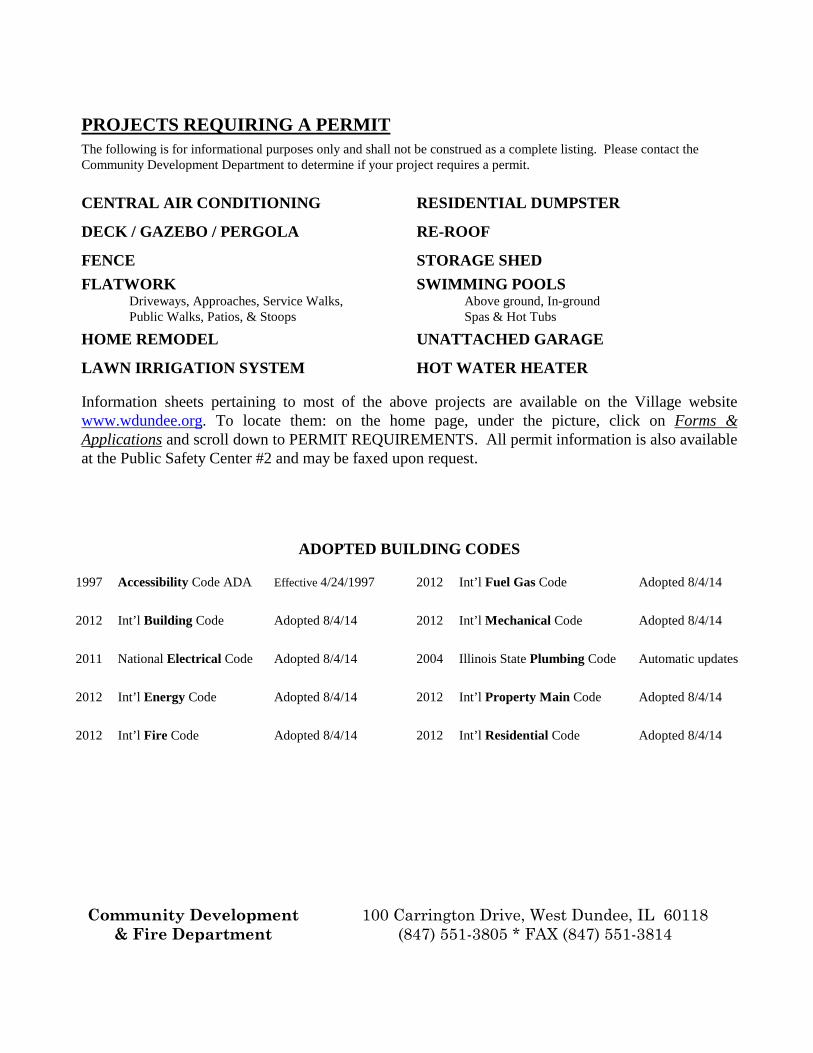
PROJECTS REQUIRING A PERMIT
The following is for informational purposes only and shall not be construed as a complete listing. Please contact the Community Development Department to determine if your project requires a permit.
CENTRAL AIR CONDITIONING RESIDENTIAL DUMPSTER
DECK / GAZEBO / PERGOLA RE-ROOF
FENCE STORAGE SHED FLATWORK Driveways, Approaches, Service Walks, Public Walks, Patios, & Stoops
SWIMMING POOLS Above ground, In-ground Spas & Hot Tubs
HOME REMODEL UNATTACHED GARAGE
LAWN IRRIGATION SYSTEM HOT WATER HEATER
Information sheets pertaining to most of the above projects are available on the Village website www.wdundee.org. To locate them: on the home page, under the picture, click on Forms & Applications and scroll down to PERMIT REQUIREMENTS. All permit information is also available at the Public Safety Center #2 and may be faxed upon request.
ADOPTED BUILDING CODES
1997 Accessibility Code ADA Effective 4/24/1997
2012 Int’l Fuel Gas Code Adopted 8/4/14
2012 Int’l Building Code Adopted 8/4/14
2012 Int’l Mechanical Code Adopted 8/4/14
2011 National Electrical Code Adopted 8/4/14
2004 Illinois State Plumbing Code Automatic updates
2012 Int’l Energy Code Adopted 8/4/14
2012 Int’l Property Main Code Adopted 8/4/14
2012 Int’l Fire Code Adopted 8/4/14
2012 Int’l Residential Code Adopted 8/4/14
Community Development & Fire Department
100 Carrington Drive, West Dundee, IL 60118 (847) 551-3805 * FAX (847) 551-3814

APPLICATION FOR SIGN PERMIT
Date:
Address of Proposed Sign:
Business Name:
Phone: Owner / Manager
Name & Address Fax:
Owner of Property: Phone:
Owner’s Address: Fax:
Contractors Name: Phone:
Address:
Contact Name: Fax:
Plat of survey attached indicating location of sign: Yes No Zoning Classification:
Front Façade Wall Area Height From Grade
NOTE: A to scale, color drawing is required for all wall signage to determine compliance.
���� CHECK ALL BOXES BELOW THAT APPLY
Freestanding Electric Illuminated
Wall Non-Electric Non-Illuminated
Canopy / Awning Double Faced Temporary
Cost Of Sign: $
Sign Dimensions: X = sq. ft.
Approved
Not Approved
SIGNATURE
Community Development & Fire Department
100 Carrington Drive, West Dundee, IL 60118
Phone 847-551-3805 Fax 847-551-3814

2014 APPLICATION FOR FOOD HANDLING PERMIT
As prescribed in Article II, Section C, Kane County Food Sanitation Ordinance, the undersigned hereby makes application for a permit to operate a food service establishment in the County of Kane.
ESTABLISHMENT INFORMATION Fax __________________________________
Name of Business ___________________________________________________________ Phone ________________________________
Address __________________________________________________ City/State _________________________ Zip _________________
E-mail ____________________________________________________Website_________________________________________________
Parcel Identification Number ____________________________________ (REQUIRED FIELD FOR NEW ESTABLISHMENTS)
DIRECT BILLING STATEMENT TO Fax ________________________________
Name of Business Owner______________________________________________________ Phone ________________________________
Address _____________________________________________ City/State ______________________________ Zip _________________
PERMITS WILL BE MAILED TO THE ESTABLISHMENT ADDRESS (A copy can be sent to the business owner at no charge if requested at
the time of application submittal. After submittal a processing fee will apply.)
BUILDING OWNER Name _____________________________________________________________________ Phone_________________________________
Address _________________________________________________ City/State ________________________ Zip __________________
TYPE OF OWNER Individual Partnership Corporation/LLC Unit of Local Govt.
ESTABLISHMENT CLASSIFICATION (see reverse) ________ TYPE OF PERMIT New Renewal
SQUARE FEET ______________ SEATING CAPACITY ____________ NUMBER OF EMPLOYEES_____________
SEASONAL (6 months or less) NONSEASONAL (more than 6 months)
BUSINESS HOURS _________________ to __________________ DAYS CLOSED ___________________________________________
NAME OF CERTIFIED FOOD HANDLER______________________________________________________________
POSITION ___________________________ ID# ________________________ EXP. DATE ______________________________
WATER SUPPLY (check one) Public Private Date Water Tested _____________________________
SEWAGE DISPOSAL (check one) Public Private
SEPTIC PUMPER ______________________________________________ Last Date Pumped ___________________________
GREASE TRAP DISPOSAL BY _____________________________________________ (company name)
GREASE BARREL DISPOSAL BY ______________________________________ (company name)
PEST CONTROL CO. _______________________________________________________________________________________________ (Name) (Complete Mailing Address) (Phone Number)
DATE _________________________ SIGNATURE _______________________________________________________
****************************************************************************************** DO NOT WRITE BELOW - FOR OFFICE USE ONLY
Establishment Number ________________________________________ Permit # ___________________________
Permit Fee $ __________________ Category __________________ Approved By _______________________
* THIS PERMIT IS NOT TRANSFERABLE TO ANOTHER PERSON OR LOCATION *
1240 N. Highland Ave., Suite 5, Aurora, IL 60506 Phone (630) 444-3040 Fax (630) 897-8123
1750 Grandstand Place, Elgin, IL 60123 Phone (630) 444-3040 Fax (847) 888-6458
www.kanehealth.com
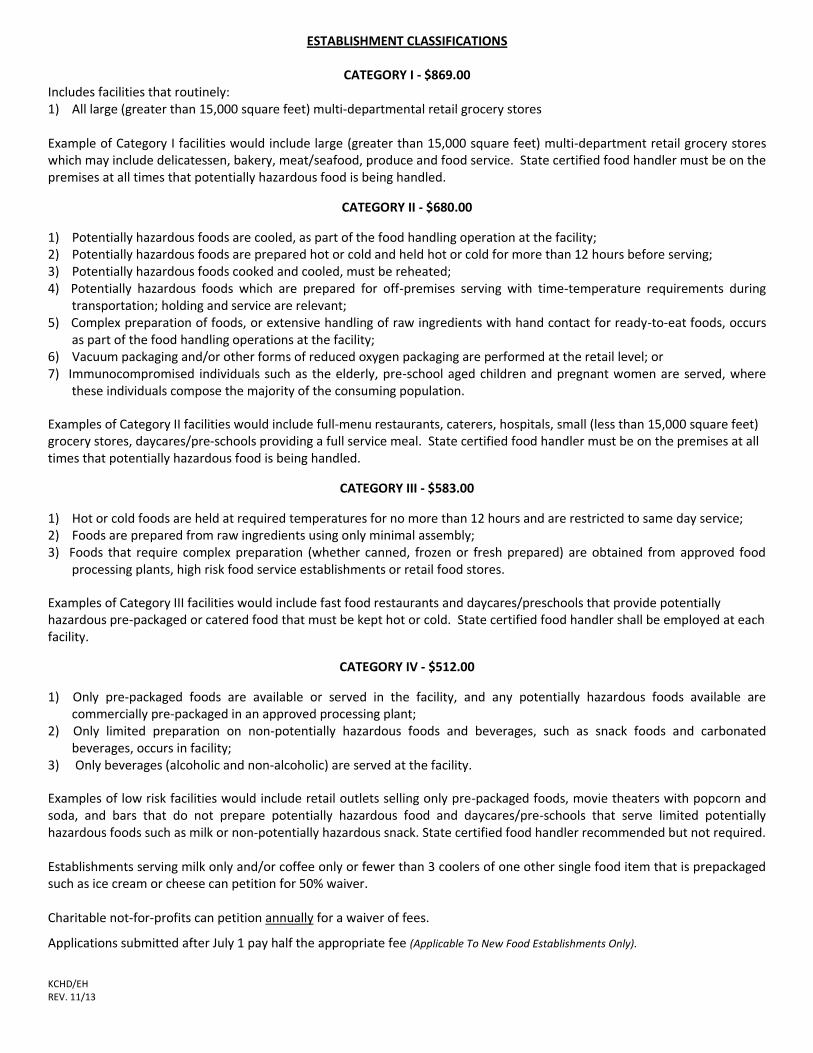
ESTABLISHMENT CLASSIFICATIONS
CATEGORY I - $869.00
Includes facilities that routinely: 1) All large (greater than 15,000 square feet) multi-departmental retail grocery stores Example of Category I facilities would include large (greater than 15,000 square feet) multi-department retail grocery stores which may include delicatessen, bakery, meat/seafood, produce and food service. State certified food handler must be on the premises at all times that potentially hazardous food is being handled.
CATEGORY II - $680.00
1) Potentially hazardous foods are cooled, as part of the food handling operation at the facility; 2) Potentially hazardous foods are prepared hot or cold and held hot or cold for more than 12 hours before serving; 3) Potentially hazardous foods cooked and cooled, must be reheated; 4) Potentially hazardous foods which are prepared for off-premises serving with time-temperature requirements during
transportation; holding and service are relevant; 5) Complex preparation of foods, or extensive handling of raw ingredients with hand contact for ready-to-eat foods, occurs
as part of the food handling operations at the facility; 6) Vacuum packaging and/or other forms of reduced oxygen packaging are performed at the retail level; or 7) Immunocompromised individuals such as the elderly, pre-school aged children and pregnant women are served, where
these individuals compose the majority of the consuming population.
Examples of Category II facilities would include full-menu restaurants, caterers, hospitals, small (less than 15,000 square feet) grocery stores, daycares/pre-schools providing a full service meal. State certified food handler must be on the premises at all times that potentially hazardous food is being handled.
CATEGORY III - $583.00
1) Hot or cold foods are held at required temperatures for no more than 12 hours and are restricted to same day service; 2) Foods are prepared from raw ingredients using only minimal assembly; 3) Foods that require complex preparation (whether canned, frozen or fresh prepared) are obtained from approved food
processing plants, high risk food service establishments or retail food stores.
Examples of Category III facilities would include fast food restaurants and daycares/preschools that provide potentially hazardous pre-packaged or catered food that must be kept hot or cold. State certified food handler shall be employed at each facility.
CATEGORY IV - $512.00
1) Only pre-packaged foods are available or served in the facility, and any potentially hazardous foods available are commercially pre-packaged in an approved processing plant;
2) Only limited preparation on non-potentially hazardous foods and beverages, such as snack foods and carbonated beverages, occurs in facility;
3) Only beverages (alcoholic and non-alcoholic) are served at the facility.
Examples of low risk facilities would include retail outlets selling only pre-packaged foods, movie theaters with popcorn and soda, and bars that do not prepare potentially hazardous food and daycares/pre-schools that serve limited potentially hazardous foods such as milk or non-potentially hazardous snack. State certified food handler recommended but not required. Establishments serving milk only and/or coffee only or fewer than 3 coolers of one other single food item that is prepackaged such as ice cream or cheese can petition for 50% waiver. Charitable not-for-profits can petition annually for a waiver of fees.
Applications submitted after July 1 pay half the appropriate fee (Applicable To New Food Establishments Only).
KCHD/EH REV. 11/13

Food And Beverage Tax – Frequently Asked Questions Q. Which types of businesses must collect and pay the Food and Beverage Tax? A. All businesses within the Village of West Dundee where prepared food (including drinks) is sold at retail for immediate consumption, with or without seating provided for consumption of said prepared food on the premises or not. Also included are businesses that carry food and drink items considered “high tax” as defined by the Illinois Department of Revenue. Q. On what sales must I collect and pay the Food and Beverage Tax? A. You must collect and pay the Food and Beverage Tax if you make retail sales of prepared food, alcoholic beverages, and other food and beverages that have been prepared for immediate consumption, whether on or off the premises. Examples of taxable sales include but are not limited to:
• All products served in restaurants.
• All alcoholic beverages purchased, whether for consumption on or off the premises.
• All other food and beverage items considered “high sales tax” items as defined by the Illinois Department of Revenue.
• Brewed coffee, fountain drinks, or other beverages prepared for immediate consumption on or off premises in a grocery store or convenience store.
Q. What transactions are exempt from the Food and Beverage Tax? A. Food and beverage items considered “low sales tax” items as defined by the Illinois Department of Revenue. Q. What is the tax rate? A. The Food and Beverage Tax rate is 1 percent (.01) of gross receipts. Q. Do I have to register my business as a place of eating subject to the tax? A. Yes. Every owner maintaining a place for eating must register no later than May 30, 2014 or the date of becoming such an owner, whichever is later. This is a one time registration that will remain effective unless there are changes of business, management, or location. If there is a change, please notify the Village within 30 days for proper maintenance of records. Q. How do I show this tax on my retail receipts? A. You may either separately state this tax, or state this tax in combination with other taxes on the receipts you give your customers. Q. What form must I use to report the Food and Beverage Tax?

A. To pay this tax, you must file monthly the Food and Beverage Tax Return. Instructions are included on the form. The form is available at www.wdundee.org under the Administrative & Finance tab. Q. How do I file if I have more than one site? A. If you make retail sales from more than one site you must file a separate Food and Beverage Tax return for each site. Q. Must I file the Food and Beverage Tax Return even if I have no sales to report? A. Yes. You must file a signed return form for each monthly reporting period regardless of whether or not there are receipts to report. You may file a “zero” return. Q. Where do I file my return? A. You should mail or deliver your return to: Village of West Dundee Attn: Food and Beverage Tax 102 South Second Street West Dundee, Illinois 60118 Q. When is my monthly Food and Beverage Tax Return and tax payment date? A. The returns and tax payments are due on or before the 20th day of the month for the preceding calendar month. For example, Food and Beverage Tax payments for the month of June would be due on July 20th. Q. What methods of payment can be used? A. Businesses may pay by check or via ACH through First American Bank. If ACH is used, a Food and Beverage Tax Return for the applicable period must still be turned into the Village. Q. Is there a discount for timely filing? A. Yes. If your Food and Beverage Tax return is filed and received by the 20th of the following month, your business will receive 2% off of the total tax due. Q. What if I do not file and pay by the due date? A. If you do not file your return and pay the tax due by the due date, you will be assessed for any tax due plus a penalty. The penalty is 2% of the tax unpaid per month. Please contact the Village of West Dundee at 847-551-3800 with any questions.

102 S. Second Street West Dundee, IL 60118
847-551-3800
FOOD AND BEVERAGE TAX REGISTRATION
1. Business Name: Phone:
Address: City: West Dundee
State, Zip:
2. Mailing Name: Phone:
Address: City: State, Zip:
3. Name of Owner or Manager: Phone:
Address: City: State, Zip:
4. Nature of Business:
5. Type of Business Organization: ____ Sole Proprietorship ____ Corporation ____ Partnership ____ Other (Specify: ________________)
6. Illinois Retailer Occupation Tax No.: ___________________________
7. Federal Taxpayer ID No. or Social Security No.: ________________________
8. Name & address of person preparing Food & Beverage Tax Return: Phone:
PLEASE RETURN THIS FORM TO VILLAGE HALL WITHIN 30 DAYS OF OPENING.
I declare that the statements contained herein are true and correct to the best of my knowledge.
Signature of Owner/Manager Date

1. $2. $3. $4. $5. (Line 2 x .02) x $6. $
Phone:
DUE ON THE 20TH DAY OF THE FOLLOWING MONTH
MONTH/YEAR OF COLLECTION:
City/State/ZIP:
FOOD AND BEVERAGE TAX REMITTANCE FORM
Payer Name:
Address:
Printed Name Title
E-Mail:
Business Name:
Local Business Address:
Illinois Business Tax (IBT) # :Phone:
City/State/ZIP:
Signature Date
COMPUTATION OF TAX LIABILITY
Net Tax Due (Line 2 minus Line 3)Late Pay Penalty months lateTotal Tax Due (Line 4 + Line 5)
Gross Food and Beverage Receipts1% Food and Beverage Tax (Line 1 x .01)Timely Filing Discount (Line 2 x .02)
Under penalties of perjury and other penalties provided by law, I declare that I have examined this return and to the best of my knowledge it is true, correct and complete. I further declare that the information set forth is taken from the books and records of the business for which this return is filed.
• Make check payable to the Village of West Dundee• Please do not staple check to tax return• Mail this completed and signed return, the check for the amount shown on line 6, and a copy of Illinois Department of
Revenue Form ST-1 to:Village of West Dundee
Attn. Food and Beverage Tax 102 S. Second Street
West Dundee, IL 60118
Questions? Call 847-551-3800

Local Motor Fuel Tax – Frequently Asked Questions
Q. Which types of businesses must collect and pay the Local Motor Fuel Tax?A. All businesses within the Village of West Dundee where motor fuel (both gasoline anddiesel) is sold at retail for purchase.
Q. What is the tax rate?A. The tax rate is two cents ($0.02) per gallon.
Q. When does the tax go into effect?A. June 1, 2014.
Q. What are the registration and remittance processes?A. Retailers must first complete a registration form that is to be turned into Village no later thanMay 30, 2014. This form can be found inside this packet. The form can also be found on theVillage website (www.wdundee.org) under the Administrative/Finance tab. The Remittanceform is also included in this packet, and can be found on the Village website as well
Q. When is my monthly Local Motor Fuel Tax Return and tax payment date?A. The returns and tax payments are due on or before the 20th day of the month for the precedingcalendar month. For example, Local Motor Fuel Tax payments for the month of June would bedue on July 20th.
Q. What methods of payment can be used?A. Businesses may pay by check or via ACH through First American Bank. If ACH is used, aLocal Motor Fuel Return for the applicable period must still be turned into the Village.
Q. Is there a discount for timely filing?A. Yes. If your Local Motor Fuel Tax return is filed and received by the 20th of the followingmonth, your business will receive 2% off of the total tax due.
Q. What if I do not file and pay by the due date?A. If you do not file your return and pay the tax due by the due date, you will be assessed forany tax due plus a penalty. The penalty is 2% of the tax unpaid per month.
Q. Where do I file my return?A. You should mail or deliver your return to:
Village of West Dundee Attn: Local Motor Fuel Tax 102 South Second Street West Dundee, Illinois 60118 Q. How do I file if I have more than one site? A. If you make retail sales from more than one site you must file a separate Local Motor Fuel Tax return for each site. Please contact the Village of West Dundee at 847-551-3800 with any questions.
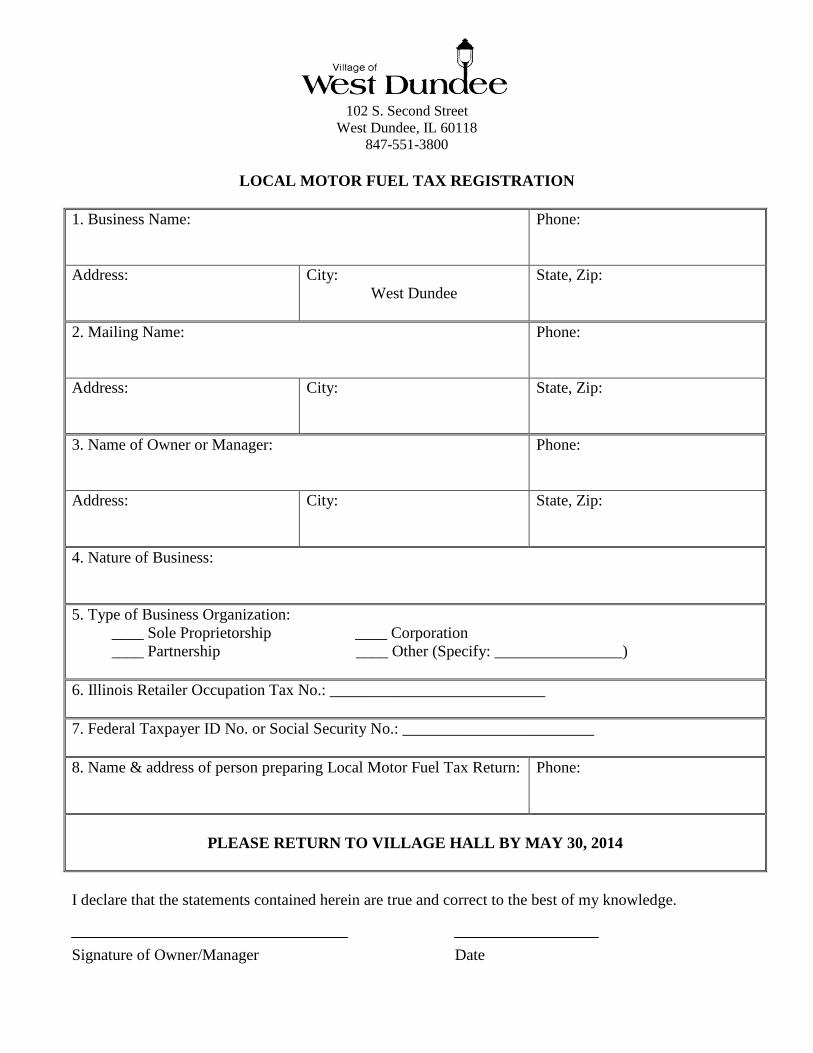
102 S. Second Street
West Dundee, IL 60118 847-551-3800
LOCAL MOTOR FUEL TAX REGISTRATION
1. Business Name:
Phone:
Address:
City: West Dundee
State, Zip:
2. Mailing Name:
Phone:
Address:
City: State, Zip:
3. Name of Owner or Manager:
Phone:
Address:
City: State, Zip:
4. Nature of Business: 5. Type of Business Organization: ____ Sole Proprietorship ____ Corporation ____ Partnership ____ Other (Specify: ________________) 6. Illinois Retailer Occupation Tax No.: ___________________________ 7. Federal Taxpayer ID No. or Social Security No.: ________________________ 8. Name & address of person preparing Local Motor Fuel Tax Return:
Phone:
PLEASE RETURN TO VILLAGE HALL BY MAY 30, 2014
I declare that the statements contained herein are true and correct to the best of my knowledge. Signature of Owner/Manager Date

Date Paid:
Amt. Paid:
Postmark:
For the Month Ending: Check #:
Business Name:
Mailing Name (dba):
Address Phone
City West Dundee State IL Zip 60118
Name of Preparer:
Address Phone
City State Zip
Computation of Tax Liability:
1. Total Gallons Sold During Liability Period (Gas + Diesel)
2. Tax Liability (Total Gallons from Line 1 x $0.02) $
3. Late Payment Penalty (line 2 multiplied by 2%) $
4. Total Amount Due (line 2 plus line 3) $
Return Original with Payment and copy of ST‐1 return to:Village of West Dundee
Attn: Local Motor Fuel Tax102 S. Second Street
West Dundee, IL 60118
Fax: 847‐551‐3809Phone: 847‐551‐3800
LOCAL MOTOR FUEL TAX REMITTANCE FORM
Title
Date
Signature
Printed Name
(Office use only)
(Forms available online at www.wdundee.org)
Remittance Instructions
Please remit the amount indicated on line 4 above. Checks should be made payable to the Village of West Dundee. This form and a copy of the Illinois Department of Revenue Form ST‐1 (state sales tax return) for the corresponding period must accompany your remittance.
Your remittance must be received by the Village at the address shown below by the 20th of the month following the month when thetaxes are collected. If the 20th of the month falls on a Sunday or holiday when the Village Hall is closed, payment must be received by the next business day. However, a payment sent by mail must be postmarked no later than the 20th of the month. If the 20th of the month falls on a Sunday or national holiday when the U.S. Postal Service is closed, the remittance must be postmarked by the next business day.
Affirmation
Under penalties provided by ordinance, I hereby affirm that the statements contained herein are taken from the books and records of the above business and are true and correct to the best of my knowledge.

Community Development &
Fire Department 100 Carrington Dr., West Dundee, IL 60118
847-551-3805 FAX 847-551-3814
HOME BASED BUSINESS
REGISTRATION & LICENSE APPLICATION
I, (We), the undersigned, hereby make application for a Business Registration & Business License under
the ordinances of the Village of West Dundee for conducting a business. Any omissions or misstatements
of facts herein may cause forfeiture for granting of the Business Registration and/or Business License.
Section A: Local Business
Name of Business
Doing Business As
Local Address West Dundee, Illinois 60118
Describe Business
Business Phone Business Fax
Email Address Website
Illinois Retail
Sales Tax # (where applicable)
Name as it appears
on Illinois Retail
Sales Tax List
Section B: Owner / Corporation
Full Name
Address
City, State Zip +4
Phone email address
Section C: Fees
Registration Fee: $35.00 $ N / A
Tobacco License Fee: $35.00 (If selling tobacco products or paraphernalia) $
Food Dealer License Fee: $35.00 (If selling prepared or prepackaged food) $
Total Fees Enclosed $
Comments:
SIGNATURE OF OWNER IS REQUIRED PRINT NAME AND TITLE
FOR OFFICE USE ONLY
HOLD/RELEASE
Batch #
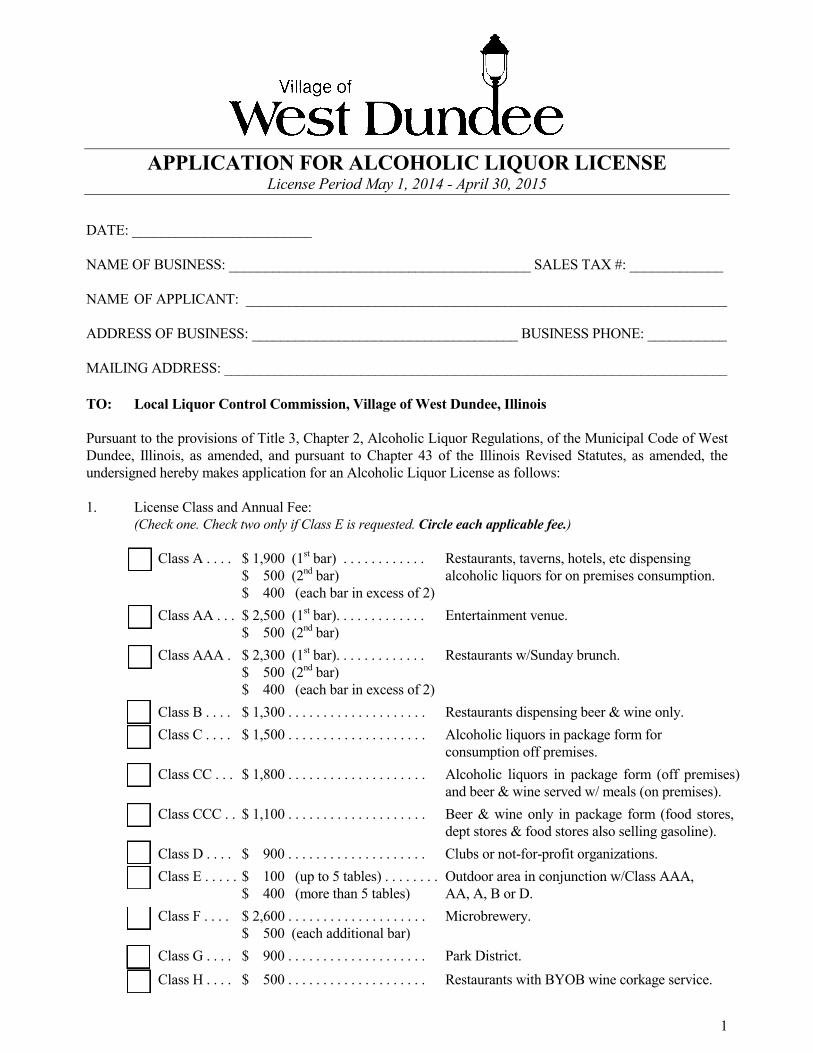
1
APPLICATION FOR ALCOHOLIC LIQUOR LICENSE License Period May 1, 2014 - April 30, 2015
DATE: _________________________ NAME OF BUSINESS: __________________________________________ SALES TAX #: _____________ NAME OF APPLICANT: ___________________________________________________________________ ADDRESS OF BUSINESS: _____________________________________ BUSINESS PHONE: ___________ MAILING ADDRESS: ______________________________________________________________________ TO: Local Liquor Control Commission, Village of West Dundee, Illinois Pursuant to the provisions of Title 3, Chapter 2, Alcoholic Liquor Regulations, of the Municipal Code of West Dundee, Illinois, as amended, and pursuant to Chapter 43 of the Illinois Revised Statutes, as amended, the undersigned hereby makes application for an Alcoholic Liquor License as follows: 1. License Class and Annual Fee: (Check one. Check two only if Class E is requested. Circle each applicable fee.)
Class A . . . . $ 1,900 (1st bar) . . . . . . . . . . . . Restaurants, taverns, hotels, etc dispensing $ 500 (2nd bar) alcoholic liquors for on premises consumption.
$ 400 (each bar in excess of 2) Class AA . . . $ 2,500 (1st bar). . . . . . . . . . . . . Entertainment venue. $ 500 (2nd bar) Class AAA . $ 2,300 (1st bar). . . . . . . . . . . . . Restaurants w/Sunday brunch. $ 500 (2nd bar)
$ 400 (each bar in excess of 2) Class B . . . . $ 1,300 . . . . . . . . . . . . . . . . . . . . Restaurants dispensing beer & wine only. Class C . . . . $ 1,500 . . . . . . . . . . . . . . . . . . . . Alcoholic liquors in package form for
consumption off premises. Class CC . . . $ 1,800 . . . . . . . . . . . . . . . . . . . . Alcoholic liquors in package form (off premises)
and beer & wine served w/ meals (on premises). Class CCC . . $ 1,100 . . . . . . . . . . . . . . . . . . . . Beer & wine only in package form (food stores,
dept stores & food stores also selling gasoline). Class D . . . . $ 900 . . . . . . . . . . . . . . . . . . . . Clubs or not-for-profit organizations. Class E . . . . . $ 100 (up to 5 tables) . . . . . . . . Outdoor area in conjunction w/Class AAA,
$ 400 (more than 5 tables) AA, A, B or D. Class F . . . . $ 2,600 . . . . . . . . . . . . . . . . . . . . Microbrewery. $ 500 (each additional bar) Class G . . . . $ 900 . . . . . . . . . . . . . . . . . . . . Park District.
Class H . . . . $ 500 . . . . . . . . . . . . . . . . . . . . Restaurants with BYOB wine corkage service.
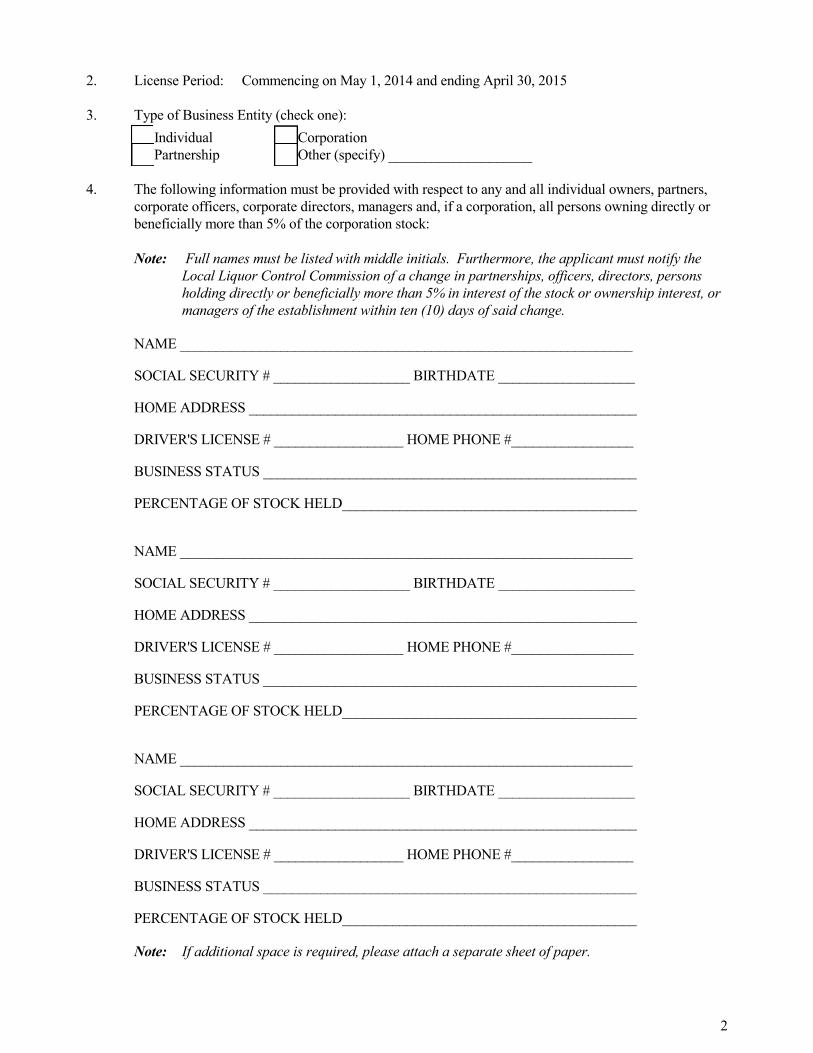
2
2. License Period: Commencing on May 1, 2014 and ending April 30, 2015 3. Type of Business Entity (check one): [ ] Individual [ ] Corporation [ ] Partnership [ ] Other (specify) ____________________ 4. The following information must be provided with respect to any and all individual owners, partners,
corporate officers, corporate directors, managers and, if a corporation, all persons owning directly or beneficially more than 5% of the corporation stock:
Note: Full names must be listed with middle initials. Furthermore, the applicant must notify the
Local Liquor Control Commission of a change in partnerships, officers, directors, persons holding directly or beneficially more than 5% in interest of the stock or ownership interest, or managers of the establishment within ten (10) days of said change.
NAME _______________________________________________________________ SOCIAL SECURITY # ___________________ BIRTHDATE ___________________ HOME ADDRESS ______________________________________________________ DRIVER'S LICENSE # __________________ HOME PHONE #_________________ BUSINESS STATUS ____________________________________________________ PERCENTAGE OF STOCK HELD_________________________________________
NAME _______________________________________________________________ SOCIAL SECURITY # ___________________ BIRTHDATE ___________________ HOME ADDRESS ______________________________________________________ DRIVER'S LICENSE # __________________ HOME PHONE #_________________ BUSINESS STATUS ____________________________________________________ PERCENTAGE OF STOCK HELD_________________________________________ NAME _______________________________________________________________ SOCIAL SECURITY # ___________________ BIRTHDATE ___________________ HOME ADDRESS ______________________________________________________ DRIVER'S LICENSE # __________________ HOME PHONE #_________________ BUSINESS STATUS ____________________________________________________ PERCENTAGE OF STOCK HELD_________________________________________ Note: If additional space is required, please attach a separate sheet of paper.

3
5. Is applicant a citizen of the United States? __________________________ If naturalized, state, date and place of naturalization. ____________________________________
________________________________________________ If an Illinois Corporation, date of incorporation. ________________________________________ If a foreign corporation, state of incorporation and date qualified to transact business in Illinois
pursuant to the Illinois Business Corporation Act. _______________________________________________________________________________ 6. State the character of the applicant's business, and in case of a corporation, the objects for which it was
formed.
________________________________________________ ________________________________________________ 7. State the location and physical description of the premises which is to be operated under such license.
________________________________________________ ________________________________________________ 8. State whether the applicant has ever had a liquor license issued by the Federal government, any State
government or any municipality. __________ If answer is in the affirmative, state the name of the licensing unit of government, when and where said
license was issued.
________________________________________________ ________________________________________________ 9. Has the applicant ever had any previous liquor license revoked? ________ If answer is in the affirmative, state the date and reason for such revocation.
________________________________________________ ________________________________________________ 10. Have the applicant and the designated managers read and do they understand and agree not to violate
any of the liquor laws of the United States, the State of Illinois or any of the ordinances of the Village of West Dundee in conducting business?
______________________________________ 11. State whether all individual owners, and/or partners, have been fingerprinted by the West Dundee
Police Department and, if so, the date thereof. For corporate applicants only, whose manager of the licensed premises is not a resident of the Village, state the name and address of the designated agent of the corporation.
_______________________________________________________________________________
________________________________________________

4
12. State the name and address of the person who will generally be managing the ongoing affairs of this business at these premises.
________________________________________________ ________________________________________________ State whether said manager has been fingerprinted by the West Dundee Police Department and, if so,
the date thereof. _________________________________________ Note: This application will remain incomplete and will not be considered until Question #12 can be
answered in the affirmative. 13. Has the applicant attached proof of Dram Shop Insurance to this application or already furnished it to
the Village? _____________________________________________ 14. If the applicant does not own the premises for which the license is sought, does the applicant have a
lease for the full period for which the license is to be issued? _________ Note: If the answer is in the affirmative, attach a copy of said lease to the application. 15. Has the applicant has ever been convicted of a felony offense under any Federal or State law?
_____________________________________________________________________________ 16. State whether the applicant has ever been convicted of a violation of any Federal or State law
concerning the manufacture, possession or sale of alcoholic liquor.
_______________________________________________ 17. State whether a Federal Gaming Device Stamp or Federal Wagering Stamp has been issued to the
applicant, the premises, or to any corporation in which the applicant holds 5% or more stock.
_______________________________________________ If the answer is in the affirmative, has the stamp been issued for any portion or all of the time to be
covered by this application? ___________________________________ 18. Are the premises within 200 feet of any real property of any church, school, hospital, home for the
aged or indigent persons or for veterans, their wives or children, or any military or naval station?
_______________________________________________ 19. Are the premises for which license is herein applied for a store or other place of business where the
majority of customers are minors of school age or where the principal business transacted consists of school books, school supplies, food, lunches or drinks for such minors? ___________________
20. Does the applicant understand and agree that during the license period, any violation of Federal, State
or Village laws and ordinances will be referred to the Local Liquor Control Commission and that such violation may result in the suspension or revocation of said license? _________________
21. Does the applicant understand and agree that members of the Local Liquor Control Commission and/or
West Dundee Police Department shall have the authority to enter at any time upon the premises licensed hereunder to determine whether any State or Village laws and ordinances have been or are being violated, and at such time to examine the premises of said licensee in connection therewith?
_____________________

5
22. Does the applicant understand and agree that a license shall be purely a personal privilege, and shall
not constitute property, nor shall it be subject to attachment, garnishment or execution, nor shall it be alienable or transferable, voluntarily or involuntarily, or subject to being encumbered or hypothecated?
___________________________________________ SIGNATURE OF APPLICANT(S) CORPORATION SIGNATURES INDIVIDUAL OR PARTNERSHIP SIGNATURES _________________________ __________________________________________ President __________________________________________ _________________________ Secretary __________________________________________ The following signature must be witnessed by an Illinois Notary Public. STATE OF ILLINOIS ) ) SS COUNTY OF KANE ) The undersigned swears that all statements are true and correct. __________________________________________ Applicant signature Subscribed and Sworn To Before Me this ____ day of ______________, 20__ ________________________________ Notary Public

6
CHECKLIST
A complete application for alcoholic liquor license must contain the following. Please confirm that all required documentation is provided. All questions on the application completed in full. Application signed.
Signature of applicant on page 5 of application swearing all statements are true and correct,
witnessed and notarized by an Illinois Notary Public. (Do not sign in advance, a notarized signature must be signed in the presence of the Notary.)
Certificate of Dram Shop Insurance evidencing $1,000,000 of coverage.
$5,000 Surety Bond (License & Permit Bond).
Applicable lease or ownership information for location. If application is for a renewal liquor
license, this need be submitted only if it is not already on file or has been renewed or amended since last year.
A copy of your current State Liquor License.
A current copy of your State Liquor License must remain on file with the Village so long as your Local Liquor is in effect. Should your State license expire during this timeframe, a copy of the renewed State license must be submitted.
If this is a new application or ownership changes, please include fingerprints for each person
holding more than five percent (5%) interest in the establishment or, in the case of a corporation, the general manager of the establishment.
Fingerprints are to be taken at the West Dundee Police Department. Any person required to submit fingerprints who does not live in the area should call the West Dundee Police Department at 847-551-3810 so that a fingerprint card can be mailed to them. They should bring that card to their local police department for fingerprinting and then mail it back to the West Dundee Police Department.
A list of all employees subject to the required Basset Training.
The Village of West Dundee requires Basset Certification for all employees. New Employees must complete this training with 90 days of hire. Basset training completed in person certifies the employee for life. Basset certification class taken on line is valid for three (3) years.

PLEASE PRINT OR TYPE Date of Application:
APPLICANT SECTION:
Name
(including nicknames or aliases):
Mailing Address:
Residence Address:
Home Phone: Cell Phone:
Fax Number: Email Address:
Have you ever changed your name through marriage or through action of a court, or have you ever
been known by any other name? YES � NO � If yes, list name(s) & date(s) of name changes(s)
Name: Date:
Name: Date:
Social Security Number: Date of Birth:
If the applicant is a corporation, list name of the registered agent as well as the name(s) and
address(es) of each officer, director, stockholder (holding more than 20% of the stock of such
corporation), partner, and financially interested person(s). Attach additional sheet if necessary:
If applicant is a partnership, list the name(s) and address(es) of all general or managing partners
and any limited partners owning more than 20% of the aggregate limited partnership interest in
such partnership. Attach additional sheet if necessary:
Applicant’s business, occupation or employment for the three (3) years immediately preceding date
of this application:
COMMUNITY DEVELOPMENT & FIRE DEPARTMENT 100 Carrington Drive, West Dundee, IL 60118
PH 847-551-3805 FAX 847-551-3814
MASSAGE THERAPY CLINIC LICENSE APPLICATION
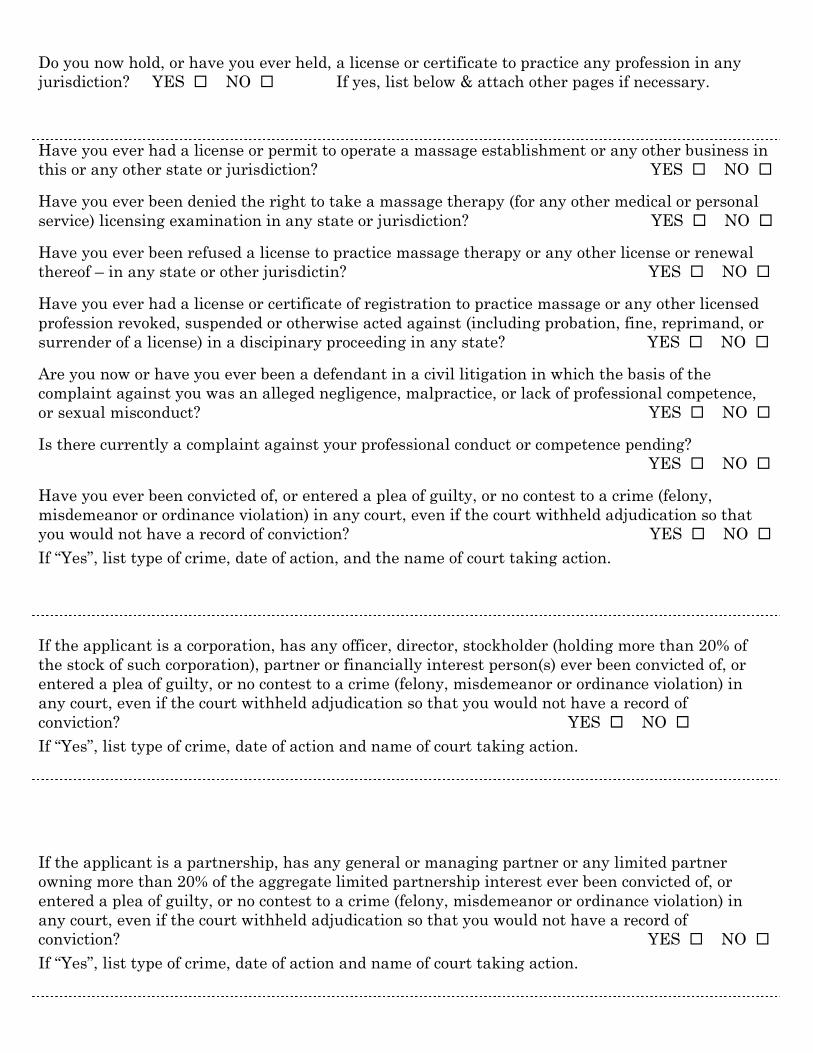
Do you now hold, or have you ever held, a license or certificate to practice any profession in any
jurisdiction? YES � NO � If yes, list below & attach other pages if necessary.
Have you ever had a license or permit to operate a massage establishment or any other business in
this or any other state or jurisdiction? YES � NO �
Have you ever been denied the right to take a massage therapy (for any other medical or personal
service) licensing examination in any state or jurisdiction? YES � NO �
Have you ever been refused a license to practice massage therapy or any other license or renewal
thereof – in any state or other jurisdictin? YES � NO �
Have you ever had a license or certificate of registration to practice massage or any other licensed
profession revoked, suspended or otherwise acted against (including probation, fine, reprimand, or
surrender of a license) in a discipinary proceeding in any state? YES � NO �
Are you now or have you ever been a defendant in a civil litigation in which the basis of the
complaint against you was an alleged negligence, malpractice, or lack of professional competence,
or sexual misconduct? YES � NO �
Is there currently a complaint against your professional conduct or competence pending?
YES � NO �
Have you ever been convicted of, or entered a plea of guilty, or no contest to a crime (felony,
misdemeanor or ordinance violation) in any court, even if the court withheld adjudication so that
you would not have a record of conviction? YES � NO �
If “Yes”, list type of crime, date of action, and the name of court taking action.
If the applicant is a corporation, has any officer, director, stockholder (holding more than 20% of
the stock of such corporation), partner or financially interest person(s) ever been convicted of, or
entered a plea of guilty, or no contest to a crime (felony, misdemeanor or ordinance violation) in
any court, even if the court withheld adjudication so that you would not have a record of
conviction? YES � NO �
If “Yes”, list type of crime, date of action and name of court taking action.
If the applicant is a partnership, has any general or managing partner or any limited partner
owning more than 20% of the aggregate limited partnership interest ever been convicted of, or
entered a plea of guilty, or no contest to a crime (felony, misdemeanor or ordinance violation) in
any court, even if the court withheld adjudication so that you would not have a record of
conviction? YES � NO �
If “Yes”, list type of crime, date of action and name of court taking action.
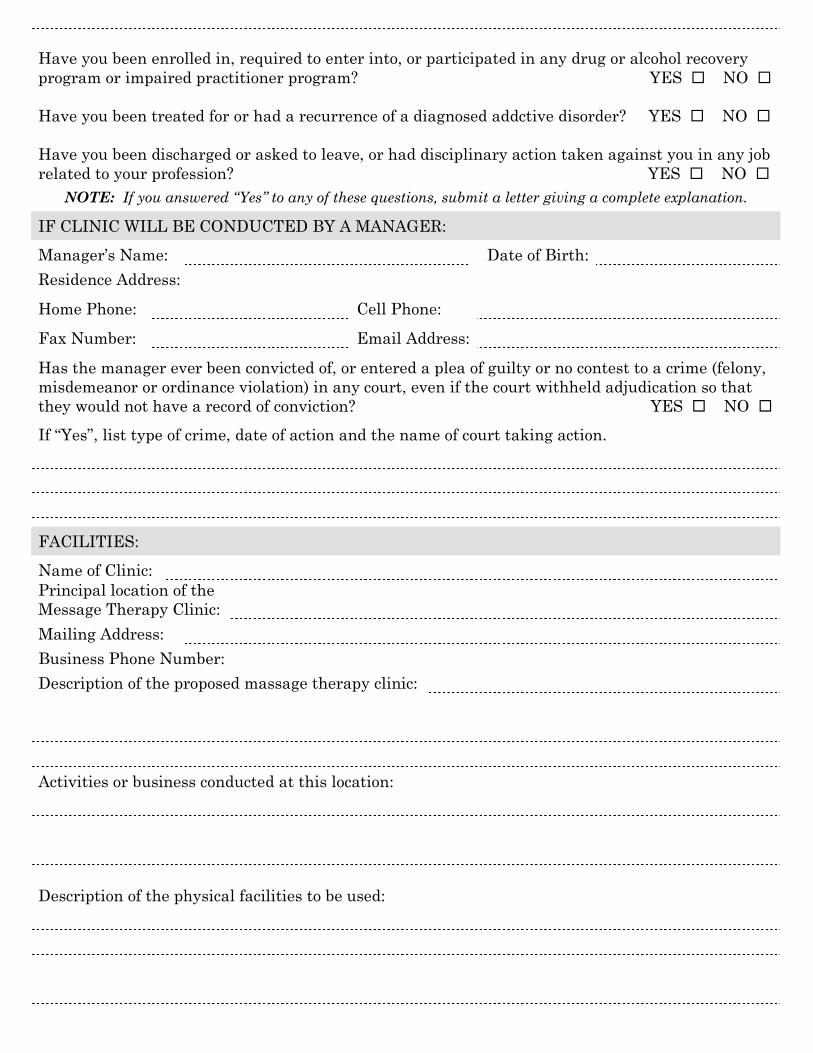
Have you been enrolled in, required to enter into, or participated in any drug or alcohol recovery
program or impaired practitioner program? YES � NO �
Have you been treated for or had a recurrence of a diagnosed addctive disorder? YES � NO �
Have you been discharged or asked to leave, or had disciplinary action taken against you in any job
related to your profession? YES � NO �
NOTE: If you answered “Yes” to any of these questions, submit a letter giving a complete explanation.
IF CLINIC WILL BE CONDUCTED BY A MANAGER:
Manager’s Name: Date of Birth:
Residence Address:
Home Phone: Cell Phone:
Fax Number: Email Address:
Has the manager ever been convicted of, or entered a plea of guilty or no contest to a crime (felony,
misdemeanor or ordinance violation) in any court, even if the court withheld adjudication so that
they would not have a record of conviction? YES � NO �
If “Yes”, list type of crime, date of action and the name of court taking action.
FACILITIES:
Name of Clinic:
Principal location of the
Message Therapy Clinic:
Mailing Address:
Business Phone Number:
Description of the proposed massage therapy clinic:
Activities or business conducted at this location:
Description of the physical facilities to be used:
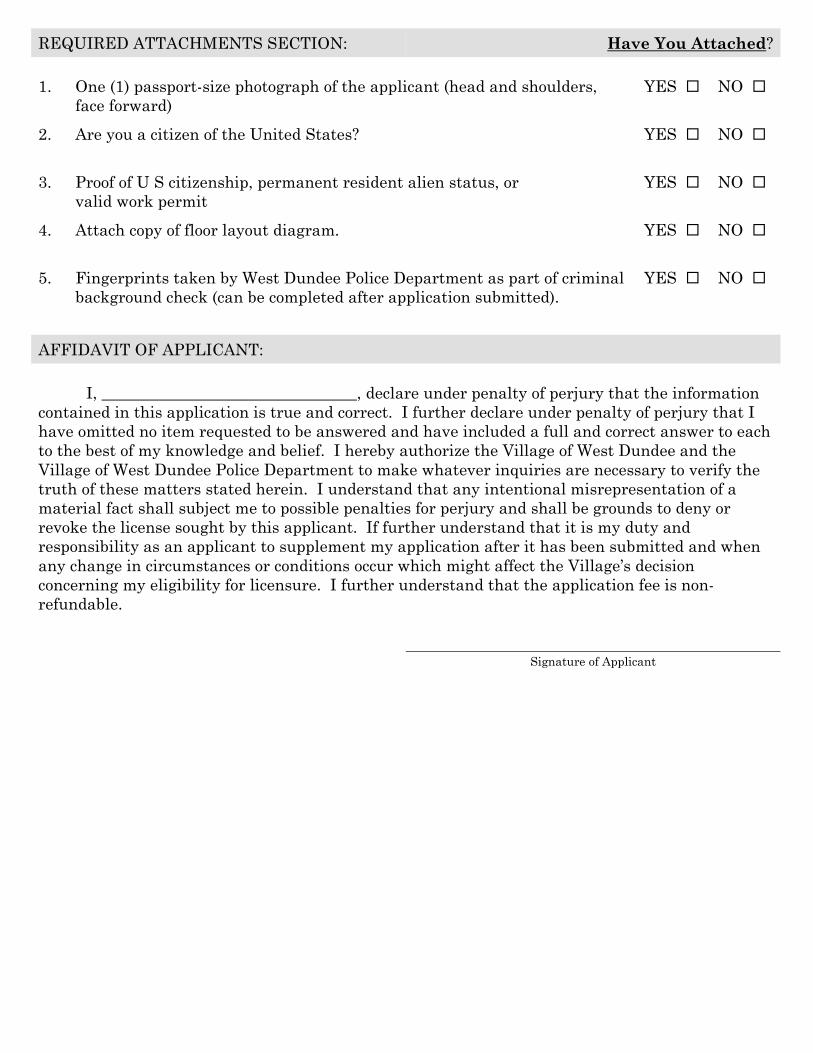
REQUIRED ATTACHMENTS SECTION: Have You Attached?
1. One (1) passport-size photograph of the applicant (head and shoulders,
face forward)
YES � NO �
2. Are you a citizen of the United States? YES � NO �
3. Proof of U S citizenship, permanent resident alien status, or
valid work permit
YES � NO �
4. Attach copy of floor layout diagram. YES � NO �
5. Fingerprints taken by West Dundee Police Department as part of criminal
background check (can be completed after application submitted).
YES � NO �
AFFIDAVIT OF APPLICANT:
I, ________________________________, declare under penalty of perjury that the information
contained in this application is true and correct. I further declare under penalty of perjury that I
have omitted no item requested to be answered and have included a full and correct answer to each
to the best of my knowledge and belief. I hereby authorize the Village of West Dundee and the
Village of West Dundee Police Department to make whatever inquiries are necessary to verify the
truth of these matters stated herein. I understand that any intentional misrepresentation of a
material fact shall subject me to possible penalties for perjury and shall be grounds to deny or
revoke the license sought by this applicant. If further understand that it is my duty and
responsibility as an applicant to supplement my application after it has been submitted and when
any change in circumstances or conditions occur which might affect the Village’s decision
concerning my eligibility for licensure. I further understand that the application fee is non-
refundable.
Signature of Applicant

PLEASE PRINT OR TYPE Date of Application:
SECTION A: Establishment Where Video Gaming Terminal Will be Located Establishment Name: Address: Owner Name: Age: Owner Address: City, State: Zip: Home Phone: Cell Phone: Fax Number: Email Address: SECTION B: Video Gaming Terminal Information Owner Name: Age: Owner Address: City, State: Zip: Home Phone: Cell Phone: Fax Number: Email Address: SECTION C: Attachments Copy attached of video gaming license issued by the Illinois Gaming Board to the owners of: the video gaming terminal YES NO and the local establishment YES NO
Description of video gaming terminal to be operated under the above license: Drawing attached indicating the location of the video gaming terminal as it is to be located in the local establishment. YES NO Has the owner of the establishment or the owner of the video gaming terminal ever been convicted of, or entered a plea of guilty, no contest to , or nolo contendere to a crime (felony, misdemeanor or licensing ordinance) in any court, even if the court withheld adjudication so that you would not have a record of conviction? YES NO If “Yes”, attach list with type of crime, date of action, and the name of court taking action. Section D: Fees FEE Video Gaming Establishment License Fee $ 1,000.00 Mechanical/Electronic Gambling Device License Fee $250.00 Per Device
$ Number of Devices X $250.00 Per Device =
Total Fees Enclosed $ Signature of Applicant
FOR OFFICE USE ONLY
FEES PAID
LICENSE GAMBLING DEVICES CHECK # BATCH #
Village Hall - Administration Department 102 S. Second Street, West Dundee, IL 60118
Phone: 847-551-3800 Fax: 847-551-3809
VIDEO GAMING LICENSE APPLICATION