new developments around sheet and tip vortex cavitation...
TRANSCRIPT

NEW DEVELOPMENTS AROUND SHEET AND TIP VORTEX CAVITATION ON SHIPS'PROPELLERS
G.KuiperMarin, The Netherlands.
A concept of tip vortex cavitation on propellers is described qualitatively, leading to the distinction oftrailing vortices, local tip vortices and leading edge vortices. Improvements of the inception behaviourusing this distinction are presented. Observations on developed tip vortex cavitation are given to showthat the concept of vortex bursting seems inadequate. The problem of "broadband" vibrations due to acavitating tip vortex is illustrated. Arguments are given for the fact that a three dimensional approachis necessary to describe shedding of cloud cavitation at the trailing edge of a sheet cavity.
1. Introduction.
New developments are possible when the concepts which are used to describe the phenomena arechanging. An example of a changing concept in the field of cavitation inception was the inclusion ofviscous effects in the description of cavitation inception. Before that inclusion, cavitation inceptionhad beeen considered from the viewpoint of bubble dynamics only. Although bubble dynamics andboundary layer effects are not yet fully integrated, investigations on cavitation inception have had thesame basic background in the last decades.
The problem of inception of tip vortex cavitation is classical and very difficult. It is still important fornavy propellers, but progress in this field has been very limited and only some simple empirical scalingrelations and a basic two-dimensional modeling is available. CFD can potentially bring the predictionof tip vortex cavitation on a new level, but this is still under development and only for the non-cavitating case. In this field new physical concepts are being developed and in this paper some resultsare presented.
The behaviour and collapse of a developed tip vortex is increasingly a subject of concern in practice.Here the question is which parameters are important for e.g. rudder erosion and for pressurefluctuations on the hull. One such a parameter is the occurrence of vortex bursting. Good observations,both at model and at full scale, can help to develop an understanding of the phenomena and lead toadequate modeling of the problem. In this paper observations are presented and discussed.
Finally there is the problem of erosion on propellers due to cavitation. Erosion is the final stage ofinception, development and collapse of cavitation. Bubble cavitation is generally avoided on shippropellers, so the problem of erosion is most apparent on sheet cavitation. This occurs always in highlydynamic conditions, where shedding of clouds of cavitation occurs at the trailing edge of the sheetcavity. To connect the calculations with impact calculations of a bubble cloud it is necessary toestimate a length scale of these structures. This has not yet been possible, due to the complicatedstructure of the clouds. The problem is often investigated in a two-dimensional way, e.g. in CFDcalculations. In this paper it is argued that this simplification makes that the most important parameterof cloud shedding may be lost.
2. The model of a tip vortex.
Inception of vortex cavitation is still one of the most complex phenomena on a ship propeller. Bothnuclei content, probably the total gas content, the strength of the vortex, the size of the viscous core andthe vorticity distribution outside the viscous core determine the inception conditions. In this list thevortex is thought of as a predominantly transverse velocity field, so that a two dimensional descriptioncan be used. Without cavitation inception the model as described by Rule and Bliss (1992), as shown inFig. 1, is representative for this approach.
CAV2001:lecture.007

Fig. 1. Vortex model as used by Rule and Bliss(1998)
This model can be summarized as follows. The change in bound circulation on the wing generatestrailing vorticity. This vorticity rolls up from the tip. Conservation of circulation and of the first andsecond moment of vorticity provides enough information to determine the span location and the radiusof the trailing vortex at every axial position. Conservation of axial flux of angular momentum leads tothe determination of the axial induced velocity. The roll-up process can be considered as taking placeon a series of nested, contracting circular tubes. Rule and Bliss show that the axial velocity leads to astronger singularity in the invicid vortex core than the classical fully two-dimensional approach. Thesingularity in the core is eliminated by the viscous core, which is taken as a solid body rotation up to acertain radius and connected to the outer flow using a logarithmic velocity distribution. Such alogarithmic velocity distribution is a solution of the fully 2 dimensional Navier-Stokes equations.It is important to note that Rule and Bliss show with this model that rollup is a three-dimensionalprocess and that an axial velocity is required, which in turn has a significant effect on the roll-upprocess. The importance of the axial velocity or pressure distribution was already stressed by Batchelor(1964)
3. Determination of tip vortex inception.
Still a cavitating tip vortex is generally modeled as a predominantly two dimensional flow. Anexample of such a nicely cavitating tip vortex as shown in Fig. 2.
Fig. 2. Cavitating tip vortex

Cavitation occurs in the center of the vortex. This makes it possible to locate the vortex core, but it alsoshows that cavitation removes the viscous core. Arndt and Keller (1992) have made some exerciseswith a simple two-dimensional Rankine vortex with a solid cavitating core, showing that twosimultaneous solutions are possible, a cavitating and a non cavitating one, for the same vortex strengthand angular momentum. Are we looking for something which is undefined when we look for theinception conditions of a vortex? In practice inception occurs in a flashing way. The temporal variationof visual inception of cavitation is generally averaged over time, so that inception is called when e.g.cavitation is visible during 50% of the time. This is very difficult to determine and the percentage isoften a very rough estimate. An alternative and better way is to call inception when you see it at leastonce per unit time. When the time is chosen as e.g. 10 seconds it means that after observation of acavity it is checked if within 10 seconds the cavity re-appears. If not inception is not yet called.
The observation of Fig.3 shows some discrepancies with the model as described above. The roll-upprocess predicts an increase in the vortex strength with increasing distance to the tip. In the invicid twodimensional model this would increase the diameter of the cavitating core. It does not, on the contrary,the diameter has the tendency to slowly decrease (Kuiper, 1981). This illustrates that the cavitydiameter is not directly related with the total vortex strength of the tip vortex. Some efforts have beenmade to redefine the inception conditions from the diameter of the cavitating core as a function of thepressure or cavitation index (vanTerwisga et al, 1999). An example is given in Fig.3, in which ac is thecavitating core radius of the tip vortex and σ is the cavitation index. From two-dimensional modelssuch as described above the relation between the core radius and the pressure can be expressed as apower law. When the power is known, measurements of the core radius versus the pressure can replaceinception measurements at very small core radii, where the inception condition may be undefined orvery difficult to determine because it depends on Reynolds number and nuclei distribution. It has beenfound that the cavitating condition is not dependent on those parameters (vanRijsbergen and Kuiper,1997). The definition of a minimum diameter is sufficient to define the inception condition in Fig. 3 ina repeatable and unique way, independent of the scale!
Fig. 3 Cavitating core diameter of a vortex versus pressure coefficient.
The next problem arises when this approach is followed: the determination of the diameter of thecavitating core. In the case of a strong tip vortex in steady conditions the core may be a smooth tube.But this tube is very sensitive to variations in pressure along the core. When e.g. in a cavitation tunnel a"smooth" cavitating vortex core is generated, the actual shape of the cavity is strongly different from atube with constant diameter. A typical observation is given in Fig. 4. from a high speed video(vanRijsbergen and Kuiper, 1997).

Fig. 4 Cavitating tip vortex.
So it requires a statistical analysis of many pictures to determine the average diameter of the cavitatingcore of the tip vortex. The disturbances of the cavitating core are probably caused by pressuredisturbances in the tunnel. In a non-uniform inflow velocity, such as occur with propellers in a wake,this effect is strongly amplified. This, in combination with the fact that the slope of the curve in Fig. 3becomes very small when the radius is small makes that this approach for the determination of theinception conditions is not an easy way out. For strong tip vortices, such as behind an elliptic wing, thisapproach may however be more accurate and repeatable than simple visual observation of inception.Moreover, when it is true that the cavitating vortex is independent of the Reynolds number, thisapproach is an alternative for the usual scaling of tip vortex inception by the so called McCormick rule:
( ) 35.0
modmod el
ship
el
ship
RnRn=σ
σ
in which the exponent of 0.35 is more or less based on experience.
However, the problem of tip vortex inception on Navy propellers is not a problem of a strong tipvortex, as in Fig. 2. The loading of the tip of a Navy propeller in the design condition is close to zero!Cavitation inception occurs when the tip is slightly loaded and unloaded during the revolution of theblade in a wake. This is expressed in the well know inception diagram, in which the pressure is plottedagainst the propeller loading (Fig. 5).
Fig. 5 Inception diagram of the tip vortex of a propeller.
This diagram gives the relation between the inception pressure of the tip vortex on the vertical axis andthe propeller loading at the horizontal axis. Because of the shape of the inception curves this diagram iscalled an inception "bucket". A strong suction side tip vortex occurs in the upper right side if thecurve. In this condition the roll-up mechanism is dominant and the description as given above mayhave some relevance. A strong pressure side vortex will occur in the upper left part of the curve. It isgenerally assumed that the roll-up model is also applicable in that case.
The operating conditions of the propeller are also indicated in Fig. 5. The intention is that this curvepasses through the lowest point of the cavitation bucket. Precisely in this most important region theinception measurements are often very scattered and the inception points at higher pressures(and thushigher positive or negative loading) are used to determine the inception lines by regression. However,the mechanisms involved in inception conditions in the lower part of the bucket, with a very low tiploading, may be different from those at heavier loading. One of the typical differences is e.g. thatinception takes place on the tip itself and not in the trailing vortex. Then roll-up of trailing vorticescannot yet be important and other mechanisms have to play a rôle.
4. Types of tip vortices.
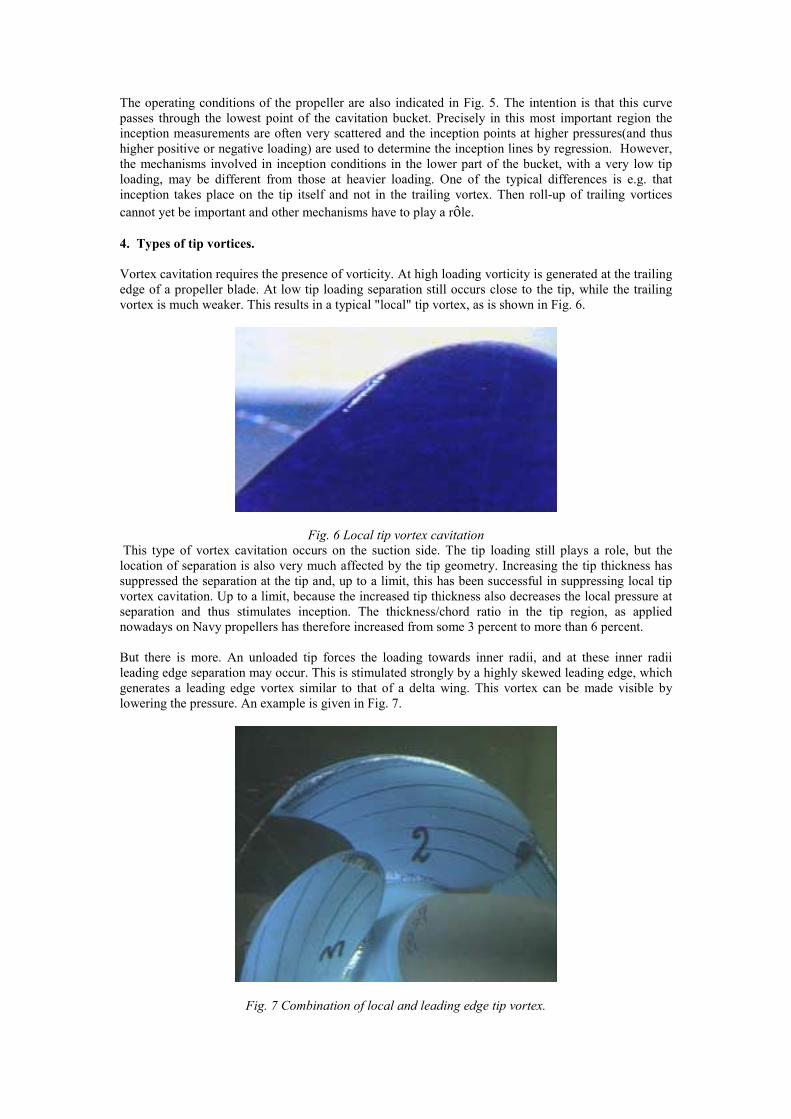
Vortex cavitation requires the presence of vorticity. At high loading vorticity is generated at the trailingedge of a propeller blade. At low tip loading separation still occurs close to the tip, while the trailingvortex is much weaker. This results in a typical "local" tip vortex, as is shown in Fig. 6.
Fig. 6 Local tip vortex cavitation This type of vortex cavitation occurs on the suction side. The tip loading still plays a role, but thelocation of separation is also very much affected by the tip geometry. Increasing the tip thickness hassuppressed the separation at the tip and, up to a limit, this has been successful in suppressing local tipvortex cavitation. Up to a limit, because the increased tip thickness also decreases the local pressure atseparation and thus stimulates inception. The thickness/chord ratio in the tip region, as appliednowadays on Navy propellers has therefore increased from some 3 percent to more than 6 percent.
But there is more. An unloaded tip forces the loading towards inner radii, and at these inner radiileading edge separation may occur. This is stimulated strongly by a highly skewed leading edge, whichgenerates a leading edge vortex similar to that of a delta wing. This vortex can be made visible bylowering the pressure. An example is given in Fig. 7.
Fig. 7 Combination of local and leading edge tip vortex.
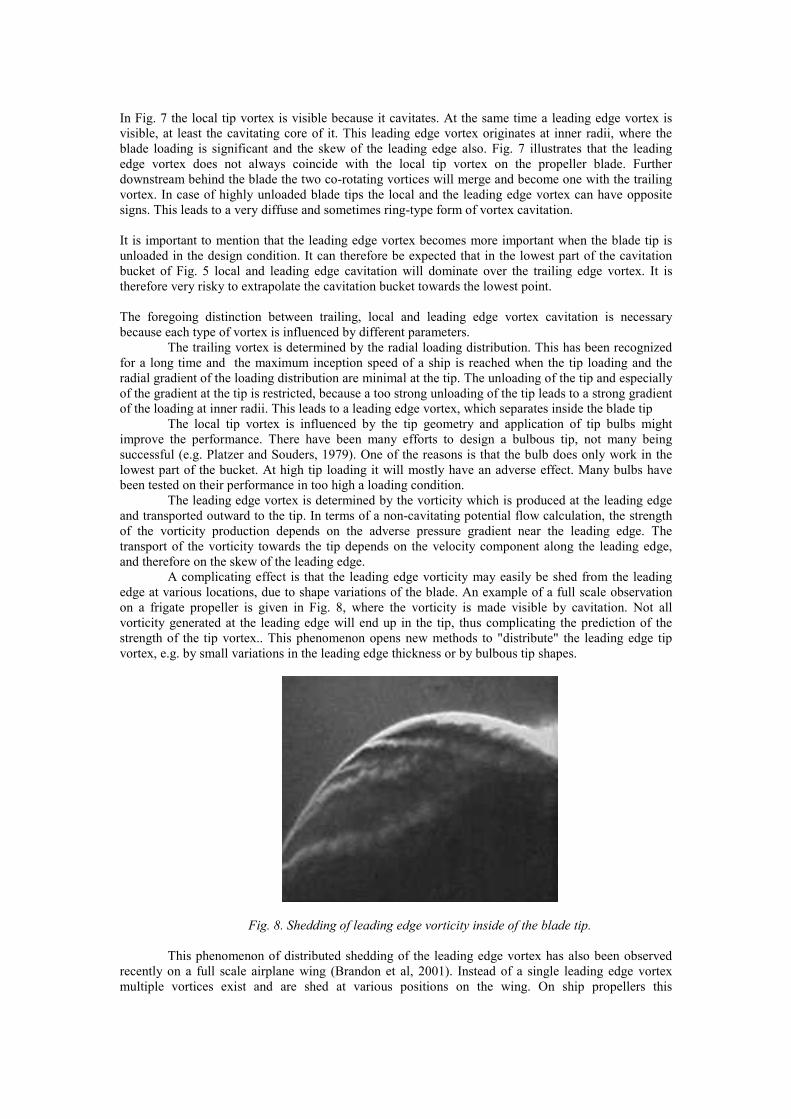
In Fig. 7 the local tip vortex is visible because it cavitates. At the same time a leading edge vortex isvisible, at least the cavitating core of it. This leading edge vortex originates at inner radii, where theblade loading is significant and the skew of the leading edge also. Fig. 7 illustrates that the leadingedge vortex does not always coincide with the local tip vortex on the propeller blade. Furtherdownstream behind the blade the two co-rotating vortices will merge and become one with the trailingvortex. In case of highly unloaded blade tips the local and the leading edge vortex can have oppositesigns. This leads to a very diffuse and sometimes ring-type form of vortex cavitation.
It is important to mention that the leading edge vortex becomes more important when the blade tip isunloaded in the design condition. It can therefore be expected that in the lowest part of the cavitationbucket of Fig. 5 local and leading edge cavitation will dominate over the trailing edge vortex. It istherefore very risky to extrapolate the cavitation bucket towards the lowest point.
The foregoing distinction between trailing, local and leading edge vortex cavitation is necessarybecause each type of vortex is influenced by different parameters.
The trailing vortex is determined by the radial loading distribution. This has been recognizedfor a long time and the maximum inception speed of a ship is reached when the tip loading and theradial gradient of the loading distribution are minimal at the tip. The unloading of the tip and especiallyof the gradient at the tip is restricted, because a too strong unloading of the tip leads to a strong gradientof the loading at inner radii. This leads to a leading edge vortex, which separates inside the blade tip
The local tip vortex is influenced by the tip geometry and application of tip bulbs mightimprove the performance. There have been many efforts to design a bulbous tip, not many beingsuccessful (e.g. Platzer and Souders, 1979). One of the reasons is that the bulb does only work in thelowest part of the bucket. At high tip loading it will mostly have an adverse effect. Many bulbs havebeen tested on their performance in too high a loading condition.
The leading edge vortex is determined by the vorticity which is produced at the leading edgeand transported outward to the tip. In terms of a non-cavitating potential flow calculation, the strengthof the vorticity production depends on the adverse pressure gradient near the leading edge. Thetransport of the vorticity towards the tip depends on the velocity component along the leading edge,and therefore on the skew of the leading edge.
A complicating effect is that the leading edge vorticity may easily be shed from the leadingedge at various locations, due to shape variations of the blade. An example of a full scale observationon a frigate propeller is given in Fig. 8, where the vorticity is made visible by cavitation. Not allvorticity generated at the leading edge will end up in the tip, thus complicating the prediction of thestrength of the tip vortex.. This phenomenon opens new methods to "distribute" the leading edge tipvortex, e.g. by small variations in the leading edge thickness or by bulbous tip shapes.
Fig. 8. Shedding of leading edge vorticity inside of the blade tip.
This phenomenon of distributed shedding of the leading edge vortex has also been observedrecently on a full scale airplane wing (Brandon et al, 2001). Instead of a single leading edge vortexmultiple vortices exist and are shed at various positions on the wing. On ship propellers this
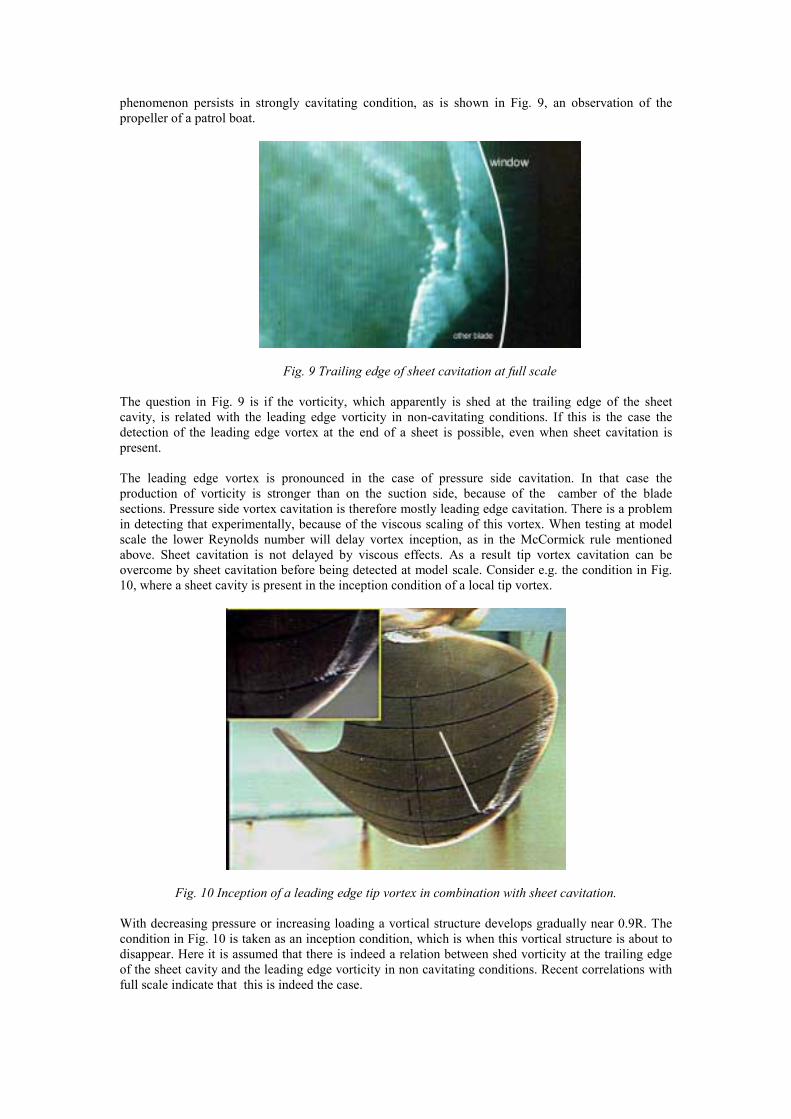
phenomenon persists in strongly cavitating condition, as is shown in Fig. 9, an observation of thepropeller of a patrol boat.
Fig. 9 Trailing edge of sheet cavitation at full scale
The question in Fig. 9 is if the vorticity, which apparently is shed at the trailing edge of the sheetcavity, is related with the leading edge vorticity in non-cavitating conditions. If this is the case thedetection of the leading edge vortex at the end of a sheet is possible, even when sheet cavitation ispresent.
The leading edge vortex is pronounced in the case of pressure side cavitation. In that case theproduction of vorticity is stronger than on the suction side, because of the camber of the bladesections. Pressure side vortex cavitation is therefore mostly leading edge cavitation. There is a problemin detecting that experimentally, because of the viscous scaling of this vortex. When testing at modelscale the lower Reynolds number will delay vortex inception, as in the McCormick rule mentionedabove. Sheet cavitation is not delayed by viscous effects. As a result tip vortex cavitation can beovercome by sheet cavitation before being detected at model scale. Consider e.g. the condition in Fig.10, where a sheet cavity is present in the inception condition of a local tip vortex.
Fig. 10 Inception of a leading edge tip vortex in combination with sheet cavitation.
With decreasing pressure or increasing loading a vortical structure develops gradually near 0.9R. Thecondition in Fig. 10 is taken as an inception condition, which is when this vortical structure is about todisappear. Here it is assumed that there is indeed a relation between shed vorticity at the trailing edgeof the sheet cavity and the leading edge vorticity in non cavitating conditions. Recent correlations withfull scale indicate that this is indeed the case.

The reason why the leading edge vortex is not recognized is that it can merge with the local tip vortex,making it invisible because it does not cavitate. It still increases the vorticity at the tip and thus thelocal tip vortex cavitation. The effect of leading edge vorticity seems more dominant than recognizeduntil now and it is one of the new developments I recognize.
5. Optimizing the inception speed
When the inception speed of a ship has to be improved it is effective to distinguish between the abovementioned types of tip vortex cavitation. As an example a moderately skewed propeller blade has beenused as a reference propeller.
5.1 The reference propeller
The contour of this reference propeller is given in Fig. 11a. This propeller was used in a joint researchprogram of the U.S.Navy and the Royal Netherlands Navy.
a. Reference propeller b. Straight leading edge c. Forward skew
Fig.11. Contours of three propellers with varying skew.
A two bladed propeller model was tested in the Marin large cavitation tunnel in open water condition.The inception diagram with the different types of cavitation is given in Fig. 12.

Fig. 12 Inception diagram of reference propeller.
This diagram shows that the reference propeller is a very good one. The inception lines of the varioustypes of tip vortex cavitation are close together, making it difficult to further optimize the suction sideinception. Indications are that local tip vortex cavitation controls the depth of the bucket, indicating thata tip bulb might lower the bottom of the bucket. The diagram also shows that the very bottom of thebucket could not be reached in the model experiments due to restrictions in tunnel speed and pressure.These observations were carried out with dual camera's in one blade position of the propeller. Thisblade position remained the same for other propellers. One camera observed the whole propeller blade,while another was zoomed into the position of expected inception, which had been determined visuallybeforehand. An observation at inception is given in Fig. 13. At inception of the tip vortex, as shown inthe insert, sheet cavitation occurs already at the leading edge, but in this case this does not interfere.The pressure side inception wasa of the leading edge type, similar as in Fig. 10.
Fig. 13 Inception of local tip vortex cavitation on the parent propeller at σn=2.0
It is not always the bottom of the bucket which determines the inception speed of a ship. Variations inthe conditions of the ship and the sea make it necessary to have a certain margin against cavitation. Thedesign condition in this case was taken at a cavitation index of 2.0. From Fig.12 it is found that thebucket width of the reference propeller in that condition is 0.09 in Kt.

There are two possibilities to decrease the strength of a leading edge vortex. Decrease the vorticitywhich is generated at the leading edge and decrease the transport of this vorticity towards the leadingedge. When the blade sections are optimized with respect to cavitation inception (the "bucket width" ofthe blade sections is optimized) there is very little room for change of the pressure peak and themaximum gradients of the pressure over the section. So only the transport of vorticity towards the tip isleft. This transport can be changed by the leading edge contour, specifically by the skew of the leadingedge.
5.2 The propeller with a straight leading edge
A second propeller blade was therefore designed with a straight leading edge, as shown in Fig. 11b.The radial loading distribution was kept the same as on the reference propeller. The pitch, camber andthickness distribution were designed independently of the parent propeller in order to minimize thebucket width of sheet cavitation and bubble cavitation (Kuiper and Jessup, 1993). A panel code (TheMIT code PSF10) was used to calculate the radial loading distribution and the pressure distribution onthe blade. The calculations showed that an increase in skew gave a decrease in tip loading whencamber and pitch were maintained. The camber and pitch of the blade were therefore adjusted and theblade sections were re-optimized. The control of the tip loading in the calculations was complicated bylocal singularities on panels close to the trailing edge near the tip. Moreover the program uses asimplified wake model for the trailing vortices, which may lead to an overestimation of the tip loadingof the skewed propeller (Moulijn en Kuiper, 1995).
The cavitation bucket of the redesigned propeller with the straight leading edge in open water is givenin Fig. 14.
Fig. 14 Inception diagram of propeller with straight leading edge.
At a cavitation index of 0.2 the suction side trailing vortex inception moves from 0.142 to 0.121,indicating that the tip loading increased, although in the calculations these were approximately thesame. The numerical singularities in the tip region are the probable cause. The suction side local tipvortex inception is affected less and moves from 0.145 to 0.135. A picture of this condition is given inFig. 15.

Fig. 15 Local tip vortex inception on the suction side of the propeller with straight leading edge atσn=2.0
No leading edge vortex is detected at the suction side. At the pressure side the inception of the tipvortex is a local tip vortex instead of by a leading edge vortex. Pressure side inception is delayedconsiderably: from KT=0.052 to 0.007 and the type of incipient vortex is now a local tip vortex insteadof a leading edge vortex.
As a result of the shift of the pressure side inception the bucket width of the propeller with the straightleading edge at a cavitation index of 0.2 is increased from 0.09 to 0.114. For the straight leading edgethe inception lines at the suction side are further apart than on the parent propeller, indicating that abetter balance is possible. To reach this a better control of the tip loading with the panel code isnecessary. This will lead to a decrease in camber of at the tip, which will increase the bucket widthfurther.
5.3 The forward skew propeller
A straight leading edge can cause vibration problems when the propeller operates in a wake. Thereforethe concept was further extended into a forward skewed propeller, as shown in Fig. 11c. Again thepropeller was designed in such a way that the minimum pressure on the blade sections was minimizedand the radial loading distribution was maintained. The results are given in Fig. 16.

Fig. 16 Inception diagram of propeller with forward skew.
As expected no leading edge vortex is present on either side. At the suction side the trailing vortexdominates rather strongly, indicating that the tip loading can be further optimized, similar as with thestraight leading edge. At the pressure side local tip vortex inception occurs, as is given in Fig. 15.There is a substantial amount of sheet cavitation, but the extend is such that it is not expected toinfluence the blade loading. Local tip vortex inception could easily be identified.
Fig. 17 Local tip vortex inception at the pressure side of the propeller with forward skew at σn=2.0
The width of the cavitation bucket of the forward skewed propeller was about the same as that of thestraight leading edge. This indicates that once the transport of vorticity towards the tip along theleading is eliminated, no further improvements are reached. A further reduction of the tip loading of theforward skew propeller may further increase the bucket width because of the distance between theinception lines of the trailing and the local tip vortex.
These results show that a distinction between the origin of the tip vortex is effective in increasing thecavitation behaviour of Navy propellers.
6. The appearance of incipient tips vortex cavitation at full scale.
The distinction of several types of vortex cavitation depending on the origin has its consequences forfull scale observations also. Trailing edge vortex cavitation is similar at model and full scale, except forthe viscous scale effect. Other types of cavitation, especially leading edge vortex cavitation, may have

an appearance which is much like sheet cavitation. There are still questions here if the appearance offull scale cavitation near inception is the same as at model scale. This can be illustrated by theobservation of Fig. 8, which at inception will look like a small line of cavitation at the leading edge,attached to the leading edge. Also local tip vortex cavitation can be difficult to distinguish from sheetcavitation. A spot on the tip of a blade, as in the insert of Fig.13, does also occur at full scale, as shownin Fig. 18. Such a cavity spot can only be classified as tip vortex inception by it further development athigher speeds.
Fig. 18 Cavitation inception of a local tip vortex at full scale.
7. Fully developed tip vortex cavitation.
Fully developed tip vortex cavitation occurs frequently and its importance is increasing because of therequirements to reduce excitations on the hull. These excitations are primarily caused by the dynamicbehavior of sheet cavitation. The dynamics of the sheet can be reduced by a higher tip loading, while atthe same time the risk of erosion is reduced because the sheet cavity is smoothly connected with thecavitating tip vortex. Two problems occur due to a strongly cavitating tip vortex: rudder erosion and"broadband" excitation of the hull.
7.1 Vortex bursting.
The behavior of fully developed tip vortex cavitation has received relatively little attention. Acavitating tip vortex is supposed to do no harm as it is swept away with the flow. The cavitation willcollapse somewhere in the fluid. The precise parameters controlling rudder erosion by a tip vortex isnot yet clear, however. In the top region of the propeller plane the cavitating tip vortex often exhibits a"bursting" behavior, as shown in Fig. 19. This phenomenon will be investigated using a series ofobservations on a Navy oiler with a 5 bladed controllable pitch propeller.
Fig. 19 "Bursting" behavior of a cavitating tip vortex at full scale.(blade position of the bursting vortex is 90 degrees)
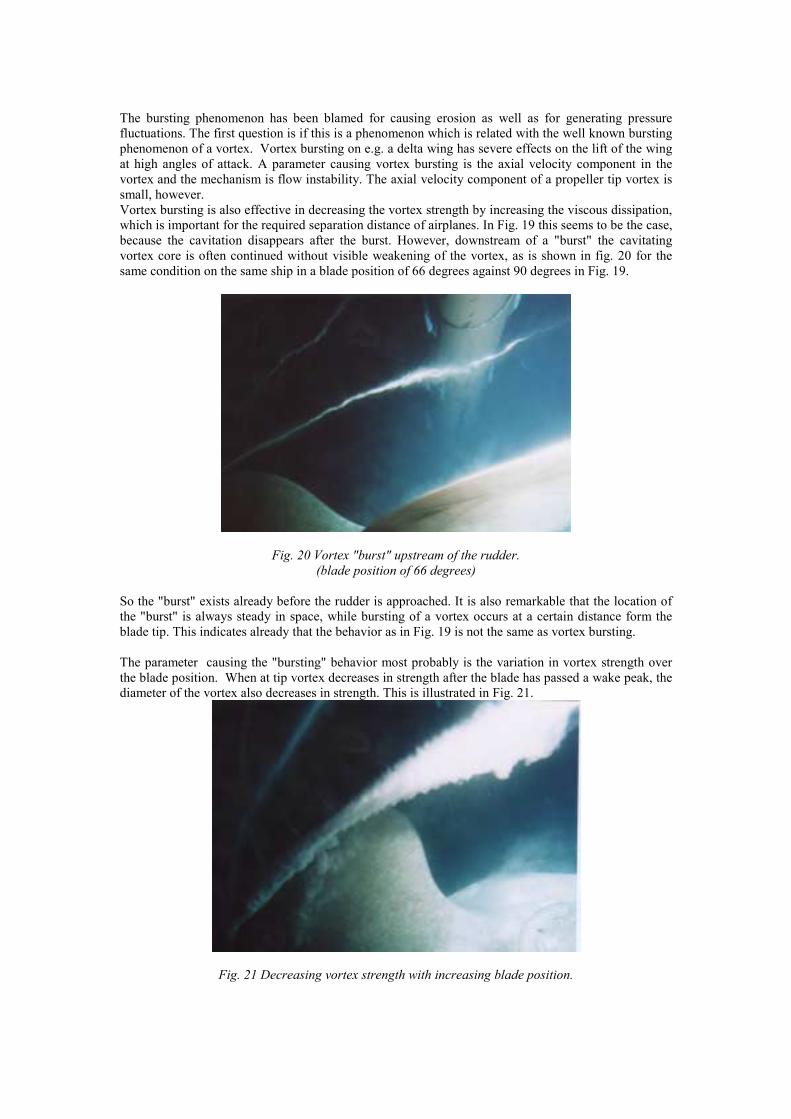
The bursting phenomenon has been blamed for causing erosion as well as for generating pressurefluctuations. The first question is if this is a phenomenon which is related with the well known burstingphenomenon of a vortex. Vortex bursting on e.g. a delta wing has severe effects on the lift of the wingat high angles of attack. A parameter causing vortex bursting is the axial velocity component in thevortex and the mechanism is flow instability. The axial velocity component of a propeller tip vortex issmall, however.Vortex bursting is also effective in decreasing the vortex strength by increasing the viscous dissipation,which is important for the required separation distance of airplanes. In Fig. 19 this seems to be the case,because the cavitation disappears after the burst. However, downstream of a "burst" the cavitatingvortex core is often continued without visible weakening of the vortex, as is shown in fig. 20 for thesame condition on the same ship in a blade position of 66 degrees against 90 degrees in Fig. 19.
Fig. 20 Vortex "burst" upstream of the rudder.(blade position of 66 degrees)
So the "burst" exists already before the rudder is approached. It is also remarkable that the location ofthe "burst" is always steady in space, while bursting of a vortex occurs at a certain distance form theblade tip. This indicates already that the behavior as in Fig. 19 is not the same as vortex bursting.
The parameter causing the "bursting" behavior most probably is the variation in vortex strength overthe blade position. When at tip vortex decreases in strength after the blade has passed a wake peak, thediameter of the vortex also decreases in strength. This is illustrated in Fig. 21.
Fig. 21 Decreasing vortex strength with increasing blade position.

The so-called "vortex burst" of a cavitating tip vortex seems therefore caused by load variations of theblade. To avoid confusion it is better to describe this phenomenon e.g. as "blowing up" the vortexinstead of vortex bursting. The passage of a blade trough a wake peak leaves behind a vortex with ablown up region, as shown in Fig. 22. Note that the blown up vortex is always more cloudy than thestable cavitating vortex core. What is needed is a model of a tip vortex with variable strength. Sinceviscous dissipation will be small the change in vorticity may lead to ring vortices perpendicular the thevortex, which are responsible for the cloudy behaviour of the blown up part of the vortex in Figs. 21and 22
Fig. 22 Blown up vortex core.
7.2 Rudder erosion.
The next question which arises is if the cause of rudder erosion is due to the fact that it is hit by acavitating tip vortex which is blown up in front of the rudder. Indications are that this is not the case,because not all cases of rudder erosion exhibit such a blown up tip vortex. It seems that a solidcavitating tip vortex core can also erode the rudder.
When the tip vortex hits the rudder it wraps around the leading edge of the rudder. In Fig. 20 thisprocess is just starting. The part around the leading edge collapses on the surface of the rudder, whilethe cavitating core continues on both sides of the rudder. The cavitation at the side connected with thepropeller tip is generally stronger than on the downstream side, as is seen in Fig. 19. A mechanism oferosion could be the implosion of the vortex around the leading edge, since that implosion occurs onthe rudder surface. In the case investigated here no erosion was present on the rudder and a reliableprediction of the risk of erosion from observations cannot be given yet. New developments arenecessary here to evaluate the risk of erosion due to a cavitating vortex which hits the rudder (or anyfoil) perpendicularly.
8. Pressure fluctuations due to tip vortex cavitation.
An unexpected consequence of a strongly cavitating tip vortex can be "broadband excitation". Thepressure fluctuations generated by a fluctuating sheet cavity are typically in blade frequencies ormultiples of it, up to the fourth or fifth blade frequency. This seems to be different in the case of a tipvortex, where apart from these discreet frequencies energy is radiated in all frequencies in that samefrequency range. This is often not detected in model tests, because the analysis of the pressure signalson the hull is done by "ensemble averaging" of the signal. The pressure signal is then averaged over anumber of revolutions and the averaged signal is further analyzed. This enhances the signal to noiseration of the blade frequencies, but it filters out the other frequencies. To detect "broadband excitation"narrow band analysis of a time registration is necessary.
Fig. 23 is an example of a propeller in behind condition at model scale which generated suchbroadband excitation.

a bFig. 23 Tip vortex cavitation generating broadband excitation.
The amplitudes at blade frequency were low, but the ship vibrated anyhow in frequencies outside theblade frequencies. The narrow band spectrum on a representative pressure pick-up above the propellerat model scale gave a pressure spectrum as given in Fig. 24.
Fig. 24 Spectrum of hull pressure fluctuations
The blade frequencies are still dominating, but there is a significant amount of energy spread out infrequencies in between, especially around the second and third blade harmonic. In this way theconstruction is always excited in its own frequencies and the vibration level in the ship depends on thedamping. For the amplitude of the blade frequencies statistical experience is used to estimate the risk ofvibrations. For this broadband energy no comparisons are available. The way to reduce this toacceptable levels was to reduce the tip loading in the top position, thus reducing the strength of thecavitating tip vortex of Fig. 23b. This will increase the amplitudes of the blade harmonics, which arecaused by the dynamics of the sheet in Fig. 23a.

These experiences do not yet reveal precisely what the mechanism is which causes the broadbandpressure fluctuations. It can be assumed that when the tip vortex becomes strong enough the implosionmechanism is such that a range of frequencies is generated, independent of the blade rate. There is nosign of cloudy break-up at the end of the tip vortex, although single pictures taken with a time lapseobservation system cannot give details of the dynamics. The parameters controlling this mechanism ofbroadband excitation are still unknown and should be investigated further. The result of the lack ofknowledge is a hesitation to go to heavily loaded tips, although this would be beneficial for the bladerate excitations and for efficiency.
9. Sheet cavitation.
One of the challenging topics of cavitation research is unsteady sheet cavitation (see the discussion ofthis topic by Franc in this symposium). For a long time the cavity has been considered as a singlevalued volume of vapor attached to the surface, which can be calculated by potential flow methods.This requires an artificial closure condition at the trailing edge of the cavity. The work of Kinnas andcoworkers explores the possibilities of this approach. The ultimate validation criterion of thesecalculations is not the cavity extent, as is often used, but the calculated pressure fluctuations. Thecalculation of the pressure fluctuations is being developed. (Kinnas et al , 1999, Dang, 2001). In hispotential calculations Dang modeled a truncated re-entrant jet (Dang and Kuiper, 1998). In three-dimensional flow the precise modeling of the re-entrant jet seems less important for the cavity shapeand extent because of the tangential flow along the closure of the cavity.
Potential methods, however, are not able to predict the risk of erosion. Experimental determination ofthis risk is also extremely difficult or impossible. Visual judgement of the cavitation behavior and paintremoval tests are used at present to qualitatively assess the risk of erosion.
The shedding of vaporous clouds by sheet cavitation is a vital element in the chain of eventsleading to cavitation erosion and this shedding is a topic of investigation. Models exist to describe theimplosioon of a spherical vaporous bubble cloud, but the size (diameter) of this cloud should followfrom calculations on sheet cavitation. The problem is to find a length scale of the shed cavitation at thetrailing edge of a sheet cavity. Again because of restrictions in the calculation methods two-dimensional calculations are dominant. The length scale is then taken as the length between the cavityclosure and the location where the re-entrant jet hits the cavity surface. However, when shedding ofcavitation is observed it is never two-dimensional. Even when the cavity length in global terms seemsconstant along the span of a foil (Fig. 25) the local mechanism is always highly three dimensional.
Fig. 25 "Two-dimensional" sheet cavitation on a foil.
Whenever a cavity closure is smooth there is a significant re-entrant jet which exits at another locationof the foil or of the blade. An example of such a stable closure on a model propeller is given in Fig. 26.
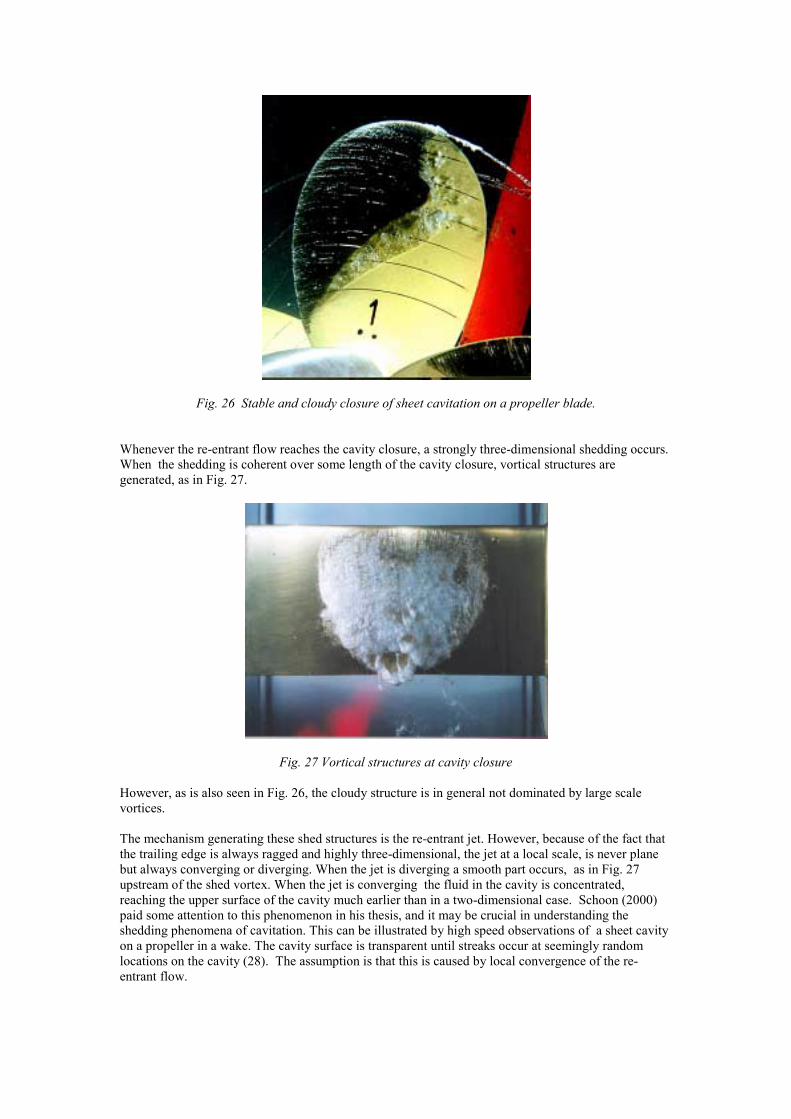
Fig. 26 Stable and cloudy closure of sheet cavitation on a propeller blade.
Whenever the re-entrant flow reaches the cavity closure, a strongly three-dimensional shedding occurs.When the shedding is coherent over some length of the cavity closure, vortical structures aregenerated, as in Fig. 27.
Fig. 27 Vortical structures at cavity closure
However, as is also seen in Fig. 26, the cloudy structure is in general not dominated by large scalevortices.
The mechanism generating these shed structures is the re-entrant jet. However, because of the fact thatthe trailing edge is always ragged and highly three-dimensional, the jet at a local scale, is never planebut always converging or diverging. When the jet is diverging a smooth part occurs, as in Fig. 27upstream of the shed vortex. When the jet is converging the fluid in the cavity is concentrated,reaching the upper surface of the cavity much earlier than in a two-dimensional case. Schoon (2000)paid some attention to this phenomenon in his thesis, and it may be crucial in understanding theshedding phenomena of cavitation. This can be illustrated by high speed observations of a sheet cavityon a propeller in a wake. The cavity surface is transparent until streaks occur at seemingly randomlocations on the cavity (28). The assumption is that this is caused by local convergence of the re-entrant flow.
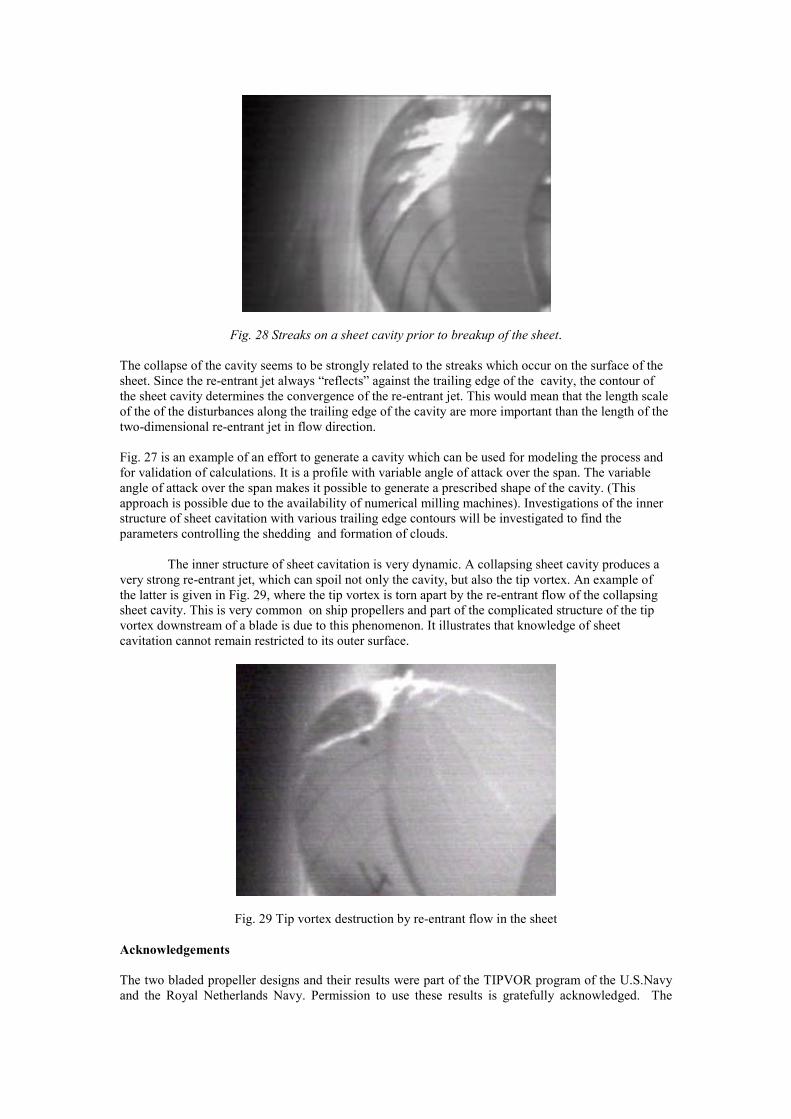
Fig. 28 Streaks on a sheet cavity prior to breakup of the sheet.
The collapse of the cavity seems to be strongly related to the streaks which occur on the surface of thesheet. Since the re-entrant jet always “reflects” against the trailing edge of the cavity, the contour ofthe sheet cavity determines the convergence of the re-entrant jet. This would mean that the length scaleof the of the disturbances along the trailing edge of the cavity are more important than the length of thetwo-dimensional re-entrant jet in flow direction.
Fig. 27 is an example of an effort to generate a cavity which can be used for modeling the process andfor validation of calculations. It is a profile with variable angle of attack over the span. The variableangle of attack over the span makes it possible to generate a prescribed shape of the cavity. (Thisapproach is possible due to the availability of numerical milling machines). Investigations of the innerstructure of sheet cavitation with various trailing edge contours will be investigated to find theparameters controlling the shedding and formation of clouds.
The inner structure of sheet cavitation is very dynamic. A collapsing sheet cavity produces avery strong re-entrant jet, which can spoil not only the cavity, but also the tip vortex. An example ofthe latter is given in Fig. 29, where the tip vortex is torn apart by the re-entrant flow of the collapsingsheet cavity. This is very common on ship propellers and part of the complicated structure of the tipvortex downstream of a blade is due to this phenomenon. It illustrates that knowledge of sheetcavitation cannot remain restricted to its outer surface.
Fig. 29 Tip vortex destruction by re-entrant flow in the sheet
Acknowledgements
The two bladed propeller designs and their results were part of the TIPVOR program of the U.S.Navyand the Royal Netherlands Navy. Permission to use these results is gratefully acknowledged. The

observations on tip vortex cavitation in front of a rudder were carried out for the Royal NetherlandsNavy.
REFERENCES.
ARNDT, R.E.A.,KELLER, A.P., 1992, "Water Quality Effects on Cavitation Inception in a TrailingVortex", J. FLUIDS ENG., VOL.114, PP430
BATCHELOR, G.K.,1964, "Axial Flow in Trailing Line Vortices", J.F.M.(1964) VOL.20 P.4 PP. 645-658.
BRANDON, J.M., HALLISSY, J.B., BROWN, P.W., LAMAR, J.E., 2001, "In-Flight FlowVisualisation- Results of the F-106B with a Vortex Flap", Symposium on Advanced FlowManagement, NATO RTO, Loen, Norway.
DANG, J., 2001, "Numerical Simulation of Unsteady Partial Cavity Flows", PhD Thesis DelftUniversity of Technology, The Netherlands.
DANG, JIE., KUIPER, G., 1998, "Re-entrant Jet Modelling of Partial Cavity Flow on TwoDimensional Hydrofoils", 3rd Int. Symposium on Cavitation, Grenoble/ JFE Vol. 121,dec. 1999
DANG, JIE., KUIPER G., 1998, "Re-entrant Jet Modelling of Partial Cavity Flow on ThreeDimensional Hydrofoils", ASME FED Summer Meeting, Washington D.C./JFE Vol 121.
KINNAS, S., CHOI, J.-K., KOSAL, E., YOUNG, J., LEE, H., 1999, "An integrated computationaltechnique for the design of propellers with specified constraints on Cavitation Extent and HullPressure Fluctuations ", Proceedings CFD99 _The international CFD conference.
KUIPER, G., 1981, "Cavitation Inception on Ship Propeller Models", PhD.Thesis, Delft Univ.ofTechnology, The Netherlands.
KUIPER, G., JESSUP, S.D., 1993, "A Propeller Design Method for Unsteady Conditions", SNAMECentennial Meeting, New York.
PLATZER, G.P., SOUDERS, W.G., 1979, "Tip Vortex Cavitation Delay with Application to MarineLifting Surfaces", DTNSRDC REP. 79/051
RULE, J.A., BLISS, D.B., 1998, "Prediction of Viscous Trailing Vortex Structure from Basic LoadingParameters", AIAA Journal Vol.36, pp208-218.
RIJSBERGEN, M.X. VAN, KUIPER, G., 1997, "Modeling a Cavitating Vortex", ASME Fluids Eng.Division Summer Meeting, FEDSM97,Vancouver.
SCHOON, JOHANNES, 2000, "A Method for the Study of Unsteady Cavitation", Thesis ChalmersUniversity Goteborg.
TERWISGA, T. VAN, KUIPER, G., VAN RIJSBERGEN, M.X., 1999, "On Experimental Techniquesfor the Determination of Tip Vortex Cavitation ", ASME/JSME Fluids EngineeringSummer Meeting, San Francisco.
.