new developments in conventional hydrocarbon exploration...
TRANSCRIPT

New developments in conventionalhydrocarbon exploration withelectromagnetic methodsMartyn UnsworthDepartment of Physics and Institute for Geophysical Research, University of Alberta, Edmonton, Alberta, Canada
Introduction
Over recent decades, electromagnetic methods have beenviewed with considerable suspicion by many in the hydro-carbon exploration industry. While highly effective inmineral and environmental geophysics, electro m a g n e t i cmethods have played a minor role in hydrocarbon explo-ration. Since electromagnetic (EM) methods use signals thatdiffuse in the Earth, they cannot provide the same verticalresolution as modern seismic exploration. However, in thelast decade, electromagnetic methods in general, and magne-totellurics (MT) specifically, have become more widely usedin hydrocarbon exploration. This change is clearly not due toany change in the underlying physics but is due to:
(a) The significant improvements that have taken place inmagnetotelluric data collection, processing and interpre-tation.
(b) The application of MT in settings where other explorationmethods (seismic, gravity, magnetic) encounter problems,are cost prohibitive, or yield ambiguous results.
(c) The realization that MT data can provide complementaryinformation to that derived from seismic exploration. Forexample, the diffusive signal propagation used in MT canbe an advantage in a region of intense fracturing. Whileseismic signals will be scattered, the MT signals diffuseand give a reliable estimate of bulk properties such asporosity. Studies of the shallow structure of the SanAndreas Fault illustrate the ability of MT to image rockvolume properties (Unsworth et al., 2004).
Just as in seismic exploration, electromagnetic geophysics can contribute to effective hydrocarbon exploration in twodistinct ways. Most often, EM methods are used to imagestructures that could host potential reservoirs and/or sourcerocks. In certain cases, they may also give evidence for directindication of the presence of hydrocarbons.
In this article, the focus is on the magnetotelluric method asbeing representative of the developments in EM techniquesin general. A review of the MT method is presented, recentdevelopments are highlighted, and typical applications arediscussed. Active source EM methods have seen a similaradvance in technology and they have been applied to explo-ration for shallow gas and oil sand, or in a deep water setting.Table 1 summarizes the most common EM methods used in oil and gas exploration and outlines typical depths of investigation.
Basics of magnetotellurics
Magnetotellurics uses natural, low frequency electromagnetic(EM) waves to image the subsurface. These waves have
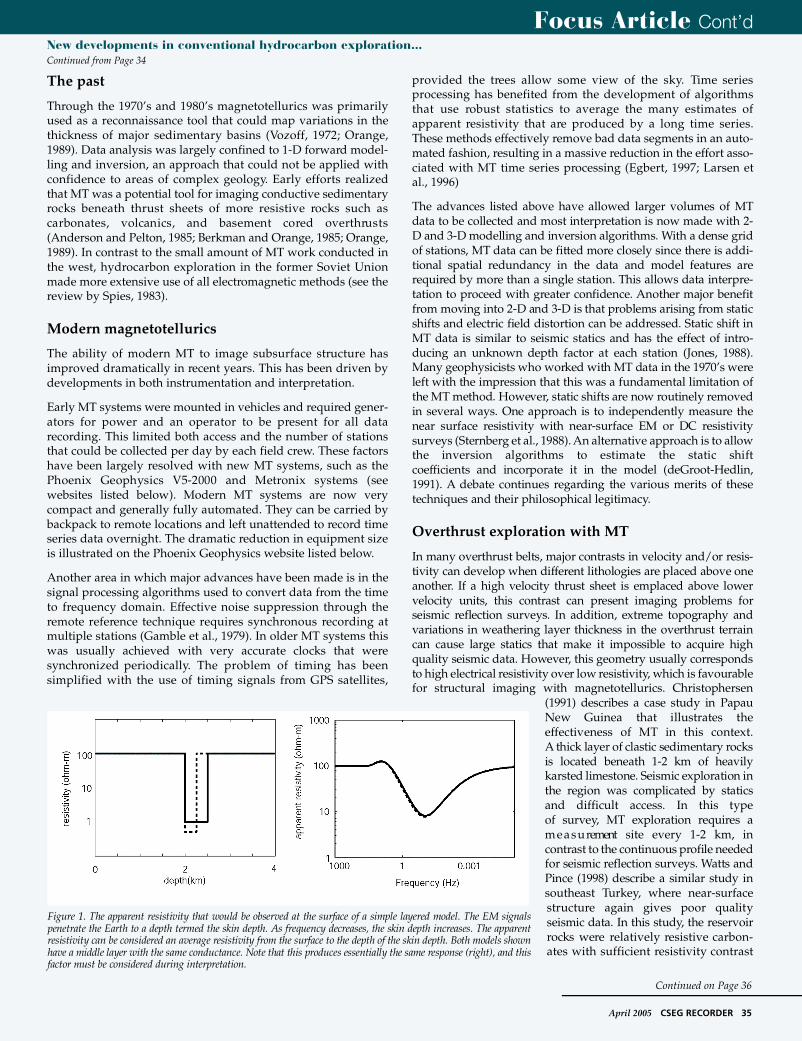
frequencies in the band 1000-0.0001 Hz and originate inworldwide lightning activity and oscillations of the magne-tosphere (Vozoff, 1991). These electromagnetic signals travelthrough the atmosphere as radio waves but diffuse into theEarth and attenuate rapidly with depth. The penetrationdepth is called the skin depth and surface measurement ofelectric and magnetic fields gives the average resistivity fromthe surface to a depth equivalent of the skin depth. The skindepth increases as frequency decreases, and thus a depthsounding of resistivity can be achieved by recording a rangeof frequencies as illustrated in Figure 1. At the highestfrequencies (1000-300 Hz), the apparent resistivity equals thetrue resistivity, since only the uppermost layer is sampled. Atintermediate frequencies, the apparent resistivity drops asEM signals penetrate the second layer. Finally, at the lowestfrequencies, the resistive basement is detected.
The best resolution is achieved in MT when determining thedepth of a low resistivity layer, as in Figure 1, and this depthcan generally be determined to within 10%. Unlike seismicreflection data, it is difficult to define formal resolutioncriteria. Another factor that must be considered is that MT iseffective at defining the conductance (the product of thick-ness and electrical conductivity). However, the individualthickness and conductivity cannot be found, as illustrated bythe second model shown in Figure 1.
34 CSEG RECORDER April 2005
Continued on Page 35
F i g u re 3. Comparison of resistivity derived from the MT data with well logsouthwest of the Brazeau thrust fault. Note that the resistivity-depth pro f i l ederived with the MT data is smoother than that measured in the well becauseMT uses long wavelength signals that average small scale features. The MTmodel can be seen to be a smoothed version of the electrical log.
April 2005 CSEG RECORDER 35
The past
Through the 1970’s and 1980’s magnetotellurics was primarilyused as a reconnaissance tool that could map variations in thethickness of major sedimentary basins (Vozoff, 1972; Orange,1989). Data analysis was largely confined to 1-D forward model-ling and inversion, an approach that could not be applied withconfidence to areas of complex geology. Early efforts realizedthat MT was a potential tool for imaging conductive sedimentaryrocks beneath thrust sheets of more resistive rocks such ascarbonates, volcanics, and basement cored overthru s t s(Anderson and Pelton, 1985; Berkman and Orange, 1985; Orange,1989). In contrast to the small amount of MT work conducted inthe west, hydrocarbon exploration in the former Soviet Unionmade more extensive use of all electromagnetic methods (see thereview by Spies, 1983).
Modern magnetotellurics
The ability of modern MT to image subsurface structure hasimproved dramatically in recent years. This has been driven bydevelopments in both instrumentation and interpretation.
Early MT systems were mounted in vehicles and required gener-ators for power and an operator to be present for all datarecording. This limited both access and the number of stationsthat could be collected per day by each field crew. These factorshave been largely resolved with new MT systems, such as thePhoenix Geophysics V5-2000 and Metronix systems (seewebsites listed below). Modern MT systems are now verycompact and generally fully automated. They can be carried bybackpack to remote locations and left unattended to record timeseries data overnight. The dramatic reduction in equipment sizeis illustrated on the Phoenix Geophysics website listed below.
Another area in which major advances have been made is in thesignal processing algorithms used to convert data from the timeto frequency domain. Effective noise suppression through theremote reference technique requires synchronous recording atmultiple stations (Gamble et al., 1979). In older MT systems thiswas usually achieved with very accurate clocks that weresynchronized periodically. The problem of timing has beensimplified with the use of timing signals from GPS satellites,
provided the trees allow some view of the sky. Time seriesprocessing has benefited from the development of algorithmsthat use robust statistics to average the many estimates ofapparent resistivity that are produced by a long time series.These methods effectively remove bad data segments in an auto-mated fashion, resulting in a massive reduction in the effort asso-ciated with MT time series processing (Egbert, 1997; Larsen et al., 1996)
The advances listed above have allowed larger volumes of MTdata to be collected and most interpretation is now made with 2-D and 3-D modelling and inversion algorithms. With a dense gridof stations, MT data can be fitted more closely since there is addi-tional spatial redundancy in the data and model features arere q u i red by more than a single station. This allows data interpre-tation to proceed with greater confidence. Another major benefitf rom moving into 2-D and 3-D is that problems arising from staticshifts and electric field distortion can be addressed. Static shift inMT data is similar to seismic statics and has the effect of intro-ducing an unknown depth factor at each station (Jones, 1988).Many geophysicists who worked with MT data in the 1970’s wereleft with the impression that this was a fundamental limitation ofthe MT method. However, static shifts are now routinely re m o v e din several ways. One approach is to independently measure thenear surface resistivity with near-surface EM or DC re s i s t i v i t ysurveys (Sternberg et al., 1988). An alternative approach is to allowthe inversion algorithms to estimate the static shift c o e fficients and incorporate it in the model (deGro o t - H e d l i n ,1991). A debate continues re g a rding the various merits of thesetechniques and their philosophical legitimacy.
Overthrust exploration with MT
In many overthrust belts, major contrasts in velocity and/or re s i s-tivity can develop when diff e rent lithologies are placed above onea n o t h e r. If a high velocity thrust sheet is emplaced above lowervelocity units, this contrast can present imaging problems forseismic reflection surveys. In addition, extreme topography andvariations in weathering layer thickness in the overthrust terraincan cause large statics that make it impossible to acquire highquality seismic data. However, this geometry usually corre s p o n d sto high electrical resistivity over low re s i s t i v i t y, which is favourablefor structural imaging with magnetotellurics. Christophersen
(1991) describes a case study in PapauNew Guinea that illustrates the e ffectiveness of MT in this context. A thick layer of clastic sedimentary ro c k sis located beneath 1-2 km of heavilykarsted limestone. Seismic exploration inthe region was complicated by staticsand difficult access. In this type of survey, MT exploration re q u i res am e a s u rement site every 1-2 km, incontrast to the continuous profile neededfor seismic reflection surveys. Watts andPince (1998) describe a similar study insoutheast Tu r k e y, where near- s u r f a c es t ru c t u re again gives poor qualityseismic data. In this study, the re s e r v o i rrocks were relatively resistive carbon-ates with sufficient resistivity contrast
Focus Article Cont’dNew developments in conventional hydrocarbon exploration...Continued from Page 34
F i g u re 1. The apparent resistivity that would be observed at the surface of a simple layered model. The EM signalspenetrate the Earth to a depth termed the skin depth. As frequency decreases, the skin depth increases. The appare n tresistivity can be considered an average resistivity from the surface to the depth of the skin depth. Both models shownhave a middle layer with the same conductance. Note that this produces essentially the same response (right), and thisfactor must be considered during interpre t a t i o n .
Continued on Page 36

36 CSEG RECORDER April 2005
to be distinguished from the overlying assemblages of interca-lated clastic sedimentary rocks and ophiolites. Dell’Aversana(2001) reports a study in the Appenines of Southern Italy andshows that low resistivity, underthrust sedimentary rocks arewell imaged with a relatively broad station spacing (2-3 km).This study also shows that these data sets can benefit from a jointanalysis of MT, gravity and seismic reflection data. The previousstudies were able to derive useful structural information withjust 2-D MT modelling and inversion. However, in some cases,more subtle contrasts can be masked by 3-D effects and a full 3-D analysis must be used (Ravaut et al, 2002). These case studieshave shown that MT is an effective method of defining subsur-face structure in overthrust belts and one contractor has reportedcollecting upwards of several hundreds of kilometers of profilesper year for these types of targets.
Seismic exploration in the Rocky Mountain Foothills has beenvery successful in defining detailed structure in many complexregions over the last 40 years. However, to date, significant useof electromagnetic methods has not been made. Early electricaland EM studies by Densmore (1970) showed that major resis-tivity contrasts were present, suggesting that structures could beimaged with electromagnetic data. Further tests of MT occurredin the early 1980’s in Montana and Southern Alberta but theseprojects were not followed up with more modern processing.
In 2002, the University of Alberta ran an MT profile in the RockyMountain Foothills to determine if useful structural informationcould be obtained in this geological setting. The profile began inthe Alberta Basin and extended southwest from Rocky MountainHouse, across the triangle zone and Brazeau Thrust Fault to theFront Ranges. MT data were collected using the University ofAlberta Phoenix V5-2000 systems, supplemented by units loanedby Phoenix Geophysics in Toronto. MT data were recorded atstations located 2-3 km apart, typically placed at the roadside orin seismic cut lines. A recording interval of 18-24 hours perstation was used and this gave estimates of apparent resistivityover the frequency band 100-0.001 Hz. MT data were simultane-ously recorded at several locations to allow for noise cancellationthrough the remote reference method. Noise encountered in thesurvey came from cathodic protection on major gas lines andground vibration from wind and traffic and was effectivelysuppressed with a combination of quiet recording at a remotestation and robust time series processing algorithms.
The most important step in the subsequent processing is toconvert the MT data from frequency to true depth. This is analo-gous to depth migration in seismic processing. In MT it is
achieved through a combination of forward modelling and auto-mated inversions in 2-D and 3-D (Rodi and Mackie, 2001). Whenthese techniques were applied to the Foothills MT data, themodel in Figure 2 was obtained.
Interpretation of the resistivity model is possible using availablewell log information and comparison with coincident seismicdata. The main features observed in the model are:
• A thick sequence of low resistivity units in the Alberta Basin(A). The pervasive low resistivities are primarily due to salineaquifers.
• The crystalline basement is resistive and dips gently to thesouthwest.
• A prominent low resistivity layer is located in the Cretaceoussection. This unit rises in the triangle zone and is close to thesurface northeast of the Brazeau Thrust Fault.
• Underthrust low resistivity units in the footwall of the BrazeauThrust Fault, that can be traced a significant distance to thewest (features B and C).
Figure 3, taken from Xiao and Unsworth (2004), shows the agree-ment between the MT derived resistivity and the resistivity logat a station southwest of the Brazeau Thrust fault. The MT resis-tivity model is spatially smooth, since it was derived with lowfrequency, diffusive electromagnetic signals with relatively longwavelengths. Note that the resistivity in the underthrust rocks isquite variable, with a pronounced zone of higher resistivities at22 km (B) and lower resistivities at 18-20 km (C). These variationslikely represent variations in the porosity of the underthrustsedimentary units, possibly related to a variable amount of frac-turing. Archie’s Law can be used to estimate porosity from in situresistivity and salinity data. Low resistivities are also observed inanticline A2 east of the Brazeau Thrust Fault and may delineatezones with fracture enhanced porosity.
Sub-basalt, sub-salt, and carbonate reef exploration
Determining the depth of sedimentary rocks beneath a cover ofbasalt is a similar problem to the overthrust case and success hasbeen achieved with MT surveys. A number of studies wereconducted in the Columbia Basin of Washington and Ore g o n(Prieto et al., 1985; Withers et al., 1994) and ongoing exploration inthe area continues to use MT. Magnetotelluric exploration in thesub-basalt environment is also pursued in India (Deccan Tr a p s ) ,Russia (Siberian flood basalts) and Ireland (Tertiary Vo l c a n i cP rovince). Thick sequences of salt can mask seismic exploration
e fforts both onshore and off s h o re .Like basalt, salt is electricallyresistive so EM methods arebeing used to image the base andsometimes the top of the salt.Examples from the Gulf ofMexico have been published byHoversten et al. (2000). Tests ofc o n t rolled source EM surveys forsub-salt imaging have beenundertaken in the Colville Hillsarea of the NWT. Resistivepinnacle reefs in Southern
Focus Article Cont’dNew developments in conventional hydrocarbon exploration...Continued from Page 35
Continued on Page 37
F i g u re 2. Resistivity model from Xiao and Unsworth (2004) derived by 2-D inversion of the University of Alberta MT pro f i l eusing the algorithm of Rodi and Mackie (2001). BTF = Brazeau Thrust fault. A1 and A2 are prominent anticlines. W3 is thewell shown in Figure 3. Black triangles show locations where MT data was re c o r d e d .
April 2005 CSEG RECORDER 37
Focus Article Cont’d
Ontario have been mapped using several types of controlled sourc eEM methods but the depth of investigation is small and re s o l u t i o nis poor (Phoenix Geophysics and University of To ro n t o ) .
Direct detection of hydrocarbons with MT
The results reviewed above have shown that MT can image stru c-t u res that could host potential hydrocarbon reservoirs. The studyin the Foothills has shown that it may also allow variations inp o rosity and pore fluid salinity to be mapped. Can MT dire c t l yimage the hydrocarbon reservoirs? Outside of the Russian litera-t u re, there are very few published studies that definitively showsuccess in this area. The most common problem encountered byMT is the possible masking of a response from an oil/gas saturatedreservoir by changes in lithology. Another factor that reduces re s o-lution is that the electric currents used in MT flow in an essentiallyhorizontal direction. Thus horizontal, high resistivity layers areessentially invisible since they have little effect on the horizontalelectric currents. However, controlled source EM methods generateelectric currents that flow in both the horizontal and vertical dire c-tions and have better resolution to allow direct detection of hydro-carbons. Case studies include the seafloor examples listed belowand apparent changes in subsurface resistivity over time as gas wasadded and removed from a shallow reservoir (Ziolkowski et al.,2 0 0 2 ) .
Marine magnetotellurics and controlled source EMmethods
The last decade has also seen the rapiddevelopment of EM methods that areuseful for hydrocarbon exploration in themarine environment. Marine magnetotel-lurics was developed in the 1980’s andinitially applied to studies of the litho-sphere and mid-ocean ridges (Evans et al.,1999). The seawater in deep oceans, amajor conductor, screens out the highfrequency signals (above 0.01 Hz) neededto image structure in the upper few kilo-meters of the seafloor. However, withmodern re c o rding equipment in lownoise environments, higher fre q u e n c ysignals can be detected in moderate waterdepths (Constable et al., 1998). Controlledsource EM methods were also initiallydeveloped for mid-ocean ridge explo-ration (Unsworth, 1994) and have subse-quently been applied to shallowhydrocarbon exploration. These methodsuse a ship to tow a transmitter over anarray of seafloor instruments providingcoverage of an exploration area (Eidesmoet al., 2002). The presence of the conduc-tive seawater reduces natural noise andallows weak signals from the subsurfaceto be detected. A combination of low reso-lution MT and higher re s o l u t i o nc o n t rolled source EM is becoming thepreferred method for mapping the back-g round sedimentary section and
detecting discrete resistive layers. The recent development in thisfield builds on decades of university, government and commer-cial research on seafloor electromagnetics involving groups inCanada, USA, UK, Japan, Australia and France.
The future
Despite the limitations of MT in the early days of its applicationto hydrocarbon exploration, the method has matured into a toolthat works effectively in certain niche environments. Since thelimitations were understood, it has proved to be a valuablecomplement to other exploration methods. Today large amountsof MT data can be collected rapidly and cost effectively toprovide the density of measurements required to image complexg e o l o g y. The next innovation in EM may come from dataprocessing, interpretation and the integration of surface andborehole methods to improve vertical resolution.
ReferencesAnderson, R. and Pelton, W. H., Magnetotelluric exploration in volcanic cover, over -thrust belts, and rift zones, 55th Ann. Internat. Mtg., SEG, Session MT7, 1985.
Berkman, E. and Orange, A., Interesting aspects of magnetotelluric data in northwesternMontana, 55th Ann. Internat. Mtg., SEG, Session MT6, 1985.
Christopherson, K. R., Applications of magnetotellurics to petroleum exploration inPapua New Guinea: A model for frontier areas, Geophysics, 56, 21-27, April 1991.
Constable, S. C., Orange, A. S., Hoversten, M. G. and Morrison, H. F., Marine magne -totellurics for petroleum exploration Part 1: A sea-floor system. Geophysics, 63, 816-825, 1998.
De Groot-Hedlin, C., Removal of static shift in two dimensions by regularized inversion,
New developments in conventional hydrocarbon exploration...Continued from Page 36
Continued on Page 38

38 CSEG RECORDER April 2005
Geophysics, 56, 2102-2106, 1991.
Dell’Aversana, P., Integration of seismic, MT and gravity data in a thrust belt interpreta -tion, First Break, 19, 335-341, 2001.
Densmore, A. A., An interpretation of some magnetotelluric data recorded in NortheastBritish Columbia during 1969, J. Can. Soc. Exploration Geophysicists, 6, 34-38, 1970.
Eidesmo, T., Ellingsrud, S., MacGregor, L. M., Constable, S., Sinha, M. C., Johansen,S., Kong, F. N. and Westerdahl, H., Sea Bed Logging (SBL), a new method for remoteand direct identification of hydrocarbon filled layers in deepwater areas, FirstBreak, 20, 144-152, 2002.
Egbert, G. D., Robust multiple-station magnetotelluric data processing, Geophys. J. Int.,130, 475-496, 1997.
Evans, R. L., Tarits P., Chave, A. D., White, A, Heinson, G., Filloux, J. H., Toh, H.,Seama, N., Utada, H., Booker, J. R. and Unsworth, M. J., Asymmetric electrical struc -ture in the mantle beneath the East Pacific Rise at 17ºS, Science, 286, 752-756, 1999.
Gamble, T. B., Goubau, W. M. and Clarke, J., Magnetotellurics with a remote reference,Geophysics, 44, 53-68, 1979.
Hoversten, M. G., Constable S.C. and Morrison H. F., Marine magnetotellurics forbase-of-salt mapping: Gulf of Mexico field test at the Gemini Structure, Geophysics,65, 1476-1488, 2000.
Jones, A., Static shift of MT data and its removal in a sedimentary basin environment,Geophysics, 53, 967-978, 1988.
Larsen, J. C., Mackie, R. L., Manzella, A., Fiordelisi, A. and Rieven, S., Robust smoothmagnetotelluric transfer functions, Geophys. J. Int., 124, 801–819, 1996.
Orange, A. S., Magnetotelluric exploration for hydrocarbons, Proc. IEEE, 77, February,1989.
Prieto, C., Perkins, C. and Berkman, E., Columbia River Basalt Plateau-An integratedapproach to interpretation of basalt-covered areas, Geophysics, 50, 2709-2719, 1985.
Ravaut, P., Russell, S., Mallard, P., Ballard, J., Watts, D., Mackie, R. and Hallinan, S.,T h ree-dimensional magnetotellurics for imaging a Devonian reservoir (Huamampampa) in thesouthern Sub-Andean Basin of Bolivia, 72nd Ann. Internat. Mtg., SEG, 2417-2421, 2002.
Rodi, W. and Mackie, R. L., Nonlinear conjugate gradients algorithm for 2-D magne -totelluric inversion, Geophysics, 66, 174-187, 2001.
Spies, B., Recent development in the use of surface electrical methods for oil and gas explo -ration in the Soviet Union, Geophysics, 48, 1102-1112, 1983.
Sternberg, B. K., Washburne, J. and Pellerin, L., Correction for the static shift in magne -totellurics using transient electromagnetic soundings, Geophysics, 53, 1459-1468, 1988.
Unsworth, M. J., Exploration of mid-ocean ridges with a frequency domain electromagneticsystem, Geophys. J. Int., 116, 447-467, 1994.
Unsworth, M. J. and Bedrosian, P. A., Electrical resistivity at the SAFOD site from magne -totelluric exploration, Geophys. Res. Lett., 31, L12S05, doiL10.1029/2003GL019405, 2004.
Vozoff, K., The Magnetotelluric Method in the Exploration of Sedimentary Basins,Geophysics, 37, 98-141, 1972.
Vo z o ff, K., The Magnetotelluric Method, in Electromagnetic Methods in AppliedGeophysics, M. N. Nabighian, Ed. (SEG, Tulsa), vol. 2, chapter 8, 1991.
Watts, M. D. and Pince, A., Petroleum exploration in overthrust areas using MT andseismic data, SEG Expanded Abstracts, 1998.
Withers, R., Eggers, D., Fox, T. and. Crebs, T., A case study of integrated hydrocarbonexploration through basalt, Geophysics, 59, 1666-1679, 1994.
Xiao, W. and Unsworth M. J., Magnetotelluric exploration in the Rocky MountainFoothills, expanded abstract, CSEG Annual Convention, Calgary, 2004.
Ziolkowski, A., Hobbs, B. and. Wright, D., First direct hydrocarbon detection and reser -voir monitoring using transient electromagnetics, First Break, 20, 224-225, 2002.
URLs
http://www.phoenix-geophysics.com/Home/Technology/Evolution/
http://www.metronix.de/mtx/products/geo/page_geo_eng.html
Acknowledgements
MT data collection in the Rocky Mountain Foothills was fundedby re s e a rch grants to Martyn Unsworth from NSERC, theCanadian Foundation for Innovation, Alberta Ingenuity Fund,I S R I P and the University of Alberta. Fieldwork was alsosupported through technical help and equipment loan fromPhoenix Geophysics. Discussions with Don Watts and RichardKellett over recent years are gratefully acknowledged. R
Focus Article Cont’dNew developments in conventional hydrocarbon exploration...Continued from Page 37
Martyn Unsworth is a professor in the Department of Physics at the University ofAlberta. He received his BA in Natural Sciences from Cambridge University in 1986and his PhD in Earth Sciences from Cambridge University in 1991. Before moving tothe University of Alberta in 2000, he worked as a post-doc at the University of BritishColumbia and as Research Assistant Professor and Research Associate Professor atthe University of Washington. His primary re s e a rch interest is in the application ofmagnetotellurics to tectonic studies, exploration geophysics and environmental pro b-lems. In recent years he has worked in several areas of Canada, California, Mexico,Tibet and the Aleutian Islands of A l a s k a " .
Signal Type Measured Fields Depth of investigation(Frequency (Electric or in a sedimentary Land
Method Source Or time domain) Magnetic) basin or Marine
MT (Magnetotellurics) Natural Frequency E and H 1 – 10 km Both
AMT (Audio-magnetotellurics) Natural Frequency E and H 100 – 1000 m Land
CSAMT (Controlled source audio- magnetotellurics) Grounded Dipole Frequency E and H 100 – 2000 m Both
UTEM(University of Toronto EM) Large Loop Time H 50 -500 m Land
LOTEM/MTEM Grounded Dipole Time E and H 100 – 1000 m Land
Land TEM Loop Time H 50 – 200 m Airborne
Table 1: Typical EM systems that have been applied to hydrocarbon exploration
Focus Article Cont’d