new developments in strawberry flavour · pdf filenew developments in strawberry flavour...
TRANSCRIPT
1
New developments in strawberry flavourresearchBart Nicolaï Thomas VandendriesscheBart Nicolaï, Thomas Vandendriessche, Maarten Hertog
Katholieke Universiteit Leuven, BelgiumFlanders Centre of Postharvest Technology, Belgium
Contents
• FlavourFlavour analysis• Flavour analysis
• Strawberry aroma• Flavour changes during ripening• Postharvest flavour changes• High throughput flavour analysis• MetabolomicsMetabolomics• Conclusions
2
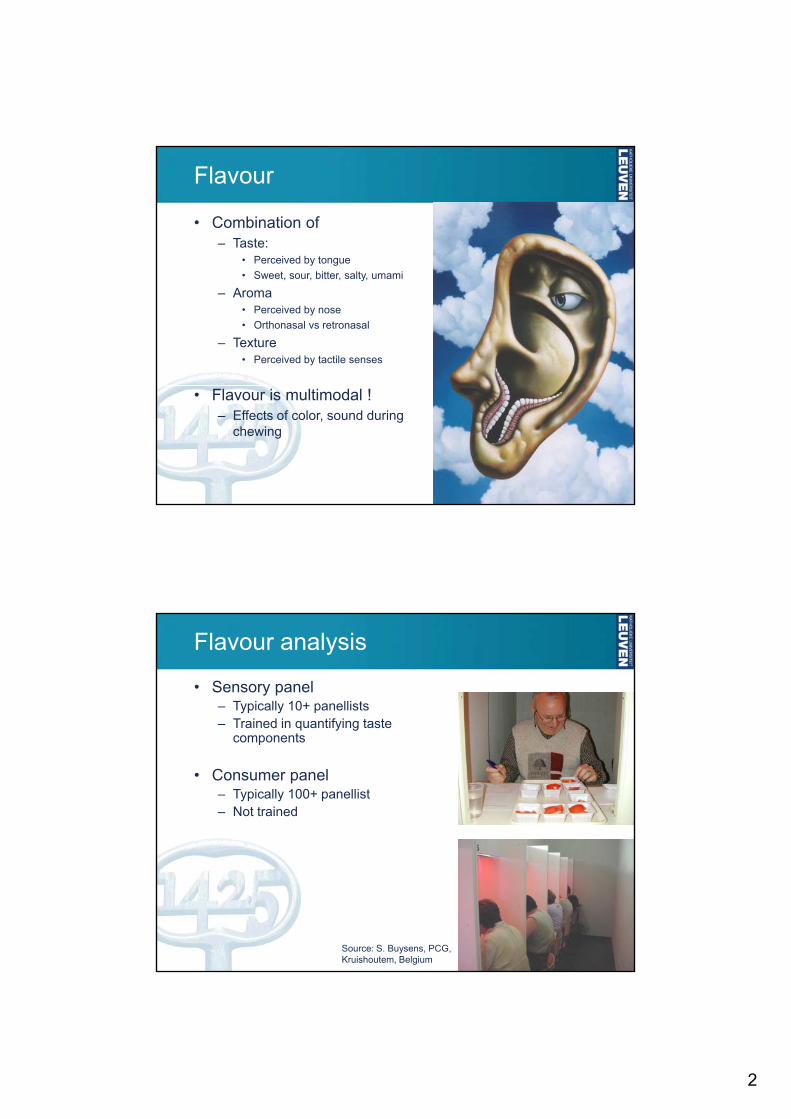
Flavour
• Combination of– Taste:
• Perceived by tongue • Sweet, sour, bitter, salty, umami
– Aroma• Perceived by nose• Orthonasal vs retronasal
– Texture• Perceived by tactile senses
• Flavour is multimodal !– Effects of color, sound during
chewing
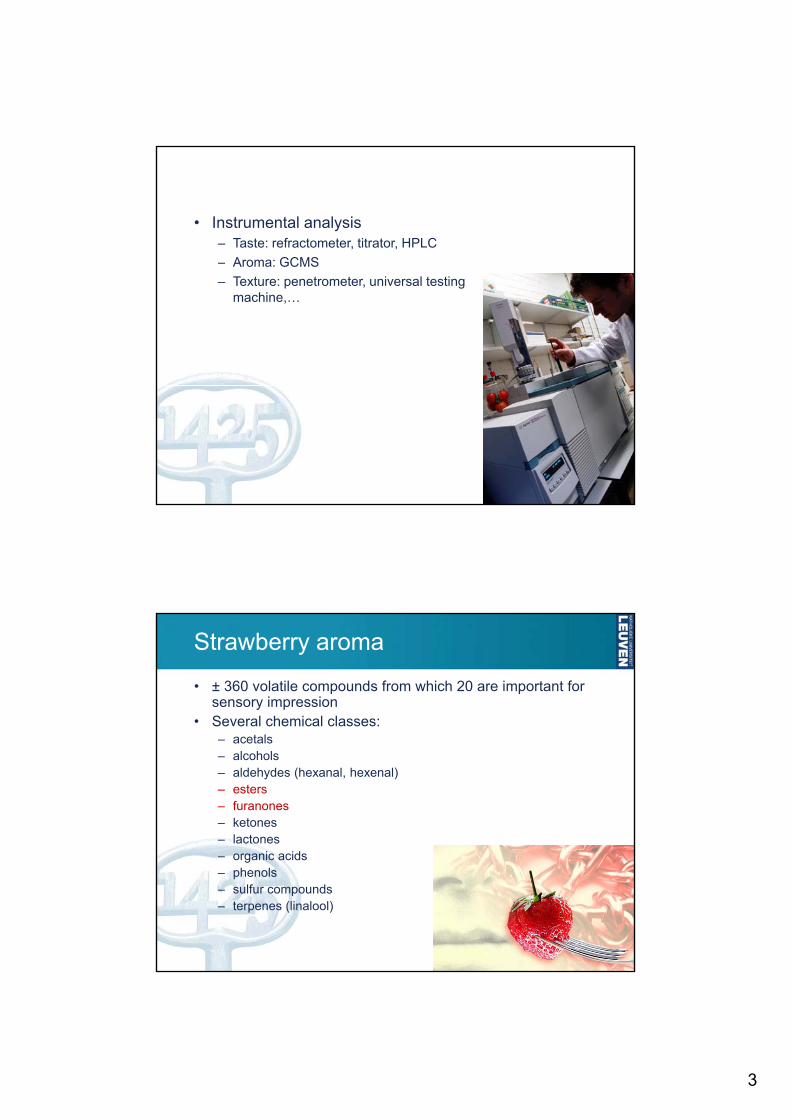
Flavour analysis
• Sensory panel– Typically 10+ panellists– Trained in quantifying taste
components
• Consumer panel– Typically 100+ panellist– Not trained
Source: S. Buysens, PCG, Kruishoutem, Belgium
3
• Instrumental analysis– Taste: refractometer, titrator, HPLC – Aroma: GCMSAroma: GCMS– Texture: penetrometer, universal testing
machine,…
Strawberry aroma
• ± 360 volatile compounds from which 20 are important for sensory impression
• Several chemical classes:– acetals– alcohols– aldehydes (hexanal, hexenal)– esters– furanones– ketones– lactones
i id– organic acids– phenols– sulfur compounds – terpenes (linalool)
4
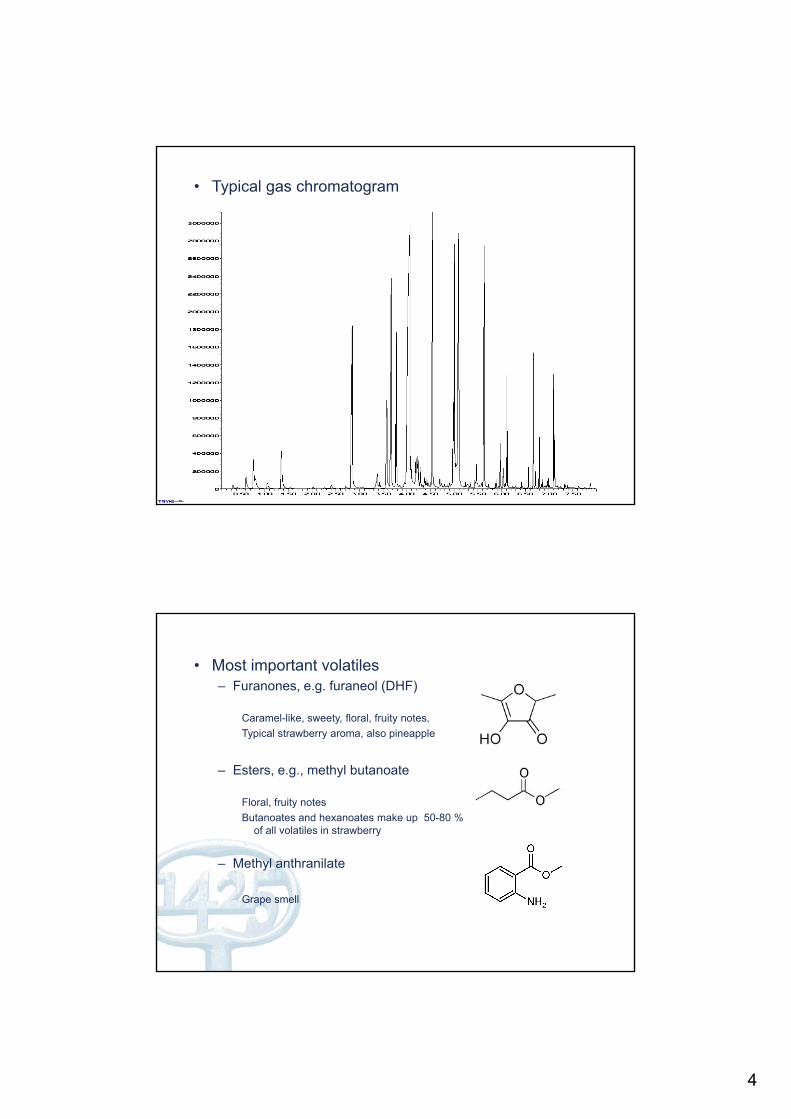
• Typical gas chromatogram
• Most important volatiles– Furanones, e.g. furaneol (DHF)
Caramel-like, sweety, floral, fruity notes, Typical strawberry aroma also pineappleTypical strawberry aroma, also pineapple
– Esters, e.g., methyl butanoate
Floral, fruity notesButanoates and hexanoates make up 50-80 %
of all volatiles in strawberry
– Methyl anthranilate
Grape smell
5
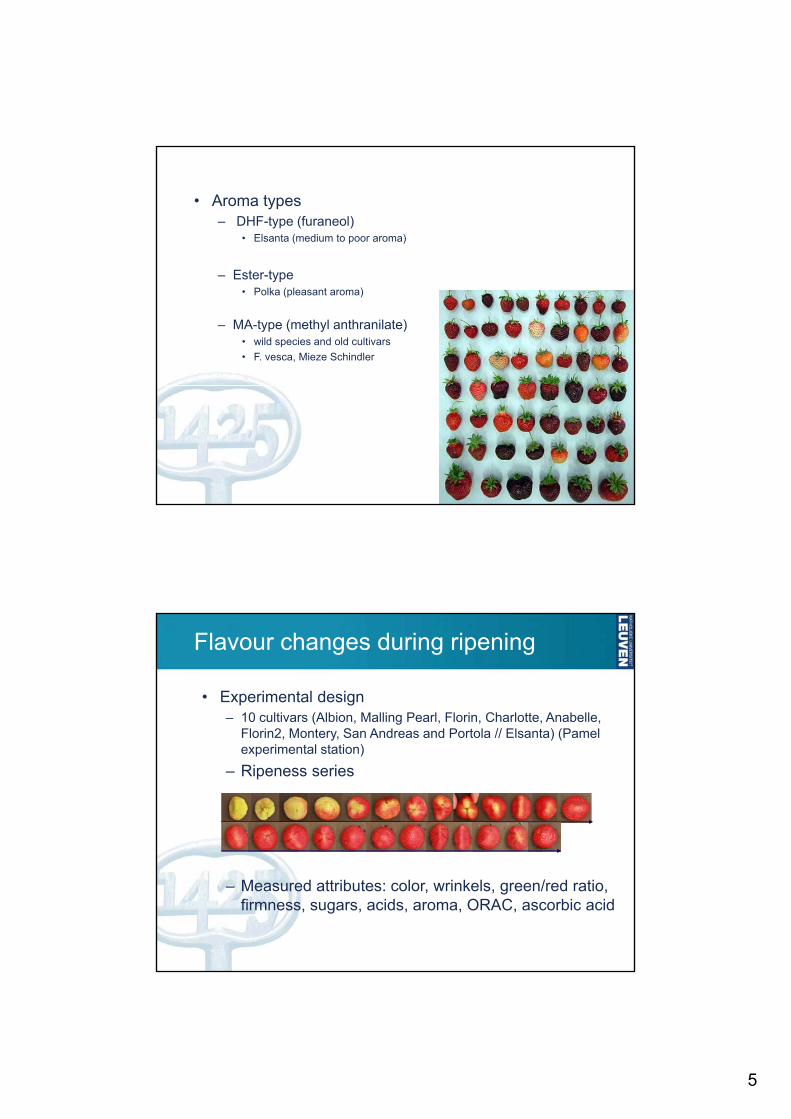
• Aroma types– DHF-type (furaneol)
• Elsanta (medium to poor aroma)
– Ester-type• Polka (pleasant aroma)
– MA-type (methyl anthranilate)• wild species and old cultivars• F. vesca, Mieze Schindler
Flavour changes during ripening
• Experimental design– 10 cultivars (Albion, Malling Pearl, Florin, Charlotte, Anabelle,
Florin2 Montery San Andreas and Portola // Elsanta) (PamelFlorin2, Montery, San Andreas and Portola // Elsanta) (Pamelexperimental station)
– Ripeness series
– Measured attributes: color, wrinkels, green/red ratio, firmness, sugars, acids, aroma, ORAC, ascorbic acid
6
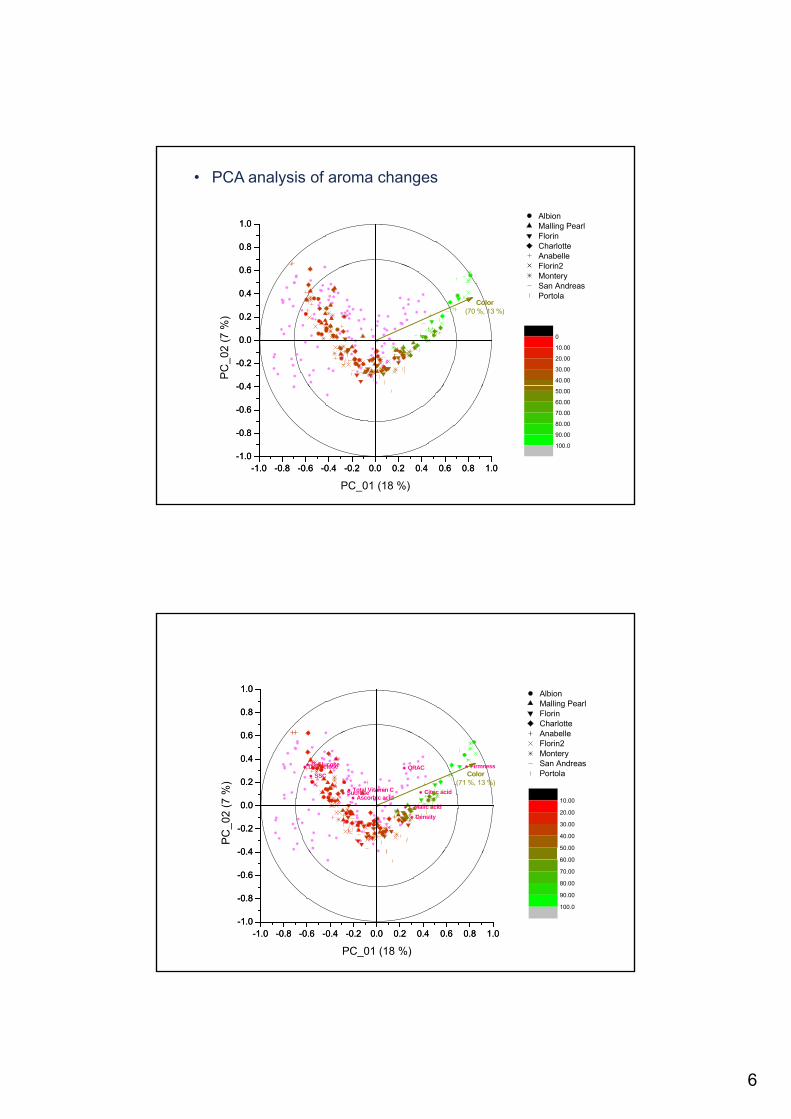
• PCA analysis of aroma changes
0.8
1.0
0.8
1.0AlbionMalling PearlFlorinCharlotteAnabelleFlorin2
0 4
-0.2
0.0
0.2
0.4
0.6
0 4
-0.2
0.0
0.2
0.4
0.6
Color(70 %, 13 %)
Florin2MonterySan AndreasPortola
PC
_02
(7 %
)
0
10.00
20.00
30.00
40.00
-1.0 -0.8 -0.6 -0.4 -0.2 0.0 0.2 0.4 0.6 0.8 1.0-1.0
-0.8
-0.6
-0.4
-1.0 -0.8 -0.6 -0.4 -0.2 0.0 0.2 0.4 0.6 0.8 1.0-1.0
-0.8
-0.6
-0.4
PC_01 (18 %)
50.00
60.00
70.00
80.00
90.00
100.0
0 6
0.8
1.0
0 6
0.8
1.0 AlbionMalling PearlFlorinCharlotteAnabelle
-0 4
-0.2
0.0
0.2
0.4
0.6
FirmnessSSC
Density
ORAC
Ascorbic acidTotal Vitamin C Citric acid
L-Malic acid
D-FructoseD-Glucose
Sucrose
-0 4
-0.2
0.0
0.2
0.4
0.6
Color(71 %, 13 %)
AnabelleFlorin2MonterySan AndreasPortola
PC
_02
(7 %
)
10.00
20.00
30.00
40.00
50.00
-1.0 -0.8 -0.6 -0.4 -0.2 0.0 0.2 0.4 0.6 0.8 1.0-1.0
-0.8
-0.6
-0.4
-1.0 -0.8 -0.6 -0.4 -0.2 0.0 0.2 0.4 0.6 0.8 1.0-1.0
-0.8
-0.6
-0.4
PC_01 (18 %)
60.00
70.00
80.00
90.00
100.0
7
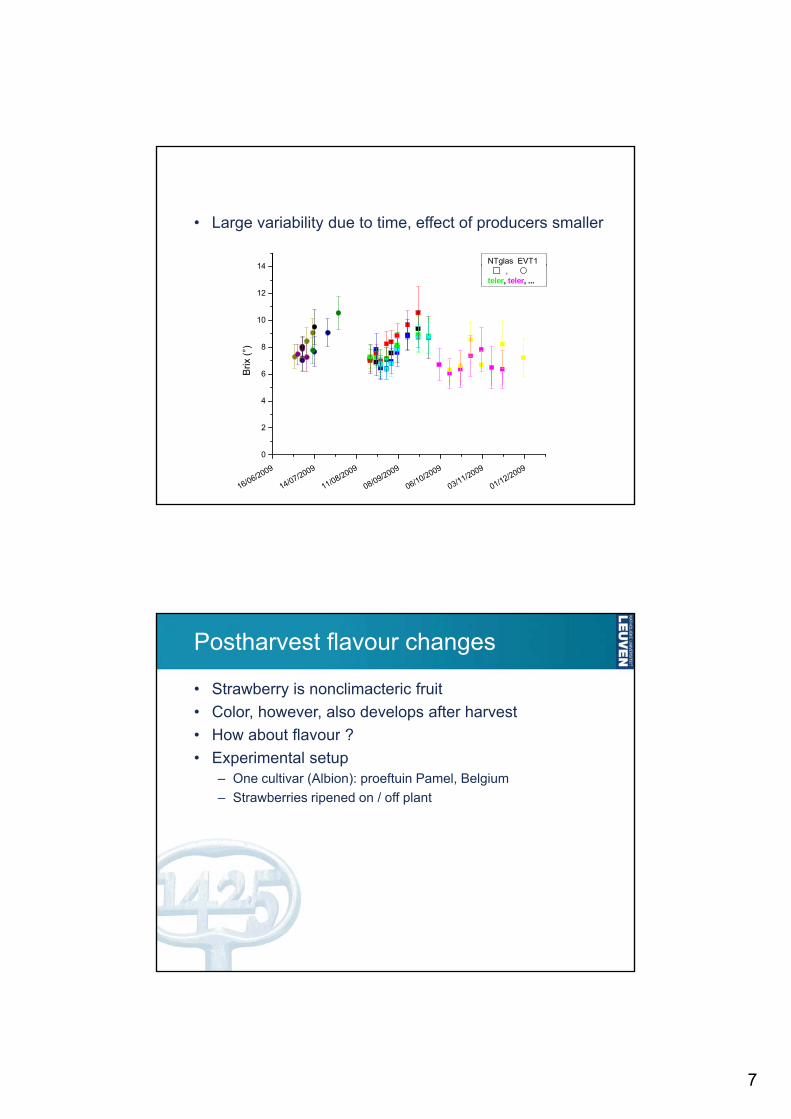
• Large variability due to time, effect of producers smaller
Variability of quality attributes at harvest
14 NTglas EVT1
6
8
10
12
14 , teler, teler, ...
Brix
(°)
16/06/2009
14/07/2009
11/08/2009
08/09/2009
06/10/2009
03/11/2009
01/12/2009
0
2
4
Postharvest flavour changes
• Strawberry is nonclimacteric fruit• Color, however, also develops after harvest
How about flavour ?• How about flavour ?• Experimental setup
– One cultivar (Albion): proeftuin Pamel, Belgium– Strawberries ripened on / off plant
8
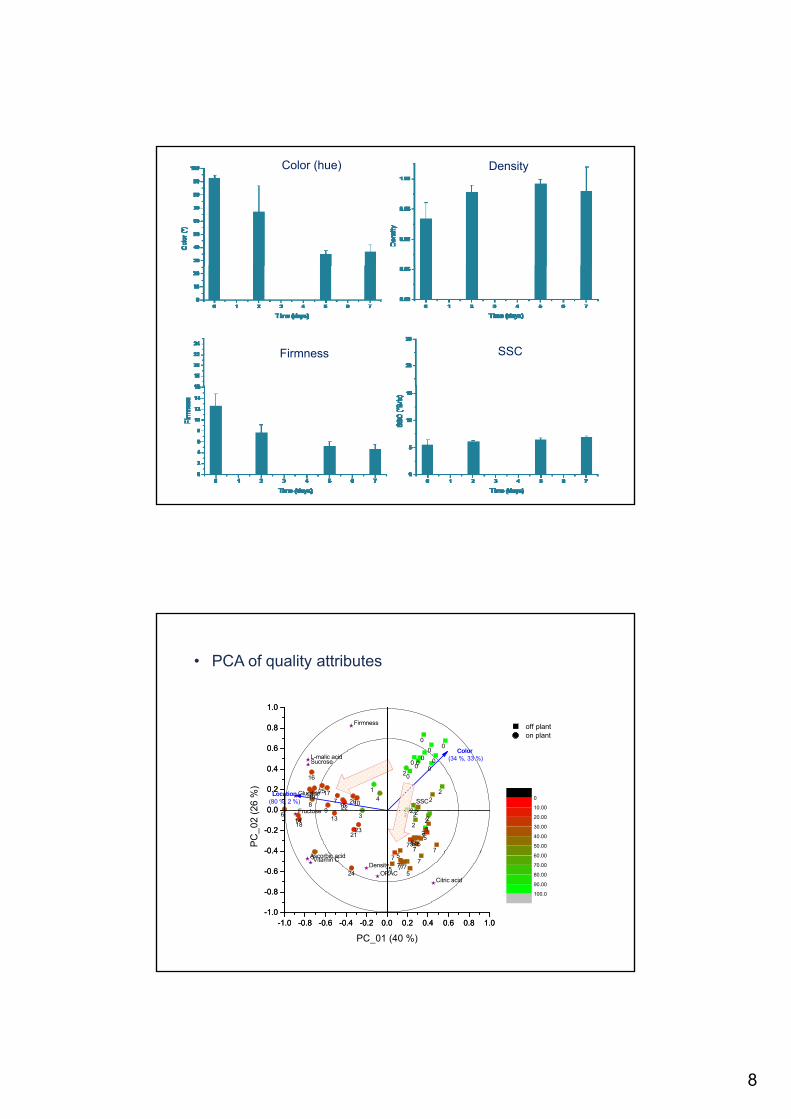
Color (hue) Density
Firmness SSC
• PCA of quality attributes
0.8
1.0
Firmness0.8
1.0
off plant
-0 4
-0.2
0.0
0.2
0.4
0.6
Glucose
Fructose
SucroseL-malic acid
SSC
0
0
0
0
000
0
00
2
222
2
2
2
2
2
2
5555
55 577 7
7
1
2
3
4
6
789
101112
1314
15
16
17
18
1920
21
22
23
25
-0 4
-0.2
0.0
0.2
0.4
0.6
Location(80 %, 2 %)
Color (34 %, 33 %)
on plant
PC
_02
(26
%)
0
10.00
20.00
30.00
40.00
50.00
-1.0 -0.8 -0.6 -0.4 -0.2 0.0 0.2 0.4 0.6 0.8 1.0-1.0
-0.8
-0.6
0.4
ORACCitric acid
Ascorbic acidVitamin CDensity
5
55 7777
7
7
75
24
-1.0 -0.8 -0.6 -0.4 -0.2 0.0 0.2 0.4 0.6 0.8 1.0-1.0
-0.8
-0.6
0.4
PC_01 (40 %)
60.00
70.00
80.00
90.00
100.0
9
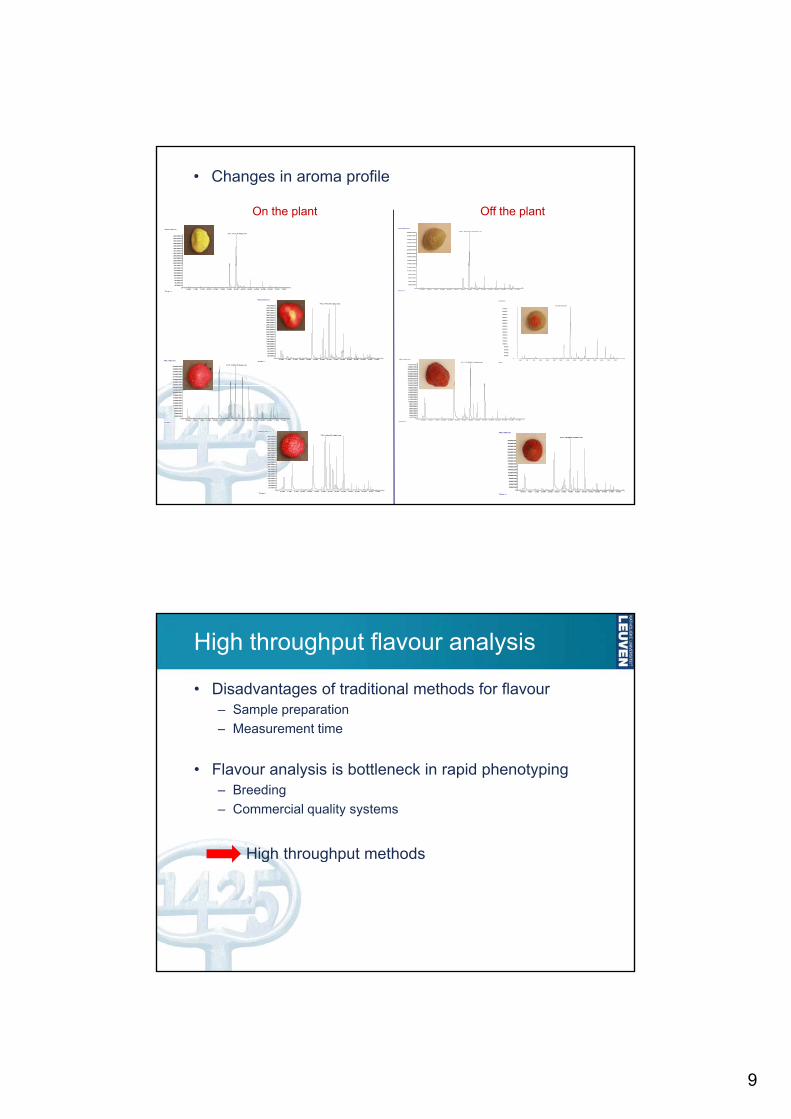
• Changes in aroma profile
On the plant Off the plant
1800000
2000000
2200000
2400000
2600000
2800000
3000000
3200000
3400000
3600000
3800000
4000000
4200000
Abundance
TIC: A1.D\data.ms
1400000
1600000
1800000
2000000
2200000
2400000
2600000
2800000
3000000
3200000
Abundance
TIC: AG11.D\data.ms
0.50 1.00 1.50 2.00 2.50 3.00 3.50 4.00 4.50 5.00 5.50 6.00 6.50 7.00 7.500
200000
400000
600000
800000
1000000
1200000
1400000
1600000
1800000
Time-->
0.50 1.00 1.50 2.00 2.50 3.00 3.50 4.00 4.50 5.00 5.50 6.00 6.50 7.00 7.500
200000
400000
600000
800000
1000000
1200000
1400000
1600000
1800000
2000000
2200000
2400000
2600000
2800000
3000000
3200000
3400000
3600000
3800000
4000000
4200000
4400000
Time-->
Abundance
TIC: A10.D\data.ms
2600000
2800000
3000000
3200000
3400000
3600000
3800000
4000000
Abundance
TIC: A18.D\data.ms
0.50 1.00 1.50 2.00 2.50 3.00 3.50 4.00 4.50 5.00 5.50 6.00 6.50 7.00 7.500
200000
400000
600000
800000
1000000
1200000
Time-->
1900000
2000000
2100000
2200000
2300000
2400000
2500000
2600000
2700000
2800000
2900000
3000000
3100000
Abundance
TIC: AG39.D\data.ms
0.50 1.00 1.50 2.00 2.50 3.00 3.50 4.00 4.50 5.00 5.50 6.00 6.50 7.00 7.500
200000
400000
600000
800000
1000000
1200000
1400000
1600000
1800000
2000000
2200000
2400000
2600000
2800000
3000000
3200000
3400000
Time-->
Abundance
TIC: AG27.D\data.ms
0.50 1.00 1.50 2.00 2.50 3.00 3.50 4.00 4.50 5.00 5.50 6.00 6.50 7.00 7.500
200000
400000
600000
800000
1000000
1200000
1400000
1600000
1800000
2000000
2200000
2400000
Time-->
0.50 1.00 1.50 2.00 2.50 3.00 3.50 4.00 4.50 5.00 5.50 6.00 6.50 7.00 7.500
200000
400000
600000
800000
1000000
1200000
1400000
1600000
1800000
2000000
2200000
2400000
2600000
2800000
3000000
3200000
3400000
3600000
3800000
4000000
4200000
4400000
4600000
Time-->
Abundance
TIC: A24.D\data.ms
0.50 1.00 1.50 2.00 2.50 3.00 3.50 4.00 4.50 5.00 5.50 6.00 6.50 7.00 7.500
100000
200000
300000
400000
500000
600000
700000
800000
900000
1000000
1100000
1200000
1300000
1400000
1500000
1600000
1700000
1800000
1900000
Time-->
0.50 1.00 1.50 2.00 2.50 3.00 3.50 4.00 4.50 5.00 5.50 6.00 6.50 7.00 7.500
200000
400000
600000
800000
1000000
1200000
1400000
1600000
1800000
2000000
2200000
2400000
2600000
2800000
3000000
3200000
3400000
Time-->
Abundance
TIC: AG48.D\data.ms
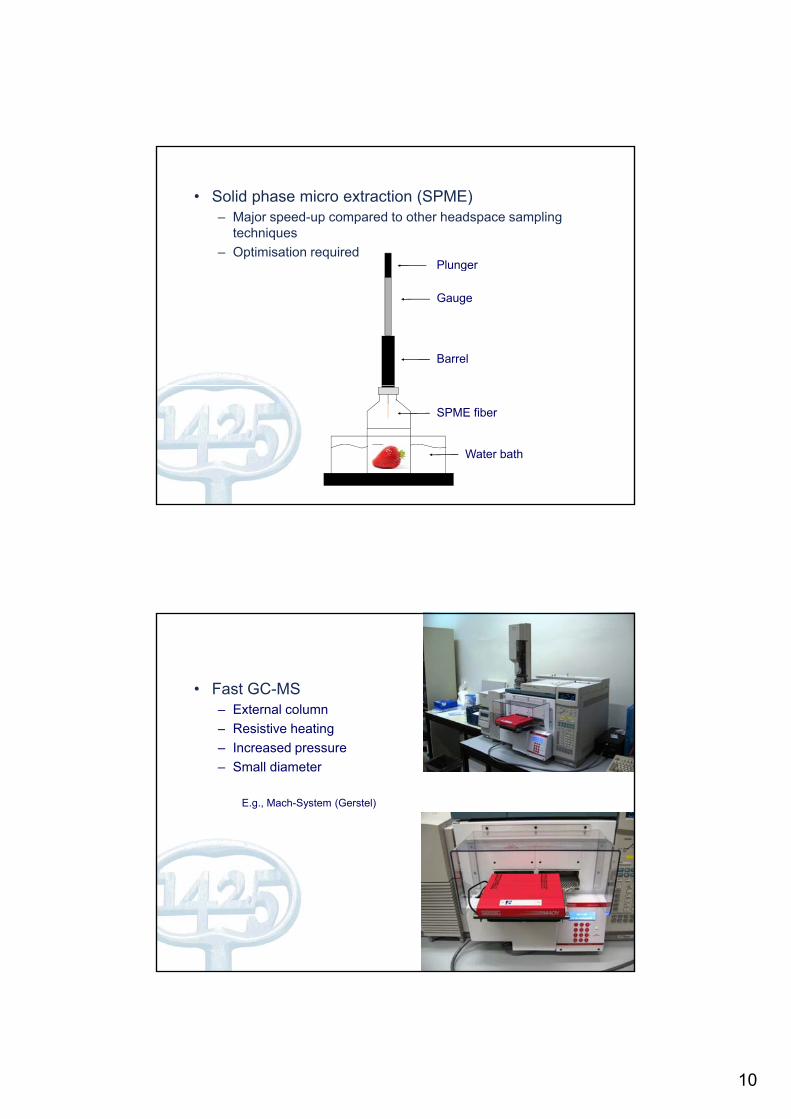
High throughput flavour analysis
• Disadvantages of traditional methods for flavour– Sample preparation– Measurement timeMeasurement time
• Flavour analysis is bottleneck in rapid phenotyping– Breeding– Commercial quality systems
High throughput methodsHigh throughput methods
10
• Solid phase micro extraction (SPME)– Major speed-up compared to other headspace sampling
techniques– Optimisation required
PlungerPlunger
Barrel
Gauge
Water bath
SPME fiber
• Fast GC-MS– External column– Resistive heatingResistive heating– Increased pressure– Small diameter
E.g., Mach-System (Gerstel)
11
10
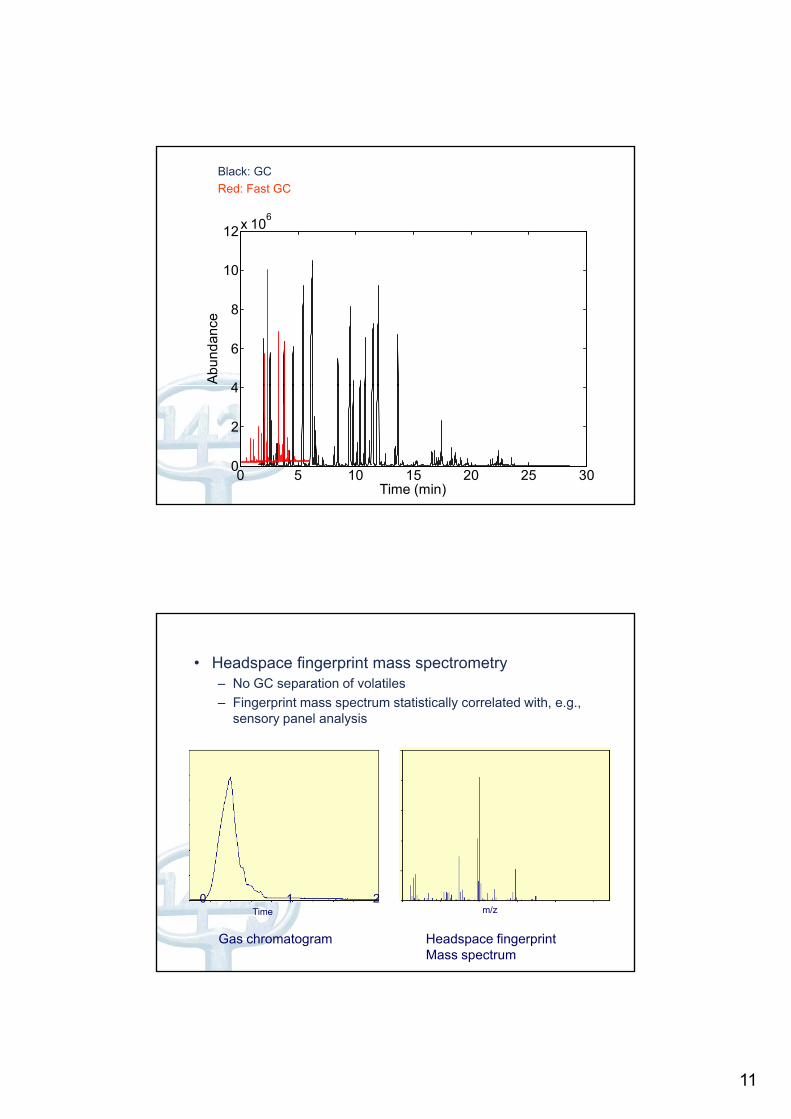
12x 106
Black: GCRed: Fast GC
4
6
8
10
Abun
danc
e
0 5 10 15 20 25 300
2
4
Time (min)
• Headspace fingerprint mass spectrometry– No GC separation of volatiles– Fingerprint mass spectrum statistically correlated with, e.g.,
sensory panel analysis
Headspace Fingerprint MS
Time0 1 2
m/z
Gas chromatogram Headspace fingerprint Mass spectrum
12
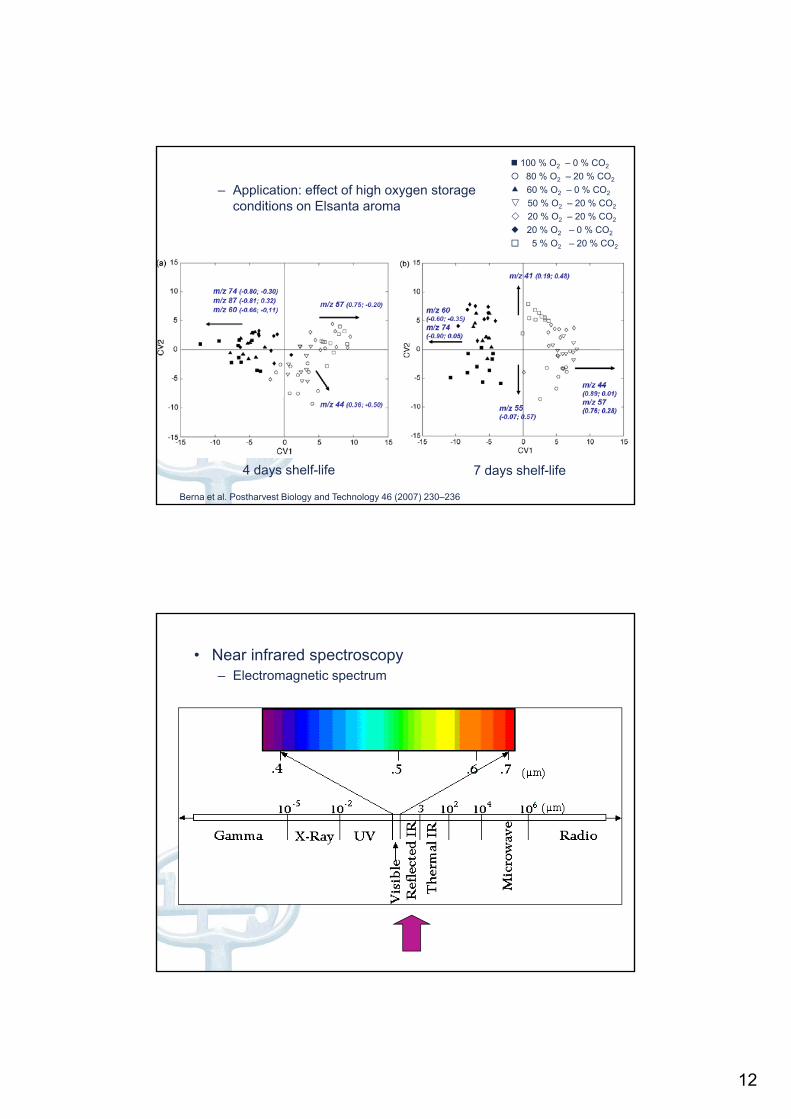
– Application: effect of high oxygen storage conditions on Elsanta aroma
100 % O2 – 0 % CO2
80 % O2 – 20 % CO2
60 % O2 – 0 % CO2
50 % O2 – 20 % CO2
20 % O2 – 20 % CO2
20 % O2 – 0 % CO2
5 % O2 – 20 % CO2
4 days shelf-life 7 days shelf-life
Berna et al. Postharvest Biology and Technology 46 (2007) 230–236
• Near infrared spectroscopy– Electromagnetic spectrum
13
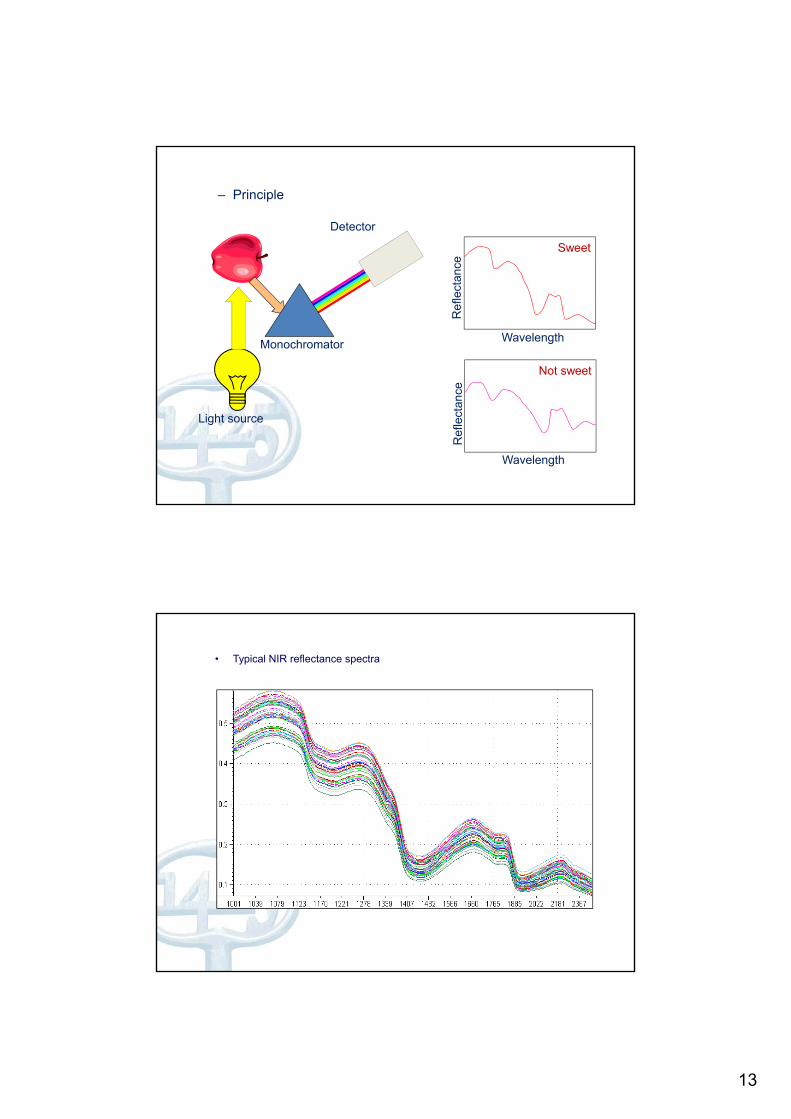
– Principle
ce
Sweet
Detector
Wavelength
Ref
lect
anc
Monochromator
e
Not sweet
Light source
WavelengthR
efle
ctan
ce
• Typical NIR reflectance spectra
Rel
ativ
e re
flect
ance
Wavelength (nm)
R r
14
NIR - suikers
22
24Brix
CalibrationValidation
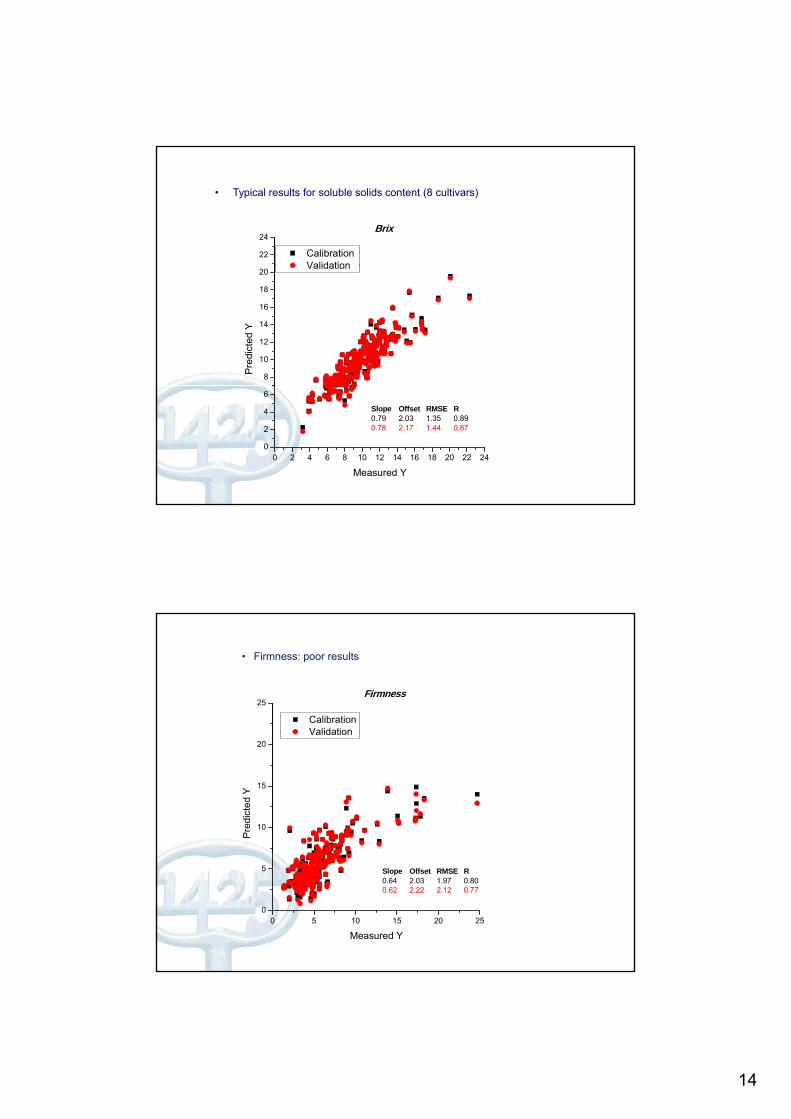
• Typical results for soluble solids content (8 cultivars)
8
10
12
14
16
18
20 Validation
Pre
dict
ed Y
0 2 4 6 8 10 12 14 16 18 20 22 240
2
4
6
Slope Offset RMSE R0.79 2.03 1.35 0.890.78 2.17 1.44 0.87
Measured Y
• Firmness: poor results
25Firmness
CalibrationValidation
10
15
20 Validation
Pred
icte
d Y
0 5 10 15 20 250
5 Slope Offset RMSE R0.64 2.03 1.97 0.800.62 2.22 2.12 0.77
Measured Y
15
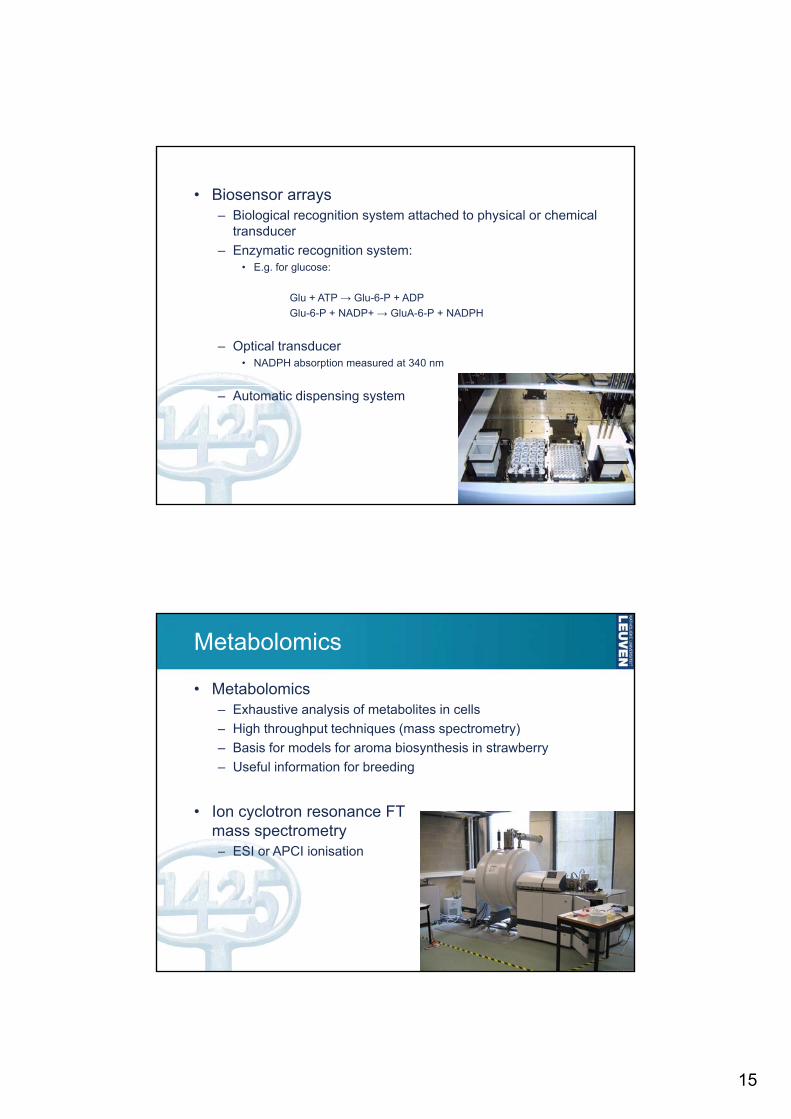
• Biosensor arrays– Biological recognition system attached to physical or chemical
transducer– Enzymatic recognition system:
• E g for glucose:
Biosensor arrays
• E.g. for glucose:
Glu + ATP → Glu-6-P + ADPGlu-6-P + NADP+ → GluA-6-P + NADPH
– Optical transducer• NADPH absorption measured at 340 nm
– Automatic dispensing system
Metabolomics
• Metabolomics– Exhaustive analysis of metabolites in cells– High throughput techniques (mass spectrometry)High throughput techniques (mass spectrometry)– Basis for models for aroma biosynthesis in strawberry– Useful information for breeding
• Ion cyclotron resonance FT mass spectrometry– ESI or APCI ionisation– ESI or APCI ionisation
16
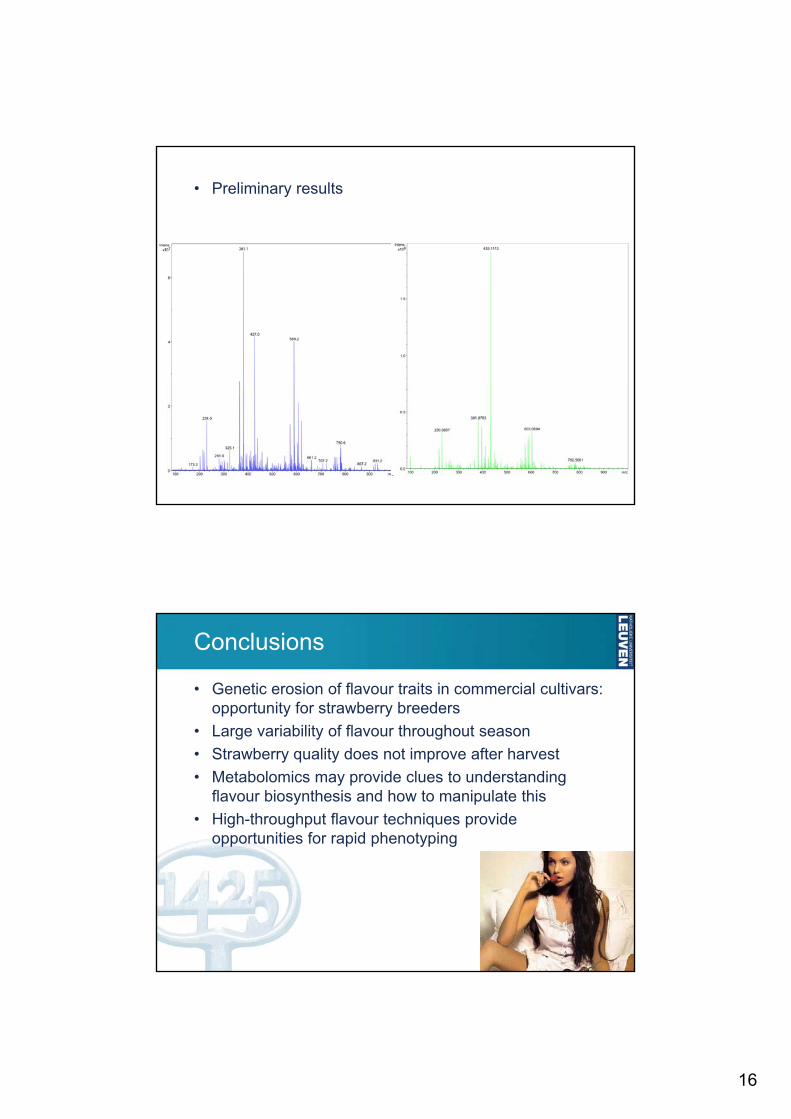
• Preliminary results
Conclusions
• Genetic erosion of flavour traits in commercial cultivars: opportunity for strawberry breeders
• Large variability of flavour throughout season• Large variability of flavour throughout season• Strawberry quality does not improve after harvest• Metabolomics may provide clues to understanding
flavour biosynthesis and how to manipulate this• High-throughput flavour techniques provide
opportunities for rapid phenotyping
17
Acknowledgements