new dimensions in poverty measurementsiteresources.worldbank.org/extabcde/resources/7455676... ·...
TRANSCRIPT

New Dimensions in Poverty Measurement
James E. Foster The George Washington University and OPHI
Broadening Opportunities for DevelopmentAnnual Bank Conference in Development Economics
OECD Conference Centre, Paris, France 31 May 2011

Poverty Measurement
Framework – Sen 1976 identification and aggregation
Goals – Who is poor? targeting– How much poverty? in any population

Poverty Measurement
SupposeSingle variable – calories, income or aggregate expend.
Unidimensional methodsIdentification – poverty lineAggregation – Foster-Greer-Thorbecke 1984, 2010
NoteDecomposabilityRobustness

Poverty Measurement
SupposeMany variables How to measure poverty?
Answer If variables can be meaningfully aggregated into some overall resource or achievement variable can use unidimensional methods

Poverty Measurement
ExamplesWelfare aggregation
Construct each person’s welfare functionSet cutoff and apply unidimensional poverty index
Myriad assumptions needed Alkire and Foster (2010) “Designing the Inequality-
Adjusted Human Development Index”Ordinal variables problematicSuggests dominance

Poverty Measurement
ExamplesPrice aggregation
Construct each person’s expenditure levelSet cutoff and apply unidimensional poverty index
Myriad assumptions needed Ordinal and nonmarket variables problematicLink to welfare tenuous (local and unidirectional)
Foster, Majumdar, Mitra (1990) “Inequality and Welfare in Market Economies” JPubE

Poverty Measurement
SupposeMany variables that cannot be meaningfully aggregated into some overall resource or achievement variable. How to measure poverty?
Answers? Blinders Limit consideration to a subset that can be aggregated, and use unidimensional methods.
Key dimensions ignoredMarginal methods Apply unidimensional methods separately to one or more variables in turn.
Inadequate identification. Ignores joint distribution.

Our Proposal - Overview
Identification – Dual cutoffsDeprivation cutoffs - each deprivation countsPoverty cutoff - in terms of aggregate deprivation values
Aggregation – Adjusted FGTReduces to FGT in single variable case
Background papersAlkire and Foster “Counting and Multidimensional Poverty
Measurement” forthcoming Journal of Public EconomicsAlkire and Foster “Understandings and Misunderstanding of
Multidimensional Poverty” forthcoming Journal of Economic Inequality

Adjusted Headcount Ratio - Overview
Concept - Poverty as multiple deprivationMirrors identification used by NGOs – BRACDepends on joint distribution
Ordinal data Transparent

Adjusted Headcount Ratio - Overview
Can be implemented at any levelCross country – MPI in the 2010 HDRWithin country – Mexico*, Colombia, Bhutan, etc. Local village level – Participatory methods India, Bhutan,
etcEvaluation – Impacts on poverty
Can be used with endogenous cutoffsCoherent use across space and time

Outline
UnidimensionalMultidimensionalUnderstandings and MisunderstandingsExtensions

Review: Unidimensional Methods
Example Incomes y = (7,3,4,8) Poverty line z = 5
Deprivation vector g0 = (0,1,1,0) Headcount ratio P0 = µ(g0) = 2/4
Normalized gap vector g1 = (0, 2/5, 1/5, 0)Poverty gap = P1 = µ(g1) = 3/20
Squared gap vector g2 = (0, 4/25, 1/25, 0)FGT Measure = P2 = µ(g2) = 5/100
Decomposable across population groups

Multidimensional Methods
Matrix of achievements for n persons in d domains
Domains
Persons
z ( 13 12 3 1) Cutoffs
These entries fall below cutoffs
y =
13.1 14 4 115.2 7 5 012.5 10 1 020 11 3 1

Deprivation Matrix
Replace entries: 1 if deprived, 0 if not deprived
Domains
Persons
g0 =
0 0 0 00 1 0 11 1 1 10 1 0 0

Identification – Dual Cutoff Approach
Q/ Who is poor?A/ Fix cutoff k, identify as poor if ci > k (Ex: k = 2)
Domains c
Persons
Note Includes both union and intersectionEspecially useful when number of dimensions is large
Union becomes too large, intersection too smallNext step - aggregate into an overall measure of poverty
g0 =
0 0 0 00 1 0 11 1 1 10 1 0 0
0241
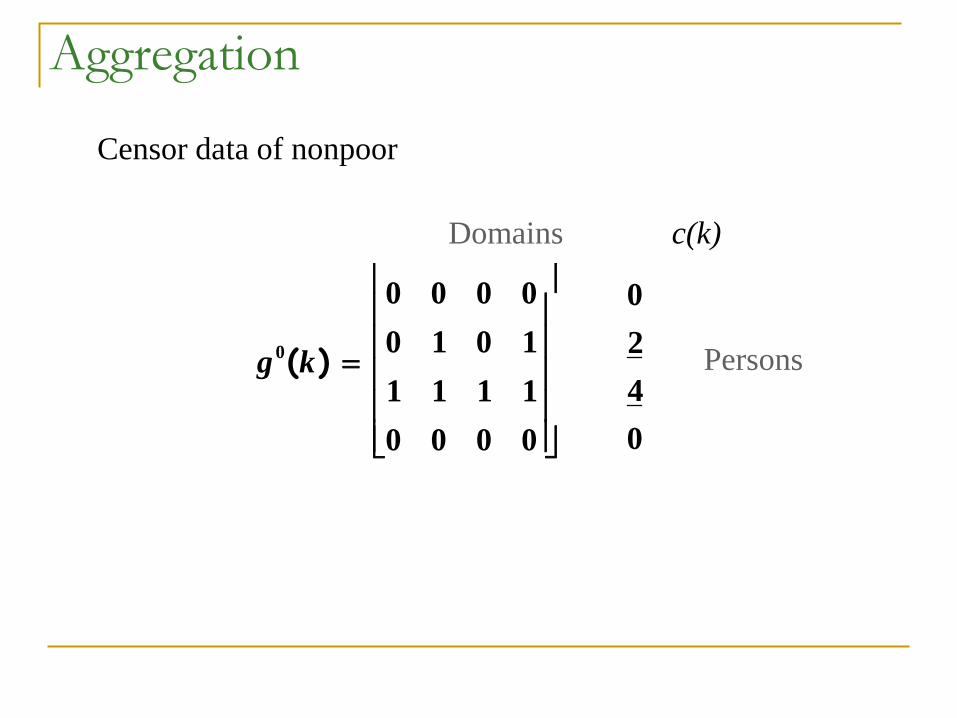
Aggregation
Censor data of nonpoor
Domains c(k)
Persons
g0(k) =
0 0 0 00 1 0 11 1 1 10 0 0 0
0240

Aggregation – Headcount Ratio
Domains c(k)
Persons
Two poor persons out of four: H = ½ ‘incidence’Critiques
g0(k) =
0 0 0 00 1 0 11 1 1 10 0 0 0
0240
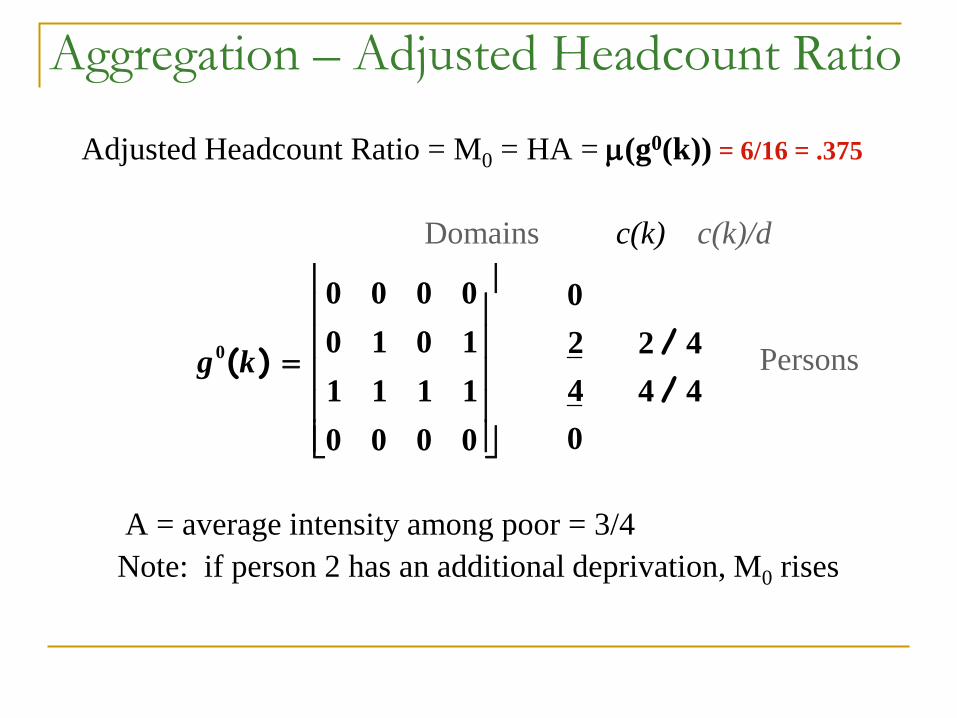
Aggregation – Adjusted Headcount Ratio
Adjusted Headcount Ratio = M0 = HA = µ(g0(k)) = 6/16 = .375
Domains c(k) c(k)/d
Persons
A = average intensity among poor = 3/4Note: if person 2 has an additional deprivation, M0 rises
g0(k) =
0 0 0 00 1 0 11 1 1 10 0 0 0
0240
2 / 44 / 4

Aggregation – Adjusted Headcount Ratio
ObservationsUses ordinal dataSimilar to traditional gap P1 = HI
HI = per capita poverty gap= headcount H times average income gap I among poor
HA = per capita deprivation = headcount H times average intensity A among poor
Decomposable across dimensions after identificationM0 = ∑j Hj/d - Hj are “censored” headcount ratios
If data are cardinal can extend to adjusted poverty gap and adjusted FGT

Aggregation: Adjusted FGT Family
Adjusted FGT is Mα = µ(gα(τ)) for α > 0
Domains
Persons
gα (k) =
0 0 0 00 0.42α 0 1α
0.04α 0.17α 0.67α 1α
0 0 0 0

Understandings and Misunderstandings
Concept of Poverty: Multiple deprivationsDepends on joint distribution
M0 = ¼ M0 = 0
Matrix 1 Matrix 2
=
4000
1111000000000000
0 g
=
1111
1000010000100001
0 g
Understandings and Misunderstandings
Data Requirements: Single survey sourcingDepends on joint distribution, need information on joint dist.Q: What if “best available data” are in different datasets?A: Not best available dataEx: Elasticity exercise with best available price data from one
source and best available quantity data from anotherEx: Unlinked expenditure surveys

Understandings and Misunderstandings
Data Requirements: Single survey sourcing
“surveys should be designed to assess the links between various quality of life domains for each person, and this information should be used when designing policies in various fields.”
(Stiglitz Sen Fitoussi 2009)

Understandings and Misunderstandings
Adjusted Headcount Ratio vs. MPI vs. HDI
Adjusted headcount ratio M0 – general methodologyMPI – a specific implementation for cross-country comparisonsHDI – not a poverty measure

Understandings and Misunderstandings
Underpinnings: Poverty and Welfare
Firmly rooted in axiomatic poverty analysisEvaluate methods via axioms satisfied and violatedMPI – a specific implementation
Adjusted headcount ratiocrude (like unidimensional headcount ratio) not directly linked to welfare (ditto) conveys tangible informationtransparent parameters

Understandings and Misunderstandings
Calibration: Who chooses the parameters?
Gonzalo Hernandez will comment on thisContext dependent

Extensions
Cutoffs over space and timeAbove used absolute cutoffs – fixed and givenYet can envision cutoffs (or variables) changing as aggregate
achievements are altered Some variables less elastic more absolute, more an endSome more elastic more relative, more a means
Options include Ravallion and Chen (2009), Atkinson and Bourguignon (2001) or Foster (1998)
Note: Loss of full decomposability of methodologyDecomposable after identification
Need further study of identification especially in the multidimensional environment