new dso data: a high stakes game - euler · pdf file1 euler hermes world agency webinar new...
TRANSCRIPT
1
Euler Hermes World Agency Webinar
New DSO Data:
A High Stakes Game
Speaker: Maxime Lemerle, Economic Research
Moderator: Ilan Goren, Economic Research
27th July 2017 16.00 CET

2
Maxime Lemerle joined Euler Hermes
in 1993 as a Credit Analyst for EH France,
specializing in the food and retail sectors.
He then moved to the Research team in 1999
before becoming Team Leader for global forecasts.
Maxime now leads cross-cutting sector and
insolvency research and is in charge of sector risk
ratings.
3
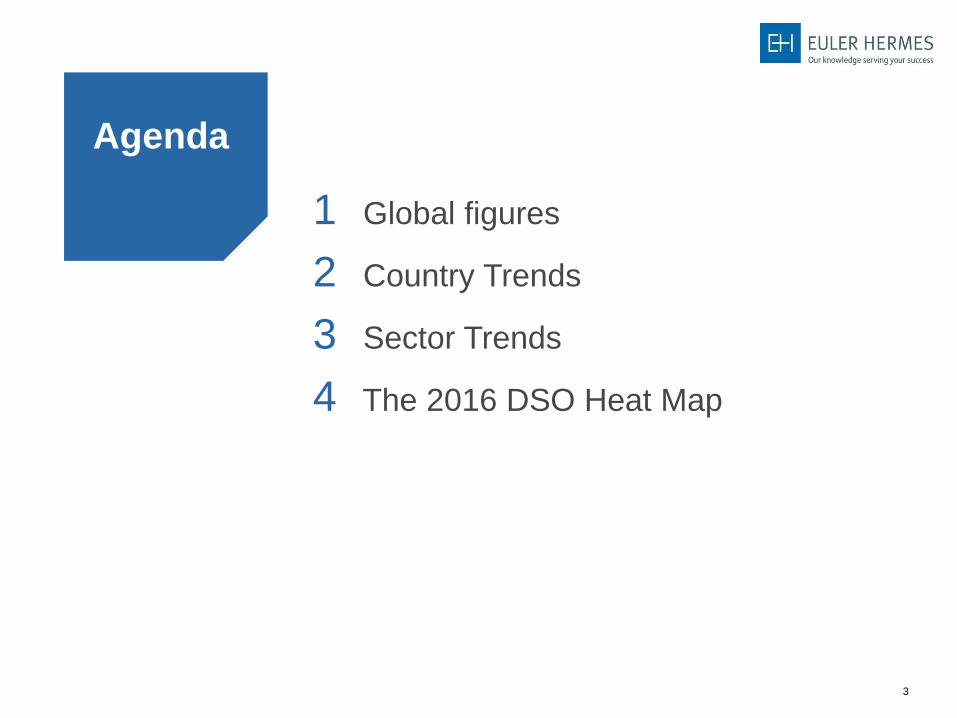
Agenda
1 Global figures
2 Country Trends
3 Sector Trends
4 The 2016 DSO Heat Map
4
1 Global figures
2 Country Trends
3 Sector Trends
4 The 2016 DSO Heat Map

5
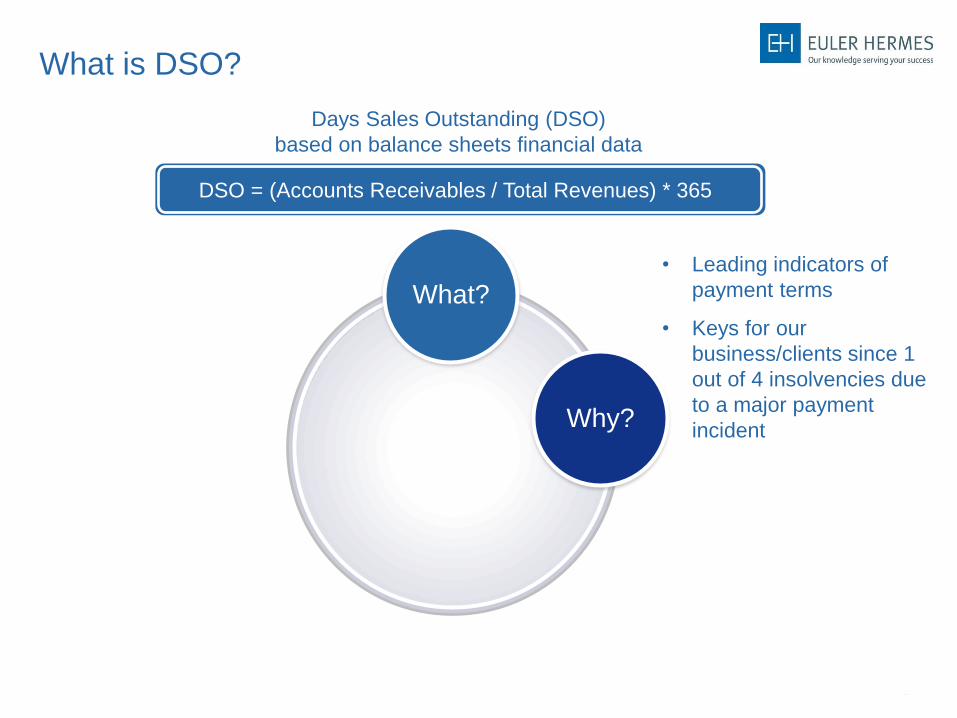
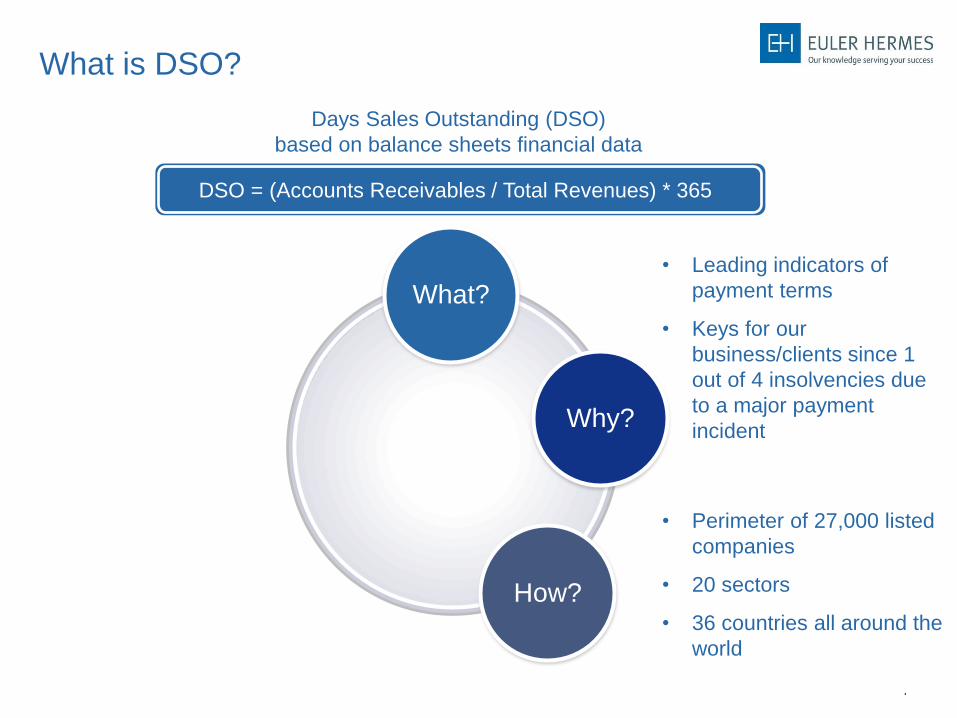
Days Sales Outstanding (DSO)
based on balance sheets financial data
• Systematic
updating on
a yearly
basis
What?
What is DSO?
DSO = (Accounts Receivables / Total Revenues) * 365
6
Days Sales Outstanding (DSO)
based on balance sheets financial data
• Leading indicators of
payment terms
• Keys for our
business/clients since 1
out of 4 insolvencies due
to a major payment
incident
• Systematic
updating on
a yearly
basis
Why?
What?
DSO = (Accounts Receivables / Total Revenues) * 365
What is DSO?
7
Days Sales Outstanding (DSO)
based on balance sheets financial data
• Leading indicators of
payment terms
• Keys for our
business/clients since 1
out of 4 insolvencies due
to a major payment
incident
• Perimeter of 27,000 listed
companies
• 20 sectors
• 36 countries all around the
world
• Systematic
updating on
a yearly
basis
Why?
How?
What?
DSO = (Accounts Receivables / Total Revenues) * 365
What is DSO?

8
Days Sales Outstanding (DSO)
based on balance sheets financial data
• EH’s Economic
Research Department
• Based on Bloomberg
database
• Systematic
updating on
a yearly
basis
Why?
How? Who?
What?
DSO = (Accounts Receivables / Total Revenues) * 365
What is DSO?
• Leading indicators of
payment terms
• Keys for our
business/clients since 1
out of 4 insolvencies due
to a major payment
incident
• Perimeter of 27,000 listed
companies
• 20 sectors
• 36 countries all around the
world

9
Days Sales Outstanding (DSO)
based on balance sheets financial data
• EH’s Economic
Research Department
• Based on Bloomberg
database
• Systematic
updating on
a yearly
basis
Why?
How? Who?
When?
What? • Yearly updates
DSO = (Accounts Receivables / Total Revenues) * 365
What is DSO?
• Leading indicators of
payment terms
• Keys for our
business/clients since 1
out of 4 insolvencies due
to a major payment
incident
• Perimeter of 27,000 listed
companies
• 20 sectors
• 36 countries all around the
world

10
Worldwide DSO average stable around 64 days…
Global steadiness of world average - Little fluctuation since 2012 around 64 days -
Slightly lower than pre crisis level – 2017 expected at 64 days
65.1
59.5
60.8
63.8
62.2
63.7
64.3 63.9 64.1 64.1 64.0
56
57
58
59
60
61
62
63
64
65
66
2007 2008 2009 2010 2011 2012 2013 2014 2015 2016 2017f
DSO- worldwide average (in number of days)
Sources: Bloomberg, Euler Hermes
11
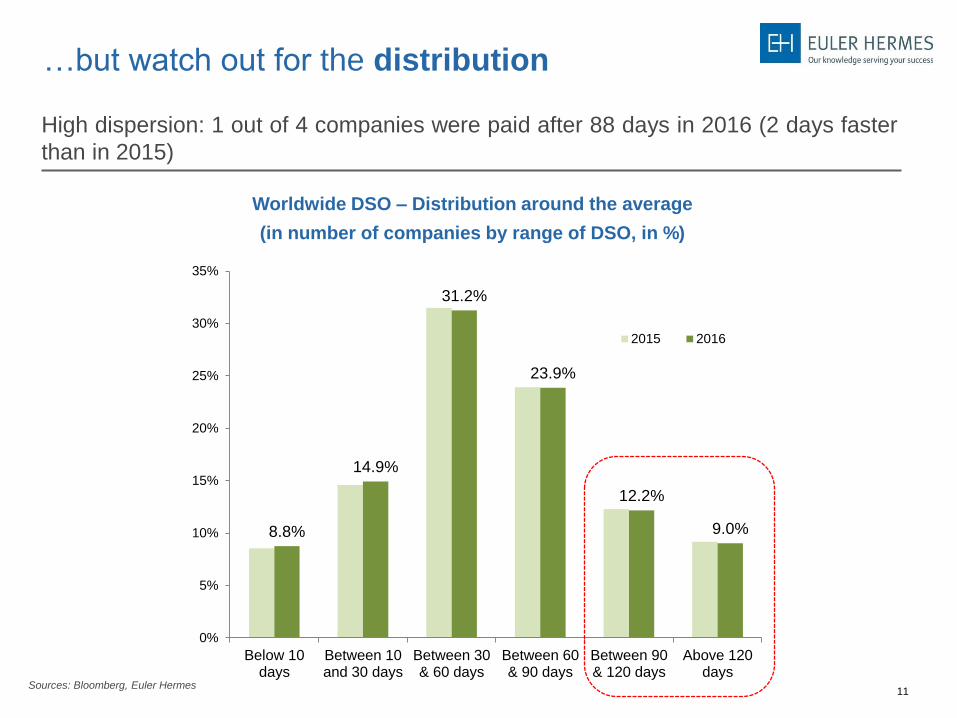
…but watch out for the distribution
High dispersion: 1 out of 4 companies were paid after 88 days in 2016 (2 days faster
than in 2015)
8.8%
14.9%
31.2%
23.9%
12.2%
9.0%
0%
5%
10%
15%
20%
25%
30%
35%
Below 10days
Between 10and 30 days
Between 30& 60 days
Between 60& 90 days
Between 90& 120 days
Above 120days
2015 2016
Worldwide DSO – Distribution around the average
(in number of companies by range of DSO, in %)
Sources: Bloomberg, Euler Hermes
12
1 Global figures
2 Country Trends
3 Sector Trends
4 The 2016 DSO Heat Map
13
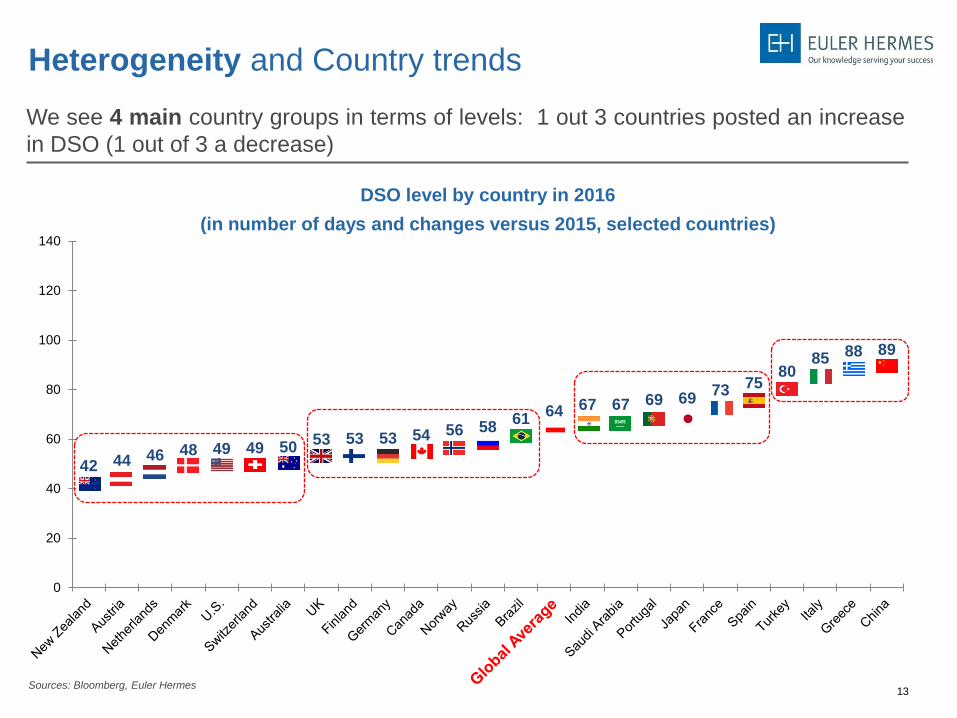
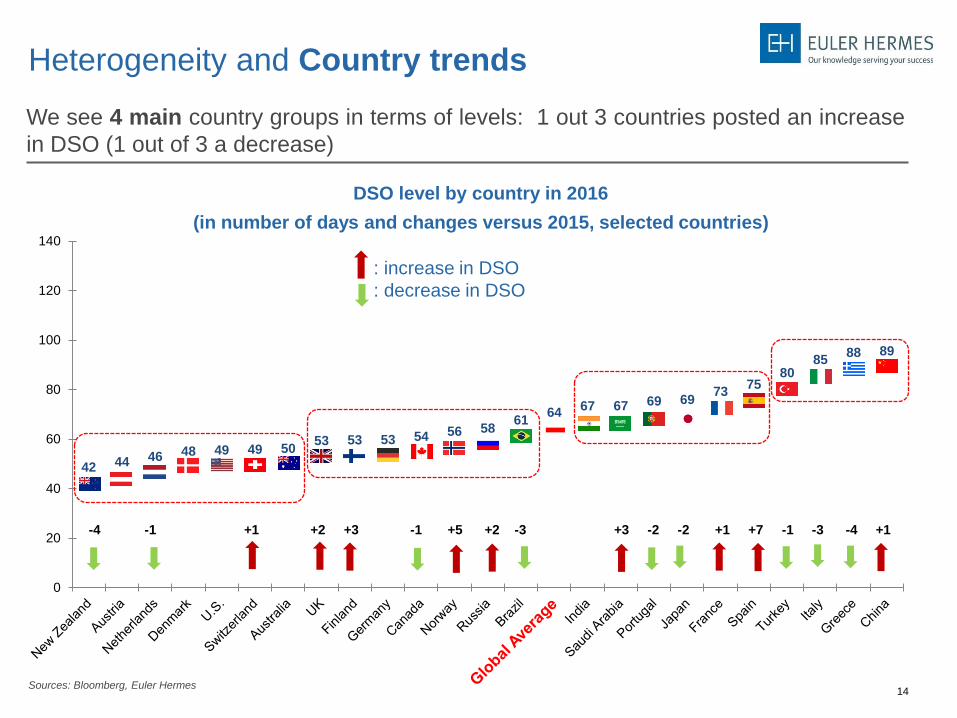
We see 4 main country groups in terms of levels: 1 out 3 countries posted an increase
in DSO (1 out of 3 a decrease)
DSO level by country in 2016
(in number of days and changes versus 2015, selected countries)
Heterogeneity and Country trends
42 44 46 48 49 49 50 53 53 53 54 56 58
61 64 67 67 69 69
73 75 80
85 88 89
0
20
40
60
80
100
120
140
Sources: Bloomberg, Euler Hermes
14
DSO level by country in 2016
(in number of days and changes versus 2015, selected countries)
42 44 46 48 49 49 50 53 53 53 54 56 58
61 64
67 67 69 69 73
75 80
85 88 89
0
20
40
60
80
100
120
140
Sources: Bloomberg, Euler Hermes
-4 -1 +1 +2 +3 -1 +5 +2 -3 +3 -2 -2 +1 +7 -1 -3 -4 +1
Heterogeneity and Country trends
We see 4 main country groups in terms of levels: 1 out 3 countries posted an increase
in DSO (1 out of 3 a decrease)
: increase in DSO
: decrease in DSO

15
Western Europe: a clear improvement in companies’ longest-delayed payments
(DSO above 90 days)
Focus 1: Western Europe
Sources: Bloomberg, Euler Hermes
DSO distribution across Western Europe for the share of DSO
exceeding 90 days

16
Focus 2: China
China has not succeeded in reducing outstanding payments (DSO above 120 days)
since at least 2015
DSO split in China between 2007 and 2016
(% of Chinese companies paid within a given time period, in number of days)
Sources: Bloomberg, Euler Hermes
17
53 55 59
65 65 65 67 73
66 70 71
68
82 77
88 90 91 96 97 98
94
112 114 120
133
18
33 38
33
24 28
22 24
31 31 26
33
22
35 31 31 32
40 40 44
34
43
55
49
37
42 44 46 48 49 49 50 53 53 53 54 56 58
61 64
67 67 69 69 73
75 80
85 88 89
0
20
40
60
80
100
120
140
25% of companies are paid after25% of companies are paid beforeAverage DSO in the country
From the smallest (Austria, Netherlands) to the largest dispersion (China)
DSO level and distribution by country in 2016
(in number of days, selected countries)
DSO distribution varies by country
Sources: Bloomberg, Euler Hermes

18
1 Global figures
2 Country Trends
3 Sector Trends
4 The 2016 DSO Heat Map

19
On average, upstream sectors (Electronics, Machinery and Equipment, Construction) have to
cope with higher DSO than sectors related to household consumables
A structural difference between B2C and B2B
Sector DSO on a global average ( 2016 level and change since 2012, in number of days)
27
46 46 46
51
56 56 58 59 60 61
64
68 69 71
73
80 82
87 88
0
1 1
0 0
3
0
1
-2
-7
3
0
8
4
3
-4
1 1
3
1
-8
-6
-4
-2
0
2
4
6
8
10
0
10
20
30
40
50
60
70
80
90
100
Change in
the n
um
ber o
f days
Num
ber
of days
2016 (lhs)
2016 vs. 2012 (rhs)
Sources: Bloomberg, Euler Hermes

20
From the smallest (Retail) to the largest range (Construction)
DSO level and dispersion by sector in 2016
(in number of days)
DSO distribution varies by sector
39
68
62 62 68
75 78
74 79 80 79
83 87 86
94 95
106
113 113 115
5
13
21 22
29 29
22
33 31 27
35 38
41 44 43 44
46
40
51 55
27
46 46 46 51
56 56 58 59 60 61 64
68 69 71 73
80 82 87 88
0
20
40
60
80
100
120
25% of companies are paid after25% of companies are paid beforeAverage DSO in the sector worldwide
Sources: Bloomberg, Euler Hermes

21
On a global basis, 8 sectors have registered an increase in Working Capital
Requirements (WCR). Aeronautics requires attention as both DSO (+8 days since
2012) and WCR (+16) are up
Compare DSO with Working Capital Requirements
Electronics
Retail
Other services
Oil & gas
Food
Metals
Pharma
Transportation
Auto
Telecom
Aero
Household goods
Construction
Chemicals
Business services
Technology
Machinery & eq
Utilities
Personal & recreational goods
Paper
-10
-5
0
5
10
15
20
-10 -8 -6 -4 -2 0 2 4 6 8 10
Sector DSO (x-axis) and WCR (y-axis) on a global average
( 2016 level versus 2015 level, in number of days)
Sources: Bloomberg, Euler Hermes

22
1 Global figures
2 Country Trends
3 Sector Trends
4 The 2016 DSO Heat Map

23
The 2016 Days Sales Outstanding Heat Map
Reta
il
Oth
er
serv
ices
Tra
nsport
ation
Food
Fin
ancia
ls
Tele
com
Pers
onal &
recre
ational
goods
Meta
ls
Utilit
ies
Household
goods
Oil
& g
as
Paper
Busin
ess
serv
ices
Aero
Auto
Chem
icals
Technolo
gy
Pharm
a
Constr
uction
Machin
ery
& e
q
Ele
ctr
onic
s
Countr
y a
vera
ge
New Zealand 14 23 36 49 23 39 38 51 34 50 20 - 46 - - - 75 70 38 57 68 42
Austria - 38 30 45 - - 27 39 47 - 73 - - - 33 - - - 42 48 - 44
Netherlands 7 47 34 49 103 - 35 - - 52 60 - 64 - - 53 54 - 43 51 55 46
South Africa 33 44 39 43 40 41 - 36 - 33 91 51 61 - - 60 74 74 50 60 55 48
Denmark 26 29 55 40 46 - 37 - 80 40 35 - 51 - - - 56 59 54 68 48 48
U.S. 21 39 34 34 52 37 42 42 52 38 55 37 54 52 53 54 59 63 53 58 59 49
Switzerland 15 26 22 43 - - 68 53 66 67 - 64 57 - - 89 60 64 53 54 64 49
Australia 23 52 36 51 46 44 53 37 40 56 47 69 57 44 50 54 59 81 58 57 70 50
United Kingdom 15 46 38 50 55 40 41 33 48 40 46 60 59 48 61 69 72 80 54 72 69 53
Finland 20 26 41 24 44 91 57 43 - 46 - 40 48 - - - 86 - 37 57 62 53
Germany 30 45 40 41 64 54 51 42 52 41 59 15 63 - 63 53 59 69 47 59 63 53
Canada 16 59 46 34 60 42 57 38 49 59 69 33 59 60 68 46 71 83 60 59 61 54
Sweden 24 43 30 34 34 35 64 53 46 42 37 43 65 60 40 72 74 63 60 65 62 56
Norway 6 34 36 51 80 33 - 51 37 - 73 - 55 - - 46 58 46 55 61 93 56
Poland 35 52 46 52 49 45 40 43 33 53 31 51 69 58 39 53 70 73 63 85 72 58
Russia 25 23 27 33 48 - 23 46 55 59 56 40 46 78 72 31 96 103 69 71 82 58
Bulgaria 68 25 52 46 71 - 50 42 58 67 51 60 15 - 63 72 - 59 98 73 42 59
Brazil 57 44 44 40 54 85 101 49 63 59 41 43 61 65 53 49 53 70 66 93 - 61
Hong Kong 30 42 45 41 30 33 55 55 52 60 83 59 70 - 80 69 69 97 67 108 90 63
Chile 65 73 59 61 55 67 62 56 60 77 - 31 58 - - 81 68 - 68 101 - 64
Belgium 43 57 60 57 114 62 45 30 125 - 72 - 85 - - 47 83 67 51 78 64 65
India 54 58 49 41 60 31 57 57 73 55 67 45 77 120 54 73 85 72 82 80 101 67
Saudi Arabia 19 51 60 49 81 99 - 56 - 53 - - 109 - - 69 - - 85 65 138 67
South Korea 36 51 48 47 55 60 56 72 65 58 53 65 49 59 68 65 67 104 69 84 67 67
Portugal 16 40 97 67 29 - - - 88 - - 48 - - - - 116 - 101 - - 69
Romania 42 18 66 82 36 - 29 48 58 51 68 54 79 57 58 63 - - 87 83 83 69
Japan 22 36 49 51 17 66 60 80 43 65 49 86 59 101 65 94 71 97 109 104 95 69
Taiwan 35 25 35 47 33 43 57 56 44 58 63 56 69 86 73 72 69 76 69 94 96 72
France 33 78 61 59 97 54 54 57 82 63 85 53 80 75 47 84 97 75 68 90 77 73
Singapore 35 28 66 47 46 38 78 72 66 72 98 84 79 76 78 83 82 68 90 92 87 73
Spain 21 62 - 62 47 52 76 51 51 56 100 59 69 - - - 88 93 125 115 - 75
Turkey 27 75 45 67 56 109 85 75 28 80 86 102 48 - 76 75 108 100 111 94 110 80
Morocco 61 79 - 58 98 - - 53 - - 41 - - - - - 140 96 80 - - 83
Italy 55 98 70 54 89 73 66 - 106 94 77 - 107 - 44 129 101 75 101 97 71 85
Greece 41 50 34 97 46 - 68 95 - 123 24 - 100 - - 90 99 - 117 116 - 87
China 20 51 48 38 34 48 60 72 49 73 115 94 86 142 111 80 112 96 112 130 136 89
Sector average 27 46 46 46 50 51 56 56 58 59 60 61 64 68 69 71 73 80 82 87 88 64
Sources: Bloomberg, Euler Hermes

24
Find more details in our report: eulerhermes.com/economic-research
Payment risk data and dynamic charts
mindyourreceivables.eulerhermes.com

25
Thank you for
your attention
26
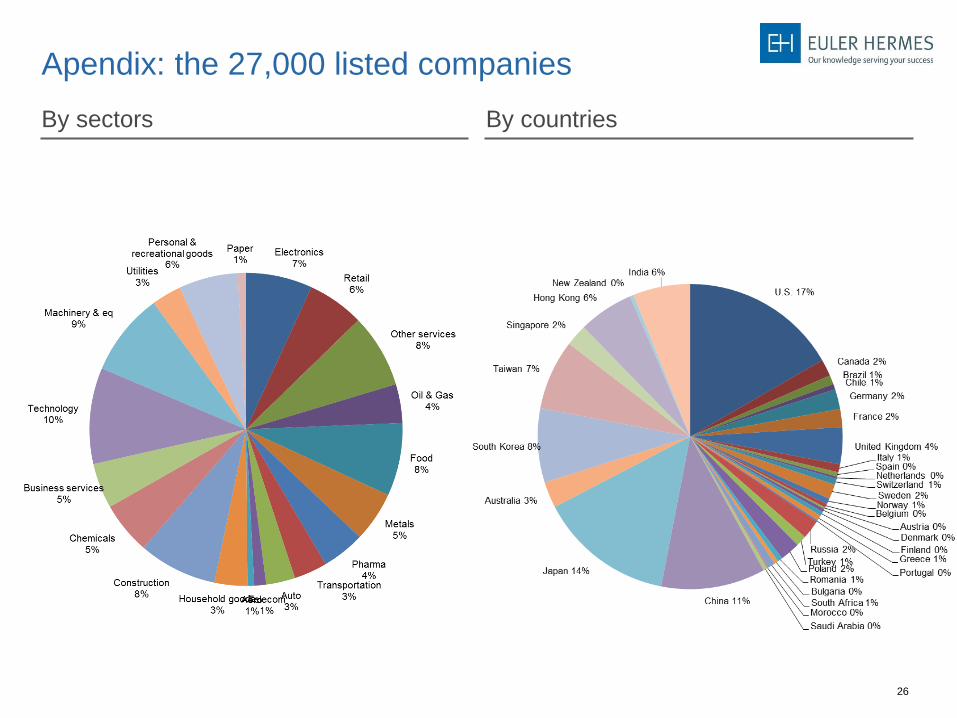
Apendix: the 27,000 listed companies
By sectors By countries