new england interstate wannalancit mills water...
TRANSCRIPT

New England Interstate Wannalancit Mills
Water Pollution Control 650 Suffolk Street, Suite 410
Commission Lowell, MA 01854-3694
Bulletin 82June2017
A Report On Federal & State Programs To Control Leaking Underground Storage Tanks
neiwpcc.org/lustline
L.U.S.T.LINE
It’s first thing Monday morning, October 15, 2018, about 18 months from now. Joe the UST operator gets an unexpected visit from Bob, local UST compliance inspector. Joe’s
been through this before and pulls out his records and gets his keys and tool box ready to impress the inspector. This story can go one of two ways: 1) In addition to his usual paperwork, Joe pulls out his 30-Day Walkthrough Inspection forms that he’s been filling out and the inspector, impressed, pats him on the back. Or 2) Joe gets a Notice of Violation for not having these forms because he’s never heard of them, or the rules, nor can he understand why it’s required or how to do it.
One of the more creative and useful things to come of the 2015 federal UST regulation is the idea of a periodic ground-level inspection of UST systems. By October 13, 2018, all owners/operators of the nation’s regulated USTs should have completed their first 30-Day Walkthrough Inspection. By that date, approximately 560,000 regulated USTs are to have been inspected and documented. Meanwhile, let’s try to answer some of the pertinent questions a Joe or Josephine UST operator might ask the inspector.
What Are the Benefits?There are some who might say this is just another useless regulatory requirement and a waste of time. But, as I see it, there are tremendous benefits associated with doing 30-day inspections—as long as they are done correctly. Benefits include:
• Heavily used equipment that is prone to degradation, damage, or malfunction is being inspected regularly.
• Small problems may be discovered before they turn into big ones.
Potential Impact of 2015 UST Regs
On the LUST Front
Leak Detection Geneology
Field Notes: PEI RP Updates
FAQs from NWGLDE
USEPA PVIScreen Model
Next New Thing in Petroleum Remediation
Verifying Insurance
Flexible Piping: Still Failing
Tanks on Tribal Lands
Benzene to Beer Trail
4
6
9
14
16
17
21
23
25
28
30
Inside
The 30-Day Walkthrough Inspection: What’s Not to Love?by Ben Thomas
■ continued on page 2

2
LUSTLine Bulletin 82 • June 2017
• Many items on the checklist are already being checked by law.
• UST operators end up with one 30-day document instead of many miscellaneous ones.
• Many companies regularly inspect their UST systems because it’s good risk manage-ment.
• After Class A/B tra ining certification, training information stays fresh as a result of doing repeatable actions.
• The possibility of spills, leaks, missed alarms, and fines is reduced.
Are There Any Known Hazards Associated with 30-Day Inspections?Given proper safety preparation, equipment, training, and some common sense, potential hazards are less likely. But even with proper safety equipment, working at an UST site has inherent risks like:
L.U.S.T.LineEllen Frye, Editor
Ricki Pappo, LayoutMarcel Moreau, Technical Adviser
Ronald Poltak, NEIWPCC Executive DirectorDrew Youngs, NEIWPCC Project Officer
Erin Knighton, USEPA Project OfficerLUSTLine is a product of the New England Interstate Water Pollution Control Commis-
sion (NEIWPCC). It is produced through cooperative agreements (US-83555901 and US-83556001) between NEIWPCC and the
U.S. Environmental Protection Agency.LUSTLine is issued as a communication
service for the Subtitle I RCRA Hazardous & Solid Waste Amendments
rule promulgation process. LUSTLine is produced to promote
information exchange on UST/LUST issues. The opinions and information stated herein are those of the authors and do not neces-sarily reflect the opinions of NEIWPCC.
This publication may be copied. Please give credit to NEIWPCC.
NEIWPCC was established by an Act of Congress in 1947 and remains the old-
est agency in the Northeast United States concerned with coordination of the multi-
media environmental activities of the states of Connecticut, Maine, Massachusetts, New Hampshire,
New York, Rhode Island, and Vermont.NEIWPCC
Wannalancit Mills650 Suffolk Street, Suite 410
Lowell, MA 01854Telephone: (978) 323-7929
Fax: (978) [email protected]
LUSTLine is printed on recycled paper.
• Traffic safety hazards• Exposure of skin and eyes to
liquid petroleum• Injuries related to opening access
points• Not knowing how to perform
inspections properly• Missing or misidentifying poten-
tial hazards• Improper disposal of contami-
nated waste• Allowing rain, sleet, and snow
to get into sumps, buckets, and risers.
What Must Be Inspected?The walkthrough covers three principle areas at an UST site—tank pad area, voltage rectifier, and tank gauge and/or release detection equipment. An UST operator must inspect all of the components on the following lists during the walkthrough inspection, unless it is not present or applicable to his or her UST system. So like many things in UST compliance, there is no one-size-fits-all inspection form.Tank Pad Area
• Riser covers• Spill buckets• Drop tubes• Tank gauge sticks• Water in tank (with stick)• Vents• Dual-point vapor recovery• Monitor wells
Voltage Rectifier
• Impressed current volt and amp readings
Tank Gauge and/or Release Detection Equipment
• 0.2 GPH 30-day leak test• Water in tank (with ATG)• Tank and piping interstitial
results (printout or log)• SIR or Inventory control and
reconciliation results• Soil vapor or groundwater
monitoring results (MO, LA, and MS)
Who Performs the Inspection?The federal rules are silent as to who can do the inspection. Possibilities include:
• Qualified third-party contractors (e.g., UST testers and services providers)
• Trained Class A/B UST operators• Anyone with sufficient knowl-
edge, skill, and experience.
Check with your state, local, or tribal agency to see what the mini-mum requirements include.
Which Form Is Required?Federal law provides for three options:
• Items listed in the revised UST rules in 40 CFR 280
• A standard code of practice (only one out there folks: PEI/RP900)
• A standard form adopted by your implementing agency.
Check with your state, local, or tribal UST agency for the answer. However, many states may end up adopting the PEI/RP900: UST Inspec-tion and Maintenance. UST opera-tors are welcome to download these forms free of charge at http://www.pei.org/rp900. California North DakotaColorado New MexicoConnecticut New YorkDelaware New JerseyGuam Puerto RicoIllinois (Quarterly) TexasUtah VermontMaine MassachusettsMinnesota WisconsinNew Hampshire Wyoming
What If I’m Already Doing the Inspections Prior to the Deadline?Basically, then you’re awesome.
ASTSWMO recently surveyed the states and of the 34 that replied, the following states already require walkthrough inspections.
If I Do the 30-Day Inspection Must I Also Do Daily and Annual Inspections?For better or worse, the final USEPA rules have a little wrinkle in the language that effectively says if you adopt a nationally recognized standard like PEI/RP900, you must use the whole thing. “The whole thing” means not only using the 30-day form but the Daily and Annual form as well. Daily and
■ 30-Day Walkthrough Inspection from page 1
3
June 2017 • LUSTLine Bulletin 82
What’s This 30-Day Versus Monthly Thing I Keep Hearing About?Is a 30-day inspection requirement the same as monthly? Not exactly. For an exact interpretation, it depends on the state or even the inspector. Fed-eral law got the 30-day ball rolling back in 1988 when the rules stated release detection must be done every 30 days so the day count versus the monthly thing goes back into regula-tory history. Technically it’s 30 days. PEI calls it monthly.
Suggestion: Inspect every 28 days.
Some Practical Advice for Operators
• Determine which state rules apply.
• Figure out what’s the best form to use.
• Designate a properly trained staff person to perform the inspections.
• Determine which parts of the inspection are applicable to your UST site.
• Dec ide whether you wi l l record your inspection results electronically or on paper.
• Start practicing tomorrow if you’re not already doing it.
• Make sure you keep awesome records.
• Set up a written process for follow up on any problems noted during your walkthrough inspection.
annual inspections are a whole other story for another LUSTLine article.
What Might I Find During My Inspection That Could Be a Problem?Real life problems can include:
• Damaged spill bucket, drain, or liquid in the spill bucket
• Incorrectly labeled or damaged covers
• Gauge stick permanently lodged in the drop tube
• Excessive water in the tank• Missing or broken gauge stick• Tank gauge in alarm or without
power and paper or with burned out bulbs
• Incomplete or missing release detection records
• Damaged or missing vent cap• Rectifier disconnected or readings
missing or showing a problem• Monitor well cap not marked or
not secured or damaged• Stage I vapor recovery poppet
damaged or cover not properly marked.
How Long Does an Inspection Take?Five to thirty minutes is what I com-monly hear when I ask a roomful of folks already doing it. It can depend largely on how many tanks you have, how accessible the UST system is, the weather or time of year, the
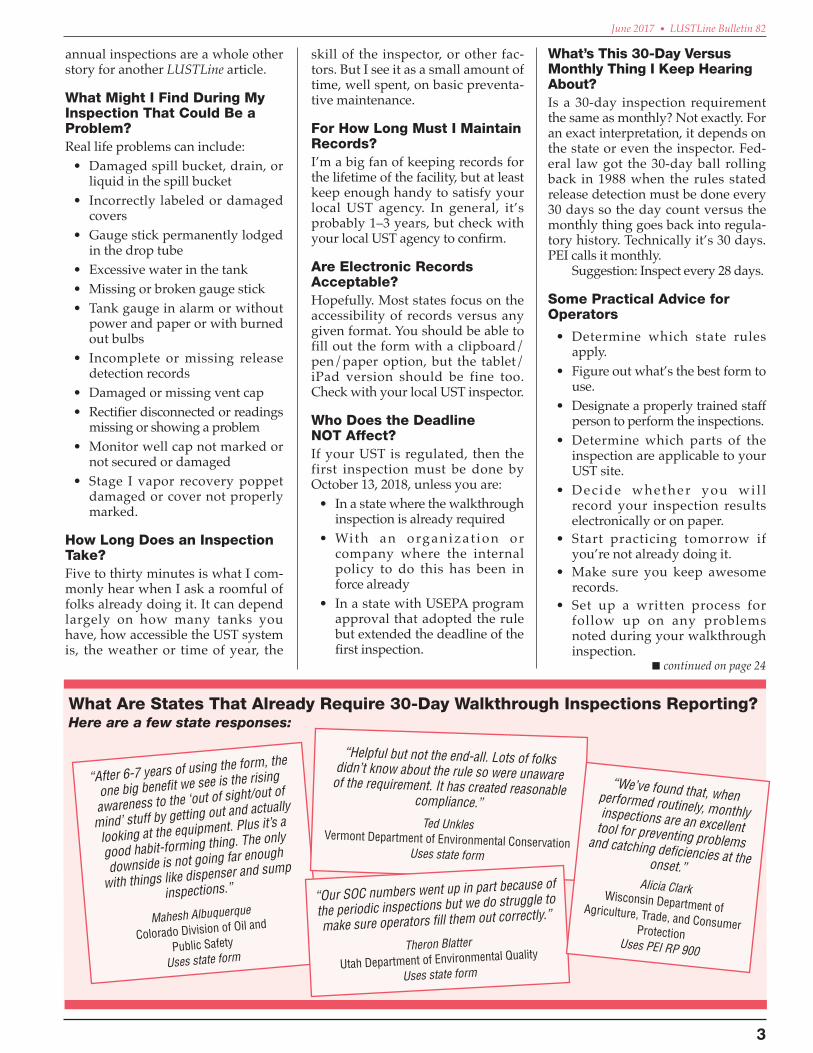
“After 6-7 years of using the form, the
one big benefit we see is the rising
awareness to the ‘out of sight/out of
mind’ stuff by getting out and actually
looking at the equipment. Plus it’s a
good habit-forming thing. The only
downside is not going far enough
with things like dispenser and sump
inspections.”
Mahesh Albuquerque
Colorado Division of Oil and
Public Safety
Uses state form
“Helpful but not the end-all. Lots of folks didn’t know about the rule so were unaware of the requirement. It has created reasonable compliance.”
Ted Unkles Vermont Department of Environmental Conservation
Uses state form
“Our SOC numbers went up in part because of
the periodic inspections but we do struggle to
make sure operators fill them out correctly.”
Theron Blatter
Utah Department of Environmental Quality
Uses state form
■ continued on page 24
“We’ve found that, when performed routinely, monthly inspections are an excellent tool for preventing problems and catching deficiencies at the onset.”Alicia ClarkWisconsin Department of Agriculture, Trade, and Consumer Protection
Uses PEI RP 900
What Are States That Already Require 30-Day Walkthrough Inspections Reporting?Here are a few state responses:
skill of the inspector, or other fac-tors. But I see it as a small amount of time, well spent, on basic preventa-tive maintenance.
For How Long Must I Maintain Records?I’m a big fan of keeping records for the lifetime of the facility, but at least keep enough handy to satisfy your local UST agency. In general, it’s probably 1–3 years, but check with your local UST agency to confirm.
Are Electronic Records Acceptable?Hopefully. Most states focus on the accessibility of records versus any given format. You should be able to fill out the form with a clipboard/pen/paper option, but the tablet/iPad version should be fine too. Check with your local UST inspector.
Who Does the Deadline NOT Affect?If your UST is regulated, then the first inspection must be done by October 13, 2018, unless you are:
• In a state where the walkthrough inspection is already required
• With an organizat ion or company where the internal policy to do this has been in force already
• In a state with USEPA program approval that adopted the rule but extended the deadline of the first inspection.

4
LUSTLine Bulletin 82 • June 2017
It Gets Worse Before It Gets Better?While all these presentations were very informative, one that I kept thinking about on the way back home was a presentation by Mike Frank from the State of Maryland. Mike talked about his experience implement ing a spi l l bucket and containment-sump testing requirement they adopted in 2005. One of his lessons learned was the high failure rates associated with initial testing of this equipment. He said that most spill buckets failed the first round, and a fair amount of the containment sumps had to be repaired before they could even be tested.
High failure rates by themselves were no big surprise. It’s almost intuitive that equipment that hasn’t been tested for functionality since its installation years or sometimes decades ago will likely fail. After all, this equipment was never designed to last forever. What haunted me, however, were the outcomes following the testing failures, not just the repair
revised UST regulation, I met with my team and we looked for data related to spill bucket and containment testing failure rates and associated cleanup costs. We wanted to estimate the impact the new requirements would have on our program workload and our PSTF. We began with our own data. We had about 7,000 regulated USTs at 2,800 facilities. Under our new rules all 2,800 facilities would have to test their spill buckets in three years (by January 1, 2020), and some 900 facilities that use interstitial monitoring would also need to have their containment sumps tested.
We then looked at reported releases at these facilities. A query of our database indicated that 60 percent of our 2,800 active UST facilities have already had reported releases and some assessment or cleanup. That meant 40 percent of the facilities that will be subject to the new spill bucket testing have never had a reported release or any previous environmental assessment. When we
Mahesh Albuquerque, Director of the Colorado Division of Oil and Public Safety, is on the lookout for articles from creative thinkers and experts willing to share ideas, insights, and stories on a wide variety of issues related to underground storage tanks. Topics include policy, strategy, successes, failures, and lessons learned. “Now that we have been regulating USTs for 30 years,” says Mahesh, “my hope is that this column will help stimulate readers to ‘think outside the tank,’ to
ponder why we do what we do, and to consider and share creative ways to improve our effectiveness—as we strive toward environmental pro-tection.” Mahesh can be reached at [email protected].
A Thoughtful Column Engineered by Mahesh Albuquerque
A Heads Up? Potential Impact of 2015 UST Regulations on Cleanups and State Funds
A couple of years ago I attended a timely and informative ASTSWMO Tanks Regulation Forum focused on the long-awaited 2015 revisions to USEPA’s UST regulations. There was a feeling of excitement and anticipation about implementing the new requirements that strengthen the almost 30-year-old UST regulations through increased emphasis on properly
operating, maintaining, and periodically testing certain UST equipment. There was a sense of hope that these new requirements would result in improved release prevention, earlier detection, and eventually smaller cleanups.
We heard perspectives on the new testing and inspection requirements from the regulated community through representatives from the Petroleum Marketers Association of America (PMAA), the American Petroleum Institute (API), and contractors. We also heard what states were doing to adopt and implement the new regulations, and learned lessons from states that had already adopted some of the testing requirements.
or replacement of the containment, but the petroleum releases associated with each failure. The hypothesis I formed was simple: As we begin testing containment we will likely encounter high failure rates, resulting in the discovery of many new releases that will require investigation and cleanup, and thereby place additional burdens on our petroleum storage tank fund (PSTF).
This isn’t exactly the anticipated impact I was hoping for or expecting wi th implement ing the new regulations. I was expecting the trends we have seen nationally in the tanks program over the last decade—reduction in cleanup backlog, higher operational compliance and fewer new releases—to continue. Sometimes things get worse before they get better, and I think this is exactly what we will see as we implement the new UST regulations.
Show Me the DataSo last year before we prepared to implement our adopted USEPA

5
June 2017 • LUSTLine Bulletin 82
looked at just those 900 facilities that would require containment testing this percentage was slightly higher (50%), which made sense as most of the UST systems that use interstitial monitoring were installed within the last decade, usually at newer facilities.
What Do We Know about Spill Bucket Failure Rates?Years ago I read that CROMPCO, a reputable UST system testing company, started a pilot project in 1995 to test the integrity of spill buckets. They vacuum tested over 10,000 spill buckets and reported failure rates of around 60 percent.
We looked at data from a large national convenience store chain that replaced spill buckets at 115 of their stores in Colorado less than ten years ago. They reported spill bucket failures and associated releases at a whopping 70 percent of the stores where their replacements occurred, and sought reimbursement from our PSTF for 30 percent of these releases. The associated assessment and cleanup costs for these 24 stores with releases ranged from $17,000 to $638,000, with a median of $98,000. Our PSTF has reimbursed slightly over $3.8 million for these 24 sites with an average reimbursement award of $161,000 per site.
Based just on these two sources of data, we believe between 60 to 70 percent of the spill buckets will fail integrity testing and result in the discovery of releases that will need assessment and cleanup.
What about Containment Testing?The containment testing failure rates are expected to be lower. I had seen a presentation by Tanknology, another reputable UST system testing com-pany, that when California began its SB-989 Secondary Containment Test-ing program in 2002 they encoun-tered failure rates of around 25 to 30 percent for submersible turbine pump (STP) containment and under-dispenser containment (UDC) respec-tively. Initial failure rates were higher until repairs were made prior to test-ing, similar to what Mike Frank said about his experience in Maryland.
In Colorado only about a third of our UST facilities will be subject to the three-year containment testing requirement. If we assumed a 25
percent failure rate, it would result in the discovery of 231 releases that would need assessment and cleanup.
What Does This All Mean to Our Program?It’s a no brainer that we will have high failure rates associated with initial spill bucket and containment testing. Many of these failures will result in the discovery of releases to the environment, and the costs for these cleanups will put a strain our reimbursement fund. The impact from spill bucket testing will be significantly greater than that associated with UDC or STP containment testing. So let’s do the math to find out the anticipated impact.
In Colorado we have 2,800 active UST facilities, if we assume a 60 percent failure rate on spill bucket testing there would be 1,700 associated releases needing assessment and cleanup. Now assuming only 30 percent or 510 facilities apply for reimbursement from our fund, at an average cleanup cost of $161,000, that’s around an $82 million impact. We all know that cleanups take time, so if we assume an average time to closure of five years, and spread out that cost, the annual impact to our fund would be around $16.4 million. If everyone waited till 2019 to do their first three-year spill bucket testing, the $16.4 impact to our fund in 2020 would be huge. Was there a way to defray these anticipated costs over a longer time period?
Any Early Takers?So, when we adopted our new UST regulations that took effect this year and require the three-year testing to be completed before January 1, 2020, we also announced that $2 million was set aside in our PSTF
this year for distribution in the form of financial incentives ranging from $7,500 to $10,000 per facility for early testing and upgrade of equipment. It really does not make sense to wait to test. Not only will there be a shortage of contractors available to do the work, but as with any supply and demand issue, the cost for the service will likely go up. We hope our financial incentives will motivate some owners to test and upgrade early, thereby helping spread out the impact to our cleanup program and our PSTF to more practicable amounts even before 2020.
This year we also launched a new Registered Environmental Professional (REP) program for environmental consultants that work with our tank program. The REP program that takes effect January 1, 2018 will hold consultants to a higher standard of quality while giving them more decision-making autonomy, enabling them to move release sites from initial assessment to closure more efficiently and effectively. Our hope is that this will not only result in better utilization of our cleanup program staff, even in the midst of a flurry of new releases, but also that it will help reduce overall time to closure and associated cleanup cost.
What Can You Expect? As your state begins implementing the revised regulations, expect a high percentage of containment sumps and spill buckets to fail their first three-year test. Confirmed releases will be associated with an equally high percentage of this failed equip-ment. Expect the number of sites needing cleanup to rise significantly as you implement the new require-ments, and the cleanup of these releases to place a significant burden on your existing storage tank reim-bursement fund.
You can do the math yourself. If you can implement creative ways to defray these costs that’s great. How-ever, don’t despair or lose sight of our environmental protection mis-sion—by finding and addressing these releases we are heading in the right direction, and the new testing requirements will result in better release prevention, earlier detection, and eventually smaller and cheaper cleanups. ■
It really does not make sense to
wait to test, not only will there
be a shortage of contractors
available to do the work, but
as with any supply and demand
issue, the cost for the service will
likely go up

6
LUSTLine Bulletin 82 • June 2017
State, territorial, and tribal underground storage tank (UST) programs play an
integral role with USEPA in preventing UST releases, detecting releases early, and cleaning up releases when they do occur. Surely you’ve heard me say that I am quite proud of USEPA’s partnerships with states, territories, tribes, industry, and other tank stakeholders. The UST program’s founders built the UST program on the premise that our partnerships are the most effective way to address USTs in the United States.
We do our best to listen to you—our partners—and provide you with useful and timely documents and information to help you do your job. Many times we heard from you about your needs, and we responded by developing documents, setting up webinars, or facilitating discussions among you and your peers. Let me interject a quick shout-out to both NEIWPCC and ASTSWMO—two of our grantees—who have assisted USEPA in so many aspects of developing and providing timely and useful leaking UST (LUST) information to our state, territorial, and tribal partners.
In this issue of LUSTLine, I tell you about various LUST resources we developed and how to access them, as well as share what I see on the horizon in the way of LUST documents and information sharing.
LUST Documents and Resources Released Over the Last YearUSEPA worked diligently over the past year or so to develop technical
documents and webinars about clean-ing up UST releases. Below are docu-ments we developed and efforts we undertook to help you, our LUST stake-holders. n Updated direct-push technologies
in chapter V of our Expedited Site Assessment Tools for Underground Storage Tank Sites: A Guide for Regulators (EPA 510-B-16-004, October 2016) document. This updated chapter discusses the fundamental elements of direct push, such as direct-push rod systems, sampling equipment, specialized probes, methods for advancing rods, and methods for sealing direct-push holes. Each section in the chapter explains the applications, as well as the advantages and limitations of the various tools and technologies.
Direct-push technologies help in assessing sites more quickly and can be more cost effective than con-ventional site assessment methods. Originally issued in 1997, the entire document discusses the expedited site assessment process, which is a framework for rapidly characterizing UST site conditions for corrective action decisions. https://www.epa.gov/ust/expedited-site-assessment-tools-underground-storage-tank-sites-guide-regulators.
n Added enhanced anaerobic oxi-dative bioremediation, chapter XIV, and revised the introduction and glossary of our How to Evalu-ate Alternative Cleanup Technolo-gies for Underground Storage Tank Sites: A Guide for Corrective Action Plan Reviewers (EPA 510-B-16-005,
November 2016) document. This new chapter contains informa-tion to help users evaluate a cor-rective action plan that proposes enhanced anaerobic oxidative bioremediation. In the chapter, we explain the anaerobic biodeg-radation process, discuss the advantages and disadvantages of the enhanced anaerobic oxida-tive bioremediation technology, list key parameters for evaluat-ing whether the technology is appropriate at a site, and provide checklists to aid in review of a corrective action plan.
E n h a n c e d a n a e r o b i c b i o -remediation works more slowly than enhanced aerobic bioreme-diation and is often used as a pol-ishing step or in combination with other cleanup technologies. Orig-inally issued in 1994 and updated several times since, the entire document helps users review corrective action plans that pro-pose alternative cleanup tech-nologies at LUST sites. https://www.epa.gov/ust/how-evaluate-alternative-cleanup-technologies-underground-storage-tank-sites-guide-corrective.
n Issued Long-Term Stewardship at Leaking Underground Stor-age Tank Sites with Residual Contamination (EPA 510-K-17-001, February 2017) document. This document provides state and territorial UST cleanup pro-grams with information on what other state programs are doing with their long-term steward-ship programs and suggestions
A Message from Carolyn Hoskinson Director, USEPA’s Office of Underground Storage Tanks
On The LUST Front: What We’ve Done and What’s on the Horizon
7
June 2017 • LUSTLine Bulletin 82
for developing or enhancing their long-term stewardship programs. The document includes an over-view of long term stewardship at leaking UST sites with residual contamination; components of long-term stewardship; propri-etary, government, and informa-tion approaches to long-term stewardship; tips for achieving long-term stewardship; and state resources regarding long-term stewardship. https://www.epa.gov/ust/long-term-stewardship-leaking-underground-storage-tank-sites-residual-contamination
n Hosted a key LUST research projects webinar, in conjunction with USEPA Office of Research and Development, that provided a high-level overview of key research projects in various LUST-related areas (e.g., petroleum vapor intrusion, monitored natu-ral attenuation, fuel composition). Our LUST partners and stakehold-ers were the main audience for the webinar. https://www.epa.gov/ust/lust-research-projects-webinar.
n Hosted a petroleum brownfields UST revitalization efforts webi-nar for states and other inter-ested stakeholders. This first in a series of webinars aimed to highlight the role revitalization plays in addressing abandoned or orphaned sites in our LUST back-log. The webinar was part of our efforts to share successful prac-tices with our LUST partners and stakeholders, as well as provide useful insights and opportunities to identify transferable practices. Featured speakers from Indiana’s Finance Authority and Colorado’s Division of Oil and Public Safety, discussed their approaches to cleaning up and revitalizing LUST sites. Topics included: important considerations, keys to success, incentives, leveraging resources, measuring return on investment, and success stories. https://www.epa.gov/ust/revitalization-webi-nars.
n Hosted a quarterly conference call in conjunction with ASTSWMO r e g a r d i n g U S T f i n a n c i a l responsibility mechanisms for state and territorial UST fund managers and staff, as well as representatives of private financial responsibility mechanisms such as insurance. This conference call series provides a forum for states to connect with other states and USEPA regarding state fund and financial responsibility issues of interest. In addition to hosting this call in February 2017, we hosted similar webinars in June and November 2016. For more information, contact Jill Williams-Hall at [email protected] or 202-564-0592.
On the Horizon: Upcoming LUST Documents and Resources Together, we have lots more work to do as we reduce the backlog of approxi-mately 71,000 UST releases remaining as of September 2016. Reducing the backlog remains a key priority for the national UST program, and states and USEPA are continuing our steady prog-ress on this effort. With that in mind, we are developing additional resources to help states address UST releases that remain to be cleaned up. Below are some examples of what’s coming. n A horizontal wells appendix will
become part of our How to Evalu-ate Alternative Cleanup Tech-nologies for Underground Storage Tank Sites: A Guide for Correc-tive Action Plan Reviewers. The horizontal wells appendix will pro-vide additional technical direction to remediation professionals who oversee environmental cleanups and review LUST corrective action plans. Drilling horizontal wells, while not a treatment technology in its own right, is an alternate mechanism of delivering remedia-tion reagents and amendments to the subsurface. UST remediation professionals and other users can expect to see the horizontal wells
appendix added to our guide at the end of 2017.
n The PVIScreen is an easy-to-use model for simulating petro-leum vapor intrusion (PVI). This model will aid users in assessing the potential for PVI into build-ings. Developed primarily for state, tribal, and USEPA regional LUST personnel, we think oth-ers, such as consultants, con-tractors, responsible parties, industry, academia, and the public may also find this model useful. Assessing PVI can be expensive. Using a screening model like PVIScreen can save money and time, as well as pro-vide more certainty in assessing potential risk. The PVIScreen is a collaboration between OUST and USEPA’s Office of Research and Development. (See article on PVIScreen on page 17.)
n The technology transfer re– mediation report will identify and summarize groundwater monitoring considerations for assessing the performance of in situ technologies involving amendments and reagents. In addition to addressing several amendments and reagents, the report will address two amend-ments that are particularly rel-evant to the LUST universe of sites: activated carbon-based injectates and in situ chemical oxidation. The report will pro-vide remedial project managers and other cleanup professionals with information on groundwater monitoring issues when reagents and amendments are present; it will propose ways to ensure that the accuracy of subsequent sampling and analysis is not impacted. OUST and USEPA’s Office of Superfund Remedia-tion and Technology Innovation are collaborating on this report, which is now undergoing peer review.
n Periodic webinars and confer-
A Message from Carolyn Hoskinson…continued
■ continued on page 8

8
LUSTLine Bulletin 82 • June 2017
OOPS…In LUSTline Bulletin #80 (June 2016), Marcel Moreau’s Tank-nically Speaking article titled, “Whack-a-Leak – The Holes in Our Leak Detection,” contained two errors. In the por tion of this article titled, “The Ability of Large Leaks to Fool Continuous ATG Leak Detection,” Moreau writes that a fuel level change that exceeded a rate of a gallon an hour would be interpreted by a continuous ATG as fuel dispensing activity rather than a leak. He should have written that when the level change exceeded a gallon a minute the ATG would interpret the activity as fuel dispensing. There are five references to a “gallon per hour” leak rate in the article that should be changed to “gallon per minute.” He also wrote that the largest leak rate that must be simulated when evaluating continuous ATGs using the CITLDS protocol was 0.3 gallons per hour. This is also incorrect. The largest leak rate simulated using the CITLDS protocol is 10 gallons per hour. These corrections have been made in the online edition of LUSTline, but those of you who rely on the print version should be aware of these errors. We apologize for the confusion. ■
USEPA OUST has published a new document titled Long-Term Stewardship at Leak-
ing Underground Storage Tank Sites with Residual Contamination (EPA 510-K-17-001). It highlights the dif-ferent ways state UST cleanup pro-grams protect human health and the environment from LUST sites with residual contamination long after the cleanup phase is completed. State UST programs can use this docu-ment as both a means of learning what other states are doing in this area and a useful resource for those wishing to develop a long-term stew-ardship program or enhance an exist-ing one. OUST created this document as part of a larger effort to support state cleanup programs. You can access the document at https://www.epa.gov/ust/long-term-stewardship-leaking-underground-storage-tank-sites-residual-contamination.
Long-term stewardship is a broad concept that encompasses overall site management responsi-bilities to minimize exposure to con-tamination and protect the integrity of response actions. Examples of long-
term stewardship activities include implementing and maintaining physi-cal or engineering controls and legal or institutional controls; using infor-mation and data tracking systems to share information; monitoring and enforcing controls; and obtaining resources to implement controls for the life of a remedy. The information presented in this document draws from a 2014 survey and 2015 report developed by the Association of State and Territorial Waste Management Officials as well as USEPA research and guidance.
You will f ind a myriad of approaches to long-term steward-ship and a bountiful buffet of state examples, including links to guid-ance, sample forms and templates, outreach materials, and a variety of GIS and information systems that list and locate LUST sites with residual contamination. If you have questions or comments concerning the docu-ment or would like to share additional examples and successes relating to long-term stewardship, contact Ste-ven McNeely at [email protected]. ■
New Long-Term Stewardship Publication from OUST
A Message from Carolyn Hoskinson…continued from page 7
ence calls will cover LUST subjects such as UST financial responsibility mechanisms, petroleum brown-fields, and technical topics such as PVIScreen and light non-aqueous phase liquid (LNAPL) conceptual site modelling. USEPA or NEIWPCC will serve as hosts for the webinars.
n Our collaboration with the In ters ta te and Technology Regulatory Council (ITRC) key stakeholders and other partners will continue. We are participating in ITRC’s efforts to develop guidance documents on LNAPL and total petroleum hydrocarbons (TPH) risk. The goal of the LNAPL document is to ensure consistency in the conceptualizations and recommendations of contaminant
fate and transport behavior. The TPH risk evaluation document will assist remediation project managers in evaluating risk at TPH-contaminated sites in a consistent manner across the United States. You can expect to see these documents published sometime in 2017 and 2018.
Next StepsYou well know that we often have to make difficult decisions as to the projects we undertake. But one of our guiding principles has been and continues to be listening to our partners, hearing what we can do to help you, and—given our constraints—providing you with useful and informative documents and resources,
which help you do your job. As always, I appreciate hearing
from you about what USEPA’s UST program can do to help and empower you, so you can continue your important job of cleaning up petroleum UST releases. If you have thoughts on how we can help, please send me an email or give me a call. I always appreciate hearing from you, our valued partners, as we work together to protect human health and the environment from petroleum UST releases. ■

9
June 2017 • LUSTLine Bulletin 82
What Is Inventory?Let’s start at the very beginning. When a convenience store opera-tor or other merchant takes inven-tory, all they are doing is counting how many of a particular item they have on hand. So taking inventory might involve counting the num-ber of candy bars on the shelf, or soda bottles in the cooler, or gallons of gasoline in a tank. Taking inven-tory is a counting procedure—there are 58 candy bars on the shelf or 46 bottles of soda in the cooler. Gasoline inventory is a little different because the operator can’t physically see how much is on hand. He either pushes a button on the ATG to provide a direct measurement of how much gasoline is in a tank or he can use a gauge stick to measure the depth of the liquid and use a tank chart to find out how many gallons he has.
Taking inventory is of limited usefulness. It can tell the operator when it’s time to order more candy bars or more fuel, but that is about it. Merely taking inventory does not tell you whether the clerk on the night shift has been stealing candy bars or giving free soda to his friends. Like-wise, merely measuring the fuel in the tank does not tell you whether you have a leak. Taking inventory
is not a method of theft detection or leak detection.
What Is Inventory Reconciliation?If you are a competent business person, you want to know more than just what stock you have on hand. You want to know whether you are making any money. What you want is to reconcile your inventory to be sure you are in fact selling all the stock that you have purchased. To do inventory reconciliation, you need to know three things: How much of something you purchased, how much you sold, and how much is left.
Let’s say you purchased 100 candy bars. Your sales records indicate that you sold 60 candy bars. This means that you should have 40 candy bars left on the shelf. You inventory your candy bars and find that there are 37 left on the shelf. Three candy bars are missing. There is a variance of three candy bars between what you should have on the shelf and what you actually have.
Your inventory reconciliation doesn’t tell you what happened to these candy bars, only that they are not where they are supposed to be. Maybe that shipment of 100 candy bars really only had 97 candy bars.
Maybe someone picked up a candy bar then set it down to pick up a can of beans and left the candy bar in amongst the bean cans. The candy bar is still in the store but just not on the shelf with the others. Or maybe someone put some candy bars in their pocket and walked out of the store without paying for them. You need more information to figure out exactly what happened to the three unaccounted for candy bars, but you do know that you paid for three candy bars that you didn’t sell. This is inventory reconciliation.
The same ho lds t rue for gasoline. You bought 1,000 gallons. Your records indicate you sold 600 gallons. You should have 400 gallons left. When you measure what is left in the tank using your ATG or your gauge stick and tank chart, you find there are 395 gallons. Five gallons are missing. There is a variance of five gallons between what you should have in the underground tank and what you actually have.
Your inventory reconciliation doesn’t tell you what happened to these gallons, only that they are unaccounted for. Maybe your delivery was short a few gallons, or maybe your dispenser meters are delivering more fuel than they
Marcel Moreau is a nationally recognized petroleum storage specialist
whose column, Tank-nically Speaking, is a regular feature of LUSTLine.
As always, we welcome your comments and questions. If there are technical issues that you would like to have Marcel discuss, let him know at [email protected].
– nically SpeakingTank – nically Speaking by Marcel Moreau
Leak Detection Genealogy
There was a time when UST leak detection was pretty simple. There was little confusion about which leak detection method was what. No one confused inventory control with groundwater monitoring, or automatic tank gauging with secondary containment. But the complexity of UST leak detection has increased markedly since the federal rules went into effect in
1988. In addition, a number of acronyms like MIR, SIR, CITLD, CSLD, and SCALD have come into common usage, along with some poorly defined terms such as “continuous ATG,” and “continual reconciliation.” The recently minted 2015 amendments to the federal UST regulation have compounded the problem by conflating two very different leak detection methods within a single section of the rule (see 280.43(d)(3)(ii)).
So my purpose in writing this article is to clearly differentiate a variety of leak detection methods that have caused some consternation in regulatory circles. I’m going to focus on two very different approaches to leak detection that have gotten tangled up in one another: inventory reconciliation and automatic tank gauging.
■ continued on page 10

10
LUSTLine Bulletin 82 • June 2017
for determining whether a leak may be present had a 95% probability of finding leaks of about a gallon an hour.
Statistical Inventory Reconciliation (SIR) SIR was born in the early 1980s. Dr. Warren Rogers recognized that statistical techniques could be applied to inventory data to obtain more accurate estimates of whether a leak might be present. The mechanics of gathering the data for a SIR analysis are exactly the same as for MIR (see Table 1). Daily readings are made of the volume of fuel delivered, the volume of fuel sold, and the volume of fuel remaining in the tank. SIR differs from MIR only in the analysis that is conducted at the end of the month (see Table 2). Replacing simple arithmetic with appropriate statistical procedures allows the leak detection capability
• The volume in the tank is obtained by pushing a button on the ATG.
• The variance is calculated auto-matically as numbers are entered into a computer spreadsheet.
Doing inventory reconciliation today requires much less effort than it did 30 years ago.
Regardless of how the data are gathered, MIR makes the determination of whether a leak may be present using simple arithmetic: the amount of fuel unaccounted for at the end of the month is compared to the total volume of fuel sold during the month. The criterion in the federal rule is that if the inventory variance is greater than 1% of the volume sold during the month plus 130 gallons for two months in a row, a suspected release investigation must be initiated. The USEPA estimated that this procedure
are recording, or maybe your tank gauge calibration is a bit off, or you didn’t read your gauge stick exactly right, or maybe someone stole some fuel from the tank, or maybe there’s a leak and five gallons went into the ground.
Because measurements of gaso-line volume are not as accurate as counting candy bars on a shelf, it’s also possible the unaccounted for gallons are sitting in the tank and the variance is due solely to measure-ment errors. You need more informa-tion to figure out what happened to these unaccounted for gallons, but you do know that there appears to be five gallons of fuel that you bought but didn’t sell. This is fuel inventory reconciliation. Because one of the reasons why fuel is not accounted for is a leak, inventory reconciliation is a method of leak detection.
Manual Inventory Reconciliation (MIR)For many decades, MIR was the most commonly used method of leak detection for underground fuel tanks. In its earliest forms, MIR was performed using the following steps:
• The volume delivered was determined from the bill of lad-ing provided when the fuel was delivered.
• The volume dispensed was cal-culated from the totalizer read-ings for each grade of fuel and for each nozzle.
• The volume in the tank was determined using a gauge stick to obtain the liquid level and a tank chart to convert the liquid level to volume.
• The variance was calculated using pencil and paper and arithmetic.
Nowadays most people doing inventory reconciliation use the fol-lowing steps:
• The volume delivered is still determined from the bill of lad-ing provided when the fuel was delivered.
• The volume dispensed is calcu-lated directly by the point of sale system (POS) that the clerk uses to control fueling operations.
DATA REQUIREMENTS
Manual Inventory Reconciliation (MIR)
Statistical Inventory Reconciliation (SIR)
Volume in Tank (using gauge stick or ATG) Volume in Tank (using gauge stick or ATG)
Volume Dispensed (using totalizers or point of sale system)
Volume Dispensed (using totalizers or point of sale system)
Volume Delivered (from bill of lading) Volume Delivered (from bill of lading)
Table 1. The data requirements for MIR and SIR are identical.
PROCEDURES
Manual Inventory Reconciliation (MIR)
Statistical Inventory Reconciliation (SIR)
Once a day measurements Once a day measurements
Reconciliation using arithmetic (usually by the operator or accountant)
Statistical procedures on data (usually by third party vendor)
Variance more than 1% + 130 gallons of sales for two months is suspected release
Single failed test is suspected release.
Table 2. Other than the daily gathering of data, the procedures used by MIR and SIR are very different.
REGULATORY REQUIREMENTS
Manual Inventory Reconciliation (MIR)
Statistical Inventory Reconciliation (SIR)
Leak detection for young tanks only Leak detection for tank and piping regardless of age
Measure to 1/8 inch, drop tube required, record water level once a month
Gather data per vendor requirements
Once every 30 day reconciliation Results within 30 days
Two consecutive months of excessive variance is a suspected release
One failed analysis is a suspected release
Table 3. The regulatory requirements for MIR and SIR are very different.
■ Tank-nically Speaking from page 9

11
June 2017 • LUSTLine Bulletin 82
test result. Here is where the termi-nology can get confusing. While a variety of terms have been used to describe these tests, I will use the term “periodic test” when referring to an ATG test that is conducted over a single uninterrupted period of one or more hours. The term “static test” may also be used to describe this type of test.
I will use the term “continuous test” when referring to an ATG test conducted during quiet periods, but the quiet periods may be interrupted by fueling activity without affect-ing the validity of the test. The term “segmented test” may also be used to describe this type of test. An ATG conducting continuous tests may take up to the regulatory limit of 30 days to conduct a single test. Whether the ATG is conducting periodic or con-tinuous tests, the data requirements are the same (see Table 4).
Periodic and continuous ATG tests differ in their procedures (see Table 5). Periodic tests assume there will be no dispensing activity during the test period, so any dispensing that does occur typically results in a failed test. Continuous tests assume there will be dispensing activity
pressurized piping, secondary con-tainment, and groundwater and soil vapor in observation wells. But this article will only discuss one method of ATG leak detection: monitoring the liquid level in the tank over time.
Because we are looking for rela-tively small changes in volume in a tank that may contain many thou-sands of gallons of fuel, any changes in the temperature of the fuel become important. Small changes in the tem-perature of the fuel can produce vol-ume changes that are of the same magnitude as the leak we are looking for, so ATGs must accurately mea-sure any temperature changes in the fuel. The ATG must then calculate the effects of the temperature change on the volume of fuel and take this change into account when determin-ing whether or not a leak is present.
Periodic and Continuous ATG TestsFor an ATG to detect leaks by moni-toring the fuel level over time, the liquid level must be stable dur-ing the test period. The test period can be a continuous period of one or more hours, or it can be broken up into shorter segments that are then combined to obtain a valid
of inventory reconciliation to be considerably improved. SIR vendors must demonstrate that they can detect leaks of 0.2 gallons per hour in order to be acceptable as a monthly leak detection method.
Because of the greatly improved leak detection performance of SIR, federal regulations treat MIR and SIR very differently (see Table 3). MIR is acceptable as leak detection only for tanks that are less than 10 years old. SIR is acceptable as leak detection for both tanks and piping, regardless of the storage system’s age. This does not mean that MIR does not detect piping leaks, only that regulations do not accept MIR as a method of leak detection for piping. While two months of excessive variance are cause for suspecting a release with MIR, a single failed test result with SIR is a suspected release.
Since the publication of the 2015 amendments to the federal regula-tions, the USEPA has decided to require strict adherence to the rule requirement to detect leaks in a 30-day period for all leak detection methods. A number of SIR vendors require 30 days of data in order to conduct their analysis, with addi-tional days required to receive the data, process the data, and return results to the tank operator. Thus, identification of a possible leak by a facility operator might not occur until many days past the 30-day limit set in the rules. While federal and state UST regulatory agencies have tolerated this in the past, USEPA is requiring SIR vendors to modify their procedures so that the require-ment that a leak be identified in a 30-day period can be met.
What Is an Automatic Tank Gauge (ATG)?ATGs started out in the tank world as fancy gauge sticks, but they have become incredibly more sophisti-cated and complex since their initial development over 30 years ago. For purposes of this article, I’m going to keep it simple and define an ATG as a device that measures the level of liquid in an underground tank. Mon-itoring the liquid level in a tank over a period of time when liquid is not being added or removed from the tank is one approach to leak detec-tion. With the appropriate peripheral devices, an ATG can also monitor
DATA REQUIREMENTS
Periodic ATG Test Continuous ATG TestLiquid Level Liquid Level
Temperature Temperature
Table 4. The data requirements for periodic and continuous ATG tests are the same
DATA REQUIREMENTS
ATG Inventory ReconciliationLiquid Level Volume Delivered
Temperature Volume Dispensed
Volume in Tank
Table 6. Data required to conduct leak detection with an ATG versus using inventory reconciliation.
■ continued on page 12
PROCEDURES
Periodic ATG Test Continuous ATG TestTests conducted at scheduled times Test data gathered on an ongoing basis
No dispensing or deliveries during test period No dispensing or deliveries while test data are gathered
Failed test typically results when dispensing occurs during test period
Test period may be interrupted by dispensing activity
Test results usually obtained in a matter of hours Test may take many days to complete, depending on the level of dispensing activity
Table 5. Procedures for periodic and continuous ATG tests.

12
LUSTLine Bulletin 82 • June 2017
times per minute, even while fuel is actively being pumped through multiple nozzles from multiple tanks that are manifolded together. The system can also take advantage of quiet periods between dispensing events to monitor the tank in traditional continuous ATG fashion. Needless to say, this method generates mountains of data that are subject to complex analysis. The process is remotely monitored by trained personnel who are notified automatically by the software of any issues that may show up in the data.
While some vendors of continual reconci l iat ion have had their methodologies evaluated as leak detection methods, leak detection is not the primary goal of continual reconciliation. At present, continual reconciliation is used primarily at very large throughput facilities such as truck stops. It is marketed primarily as a fuel-management tool, for in addition to leak detection, continual reconciliation can identify meters that are giving away fuel, theft (virtually as it is happening), and short deliveries, providing a level of detail in fuel management that could only be dreamed about in the days of pencil and paper inventory reconciliation.
So What Is Continuous In-Tank Leak Detection (CITLD)?The five methods of leak detection I have just described, MIR, SIR, periodic and continuous ATG tests, and continual reconciliation, are the only inventory- and ATG-based methods of leak detection in current use. However, another term, CITLD, has crept into leak detection terminology. The federal rule published in July 2015 refers specifically to CITLD as a method of leak detection:
Continuous in-tank leak detection (CITLD) operating on an uninterrupted basis or operating within a process that a l lows the sys tem t o g a t h e r i n c r e m e n t a l measurements to determine the leak status of the tank at least once every 30 days.4
Confusion arises because CITLD is not one but two very different methods of leak detection, though one would be hard pressed to
ever, USEPA stated in an April 18, 1989 letter that this was not the case, and that ATGs that were certified to detect 0.2 gallon per hour leaks 95% of the time did not need to also con-duct inventory reconciliation.
Though the language associat-ing ATGs with inventory control was omitted from the proposed rule revisions when they were published in 2011, slightly modified language linking ATGs and inventory was reinstated in the final rule amend-ments published in 2015. 2
The preamble to the 2015 rule makes clear, however, that the intent of the rule is not to require that ATGs and inventory reconciliation be used together, but only that ATGs need to meet the same performance standards as inventory control. Spe-cifically, USEPA has in mind the inventory reconciliation requirement to check for water on a monthly basis. While the wording in the rule is vague, USEPA’s explanation of the rule in the preamble is clear: “This final UST regulation does not require owners and operators to perform inventory control in addition to auto-matic tank gauging.”3
So What Is Continual Reconciliation?Of the leak detection methods described in this article, continual reconciliation is the most recently developed, though it has been com-mercially available for over a decade now. Continual reconciliation is most closely related to inventory rec-onciliation, but it also depends on the accurate and rapid liquid level measurement ability of ATGs to be successful. On the leak detection family tree, continual reconciliation is a result of the union of ATGs and inventory reconciliation.
As the name implies, continual reconciliation continuously recon-ciles the volume of fuel dispensed as measured by dispenser meters with the volume of fuel in the tank as mea-sured by the ATG. For example, if there is 1,000 gallons of fuel in a tank and 10 gallons are dispensed into a vehicle, the continual reconciliation software checks to be sure that there is now 990 gallons of fuel in the tank.
Because of today’s computer technology, this reconciliation process is nearly continuous, with reconciliation occurring multiple
before a test can be completed and patiently wait for intervals between dispensing activity when the liquid level is stable enough to gather data that can be compiled into a data base. Data gathering continues until the continuous ATG determines that sufficient data have been gathered to generate a valid test result.
ATG Leak Detection Versus Inventory ReconciliationNow we are in a position to compare how ATGs and inventory reconcilia-tion are used for leak detection. I rec-ognize that inventory reconciliation as described above is not commonly used as a method of leak detection to meet regulatory requirements today. However, a solid understanding of inventory reconciliation is required to understand what differentiates one leak detection method from the other.
In short, ATG leak detection is a volume change procedure. ATGs do leak detection by monitoring the liq-uid level over time to see if there is a change that is not due to tempera-ture. Inventory reconciliation is an accounting procedure. With inven-tory reconciliation, we compare what was bought, what was sold, and what is left to see if anything is miss-ing. Because they are fundamentally different, the two methods of leak detection have very different data requirements (see Table 6). While an ATG can be used to provide the “volume in tank” data that is a com-ponent of inventory reconciliation, there is no overlap in how the two methods function to detect leaks.
If You Are Using an ATG for Leak Detection, Do You Also Have to Do Inventory Reconciliation?Ever since the 1988 regulations, rules have associated ATGs and inven-tory. The section of the 1988 rules describing how to use ATGs for leak detection states, “Inventory control (or another test of equiva-lent performance) is conducted in accordance with the requirements of §280.43(a).”1 This would seem to be saying that inventory reconcili-ation must be used in conjunction with automatic tank gauging. How-
■ Tank-nically Speaking from page 11

13
June 2017 • LUSTLine Bulletin 82
determine that from the language in the rule.
A Little Background…Back in the 1980s, when the federal rules were first being formulated, many leak detection methods appeared in the marketplace in anticipation of the gobs of money that were to be made when leak detection had to be applied to u n d e r g r o u n d t a n k s . U S E PA evaluated many of these leak detection methods and concluded that in many cases the vendor ’s claims of the equipment performance were very much exaggerated.6
To deal with this problem, USEPA incorporated performance s tandards for leak detect ion equipment in the federal rule. Leak detection equipment vendors must demonstrate that their equipment can detect leaks 95% of the time with a false alarm rate of no more than 5%. To guide equipment vendors, USEPA published a series of detailed test procedures that vendors could follow to evaluate their leak detection equipment. The documents describing these test procedures are commonly referred to as protocols.7
There are protocols for evaluat-ing ATGs, tightness testing methods, line-leak detectors, and several other leak detection methodologies. The original ATG protocol was published in 1990, a time when the only tests conducted by ATGs were periodic tests. When ATG vendors developed the continuous testing approach a few years later, they recognized that none of the existing protocols was suitable for evaluating this new approach to leak detection. So a new protocol was produced specifically to evaluate the continuous ATG test-ing method. Certain vendors already had visions of creating the continual reconciliation approach to leak detec-tion, so this method was included in a protocol document that came to be known by its title, “Continuous In-Tank Leak Detection Systems” (CITLDS), although the final “S” for “Systems” is sometimes omitted.
The CITLD protocol actually contains evaluation methodologies for three different methods of leak detection. They are continuous ATG, continual reconciliation, and automatic monthly inventory control . The
Leak Detection TerminologyClearView A brand of continual reconciliation leak detection developed by Simmons (a SIR provider) and marketed by Wayne Fueling Systems, a Dover Fueling Solutions company.Continual Reconciliation A leak detection method that constantly compares the volume of fuel dispensed as measured by dispenser meters with the volume of fuel removed from a tank as measured by an ATG. The system can detect leaks in tanks or product piping. The system may also monitor the tank liquid level during non-dispensing periods to detect tank leaks. Continuous In-Tank Leak Detection (CITLD) A protocol that describes a series of test procedures that can be used to evaluate whether continuous ATG and continuous reconciliation leak detection methods meet the performance requirements of the federal rule. Continuous ATG Test A term applied to a type of ATG leak test where the tank gauge monitors tank activity to identify quiet periods when the liquid level in the tank is stable and suitable leak test data can be gathered. While the tank gauge is continuously monitoring the tank to identify dispensing and delivery activity, the data used to test the tank for leaks are actually gathered during discrete quiet periods when the liquid level in the tank is stable. The data from multiple short test periods is evaluated to determine if a leak may be present. The term “segmented test” is perhaps a more accurate description of how these leak tests are conducted.Continuous Statistical Leak Detection (CSLD) A brand of continuous ATG test conducted by tank gauges manufactured by Veeder Root. The presence of the word “statistical” in the acronym has sometimes led people to believe that this method of leak detection is related to SIR. While statistics play a role in evaluating the data gathered by the tank gauge, this method of leak detection is strictly ATG based and is not related to inventory reconciliation in any way. Manual Inventory Reconciliation (MIR) A method of conducting standard inventory reconciliation where the required data (volume delivered, volume dispensed, volume in the tank) are manually processed using pencil and paper or a computer spreadsheet. While various devices may be used to gather and process the data (e.g., ATG, point of sale system, computer spreadsheet), the procedure is still categorized as MIR as long as the criterion for suspecting a release is a monthly variance of 1% plus 130 gallons of the monthly throughput.Periodic ATG Test A type of ATG leak test where the tank gauge monitors the liquid level in the tank over a single extended period of several hours when no dispensing or deliveries take place. PetroNetwork A brand of continual reconciliation leak detection developed by Warren Rogers Associates (the first developer of SIR).Segmented Test Another term for a continuous ATG test.Static Test Another term for a periodic ATG test.Statistical Continuous Automatic Leak Detection (SCALD) A brand of continuous ATG test conducted by tank gauges originally developed by INCON, now owned by Franklin Fueling Systems. The presence of the word “statistical” in the acronym has sometimes led people to believe that this method of leak detection is related to SIR. While statistics play a role in evaluating the data gathered by the tank gauge, this method of leak detection is strictly ATG based and is not related to inventory reconciliation in any way.NOTE: Brand names are mentioned here solely for purposes of identifying certain commonly encountered trade names with their respective leak detection methodology. Mention of brand names does not constitute endorsement of these brands by EPA, NEIWPCC, or myself.
■ continued on page 15

14
LUSTLine Bulletin 82 • June 2017
• New graphics on suction pump-ing, piping layouts, and flexible connectors have been added.
PEI/RP900: Inspection The 2015 federal UST rule requires tank owners and operators to con-duct periodic walkthrough inspec-tions of spill prevention equipment, release detection equipment, and containment sumps. The rule specifi-cally recognizes PEI’s RP900: Recom-mended Practices for the Inspection and Maintenance of UST Systems as a code of practice that may be used to meet the walkthrough inspection require-ments.
Because PEI recommended prac-tices are typically revised every five years, the 2008 edition of RP900 (PEI/RP900-08) would normally have been updated in 2013. However, the PEI UST System Inspection and Mainte-nance Committee, which is respon-sible for RP900, elected to defer work on the next edition until the new fed-eral rule was published.
As a result of this decision, the Committee was able to ensure that walkthrough inspection procedures discussed in the 2017 edition of the PEI document (PEI/RP900-17) meet or exceed all federal requirements. To make it easy for readers to evaluate PEI’s recommendations in light of the requirements in the federal inspec-tion program, three side-by-side com-parison tables have been included in Chapter 3.
PEI/RP900-17 contains the fol-lowing changes:
• A new appendix entitled “Water Management in Storage Systems” has been added to help readers better understand and address water-related issues associated with UST systems containing die-sel and ethanol-blended fuels.
• Many equipment-testing and ver-ification procedures included in the 2008 edition were removed—not because they are unimportant but rather because the Committee
concluded that PEI’s RP1200, which focuses exclusively on testing and verification, was a more logical home for the pro-cedures (see below).
• The popular—but lengthy—annual inspection checklist in Appendix A was divided into smaller sections that can be more readily adapted to the needs of specific facilities.
• Steps for inspecting corrosion on drop tube shutoff valves (Section 8.10.1.2) and ball float valves (Section 8.10.2.3) located in diesel tanks, as well as components in tank-top sumps, especially for systems storing ethanol blended gasoline (Section 8.6.3), were added.
• Chapter 8 was reorganized and enhanced with two new tables that clarify which inspection steps are applicable to specific UST components.
PEI/RP1200: Testing and VerificationUnder the 2015 federal UST rule, tank owners and operators must test spill prevention and overfill prevention equipment at least once every three years. For both types of equipment, the USEPA determined that the procedures in PEI’s RP1200: Recommended Practices for the Testing and Verification of Spill, Overfill, Leak Detection and Secondary Containment Equipment at UST Facilities may be used to meet the rule’s require-ments.
As work began on the latest revision of RP1200, the RP900 Com-mittee recommended to PEI’s Over-fill, Release Detection and Release Prevention Equipment Testing Committee that 24 testing and veri-fication matters previously included in RP900 be incorporated into RP1200. Most of those recommen-dations were accepted. Largely as a result of these additions, the new edition of RP1200 (PEI/RP1200-17)
from Rick Long, Executive Vice President, Petroleum Equipment Institute (PEI)
PEI Updates Recommended Practices on UST System Installation, Inspection, and Testing
Field Notes ✍
Updated editions of three PEI recommended practices that play a prominent role
associated with the 2015 federal underground storage tank (UST) regulations are now out. Collec-tively, these documents provide a broad array of safe, reliable, and environmentally friendly installa-tion, inspection, and testing proce-dures that meet or exceed federal UST regulatory requirements.
PEI/RP100: InstallationSince 1988, the federal UST rule (40 CFR 280) has stated that UST systems may be installed in accor-dance with a nationally recog-nized code of practice such as PEI’s RP100: Recommended Practices for Installation of Underground Liquid Storage Systems. The 2015 rule con-tinues that tradition.
For the 2017 edition of RP100 (PEI/RP100-17), the PEI Tank Installation Committee reviewed and acted on more than 30 public comments submitted by regulators, manufacturers, installers, and industry consultants. Among the most significant changes in PEI/RP100-17 are the following:
• Vent restriction devices (ball float valves) are no longer recommended for overfill pre-vention.
• Double-walled spill buckets are listed as an installation option that should be considered (Sec-tion 8.2).
• Procedures, measurements, and time requirements for the testing of containment sumps have been substantially revised (Section 8.5.4).
• The “Release Detection” chap-ter in the 2011 edition has been rewritten, reorganized, and expanded into a new “Leak Detection” chapter that, among other things, contains detailed practices for double-walled tanks and piping.
15
June 2017 • LUSTLine Bulletin 82
automatic monthly inventory control was envisioned as an automated way to do MIR, but to my knowledge, no vendors have certified their equipment using this part of the protocol.
In my view, using the acronym CITLD to refer to two very different leak detection methods is a recipe for confusion. The confusion is accentu-ated because the description in the rule of CITLD is vague, and both methods included under CITLD have an ATG as a key piece of equipment. I believe the leak detection world would be better served if the acronym CITLD were used only in reference to the protocol that is used to evaluate certain leak detection methods. The terms continuous ATG and continual reconciliation would then be used to refer to unique leak detection meth-ods that were certified as meeting leak detection performance standards using the CITLD protocol.
In Summary…I don’t see the language in the federal rule changing anytime soon, but if regulators can just keep in mind the distinction between the CITLD protocol and the two approaches to leak detection that use this protocol, the level of confusion can be greatly
is five pages longer than the 2011 version of the document.
The RP1200 Committee also accepted in whole or in part many of the 34 suggestions received during the public comment period.
One of the Committee’s biggest decisions was not a change but an affirmation that in hydrostatic test-ing of sumps (Section 6.5.6), the test water should be a minimum of four inches above the uppermost sump penetration or sump sidewall seam (whichever is higher). During the comment period, several sugges-tions for alternate procedures on this test had been submitted.
Similarly, the Committee reaf-firmed its 2008 recommendation that ball float valves be removed and replaced with another type of over-fill prevention device (Section 7.2).
Vacuum-testing standards for double-walled tanks in Chapter 4 have been changed to bring greater consistency to the procedures for fiberglass and steel tanks. Finally, a number of the 28 definitions in Chapter 2 were reworded to match language used in other PEI recom-mended practices.
The Big Picture?PEI is certainly pleased that USEPA recognizes all three of these docu-ments as sufficient for various requirements in the 2015 federal rule. However, it’s important to remember that the 38 states (plus the District of Columbia and the Commonwealth of Puerto Rico) with USEPA state program approval (SPA) will have to make their own decisions. While those states may
or may not accept all of PEI’s prac-tices, they will, as always, have to show that their standards are no less stringent than the federal require-ments, contain provisions for ade-quate enforcement, and regulate at least the same USTs as the federal standard. At the time of this writing, some SPA states are moving quite rapidly to update their programs. All applications for renewal of SPA status must be submitted to USEPA by October 13, 2018.
More information on RP100, RP900, RP1200 and the twelve other recommended practices published by PEI can be found at www.pei.org/rp. PEI extends member pricing on RPs to regulators—the member price of $40 is a big savings over the nonmember rate of $95. ■
Field Notes continued
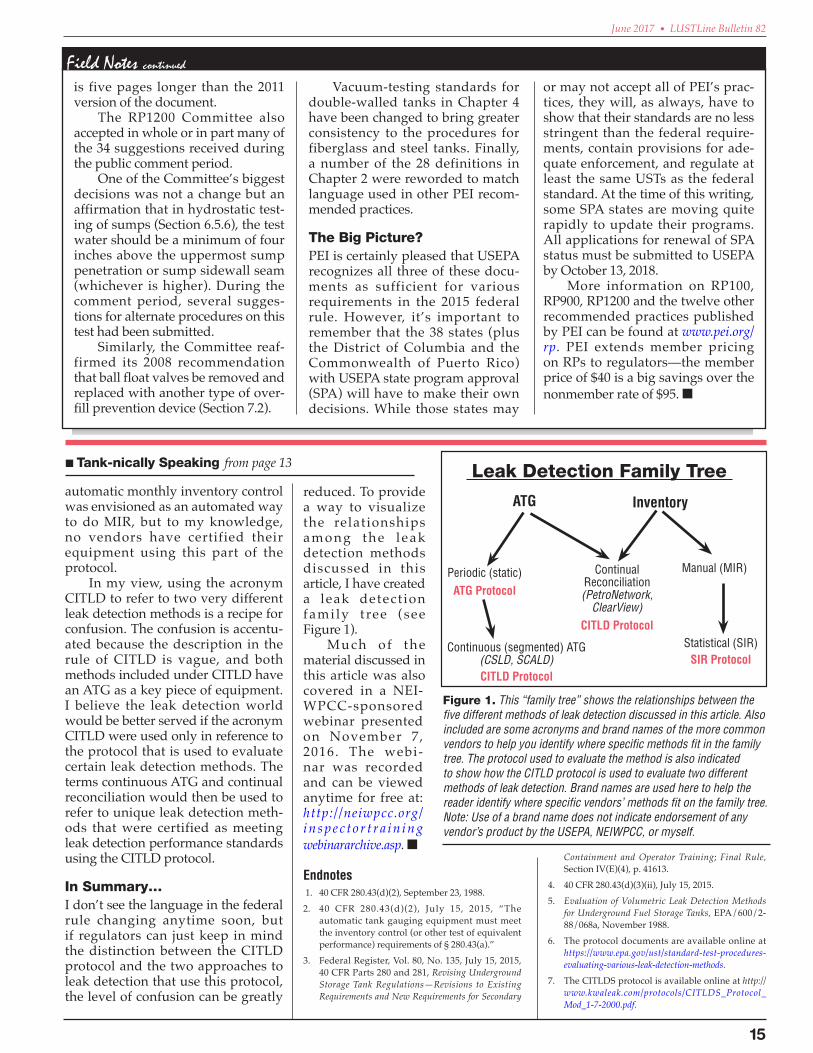
reduced. To provide a way to visualize the relationships among the l eak detection methods discussed in this article, I have created a leak detect ion fami ly t ree ( see Figure 1).
Much o f the material discussed in this article was also covered in a NEI-WPCC-sponsored webinar presented on November 7, 2016. The webi-nar was recorded and can be viewed anytime for free at: http://neiwpcc.org/inspec t o r t r a in ing webinararchive.asp. ■
Endnotes 1. 40 CFR 280.43(d)(2), September 23, 1988. 2. 40 CFR 280.43(d)(2), July 15, 2015, “The
automatic tank gauging equipment must meet the inventory control (or other test of equivalent performance) requirements of § 280.43(a).”
3. Federal Register, Vol. 80, No. 135, July 15, 2015, 40 CFR Parts 280 and 281, Revising Underground Storage Tank Regulations—Revisions to Existing Requirements and New Requirements for Secondary
■ Tank-nically Speaking from page 13 Leak Detection Family Tree
ATG Inventory
Periodic (static) ATG Protocol
Continual Reconciliation (PetroNetwork,
ClearView)CITLD Protocol
Manual (MIR)
Statistical (SIR)SIR Protocol
Continuous (segmented) ATG (CSLD, SCALD)CITLD Protocol
Figure 1. This “family tree” shows the relationships between the five different methods of leak detection discussed in this article. Also included are some acronyms and brand names of the more common vendors to help you identify where specific methods fit in the family tree. The protocol used to evaluate the method is also indicated to show how the CITLD protocol is used to evaluate two different methods of leak detection. Brand names are used here to help the reader identify where specific vendors’ methods fit on the family tree. Note: Use of a brand name does not indicate endorsement of any vendor’s product by the USEPA, NEIWPCC, or myself.
Containment and Operator Training; Final Rule, Section IV(E)(4), p. 41613.
4. 40 CFR 280.43(d)(3)(ii), July 15, 2015. 5. Evaluation of Volumetric Leak Detection Methods
for Underground Fuel Storage Tanks, EPA/600/2- 88/068a, November 1988.
6. The protocol documents are available online at https://www.epa.gov/ust/standard-test-procedures-evaluating-various-leak-detection-methods.
7. The CITLDS protocol is available online at http://www.kwaleak.com/protocols/CITLDS_Protocol_Mod_1-7-2000.pdf.

16
LUSTLine Bulletin 82 • June 2017
FAQs from the NWGLDE …All you ever wanted to know about leak detection, but were afraid to ask.
Leak Detection Test Method Listings for Underground Piping Associated with Airport Hydrant Fuel Distribution Systems and Field-Constructed Tanks on the NWGLDE Website
About the NWGLDE
The NWGLDE is an independent work group comprising 11 members, including 10 state and 1 USEPA member. This column provides answers to frequently asked questions (FAQs) the NWGLDE receives from regulators and people in the industry on leak detection. If you have questions for the group, please contact them at [email protected].
NWGLDE’s Mission
• Review leak detection system evaluations to determine if each evaluation was performed in accordance with an acceptable leak detection test method protocol;
• Ensure that the leak detection system meets USEPA and/or other applicable regulatory performance standards, if applicable;
• Review only draft and final leak detection test method protocols submitted to the work group by a peer review committee to ensure they meet equivalency standards stated in the EPA standard test procedures; and
• Make the results of such reviews available to interested parties.
In this LUSTLine FAQs from the National Work Group on Leak Detection Evaluations (NWGLDE) we discuss revisions to “Large-Diameter Piping” leak detection methods in response to new release detection requirements for airport hydrant fuel distribution systems and field-constructed tanks. Note: The views expressed in this column represent those of the work group and not necessarily those of any implementing agency.
Q. The 40 CFR Part 280 2015 revised rule specifies a testing deadline and maximum leak detection rates for semiannual and annual line tightness testing for underground piping associated with airport hydrant fuel distribution systems and field-con-structed tanks based on tank size and piping test section volume. Where can I find the appropriate test methods on the NWGLDE website?
A. In addition to Line Tightness Test Method listings, NWGDLE also lists “Large-Diameter Line Leak Detection Methods.” Because of the large volume of the piping for airport hydrant distribution systems and field-constructed tanks, methods listed under Line Tightness Test Methods are not capable of meeting the regulatory requirements of detecting 0.1 gph with a 95%/5% probability of detection/false alarm. However, methods under “Large-Diameter Line Leak Detection include large-volume or bulk monitoring methods that were designed specifically for these newly regulated applications. These methods were listed with a test threshold that the manufacturer chose to have evaluated. With USEPA’s new rule revision, NWGLDE is renaming the “Large-Diameter Line Leak Detection Method” the “Line Leak Detection Method for Airport Hydrant and Field Constructed Systems.”
Piping system capacity, not diameter, is the limiting parameter of these test methods, hence, this category will contain listings for methods that can’t necessar-ily detect leaks as small as 0.1 gph in larger piping test section volumes, but that could otherwise meet the maximum leak detection rates as specified in 40 CFR 280 for underground piping systems sized larger than 50,000 gallons and associated with air-port hydrant systems and field-constructed tanks.
Also, realizing that 40 CFR 280 expresses maximum leak detection rates in gallons per hour (gph) and that many existing test method listings for large-volume piping express rates only as a percentage (%) of vol-ume, NWGLDE will be asking vendors to revise their existing listings to include the gallon per hour equiv-alent. It can then be determined by looking at the list-ings whether or not these methods will meet at least one of the two testing options allowed under USEPA regulations, annual or semi-annual testing each with
target leak rates based on testing frequency and the volume of the line being tested.
For example, a method that is currently listed to meet a leak rate of 0.002% of line volume in gallons per hour must meet a leak threshold of 0.001% of line vol-ume to pass the tightness test. These thresholds are calculated as percent of line volume. To correlate this with the new USEPA rules, for a 50,000-gallon line volume, this method is certified to meet a 1.0 gallon/hour leak rate, so long as the actual system passes the 0.5 gallon/hour leak rate threshold. USEPA’s new rule is broken into different thresholds based on line volume and frequency of testing. A 50,000-gallon line can be tested twice a year to 1.0 gallon/hour or once a year to a certified 0.5 gallon/hour leak rate.
In conclusion, the method described in this example can be used to meet the semiannual testing, requirement for a 50,000 gallon line volume, but is not certified to test to the 0.5 gallon per hour leak rate required for just annual testing of this 50,000 gallon line volume.
Compliances dates for the new UST rule require-ments may vary by state. For details on the USEPA rule, visit their webpage: https://www.epa.gov/ust/revising-underground-storage-tank-regulations-revisions-existing-requirements-and-new. ■

17
June 2017 • LUSTLine Bulletin 82
BackgroundOne of the primary vapor intrusion models in use, the Johnson-Ettinger model (JEM), was presented as a screening model (Johnson and Ettinger, 1991), which essentially consists of two completely mixed compartments, one representing the interior of a building and the other the soil below. This conceptualization reflects the potential for both features of the building and the subsurface to contribute to indoor air contamination.
In its original form, the model simply related the concentration in the soil gas to the concentration in indoor air. Historically, it was used with only a few site-specific parameters, while most of the other required inputs were taken from tables of “default” values. No biodegradation of the compound w a s i n c l u d e d a s t h e m o d e l conceptualization, it only related the concentrations between the two compartments. Later extension of the JEM included diffusive flux from a
deeper source zone to the bottom of the foundation. Even though the JEM does not include biodegradation, it could be a valid conceptualization for chlorinated solvents, because most of these compounds do not undergo aerobic biodegradation.
Petroleum hydrocarbons, however, are readily degraded under aerobic conditions, so the JEM excludes a process with the potential for greatly affecting petroleum vapor intrusion (Figure 1, left). Given that chlorinated solvents are not degraded in the presence of oxygen, dissolved contamination in the aquifer (saturated zone) often has the potential to contaminate indoor air (Figure 1, right). In contrast, research published since 2002 has shown that due to widespread aerobic biodegradation, petroleum hydrocarbons require certain circumstances to result in vapor intrusion (Davis, 2009). Consequently, the prospect for petroleum vapor intrusion is more limited than for chlorinated solvents, but also more dependent on the specific
configuration of a source—presence of light non-aqueous phase liquid (LNAPL)—and depth to water, among other factors (Figure 1).
Getting to Suitable ModellingSubsurface environmental models are based on the application of mass conservation principles of transport and transformation of chemicals in the environment. Generally, all environmental models are based on two components: 1) an empirically determined principle relating chemi-cal, physical, and biological quanti-ties, and 2) the empirical coefficients that describe these processes. Taken together these two components have the potential for representing the transport and transformation of petroleum vapors in the vadose zone below a building.
To address the limitations of dealing with petroleum vapor intru-sion, George DeVaull (2007, API 2010) developed a model, BioVapor, to account for:
USEPA’s PVIScreen Model for Petroleum Vapor Intrusionby James W. Weaver and Robin V. Davis
Fifteen years ago, vapor intrusion and its evaluation through modeling approaches were identified as a potential problem at subsurface contamination sites (Obamascik, 2002). The application of simplified models using mostly generic default parameters has contributed to confusion over appropriate assessment strategies for these sites. In addressing a number of
issues, the approach taken in the 2015 USEPA guidance (USEPA, 2015) is to base site decisions on multiple lines of evidence. Despite problems identified with models, models with appropriate site-specific parameters can provide at least one of those lines of evidence. In this article we describe USEPA’s new petroleum vapor intrusion model, called PVIScreen.
■ continued on page 18
Figure 1. Comparison between the processes governing non-biodegrading solvent vapor intrusion (left) and petroleum vapor intrusion (right) (USEPA, 2012).

18
LUSTLine Bulletin 82 • June 2017
• aerobic biodegradation in the vadose zone
• l i m i t s o n o x y g e n s u p p l y imposed by the diffusive flux into the vadose zone
• the oxygen demand of any num-ber of compounds present in soil gas
• oxygen consumption by native soil respiration.
Conceptually, oxygen from the atmosphere (Figure 2) permeates
the soil gas, providing the electron acceptor needed for aerobic b iodegradat ion of petroleum hydrocarbons. Because of the typical large flux of oxygen from the atmosphere, petroleum hydrocarbons react in a zone near their source and consequently their concentrations may be reduced relatively deeply within the vadose zone.
BioVapor was developed as a Microsoft Excel spreadsheet applica-tion. The model balances the supply of oxygen from the atmosphere with the degradation-driven demand for oxygen in the soil gas. The outputs of the model include the depth of the aerobic zone, indoor air concentra-tion for all chemicals included in the simulation, and the chemical con-
centrations at other points in the soil profile.
Although models represent important processes, the ability to determine definitively that there are no vapor impacts to buildings (“screen for PVI”) also depends on application-related factors. These factors include the degree to which the site conceptual model matches the structure of the mathematical model, the inherent limitations imposed by the assumptions in the mathematical model, the values chosen for input parameters, and the ability to calibrate the mathematical model to site conditions.
To address some of these modeling limitations, USEPA has developed PVIScreen, a petroleum
Figure 2. Schematic illustration of petroleum hydrocarbon (PHC) flux and distribution and oxy-gen flux and distribution (USEPA, 2012).
Figure 3. Building, foundation, contaminant source, and water table configuration display from PVIScreen.
■ PVIScreen Model from page 17
vapor intrusion model, which extends the concepts of BioVapor by:
• implementing an automated uncertainty analysis
• linking directly to a fuel leaching model
• providing the capability to use a flexible unit conversion system
• displaying key outputs in an intuitive fashion, providing an automatically generated report containing all inputs and outputs.
In PVIScreen, the building, vadose zone, and aquifer are defined in a layout (Figure 3) that relates the bottom of the foundation to a zone of petroleum contamination. Although petroleum is indicated as the source in Figure 3, soil gas or groundwater data can also be used as the source in the simulation. The model uses a number of inputs to describe the physical layout, and key soil, building, and biodegradation p a r a m e t e r s . T h e re s u l t s a re compared against screening levels to indicate the possible risks associated with the calculated indoor air concentrations.
Uncertainty AnalysisUncertainty analysis, as described here, uses the response of the model to changes in parameter values to assess the uncertainty in model out-put. The method used in PVIScreen presumes that some or all parameters of the model are uncertain. These are selected either as constants, a min-max range, or an empirical probabil-ity distribution.
In the uncertainty analysis procedure, the model is run a specified number of times—usually 1,000—and the uncertain parameters

19
June 2017 • LUSTLine Bulletin 82
are chosen randomly from the inputs. After completing all required runs of the model, the results are processed into output probabilities for each chemical included. The results are presented as a summary table, probability curves, and detailed output file. Any of these can be used to evaluate the results; the summary table is typically the simplest to interpret. Let’s look at an example of how this works.
A Site Investigation for a Release at a Gas Station and Neighboring RestaurantA site with an on-site convenience store/gas station and off-site adjacent restaurant reported a release in August 2010 (Figure 4). The gas station was active with two 10,000 gallon and one 8,000 gallon tanks. The release was assumed to be from spills and overfills. Four field investigations were made between 2010 and 2015 with 22 monitoring wells and 7 borings. The groundwater ranged from 5.5 feet to 7.5 feet deep (Figure 5).
A 3-foot-deep boring was advanced at the edge of the restaurant and completed as a soil gas monitoring point. Soil gas data from this boring was used as the source of contamination for the simulation (Table 1). BTEX, MTBE, naphthalene, and TPH-GRO data were available, and each of these was simulated in PVIScreen. All available constituents should be entered in order to properly account for the chemical loading to the subsurface. The complete discussion of this case and all input parameters can be found in the PVIScreen User ’s Guide.
Figure 4. Site plan for the convenience store/gas station and restaurant simulations.
Figure 5. Cross-section summarizing site data in the vicinity of the off-site restaurant.
IDSAMPLE DEPTH (feet)
BENZENE (μg/m3)
TOLUENE (μg/m3)
ETHYLBENZENE (μg/m3)
TOTAL XYLENES (μg/m3)
NAPHTHALENE (μg/m3)
TPH-GRO (μg/m3)
MTBE (μg/m3)
SVP-1 3 <3.2 10 <4.4 41 <5.3 210 <3.6
PVIScreen Input
3 1.6 10 2.2 41 2.85 210 1.8
Utah DEQ Screening Levels, commercial indoor air
n/a 0.5 7310 1480 148 4.39 307 4380
Table 1. Field results, PVIScreen input concentrations, and Utah DEQ screening levels for the restaurant simulation.
■ continued on page 20

20
LUSTLine Bulletin 82 • June 2017
PVIScreen Model ParametersThe width and length of the building was entered as measured (60 ft x 80 ft), the ceiling height was assumed to be 9 ft, and thickness of foundation 10 centimeters. The foundation crack width was considered as a variable parameter, using a USEPA range of values (0.5 mm to 5.0 mm). The air exchange rate was set to a range of 3 hr-1 to 10 hr-1 to represent com-mercial buildings. The Building & Foundation entry screen shows how the combination of constant and variable parameters is entered (Fig-ure 6). On other input screens, site-specific values were entered for the depth to sample (3 ft), and depth to water (7.5 ft). The other vadose zone parameters were given wide ranges as site-specific values were not avail-able (not shown).
The source of contamination was taken to be the soil gas data from the 3-foot-deep-boring at the edge of the building (SVP-1 on Figure 5). Concentration values reported at less than the reporting limit were set to half the reporting limit (Table 1). Site-specific screening levels were calculated from Guidelines for Utah’s Corrective Action Process for Leaking Underground Storage Tank Sites (Utah, 2015) and used as input.
ResultsThe PVIScreen simulation showed that all runs of the model were below the screening level of 0.5 µg/m3 for benzene (Figure 7). The result screen shows a plot of the statistical results on the left, and the summary table on the right. The summary table states that for benzene “0.0% Exceed the Screening Level of 0.5 ug/L.” Although not shown here, the same result was found for each of the other chemical constituents. Therefore, the model results suggest that there is a very low chance of vapor intrusion at the restaurant. In addition to these graphical results, PVIScreen automatically generates a modeling report. The report is written in HTML and is automatically displayed in a browser window. The report summarizes the model assumptions, specific run information, tabular results, and all choices of input parameters.
ConclusionsAccording to USEPA guidance (USEPA, 2015), decisions on petro-leum vapor intrusion need to follow from multiple lines of evidence. Mod-eling can provide one of these lines of evidence. As noted for the use of the PVIScreen, site data is needed for running the model, in particular for defining the source.
We anticipate that the model can be used in various scenarios. It fits into site screening in cases where the building is inside a lateral inclusion zone and there is not sufficient vertical separation between the source and foundation. PVIScreen results can also provide justification for additional sampling (i.e., soil gas, subslab, and/or indoor air). In cases where subslab vapor concentration data indicate
the potential for PVI, use of the model can provide an additional l ine of evidence that would support a decision. In brownfields redevelopment, where buildings are yet to be constructed, PVIScreen could provide insights on impacts when no indoor air measurements are possible. Where the PVIScreen results indicate a probability of indoor air contamination (Figure 7), some cases clearly indicate the status of PVI: if the probability of exceeding the specified screening level is given by the model as 0.0%, then the model clearly does not indicate PVI potential.
Other cases might require a judgment or policy decision. For example, if the probability is only, say 2%, is the model indicating PVI
Wander LUST
Figure 6. Building & Foundation input screen for the off-site restaurant simulation.
Figure 7. Off-site restaurant simulation benzene result showing no simulation results above the screening level of 0.5 µg/m3. The most probable and averaged-parameter results are below the minimum plotting concentration of 10-5 µg/m3.
■ PVIScreen Model from page 19
■ continued on page 29

21
June 2017 • LUSTLine Bulletin 82
Priorities ShiftOverall I think we’ve done a good job of addressing many of the big issues in petroleum remediation as they’ve arisen. But priorities shift. Some states are now using ground-water experts who previously addressed petroleum to deal with the new gorilla in the closet—perfluo-rooctyl sulfonate (PFOS), perfluo-rooctanoic acid (PFOA), and PFOS/PFOA.
T h i s a c k n o w l e d g e s w h a t many states have always done but often do not articulate at national meeting of UST/LUST stakeholders. Indeed, many state technical staff are organized within larger groundwater programs and work on a huge variety of projects, which may include petroleum, solvents, surfactants, nutrients, and broader assessment and cleanup strategies that dea l wi th redeveloping propert ies using Brownfields funding. Of late, however, PFOS/PFOA has taken the spotlight as the Department of Defense’s largest remediation priority, and they are funding broad assessment activities at military bases in most states.
petroleum brownfields, light non-aqueous-phase liquids (LNAPL), conceptual site models (CSM), site optimization, and MTBE).
Some of these efforts began a s U S E PA / A S T S W M O L U S T Task Force joint team efforts, and then quickly evolved on a parallel track with the establishment of an Interstate Technical and Regulatory Council (ITRC) Team effort. PVI is a good example of such an effort that has involved many of the same key technical experts. Each of those efforts represented a huge movement of change on the part of state and federal agencies, industry, and the environmental consulting community.
After pondering the current state of LUST cleanup and petroleum remediation in
the United States—the big issues in petroleum remediation—I arrived at a brilliantly specific question: What is the next new thing in petroleum remediation? As one who spent his career grappling with the “big petroleum remediation issues,” I can’t help but wonder if there is some next new issue we have to tackle? Those of us in LUST remediation have had our share of challenges that have covered a wide spectrum of issues, many of which we’ve continued to address for many years. So we tend to brace ourselves for the next new headache.
Don’t get me wrong, change is not a bad thing. Look at all the changes in technologies that we have witnessed in a short period of time (e.g., YouTube, 2005; iPhone, 2007; DNA testing kits, 2008; Amazon’s “Alexa,” 2014). In LUST remediation, we can look back and see very specific time markers based on the publication of key technical guidance documents that answered a specific regulatory need with national implications (e.g., petroleum vapor intrusion (PVI), lead scavengers,
Jeff Kuhn recently retired from a career in environmental cleanup with the Montana Department of Environmental Quality (MDEQ) and plans to forge on as a private consultant. He is a veteran at the state and national level having tackled almost every technical issue that has arisen in petroleum remediation in the last 30 years. Through this column he takes us on “walkabouts” across the fascinating world of underground storage tanks. Jeff welcomes your comments and suggestions and can be reached at [email protected].
Wander LUST ..
....a walkabout with Jeff Kuhn...........................
...
The Next New Thing in Petroleum Remediation
■ continued on page 22
Groundwater is still the primary
contaminant receptor and the
reason that LUST sites remain open
and “backlogged.” These are often
the most difficult and the most
costly sites to remediate.

22
LUSTLine Bulletin 82 • June 2017
• periodic review of release- specific treatment technologies to optimize cleanups
• review of site-specific cleanup standards
• use of institutional/engineering controls (IC/ECs).This generally agrees with the
opinions of a number of veteran LUST workers who I asked what “the next new thing” might be. Most were just as reluctant as I was to identify a next new thing. But all agreed on the great need for improvement in remediation technologies that would move sites to closure.
Fuel Formulation?I would be remiss not to mention the possibility of another contaminant issue reemerging to the forefront. Fuel formulation is dynamic, responding to many variables. Historical ly str ict air quali ty standards for auto emissions (e.g., California Air Resources Board) have driven the need for cleaner burning fuels and better automotive technologies.
There is l i t t le doubt that alternative fuels, especially biofuels, will continue to challenge UST equipment manufacturers by finding weaknesses in material compatibility that lead to future releases. Even some major airlines are now using biofuel blended with traditional aviation fuel. For example, United Airlines is using 30 percent biofuels and 70 percent conventional jet fuel on some commuter segments in California.5
Clearly the market for biofuel is expanding into new areas. Changing fuel formulations will continue to challenge the effectiveness of LUST remediation systems and optimization efforts.
As Always, It’s Continuous ImprovementITRC has carried the ball on many technical issues at precisely the right time, providing invaluable assistance to states and other practitioners.6
One such example is ITRC’s Total Petroleum Hydrocarbons (TPH) Risk Team (see LUSTLine #80). That team is developing guidance to help answer questions involving the ubiquitous TPH fractions that we seem to encounter over and over again, especially when old LUST sites are re-opened.
The publication of TechReg docu-ments is not a guarantee that future state program staff will use them and heed lessons learned. Also, science is constantly evolving; even the best technical guidance documents must be updated to reflect advancements in tools and technology. But immedi-ate access to such technical resources is one of many reasons for the great success of state LUST programs.
Sometimes the most obvious conclusions are not so obvious, only because we are looking for something “grander,” a new problem we can throw our creative energy at, something more interesting than the familiar problems to which we’ve grown accustomed. In the current climate of uncertain future funding and shifting program priorities, focusing work on optimizing remediation systems and finding better assessment and cleanup technologies, is the “next new thing.” It’s also something familiar to all of us—“continuous improvement”— the mantra of OUST’s first director, Ron Brand, instilled as a means of carrying the Tanks program forward. It’s still the right place for state remediation programs, consultants, and industry to place their collective efforts. ■
References1. “The National LUST Cleanup Backlog: A Study of
Opportunities,” USEPA, September 2011, https://www.epa.gov/ust/national-lust-cleanup-backlog-study-opportunities.
2. Ibid. pg. 33. Ibid. pg. 16 4. Ibid. pg. 15 5. http://oilprice.com/Alternative-Energy/Biofuels/Biofu-
els-May-Be-The-Future-Of-The-Aviation-Industry.html. 6. http://www.itrcweb.org.
Hence, that’s where many state groundwater staff efforts are being focused.
States often have no choice but to “follow the money.” They must use their staff on funded program priorities first. If petroleum remedia-tion projects have little or no funding they do not move forward on a state level. They are “backlogged” and remain on a list until federal, state, or private funding becomes avail-able. Wait, didn’t we all recently par-ticipate in a national discussion with USEPA involving the National LUST Cleanup Backlog?
The Backlog StudyThe National Cleanup Backlog Study clarified a number of needs at a national level. It was completed in two phases.1 Phase I conducted in 2006, evaluated LUST site statistics from 45 states. Phase II, initiated in 2008, evaluated a smaller sample of 14 states in much greater detail.2
One important conclusion is worth reiterating. The LUST cleanup backlog represents a large number of groundwater-contaminated sites. Results of the Phase II study found that data from 11 states, sorted by “media contaminated,” found the following:3
• 78% of re leases impacted groundwater resources
• 19% impacted soil only• 3% impacted other media only
(e.g., surface water).Groundwater is still the primary
contaminant receptor and the reason that LUST sites remain open and “backlogged.” These are often the most difficult and the most costly sites to remediate. They challenge the limits of most in-situ remediation technologies and require continual site optimization efforts to maintain. The backlog study was correct to include this in its recommended list of “potential opportunities” for states to explore. One recommendation from the study stands out from the others:4
Consider the use of a systematic process to explore opportunities to accelerate cleanups and reach closure, such as:
In the current climate of uncertain
future funding and shifting program
priorities, focusing work on
optimizing remediation systems
and finding better assessment and
cleanup technologies, is the
“next new thing.”
■ New Petroleum Remediation from page 21

23
June 2017 • LUSTLine Bulletin 82
What are an inspector ’s options when trying to ver-ify that those tanks he/she
just inspected are really, truly, hon-estly insured?
• Is the Acord®, a one-page cer-tificate enough? Seems awful flimsy, doesn’t it?
• How about the Endorsement or Certificate of Insurance form from CFR 280.97? USEPA requires all insurance policies to have either an endorsement or a certificate of insurance as worded; that must be good enough, right?
• What about the actual full policy from the insurance company? (Ouch, that’s a lot of reading.)
It all pretty much comes down to how much you really need to know versus how much you want to know. What do these options give you?
• ACORD® The Association for Cooperative Operations Research and Development (ACORD) i s a non-prof i t o rg a n i z a t i o n t h a t s e r v e s the insurance industry and develops standard forms used by insurance companies. An ACORD certificate of liability is not an insurance policy—it is not a contract; it does not contain all the details of the policy. It is simply a standard form that gives certain information about an insurance policy and exists for informational purposes only.
• Endorsement/Certificate of Insurance Form in 40 CFR 280.97 Ha, this must be perfect—it’s in the federal regulation! The endorsement/certificate of insurance form from the federal regulations does provide more information than simply an ACORD form. One of the most important differences
between the endorsement/certificate of insurance and an ACORD form is that the endorsement/certif icate of insurance becomes part of the insurance policy (i.e., it becomes part of the contract between the owner/operator and the insurance company). The endorsement/certificate of insurance has to “fill in the blanks” that detail the amount and scope of insurance coverage and specific wording to ensure that certain things are included in the policy, such as “first dollar coverage” and a “six-month extended reporting period.”
• Insurance policy from the insurance company Own-ers and operators are supposed to have a copy of the complete insurance policy available for review upon request. However, it is often frighteningly volumi-nous in length and full of very legalistic terms.
The Assurance Is in the DetailsSo how does an inspector verify that the tank owner is in full compliance with the financial responsibility regulations? Glance at an ACORD form? Make sure the blanks are completed on the endorsement/certificate of insurance? Wade through all that legalistic jargon in an insurance policy? Each state has to decide just how vigilant they want to be in verifying compliance. As with any other aspect of inspection for compliance with tank regulations, be it leak detection or financial responsibility, the higher the level of detail required, the more confident you can be that compliance with the regulations is complete.
When a tank inspector shows up on-site to verify that the tank owner is complying with the leak detection
requirements he must decide what level of detail is appropriate. Does he ask the owner if he is doing leak detection and accept a verbal “yes”? Does he peruse a handwritten sheet that shows a checkmark each month in a leak detection column? Does he actually confirm that the automatic tank gauge is calibrated correctly, that it has had a functional test of the system, probes are working properly, and the tank leak test has passed every month?
The answer for leak detection probably appears s imple—we automatically think, “Absolutely, the tank inspector should verify that all components are functional and operating correctly and the leak detection test has passed!” What is not so automatic is to transfer that same thinking to the verification of financial responsibility. Inspectors need to ensure that the insurance policy language is cal ibrated correctly, that all the policy terms are working properly, and that the policy can pass a functional test.
What Is an Inspector to Do?Our three options each have their drawbacks:
• The ACORD form s imply does not have the necessary information to verify compliance with the regulations. It will provide very basic information such as a policy number and insurance provider information but there are no details as to what limits of coverage are provided, any exclusions or terms of the policy.
• The Endorsement/Certificate of Insurance form required by the federal regulations provides an easy way to verify that certain requirements are met. The signed form is an easy way for
Unlocking the Mystery of FRA straight-talking column by Jill Williams-Hall, a Sr. Planner with the Delaware DNREC, on assignment to USEPA’s Office of Underground Storage Tanks, Washington, DC. Jill can currently be reached at: [email protected].
Verifying Insurance What’s an Inspector to Do?
■ continued on page 24

24
LUSTLine Bulletin 82 • June 2017
So what is a state to do when an inspector doesn’t have the time to read the document during an on-site visit or doesn’t have the technical expertise to verify the policy language? States have applied various approaches to solve this issue. A number of states require the tank owner to send a copy of the full policy to the state tank office. There is typically a staff person with appropriate insurance training who reviews the entire policy to ensure it is in compliance with the regulations. For maximum efficiency, states may load this information into a database that can be accessed by the tank inspector and instantly combined with the results of an on-site inspection.
For some states the enforce-ment of the financial responsibility requirements is on a completely sep-arate track and not combined with the on-site inspection. A tank owner might therefore receive one notice of non-compliance with operational requirements and a separate notice of non-compliance with FR.
A more innovative approach is to partner with another state agency that has staff with the neces-sary insurance expertise—the state insurance agency, the department of motor vehicle registration, the busi-ness-licensing agency. For example, in one state the tank insurance policy must be submitted annually with the application to renew the busi-ness license. The business-licensing agency reviews the tank insurance policy and then passes it to the envi-ronmental agency. A successful col-laboration of state agencies!
It’s Worth the TroubleEach state must decide how in-depth their review of FR documentation will be. At first blush it may feel like they can’t add any more burdens to tank inspectors already struggling to make the three-year inspection rotation. But the importance of FR cannot be underestimated. When all else fails and a release does occur, corrective action should be swift and sure to protect human health, safety, and the environment. A ready financial source for cleanup will often reduce the lag time between release confirmation and the commencement of remediation. ■
an inspector to quickly verify basic information—the scope and coverage amounts required are correct, the policy effective dates are current, the coverage is “first dollar,” the policy includes a six-month tail, termination must be made in writing to the insured, and coverage is for all accidental releases (both sudden and non-sudden).
C o r r e c t c o m p l e t i o n a n d submittal of this form is the minimum requirement for c o m p l i a n c e w i t h 4 0 C F R 280.97. But is this really enough information to ensure that the policy fully complies with the regulations, or if there is a nuance the tank owner might not have noticed or understood that may give him less coverage than he realizes? Surprisingly, maybe not. Paragraph 1 of the certification form states, “In accordance with and subject to the limits of liability, exclusions, conditions, and other terms of the policy.”
So without a full reading of the underlying insurance policy, how does an inspector know if there is an exclusion or condition that might not meet the requirements of the regulations, or that may provide the tank owner with less coverage than he realized? Simple answer: you can’t.
• The Insurance Policy is a legal contract between the insured (tank owner) and the insurer (insurance company). Herein are all the terms, conditions, and exclusions. Just as leak detection equipment does not work if all the correct components are not installed and functioning properly, so too with insurance. W h i l e t h e e n d o r s e m e n t /certificate of insurance gives you a quick look under the hood, reviewing the policy itself is the only way to verify that every necessary component is present and all the equipment is functioning as required. But these documents are lengthy and contain very specific insurance terms that are not typically understood by a layperson.
My Forecast Calls for a Bit of…• Confusion until all the state
rules are in and operators are up to speed.
• R e l i e f o n t h e p a r t o f companies already doing the walkthroughs—now everyone else must ”go the extra mile.”
• Frustration from large-scale UST owners who now must use potentially dozens of different forms to satisfy state-specific form rules in umpteen states.
• Uncertainty until the majority of operators figure out who will inspect and how to document and fix problems.
• Overwhelmed contractors being called to fix problems found during inspection.
• Lag with certified UST trainers amending their Class A/B training material.
PS: What About Dispensers?Technically above the shear valve, dispensers are usually not part of the universe of UST regulations. However, many dispensers are prone to high use and serious wear and tear so adopting a dispenser inspection plan is a great risk-management decision. If you want to include them as part of your monthly rounds, see PEI/RP500: Inspection & Maintenance of Motor Fuel Dispensing (2011 Edition). Inspectors have noted that there is a very high rate of shear valve failure in diesel tanks. ■
Ben Thomas is currently on the PEI/RP900 rewrite committee and is
pleased to report that after 15 years as a state UST inspector plus 15 years as a UST trainer, he’s still excited about UST education. In 2009, Ben began
giving out complimentary copies of PEI RP 900’s monthly inspection form to his Class A/B operators, a practice he
continues today. Contact Ben at [email protected].
Historic Note: Ben Thomas wore
a NEIWPCC “LUST BUSTER” T-shirt to the commemorative
signing of the Vermont UST Act by then Governor Madeline Kunin in
Hardwick Vermont in 1987.
■ Verifying Insurance from page 23 ■ 30-Day Walkthrough Inspection from page 3

25
June 2017 • LUSTLine Bulletin 82
The Association of State and Te r r i t o r i a l S o l i d W a s t e M a n a g e m e n t O f f i c i a l s
(ASTSWMO) Tanks Subcommittee includes four Task Forces that serve as liaisons between state UST programs and the USEPA, and provides a forum for sharing information and ideas among state regulatory officials. The ASTSWMO UST Task Force’s mission is to represent the interests of state and territorial programs whose primary responsibility is the environmental regulation of state and federally regulated USTs.
At one of our recent meetings, Don Taylor, the UST Task Force’s Region 4 member from the Tennessee Department o f Environmenta l Conservat ion (TDEC), shared information about Total Containment, Inc. (TCI) flexible piping systems. As some of you may recall, TCI piping did not perform well in the field. TDEC and other states have required UST owners to replace or permanently close some TCI piping due to potential failures. However, TDEC inspectors continue to find TCI piping still in service during routine inspections. Even though TCI went out of business in 2004, TCI’s legacy of installed piping is still with us today.
In this article, Don Taylor provides a brief history of TCI piping along with inspection observations and regulatory activities relating to TCI piping in Tennessee. Mr. Taylor is working with the ASTSWMO UST Task Force and other states to determine if issues with TCI piping are being observed elsewhere and to examine the severity of this problem nationwide.
Thanks to Kevin Henderson and Marcel Moreau for their contributions to this article.
The Enviroflex SagaAdvances in technology occur fre-quently in the petroleum industry, sometimes making it difficult for state and federal UST regulatory agencies to keep pace with the trends in the
marketplace. An example of this issue was the introduction of flexible ther-moplastic piping in the early 1990s for petroleum UST applications. The first manufacturer to enter this mar-ket was Total Containment, Inc. (TCI) with a product called Enviroflex.
In August 1990 the USEPA determined that TCI’s “Enviroflex” flexible plastic piping systems were “no less protective of human health and the environment” than the other piping materials allowed by the agency per the 1988 federal UST rules.1 In making this determination, USEPA acknowledged that prototype TCI piping systems would be secondarily contained, monitored continuously with interstitial sensors, and inspected monthly. EPA also noted that this determination would be reconsidered “should operational problems with the integrity of the piping system”arise.2 From 1990 to 2004 TCI manufactured several different versions of its flexible piping that was installed at thousands of UST facilities. (See Table 1 on page 27 for a complete list.)
As early as 1993, TCI began receiving reports of Enviroflex piping failures. Failures of the first two ver-
sions were attributed to degradation of the outer urethane covering due to exposure to gasoline (first version) and water (second version). Exposure of the first version to gasoline, which was inevitable because the inner liner of the pipe was somewhat permeable to gasoline, resulted in cracking of the outer covering which would then fall off, exposing the reinforcing mesh underneath (see Figure 1). Exposure of the second version to water pro-moted the growth of naturally occur-ring fungus that then proceeded to feed on the urethane. In the early stages, this was evidenced by black staining on the outer covering (see Figure 2).
In addition, model 1500 TCI pipe (yellow) was never listed by UL for use with alcohol fuels. Any yellow TCI pipe containing alcohol blended gasoline is out of compliance with the compatibility requirements of the rules.
By the mid 1990s, TCI began to offer replacement piping to tank owners who had installed the yellow pipe. Only those places where the facility owner had registered the pipe or a TCI distributor/contractor
ASTSWM0—The UST/LUST Connection
Flexible Piping: Still Failing After All These Years
■ continued on page 26
Figure 1. The outer covering of the earliest version of Enviroflex was not compatible with gasoline. This resulted in the material cracking and falling off, exposing the reinforcing webbing beneath.

26
LUSTLine Bulletin 82 • June 2017
sites since the survey only included portions of the state.
In Tennessee, when UST inspec-tors encounter any type of in-service product piping system in which deg-radation of the outer covering, severe bending, splitting, delamination, or other visible deformation is observed, they are required to issue a Flex Pip-ing Failure Notice to the tank owner immediately. This notice informs the
efforts to inform t a n k o w n e r s o f potential problems. TDEC issued a bul-letin to tank owners and service provid-ers, encouraging the inspection of flex-ible plastic piping for symptoms of imminent failure. As a result, many UST facilities in Tennes-see were found to be operating with TCI piping that TDEC determined was not compat-ible with petroleum UST systems. TDEC required replace-ment or permanent closure of all TCI yellow piping sys-tems still found in use after 2004.
Lingering ProblemsAlas, however, during routine UST facility inspections, inspectors con-tinue to encounter facilities with Envi-roflex piping still in service. In 2016 TDEC began collecting data on flex-ible plastic piping issues found in the state. So far, visible signs of flexible piping degradation have been con-firmed at a total of sixteen facilities. TDEC suspects this may only repre-sent up to a third of possible problem
notified TCI of the existence of the pipe were part of the replacement program. Many tank owners did not bother to send in the warranty cards and/or no one reported to TCI that the pipe had been installed. If no one registered the pipe and no one reported the installation to TCI by TCI’s July 1999 deadline, then the pipe was never replaced.
TCI model 1501 pipe (bone or white color) suffered from a differ-ent problem. The inner liner of this pipe was made of a material called Carilon, which was very resistant to exposure to chemicals, but manu-facturing the inner tube of the pip-ing without defects was difficult. Defects in the Carilon liner allowed petroleum to seep into the outer lay-ers of the pipe, making them soft and spongy (see Figure 3).
TCI model 1503 pipe (blue) suf-fered from yet another problem. The materials of construction were gener-ally compatible with petroleum and water, and there were fewer manu-facturing defects, but the materials used tended to swell, causing the pipe to lengthen significantly after installation. This often resulted in the pipe being kinked or bent beyond its design specifications (See Figure 4).
Additional failure modes of TCI pipe can be viewed by going to http://www.neiwpcc.org/lustline/supplements.asp and clicking on “Supplement to LUSTLine 82.”
Getting the Word OutReaders who have worked in the UST regulatory realm since the late 1990s may be familiar with the efforts of the Mississippi Department of Environmental Quality and Florida Department of Environmental Protec-tion to alert the industry and govern-ment agencies to the problems found with flexible thermoplastic piping. In 2002 Mississippi DEQ took a lead role in investigating and notifying tank owners of the problems found in their state. Formal notices were issued to tank owners, alerting them to the signs of potential failure associ-ated with certain types of flex piping, including TCI Enviroflex
Many states, including the Ten-nessee Department of Environment and Conservation (TDEC), followed the lead of Mississippi and Florida’s
■ ASTSWMO from page 25
Figure 3. When the inner Carilon liner of the model 1502 piping failed, the body of the pipe became soft and spongy due to the infiltration of product into the outer layers of the pipe.
Figure 2. The outer covering of the second version of Enviroflex was subject to fungal growth when exposed to water. This resulted in dark stains and cracks in the material.
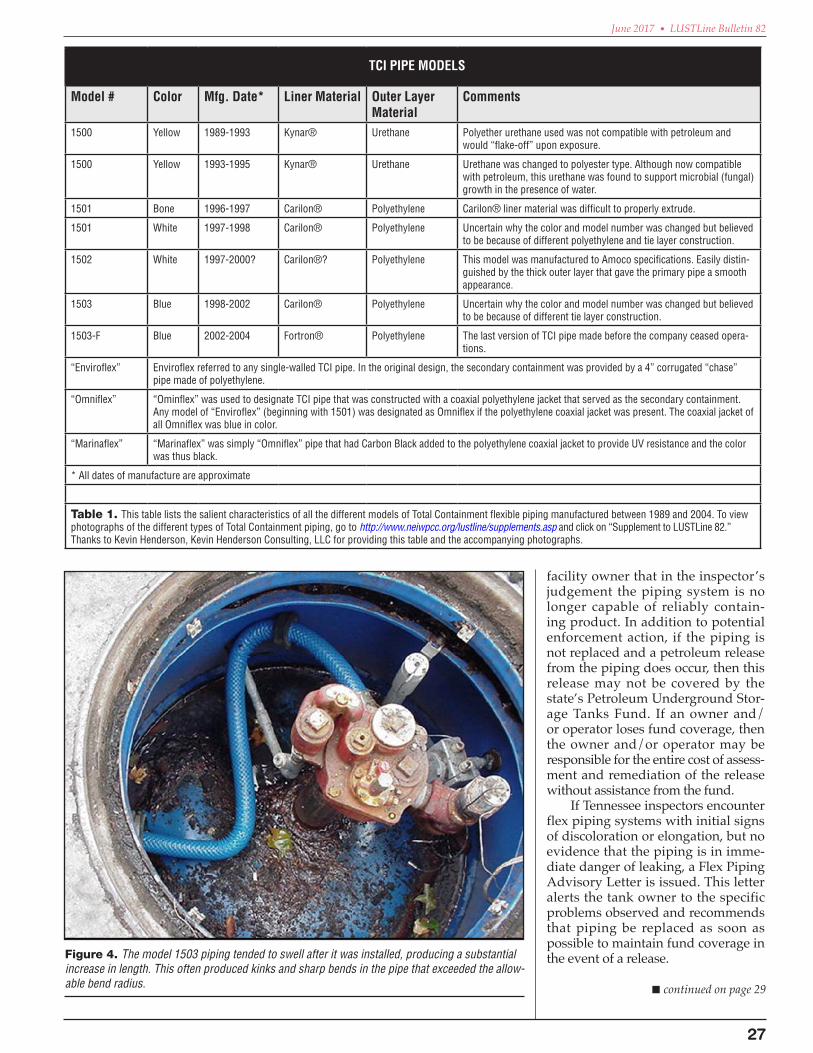
27
June 2017 • LUSTLine Bulletin 82
TCI PIPE MODELS
Model # Color Mfg. Date* Liner Material Outer Layer Material
Comments
1500 Yellow 1989-1993 Kynar® Urethane Polyether urethane used was not compatible with petroleum and would “flake-off” upon exposure.
1500 Yellow 1993-1995 Kynar® Urethane Urethane was changed to polyester type. Although now compatible with petroleum, this urethane was found to support microbial (fungal) growth in the presence of water.
1501 Bone 1996-1997 Carilon® Polyethylene Carilon® liner material was difficult to properly extrude.
1501 White 1997-1998 Carilon® Polyethylene Uncertain why the color and model number was changed but believed to be because of different polyethylene and tie layer construction.
1502 White 1997-2000? Carilon®? Polyethylene This model was manufactured to Amoco specifications. Easily distin-guished by the thick outer layer that gave the primary pipe a smooth appearance.
1503 Blue 1998-2002 Carilon® Polyethylene Uncertain why the color and model number was changed but believed to be because of different tie layer construction.
1503-F Blue 2002-2004 Fortron® Polyethylene The last version of TCI pipe made before the company ceased opera-tions.
“Enviroflex” Enviroflex referred to any single-walled TCI pipe. In the original design, the secondary containment was provided by a 4” corrugated “chase” pipe made of polyethylene.
“Omniflex” “Ominflex” was used to designate TCI pipe that was constructed with a coaxial polyethylene jacket that served as the secondary containment. Any model of “Enviroflex” (beginning with 1501) was designated as Omniflex if the polyethylene coaxial jacket was present. The coaxial jacket of all Omniflex was blue in color.
“Marinaflex” “Marinaflex” was simply “Omniflex” pipe that had Carbon Black added to the polyethylene coaxial jacket to provide UV resistance and the color was thus black.
* All dates of manufacture are approximate
Table 1. This table lists the salient characteristics of all the different models of Total Containment flexible piping manufactured between 1989 and 2004. To view photographs of the different types of Total Containment piping, go to http://www.neiwpcc.org/lustline/supplements.asp and click on “Supplement to LUSTLine 82.” Thanks to Kevin Henderson, Kevin Henderson Consulting, LLC for providing this table and the accompanying photographs.
Figure 4. The model 1503 piping tended to swell after it was installed, producing a substantial increase in length. This often produced kinks and sharp bends in the pipe that exceeded the allow-able bend radius.
facility owner that in the inspector’s judgement the piping system is no longer capable of reliably contain-ing product. In addition to potential enforcement action, if the piping is not replaced and a petroleum release from the piping does occur, then this release may not be covered by the state’s Petroleum Underground Stor-age Tanks Fund. If an owner and/or operator loses fund coverage, then the owner and/or operator may be responsible for the entire cost of assess-ment and remediation of the release without assistance from the fund.
If Tennessee inspectors encounter flex piping systems with initial signs of discoloration or elongation, but no evidence that the piping is in imme-diate danger of leaking, a Flex Piping Advisory Letter is issued. This letter alerts the tank owner to the specific problems observed and recommends that piping be replaced as soon as possible to maintain fund coverage in the event of a release.
■ continued on page 29

28
LUSTLine Bulletin 82 • June 2017
Implementation of underground storage tank regulations is a responsibility retained by the
federal government for Indian Country. To fulfill that requirement the United States Environmental Protection Agency (USEPA) enters into cooperative agreements with federally recognized Tribes, Tribal Nations, or Tribal Consortiums.
For the last 10 years, the Oneida Nation (Oneida) in Wisconsin has been a recipient of one of these coop-erative agreements. The focus of this agreement has been to provide com-pliance assistance to all federally
registered tank facilities within the Oneida Reservation and to the other federally recognized Tribes in Wis-consin for release detection and spill prevention. The unique approach that Oneida has developed is to pro-vide a three-day intensive “UST Boot Camp.” Since developing this pro-gram in 2010, almost 300 attendees have completed the course and over 50 Tribal nations have participated.
Along with the Boot Camp, Oneida has a travel trailer outfitted with UST-related equipment models and an interactive experience for equipment parts. The trailer is brought to participating stations, and an on-site learning experience is developed that includes a site w a l k - t h ro u g h , d i s c u s s i o n o f proper operation and maintenance procedures, operator responsibilities, and fuel delivery best practices.
The information presented at the Boot Camps and during site visits, is intended to prepare participants to take the forthcoming, web-based USEPA A/B/C operator tests. For the
Tanks On Tribal LandsUST Operator Boot Camps in Oneida Countryby Michael Arce & Victoria Flowers
Michael Arce showing the UST Compliance Assistance trailer used for on-site visits and training.
Boot Camp trainees at the tank-top exercise.
Some of the props used for the UST Boot Camp and Compliance Assistance visits.

29
June 2017 • LUSTLine Bulletin 82
past three years, based on pre-and post-knowledge assessments given at each Boot Camp, participants have increased their scores, on average, by over 30 percent! ■
Michael Arce is a federally credentialed UST inspector and is the Compliance Assistance Inspector for the Oneida Compliance Assistance Program. He
can be reached at [email protected].
Victoria Flowers is an Environmental Specialist for the Oneida Nation and assists Michael with the UST Boot
Camp. She can be reached at [email protected].
ENIPC Receives Compliance Assistance Training Grant
USEPA awarded a five-year grant to the Eight Northern Indian Pueblos Council (ENIPC) to provide underground storage tank (UST) compliance assistance training to owners and operators within Indian country and to
specialized UST training to tribal personnel. This grant replaces one that ended on March 31, 2015 with the Inter Tribal Council of Arizona. The ENIPC grant was awarded through a competitive process, and all tribal organizations were encour-aged to submit proposals.
The grant supports compliance with federal UST regulations in Indian coun-try by educating UST owners and operators, training tribal government person-nel, promoting compliance program development, and offering collaboration opportunities for tribes. ENIPC will help and work with tribes across the nation to address their UST compliance assistance training needs while focusing on areas with the greatest needs.
To access these services contact Rebecca Martin, ENIPC Program Manager, at [email protected] or call 505-692-8181. For more information about USEPA’s UST program in Indian country, visit https://www.epa.gov/ust/underground-stor-age-tanks-usts-program-indian-country. ■
Davis, R.V., 2009, “Update on Recent Studies and Proposed Screening Criteria for the Vapor-Intrusion Pathway,” LUSTLine 61, 11–14.
DeVaull, G.E., 2007, “Indoor Vapor Intrusion with Oxygen-Limited Biodegradation for a Subsurface Gasoline Source,” Environmental Science and Technology, 41, 3241–3248.
Johnson P.C., Ettinger, R.A., 1991, “Heuristic Model for Predicting the Intrusion Rate of Contaminant Vapors Into Buildings,” Environmental Science and Technology, 25, 1445–1452.
Obamascik, M., 2002, “EPA home-toxins test ‘crude and limited’; Widely used computer model often wrong,” Denver Post, January 7, 2001, A-1.
U.S. Environmental Protection Agency, 2012, “Petroleum Hydrocarbons And Chlorinated Hydrocarbons Differ In Their Potential For Vapor Intrusion,” , Washington, DC.
U.S. Environmental Protection Agency, 2015, “Technical Guide for Addressing Petroleum Vapor Intrusion at Leaking Underground Storage Tank Sites,” U.S. Environmental Protection Agency, Washington, DC, EPA 510-R-15-001.
Utah Department of Environmental Qual-ity, 2015, “Guidelines for Utah’s Corrective Action Process for Leaking Underground Stor-age Tanks Sites,” Third Edition Final Draft.
Jim Weaver is with the USEPA Ground Water and Ecosystem Restoration Division of the Office of Research and Development National Risk
Management Research Laboratory in Ada, Oklahoma. He can be reached at
580-436-8550.
Robin V. Davis is recently retired from the Utah Department of Environmental
Quality in Salt Lake City, Utah. She can be reached at 801-300-7431.
potential? If the 2% of cases can be attributed to certain parameter values such as extremely low air exchange rates, and if these are not likely for the building in question, then a judgment might be reached that there is low PVI potential. Considerations such as these require recourse to site knowledge and data.
I n d i s c u s s i o n w i t h s t a t e regulators at the 2015 National Tanks Conference and a 2016 ASTSWMO workshop, however, some state regulators indicated that if the model indicated any exceedances, then further investigation was justified. These deliberations highlight the need for the model use to be tied to the site investigation and conceptual site model of the contamination, and the need for multiple lines-of-evidence in PVI assessment. ■
The User’s Guide for PVIScreen is currently being formatted for
distribution on USEPA’s website. Contact Jim at [email protected] for the document and code, until the web
address has been determined.
ReferencesAmerican Petroleum Institute, 2010, User’s Manual,
BioVapor: A 1-D Vapor Intrusion Model with Oxygen-Limited Aerobic Biodegradation.
What Are You Seeing in Your State?Tennessee, in cooperation with the ASTSWMO UST Task Force, is currently conducting a national survey to determine the severity of problems associated with the degradation of TCI flex piping, as well as flex piping failures from other manufacturers. Inspectors are encouraged to provide photographs and document any facility with TCI piping in place, whether evidence of degradation is present or not. This documentation may assist your state agency with future investigations if the need arises. Sharing this information with ASTSWMO will help with determining the severity of this problem nationwide. ■
Endnotes1. “Review of Total Containment’s ‘Enviroflex’
Piping,” memo from Dave O’Brien, USEPA OUST to Lee Daniels, USEPA Region VII, August 1, 1990.
2. Ibid.
If you wish to contribute to the ASTSWMO flex pipe survey,
contact Don Taylor at [email protected].
■ PVIScreen Model from page 20 ■ ASTSWMO from page 27

30
LUSTLine Bulletin 82 • June 2017
In historic Washington County Tennessee a property that served as a train depot in the 1800s
and an auto center in the 1960s has been transformed into the Yee-Haw Brewing Company Taproom and White Duck Taco Shop. Indeed, there were many twists and turns on the path from train depot to brewery and restaurant, but the deed was done with a lot of steering by the Tennessee Division of Underground Storage Tanks (TDEC).
The “Tweetsie” Railroad Depot was constructed in Johnson City 1891 to transport passengers, iron ore, and timber from the mountains of northeast Tennessee and western North Carolina. The depot served the railway until passenger service stopped in the 1940s. In the 1960s, the depot was acquired by the Wexler family and transformed into a full service auto center. Four petroleum USTs were operated at this facility from 1965 until 1979.
When the auto center was closed, the tanks were taken out of service permanently and filled with foam. In 1989, the property was being considered for condemnation for commercial development . After a Phase II Environmental Assessment indicated petroleum contamination concentrations in the soil that exceeded cleanup standards, remedial act ions were taken.
The Benzene to Beer Trail by Eric Ward
▲ The East Tennessee and Western North Carolina (ET&WNC) “aka” Tweetsie” Railroad began serving the Johnson City area in the early 1882. Narrow gauge passenger service was offered in addition to transportation of coal, iron ore, and industrial materials. The railroad served the area locally for passenger service until the early 1950’s and continued to transport materials for local industries as a until 1994.
▲ The Tweetsie Depot operated briefly as a bus terminal in the 1950’s, and as a retail automotive service center until 2010. Local citizens and city officials made efforts to restore and preserve the property until it was acquired for revitalization in 2015.
Today the YeeHaw Brewing Company has completed restoration of the building using many original architectural features of the original Tweetsie Depot. In addition to an onsite beer brewery, a taco shop operates next door in the restored structure. The site is now a centerpiece of the downtown revitalization efforts for the City of Johnson City.

31
June 2017 • LUSTLine Bulletin 82
Subsequent activities by TDEC and the property owner determined no further action was required.
In 2014, the City of Johnson City collaborated with the Yee-Haw Brewing Company to assist in renovating the former UST site through grants, utility relocation, and site assessment and development consultation with the Washington County Economic Development C o u n c i l . Ye e - H a w B r e w i n g Company opened in 2015 and joins three other brewpubs located in former gasoline dispensing locations, unofficially known as the “Benzene to Beer Trail.”
Stan Boyd, Director of the Division of USTs, shared his reflections on the project. “Due to UST’s historical involvement with the property and its regional historical relevance, our staff monitored construction activity throughout the renovation process. It’s exciting to see an old service center converted into a thriving business in the heart of this redevelopment. The depot, which once served freight and passengers on a rail line, now serves up brews and tacos. ■
Eric Ward is TDEC’s Communication Director.
Name ____________________________________________________________________________________________
Company/Agency ________________________________________________________________________________
Mailing Address __________________________________________________________________________________
E-mail Address ___________________________________________________________________________________
❏ One-year subscription: $18.00
❏ Federal, state, or local government: Exempt from fee. (For home delivery, include request on agency letterhead.)
Please enclose a check or money order (drawn on a U.S. bank) made payable to NEIWPCC.
Send to: New England Interstate Water Pollution Control Commission, Wannalancit Mills, 650 Suffolk Street, Suite 410, Lowell, MA 01854
Phone: (978) 323-7929 ■ Fax: (978) 323-7919 ■
[email protected] ■ www.neiwpcc.org
L.U.S.T.LINE Subscription Form
NEIWPCC is excited to announce that the next National Tanks Confer-ence (NTC) has been scheduled for September 11–13, 2018, at the Galt House Hotel in Louisville, Kentucky. The 2015 NTC in Phoenix was a
major success, and we look forward to planning and hosting the event again in Louisville. Please visit our conference website for updates on the call for abstracts, registration, amenities, and more: http://www.neiwpcc.org/tanks-conference/.
Since the last LUSTLine issue, NEIWPCC has worked to plan and imple-ment a number of training opportunities. Aimed at state and tribal inspectors, NEIWPCC makes training available through the UST Inspector Training Webi-nar Series. Recent training topics have included Statistical Inventory Recov-ery (SIR) and Continuous In Tank Leak Detection (CITLD), Containment Sump Testing, and UST Overfill Prevention. NEIWPCC is working to develop addi-tional training on a number of topics, including UST maintenance and repair. Archived inspector training webinars can be found here: http://www.neiwpcc.org/inspectortrainingwebinararchive.asp.
For the state and tribal LUST audience, NEIWPCC continues to offer train-ing through the LUST Corrective Action Webinar Series. Recent training has centered on Emerging Cleanup Technology and LNPAL Conceptual Site Models. NEIWPCC is currently working to develop training under the larger theme of Risk-Based Corrective Action. Archived corrective action webinars can be found here: http://www.neiwpcc.org/lust-cawebinararchive.asp.
If you have any questions about the National Tanks Conference, training webinars, or other aspects of NEIWPCC’s UST/LUST program, please feel free to contact Drew Youngs, NEIWPCC’s UST Program Manager at [email protected]. ■
Tank news From neIwPCC.......

L.U.S.T.LINENew England Interstate WaterPollution Control CommissionWannalancit Mills650 Suffolk Street, Suite 410Lowell, MA 01854
Non-Profit Org.U.S. Postage
PAIDWilmington, MA
Permit No.200
L.U.S.T.Line IndexAugust 1985/Bulletin #1 – October 2016/Bulletin #81
To download the index, go to www.neiwpcc.org/lustline/
then click on LUSTLine Index.
L.
U.S.T.LINE
New England Interstate Water Pollution Control Commission
NEW LUSTLINE T-shirts
Short-sleeve: S–XXL: $10Long-sleeve: S–XXL: $15 To order: Visit www.neiwpcc.org/portal or e-mail [email protected].