new firm performance and the replacement of...
TRANSCRIPT
New Firm Performance and the
Replacement of Founder-CEOs
Jing Chen*
Copenhagen Business School
Peter Thompson**
Emory University
November 2012
In this paper we study some causes and consequences of founder-CEO replace-ments among a sample of 4,172 Danish startups created by single founders in 1999 and 2000. In contrast to the extant literature on VC-financed firms, re-placements among firms in our sample are more likely among the worst- and best-performing firms, and replacement is not unambiguously associated with better subsequent performance. Firms that replaced the founder as CEO were much more likely to fail, but the surviving firms among them grew considerably faster. We also analyze subsequent earnings and occupational choices of founders who rescinded operating control of their firms. Although subsequent founder in-come is increasing in the performance of their firms, those that left good firms were no more likely than others to found another business. Our results are consis-tent with the notion that founder-CEO replacement is driven in part by mis-matches between business quality and founder ability.
JEL Classification Codes: D21, D22, J62, L26
Keywords: Entrepreneurship, business creation, founder turnover, CEO turnover.
* CBS - Department of Innovation and Organizational Economics, Kilevej 14, 2000 Fre-deriksberg, Denmark. Email: [email protected]. ** Goizueta Business School, Emory Universi-ty, 1300 Clifton Road, Atlanta, GA 30322, USA. Email: [email protected]. We appreciate helpful comments from: Christian Catalini, Alberto Galasso, Mirjam Van Praag, participants in the 2012 Summer Residence Week for Entrepreneurship Econo-mists at Oxford University, the Roundtable for Engineering Entrepreneurship Research at Georgia Tech, and in seminars at the University of Amsterdam, the University of Lugano and Emory University.
1
1. Introduction
How does firm performance influence the likelihood that founder-CEOs of new businesses cede operating control to a specialist manager? What implications does the departure of the founder have for subsequent business performance? And what happens to founders after they have left? This paper reports the results of an analysis of the causes and consequences of founder-CEO replacement among a cohort of new businesses founded in Denmark. Our empirical work uses the matched employer-employee database maintained by Statistics Denmark, and draws samples from the universe of new businesses created in Denmark during 1999 and 2000. These firms are generally small, they are almost invariably not financed by venture capital, and they are generally not at risk of an IPO event. We know surprisingly little about founder turnover1 among such firms.
A growing literature has provided us with substantial insight into the causes and consequences of founder-CEO replacement in other types of firms. This literature, which has focused on high-growth and VC-backed firms2, finds that founder-CEO replacement is most likely to occur after a period of rapid expansion [e.g., Boeck-er and Karichalil (2002)], or upon attainment of critical milestones such as com-pletion of product development or securing new rounds of outside funding [Was-serman (2003)]. More important, perhaps, is that founder-CEO replacement is typically motivated by an expectation among stakeholders that the firm is likely in the near future to undergo an episode of transformational growth. Indeed, a significant portion of the literature explicitly samples on such expectations by studying only firms that are preparing for an IPO [e.g., Nelson (2003), Jain and Tabak (2008), Pollack, Fund and Baker (2009)].
The extant research lacks findings that we can confidently extrapolate to the firms that are the focus of the present paper. First, VC-financed firms appear to
1 We will use the terms founder-CEO replacement and founder turnover interchangeably to describe an event where the founder of a firm, who had been managing the firm as his or her primary occupation, rescinds operating control while maintaining ownership rights. 2 Of course, executive turnover in established, typically public, firms has been extensively studied for many years [e.g., Hofer (1980), Chen and Hambrick (2012)]. There is also an active literature on succession in family-owned businesses, but the concerns of this litera-ture are rather different from those in which executive control is passed outside the founder’s family. See Handler (1994) for a review.

2
exhibit founder-CEO replacements at much higher rates than firms that are not subject to significant control by outside equity investors [Hellman and Puri (2002), Boeker and Wiltbank (2005)]. Second, few of the firms in our sample are ever likely to undergo transformations of the sort that appear to motivate many founder-CEO substitutions among VC-financed firms. Third, VC-financed firms are not random draws from the firm population. They are more likely to grow substantially, they are better financed, and their founders and employees on av-erage have more human capital. Correlations between variables estimated from a sample drawn from the upper tail of the quality distribution may not hold in other segments of the population, especially when there are possibilities of non-monotonic relationships in the population as a whole.
It is well-known that VC-financed firms account for a tiny fraction of business launches3 but they play a much larger role in economic growth, employment crea-tion and innovation. As a result, academic effort to understand the dynamics of control in VC-financed firms is appropriately disproportionate to their numbers. Nonetheless, given their numerical importance, we should also be concerned with the control dynamics of the typical small business. Patterns of founder turnover among representative businesses also provide insight into the forces governing business transfers.4 They are also key to understanding the expected opportunity costs of business creation, as well as the dual phenomena of serial and portfolio entrepreneurs.
In this paper we study founder-CEO replacements among a sample of 4,172 Da-nish startups created in 1999 and 2000. To ensure that the departure of the founder indicates a meaningful change in control, the sample consists only of firms that were created by a single founder, and where the founder worked as his primary job in the business. The firms and founders we study represent all firms founded in Denmark that meet these criteria. Only 18 percent of them are classi-
3 For example, in the United States, 626,771 new businesses were created in 2008, only 3,276 of which received VC financing (Bureau of labor Statistics at http://www.bls. gov/bdm/entrepreneurship/bdm_chart1.htm; and NCVA (2009). 4 Founders may sell businesses because they are poorly matched to the needs of the busi-ness, or because they have reasons to cash out their equity position. Looking at founder-CEO replacements among businesses that are not transferred, allows us to gain insights about the first of these two motivations.

3
fied as high-tech, while wholesale, retail, construction and manufacturing are well-represented; this is a much broader sample than has previously been used to study founder-CEO replacement. Our data are drawn from Denmark’s national matched employer-employee dataset, so we are also in a unique position to ex-plore what happens to the founders after they have left the firm. We study in-stances of founder-CEO replacement and we track the firms and founder until 2005. The data allow us to distinguish business turnover from founder turnover and, in this paper, we focus on the causes and consequences of events in which the founder retires from active management but continues to retain controlling ownership. That is, our focus is on CEO succession in small firms, rather than business transfers.5
To guide our empirical work, we develop a simple model of firm creation, surviv-al, and founder turnover. The goal of founder-CEO replacement among VC-backed firms is generally held to be resolving mismatches between the skills of the founder-CEO and the expected demands of the transforming enterprise. We also develop a framework based on mismatches between business and founder, although our model focuses on current rather than anticipated mismatches. We suppose that firm performance is a function of the ability of the founder and the quality of the business idea, both of which are draws from stable population dis-tributions. Ability and quality are complements in production so that there can arise mismatches of sufficient magnitude to justify replacing the founder with an outside CEO who is better suited to the business.6
Our theoretical framework motivates us to consider the possibility that founder-CEO turnover is most likely in the tails of the initial performance distribution, and that, while good early performance is on average associated with good future performance, this effect is stronger in firms that had no turnover. What we find in the data is a little more complex than this. We do find that turnover is more likely in the tails of the firm performance distribution and, conditional on firm
5 The classic empirical study of small business transfers is Holmes and Schmitz (1995). 6 Our theoretical framework is related to the models of business transfers developed by Holmes and Schmitz (1990, 1995), and to the model in Braguinsky et al. (2012), which explores the effect of the cost of evaluating ideas on founder turnover. We shall comment further on the relationship between our theoretical framework and these models in the next section.

4
survival, turnover is associated with higher rates of growth. However, turnover is also associated with higher firm exit rates. We also explore the earnings and oc-cupational choices of founders who have relinquished day-to-day control of their firms. Our framework and our empirical results are both consistent with the in-tuitive notion that founders who were replaced in high-performing businesses subsequently earn more than those who left low-performing businesses but, less intuitively perhaps, they are no more likely to create another startup.
2. Theoretical Framework
There are two periods. In the first period, a founder with ability q has an idea of quality q1. Ability is general and determines both the success with which the founder can manage a firm that implements the idea, and his earnings in alterna-tive employment. We assume that founder ability is innate, fixed over time and known to the founder. Idea quality incorporates a variety of factors influencing performance, including the quality of the underlying idea or technology, its adap-tation and fit to the market, and the public’s state of knowledge about the firm’s product. Some of these factors may be regarded as fixed, while others evolve over time as the business model is refined. Upon entry, the founder knows , but he only knows that q1 is a random draw from the distribution
1( | ).F q q The realiza-
tion of q1 is observed after entry. The business idea is refined and adapted to the market, yielding a new quality q2 in the second period, which is drawn from
( )2 1| .G q q
In each period, t = 1, 2, output is given by
1 t t
t ty q a aq-= , (1)
for some [0, 1].t
a Î Although, q and q are assumed to be complements in both periods, we allow for the relative importance of ability and idea quality to vary from one period to the next.
Profit in period 1 is given by
1 11
1 1q wa ap q q-= - . (2)
The only cost is the opportunity cost of the founder’s time, which is assumed to be linearly increasing in ability. For concreteness, we shall suppose this alterna-
5
tive use of the agent's time is in wage work.
At the end of the first period, q2 is observed and a decision is then made whether to contract with an outside CEO to replace the founder, to continue without change of leadership, or to exit. If the outside CEO has ability q , she must be paid a wage .wq If a replacement CEO is hired, a transition cost, c, must be paid. This cost reflects both direct costs of any disruption associated with a change in leadership, as well as any premium necessary to resolve agency prob-lems arising from the separation of ownership and control [Fama and Jensen (1983), Jensen and Meckling (1976)].7 The rewards to recruiting an outside CEO are that the CEO’s ability can be chosen optimally in light of the realization of q2, and the founder is released to earn wq elsewhere while remaining as the resi-dual claimant on the firm’s earnings. The founder is replaced by an outsider if
( )2 2 2 21 1
2 2argmax q w c q wa a a a
qq q q q- -- - > -
, (3)
and if the term on the left hand side of (3) is positive. The profit-maximizing ability of the external CEO is given by
( ) 21/(1 )
2 2/ w q
aq a
-= , (4)
so maximized profits in period 2 are
( )2 21*2 2 2
max ,q w Aq ca ap q q-= - - , (5)
where 2 2/(1 )
2 2(1 )( / ) .A w a aa a -= - If *
20,p < the firm exits.
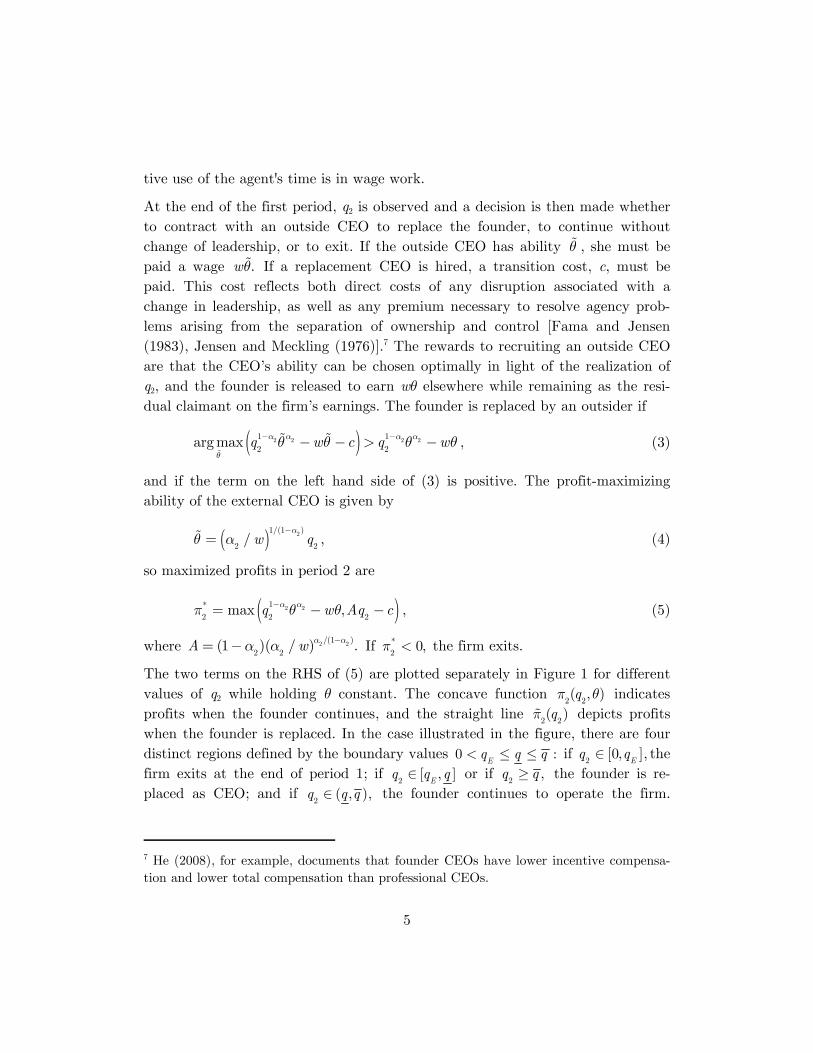
The two terms on the RHS of (5) are plotted separately in Figure 1 for different values of q2 while holding q constant. The concave function
2 2( , )qp q indicates
profits when the founder continues, and the straight line 2 2( )qp depicts profits
when the founder is replaced. In the case illustrated in the figure, there are four distinct regions defined by the boundary values 0 :
Eq q q< £ £ if
2[0, ],
Eq qÎ the
firm exits at the end of period 1; if 2
[ , ]E
q q qÎ or if 2
,q q³ the founder is re-placed as CEO; and if
2( , ),q q qÎ the founder continues to operate the firm.
7 He (2008), for example, documents that founder CEOs have lower incentive compensa-tion and lower total compensation than professional CEOs.
6
When 2
[ , ]E
q q qÎ , the founder is replaced because the opportunity cost of his time does not justify continued commitment to the business model; he is replaced by an external CEO who is less able than the founder. In contrast, when
2q q³
the founder is replaced by an external CEO with higher ability.
Figure 1 also illustrates the effect of an increase in the founder’s ability, from q to .q¢ This reduces the profitability of the founder continuing with the firm when
the quality of the idea is low, and increases it when the idea is good. It is easy to verify that the intersection of
2 2( , )qp q and
2 2( , )qp q¢ lies between q and ,q and
hence that the effect of an increase in q is to raise both q and .q The interval
[ , ]E
q q will vanish if the founder’s ability declines sufficiently so that .E
q q< There are, therefore, two distinct cases. In one case, when founders have limited ability, the period 2 outcomes fall into three distinct groups, with replacement of founders occurring only at higher values of q. In the second case, founders are replaced in firms with business models drawn from the tails of the quality distri-bution among all surviving firms. Which of these cases arises depends on the founder’s ability, as well as other parameters of the model. For example, an in-crease in the transition cost, c, shifts
2 2( )qp down, which may eliminate the in-
terval [ , ];E
q q that is, if the increase in c is large enough, replacement of founders occurs only at high values of q2 and in each case the replacement has higher abili-ty than the founder. Clearly, the minimum value of c that eliminates the interval
Eq
q q2
q0
2 2( )qp
2 2( , )qp q
c-
wq-
wq¢-
2 2( , )qp q¢
q q¢ >
FIGURE 1. Second period payoffs; c>0.

7
[ , ]E
q q depends on the founder’s ability.8
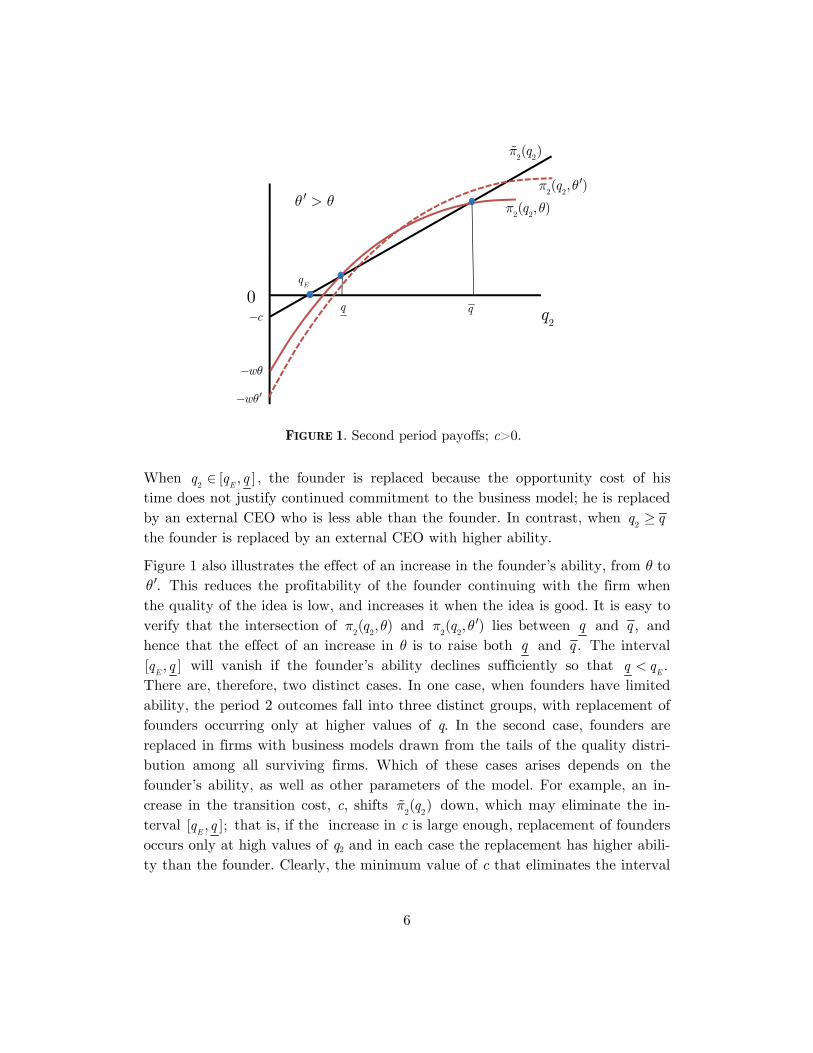
Figure 2 provides a more complete depiction of the model’s implications. Firms that are closed down are those with low-quality ideas. If the founder does not want to continue to operate the firm, continuation requires a new CEO. Howev-er, payment of the transition cost cannot be justified in low-quality firms. The boundary separating firms that are discontinued from those that are continued with the founder at the helm is given by the pairs
2{ , }q q satisfying
21/(1 )
2,q w aq -= showing that low-ability founders may continue to operate a busi-
ness that a high-ability founder would close down. Founder turnover in continu-ing firms occurs in two distinct groups. First, there is a group of firms with high-quality ideas but that were founded by agents of sufficiently low ability to merit replacement with a more able CEO. The boundary between this group and the group of founders that continue to operate their own firm is defined by the func-
8 When 0,c > it is always the case that .q q< In the limiting case of 0,c = the func-tion
2 2( )qp
is then tangential to
2 2( , )qp q for any value of q. and .q q In this case,
every founder is replaced, because it is always efficient to secure a perfect match between CEO ability and idea quality.
FIGURE 2. Ability, idea quality, and outcomes.
q2
(log scale)
q(log scale)
Replace with less able CEO
Replace with more able CEO
Founder continues to operate firm
Firm exits and founder enters wage employment
21/(1 )1A w a- --
1
2q cA-=
21/(1 )
2q w aq -=
( )q q
( )q q

8
tion ( )q q that provides the larger of the solutions to the equation 2 21
2 2.Aq c q wa aq q-- = - As the transition cost rises, ( )q q unambiguously shifts
upwards. The second group consists of firms with able founders but whose firms are of middling quality. The quality of the idea is high enough to prefer continua-tion over exit, but not high enough to merit continuation of the founder. The re-placement CEO has lower ability than the founder. The boundary between this group and those that exit is a horizontal line at 1
2.q cA-= The boundary be-
tween this group and the group of founders that continue to operate their own firm is given by the function ( )q q that provides the smaller of the solutions to
2 21
2 2Aq c q wa aq q-- = - . An increase in the transition cost shifts ( )q q downwards. Figure 2 shows that ( )q q and ( )q q are both positively sloped, which is consistent with the discussion around Figure 1.
2.1 Baseline simulations
The empirical implications of our theoretical framework depend critically on the joint distribution of q2 and q (and, by virtue of the correlation between q1 and q2, on the joint distribution of initial idea quality and founder ability). For example, the implication that founder turnover occurs both when q2 is high (relative to q) and when it is low requires that we observe in any sample instances where con-trasting values of q2 and q coexist. Similarly, the transition cost cannot be so high that it eliminates the interval [ , ].
Eq q Because this may not be the case, and de-
spite the simplicity of the theoretical framework, there are no general empirical predictions about the relationships between performance in the two periods, founder ability and turnover. We will therefore make use of some numerical simu-lations to explore the possibilities of the model.
However, it is useful to consider some reasonable ways in which we can limit the varied possibilities. We do so in two ways. The first imposes a constraint on the transition cost, c, such that the model predicts an aggregate rate of turnover that approximates the rate (about 12 percent) that we observe in our data. The second makes use of a simple free-entry condition to help us constrain the rela-tionship between ability and the quality of the idea. We want to admit entrepre-neurs of all abilities. This will be the case if all agents, regardless of ability, are indifferent between entrepreneurship and wage work in period 1. If the quality of ideas and agent ability are independent of each other, then high-ability agents, who bear a higher opportunity cost of becoming an entrepreneur, will find busi-
9
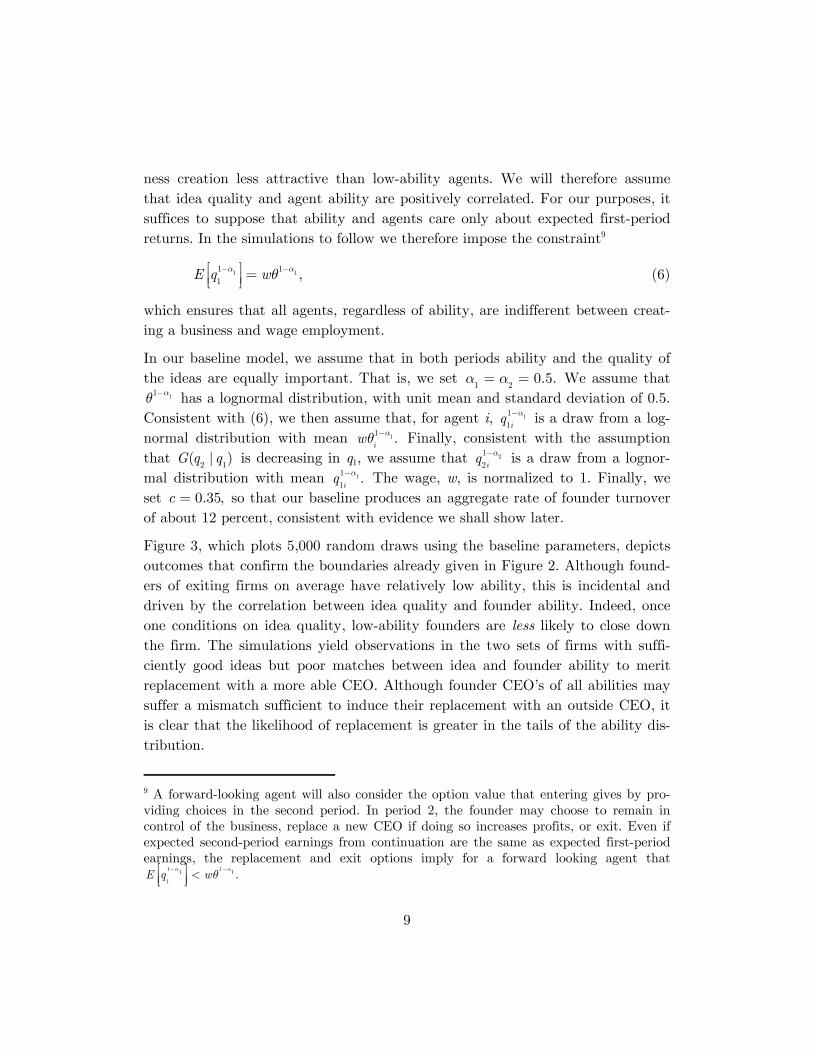
ness creation less attractive than low-ability agents. We will therefore assume that idea quality and agent ability are positively correlated. For our purposes, it suffices to suppose that ability and agents care only about expected first-period returns. In the simulations to follow we therefore impose the constraint9
1 11 1
1,E q wa aq- -é ù =ê úë û (6)
which ensures that all agents, regardless of ability, are indifferent between creat-ing a business and wage employment.
In our baseline model, we assume that in both periods ability and the quality of the ideas are equally important. That is, we set
1 20.5.a a= = We assume that
11 aq - has a lognormal distribution, with unit mean and standard deviation of 0.5. Consistent with (6), we then assume that, for agent i, 11
1iq a- is a draw from a log-
normal distribution with mean 11 .i
w aq - Finally, consistent with the assumption that
2 1( | )G q q is decreasing in q1, we assume that 21
2iq a- is a draw from a lognor-
mal distribution with mean 11
1.
iq a- The wage, w, is normalized to 1. Finally, we
set 0.35,c = so that our baseline produces an aggregate rate of founder turnover of about 12 percent, consistent with evidence we shall show later.
Figure 3, which plots 5,000 random draws using the baseline parameters, depicts outcomes that confirm the boundaries already given in Figure 2. Although found-ers of exiting firms on average have relatively low ability, this is incidental and driven by the correlation between idea quality and founder ability. Indeed, once one conditions on idea quality, low-ability founders are less likely to close down the firm. The simulations yield observations in the two sets of firms with suffi-ciently good ideas but poor matches between idea and founder ability to merit replacement with a more able CEO. Although founder CEO’s of all abilities may suffer a mismatch sufficient to induce their replacement with an outside CEO, it is clear that the likelihood of replacement is greater in the tails of the ability dis-tribution.
9 A forward-looking agent will also consider the option value that entering gives by pro-viding choices in the second period. In period 2, the founder may choose to remain in control of the business, replace a new CEO if doing so increases profits, or exit. Even if expected second-period earnings from continuation are the same as expected first-period earnings, the replacement and exit options imply for a forward looking agent that
1 1
1
1 1 .E q wa a
q- -
<é ùê úë û

10
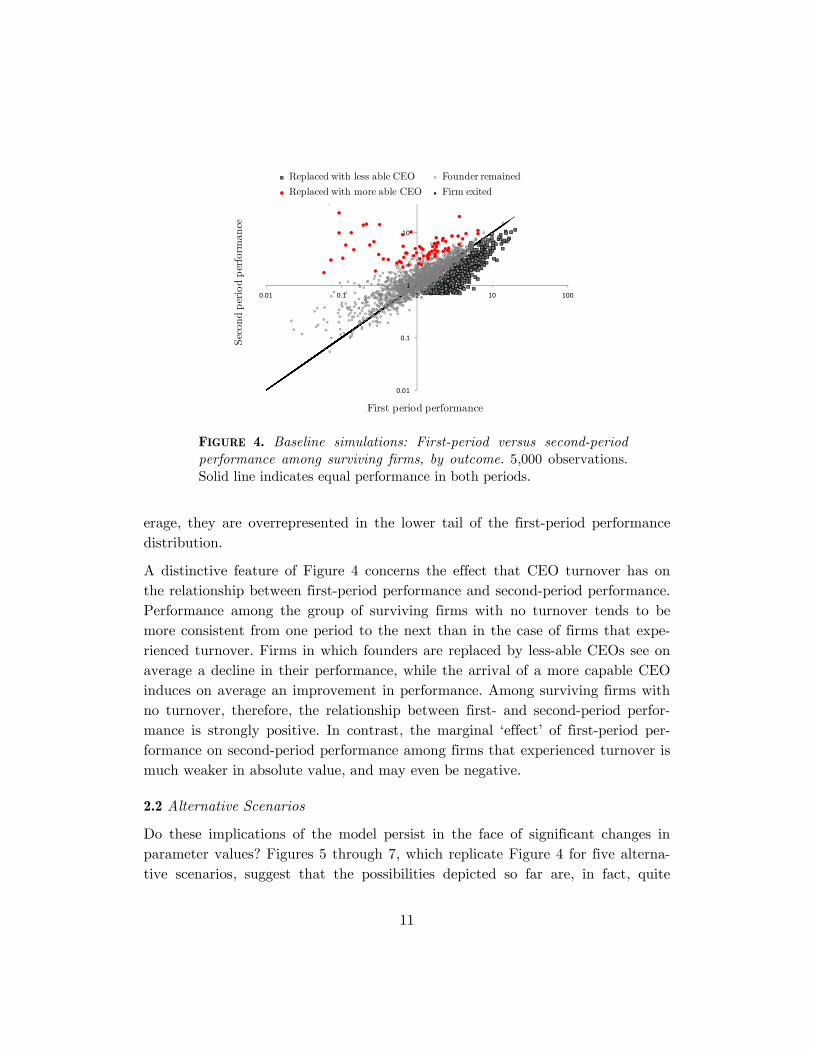
However, we do not get to observe q and q separately. In the data, we observe only their combined contribution to revenues, and it is not obvious that we should also expect to see more frequent founder-CEO replacements in the tails of the firm performance distribution. Figure 4 therefore plots simulated first- and second-period revenues of surviving firms by founder status for our baseline simu-lations. The two distinct groups of founders that experience turnover are also clearly evident when we look at first-period performance, and they are indeed drawn more frequently from the tails of the performance distribution. There is a group with above-average performance in the first-period whose founders are re-placed with less able CEOs. There is also a group of firms whose founders are replaced with more able CEOs. This group consists of firms with low-ability founders, but their poor ability is offset by ideas that in the second-period are sufficiently high quality to justify payment of the transition cost (firms with the worst ideas in the second period are closed down). Although these firms have a mean first-period performance that is not much different from the population av-
0.0001
0.001
0.01
0.1
1
10
100
0.01 0.1 1 10 100
Idea
Qual
ity
in P
erio
d 2
, q 2
Founder ability, q
Replaced with less able CEO Founder remained
Replaced with more able CEO Firm exited
FIGURE 3. Baseline simulations Founder ability versus second-period idea quality, by outcome. 5000 observations. Parameters: a1=a2=0.5, w=1, c=0.35. Each 11 aq - is a draw from the lognormal with mean one, 11
1q a- is lognormal with
mean 11 ,aq -
and each 21
2q
a- is lognormal with mean 11
1;q a-
all
three distributions have a standard deviation of 0.5. Founder turnover occurs in about 12% of the observations.
11
erage, they are overrepresented in the lower tail of the first-period performance distribution.
A distinctive feature of Figure 4 concerns the effect that CEO turnover has on the relationship between first-period performance and second-period performance. Performance among the group of surviving firms with no turnover tends to be more consistent from one period to the next than in the case of firms that expe-rienced turnover. Firms in which founders are replaced by less-able CEOs see on average a decline in their performance, while the arrival of a more capable CEO induces on average an improvement in performance. Among surviving firms with no turnover, therefore, the relationship between first- and second-period perfor-mance is strongly positive. In contrast, the marginal ‘effect’ of first-period per-formance on second-period performance among firms that experienced turnover is much weaker in absolute value, and may even be negative.
2.2 Alternative Scenarios
Do these implications of the model persist in the face of significant changes in parameter values? Figures 5 through 7, which replicate Figure 4 for five alterna-tive scenarios, suggest that the possibilities depicted so far are, in fact, quite
0.01
0.1
1
10
100
0.01 0.1 1 10 100
Sec
ond p
erio
d p
erfo
rman
ce
First period performance
FIGURE 4. Baseline simulations: First-period versus second-period performance among surviving firms, by outcome. 5,000 observations. Solid line indicates equal performance in both periods.
Replaced with less able CEO Founder remained
Replaced with more able CEO Firm exited
12
0.1
1
10
0.01 0.1 1 10
Sec
ond p
erio
d p
erfo
rman
ce
First period performance
Replaced with less able CEO Founder remained
Replaced with more able CEO Series4
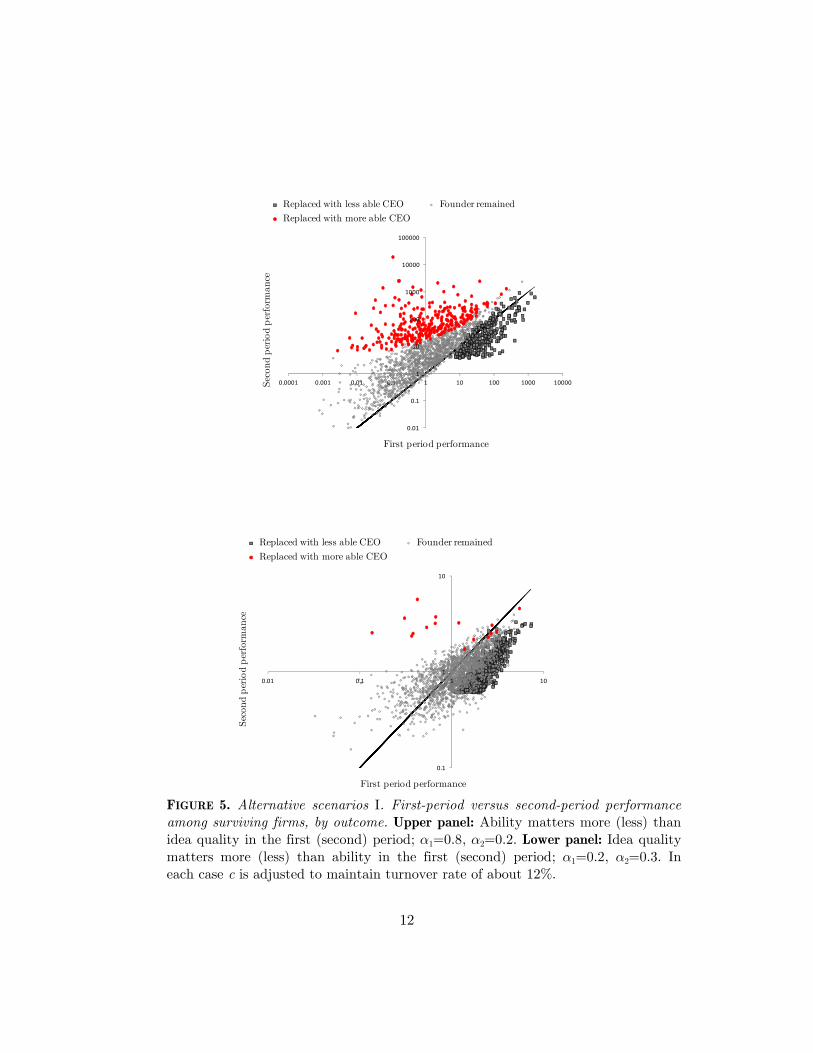
FIGURE 5. Alternative scenarios I. First-period versus second-period performance among surviving firms, by outcome. Upper panel: Ability matters more (less) than idea quality in the first (second) period; a1=0.8, a2=0.2. Lower panel: Idea quality matters more (less) than ability in the first (second) period; a1=0.2, a2=0.3. In each case c is adjusted to maintain turnover rate of about 12%.
0.01
0.1
1
10
100
1000
10000
100000
0.0001 0.001 0.01 0.1 1 10 100 1000 10000Sec
ond p
erio
d p
erfo
rman
ce
First period performance
Replaced with less able CEO Founder remained
Replaced with more able CEO Series4
13
0.1
1
10
100
0.01 0.1 1 10 100
Sec
ond p
erio
d p
erfo
rman
ce
First period performance
Replaced with less able CEO Founder remained
Replaced with more able CEO Series4
0.1
1
10
100
0.01 0.1 1 10 100
Sec
ond p
erio
d p
erfo
rman
ce
First period performance
Replaced with less able CEO Founder remained
Replaced with more able CEO Series4
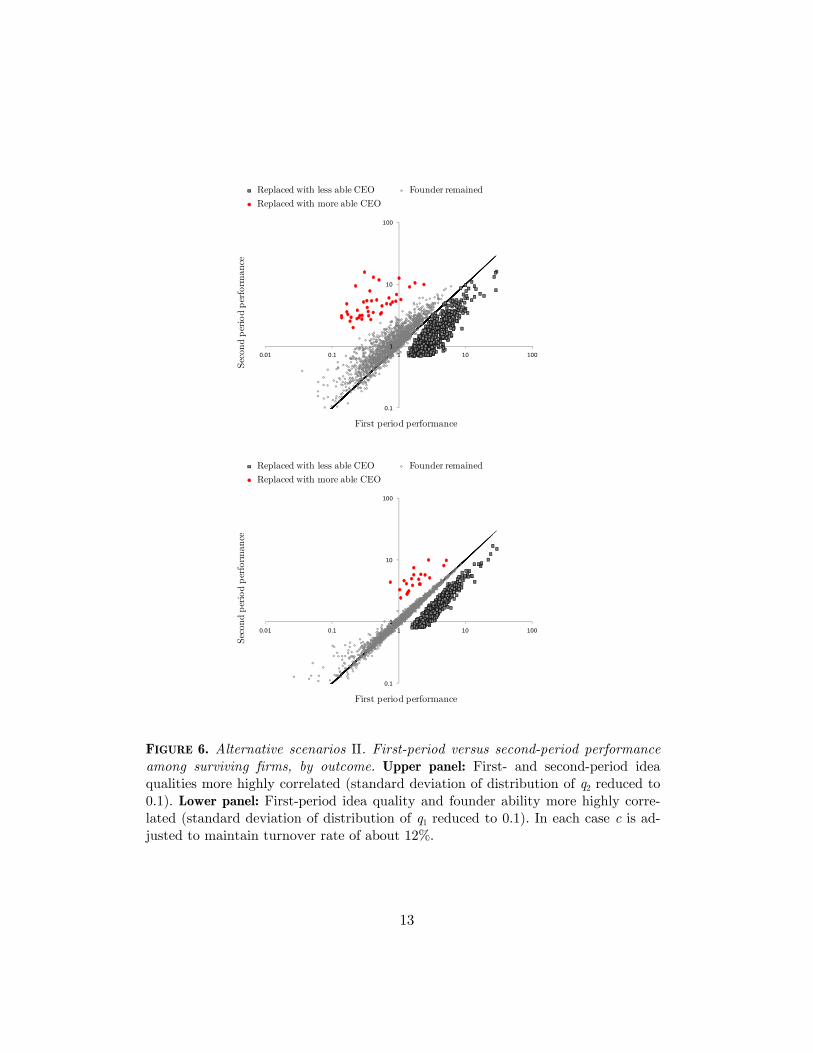
FIGURE 6. Alternative scenarios II. First-period versus second-period performance among surviving firms, by outcome. Upper panel: First- and second-period idea qualities more highly correlated (standard deviation of distribution of q2 reduced to 0.1). Lower panel: First-period idea quality and founder ability more highly corre-lated (standard deviation of distribution of q1 reduced to 0.1). In each case c is ad-justed to maintain turnover rate of about 12%.

14
robust. In Figure 5, the relative importance of idea quality and ability is altered across the two periods. In the upper panel, ability is most important in the first period
1 2( 0.8, 0.2),a a= = while in the lower panel it is more important in the
second 1 2
( 0.2, 0.8).a a= = The results reported in the baseline are not sensitive to these significant changes in the production technology. Figure 6 sharply alters the correlations between idea quality and ability. In the upper panel, the stan-dard deviation of the distribution of
2q is reduced by 80 percent, to 0.1, while
maintaining its mean equal to the realized value of 1
q ; the lower panel similarly increases the correlation between q and q1 by reducing the variance of the distri-bution of
1.q The three groups of surviving firms become even more distinct than
in the baseline, but the original pattern is preserved. Finally, in Figure 7 the cost of transitioning to a new CEO is reduced sharply, so that the fraction of firms that experience turnover is increased from about 12 percent to 35 percent. Again, the baseline results are robust to this change.10
10 Our data do not afford us an opportunity to explore the effects of changes in the tran-sition cost. However, Braguinsky et al. (2012) explore the effects of a likely decline in the
0.1
1
10
100
0.01 0.1 1 10 100
Sec
ond p
erio
d p
erfo
rman
ce
First period performance
Replaced with less able CEO Founder remained
Replaced with more able CEO Series4
FIGURE 7. Alternative scenarios III. First-period versus second-period performance among surviving firms, by outcome. Transition cost reduced to c=0.1, increasing founder turnover rate to about 35%.

15
2.3 Related models
There are, of course, different ways one may specify a model of mismatching. In this subsection we briefly compare our theoretical framework with three related models. The best known of these is Holmes and Schmitz (1995), in which agents vary in their ability to produce ideas, although all are equally gifted at managing. Agents with low innovative ability prefer to buy and manage existing businesses, while agents with high ability prefer to specialize in business creation (selling or closing each business they create). The outcomes for founders with intermediate ability depend on the quality of the business idea: they will close the worst busi-nesses and manage the best. A key determinant of the boundaries between the choices is the cost of transferring a business. Figure 8 illustrates. Clearly, only the better ideas produced by the more able innovators experience founder turnover.
cost of evaluating ideas in Japanese biotech firms, brought about by institutional reform. They find that a reduction in evaluation cost was associated with a large increase in the rate of founder turnover.
Transfer business and start another one
Founder continues to operate firm
Close business and find another to
manage.
Close business and start another one
q
q
FIGURE 8. Holmes and Schmitz (1990)

16
As managerial ability is fixed, the model predicts that business turnover is asso-ciated with high initial and subsequent firm performance, but it does not predict any change in performance after turnover.
In Braguinsky et al. (2012), entrepreneurs with known ability found businesses with unknown quality. As in our model, business quality and founder ability are complements in production. The quality remains unknown unless the founder chooses to pay an evaluation cost, c. High-ability agents know that they are at risk of wasting their time with a poor idea, so they choose to evaluate the idea, closing down business that are not good enough. Low-ability agents know that they may not be good enough mangers if their business quality is good; they also pay the evaluation cost and either close their business or transfer control to a professional manager. Agents with intermediate ability do not pay the evaluation cost; they continue to manage a business of unknown quality (see Figure 9). The model unambiguously predicts that only the better businesses founded by low-ability managers are at risk of founder turnover, and that turnover elicits an im-provement in performance. Auxiliary assumptions of the model associate better initial firm performance (i.e., the combination of business quality and founder ability) with turnover.
Founder continues to operate firm
Close business
q
q
Replace founder-CEO
q q
Close business
FIGURE 9. Braguinsky et al. (2012)
17
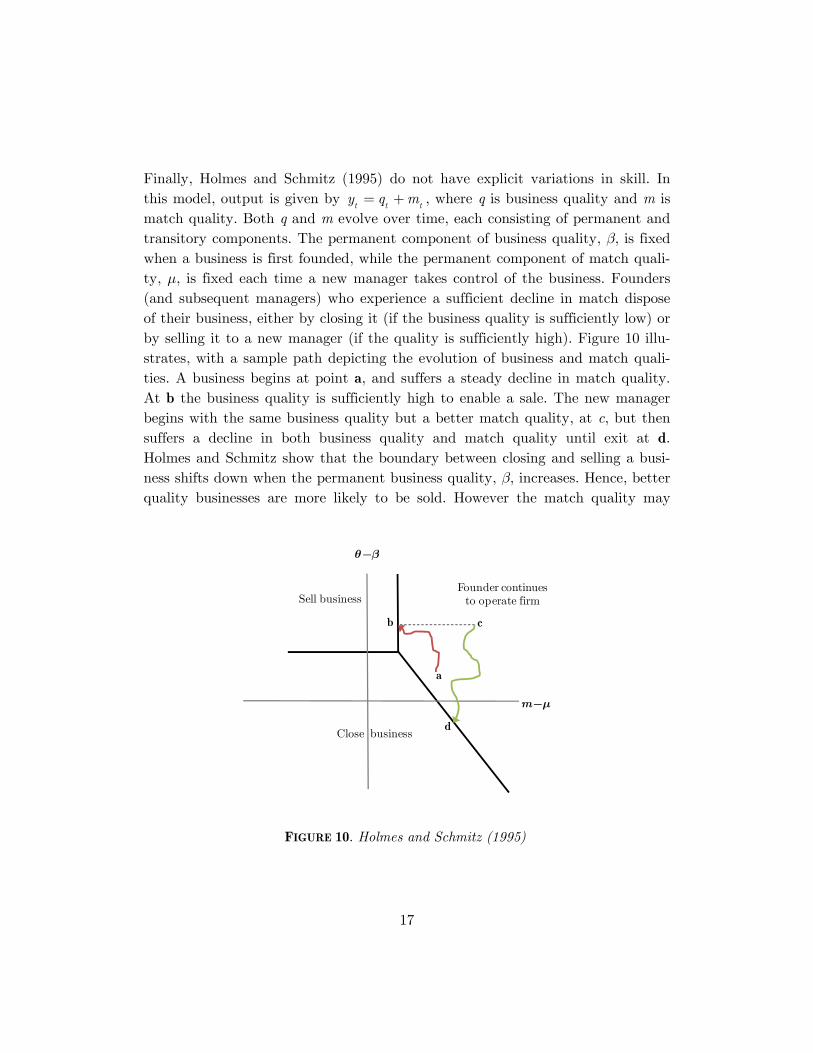
Finally, Holmes and Schmitz (1995) do not have explicit variations in skill. In this model, output is given by
t t ty q m= + , where q is business quality and m is
match quality. Both q and m evolve over time, each consisting of permanent and transitory components. The permanent component of business quality, b, is fixed when a business is first founded, while the permanent component of match quali-ty, m, is fixed each time a new manager takes control of the business. Founders (and subsequent managers) who experience a sufficient decline in match dispose of their business, either by closing it (if the business quality is sufficiently low) or by selling it to a new manager (if the quality is sufficiently high). Figure 10 illu-strates, with a sample path depicting the evolution of business and match quali-ties. A business begins at point a, and suffers a steady decline in match quality. At b the business quality is sufficiently high to enable a sale. The new manager begins with the same business quality but a better match quality, at c, but then suffers a decline in both business quality and match quality until exit at d. Holmes and Schmitz show that the boundary between closing and selling a busi-ness shifts down when the permanent business quality, b, increases. Hence, better quality businesses are more likely to be sold. However the match quality may
Sell businessFounder continues
to operate firm
Close business
q-b
m-m
a
b
d
c
FIGURE 10. Holmes and Schmitz (1995)

18
be little better after a sale, so despite better average performance after business turnover, there can be an increased risk of quick failure.11 It is not possible to re-late founder ability to the likelihood of business turnover in this model unless we impose some functional relationship between ability and the pair { , }.m q Doing so, however, would be unfair to the Holmes and Schmitz model, although it strikes us that their model could be made consistent with turnover occurring in the tails of the firm performance distribution.
3. Data and Sample Construction
Our empirical analysis focuses on all new business founded in Denmark in 1999 and 2000. We construct our samples out of three databases maintained by Statis-tics Denmark: the Entrepreneur Database, the Firm Database, and the Inte-grated Database for Labor Market Research (IDA).
The Entrepreneur Database is the primary source for identifying new businesses (partnerships or sole proprietorships) registered in Denmark each year, and pro-vides unique identifiers for each firm, each plant, and one individual identified in the registration documents. The Entrepreneur Database spans the period 1996 to 2006. However, accounting information is not collected for all industries until 1999, so this is the earliest cohort we study.
There are several limitations to the Entrepreneur Database. First, since only one person associated with the new business is recorded, the database provides no information for identifying possible co-founders. Second, some of those who ap-pear in the database may not be the “real” founder. For example, there are cases in which founders used their spouse’s name to register a business. Third, it is un-clear from the Entrepreneur Database whether or not the identified entrepreneur actually works at their startup. Although it is possible that entrepreneurs do not operate businesses themselves, this study focuses on those who were actually working for their own businesses. In order to identify these entrepreneurs and possible co-founders, the data obtained from the Entrepreneur Database are combined with information provided in the Firm Database.
The Firm Database consists of annual employment information on all workers
11 Figure 5 depicts the case where the m is common across matches. If m is lower after business transfer, the boundaries shift to the right, increasing the risk of business failure.

19
(full-time and part-time) at all firms operating in Denmark. The variable of par-ticular interest is their position in the firm, through which founders of each new business are identified in the following way. First, founders are those whose posi-tions are classified as self-employed, employers, or business tax payers. Second, for businesses with fewer than four employees, people whose positions are top managers are also defined as founders.12 Third, if nobody in a business with fewer than four employees is identified as a founder based on the previous two criteria, all employees are considered as cofounders. The fourth group of founders consists of those who registered the business, were working for the business, but did not meet the first three criteria for being a founder. Lastly, we identify individuals who registered the business, but did not appear to be working for the new firms (we will exclude this last category from the sample).
We link these businesses to the IDA, where more detailed information such as industry classification and employee demographics is available. The IDA is an employer-employee matched database, which provides mainly employment infor-mation at firm, establishment, and employee levels. The IDA enables us to track over time the turnover of founders, changes in firm status, and occupational choices of individuals each year until 2008. However, because of incomplete ac-counting and earnings data in the most recent years, we will follow firms only through 2004 and individuals through 2005.
Firm identifiers in the IDA are attached to a specific owner, so they change whenever there is a change of ownership. This design makes it possible to distin-guish three firm-level events in each year. Survival is assumed if the same firm identifier from the previous year appears in the current period. An ownership change occurs if the same establishments of the firm from the previous year are identified in the current period except that they are associated with a different firm identifier. A business exit is identified if all the establishments of the firm can no longer be found in the data.
In our analysis, the original founder of a startup must meet the following criteria: (1) He or she formed a startup in 1999 or 2000 as a sole proprietor; (2) The per-son was currently working at the new venture; and (3) The new business could be identified in the Firm Database and the IDA database, indicating that at least
12 This way to identify founders was first used by Sørensen (2007).
20
one person was working in the business as his or her primary job.13 Using the unique person and firm identifiers, we can track these founders’ employment in the following year to identify whether or not the founder was still working at the startup, and whether he was still an employer. A founder was staying at the star-tup if he could be identified in the firm in the following year, whether as an em-ployee or as an employer. Otherwise, the founder is assumed to have left the orig-inal firm because of turnover, business exit, or ownership change. In a few cases, the founder might stay at the startup after a change of ownership, but in each of these cases a new firm identifier is assigned to the startup.
Table 1 provides tabulations of changes in the status of startups and their found-ers from the founding year to 2005. Four outcomes are possible in each year: the firm exits, the firm is acquired or the firm continues, either with or without the founder remaining in operational control. Of 4,172 firms in the sample, a total of 533 (12.8 percent) of them eventually experienced founder turnover. Turnover was twice as common as ownership change (6.5 percent), but much less common than firm exit (50.6 percent). The hazard of turnover declines with firm age, de-clining from 5.11 percent in the first year, to 2.61 percent at age five.14
4. Firm Performance and Founder-CEO Replacement
In this section, we evaluate the relationships between startup performance and subsequent rates of founder turnover, and between founder turnover and subse-quent firm performance.
4.1 Startup performance and founder-CEO replacement
To assess the effect of initial performance on subsequent rates of founder-CEO replacement, we remove from the baseline sample 2,388 startups (918 from the 1999 cohort, and 1,470 from the 2000 cohort) that exited or were acquired before
13 This person may be the founder, so our sample includes single-person firms. We have, however, repeated our analyses after restricting the sample to including firms with at least two individuals. The results, available from the authors, are very similar to those reported here. 14 The declining hazard of turnover is consistent with gradual learning about match quali-ty [Jovanovic (1979)], which we have not attempted to model.

21
TABLE 1
Status Change of Startups by Year
Years after Founding 1 2 3 4 5 6*
Count Surviving: founder stays 2,996 2,247 1,829 1,535 1,321 Surviving: founder turnover 213 127 82 54 40 Firm exit 898 550 291 193 140 Firm acquired 65 72 45 47 34
Total 4,172 2,996 2,247 1,829 1,535
Hazards (percentage) Surviving: founder stay 71.81 75.00 81.40 83.93 86.06 87.16 Surviving: founder turnover 5.11 4.24 3.65 2.95 2.61 3.12 Firm exit 21.52 18.36 12.95 10.55 9.12 7.71 Firm acquired 1.56 2.40 2.00 2.57 2.21 2.02
Total 100 100 100 100 100 100
* Percentages for 1999 cohort only.
any occurrence of a founder turnover during the observation window between the founding year and 2005. Table 2 provides descriptive summary statistics for the remaining 1,784 startups and their founders. There are no large differences in means between founders that continued and founders who were replaced. Howev-er, the latter group are somewhat younger and less likely to have had vocational training; they are also more likely to come from the tails of the earning distribu-tion (either less than high school or at least college); they are also somewhat less likely to have founded businesses in construction, and more likely to be engaged in high-tech activities.
We first estimate the following logit model,
21 1 2 1 , 1 ,
ln ( )1
tt t i i t i t
t
plogsale logsale X Z
pa b b g d e- - -
æ ö÷ç ÷ç = + + + + +÷ç ÷÷ç -è ø (7)

22
where pt is the probability that the founder leaves a continuing firm in period t, is a vector of time-invariant variables related to founder demographics (gend-
er, marital status, age, and education) and startup founding conditions (founding year and industry), and , is a vector of potentially time-varying variables, such as firm age, founder age, marital status, and highest completed education.
Table 2
Descriptive Summary of Subsample 1
All No Turnover Turnover Age (mean years) 40.07 40.23 37.91 Male (%) 0.76 0.76 0.77 Married (%) 0.64 0.64 0.54
Education (%) less than high school 16.84 16.55 21.01 exact high school 6.66 6.34 11.07 vocational training 50.91 51.75 39.21 some college 14.72 14.66 15.57 bachelor 1.13 1.02 2.63 Master 7.66 7.66 7.69 Phd 0.69 0.69 0.75 others 1.38 1.33 2.06 Founded in 1999 (%) 42.28 42.69 36.59 Initial sales (1,000 DKK) 2,149 2,135 2,347 Initial no. of full-time employees 1.87 1.85 2.09
Industry (%) Agriculture 0.29 0.28 0.38 Manufacturing 7.25 7.34 6.00 Construction 17.57 17.86 13.51 Wholesale and retail 37.57 37.55 37.9 Transport, post, telecom 4.89 4.90 4.69 Low-tech businesses 6.93 6.93 6.94 Public Services 0.43 0.42 0.56 Personal Services 6.05 6.26 3.19 Kibs 0.44 0.34 1.88 High-tech 18.24 17.77 24.77 Others 0.34 0.35 0.19 Obs. 7,961 7,428 533
23
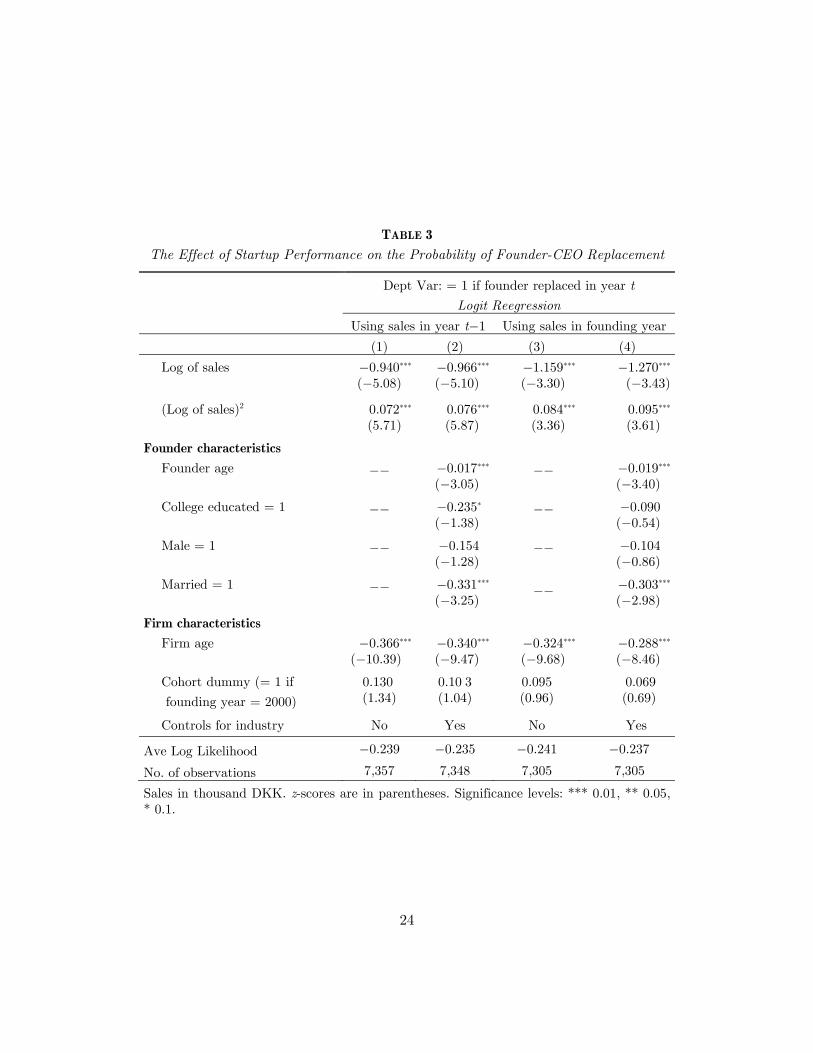
The key independent variable is the logarithm of sales in the previous period, along with its quadratic to allow for the possibility of a non-monotonic effect as predicted in Section 2.15 Columns (1) and (2) of Table 3 present the results. In column (1), we include controls only for firm age and founding year. The nega-tive coefficient on firm age reflects the declining hazard of founder-CEO replace-ment already noted in the summary statistics, while the cohort dummy is insigni-ficant. In column (2) we add some founder characteristics. The probability of founder-CEO replacement declines with founder age, it is lower for founders with college education, and it is lower for men and married founders. Both columns show a U-shaped relationship between the log of sales in the previous period and the likelihood of founder turnover in the current period, indicating that a founder is more likely to rescind operating control of the firm if it is located the tails of the performance distribution among all surviving firms. Columns (3) and (4) re-place sales in the previous period with sales in the startups’ first year of opera-tion. The results continue to show the U-shaped relationship, and the same ef-fects of founder characteristics and firm age on the likelihood of founder-CEO replacement. The minimum of the U-shaped relationship between prior perfor-mance and the probability of turnover occurs at revenue levels of DKK580,000 to DKK800,000, equal to 15 to 37 percent of the sample mean. This is also well within the sample range. Consistent with the predictions of our simple mismatch-ing model, therefore, we find that turnover is more common in the tails of the observed earnings distribution than in the middle.
4.2 Founder-CEO replacement and the subsequent performance of startups
To examine the relationship between founder-CEO replacement and subsequent firm performance, we use a subset of startups in the baseline sample and limit the observation window to the interval between the founding year and 2004. The startups included in this subsample meet two criteria. First, we eliminate firms in which the founder was replaced after 2002. That is, firms included in the sample either experienced founder turnover by 2002, or never had founder turnover dur-ing the observation period. Second, we remove startups that failed or were ac-quired between the initial founding year and 2002 but prior to any observed
15 For six observations with zero sales, we added one DKK to sales prior to taking the logarithm.
24
TABLE 3
The Effect of Startup Performance on the Probability of Founder-CEO Replacement
Dept Var: = 1 if founder replaced in year t
Logit Reegression
Using sales in year t-1 Using sales in founding year
(1) (2) (3) (4)
Log of sales -0.940*** -0.966*** -1.159*** -1.270*** (-5.08) (-5.10) (-3.30) (-3.43)
(Log of sales)2 0.072*** 0.076*** 0.084*** 0.095*** (5.71) (5.87) (3.36) (3.61)
Founder characteristics Founder age __ -0.017*** __ -0.019***
(-3.05) (-3.40)
College educated = 1 __ -0.235* __ -0.090 (-1.38) (-0.54)
Male = 1 __ -0.154 __ -0.104 (-1.28) (-0.86)
Married = 1 __ -0.331*** __ -0.303*** (-3.25) (-2.98)
Firm characteristics Firm age -0.366*** -0.340*** -0.324*** -0.288***
(-10.39) (-9.47) (-9.68) (-8.46)
Cohort dummy (= 1 if
founding year = 2000)
0.130 0.10 3 0.095 0.069 (1.34) (1.04) (0.96) (0.69)
Controls for industry No Yes No Yes
Ave Log Likelihood -0.239 -0.235 -0.241 -0.237
No. of observations 7,357 7,348 7,305 7,305
Sales in thousand DKK. z-scores are in parentheses. Significance levels: *** 0.01, ** 0.05, * 0.1.
25
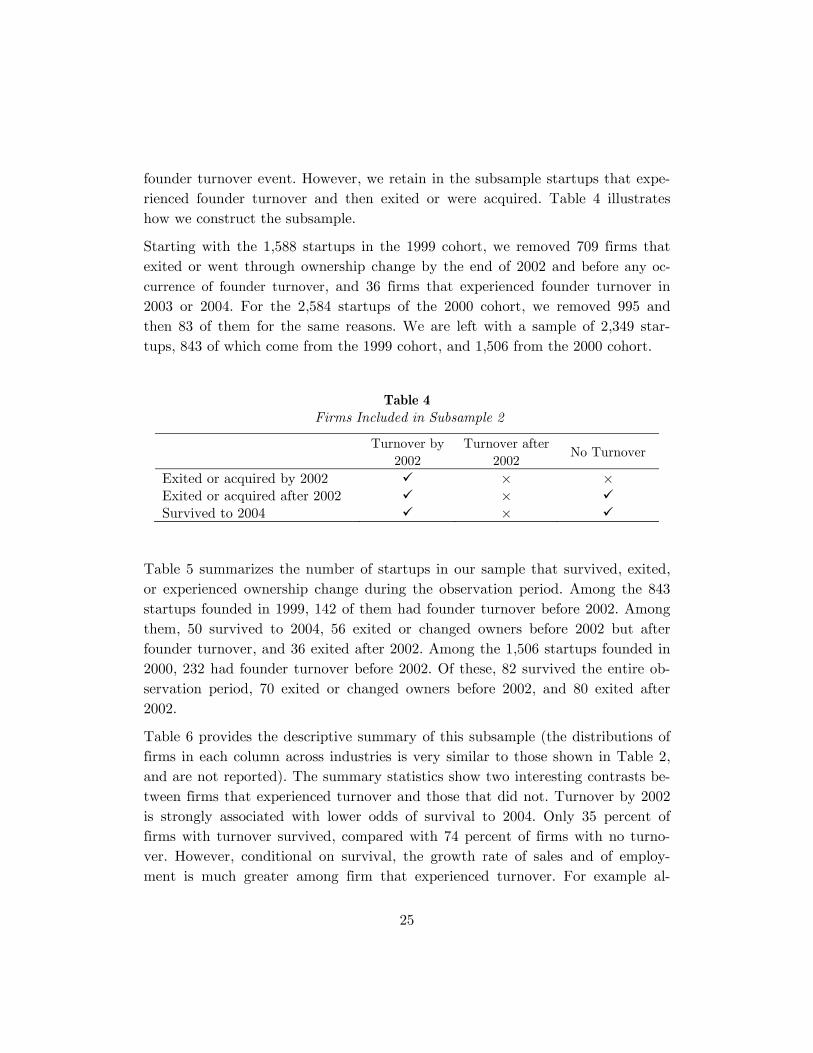
founder turnover event. However, we retain in the subsample startups that expe-rienced founder turnover and then exited or were acquired. Table 4 illustrates how we construct the subsample.
Starting with the 1,588 startups in the 1999 cohort, we removed 709 firms that exited or went through ownership change by the end of 2002 and before any oc-
currence of founder turnover, and 36 firms that experienced founder turnover in 2003 or 2004. For the 2,584 startups of the 2000 cohort, we removed 995 and then 83 of them for the same reasons. We are left with a sample of 2,349 star-tups, 843 of which come from the 1999 cohort, and 1,506 from the 2000 cohort.
Table 4 Firms Included in Subsample 2
Turnover by 2002
Turnover after 2002
No Turnover
Exited or acquired by 2002 × × Exited or acquired after 2002 × Survived to 2004 ×
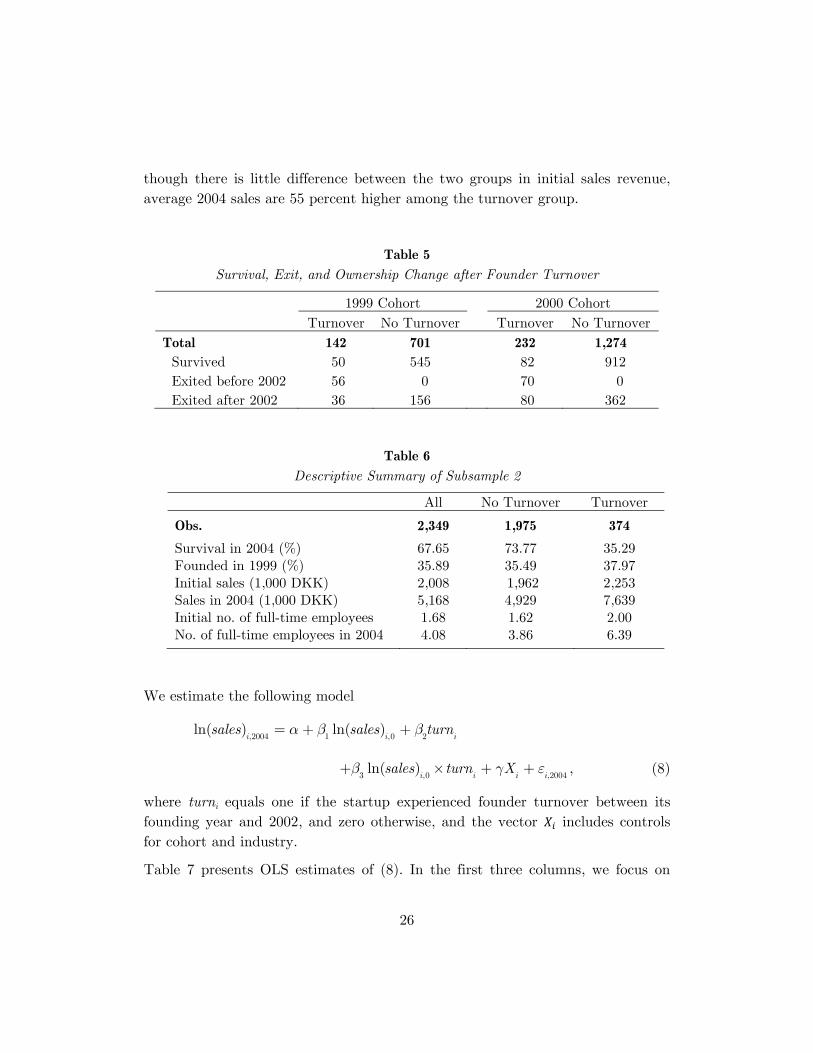
Table 5 summarizes the number of startups in our sample that survived, exited, or experienced ownership change during the observation period. Among the 843 startups founded in 1999, 142 of them had founder turnover before 2002. Among them, 50 survived to 2004, 56 exited or changed owners before 2002 but after founder turnover, and 36 exited after 2002. Among the 1,506 startups founded in 2000, 232 had founder turnover before 2002. Of these, 82 survived the entire ob-servation period, 70 exited or changed owners before 2002, and 80 exited after 2002.
Table 6 provides the descriptive summary of this subsample (the distributions of firms in each column across industries is very similar to those shown in Table 2, and are not reported). The summary statistics show two interesting contrasts be-tween firms that experienced turnover and those that did not. Turnover by 2002 is strongly associated with lower odds of survival to 2004. Only 35 percent of firms with turnover survived, compared with 74 percent of firms with no turno-ver. However, conditional on survival, the growth rate of sales and of employ-ment is much greater among firm that experienced turnover. For example al-
26
though there is little difference between the two groups in initial sales revenue, average 2004 sales are 55 percent higher among the turnover group.
Table 5
Survival, Exit, and Ownership Change after Founder Turnover
1999 Cohort 2000 Cohort
Turnover No Turnover Turnover No Turnover
Total 142 701 232 1,274 Survived 50 545 82 912
Exited before 2002 56 0 70 0
Exited after 2002 36 156 80 362
Table 6
Descriptive Summary of Subsample 2
All No Turnover Turnover
Obs. 2,349 1,975 374
Survival in 2004 (%) 67.65 73.77 35.29 Founded in 1999 (%) 35.89 35.49 37.97 Initial sales (1,000 DKK) 2,008 1,962 2,253 Sales in 2004 (1,000 DKK) 5,168 4,929 7,639 Initial no. of full-time employees 1.68 1.62 2.00 No. of full-time employees in 2004 4.08 3.86 6.39
We estimate the following model
,2004 1 ,0 2
ln( ) ln( )i i i
sales sales turna b b= + +
3 ,0 ,2004ln( )
i i i isales turn Xb g e+ ´ + + , (8)
where turni equals one if the startup experienced founder turnover between its founding year and 2002, and zero otherwise, and the vector includes controls for cohort and industry.
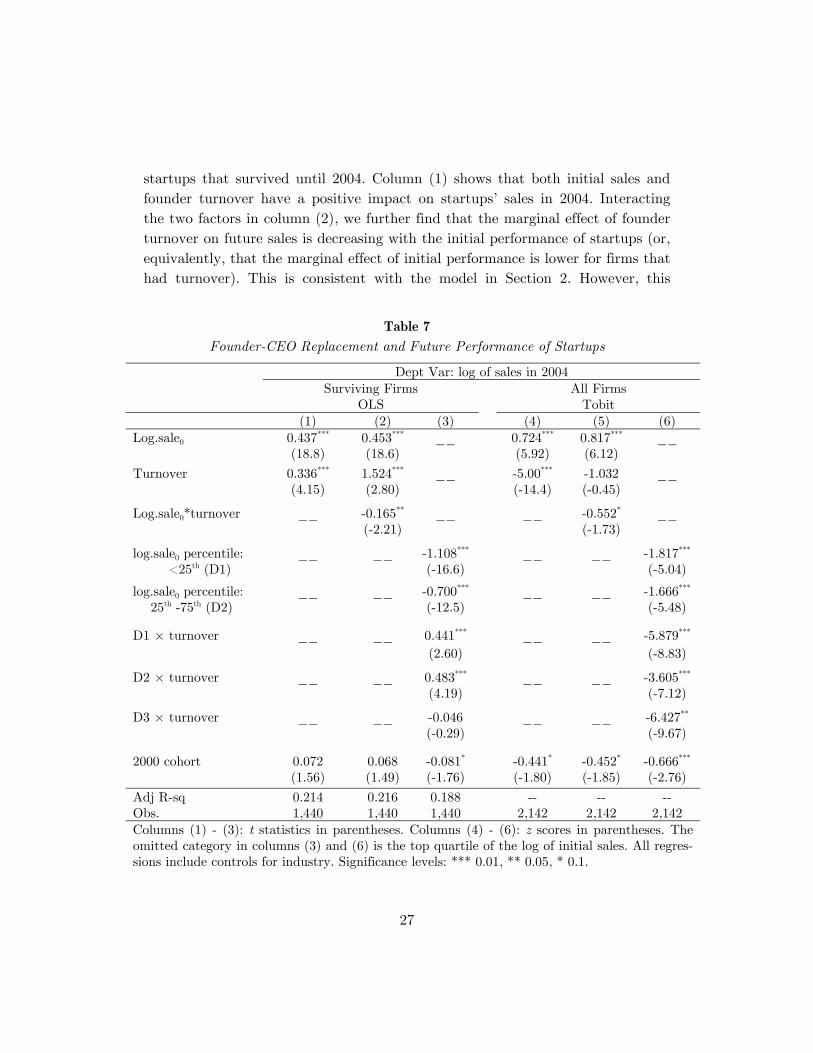
Table 7 presents OLS estimates of (8). In the first three columns, we focus on
27
startups that survived until 2004. Column (1) shows that both initial sales and founder turnover have a positive impact on startups’ sales in 2004. Interacting the two factors in column (2), we further find that the marginal effect of founder turnover on future sales is decreasing with the initial performance of startups (or, equivalently, that the marginal effect of initial performance is lower for firms that had turnover). This is consistent with the model in Section 2. However, this
Table 7
Founder-CEO Replacement and Future Performance of Startups
Dept Var: log of sales in 2004 Surviving Firms
OLS All Firms
Tobit
(1) (2) (3) (4) (5) (6)
Log.sale0 0.437*** 0.453*** __ 0.724*** 0.817*** __ (18.8) (18.6) (5.92) (6.12)
Turnover 0.336*** 1.524*** __ -5.00*** -1.032 __ (4.15) (2.80) (-14.4) (-0.45)
Log.sale0*turnover __ -0.165** __ __ -0.552* __ (-2.21) (-1.73)
log.sale0 percentile: <25th (D1)
__ __ -1.108*** __ __ -1.817*** (-16.6) (-5.04)
log.sale0 percentile: 25th -75th (D2)
__ __ -0.700*** __ __ -1.666***
(-12.5) (-5.48)
D1 × turnover __ __ 0.441*** __ __ -5.879*** (2.60) (-8.83)
D2 × turnover __ __ 0.483*** __ __ -3.605***
(4.19) (-7.12)
D3 × turnover __ __ -0.046 __ __ -6.427** (-0.29) (-9.67)
2000 cohort 0.072 0.068 -0.081* -0.441* -0.452* -0.666***
(1.56) (1.49) (-1.76) (-1.80) (-1.85) (-2.76)
Adj R-sq 0.214 0.216 0.188 -- -- -- Obs. 1,440 1,440 1,440 2,142 2,142 2,142 Columns (1) - (3): t statistics in parentheses. Columns (4) - (6): z scores in parentheses. The omitted category in columns (3) and (6) is the top quartile of the log of initial sales. All regres-sions include controls for industry. Significance levels: *** 0.01, ** 0.05, * 0.1.

28
positive effect of turnover is reduced to zero only at about the 95th percentile in the distribution of initial sales. In column (3), we replace the log of initial sales with three categorical variables that indicate membership in the bottom quartile, the upper quartile, or the middle of the distribution of the log of initial sales. The result confirms a positive correlation between initial and future performance. Meanwhile, founder turnover has a positive association with a startup’s future performance for the first two categories, but no association for the third category.
In columns (4) to (6), we estimate Tobit regressions including all firms in the subsample. For startups that exited or went through ownership change before 2004, we recode the logarithm of their sales as zero [cf. Dunne, Roberts and Sa-muelson (1989)], and make zero our threshold for inclusion in the linear portion of the model. The inclusion of exiting firms changes the results. Turnover is now associated with lower future performance for all firms, although as in the first three columns, the effect of turnover is worse for firms with good initial perfor-mance.
Table 8
Survival and Founder-CEO Replacement
Logit Model
Dept Var: =1 if firm survived to 2004
(1) (2)
log.sale0 percentile: <25th (D1) -0.458*** -0.450*** (-2.80) (-2.75)
log.sale0 percentile: 25th -75th (D2) -0.540*** -0.537*** (-3.83) (-3.81)
D1 × turnover -2.002*** -1.446*** (-8.01) (-5.36)
D2 × turnover -1.276*** -0.368 (-6.90) (-1.62)
D3 × turnover -2.178*** -1.337*** (-8.61) (-4.59)
2000 cohort -0.270*** -0.319*** (-2.61) (-2.97)
Ave. Log Likelihood -0.580 -0.579 Obs. 2,153 2,035 z scores in parentheses. All regressions include controls for industry. Significance levels: *** 0.01, ** 0.05, * 0.1.

29
The contrast between the OLS regressions for surviving firms and the Tobit es-timates for the full sample suggests that founder-CEO replacements have dispa-rate effects on survival and performance conditional on survival. To confirm this, in Table 8 we report the result of logit regressions where the dependent variable equals one if the firm survived to 2004 and zero otherwise. Column (1), which include all firms in our sample, clearly indicates lower survival rates for firms that experienced founder-CEO replacement, regardless of initial size. There is, however, a potential endogeneity problem in these two columns. It is possible the founders leave firms because they are already in the process of exiting, but our data do not record exits until after they have left. In column (2), we therefore remove from the sample 100 firms that had failed after founder departure but by 2002; these firms must have failed very soon after the founder left. Doing so does not alter the evidence that founder-CEO replacements are associated with higher failure rates.
This section has generated three central findings. First, founder-CEO replace-ment is more likely when firm performance is in the tails of the revenue distribu-tion. Second, replacement is associated with higher future sales among surviving firms. Third, replacement is associated with higher failure rates. We will draw some conclusions from these findings in Section 6.
5. What Happens to Replaced Founder-CEOs?
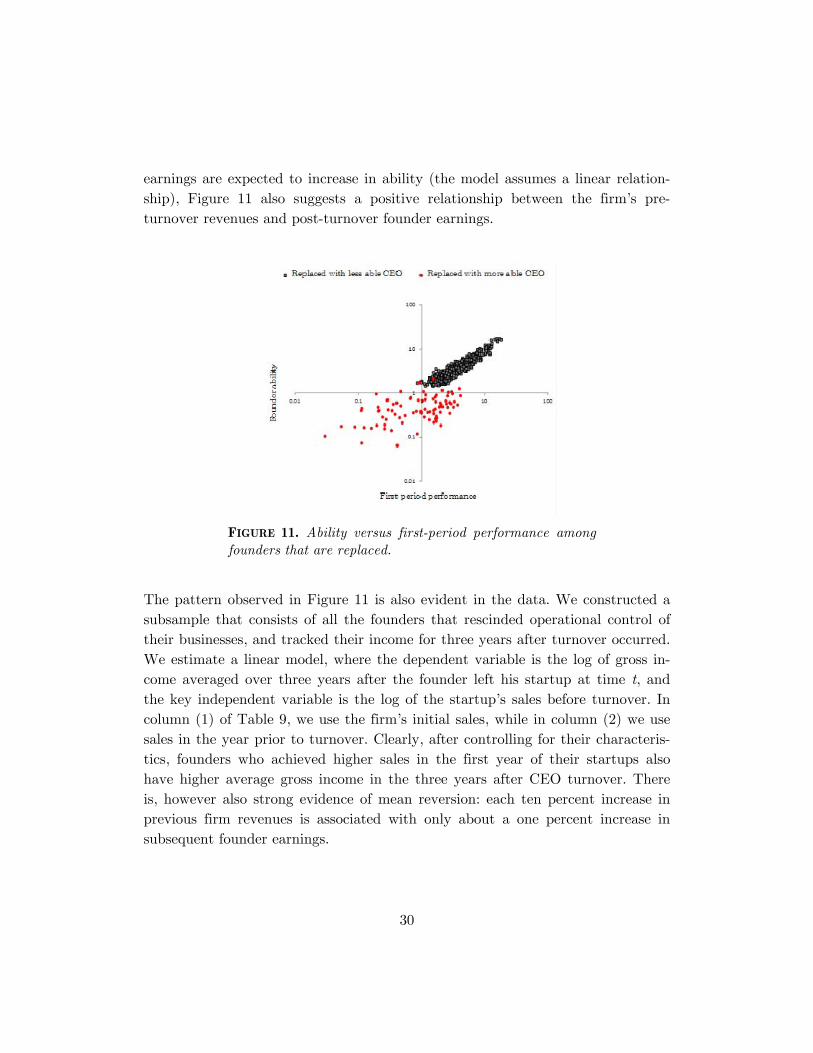
What happens to the founder-CEOs that are replaced? Among all founders, first-period performance is positively correlated with ability. However, some founders are replaced because they have low ability but good ideas, so it is not clear that the positive correlation between firm performance and ability survives among the subset of founders that are replaced. Because future earnings depend on ability, the relationship between first-period performance and future earnings is also a priori unclear. However, as Figure 11 indicates, the positive relationship survives in our baseline analysis among founders selected for replacement.16 As future
16 In scatter plots not shown, we find this relationship holds also for the parameter values used in Figures 5 through 7. In several cases the effect is, as in Figure 5, much weaker among founders that are replaced with more able CEOs.
30
earnings are expected to increase in ability (the model assumes a linear relation-ship), Figure 11 also suggests a positive relationship between the firm’s pre-turnover revenues and post-turnover founder earnings.
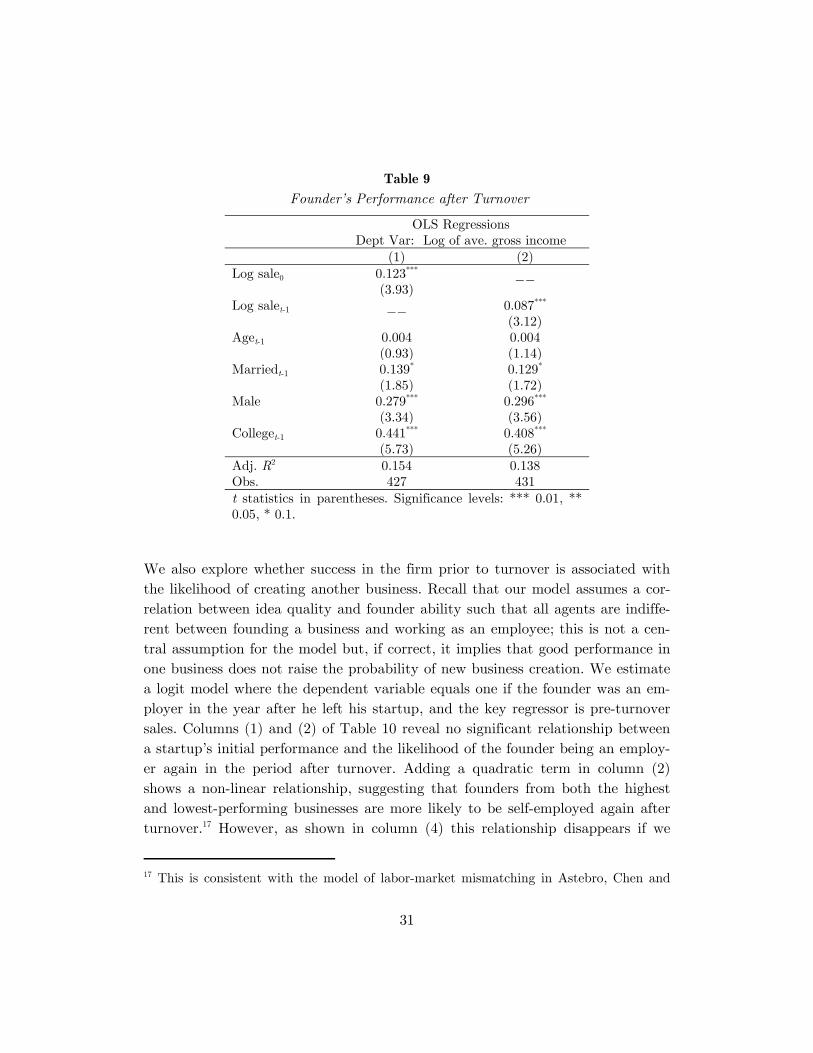
The pattern observed in Figure 11 is also evident in the data. We constructed a subsample that consists of all the founders that rescinded operational control of their businesses, and tracked their income for three years after turnover occurred. We estimate a linear model, where the dependent variable is the log of gross in-come averaged over three years after the founder left his startup at time t, and the key independent variable is the log of the startup’s sales before turnover. In column (1) of Table 9, we use the firm’s initial sales, while in column (2) we use sales in the year prior to turnover. Clearly, after controlling for their characteris-tics, founders who achieved higher sales in the first year of their startups also have higher average gross income in the three years after CEO turnover. There is, however also strong evidence of mean reversion: each ten percent increase in previous firm revenues is associated with only about a one percent increase in subsequent founder earnings.
FIGURE 11. Ability versus first-period performance among founders that are replaced.
31
Table 9
Founder’s Performance after Turnover
OLS Regressions
Dept Var: Log of ave. gross income (1) (2) Log sale0 0.123*** __
(3.93) Log salet-1 __ 0.087***
(3.12) Aget-1 0.004 0.004
(0.93) (1.14) Marriedt-1 0.139* 0.129*
(1.85) (1.72) Male 0.279*** 0.296***
(3.34) (3.56) Colleget-1 0.441*** 0.408***
(5.73) (5.26) Adj. R2 0.154 0.138 Obs. 427 431 t statistics in parentheses. Significance levels: *** 0.01, ** 0.05, * 0.1.
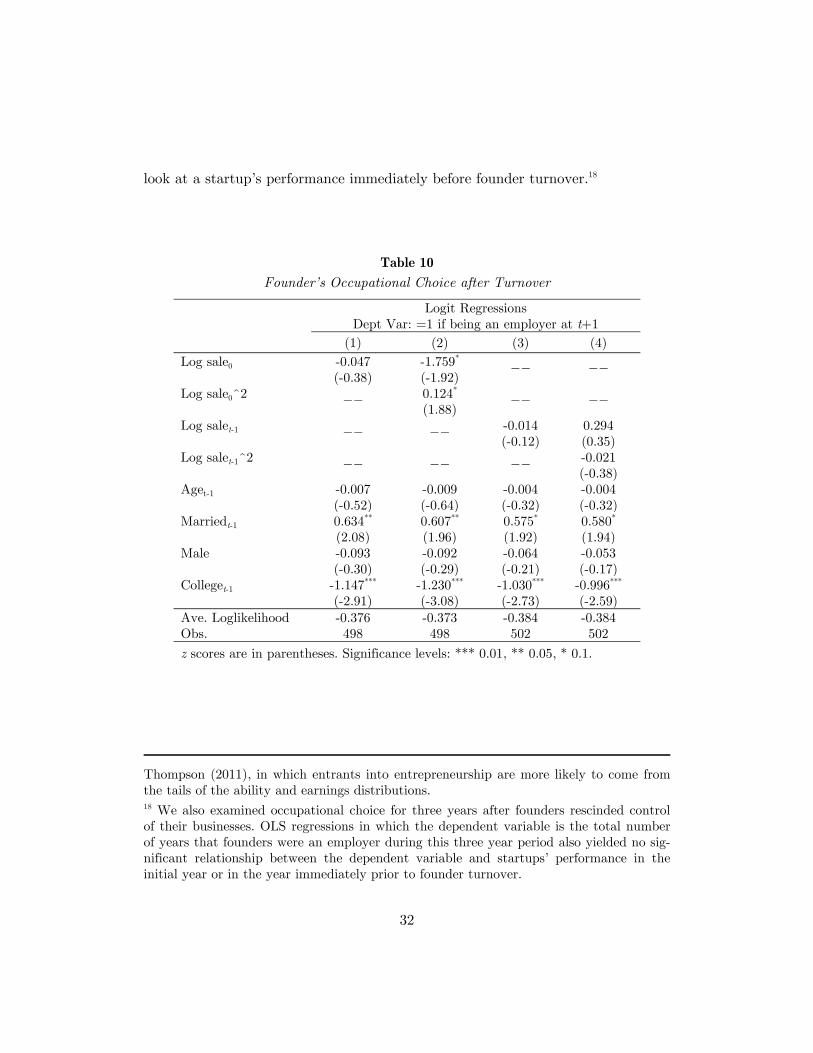
We also explore whether success in the firm prior to turnover is associated with the likelihood of creating another business. Recall that our model assumes a cor-relation between idea quality and founder ability such that all agents are indiffe-rent between founding a business and working as an employee; this is not a cen-tral assumption for the model but, if correct, it implies that good performance in one business does not raise the probability of new business creation. We estimate a logit model where the dependent variable equals one if the founder was an em-ployer in the year after he left his startup, and the key regressor is pre-turnover sales. Columns (1) and (2) of Table 10 reveal no significant relationship between a startup’s initial performance and the likelihood of the founder being an employ-er again in the period after turnover. Adding a quadratic term in column (2) shows a non-linear relationship, suggesting that founders from both the highest and lowest-performing businesses are more likely to be self-employed again after turnover.17 However, as shown in column (4) this relationship disappears if we
17 This is consistent with the model of labor-market mismatching in Astebro, Chen and
32
look at a startup’s performance immediately before founder turnover.18
Table 10
Founder’s Occupational Choice after Turnover
Logit Regressions Dept Var: =1 if being an employer at t+1
(1) (2) (3) (4)
Log sale0 -0.047 -1.759* __ __ (-0.38) (-1.92)
Log sale0^2 __ 0.124* __ __ (1.88)
Log salet-1 __ __ -0.014 0.294 (-0.12) (0.35)
Log salet-1^2 __ __ __ -0.021 (-0.38)
Aget-1 -0.007 -0.009 -0.004 -0.004 (-0.52) (-0.64) (-0.32) (-0.32)
Marriedt-1 0.634** 0.607** 0.575* 0.580* (2.08) (1.96) (1.92) (1.94)
Male -0.093 -0.092 -0.064 -0.053 (-0.30) (-0.29) (-0.21) (-0.17)
Colleget-1 -1.147*** -1.230*** -1.030*** -0.996*** (-2.91) (-3.08) (-2.73) (-2.59)
Ave. Loglikelihood -0.376 -0.373 -0.384 -0.384 Obs. 498 498 502 502
z scores are in parentheses. Significance levels: *** 0.01, ** 0.05, * 0.1.
Thompson (2011), in which entrants into entrepreneurship are more likely to come from the tails of the ability and earnings distributions. 18 We also examined occupational choice for three years after founders rescinded control of their businesses. OLS regressions in which the dependent variable is the total number of years that founders were an employer during this three year period also yielded no sig-nificant relationship between the dependent variable and startups’ performance in the initial year or in the year immediately prior to founder turnover.
33
6. Conclusions
In this paper we analyzed the relationships between founder-CEO replacement, firm performance, and founder earnings and occupational choices in a sample of 4,172 firms drawn from the Danish matched employer-employee dataset. Our in-terest was in studying the causes and consequences of changing operating control of young firms, so we restricted our attention to firms that had a single founder. Our sample comprises the universe of Danish firms founded in 1999 or 2000 that met this criterion.
Our key findings were as follows. First, founder-CEO replacements among the firms in our sample were more likely among the worst- and best-performing firms as measured by sales revenue, with the lowest likelihood occurring around the 25th percentile. Second, replacement was not unambiguously associated with bet-ter subsequent performance. One the one hand, firms that replaced the founder as CEO were more likely to fail, while on the other hand the surviving firms among them grew faster. We also found that the marginal ‘effect’ of initial sales on future sales among surviving firms was much stronger among firms that did not experience founder-CEO replacement. Differences between the subsequent performance of turnover and non-turnover firms were numerically important. The likelihood of firms that experienced turnover by 2002 surviving to 2004 was only 35 percent, compared with 74 percent among firms with no turnover. Among the
surviving firms, however, average 2004 sales are 55 percent higher among the turno-
ver group, despite similar revenues in both groups prior to turnover.
We also analyzed subsequent earnings and occupational choices of founders who rescinded operating control of their firms. Although subsequent founder income was found to be increasing in the performance of their firms, those that left good firms were no more likely than others to found another business.
Our results are consistent with the notion that mismatches between business quality and founder ability matter, although not necessarily in the precise form of the theoretical framework we developed in this paper. Åstebro, Chen and Thompson (2011) assumed that mismatches between an agent’s ability and the quality of the firm that employed him might drive him into self-employment or entrepreneurship. That model, like the theoretical framework developed in this paper, predicted that mismatches were most likely in the tails of the ability dis-tribution. However, it assumed that business creation serves the purpose of re-
34
solving mismatches. The present paper suggests that mismatches may be impor-tant also after business creation.
Our model predicts that turnover occurs more frequently in the tails of the initial performance distribution, that the marginal ‘effect’ of initial performance on fu-ture performance is greater among non-turnover firms, and it also predicts the empirical results about the future earnings and occupational choices of departing founders. However, the model has no uncertainty at the time of founder-CEO replacement, and hence has nothing to say about the much higher failure rates of firms that experienced turnover.
The disparate empirical results about firm failure and the growth of surviving firms recall Holmes and Schmitz’ (1995) model of business turnover. In their model, firm performance depends on the sum of business quality and match qual-ity. In contrast to the present paper, there is no variation in ability so all agents have the same outside option, and new CEOs only observe the quality of their match with a business after they have purchased the firm. Their model predicts that the best business ideas are most likely to be transferred to new owners, so among surviving firms business transfers are on average associated with good per-formance. However, because transfers may create a poor match, businesses that are sold are at greater risk of subsequent exit.19 Our results on growth and sur-vival of firms resonate with these predictions of their model.
Of course, mismatching need not be the only mechanism at work. One alternative interpretation of our findings is based on the distinction between necessity and opportunity entrepreneurs [see, for example, Block and Wagner (2006) and refer-ences therein]. Suppose that some agents found businesses because they have suf-fered negative employment shocks, either because of a mismatch in wage work or a failure to find wage employment at all. These founders may be unusually likely to return to wage work as soon as the opportunity presents itself. If, as in Åste-bro, Chen and Thompson (2011), such shocks are more common in the tails of the ability distribution, they can explain higher rates of founder turnover in the
19 Pollock, Fund and Baker (2009) find that VC-financed firms that are preparing for an IPO are more likely to experience founder turnover if their firm operates in an uncertain industry environment. This could also explain our results on survival, although our re-gressions do have industry fixed effects.
35
tails of the performance distribution.20
Both our theoretical framework and our empirical analysis have focused on the turnover of operating control while the founder retains ownership. In our sample, turnover of operating control is more common than business turnover, but both are important features of the data. Our paper leaves unanswered the interesting question of how owners decide between selling a business and hiring a CEO. The Danish matched employer-employee dataset may also be rich enough to allow us to compare some characteristics of outgoing founders and incoming CEOs, and assess whether founder-CEO pairs differ from each other in ways consistent with mismatching models. These are questions we intend to address in future work.
References Åstebro, Thomas, Jing Chen, and Peter Thompson (2011): “Stars and Misfits: Self-
Employment and Labor Market Frictions.” Management Science, 57(11):1999-2017.
Block, Joern, and Marcus Wagner (2006): “Necessity and opportunity entrepreneurs in German: Characteristics and earnings differentials.” University of Munich: MPRA Paper No. 610.
Boeker, Warren and R. Karichalil (2002): “Entrepreneurial Transitions: Factors In-fluencing Founder Departure.” Academy of Management Journal, 45(4):818-826.
Boeker, Warren, and Robert Wiltbank (2005): “New Venture Evolution and Mana-gerial Capabilities.” Organization Science, 16(2):123-133.
Braguinsky, Serguey, Yuji Honjo, Sadao Nagaoka, and Kenta Nakamura (2012): “Evaluation and transfer of science-based business: Theory and evidence.” Working Paper, Department of Social and Decision Sciences, Carnegie Mellon University.
Chen, Guoli, and Donald C. Hambrick (2012): “CEO Replacement in Turnaround Situations: Executive (Mis)Fit and Its Performance Implications.” Organiza-tion Science, 23(1):225-243.
Dunne, Timothy, Mark J. Roberts and Larry Samuelson (1987): "The Growth and Failure of U.S. Manufacturing Plants," Quarterly Journal of Economics, 104(4):671-98,
Fama, Eugene M., and Michael C. Jensen, (1983): “Separation of Ownership and
20 However, whether such shocks can also explain the observed relationships between founder turnover and subsequent firm performance depends on how departing founders select their replacements. It is likely that skill matching continues to play a role here.
36
Control.” Journal of Law and Economics, 26:301–326.
Handler, Wendy C. (1994): “Succession in Family Business: A Review of the Re-search.” Family Business Review, 7:133-157.
He, Lerong (2008): “Do Founders Matter? A Study of Executive Compensation, Go-vernance Structure and Firm Performance.” Journal of Business Venturing, 23:257–279.
Hellmann, Thomas, and Manju Puri (2002): “Venture Capital and the Professionali-zation of Start-Up Firms: Empirical Evidence.” Journal of Finance, 57(1):169-197.
Hofer, Charles W. (1980): “Turnaround strategies.” Journal of Business Strategy, 1(1):19–31.
Holmes, Thomas J., and James A. Schmitz, Jr. (1990): “A theory of entrepreneur-ship and its application to the study of business transfers.” Journal of Political Economy, 98(2): 265-94.
Holmes, Thomas J., and James A. Schmitz, Jr. (1995): “On the Turnover of Business Firms and Business Managers.” Journal of Political Economy, 103(5):1005-1038.
Jain, Bharat A., and Filiz Tabak (2008): “Factors influencing the choice between founder versus non-founder CEOs for IPO firms.” Journal of Business Ventur-ing, 23(1):23-45.
Jensen, Michael C., and William H. Meckling (1976): “Theory of the Firm: Mana-gerial Behavior, Agency Costs and Ownership Structure.” Journal of Financial Economics, 2:305–360.
Jovanovic, Boyan (1979): “Job Matching and the Theory of Turnover.” Journal of Political Economy, 87(5, part 1): 972-990.
NCVA (2009): Venture Impact. The Economic Importance of Venture Capital-Backed Companies to the U.S. Economy. National Venture Capital Association
Nelson, T. (2003): “The persistence of founder influence: Management, ownership, and performance effects at initial public offerings.” Strategic Management Journal, 24(8):707-724.
Pollack, Timothy G., Bret R. Fund, and Ted Baker (2009): “Dance with the one that brought you? Venture capital firms and the retention of founder-CEOs.” Stra-tegic Entrepreneurship Journal, 3:199-217.
Sorensen, Jesper (2007): “Bureaucracy and Entrepreneurship: Workplace Effects on Entrepreneurial Entry.” Administrative Science Quarterly, 52(3): 387-412.
Wasserman, Noam (2003): “Founder-CEO Succession and the Paradox of Entrepre-neurial Success.” Organization Science, 14(2):149-172.