new generation adsorbents for from modeling to … · 2017. 12. 15. · tant, la cerca de materials...
TRANSCRIPT

1
1
NEW GENERATION ADSORBENTS FOR
GAS SEPARATION: FROM MODELING
TO INDUSTRIAL APPLICATION
A molecular perspective on the effect of impurities in gas separation in
adsorptrocesses
Authored by
DANIEL BAHAMÓN GARCÍA
A dissertation submitted in partial fulfillment of the requirements for the degree of
DOCTOR OF PHILOSOPHY
PRESENTED TO
Universitat Autònoma de Barcelona
PhD Program in Environmental Science and Technology
DIRECTOR: Dr. Lourdes F. Vega
Bellaterra September 2015

ii
ii

iii
iii
Dr. Lourdes Vega Fernández,
CERTIFIES THAT:
Daniel Bahamón García, Bachelor in Chemical Engineering and MSc in Engineering
from the "Universidad Pontificia Bolivariana", Colombia, has undertaken this thesis
entitled "New generation adsorbents for gas separation: from modeling to industry
application" under her direction, and the main results are presented in this memory as
partial fulfillment for the degree of Doctor
For the record, this certificate is signed by
________________________ ___________________________
Dr. Lourdes F. Vega Dr. Javier Lafuente
Director UAB Tutor
________________________
Daniel Bahamón García
PhD candidate
Bellaterra, September 2015

iv
iv
i
i
Summary
As defined by the Brundtland Commission, sustainable development is the
advance that "meets the needs of the present without compromising the ability of
future generations to meet their own needs”. Sustainable development is of special
relevance in the present situation, in which an explosive growth in energy
consumption as a consequence of the great inventions and developments related to
transportation and technology is observed, along with a rapid increase in population
worldwide. Most of these technologies are related to an increased amount of
greenhouse gases emitted to the atmosphere. In this context, sustainable development
would suggest searching for ways to mitigate these emissions, including carbon
capture and storage (or utilization, CCSU), energy efficiency, alternative sources of
energy and energy saving, as already suggested by the Kyoto's protocol and the IPCC
reports. Hence, much effort has been devoted in recent years to capture and storage of
CO2 from concentrated sources of emission such of power plants and others.
Apart from establishing new technologies for CO2 capture and separation, the
exploration of advanced adsorbent materials with high separation performance and
low capital cost is very significant for various gas-separation- related issues. Over the
last three decades, the science of porous solid materials has become one of the most
intense areas of research and development for chemists, physicists, and materials
scientists. These materials have found a large number of applications in many fields,
such as adsorption, separation and purification, as well as catalysis for different
processes. Exploration of advanced porous materials is therefore an intense subject of
scientific research and practical applications.
In fact, considerable progress has been made in recent years on the
development of novel adsorbents. For instance, Metal Organic Frameworks (MOFs)
have been gaining considerable attention as promising nanoporous materials for gas
storage and gas separation applications due to their exceptional physical and chemical
properties. The rational design and synthesis of various types of MOFs have been
achieved by tailoring the combination of different organic linkers and metal-ions.
MOFs have already been demonstrated to be promising materials in the separation of
different gases, however, a molecular level understanding of gas adsorption in the
pores is crucial to accelerate the design and development of these and other

Summary
ii
applications. It is also fundamental to know their behavior under moisture conditions
and impurities content, as normally found at specific industrial applications.
The overall objective of this PhD Thesis is to advance in the field of materials
for CO2 capture and separation at process conditions. New tools are proposed for
assessing and optimizing capture systems at industrial conditions, based on molecular
simulations. Although several adsorbents are considered, particular attention is paid to
zeolites and MOFs, given their promising a-priori properties for this separation. The
influence of water vapor and impurities is explicitly considered, both, in the light of the
fundamentals of adsorption and in the application for post-combustion carbon dioxide
capture by swing adsorption cycles.
A brief description of the fundamentals of adsorption and molecular
simulations is first presented, followed by generalities on CO2 capture and separation,
including the processes and the conditions at which it should occur. A novel
throughout review on recent studies of materials for CO2 capture and separation is
presented, including few studies of impurities, thus providing valuable information to
assess their industrial application. Based on this review, some of the most promising
materials for CO2 separation in a Temperature Swing Adsorption (TSA) process are
studied in detail by using molecular simulations (compared to experimental data when
available). A new procedure for assessing and optimizing capture systems at real
conditions, based on molecular simulations, is proposed in this work. Given the great
influence of water as a trace compound on the separation, CuBTC (one of the most
studied MOFs, stable in water and with potential for industrial application) is
investigated in comparison to the benchmark zeolite 13X, already used in some
industrial processes. The effect of the coexisting species as well as the influence of
water and SO2 in flue gas is examined in detail in order to reach a better understanding
of the adsorption capacity, selectivity, adsorption density location and isosteric heat
distributions.
And finally, detailed parametric studies have been carried out for a
comparative computational investigation for separating of multi-component mixtures
of flue gas by using other representative zeolites such as kaolinite and chabazite.
Additional work, related to another environmental problem, the separation of a
pollutant (ibuprofen) in water, by using activated carbons, is also presented here,
demonstrating the versatility of the tools for these types of systems.
In summary, the work developed in this Thesis highlights the use of molecular
simulation techniques for optimizing environmental related processes, with special
focus on CO2 capture and separation. It provides new procedures to assess the use of
these materials from their fundamental knowledge until their applications at industrial
conditions.

iii
iii
Resum
Segons la definició de la Comissió Brundtland, el desenvolupament sostenible
és l'avanç que "satisfà les necessitats del present sense comprometre la capacitat de les
generacions futures per satisfer les seves pròpies necessitats". El desenvolupament
sostenible és d'especial rellevància en la situació actual, en què s'observa un creixement
explosiu en el consum d'energia com a conseqüència de grans invents i
desenvolupaments en transport i tecnologia, juntament amb un ràpid augment de la
població arreu del món. Les tecnologies esmentades estan relacionades amb una major
quantitat de gasos d'efecte hivernacle emesos a l'atmosfera. En aquest context, el
desenvolupament sostenible suggereix la cerca de formes de mitigar aquestes
emissions, incloent la captura i emmagatzematge de diòxid de carboni (o la seva
utilització, Carbon Capture Storage and Utilization, CCSU), l'eficiència energètica, fonts
alternatives d'energia i estalvi d'energia, com ja s'ha suggerit al protocol de Kyoto i als
informes de l'IPCC. Com a conseqüència, molt esforç s'han dedicat en els últims anys a
cerca tecnologies de CCSU a partir de fonts concentrades d'emissió.
Apart d'establir noves tecnologies per a la captura de CO2, hi ha hagut un gran
avanç en l'exploració de materials adsorbents avançats amb un alt rendiment i un baix
cost de capital per a diversos processos de separació. Durant les últimes tres dècades,
la ciència de materials sòlids porosos s'ha convertit en una de les àrees més intenses de
recerca i desenvolupament per als químics, físics i científics de materials. Aquests
materials han trobat un gran nombre d'aplicacions en molts camps, com ara l'adsorció,
la separació i purificació, així com la catàlisi per diferents processos industrials. Per
tant, la cerca de materials porosos avançats per a la captura de CO2 i la seva separació
d’altres gasos és un tema d'intensa investigació científica i d'aplicacions pràctiques.
De fet, en els darrers anys s'ha avançat considerablement en el
desenvolupament de nous adsorbents. Per exemple, les estructures òrgan-metàl·liques
(Metal-Organic Frameworks, MOFs) han anat guanyant considerable atenció com
materials nanoporosos prometedors per a aplicacions d'emmagatzematge i separació
de gasos, per les seves propietats físiques i químiques excepcionals. El disseny racional
i la síntesi de diversos tipus d'MOFs es fa mitjançant l'adaptació de la combinació de
diferents ions metàl·lics i enllaçants orgànics. Els MOFs ja han demostrat ser materials
prometedors en la separació de diferents gasos, però encara manca una comprensió a

Resum
iv
nivell molecular de l'adsorció de gas en els porus és crucial per accelerar el disseny i
desenvolupament d'aquests materials fets a mida. També és fonamental conèixer el seu
comportament sota condicions d'humitat i impureses, condicions sota les quals es
troben en aplicacions industrials específiques.
L'objectiu general d'aquesta tesi doctoral és avançar en el camp dels materials
per a la captura i separació de CO2 a condicions del procés. A partir de simulacions
moleculars es proposen noves eines per a l'avaluació i optimització dels sistemes de
captura en condicions reals. Encara que es consideren diversos adsorbents, el treball es
centra sobretot en zeolites i MOFs, donades les seves propietats prometedores a-priori
per a aquesta separació. Com a novetat es considera de manera explicita la influència
del vapor d'aigua i impureses, tant des del punt de vista fonamental com en l'aplicació
per a la captura de CO2 per post-combustió mitjançant cicles d'adsorció per oscil·lació
(Swing Adsorption Cycles).
En primer lloc, es presenta una breu descripció dels fonaments de l'adsorció i de
les simulacions moleculars, seguit per generalitats en la captura de CO2, incloent
processos i condicions d’operació. Es presenta una revisió exhaustiva d'estudis recents
de materials per a la captura i separació de CO2, proporcionant així informació valuosa
per optimitzar la seva aplicació industrial. Basats en aquesta revisió, es van estudiar en
detall alguns dels materials més prometedors per a la separació de CO2 en un procés
d'adsorció per canvi de temperatura (TSA) utilitzant simulacions moleculars
(comparant amb dades experimentals disponibles). Es proposa en aquesta tesi un nou
procediment per a l'avaluació i optimització dels sistemes de captura en condicions
reals, basats en simulacions moleculars. Donada la gran influència de l'aigua com un
compost traça en la separació, es va investigar el CuBTC (un dels MOF més estudiats i
estables en aigua) en comparació amb la zeolita de referència 13X, que ja s'utilitza en
alguns processos industrials. S'examina en detall l'efecte de les espècies coexistents, així
com la influència de l'aigua i el SO2 en els gasos de combustió, per tal d'arribar a una
millor comprensió de la capacitat d'adsorció, la selectivitat, la ubicació de les molècules
al material i les distribucions de calor isostèrics. Finalment, s'han dut a terme estudis
paramètrics detallats per a una investigació computacional comparativa de la separació
de mescles multi-components de gasos de combustió mitjançant l'ús d'altres zeolites
com ara caolinita i chabazita. També es presenta un treball addicional, d’un altre
problema mediambiental, la separació d'un contaminant (ibuprofèn) en aigua,
mitjançant l'ús de carbons activats, emprant les mateixes eines de simulació.
En resum, el treball desenvolupat en aquesta tesi destaca l'ús de tècniques de
simulació molecular per a l'optimització de processos relacionats amb el medi ambient,
amb especial atenció a la captura i separació de CO2. Es proporcionen nous
procediments per avaluar l'ús d'aquests materials a partir del seu coneixement
fonamental fins a la seva aplicació en condicions industrials.

v
v
Resumen
Según la definición de la Comisión Brundtland, el desarrollo sostenible es aquel
que "satisface las necesidades del presente sin comprometer la capacidad de las
generaciones futuras para satisfacer sus propias necesidades". El desarrollo sostenible
es de especial relevancia en la situación actual, en la que se observa un crecimiento
explosivo en el consumo de energía como consecuencia de grandes inventos y
desarrollos en transporte y tecnología, junto con un rápido aumento de la población en
todo el mundo. La mayoría de estas tecnologías están relacionadas con una mayor
cantidad de gases de efecto invernadero emitidos a la atmósfera. En este contexto, el
desarrollo sostenible sugiere la búsqueda de formas de mitigar estas emisiones,
incluyendo la captura y almacenamiento de carbono (o utilización, Carbon Capture and
Storage and Utilization CCSU), la eficiencia energética, fuentes alternativas de energía y
ahorro de energía, como ya se ha sugerido por el protocolo de Kioto y los informes del
IPCC. De ahí que en los últimos años se haya dedicado un esfuerzo considerable a
desarrollar tecnologías para la captura y almacenamiento de CO2 a partir de fuentes
concentradas de emisión.
Además de establecer nuevas tecnologías para la captura de CO2, en los últimos
años se ha intensificado la búsqueda de materiales adsorbentes avanzados con un alto
rendimiento en la separación y un bajo costo de capital para diversos procesos de
separación. Así, durante las últimas tres décadas, la ciencia de materiales sólidos
porosos se ha convertido en una de la áreas más intensas de investigación y desarrollo
para químicos, físicos y científicos de materiales. Estos materiales han encontrado un
gran número de aplicaciones en campos, tales como la adsorción, la separación y
purificación, así como la catálisis para diferentes procesos.
De hecho, se ha avanzado considerablemente en los últimos años en el
desarrollo de nuevos adsorbentes. Por ejemplo, las estructuras órgano-metálicas (Metal
Organic Frameworks, MOFs) han ido ganando considerable atención como materiales
nanoporosos prometedores para aplicaciones de almacenamiento y separación de
gases, debido a sus propiedades físicas y químicas excepcionales. Los MOFs ya han
demostrado ser materiales prometedores en la separación de diferentes gases, sin
embargo, se necesita la comprensión a nivel molecular de la adsorción de gases para
acelerar el diseño y desarrollo de aplicaciones a la carta. También es fundamental

Resumen
vi
conocer su comportamiento bajo condiciones de humedad e impurezas, como se tiene
normalmente en aplicaciones industriales específicas.
El objetivo general de esta Tesis Doctoral es avanzar en el campo de materiales
para la captura y separación de CO2 a condiciones del proceso. Se proponen nuevas
herramientas para la evaluación y optimización de los sistemas de captura en
condiciones reales, basadas en simulaciones moleculares. Aunque se consideran varios
adsorbentes, el trabajo se centra en zeolitas y MOFs, dadas sus propiedades
prometedoras a-priori para esta separación. Por primera vez se considera de manera
explícita la influencia del vapor de agua e impurezas, tanto a la luz de los fundamentos
de la adsorción como en la aplicación para la captura de CO2 por post-combustión
mediante ciclos de adsorción por oscilación (Swing Adsorption Cycles).
En primer lugar, se presenta una breve descripción de los fundamentos de la
adsorción y de las simulaciones moleculares, seguido por generalidades en la captura
de CO2, incluyendo procesos y condiciones de operación. Se presenta una revisión
exhaustiva de estudios recientes de materiales para captura y separación de CO2,
proporcionando así información valiosa para su aplicación industrial. Basados en esta
revisión, se han estudiado en detalle algunos de los materiales más prometedores para
la separación de CO2 en un proceso de adsorción por cambio de temperatura (TSA)
utilizando simulaciones moleculares (comparando con datos experimentales de la
literatura). Se propone un nuevo procedimiento para la evaluación y optimización de
los sistemas de captura en condiciones reales, basados en simulaciones moleculares.
Dada la gran influencia de trazas de agua en la separación, se investiga el CuBTC (uno
de los MOF más estudiados y estables en agua) en comparación con la zeolita de
referencia 13X, utilizada en algunos procesos industriales. Se examina en detalle el
efecto de las especies coexistentes, así como la influencia del agua y SO2 en los gases de
combustión, con el fin de llegar a una mejor comprensión de la capacidad de adsorción,
la selectividad, la localización de las moléculas en el material, las distribuciones de
calor isostérico y su relación con el proceso. Se han llevado a cabo estudios
paramétricos detallados para una investigación comparativa de la separación de
mezclas multi-componentes de gases de combustión mediante el uso de otras zeolitas
como caolinita y chabacita. También se presenta un trabajo adicional, relacionado con
otro problema medioambiental, la separación de un contaminante (ibuprofeno) en
agua, mediante el uso de carbones activados, usando las mismas técnicas
computacionales.
En resumen, el trabajo desarrollado en esta tesis destaca el uso de técnicas de
simulación molecular para la optimización de procesos relacionados con el medio
ambiente, con especial atención a la captura y separación de CO2. Se proporcionan
nuevos procedimientos para evaluar el uso de estos materiales a partir de su
conocimiento fundamental hasta su aplicación en condiciones industriales.

vii
vii
Acknowledgments
I want to express my sincere gratitude to my director, Dr. Lourdes Vega, from
which I learned and appreciated every minute addressed to me. Her tenacity, patience
and wise counsel led me to take her as an example of life. In few words, without her it
would have been impossible to conduct this research.
Special thanks to all the people I met in MATGAS, for their company, help and
disinterested friendship. The last three years have been quite an adventure, and would
not have been as enjoyable as it was without a great group of colleagues.
To my father, mother and grandparents, who have been always with me and
are a source of inspiration and desire to move forward. To my sister, to whom I
dedicate this Thesis. To my friends, who never let me decline and helped me in the
darkest moments. And to Luis and Carmen for their hospitality since I came to Spain.
In addition, I gratefully acknowledge the financial support of the Spanish
Government under project CTQ2014-53987-R, the Generalitat of Catalonia (projects
2014SGR-1582 and NUCLI BioQuim_rescue RD12-1-0018). Additional support has
been provided by Carburos Metálicos/Air Products Group and MATGAS.
Particular gratefulness to the professor Dr. Pablo Gamallo from the University
of Barcelona for his invaluable scientific discussions and suggestions in some chapters
of this Thesis.
And to all those who somehow participated in the development of this thesis.
Thanks for the support!

viii
viii

ix
ix
Content
1. INTRODUCTION .................................................................................................... 1
1.1. Thesis objectives ........................................................................................................... 3
1.2. Thesis outline ................................................................................................................. 4
2. FUNDAMENTALS ................................................................................................... 7
2.1. Adsorption ...................................................................................................................... 8
2.1.1. Physical and chemical adsorption ..................................................................................... 9
2.1.2. Adsorption isotherms ....................................................................................................... 10
2.1.3. Isotherms Types ................................................................................................................. 11
2.1.4. Heat of adsorption ............................................................................................................. 13
2.1.5. Adsorbent selectivity ......................................................................................................... 14
2.1.6. Breakthrough Curves ........................................................................................................ 15
2.2. Molecular Simulations ............................................................................................... 17
2.2.1. Statistical Mechanics ......................................................................................................... 17
2.2.2. Monte Carlo ........................................................................................................................ 21
2.2.3. Molecular Dynamics ......................................................................................................... 25
2.2.4. Molecular interaction potentials (Force Fields) ............................................................. 25
2.2.5. Molecular Models .............................................................................................................. 29
3. GENERAL CONSIDERATIONS ON CO2 CAPTURE AND SEPARATION
........................................................................................................................................ 33
3.1. Introduction .................................................................................................................. 34
3.1.1. Current uses of CO2 ........................................................................................................... 34
3.2. Technologies for CO2 capture ................................................................................... 35
3.2.1. Swing Adsorption Processes ............................................................................................ 39
3.2.2. Other considerations ......................................................................................................... 41
3.3. Computational Approaches for CO2 Adsorption and Separation ..................... 41

x
4. LITERATURE REVIEW OF RECENT WORKS ON ADSORBENT
MATERIALS FOR CO2 CAPTURE AND SEPARATION .................................. 45
4.1. Introduction .................................................................................................................. 46
4.2. Solid Porous Adsorbent Materials for CO2 Capture ............................................ 47
4.2.1. Activated Carbons ............................................................................................................. 49
4.2.2. Zeolites ................................................................................................................................ 50
4.2.3. Amine-Impregnated/Grafted Adsorbents ..................................................................... 53
4.2.4. Metal-Organic Frameworks (MOFs) ............................................................................... 55
4.2.5. Zeolitic Imidazolate Frameworks .................................................................................... 58
4.3. Simulation in selected systems for CO2 adsorption and separation ................. 60
4.4. Literature review on materials for CO2 capture ..................................................... 64
4.4.1. CO2 adsorption at high pressures .................................................................................... 64
4.4.2. CO2 adsorption at sub-atmospheric pressures .............................................................. 66
4.4.3. Selective adsorption of CO2 (CO2/N2 Separation) ........................................................ 69
4.4.4. Studies at process conditions ........................................................................................... 74
4.4.5. Influence of impurities ...................................................................................................... 76
4.4.5.1. Behavior with Water ............................................................................................................. 76
4.4.5.2. Other impurities ................................................................................................................... 78
5. MOLECULAR MODELING OF MATERIALS FOR CO2 CAPTURE AT
TSA PROCESS CONDITIONS .............................................................................. 85
5.1. Background information ............................................................................................ 86
5.2. Force field and simulation details ............................................................................ 87
5.3. Main results .................................................................................................................. 90
5.3.1. Validation of models ......................................................................................................... 90
5.3.2. Calculated pure adsorption isotherms ........................................................................... 95
5.3.3. N2/CO2 separation selectivities ..................................................................................... 103
5.3.4. Breakthrough calculations for TSA adsorber ............................................................... 106
5.3.4.1. Regeneration of the bed adsorber ........................................................................................ 110
5.3.5. Water Effect ...................................................................................................................... 111
5.3.6. Working Capacities ......................................................................................................... 116
5.4. Conclusions ................................................................................................................ 118
6. EFFECT OF WATER AND IMPURITIES ON THE ADSORPTION OF CO2
IN CUBTC AND ZEOLITE 13X ............................................................................ 121
6.1. Background information .......................................................................................... 122
6.2. Methodology .............................................................................................................. 123
6.2.1. Structures .......................................................................................................................... 123

Table of Contents
xi
6.2.2. Simulation Details............................................................................................................ 125
6.3. Results and discussion ............................................................................................. 126
6.3.1. Adsorption isotherms of pure gases ............................................................................. 127
6.3.2. Isosteric heat ..................................................................................................................... 131
6.3.3. CO2/N2 binary mixtures ................................................................................................. 139
6.3.4. Influence of water on the adsorption behavior ........................................................... 142
6.3.5. Other impurities ............................................................................................................... 147
6.3.5.1. Ternary mixtures CO2/N2/SO2 (0.2% SO2) ....................................................................... 148
6.3.5.2. 5-component mixture ......................................................................................................... 149
6.3.6. Implications for the application in a VSA, PSA or TSA process ............................... 151
6.4. Conclusions ................................................................................................................ 152
7. GCMC SIMULATIONS OF ADSORPTION ON KAOLINITE AND
CHABAZITE .............................................................................................................. 155
7.1. Introduction ................................................................................................................ 156
7.2. Methodology .............................................................................................................. 157
7.3. Results and Discussion ............................................................................................ 160
7.4. Outlook ....................................................................................................................... 170
8. CONCLUSIONS AND FUTURE WORK......................................................... 171
BIBLIOGRAPHY ...................................................................................................... 175
APPENDIX A. REMOVAL OF POLLUTANTS (IBUPROFEN) IN WATER BY
ADSORPTION IN ACTIVATED CARBON ....................................................... 197
CURRICULUM VITAE ........................................................................................... 207

xii

xiii
xiii
List of acronyms and symbols
4A/5A Zeolite: molecular sieve (alkali metal alumino-silicate) whose aperture are 4Å
and 5Å respectively. Is a kind of alkali metal silica acid salt, and can absorb water
and other materials whose critical diameter are not more than 5Å, such as NH3,
H2S, SO2, CO2. Widely used in dry gas, liquid, gas or liquid refining and.
AC MAXSORB R: Activated Carbon (with commercial conditions, it can be type I, II or
III).
Amino-MIL-53(Al): type of MOF exhibiting either small or large pores. The first series
included the rigid (M) VIV, where MIL stands for Materiaux Institut Lavoisier).
BET: Brunauer, Emmett and Teller.
BTC: 1,3,5-BenzeneTriCarboxylic acid.
BTT: Benzene-1,3,5-Tris(1H-Tetrazole).
COF: Covalent Organic Framework. COFs are porous and crystalline, and are made
entirely from light elements (H, B, C, N, and O) that are known to form strong
covalent bonds in well-established and useful materials such as diamond,
graphite, and boron nitride.
DUT-9: NiO(BTB)(DMF)(H2O). Highly Porous Metal-Organic Framework.
GCMC: Grand Canonical Monte Carlo
H-KUST-1: MOF material developed by the Hong Kong University of Science and
Technology. Also known as CuBTC, Cu3(BTC)2.
HMS: hexagonal Mesoporous Silicas (HMS) and related structures (MCM-41, SBA-15,
etc) which have long-range periodicity, yet poorly defined short-range order,
possess very high surface areas and well hydroxylated surfaces that are
amenable to functionalization.

List of Symbols
xiv
IRMOF-1: equivalent to MOF-5. The IRMOF-1 crystal structure is a cubic array of Zn4O
units bridged by benzenedicarboxylate.
IUPAC: International Union of Pure and Applied Chemistry
LJ: Lennard Jones.
MC: Monte Carlo.
MD: Molecular Dynamics.
KH: Henry’s constants (kmol/m3-kPa)
PCN-61: is a MOF composed of 5,5,5”-benzene-1,3,5-triyltris(1-ethynyl-2-isophthalate)
(btei) linkers coordinated to copper ions in the 2+ oxidation state. PCN stands for
Porous Coordination Network.
PE-MCM-41: Pore Expanded; Mobil Composition of Matter - initial name given for a
series of mesoporous materials that were first synthesized by Mobil’s researchers
in 1992.
PSA: Pressure Swing Adsorption.
q: amount adsorbed per mass (mol/kg) or per volume of adsorbent (kmol/m3)
QST: isosteric heat of adsorption (kJ/mol).
SBA-15: Santa Barbara Amorphous silica. Non zeolitic material.
SNU-50/SNU-31: MOF which name stands for Seoul National University.
SWNTS/SWCN: Single Walled Carbon Nanotubes.
TraPPE: Transferable Potential for Phase Equilibria.
TSA: Temperature Swing Adsorption.
xi: mole fraction of component i in the adsorbed phase
yi: mole fraction of component i in the gas phase
ZSM-5: Zeolite Socony Mobil–5.
Greek symbols
: voidage of bed
i1,2: equilibrium pressure at any adsorption point (kPa)

xv
xv
List of Figures
Figure 1.1. Anthropogenic emissions of carbon dioxide…………………………...………2
Figure 2.1. Solid-gas interactions: physisorption (reversible) and chemisorption (strong
and irreversible bond formed with the solid surface)………………………………………7
Figure 2.2. Isotherms classification according to IUPAC....................................................9
Figure 2.3. Packed bed scheme………………………………………………………………14
Figure 2.4. Schematic representation of the periodic boundary conditions and the
Grand Canonical ensemble (the framework is in contact with a particle at a fixed
temperature and chemical potential; guest molecules are exchanged between the
crystal framework and the reservoir)……………………………………………………….20
Figure 2.5. Metropolis Monte Carlo movements…………………………………………..22
Figure 2.6. Lennard-Jones potential as a function of the distance of the molecule to the
solid surface (contribution of repulsive and attractive forces)…………………….……..26
Figure 3.1. Scheme of three types/options for CO2 capture………………………………34
Figure 3.2. Different technologies and associated materials for CO2 capture…………..36
Figure 3.3. Swing Adsorption Cycle scheme……………………………………………….37
Figure 3.4. The concept of PSA and TSA processes, related to the working capacity…38
Figure 4.1. Typical adsorbent materials…………………………………………………….46
Figure 4.2. Zeolite 13X………………………………………………………………………..49
Figure 4.3. Mesoporous silica impregnated with amines…………………………………52
Figure 4.4. Schematic construction of MOFs……………………………………………….53
Figure 4.5. Several MOFs structures………………………………………………………...54
Figure 4.6. Example of gate opening in MOFs……………………………………………..56

List of Figures
xvi
Figure 4.7. Several ZIF topologies…………………………………………………………..57
Figure 5.1 Schematic representation of the molecules (carbon dioxide, nitrogen and
water) and the structures modeled………………………………………………………….87
Figure 5.2. Adsorbents materials considered for CO2 separation...................................89
Figure 5.3. Validation of adsorption isotherms obtained with GCMC (marked as
“sim”), compared to experimental data…………………………………………………….90
Figure 5.4. Comparison of simulated adsorption isotherms for (a) nitrogen and (b)
carbon dioxide in selected MOFs, zeolites and other adsorbent materials selected (T =
318 K). Symbols represent the GCMC results, and the lines are guides to the eyes,
obtained by the DSL-F model (error bars are smaller than symbols)……………………96
Figure 5.5. Comparison of simulated adsorption isotherms for carbon dioxide and
nitrogen, at different conditions of pressure and temperature for 14 selected
materials………………………………………………………………………………………..98
Figure 5.6. Isosteric heat for CO2 adsorption on the selected materials as a function of
uptake. Symbols are obtained from the simulations (see text for details) while lines are
a guide to the eye……………………………………………………………………………...99
Figure 5.7. Snapshots showing areas of high adsorbed CO2 density, from GCMC
simulations at 318 K and 100 kPa…………………………………………………………..100
Figure 5.8. Comparison of the 14%/86% CO2/N2 selectivities (T = 318 K) calculated
from the IAST method (closed circles) and from a ratio of the Henry coefficients,
KCO2/KN2, (open triangles) with the selectivities from binary mixture GCMC
simulations (x-axis)…………………………………………………………………………..101
Figure 5.9. Comparison between adsorbed CO2 compositions in the different structures
as a function of the gas stream, by using IAST (dotted lines) and GCMC simulations
from this work (points)……………………………………………………………………...102
Figure 5.10. CO2/N2 selectivity variation with temperature (P=100 kPa) for flue gas
composition 14%CO2/86%N2……………………………………………………………....103
Figure 5.11. Contour plots showing areas of adsorbed nitrogen and carbon dioxide,
from GCMC simulations at 318 K and 14%/ 86% CO2/N2 mixture at a bulk pressure of
100kPa…………………………………………………………………...……………………104
Figure 5.12. Breakthrough calculations for TSA adsorber. (a) Breakthrough
characteristics of an adsorber packed maintained at isothermal conditions. In these
calculations, the partial pressures of CO2 and N2 at the inlet were taken to be P1 = 14
kPa and P2 = 86 kPa. (b) Plot of the number of moles of CO2 captured per m3 of

List of figures
xvii
adsorbent material (in the 14%CO2/86%N2 mixture) against the breakthrough time for
a packed bed adsorber at 318 K and total pressures of 100kPa…………………………106
Figure 5.13. Breakthrough curves for selected materials at different conditions (molar
composition: 14% CO2 / 86% N2)…………………………………………………………..107
Figure 5.14. Comparison of simulated adsorption isotherms for water with
experimental data, for selected materials………………………………………………….110
Figure 5.15. Variation of breakthrough curves with the water content as an impurity,
for compositions of 0.01%, 0.1% and 1% H2O (P=100kPa, T=318 K)…………………...111
Figure 5.16. Adsorption isotherms for pure components and in a ternary mixture with
a composition of 0.1% H2O, 14% CO2, 85.9% N2 (T=318K)………………………………112
Figure 5.17. (a) CO2/N2 selectivity behavior for flue gas (composition 14%CO2/86%N2),
variation with water content (T=318K, P=100kPa). (b) Evaluation of breakthrough time
as a function of water content in selected materials for CO2 capture (T=318 K)………114
Figure 5.18. Values for working capacity in selected materials under different
desorption temperatures (P=100kPa, composition: 14%CO2/86%N2); b) Variation of
working capacity with moisture content as a function of material selectivity (P=100kPa,
Tads=318K)…………………………………………………………………………………….116
Figure 6.1. Image of crystallographic data and pore types for CuBTC and zeolite
13X…………………………………………………………………………………………….122
Figure 6.2: Validation of GCMC simulated adsorption isotherms in (a) CuBTC, and (b)
Zeolite 13X (error bars included) versus experimental work…………………………...126
Figure 6.3. Comparison of simulated and experimental isotherms for carbon dioxide in
CuBTC………………………………………………………………………………………...127
Figure 6.4. Comparison of pure simulated adsorption isotherms of CO2, N2, SO2, O2,
and H2O in a) CuBTC and b) zeolite 13X frameworks (lines are guide to the eyes; error
bars are smaller than symbols)……………………………………………………………..128
Figure 6.5. Isosteric heat distribution profiles of pure components in (from left to right)
nitrogen, carbon dioxide and water for a) CuBTC and b) zeolite 13X………………….129
Figure 6.6. Energy distribution probability as a function of pressure for adsorption of
pure components in CuBTC………………………………………………………………...130
Figure 6.7. Energy distribution probability as a function of pressure for adsorption of
pure components in zeolite 13X……………………………………………………………133

List of Figures
xviii
Figure 6.8. Isosteric heat patterns of (a) CuBTC and (b) zeolite 13X for the five pure
components considered……………………………………………………………………..136
Figure 6.9. Isosteric heat distribution profiles (top) and adsorption curves (bottom) for
pure (dashed lines) and 15% CO2/85%N2 mixtures (full line and symbols) in a) CuBTC
and b) zeolite 13X at 298K…………………………………………………………………..137
Figure 6.10. Isosteric heat distribution profiles (P=100kPa) and adsorption isotherms
for binary mixtures of N2/CO2 at different conditions in CuBTC……………………...138
Figure 6.11. Isosteric heat distribution profiles (P=100kPa) and adsorption isotherms of
binary mixtures N2/CO2 at different conditions in zeolite 13X…………………………139
Figure 6.12. Selectivity for different CO2/N2 conditions in a) CuBTC and b) zeolite 13X:
circles (green) represent simplified air composition at 298K (N2 with 500ppm of CO2);
squares (blue), flue gas composition (15%/85% CO2/N2) at 298K, and diamonds (light
blue), flue gas composition (15%/85% CO2/N2) at 400K………………………………..140
Figure 6.13. Adsorption isotherms, isosteric heat distribution profiles and
representative adsorption sites snapshots in the different mixtures at 100kPa, for pure
and two ternary CO2/N2/H2O mixtures in a) CuBTC and b) zeolite 13X……………..141
Figure 6.14. Adsorption isotherms for water and carbon dioxide in CuBTC, showing
the difference between a dry framework and one with 4%wt of coordinated water…144
Figure 6.15. Adsorption isotherms for pure and 15%CO2 / 84%N2 / 1%H2O mixtures in
CuBTC………………………………………………………………………………………...145
Figure 6.16. Adsorption isotherms, isosteric heat distribution profiles and adsorbed
molar fraction for pure and 15%CO2/84.8%N2/0.2%SO2 mixtures at 298K in a) CuBTC
and b) zeolite 13X…………………………………………………………………………….147
Figure 6.17. Isosteric heat distribution profiles of pure compounds and multi-
component mixture (15%CO2/78.8%N2/5%O2/1%H2O/0.2%SO2) in a) CuBTC and b)
13X; with snapshot showing the preferential location of the different molecules
[P=100kPa, T=298K]…………………………………………………………………………148
Figure 6.18. CO2/N2 selectivity for different compositions in CuBTC and zeolite 13X
[P=100KPa, T=298K]…………………………………………………………………………149
Figure 7.1. Chabazite and kaolinite minerals……………………………………………..154
Figure 7.2. Simulation cell used (left) and detail of the two kaolinite layers faced. The
adsorption of water is restricted to the volume in between both pairs of layers……...157

List of figures
xix
Figure 7.3. Top view of a single layer of kaolinite surface. The black lines fence the unit
cell and the different sites are labeled as A-F. Also the distances between outermost
hydrogen atoms that belong to hydroxyl groups are indicated………………………...157
Figure 7.4. Kaolinite water content at 25ºC as a function of RH or pressure (kPa) for
GCMC simulations (blue) and experimental results at 23ºC and 25ºC, respectively...159
Figure 7.5. Kaolinite water content at 10ºC (green), 25ºC (blue) and 47ºC (red) as a
function of a) equilibrium pressure (kPa) and b) RH (%). The fitted BET isotherms are
also showed with dashed lines………………………………………………………….….160
Figure 7.6. Isosteric heat distributions and adsorption location density for water
adsorption on kaolinite surface at 25ºC. The adsorption location densities corresponds
to the following pressure (RH) values: a) 0.050 kPa (1.6%), b) 0.166 kPa (5.2%), c) 0.549
kPa (17.3%), d) 1.995 kPa (62.9%) and e) 3.162 kPa (99.7%)…………………….……….165
Figure 7.7. Chabazite structure framework……………………………………………….165
Figure 7.8. Probability cloud of nitrogen and carbon dioxide adsorption in raw
chabazite and CaCHA……………………………………………………………………….166
Figure 7.9. Adsorption isotherm of CO2 in CHA and Adsorption isotherms of CO2 in
CaCHA materials with different number of exchanged-ions…………………………...167
Figure 7.10. Adsorption isotherms of nitrogen in different structures of CaCHA,
according to the amount of ions exchanged (Ca2+ added)………………………………168
Figure 7.11. Comparison of the amount adsorbed in different cation-exchanged
chabazites……………………………………………………………………………………..168
Figure A.1. Ibuprofen structure (gray: carbon; white: hydrogen; red: oxygen)……….198
Figure A.2. Schematic representation of the interconnected carbon pore model……..198
Figure A.3. Lower energy position of an IBP adsorbed on a porous carbon material
(excluding water)…………………………………………………………………………….201
Figure A.4. Representation of the equilibrium position of water molecules and
ibuprofen on a C (1 1 1) carbon surface obtained by CMCG simulations……………...202
Figure A.5. Adsorption of Ibuprofen in a microporous carbon from an aqueous mixture
of 10 ppm……………………………………………………………………………………..203
Figure A.6. Adsorption in SWNTs from an aqueous solution of 10 ppm IBP…………204

xx
xx

xxi
List of Tables
Table 1.1. Comparison between physical and chemical adsorption………………………8
Table 4.1. List of materials for CO2-capture at high pressures……………………………63
Table 4.2. List of materials for CO2-capture at low pressures…………………………….65
Table 4.3. Adsorbents for CO2 capture from a CO2/N2 mixture…………………………67
Table 4.4. Recent published studies related to the impurities capture…………………..77
Table 5.1. Lennard-Jones parameters for each atom used in the GCMC simulations….86
Table 5.2. Temperature-dependent fit parameters for (a) CO2 and (b) N2 adsorption
isotherms using a Langmuir-Freundlich Dual Site model (273 K < T < 450 K)………...94
Table 5.3. Henry’s constants and isosteric heats of adsorption (QST) from GCMC
Simulations performed in this work (T = 318 K)…………………………………………..99
Table 5.4. Amount of CO2 adsorbed per gravimetric and volumetric quantity of
different materials, during the interval 0–break for the binary 14%CO2/86%N2
mixture………………………………………………………………………………………..108
Table 5.5. Summary of the working capacity (kmol/m3) of zeolites and MOF studied
for TSA process under different conditions……………………………………………….115
Table 6.1. Force field parameters used in adsorption simulations……………………...124
Table 6.2. Summary of the working capacity of zeolite 13X and CuBTC for
VSA/PSA/PSA processes. See text for details……………………………………………150
Table 7.1. Non-bond parameters for the CLAYFF and TIP4P/2005 FF………………...156
Table 7.2. Saturation Vapor Pressure (Pvp) of Water from Wagner Equation………….158
Table 7.3. BET adsorption model fitting for water over kaolinite as a function of
temperature…………………………………………………………………………………..163
Table A.1. Lennard-Jones and Coulomb interaction parameters for ibuprofen and
water…………………………………………………………………………………………..199

List of Tables
xxii
Table A.2. Adsorption capacity of different structures, as a function of the amount of
ibuprofen in the initial aqueous mixture and of the material structure……………….203.

xxiii
PARA TATICA.
“LIFE IS NOT EASY FOR ANY OF US. BUT WHAT OF THAT? WE MUST HAVE PERSEVERANCE AND
ABOVE ALL CONFIDENCE IN OURSELVES”
MARIE CURIE (1867-1934).

xxiv

1
1
1 1. INTRODUCTION

2
The new environmental constraints, the required intensification of processes
and the search of the society for sustainable resources and products are becoming a
paradigm for designing new processes and refining existing ones. Carbon dioxide is
the most abundant greenhouse gas emitted to the atmosphere by anthropogenic
processes (as seen in Figure 1.1), and although it is used in many applications, it is
often associated with the problem of climate change. In this sense, a great effort has
been devoted in recent years to develop sustainable processes, or to improve existing
ones, searching for a net positive impact in the environment or, at least, better
environmental performance than the processes currently used.
Figure 1.1. Anthropogenic emissions of carbon dioxide
Hence, one of the most important methods proposed to mitigate anthropogenic
CO2 emissions is to adsorb and separate CO2 from diluted sources, such as gases
emitted from fossil fuel combustion, usually known as Carbon Capture and Storage
(CCS), together with the search for alternative, cleaner, sources of energy and energy
efficiency.
Several approaches have been proposed for CO2 capture including cryogenic
distillation, amine scrubbing, membrane separation and sorbent adsorption. Because of
the occurrence of phase transition, cryogenic distillation is energetically intensive.
Furthermore, chemical absorption using aqueous alkanolamine solutions is proposed
to be the most applicable technology for CO2 capture. However, this technology
possesses some drawbacks such as high equipment corrosion rate, high energy
consumption in regeneration, solvent regeneration and a large absorber volume
required. As a result, solid adsorption processes are suggested and studied to
overcome those inherent problems. Upon comparison, adsorption in porous materials

Chapter 1. Introduction
3
has considerably high energy efficiency, low capital cost, large separation capability
and ease for scaling-up, providing advantages particularly at low to moderate
throughput. So far, the economic viability of adsorptive processes is largely due to the
versatility of zeolites.
Considerable progress has been made in recent years on the development of
novel adsorbents for CO2. A variety of promising types such as activated carbonaceous
materials, functionalized materials, microporous/mesoporous silica and cation-
exchanged zeolites have been studied by different authors due to their specific
properties. Moreover, Metal–Organic Frameworks (MOFs) have recently attracted
significant attention due to their impressive high surface areas and versatile crystalline
structures that allow a “materials by design” approach, causing them to try to find
their way into industrial applications.
Nevertheless, in spite of the increasing interest for efficient materials, most of
the published work focuses on adsorption isotherms and characteristics of the pure
substances, and few measurements are related to mixtures, providing limited data to
be used for the industrial conditions. Besides, for practical applications, the effect of
coexisting components or impurities such as water, oxygen, sulfur and nitrogen
compounds and other molecules present has been less explored. The necessary
understanding about the influence of the main components still needs further
investigation.
In this sense, molecular simulations play a crucial role, since apart from giving a
deep understanding of the physical phenomenon, allow us to obtain unique and
exclusive information of the material properties and operation, which cannot be
deduced by experimental macroscopic techniques, as well as be a screening method to
explore a vast amount of materials and conditions in less time.
1.1. Thesis objectives
The work is mainly focused on the computational study for application of
advanced materials such as cation-exchanged zeolites and MOFs to carry out a detailed
and comprehensive study of the adsorption process. The scope of this Thesis is to
study molecular aspects that are important for understanding of carbon dioxide
capture and the effect that impurities have on this.
The main novelty is to combine basic science with applied engineering, in order
to obtain a fundamental understanding and optimize specific processes at real
industrial conditions. For this case, accurately and transferable force fields were used

4
in order to reproduce experimental values of adsorption of gases, allowing the use of
more complex models that describe the system more realistically.
1.2. Thesis outline
The outline of this thesis is as follows:
In Chapter 2, some of the most important features about the adsorption process
are introduced. Emphasis has been put on the different computational techniques used
for the simulations. Special importance has been given to those features and
peculiarities which make these techniques suitable tools to obtain unique and valuable
information. Similarly, in Chapter 3, the technologies for CO2 capture, current uses, as
well as computational approaches for CO2 adsorption and separation are briefly
discussed.
In Chapter 4, a deep review of the most used and promising materials found in
literature for carbon dioxide capture and separation is presented, regarding: 1) pure
adsorption, 2) mixture behavior, and 3) impurities effect. Care has been taken to put all
results in the same units for a fair comparison
In Chapter 5, the separation between carbon dioxide and nitrogen in different
crystallographic families is studied in detail for a typical industrial TSA process. The
binary mixture behavior and the influence of water traces is also investigated. A new
procedure for assessing and optimizing capture systems at real conditions, based on
molecular simulations, is proposed in this work
Chapter 6 is devoted to the study of the effect of impurities such as water and
SO2 in the post-combustion carbon dioxide separation on two different materials:
CuBTC (well known and studied MOF that is stable upon adsorption of water at
standard conditions and has potential for industrial applications), and the traditionally
used zeolite 13X. The adsorption isotherms, selectivities, isosteric heats and location of
the preferential adsorption sites for the main gasses contained in a multi-component
exhaust gas are computed, in order to reach a better understanding of the competition
of the different molecules for be adsorbed inside the frameworks, and hence, the true
influence of these impurities at real operating conditions.
Chapter 7 presents a detailed computational investigation of the effect of multi-
component mixtures of flue gas for gas separation in representative zeolites such as
kaolinite and chabazite.
A final conclusion chapter summarizes the most important results showed in
the previous chapters, and highlights some possible future directions of this work

Chapter 1. Introduction
5
Additional work, based on the application of the same simulation techniques to
the study of adsorption properties of ibuprofen on activated carbon is presented in an
Appendix. This is also an environmental related problem, in this case focused on the
removal of pollutants in water. With this, we show the versatility of the computational
tools used in this Thesis, compared to experimental data found in literature, and
related to different environmental problems.

6

7
7
2 2. FUNDAMENTALS

8
2.1. Adsorption
Adsorption is a process in which a supporting medium, usually a porous
material, is required for separation. The process is considered one of the natural
phenomena most relevant area of human activity, since through it, one can selectively
capture species, thus controlling emissions of pollutants into the environment. It also
allows separating a high added value product from subproducts or waste.
The term adsorption is used to denote the enrichment or accumulation of one or
more components, whether molecules, atoms or ions, in an interfacial layer between
two bulk phases. In dealing with adsorption at gas/porous solid interfaces, it is
customary to call the components in the adsorbed state the adsorbate, and to refer to
the same species in the bulk gas phase as the adsorptive. Additionally, the adsorbing
solid is called adsorbent. Adsorption is distinguished from absorption, which involves
bulk penetration of the gas into a mass of the adsorbing solid or liquid [Dabrowski,
2001; Sing et al., 1985].
The essential requirement of an adsorption separation processes is to have an
adsorbent that preferentially adsorbs/retain a family of related components from a
mixed feed. The forces acting in an adsorption process can be categorized into two
main groups: (i) van der Waals forces directly correlated with adsorbate molecular
polarizability and (ii) electrostatic forces such as polarization forces, surface field–
molecular dipole interactions and surface field gradient–molecular quadrupole
interactions. Adsorption is usually promoted by synergies among these different kinds
of interactions.
When a gas is introduced into a solid, an adsorbed phase bonded to adsorbent
surfaces may form. When the conditions are changed, gas molecules may desorb.
Adsorption of a gas on a porous solid is a spontaneous process, which means that it
involves a decrease in free energy (G) due to the passing of the free gas to the
adsorbed film. There is also a decrease in entropy (S), because the gas adsorbed on the
surface of the adsorbent is more ordered than in the gas phase.
There are two broad types of adsorption processes: physical adsorption and
chemical adsorption. These are both characterized by the strength and nature of the
bond between the adsorbate and substrate [Sing et al., 1985]. The distinction between
physical and chemical adsorption is very important as the process and the behavior of
the adsorbed layers are quite different.

Chapter 2. Fundamentals
9
2.1.1. Physical and chemical adsorption
The adsorption process can be divided into two: the chemical adsorption (or
irreversible chemisorption) and physical (physisorption), due to the bonds that are
formed between the adsorbate and the adsorbent surface (see Figure 2.1).
The physisorption is characterized by weak bonds (van der Waals force and
dipolar forces) and low heats of adsorption. Furthermore adsorbate molecules are not
restricted to specific sites but, instead, are free to cover the entire surface of the
adsorbent caused by the attraction between permanent dipoles and induced dipoles,
without altering the atomic or molecular orbitals of the species involved.
Chemisorption involves the exchange or sharing of electrons between the
adsorbate and the substrate. As the links between the adsorbate/adsorbent are strong
(ionic or covalent) due to an interaction of chemical type, the bonding electrons
between the gas and the solid undergo a rearrangement and respective orbital change
shape or degree occupancy of such a chemical reaction mode [Lowell et al., 1984;
Rouquerol et al., 1999].
Figure 2.1. Solid-gas interactions: physisorption (reversible) and chemisorption (strong and irreversible bond formed with the solid surface).
It is evident that the enthalpy of adsorption of gases on porous solids is always
an exothermic process for physisorption. In physisorption, the uptake is generally
favored at low temperature while the uptake caused by chemisorption is favored at
high temperature. Chemisorption is typically characterized by the formation of a single
layer of adsorbate on the surface of porous materials; contrarily in physisorption,
multiple layers of the adsorbate can form on the porous materials.
Some significant differences between physisorption and chemisorption are
summarized in Table 1.1 [adapted from Young and Crowell, 1962; Adamson and Gast,
1997; Rouquerol et al., 1999; Atkins, 1998; Attard and Barnes, 2008]

10
Table 1.1. Comparison between physical and chemical adsorption.
Physical adsorption Chemical adsorption
Rate of adsorption Fast
Slow (normally has to overcome the activation energy for breaking chemical bonds)
Monolayer coverage Monolayer and multilayer formation depending on environment
Limited to mono layer coverage
Origin of interactions force and specificity
van der Waals forces, non-specific adsorption, easy for desorption
Chemical bond forces, highly specific adsorption, difficult for desorption due to the need to break bonds
Dependence of the temperature
Decrease with increasing temperature
Increase with increasing temperature
Reversibility
Reversible (the adsorbate will desorb when the temperature is raised or the pressure is lowered)
Usually not reversible
Specificity Non-specific and does not result in the dissociation of adsorbed molecules
Very specific due to chemical reactions between gas molecules and surface groups. Often results in dissociation of molecules during the process
2.1.2. Adsorption isotherms
One of the most common ways of representing adsorption equilibrium is by the
relationship between adsorbed amount and pressure for a given temperature. This
relationship is known as adsorption isotherm for a given adsorbate-adsorbent system.
The adsorption phenomena are characterized by measuring adsorption
isotherms which represent the amount of adsorbed molecules in the adsorbate as a
function of gas pressure or liquid outside. This graph is usually expressed as the
amount of adsorbate per gram (or volume) of adsorbent to each equilibrium pressure
of the gas (at a constant temperature). When a porous material is exposed in a closed
space with some definite pressure of gas, it begins to adsorb the gas. The quantity of
gas taken up by a sample of solid is proportional to the mass of the sample, the
temperature, the pressure of the gas and the nature of both, the solid and the gas.
By studying the adsorption isotherms, one can: 1) estimate the surface
area/pore volumes, 2) estimate the pore size distribution, 3) assess the surface
Chapter 2. Fundamentals
11
chemistry of the adsorbents, and 4) determine the fundamentals of the adsorption
process, among others.
There are different correlations in the literature for adjusting the experimental
equations typical values such as Langmuir, Freundlich, BET, among others.
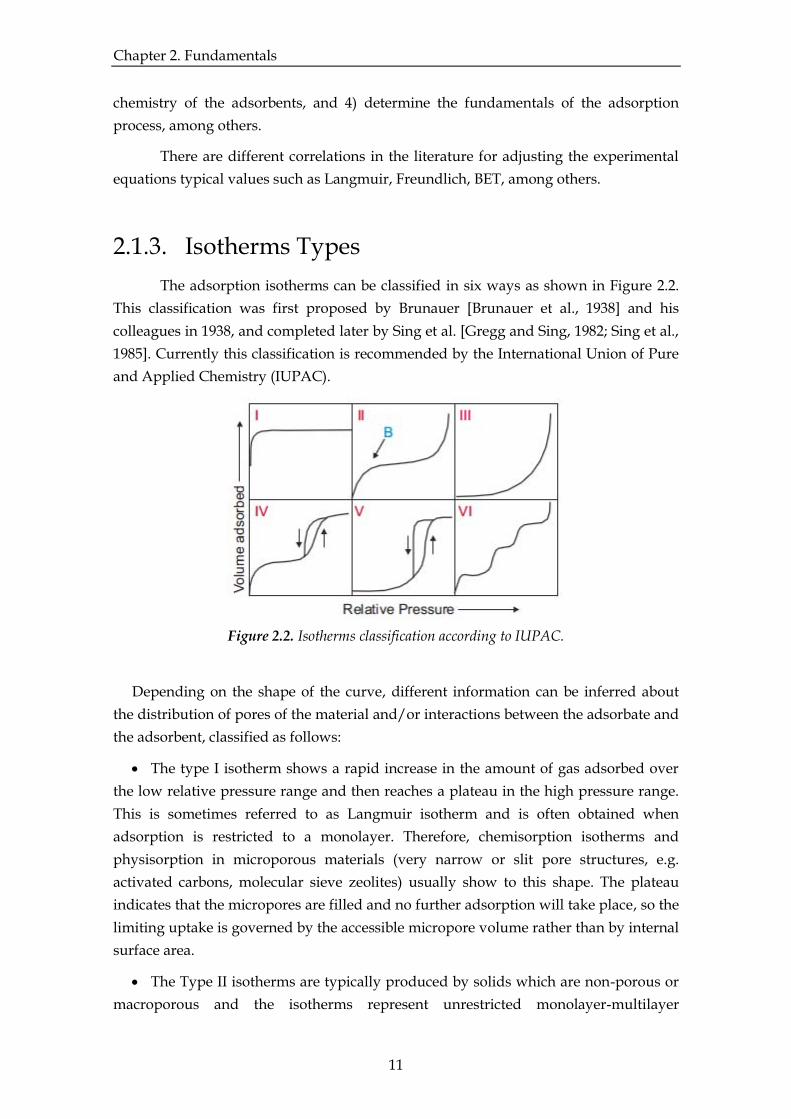
2.1.3. Isotherms Types
The adsorption isotherms can be classified in six ways as shown in Figure 2.2.
This classification was first proposed by Brunauer [Brunauer et al., 1938] and his
colleagues in 1938, and completed later by Sing et al. [Gregg and Sing, 1982; Sing et al.,
1985]. Currently this classification is recommended by the International Union of Pure
and Applied Chemistry (IUPAC).
Figure 2.2. Isotherms classification according to IUPAC.
Depending on the shape of the curve, different information can be inferred about
the distribution of pores of the material and/or interactions between the adsorbate and
the adsorbent, classified as follows:
The type I isotherm shows a rapid increase in the amount of gas adsorbed over
the low relative pressure range and then reaches a plateau in the high pressure range.
This is sometimes referred to as Langmuir isotherm and is often obtained when
adsorption is restricted to a monolayer. Therefore, chemisorption isotherms and
physisorption in microporous materials (very narrow or slit pore structures, e.g.
activated carbons, molecular sieve zeolites) usually show to this shape. The plateau
indicates that the micropores are filled and no further adsorption will take place, so the
limiting uptake is governed by the accessible micropore volume rather than by internal
surface area.
The Type II isotherms are typically produced by solids which are non-porous or
macroporous and the isotherms represent unrestricted monolayer-multilayer

12
adsorption on a heterogeneous adsorbent. The point B indicates the value of the
relative pressure where adsorption monolayer is completed and initiates multilayer
adsorption. Consequently, multilayer adsorption increases progressively with rising
pressure.
Type III: this type of isotherm is shown by non-porous or macroporous materials
when there is little affinity between the adsorbate and the adsorbent. This is
distinguished from Type II isotherms by a convexity towards the relative pressure axis
in the entire range of the isotherm and do not exhibit a point B. Therefore, at low
pressures relative effect force field (a low slope) is not observed due to the weak
interactions between the adsorptive partners. In other words, the adsorbate-adsorbate
interactions are stronger than adsorbate-adsorbent interactions. However, the uptake
at high relative pressure is much higher due to the adsorbate-adsorbate interactions
being much stronger inside the pore and this increases the driving force of the
adsorption process.
The Type IV is presented by mesoporous adsorbents. The isotherm shows a
hysteresis loop, which is associated with capillary condensation in
adsorption/desorption mesopores, and a limit on the amount adsorbed to the upper
range of relative pressure. The initial part of the isotherm is attributed to adsorption
monolayer, because it coincides with the first region of the isotherm of type II. At this
initial state, adsorption of molecules on to the walls of porous material occurs at a very
low relative pressure until a monolayer is formed. Hence, the multilayer adsorption
occurs as pressure increases and follows capillary condensation at high relative
pressure. In the capillary condensation process, gas molecules tend to form a liquid-
like layer with a curved meniscus at pore entrances. As pressure decreases, the angle of
the curve of the meniscus also changes. The liquid meniscus blocks the liquid
condensed in pores from evaporating, thus resulting in a high mass of adsorbate
remaining in the porous material which then creates the hysteretic loop.
Type V: presented by mesoporous materials because of the presence of hysteresis
in the process. There is little affinity between the adsorbate and the adsorbent. Unlike
Type III, there is a hysteresis loop and it exhibits a point of inflection at a higher
relative pressure. Subsequently, Type V isotherms reach a plateau in the multilayer
region of the isotherm where the capillary condensation occurs. This isotherm is rare.
The Type VI isotherm represents the step-like nature of the adsorption process in
some materials. The steps result from sequential multilayer adsorption on an uniform
non-porous surface. Each of the steps corresponds to having an adsorbed layer
(represents the monolayer capacity for each adsorbed layer). The adsorption process
should be ideally reversible, however, some deviations can occur.

Chapter 2. Fundamentals
13
2.1.4. Heat of adsorption
The concept of adsorption equilibrium is deeply involved in the evaluation of
adsorbent specific capacity, selectivity and regenerability. Equilibrium adsorption
isotherms and heat of adsorption represent essential input data for a process modeling.
Heat of adsorption is a measure of the strength of interactions between adsorbate and
adsorbent (adsorption is an exothermal phenomenon). For adsorbents characterized by
energetically heterogeneous surfaces (e.g. most zeolites), heat of adsorption is higher at
low loadings, describing interactions on strongest sites. Thus, it is properly referred as
isosteric (i.e. at a definite loading) heat of adsorption, qST.
From the process engineering point of view, the heat of adsorption is a measure
of the energy required for adsorbent regeneration and it provides an indication of
temperature variations that can be expected on the bed during adsorption (and
desorption) under adiabatic conditions. It appears that the heat of adsorption should,
ideally, have an intermediate value. If it is too high, the sorbent will be difficult to
regenerate economically, and if it is too low the capacity for adsorbing a specific
molecule (i.e. CO2) and the selectivity will be too small for practical applications.
Hence, since the isosteric heat of adsorption is the energy dissipated during
adsorption [Ackley et al., 2003; Martin et al., 2010], this can be calculated from the
equilibrium established between the condensed phase and gas phase, reduced to the
Clapeyron equation for adsorption equilibrium.
(2.1)
The isosteric heat from the Clapeyron equation is independent of temperature
and pressure, and it is calculated based on the slope of a straight line built when
relating "ln P" vs. "1/T". From a set of isosteres (at the same concentration) or
experimental data for a phase equilibrium between a solid and a gas phase (T, P, Nads)
one can fully describe the adsorption equilibrium and evaluate the isosteric heat of
adsorption.
The magnitude of the heat of adsorption is often used to distinguish between
chemisorption and physisorption. It is recognized as physisorption when the heat of
adsorption is typically in the range of 20-70 kJ/mol (and is larger than the enthalpy of
condensation). Enthalpy of chemisorption, in general, is much larger than enthalpy of
physical adsorption and generally higher than 80 kJ/mol. In the intermediate zone
identification is uncertain [Rouquerol et al., 1999].
The nature of both, the adsorbent and the adsorbate, governs the strength of the
interaction. Strong forces between the fluid and the surface lead to chemisorption,
which is characterized by the formation of a monolayer on the surface of the adsorbent

14
[Rouquerol et al., 1998]. Small adsorption enthalpies occur in physical adsorption or
physisorption when only weak forces like van der Waals interactions appear between
the phases. The formation of multilayers is common in this case.
2.1.5. Adsorbent selectivity
Equilibrium selectivity is the key parameter to evaluate adsorbent separation
ability. It is based on differences in affinities of the adsorbent for the different species
constituting the fluid phase. The preferential adsorption of components from a gas
mixture can be achieved by one, or a combination, of the following mechanisms: (1)
differences in the adsorbate–surface interactions and/or adsorbate packing interactions
when the system reaches equilibrium (thermodynamic equilibrium mechanism), (2)
differences in the size and/or shape of gas molecules leading to exclusion of molecules
with a critical diameter too large to enter the adsorbent pores) and (3) differences in the
diffusion rates of molecules through the adsorbent pores (kinetic mechanism).
For mixtures, the selectivity of preferential adsorption of component 1 over
component 2, can be formally defined as:
(2.2)
where x and y denotes composition of each component at the adsorbed and at the bulk
phases, respectively.
This definition of Sij serves as a useful tool to screen potential adsorbents.
However, to adequately design an adsorption-based separation process, the selectivity
of the adsorbent for components from a real gas mixture must be confirmed and the
capacity of the adsorbent needs to be evaluated [Rochelle et al., 2009].
In order to determine the amount adsorbed, correlations and techniques are
often used due to the complex of measure mixture streams. The Ideal Adsorbed
Solution Theory (IAST) [Myers and Prausnitz, 1965], one of the most known methods,
provides at estimation of the composition values at the adsorbent surface based only
on the knowledge of the pure component isotherms. This is an incredibly useful
method, since one only have to run calculations or experiments for pure adsorption
isotherms, and then predict any combination of the gases.
It is represented as follows:
(2.3)

Chapter 2. Fundamentals
15
(2.4)
being and P the equilibrium and bulk pressure respectively.
The accuracy of the IAST calculations for estimation of the component loadings
for several binary mixtures in a wide variety of materials has been well established by
comparison with the Configurational-Bias Monte Carlo simulations of mixture
adsorption [Krishna and Baur, 2003]. These predicted selectivities from IAST are
typically accurate at low loadings because the method is exact in the Henry law limit
[Challa et al., 2002]: for example, Babarao and Jiang [Babarao and Jiang, 2008] found
good agreement between IAST predicted isotherms and mixture simulation isotherms
for silicalite, C168 Schwarzite and IRMOF-1 at low pressures. However, IAST assumes
an ideal solution and it is inaccurate at higher loadings when there is inhomogeneous
adsorption of the mixed-gas components in the framework, either underestimating or
overestimating the adsorption compared with mixture simulation results.
2.1.6. Breakthrough Curves
The adsorption selectivity of the material for one component of the mixture
versus the other is most commonly used to screen adsorbent materials for separation
purposes, especially at the early stages of the investigation. However, the performance
of an adsorbent is governed by both, selectivity and capacity factors. The proper com-
bination of these two factors is obtained by using breakthrough calculations [Xiang et
al., 2012].
To formulate the model for a dynamic column breakthrough process, the
following mathematical model is the main used and is based on the following
assumptions: 1) the flow pattern is described by the axially dispersed plug flow model.
2) The system operates under isothermal conditions and column wall temperature was
constant and equal to the water bath temperature. 3) the frictional pressure drop
through the column is negligible. 4) the adsorbent particles are spherical and
homogenous in size and density. 6) The velocity of the gas is constant. The driving
force is the concentration gradient of the adsorbed phase and the diffusion coefficient
is constant. Under the above assumptions, a set of governing scaled equations and
appropriate scaled initial and boundary conditions can be established [Krishna and
Baur, 2002]:
The mass balance equation for a single component system, subjected to the
above assumptions, is presented below.
Component mass balance and boundary conditions:

16
(2.5)
Where
(2.6)
Substituting:
(2.7)
In the above equations, N is the flux of the adsorbates, q is the average
adsorbate concentration in the solid phase at any location along the column length. DL
is the axial dispersion coefficient, z is axial distance measured from the column inlet,
and t represents time. C is the total concentration (or density, ρg) of the feed gas, which
can be obtained from the ideal gas law, is the bed voidage and u is the superficial gas
velocity (see Figure 2.3).
The left hand side of Eq. represent the concentration of component i in the gas
due to convection, the axial dispersion, the accumulation in the packing, and sorption
onto the solid sorbent, while the right hand side represents the rate of diffusion of the
component.
Figure 2.3. Packed bed scheme.
The initial and boundary conditions:
(2.8)

Chapter 2. Fundamentals
17
The set of equations can be solved numerically, by introducing appropriate
scaling factors and applying the finite difference technique. The finite difference
method discretized the space derivatives and converted the partial differential
equations to ordinary differential equations and the ordinary differential equation
(overall mass balance) to algebraic equation at each node point. Thus, the algebraic
equations give explicit expressions for calculating dimensionless interstitial fluid
velocity at every node. Mole fraction of the adsorbable component at the column exit
are then used to analyze the experimental breakthrough responses.
2.2. Molecular Simulations
The term “molecular simulation” refers to computational methods in which the
molecular properties are explicitly taken into account. These methods play an
important role in the study of the behavior of microscopic and macroscopic processes
such as adsorption, since they provide a unified theoretical framework, based on
statistical mechanics, to model the thermodynamic properties of a substance.
A well-designed computer simulation can be a complement for experiments.
Molecular simulation can also provide data that is inaccessible through experimental
methods or when the experiment has components that are too dangerous or too
expensive. At the same time, they offer the possibility to create hypothetical scenarios
and to test theories, while help to provide a molecular understanding of why the
observed events occur.
The molecular mechanical methods are based on classical mechanics. These
methods allow the study of materials at atomic level and determine the bulk properties
through force fields, which are a set of potential functions and parameters. The
potential functions define the interactions in a molecular system. These functions can
be parameterized in a variety of analytical forms to give the correct energies and forces
in order to describe how the molecules interact as a function of their positions. The
parameters encompass optimal values of balance, such as distances, bond angles and
force constants.
2.2.1. Statistical Mechanics
Statistical mechanics is the area of physics that, using probability theory, studies
the macroscopic behavior of a system using the microscopic properties of its
constituents. This theory allows to study a large number of molecules (around 1024), by
examining the statistical properties of a much smaller system (i.e. 104 particles). It

18
provides a molecular level interpretation of thermodynamic quantities like free energy,
entropy, heat or work.
There are two fundamental postulates in statistical mechanics:
Postulate of equal a-priori probabilities: this one states that given an isolated
system in equilibrium, each accessible microstate corresponding to the same
total energy can be found with equal probability, i.e. a system in equilibrium
does not have any preference for any of its microstates.
The other postulate is so-called the Ergodic Hypothesis. This hypothesis,
fundamental in statistical mechanics, postulates that if a system is in
equilibrium, at any point in time the average thermodynamic properties remain
constant. This hypothesis, supported by experimental evidence, enables the use
of the statistical thermodynamics and, therefore, molecular simulation
methods.
The aim of molecular simulations is to describe a system using a molecular
model in order to predict its properties. For example, with molecular simulations it
could be easily observed the orientation and arrangement of molecules inside a
structure. To connect the simulation with the real world and make useful predictions, it
is crucial to compare the result of the calculations with macroscopic properties of the
system which can be measured experimentally, such as temperature, pressure, etc. This
connection between the microscopic and macroscopic view of the system can be
achieved using statistical mechanics.
To address the calculation of thermophysical properties, two molecular
simulation techniques are the most common: Monte Carlo and Molecular Dynamics.
For a detailed description of these techniques the reader is referred to the text books by
Allen and Tildesley [Allen and Tildesley, 1989], and Frenkel and Smit [Frenkel and
Smit, 2002].
The workhorse of statistical mechanics is the partition function or in other words
“the sum over all microstates”. This refers to a mathematical formula which expresses
the statistical weight of all the phase space configurations of the system. The classical
expression of the partition function Q for a N-particle system is defined as
(2.9)
where rN and pN denote the positions and momenta, respectively, and h is Planck’s
constant [Frenkel and Smit, 2002]. The function H(rN, pN) is the Hamiltonian of the
system, which is the total energy as a function of the coordinates and momenta of the
particles.

Chapter 2. Fundamentals
19
If the partition function is known exactly, then all thermodynamic properties,
such as the energy of the system, the chemical potential, the pressure, or the entropy,
etc., can be determined from it. Usually, the partition function cannot be computed.
Instead it can be computed averages corresponding to a certain statistical ensemble.
If consider a very large system of N classical particles (not relativistic, no
quantum effects), this system is dynamically described by 3N spatial coordinates q, and
3N velocity (or linear momentum) coordinates v. This means that every microstate, or
microscopic state of the system, is uniquely described by 6N variables. In a 6N-
dimensional coordinate system this microstate can be plotted as a point. Such 6N-
dimensional coordinate system is called phase space.
The system can also be described in terms of its number of molecules N, its
energy E and its volume V. From the microstate we can easily calculate the macrostate,
or macroscopic state of the system, in terms of number of N, V and E. If the system is
isolated and in thermodynamic equilibrium, the macrostate will have constant values
of N, V, and E while the system can change between different microstates with the
same values for N, V and E. There is a large number of microstates that describe the
same macrostate of the system. In the phase space, the microstates that are compatible
with the macrostate NVE will define a (hyper)volume described by a density function
(q,v). And, as mentioned before, the crucial postulate of statistical mechanics is that all
these microstates are equally likely:
(2.10)
δ(x) is the Dirac's delta function, which is zero for every x except when x=0, with
δ(0)=∞. The integral of Dirac's delta function equals the unity. This microstate density
is called microcanonical ensemble.
Under these NVE conditions, the only possible distribution is the one that
places each system at the energy level E. This level will generally have degeneracy, so
the system can be found in any of the states of identical energy.
The thermodynamic properties of the system can be obtained from the
properties of the microstates. If Ω is the number of microstates compatible with one
single macrostate, then:
(2.11)
where kB is the Boltzmann’s constant (1.3806503x10⁻²³ m2 kg s-2 K-1) and S the entropy of
the system. Usually is not only wished to describe isolated systems, but systems in
thermal equilibrium where N, V and the T are constant as they are closer to
experimental situations. In that case, following a similar formulation, a different
microstate density can be obtained called canonical ensemble. In absence of
electromagnetic fields, the velocities of the particles can be integrated to obtain:

20
(2.12)
were N(q) is the probability that the system is in the microstate i with energy Ei. The
numerator is called Boltzmann factor and the summation in the denominator is the
normalization factor called the partition function of the system: Q(N,V,T). From the
partition function all the thermodynamic information on the system can be obtained, as
the Helmholtz free energy can be directly computed as a function of N, V and T
[Pathria, 1996]:
(2.13)
However, Q(N,V,T) can only be calculated exactly for a limited number of systems
such as the ideal gas.
Similarly, the microstate density in other ensembles can also be calculated. For
example, in the Grand-canonical, or μVT ensemble, where the volume, temperature and
chemical potential μ are constant, the density of microstates is, in absence of
electromagnetic fields:
(2.14)
where Λ is the thermal de Broglie wavelength:
(2.15)
Being h the Plank's constant (6.626x10⁻³⁴ J s).
Here the number of particles, N, can fluctuate but the chemical potential μ,
remains constant as well as the volume, V, and the temperature, T. To study the
adsorption properties the grand-canonical ensemble is a natural choice. By varying the
chemical potential, which is related to the system pressure by an equation of state
[Valderrama and Vargas, 2003; Wagner and Pruss, 2002], one can obtain a local
adsorption isotherm for a given structure. The interactions between the particles of the
adsorbate in the pore model, and between the gas and particle pore wall can be
evaluated by long and short range potentials [Frenkel and Smit, 2002; Prausnitz et al.,
2000]. To compute this property the use non-physical trial moves, such as the insertion
and deletion of particles is needed in order to change the number of particles in the
system.
To calculate a property of the system it is necessary to average the value of that
property over all the possible microstates. For example, if A is the property we would
like to measure in a canonical ensemble and <A> its average value, we need to
calculate:

Chapter 2. Fundamentals
21
(2.16)
The ergodic hypothesis states that this time averaging equals the previous ensemble
averaging [Pathria, 1996]:
(2.17)
Time averages corresponds to Molecular Dynamic methods (integration of
Newton's equations of motion,). Instead, averages over microstates can be computed
efficiently using Monte Carlo methods.
2.2.2. Monte Carlo
The Monte Carlo (MC) method is a technique for computing ensemble averages
of macroscopic system properties, such as pressure, volume, temperature, etc. These
techniques rely upon stochastic methods, in particular on importance sampling
methods [Leach, 2001]. One attractive aspect is that only energies rather than forces are
evaluated during configurational sampling. In the MC method, system configurations
are generated with a probability proportional to their statistical weight, and the weight
of a configuration is proportional to Boltzmann factor, in turns. Based on repeated
random samplings, the methods are able to generate states of low energy (thus most
probable), enabling properties to be calculated correctly.
MC methods are extensively used for complex molecules constructions, in
systems where the temporal evolution is not significant for properties calculation, or in
all cases where molecular dynamics could fail due to the complexity of the system, or
to prohibit long required calculations.
The main problem is that the number of microstates is usually too large to be
computed (it would take beyond the lifetime of the universe using all computers in the
world). In addition, for most systems only a small fraction of the microstates has a
Boltzmann factor different from zero [Frenkel and Smit, 2002]. Molecular simulations
can only describe a limited number of atoms, usually in the order of a few thousand, or
hundreds of thousands with highly optimized codes and supercomputers, within the
limit of a reasonable simulation time. To avoid these inconveniences, periodic boundary
conditions are used. With this method, the volume containing the system is infinitely
replicated in each direction of space depending on the dimensionality of the problem
(see Figure 2.4).

22
Figure 2.4. Schematic representation of the periodic boundary conditions and the Grand Canonical ensemble (the framework is in contact with a particle at a fixed temperature and chemical potential; guest molecules are exchanged between the crystal framework and the
reservoir).
It is important to start a Monte Carlo simulation from a representative
equilibrium configuration. However, a randomly selected or arbitrary configuration
may be far away from typical configurations at equilibrium. Therefore, one should
neglect the first part of the simulation and not consider these configurations for
computing averages.
To effectively considerate significant states only, in the Metropolis method
[Metropolis et.al., 1953], a Markov chain is generated. This satisfies these two
conditions [Leach, 2001]:
1. The outcome of each trial depends only upon the preceding trial and not
upon the previous trials;
2. Each trial belongs to a finite set of possible (acceptable) configurations.
Metropolis
The algorithm introduced by Metropolis [Rosenbluth and Teller, 1953], allows
to generate the set of configurations according to a Markovian stochastic process.
The Metropolis MC Method is a process in which a random walk is constructed
in such a way that the probability of visiting a particular system state is proportional to
the Boltzmann factor exp[−Ui]. For such a sequence, the average property is still
possible to estimate and becomes
(2.18)
Starting from a certain configuration, a so-called trial move that changes the
system state is performed. Depending on the energy difference and a random number,
the new state is either rejected or accepted. The acceptance rule is constructed such as

Chapter 2. Fundamentals
23
the probability that the system is in a certain configuration is proportional to its
statistical weight.
As seen in Figure 2.5, a typical simulation consists of the following, randomly
selected, trial moves [Frenkel and Smit, 2002]:
• Translation. In this move, the position of the center of mass of a randomly selected
molecule i in the system is displaced by a random vector:
(2.19)
where Δ is the maximum displacement and Random is a uniformly distributed random
number between 0 and 1. The value of Δ has to be chosen to have a reasonable fraction
of accepted moves. If Δ is very small, most displacements will be accepted, but this will
lead to a very inefficient sampling of the phase space. If Δ is very large, most of the trial
moves will be rejected. The optimum value of Δ depends on the characteristics of the
interaction potential [Frenkel and Smit, 2002].
• Rotation. For molecules consisting of more than one interaction center, the rotational
degrees of freedom of the molecule can be sampled by a random rotation. Either the x,
y or z axis of the coordinate system can be selected as a rotation axis. For example, for a
rotation around the z axis we will have:
(2.20)
where r is the vector that contains the coordinates of a molecule, r' the coordinates after
the rotation, and Δθ the rotated angle in a counterclockwise direction. The maximum
rotation angle is chosen such that on average a 50% of rotations are accepted [Frenkel
and Smit, 2002].
• Insertion and deletion of molecules. In the grand-canonical ensemble, the number of
guest molecules present in the system is not constant. This ensemble is useful when we
want to calculate adsorption isotherms in a porous material.
To obey detailed balance, the same procedure has to be applied to derive the
acceptance rule for insert/removing a guest molecule. The difference is that the old
configuration is now a randomly selected molecule of the system.
Once the movement has been made, intermolecular potential energy v(XN) is
calculated along with the change in potential, v = v(XN) - v(XM). If v is negative, then
the move is accepted. If v is positive, then the move is accepted with probability.
The decision to accept or reject the motion in this case is to assign a random
number with a value in the range 0 to 1. If exp(v(rij)/kT), the motion is accepted;

24
otherwise it is rejected [Frenkel and Smit, 2002]. If the status n is rejected, then the
former state m is again taken as the new configuration of the series. This condition
usually is summarized writing the probability of acceptance of a trial.
To be specific, from the state old o, m different new state n are accessible. The
probability of leaving state o must be equal to that of entering state o. This leads to the
detailed balance equation:
(2.21)
In the Metropolis Method, α is chosen to be a symmetric matrix, namely
α(o→n)=α(n→o). As a result, the acceptance rule follows
(2.22)
Figure 2.5. Metropolis Monte Carlo movements
In summary, the Metropolis Method works as follows:
1. Start from an initial configuration. For example, random positions can be generated
for all N particles in the system.
2. Compute the total energy U(o) of the old state.
3. Make a trial move to a new configuration n by, for example, displacing one of the
particles at random.
4. Compute the total energy U(n) of the new state.
5. Accept this trial move with the probability.
6. Sample ensemble averages.
7. Repeat this procedure from step 2 many times until the system reaches equilibrium.
The strength of the MC method lies in its capability to calculate statistical
averages without explicitly sampling the entire partition function. The capability to
deal with complex variation in spatial and energetic variables is what makes MC such
an attractive method.
removal displacement addition

Chapter 2. Fundamentals
25
2.2.3. Molecular Dynamics
Molecular Dynamics (MD) is a method for computing equilibrium and
transport properties of a classical many-body system. MD simulates the time evolution
of molecules by solving Newton’s equation of motion, allowing calculating structural
and thermodynamics properties. Since the calculations are interested in the time
evolution of the particle, the equation can be expressed in terms of displacement r with
respect to time t.
(2.23)
The trajectory of the system can be obtained by integrating over several finite
difference schemes. In particular, the Verlet algorithm is probably most widely. Using
a Taylor expansion, the velocity Verlet algorithm can be easily derived:
r(t t) r(t) v(t)t a(t)2t (2.24)
The time step t is chosen such a way that the integration is accurate enough
and the total energy of the system is conserved. The average properties of the system
can be determined from the trajectory obtained over a sufficient period of time.
This method can be used to study the diffusion of guest molecules inside
adsorbent materials. In general, transport diffusion is the process in which an initial
non-uniform concentration profile is smoothed by molecular motion. The typical
diffusion coefficients calculated with MD are the transport diffusivity and the self-
diffusivity: the first one describes the diffusive motion of single molecules, while the
transport diffusivity describes the transport of mass and the decay of concentration
fluctuations.
The advantages of this algorithm is that it is very simple to implement, the error
in the calculation of the positions is of order four in Δt, and it is time reversible just as
Newton’s equations.
2.2.4. Molecular interaction potentials (Force Fields)
Both MD and MC techniques use interaction potentials for the calculation of the
energy. The term force field refers to the functional form and parameterization used to
describe this energy U of a system of interacting molecules.
Force fields are usually derived from experiments and quantum mechanical
calculations [Vlugt et al., 1998]. There are many different force fields available in the
literature. They differ in (i) the functional forms used to describe the interaction and (ii)

26
the parameters used to describe the functional forms. In the majority of cases, the
parameters values are specific for a certain system, instead of being suitable for many
different systems. So in this case is necessary to have transferable force fields that can
be extended to different phases or configurations.
The particular expression depends on the model used to represent the atoms in
the system. The total energy of the system Utotal is separated in two parts, bonded
interactions between linked atoms, and non-bonded interactions between non-linked
atoms.
In a classical force field based approach, the atoms interact through a series of
forces like bond stretching, bond bend and dihedral torsion, and through interactions
between non-bonded atoms such as van der Waals and electrostatic interactions. Those
forces can be written in term of potential energy functions.
The sum of the different contributions to the potential energy is the potential
function:
(2.25)
(2.26)
(2.27)
Sometimes, more sophisticated functions such as improper torsions, hydrogen
bonds, polarizability and cross terms are used.
There are three main components of intramolecular interactions: angle bending,
is the interaction of two atoms which are bonded to a common atom; bond stretching,
describes a bond between two atoms; and dihedral angle, describes the interaction
arising from torsional forces in molecules
Obtaining adequate values for the parameters of these equations can be
achieved by two different means: by adjusting the parameter to experimental data such
as liquid and vapor densities, heats of adsorption, dipole moment, or heat of
vaporization; or by using parameters derived by quantum mechanical studies fitted to
different conformations of a structure.
Non-bonded interactions: The non-bonded interaction term describe
how the molecules and atoms interrelate with each other through forces that are not
due to chemical bonds. These interactions play an important role in determining the
structure of adsorbed molecules and evaluation of their energies.

Chapter 2. Fundamentals
27
Usually these expressions are distance dependent equations with parameters to
model the behavior of the specific interaction between pairs of atoms. The potentials
generally consist of two parts, a contribution of electrostatic origin and another
contribution corresponding to the dispersive interactions between molecules, i.e. a
Lennard-Jones (LJ) potential.
i) van der Waals interactions
The force of attraction between adsorbate and solid adsorbent is due to instantaneously
fluctuating electric dipole moments in the adsorbate and the surface of the adsorbent,
while the repulsive force arises from the penetration or overlap of the electron cloud
between adjacent molecules and surfaces.
Both attractive dispersive and repulsive forces of the two isolated atoms are
frequently combined to give the total potential energy or Lennard-Jones [Rouquerol et
al., 1998].
(2.28)
In Eq. (2.34), the attractive r−6 part of the LJ potential corresponds to dispersive
van der Waals interactions, while the repulsive part r−12 represents the repulsion of two
atoms at short distances. From the surface plane; rij is the distance between i and an
atom j, in the solid and Bij and Cij are characteristic repulsion and attraction constants
for the gas-solid system. Figure 2.6 shows that the potential energy of a physisorbed
atom varies as a function of the distance z from the surface of the adsorbent. With a
larger z, the potential energy reduces as the attractive force decreases. With a smaller z,
the potential energy increases rapidly due to the adsorbate-adsorbent force becoming
repulsive. Once the atom moves closer to the surface of the adsorbent, the balance
between the attractive and repulsive forces may be established at distance ze. At this
distance ze the potential energy of the atom or ion is at a minimum.
The most common form to express de LJ interactions is by using the 12-6 model,
as follows:
(2.29)
where σ is the LJ size parameter, and ε is the potential well depth at a separation
distance of rmin = 21/6σ, so U(rmin) = −ε. The parameters ε and σ are specific for every kind
of atom and they must be known to carry out a molecular mechanic calculation.

28
Figure 2.6. Lennard-Jones potential as a function of the distance of the molecule to the solid
surface (contribution of repulsive and attractive forces).
The interactions between same atoms species (framework-framework,
adsorbate-adsorbate or cation-cation interactions), are often defined by reproducing
the critical values and adsorption isotherm. For the interactions between different
atoms (adsorbent-adsorbate), the Lorentz-Berthelot mixing rules [Ungerer et al., 2005]
are usually computed:
(2.30)
Moreover, as the potential rapidly vanishes for large distances, it is usually
truncated and shifted at a certain cutoff radius rcutoff. This will significantly increase the
computational efficiency.
(2.31)
The typical cut-off distance of the LJ potential is usually chosen as rc ≥ 2.5σ.
Thus, the length of the simulation box needs to be at least twice as large as the cut-off
distance.
ii) Electrostatics
The electrostatic interactions are written using the classical Coulomb potential:
(2.32)

Chapter 2. Fundamentals
29
where r is the electric constant of the medium where the charges are placed0 is the
permittivity in the vacuum (8.85x10⁻¹² C2 s2 kg-1 m-3), qi and qj are the charges of the
interacting atoms and rij the distance between the atoms i and j.
As the polarization effects are often neglected, the partial charge on a certain
atom is constant. The magnitude and distribution of the partial charges in a molecule
are chosen such that the dipole or higher order moments of the molecule taken from
quantum mechanical calculations are reproduced.
Compared to the LJ potential (r−6), the range of the electrostatic interaction (r−1)
is much larger. Due to the long-ranged nature of electrostatic interactions, simple
truncation cannot be used [Allen and Tildesley, 1989; Frenkel and Smit, 2002].
Electrostatic interactions are more difficult to calculate than the van der Waals
interaction because the integral of the interaction potential over volume is diverging.
The coulombic interactions are usually calculated using the Ewald sum method [Allen
and Tildesley, 1989; Frenkel and Smit, 2002]. This methodology was introduced in 1921
as a technique to add long-range interactions between particles and their infinite
periodic images [Ewald, 1921]. This method is a very accurate way to calculate the
electrostatic potential in the system with periodic boundary conditions [Frenkel and
Smit, 2002], however, a considerable computation time is consumed in calculating the
Fourier-space part of the Ewald summation.
The van der Waals term and the electrostatic terms must be calculated carefully.
The real-space part of the Ewald summation and the conventional Lennard-Jones
interactions can be calculated simultaneously using the same cut-off radius.
Note that these interactions terms are zero only when the distance between
atoms is infinite. As a consequence, all atoms in a finite system interact with each other,
which has a large computational cost. The easiest way to solve this problem in the van
der Waals interactions is to shift and integrate them beyond a certain distance between
a pair of atoms, only considering the particles whose distance to the interaction center
is less than the cutoff radius rcutoff, therefore it is only necessary to consider the nearest
periodic image of j to i. This is called the nearest image convention [Allen and Tildesley,
1989; Frenkel and Smit, 2002].
2.2.5. Molecular Models
Structures
Crystalline structures such as zeolite and MOFs, are completely described in
terms of their unit cell and their space group. Their atomic structures can be resolved
from different diffraction techniques, X-ray absorption near edge structure (XANES) or

30
nuclear magnetic resonance (NMR), being the X-ray diffraction the most common
technique.
The structure is often modeled using the periodic boundary conditions (see
Figure 2.4). The original simulation box is replicated throughout space, and during the
simulation, the molecules in all periodic images move in the same way as the ones in
the central box. If a molecule leaves the central box, it will enter the central box from
the opposite side.
In molecular simulations, it is often assumed that the materials are rigid. In this
case, the positions of the framework atoms are fixed at their crystallographic positions
during simulations. In this way, the computation of the interaction between the
framework and the guest molecules can be considerately simplified by using grid
interpolation techniques. However, in some cases, the flexibility may be of importance.
For example, the diffusion of molecules in zeolites may depend strongly on framework
flexibility, while for adsorption of small molecules flexibility is not important.
The model to describe flexible structures consist on different bonded potentials
between the atoms and the framework, as well as non-bonded interaction (as already
mentioned). The most common bonded potentials considered are: bond stretching,
bond bending, bond bending coupling, torsion and switching function to avoid
discontinuities. In our study we only consider rigid structures. Although some flexible
models have been proposed for some types of MOFs, developing such models is very
time consuming and is beyond the scope of this work.
Adsorbed guest molecules
The molecules are represented as a set of spheres of different sizes and masses,
connected by springs of different lengths continuously. In the classical approach,
polyatomic molecules can be described by either the all-atom model or the united-atom
model. In the all-atom model, each atom is considered as an interaction site. In the
united-atom model, a group of atoms are represented by a single interaction site. For
example, the united-atom model is often used for CH2, CH3 and CH4 groups of alkanes
where the hydrogen atoms are usually not modeled as separate interaction sites. The
all-atom approach takes into account the molecular geometry and structure more
realistically. However, as the number of interaction sites can be much larger,
simulations could be computationally more intensive.
In this work we only use atomistic, classical models of atoms and molecules. In
these models, one atom or set of atoms is represented by a single interaction center
called pseudo atom (the center of dispersive interaction) and may carry a partial charge.
Pseudo atoms are linked by rigid or flexible bonds in such a way that their geometry

Chapter 2. Fundamentals
31
resembles the geometry of the molecule. In some cases, models may include pseudo
atoms that do not correspond to actual atoms in order to better describe some
properties of the real molecules, such as the quadrupole moment. The bonded
interactions are easily fitted from quantum chemistry calculations, while the non-
bonded interactions between guest molecules are fitted to reproduce specific
properties, such as the vapor-liquid equilibrium curve (VLE), the liquid density, or the
location of the triple point.

32

33
33
3 3. GENERAL CONSIDERATIONS ON CO2
CAPTURE AND SEPARATION

34
3.1. Introduction
The sharply rising level of atmospheric carbon dioxide resulting from
anthropogenic emissions is one of the greatest environmental concerns facing our
civilization today. These emissions, which stem predominantly from the combustion of
coal, oil, and natural gas are projected to continue to increase in the future due to
economic growth and industrial development. Although the transition of the existing
infrastructure from carbon-based sources to cleaner alternatives would be ideal in this
regard, such a change requires considerable modifications to the current energy
framework, and many of the proposed technologies are not yet sufficiently developed
to facilitate large scale industrial implementation.
Thus, CCS technologies that efficiently capture CO2 from existing emission
sources will play a vital role until more significant modifications to the energy
infrastructure can be realized. Nevertheless, these systems must capture CO2 from flue
gas in an efficient, reversible fashion, and as will be discussed, the use of novel
materials exhibiting the right properties for performing CO2 capture is an area
requiring urgent development.
In this regard, the most significant challenge for CO2 capture at present is the
large energy penalty associated with the capture process. With current technologies,
approximately 70% of the cost of CCS is associated with the selective capture of CO2
from the power plant flue gas, being the high cost primarily emerged from the large
energy input required for regeneration of the capture material.
Other scenarios of CO2 capture, such as natural gas processing (CO2/CH4
separation), capture from transportation emissions, or direct air capture, are also
highly important areas of research.
3.1.1. Current uses of CO2
It is well known in the oil industry that carbon dioxide can be applied to reservoir
as a tertiary oil recovery method. However, besides the CCS technologies, whether gas,
liquid or solid (“dry ice”), CO2 has a vast number of applications in very different
industries, such as [Vega, 2010]:
Food and beverage: CO2 is used as a key cryogenic agent in cooling, chilling
and freezing applications —protecting the taste and texture of the food
products by maintaining proper temperature control. CO2 also reduces the need
for preservatives in packaged products, and is an essential ingredient in
carbonated soft drinks and soda water.

Chapter 3. CO2 Capture and Separation
35
Solvent: Liquid CO2 is considered as a good dissolving agent for many organic
compounds. For instance, it can be used to remove caffeine from coffee.
Healthcare: used for insufflations and is often combined with oxygen or air as a
respiratory stimulant to promote deep breathing (in order to stabilize the
O2/CO2 balance in blood).
Pressured Gas: It is used as the cheapest noncombustible pressurized gas.
Compressed CO2 gas is used in paintball markers, air guns, for ballooning
bicycle tires, fire extinguishers, etc.
Fumigation: Used as a fumigant to increase shelf life and remove infestations
Pulp & Paper: used to control pH levels, enhance pulp yield and wash
brownstock and bleached stock.
Water & Wastewater Treatment: A safe alternative to mineral acids, carbon
dioxide replaces chemicals used in pH reduction, lowering costs and improving
plant safety and flexibility.
Welding & Metal Fabrication: Carbon dioxide is most often mixed with argon
as a shielding gas used to prevent atmospheric contamination of molten metal
in electric arc welding processes. It is also used in the manufacture of casting
influences so as to enhance their hardness.
Chemical Industry: It is used as a raw material, especially for the production of
urea and methanol.
3.2. Technologies for CO2 capture
Exploring cost-effective and scalable technologies and methods for CO2 capture
from power generation and industrial operation where CO2 is produced on the
combustion of fossil fuels is regarded as the most effective strategy in controlling
anthropogenic CO2 emission. Depending on the generation of CO2, several capture
options and tendentious technologies have been suggested and implemented.
Generally, based on the fundamental chemical process involved in the combustion of
fossil fuels, three basic CO2 separation and capture options were adopted: (1) post-
combustion capture; (2) pre-combustion capture; and (3) oxy-fuel combustion. In this
context, there are three main scenarios under which new materials could serve to
reduce the energy requirements of capture, as illustrated in Figure 3.1.

36
Figure 3.1. Scheme of three types/options for CO2 capture.
In post-combustion capture, CO2 is removed from the flue gas that results after
combustion of the fuel in air. This is predominantly a CO2/N2 gas separation
owing to the high content of N2 in the air used for combustion and has been the
most explored strategy to date since a post-combustion CO2 capture system
could be readily retrofitted to existing power plants. An additional advantage
of post-combustion capture is that even if when the CO2 capture unit is shut
down for an emergency, one can still generate electricity, which is not possible
with the other more integrated capture methods. A further advantage of
developing CO2 separation techniques is their application in the purification of
natural gas (mainly CH4), which is typically soured with over 40% CO2 and N2
and is only useable at low concentrations of CO2.
Combustion SeparationN2 O2 H2OFuel
Air
Power
CO2
Post-combustion:
(CO2/N2, low pressure)
Fuel
AirSeparation CombustionConversion
N2 O2 H2OH2
Power
AirCO2
Pre-combustion:
(CO2/H2, high pressure)
Separation CombustionH2O
Power
N2Fuel
CO2
Air
Oxy-fuel combustion:
(O2/N2, low pressure)
O2

Chapter 3. CO2 Capture and Separation
37
Alternatively, pre-combustion capture can be performed following gasification
of the coal prior to combustion, producing a high-pressure flue gas (“syngas”)
containing H2 and CO2. This carries the advantage of being an easier separation
than the CO2/N2 separation required for post-combustion CO2 capture, owing
to the greater differences in the polarizability and quadrupole moment of the
molecules. Once the CO2 is removed from the gas mixture, the H2 is then used
for electricity generation, resulting in only H2O as the byproduct. With regard
to industrial applications, pre-combustion CO2 capture systems based upon
CO2-absorbing solvents are the closest to being realized, and a number of
power plants incorporating such systems are being constructed.
Another possible method of reducing CO2 emissions would be to perform oxy-
fuel combustion, in which pure O2 is utilized for the combustion of coal or
natural gas. Oxy-fuel combustion refers to the ignition of pulverized coal or
other carbon-based fuels in a nearly pure O2 environment and represents a
relatively new process for mitigating CO2 emissions compared with pre-
combustion and post-combustion CO2 capture. In this case, an O2/N2
separation from air is performed, and the O2 is diluted with CO2 prior to
combustion, leading to a flue gas that is a mixture of CO2 and H2O, which can
be efficiently separated using existing technologies. The significant advantages
of this process stem from the fact that the flue gas (following removal of
particulates, water, and trace impurity gases) is almost entirely CO2, which
greatly simplifies the capture step, and that most existing power plants could be
readily retrofitted. The main drawback for this option is in the large-scale
generation of pure O2 from air, since the purification is still challenging.
It can be noted that each of the three processes requires a different gas separation,
and there is a need for an entirely different set of materials properties for each
separation due to the different physical properties of the gases. This serves to highlight
the importance of materials optimization, which will be essential in the development of
next-generation separation materials.
Figure 3.2 schematically illustrates the technologies and method usually used in
CO2 separation; in each case, except for cryogenic separation, different materials are
required as the carriers. Absorption (i.e. solvent scrubbing) is a well-established CO2
separation approach used in the chemical and petroleum industries today. Absorption
falls into two categories: (1) physical, which is temperature and pressure dependent
(absorption occurs at high pressures and low temperatures) and (2) chemical, where
absorption of CO2 depends on the acid–base neutralization reaction (in this case caustic
solvents are required). Some of the preferred solvents are amines (such as
monoethanolamine), ammonia solutions and fluorinated solvents. The most recent

38
addition is ionic liquids, which have exhibited great potential in absorption of CO2 and
are also environmentally benign.
Figure 3.2. Different technologies and associated materials for CO2 capture.
Cryogenic distillation uses a principle of separation based on cooling and
condensation, and has been used in liquid separations for a long time. This technique is
theoretically sound for CO2 separation, however, the considerable energy demand
deems it unreasonable for practical application. This method is more effective when
the gas stream contains high CO2 concentration and it can be adopted in oxygen
production for oxyfuel combustion. It is presently the most widely used system for the
large-scale production of O2 from the separation of air.
Excellent separation performance can be achieved using MEA and other amines
but the respective regeneration step is energy intensive. Due to the strong binding of
CO2 to the amines, the amine solutions have to be boiled to remove the CO2 and
regenerate the solvent. At a maximum amine concentration of about 30%, most of the
energy is used to boil the water. In addition, the oxygen in the flue gas causes the
amines to degenerate. At present, however, amine scrubbing is the only technology
that is sufficiently advanced to be applied in CCS. Finding alternative technologies
aimed at mitigating some of the disadvantages of these amine solutions is an active
area of research which focuses on membrane and adsorption technologies.
Gas separation based on adsorption has been well developed, in which the
selection of a fine adsorbent is the key for specific separation. Although materials for
gas adsorptive separation have been established and a diverse range of useful
adsorbents are available for CO2 separation, there is still plenty of room to optimize the
performance of these materials and investigate a wider range of new adsorbents. These
CO2 Separation and Capture
Absorption Cryogenics Membrane Microbial/Algae Adsorption
Physical Chemical
MEA
AmmoniaIonic
Liquids
Fluorinated
Solvents
Gas
Separation
Ceramic
membranes
Gas
Absorption
Zeolite and
MOF
membranes
Polypropylene Alumina
Activated
Carbon
Zeolites
and MOFs
Monolith
(Molecular Sieve)
Carbon Coated
Substrate
Carbon/Carbon
Fibre monolith
Packed
Beds
Polyphenyleneoxide

Chapter 3. CO2 Capture and Separation
39
materials can then be combined with a broad range of process options yielding to the
optimization of the separation performance.
3.2.1. Swing Adsorption Processes
In any CO2 capture process, the adsorbent must be regenerated after each
adsorption cycle. Regeneration of a solid adsorbent is typically accomplished by
Temperature Swing Adsorption (TSA), Pressure Swing Adsorption (PSA), Vacuum
Swing Adsorption (VSA), or some combination of these processes. In all cases, the solid
adsorbent will likely be packed into a large fixed-bed column, and the adsorbate would
be desorbed from the material by increasing the temperature (for TSA) or reducing the
pressure (for PSA and VSA) of the bed.
Figure 3.3 illustrates the basic steps in an adsorption process. The starting point
is a clean, regenerated bed. During the adsorption step flue gas flows through the bed
and the CO2 selectively adsorbs, leaving a N2 rich exhaust stream. Once the bed is
saturated the bed needs to be regenerated. This can be done by applying a vacuum
and/or by increasing the temperature to conditions where the CO2 desorbs resulting in
a CO2 rich stream for subsequent sequestration.
Figure 3.3. Swing Adsorption Cycle scheme.
In PSA, adsorption is typically performed at pressures higher than atmospheric
pressure, while desorption is performed at atmospheric pressure. In VSA, adsorption
operates at atmospheric pressure and near-room temperature and desorption operates
Flue gas
N2
N2
CO2
CO2
Heated/despressurized
Purge
Cool/Pressurized

40
at lower pressures. Both PSA and VSA are performed by altering the pressures.
Generally, the adsorbents with high adsorption capacity and high selectivity toward
CO2 are preferred.
In practice, several columns are operated in a swing-mode to make the process
continuous and additional steps are added to the basic cycle, in order to maximize
productivity and energy saving (as shown in Figure 3.4).
Figure 3.4. The concept of PSA and TSA processes, related to the working capacity.
Due to the possibility of using low-grade heat from the power plant as a source
of energy for regeneration, TSA is particularly promising. Conversely, for pre-
combustion capture, the gas stream is inherently pressurized after the conversion
reactions, and a PSA cycle is expected to be most appropriate.
The CO2 within the flue gas is selectively adsorbed along with other minor
impurities of the mixture, and following a series of concurrent and countercurrent
pressurization and depressurization steps, the adsorbed gases can be removed, and the
capture material can be regenerated for subsequent CO2 capture cycles.
In summary, a few technologies have already reached the deployment stage,
but most require further improvements to the technical capabilities and reduction in
the associated costs. The most mature technology, post-combustion amine absorption,
has been employed in industry for a long time. Simultaneously, a number of materials
are available for different technologies and some new materials are emerging.
However, the commercialization of any one these technologies still faces substantial
challenges not only in the final technological and processes aspects but also in the
capabilities of the capture materials themselves.

Chapter 3. CO2 Capture and Separation
41
3.2.2. Other considerations
Raw materials cost: The low cost of natural materials such as zeolites is often
cited as a major incentive for their use. Although the raw material cost is “low,” the
adsorbent is shipped to a processing site where it must be at least calcined, sized and
packaged prior to use in any gas separation application. The useable adsorbent yield
from the mined material may be only 50–75% due to water evaporation and
over/under-sized waste. Thus, the final cost of these adsorbents will be 60% higher
than 13X and more than 10 times higher than the original raw material cost.
Although each application must be judged on its own merits, this example shows that
the “low” cost of natural zeolites does not necessarily result in a lower adsorbent cost
for a gas separation [Wenning, 1996].
Human risk: Finally, the potential human health risk from the inhalation may
discourage the use of novel adsorbents. That is the case of fibrous erionite and
mordenite [Doskocil and Davis, 1999; Siriwardane et al., 2003], which generally have
greater thermal stability and better resistance to acid environments than many
common commercial synthetic ones [Khelifa et al., 2001; Coughlan and Kilmartin, 1975;
Gallei and Stumpf, 1976].
3.3. Computational Approaches for CO2
Adsorption and Separation
Another important component to this area of research are the computational
simulations, which have been widely used to evaluate CO2 capture and have produced
a vast amount of publications including several reviews [Li et al., 2012; Jiang et al.,
2011; Guillem et al., 2014; Dogru et al., 2011; Han et al., 2008]. Compared with
experiments, molecular simulations are much faster to be used to explore some
materials for their optimized performances, such as in CO2 uptake, selective adsorption
and separation. Computational studies related to the adsorption of CO2 within
adsorbent materials [Moellmer et al., 2010; Cheon et al., 2009; Zelenak et al., 2010; Wu
et al., 2012; Yazaydin et al., 2009; Bae et al. 2009; Dubbeldam et al., 2007] are an
important endeavor in supporting the experimental work performed in the area. In this
regard, GCMC simulations have been especially employed in predicting the single and
mixed-component adsorption isotherms [Torrisi et al., 2010; Babarao et al., 2010; Wu et
al., 2010].
The underlying information required in simulation are molecular interactions,
which determine the reliability and accuracy of the simulation results. Together with a

42
robust code and an appropriate force field for molecular interactions, simulation can be
performed using either the MC or MD method [Liu and Smit, 2010; Valenzano et al.,
2011; Grajciar et al., 2011].
In particular, GCMC has been recognized as one of the most extensively used
techniques to study gas adsorption properties, being well-suited to calculate
thermodynamic properties for adsorption in nanoporous materials [Babarao et al.,
2011; Frost et al., 2006; Han and Goddard, 2008; Deng et al., 2004; Frenkel and Smit,
2002; Ramsahye et al., 2007; Iwai et al., 1997], as well as Henry’s constant, isosteric heat
and binding energies. With a series of simulations at different pressures, the
adsorption isotherms can be obtained by relating the chemical potential and gas phase
pressure through an equation of state (see chapter 5 in this dissertation).
GCMC simulations can be used not only to evaluate the adsorption properties
of simple gas; in the case of gas mixtures, but also to predict the selectivity. Since the
selectivity is not easily accessible from experiments, GCMC simulations show a clear
advantage to predict gas mixture separations.
To date, many GCMC simulations of gas adsorption on adsorbent materials
have employed general-purpose force fields, including the universal force field (UFF)
[Rappé et al., 1992] and DREIDING [Pottoff and Siepmann, 2001], which include the
force field parameters for the atoms in most of the periodic table. Specifically for
zeolites, both Watanabe and Calero’s group have taken the lead on developing force
fields to different structures, different Si/Al ratios and using different cations.
[Watanabe et al., 1995; Garcia-Perez et al., 2008], In addition, because a wide range of
possible inorganic (inorganic-organic) fragments are involved in novel MOFs, the force
field parameters for these new fragments are not available or inaccurate in some cases,
which limits the investigations in the screening and design for specific applications.
For this, first-principle-based force fields are proposed to describe the interactions
between adsorbate and adsorbent [Han and Goddard, 2008; Deng et al., 2004].
Conversely, MD has been employed to investigate the kinetic properties of gas
molecules [Salles et al., 2010; Yang et al., 2008]. The kinetic properties, together with
adsorption equilibrium properties are crucial to evaluate the overall performance of a
material. Following Newton’s second law, MD simulation imitates the natural pathway
of molecular motion to sample successive configurations. The initial velocities of
molecules at a given temperature are assigned by the Maxwell–Boltzmann distribution.
At each time, the forces between molecules are calculated, then the equations of motion
are solved numerically with a time step, and finally the velocities and positions are
updated. In addition to thermodynamic properties that can be simulated, transport
properties such as diffusivity and conductivity can be determined from the trajectory
[Kulkarni et al., 2012; Fisher II et al., 2009]. In characterizing the diffusion of a single
adsorbate, two most common quantities are the self-diffusion coefficient and transport

Chapter 3. CO2 Capture and Separation
43
diffusion coefficient. The self-diffusion coefficient describes the displacement of
individual gas molecules, while the transport diffusion coefficient quantifies the mass
transport induced by a concentration gradient in the adsorbed species [Papadopoulos
et al., 2004; Keskin et al., 2009].
One of the challenges in understanding the diffusion behavior is the little
experimental information available in regard with molecular transport. Moreover,
experimental measurement of mixture diffusion is extremely challenging, so these
simulations can provide some precious information about transport properties of gas
mixtures, which is very helpful in screening and designing materials for CO2/N2
separation [Haldoupis et al., 2010; Rasahye et al., 2008].
Another main molecular simulation techniques used for the investigation of
CO2 adsorption and separation are ab initio and density functional theory (DFT)
calculations. These quantum mechanical modeling methods are normally implemented
when detailed information regarding chemical and physical interactions is required
(for instance, to describe molecular behaviors of atoms and molecules, where electrons
are explicitly represented in the calculation, or to obtain accurate ground-state
properties for real materials such as total energies and energy barriers) them [Ghoniem
et.al., 2003]. During the past years, ab initio and DFT calculations have been employed
extensively to study, for example, specific adsorption sites, interaction mechanisms,
and interaction energies between a material and small molecules [Xu et al., 2010;
Torrisi et al., 2010; Dubbeldam et al., 2007; Huang et al., 2007]. Furthermore, a number
of DFT studies have emerged recently, [Wells and Chaffee, 2011; Walton et al., 2008]
many focused on determining the packing arrangement of CO2 molecules within the
pores, the associated enthalpy of adsorption and the perturbation of these of the
introduction of certain functionalities to the edge of the organic binders [Ghoufi et al.,
2010].

44

45
45
4 4. LITERATURE REVIEW OF RECENT
WORKS ON ADSORBENT MATERIALS FOR
CO2 CAPTURE AND SEPARATION

Chapter 4. Review of prospective materials for CO2 capture
46
4.1. Introduction
Though various CO2 capture technologies including physical and chemical
absorption [Rochelle et al., 2009, Chiesa et al., 1999], adsorption [Chang et al., 2009],
and membrane [Powell et al., 2006] exist, they are not matured technologies yet for
post-combustion power plants. This is because that a huge amount of flue gas is
needed to treat and significant mass transfer limitations exist in the processes. Because
aqueous amine absorption processes exhibit some disadvantages such as low contact
area between gas and liquid, low CO2 loading, and severe absorbent corrosion, solid
adsorption process may be an alternative to achieve the CO2 capture purpose.
Synthetic zeolites have served a prominent role in shaping the development of
adsorptive process technologies for many of the separations and have been studied
broadly from which a significant literature from both properties and applications [Ma
et al., 2009; Bloch et al., 2010]. Though the rate-limiting step for adsorption as the
diffusion of CO2 from flue gas to the inside pore of a mesoporous adsorbent is about 3
orders of magnitude higher than that for aqueous amine absorption as the CO2 mass
transfer across the gas-liquid interface [Khatri et al., 2005], some existing problems
including low CO2 adsorption capacities at low pressures and influenced by water
vapor and gases other than CO2 still hinder the practical application of adsorption to
capture CO2.
The desirable characteristics for an adsorbent to separate CO2 from N2 and
other gases includes (i) a high selectivity and good adsorption capacity for the target
gas component, (ii) fast adsorption and desorption kinetics, (iii) good physical and
chemical stability through the adsorption/desorption cycles, and (iv) be regenerable by
modest pressure or temperatures leads to minimize operational energy costs. The
selected adsorbent must also show robust performance in the presence of moisture and
other contaminants that may be in the gas feed to the adsorption treating unit. The cost
of the adsorbent and the bed packing density (which influences the adsorbent bed size)
are further considerations. In several excellent reviews on CO2 capture by adsorption
[Xu et al., 2014; Sayari et al., 2011; Choi et al., 2009], it can be understood that to
develop an appropriate CO2 capture adsorbent should also satisfy (1) low-cost raw
materials, and (2) low heat capacity.
There is a range of other physical, chemical, chemical engineering and solid
mechanics criteria that must be fulfilled for a successful adsorbent/desorbent:
composition, particle size, pore size and pore connectivity are all essential
characteristics that affect the function of a CO2 sorbent.
A typical combustion generates flue gas with a relatively low CO2 concentration
(15-16%), while the bulk of the effluent is composed of N2 and other minor

Chapter 4. Review of prospective materials for CO2 capture
47
components, such as H2O, O2, CO, NOx, and SOx [Rege et al., 2000]. Measurements at
room (or slightly elevated) temperature and low pressure most resemble practical CO2
capture, because of the low CO2 component in the gas streams that need to be
separated. Furthermore, the adsorption under room temperature and high pressure is
directly related to the evaluation of the total CO2 storage ability of an adsorbent
material.
The preparation of a material that satisfies all of these requirements is currently
a difficult synthetic challenge, although significant progress has been made in recent
years. Quality is important in the manufacture of synthetic materials, and good
product consistency is realistically attainable with modern production technology.
Such reproducibility is important to attaining acceptable and sustainable levels of
performance in gas separations [Plaza et al., 2007a].
Furthermore, the possibility of optimizing the parameters in each of the
regeneration cycles (i.e., desorption temperature and pressure of inlet/outlet gas
stream) and of combining multiple processes presents the option of tailoring the
regeneration process to match the properties of a given adsorbent [Salles et al., 2008;
Lee et al., 2008]. Above all, regeneration strategies must be designed to minimize the
total cost of capturing CO2, and as such, there will be a trade-off between maximizing
the working capacity (the amount of CO2 that can be captured in a given adsorption
cycle) and minimizing the energy required for regeneration [Herm et al., 2011;
Ishibashi et al., 1996; Mulgundmath et al., 2010]. While detailed analysis of the energy
and economic optimization issues in CO2 capture is beyond the scope of this
dissertation, such efforts will be crucial in directing the optimization of real-world CO2
capture processes.
4.2. Solid Porous Adsorbent Materials for CO2
Capture
To achieve efficient adsorption-based CO2 capture, the selection of an
appropriate adsorbent is crucial. Commercial adsorbents being used to remove CO2
from industrial gas streams include zeolites, activated carbons and titanosilicate
molecular sieves. Another porous materials including metal oxides, alumino-
phosphates, activated carbons, carbon nanotubes, silica gel, pillared clays and
polymeric resins, among others, have been explored as adsorbents, and some of them
have been implemented for various separations [Kulprathipanja, 2010; Loureiro and
Kartel, 2006; Xu and Hedin, 2014].
Novel-structured materials developed over the past years that show potential
for higher CO2 capacities include adsorbents based on Metal-Organic Frameworks

Chapter 4. Review of prospective materials for CO2 capture
48
(MOFs), Zeolitic Imidazolate Frameworks (ZIFs) surface functionalized silicas and
porous carbons [Qiu et al., 2014]; Some of these materials are shown in Figure 4.1.
Layered hydroxides and hydrotalcites have been studied extensively as sorbents for
CO2 capture from high temperature flue gases (600–700ºC) [Zhang et al., 2013]. These
high temperature sorbents are not discussed further in this chapter because these
temperatures are beyond the expected range of operating conditions for CO2 removal
units.
Zeolite Activated Carbon
MOFs
Aluminophosphate Silica gel
Figure 4.1. Typical adsorbent materials.
The smaller kinetic diameter of CO2 (3.3 Å) when compared to most other gases
(except small molecules like H2, He, Ne, H2O, and NH3) has established the method of

Chapter 4. Review of prospective materials for CO2 capture
49
controlling the pore size of a material as a highly efficient way of achieving high CO2
selectivity. This kinetic molecular sieving effect has been widely used in gas
separations by using traditional porous materials [Duren et al., 2009]. Alternately, the
advantage of the comparatively much higher quadrupole moment of CO2 as compared
to other gases can be taken to facilitate adsorptive separations, which usually leads to
stronger adsorbate-adsorbent interactions and correspondingly higher uptake and
selective adsorption [Li et al., 2012].
While initial experimental works in this area only tested general equilibrium
adsorption isotherms, the more recent work has shifted its focus closer to practical
application, including ultimate storage capacities, selective adsorption and separation
of gases [Li et al., 2011].
Porous materials:
According to the IUPAC classification, porous materials are divided into three
groups depending on the pore size: Materials with pores larger than 50nm are called
macroporous materials. Mesoporous materials are the second group with pores from 2
to 50nm in diameter and microporous materials possess pores with diameters of less
than 2nm.
Macroporous materials usually do not have a high specific surface area. The
porous structure is rather used as carrier for other porous materials. The large pores
enhance the performance as they allow high gas streams to pass through them with
only minor pressure drops. Mesoporous materials possess high inner surface areas and
are thus suitable for the adsorption of large molecules such as enzymes that cannot fit
into micropores.
Until the late 1990ies, two classes of microporous materials were dominating for
separation and catalysis. Among them, inorganic materials and special microporous
activated carbons. The class of inorganic porous materials can be subdivided into
several groups, the most prominent of them being alumosilicates (zeolites) and
aluminophosphates. Recently, the class of microporous materials was expanded by
metal-organic frameworks (MOFs).
4.2.1. Activated Carbons
Activated carbons had attracted much interest as CO2 adsorbents due to their
wide availability, low cost and high thermal stability. These materials are amorphous
porous forms of carbon that can be prepared by pyrolysis of various carbons
containing resins, fly ash, or biomass [Sumida et al., 2012]. The relatively uniform

Chapter 4. Review of prospective materials for CO2 capture
50
electric potential on the surfaces leads to a lower enthalpy of adsorption for CO2, and
hence lower capacities for CO2 at lower pressures.
However, their significantly higher surface areas allow greater adsorption
capacities at high pressures, which has resulted in activated carbons being considered
for a variety of high pressure gas separation applications [Choi et al, 2009]. In the
context of CO2 capture, the high-pressure flue gas produced in pre-combustion CO2
capture has been a major target application for these materials. Indeed, one study has
shown that the upper limit for the CO2 adsorption capacity within activated carbon
materials is approximately 10-11wt% under post-combustion CO2 capture conditions,
while it reaches 60-70wt% under pre-combustion conditions [Martin et al., 2010]. A
recent study has also demonstrated that careful selection of the material precursors and
the reaction conditions employed can lead to carbon-based adsorbents that have a
volumetric CO2 adsorption capacity that is greater than some of the highest surface
area MOFs at high pressure [Silvestre-Albero et al., 2011].
The weak CO2 adsorption in the range of 50–120°C leads to high sensitivity in
temperature and relatively low selectivity in operation. Moreover, consistent with the
lower heat of adsorption, activated carbons require a lower temperature for
regeneration. A further advantage is that their hydrophobic nature results in a reduced
effect of the presence of water, and they consequently do not suffer from
decomposition or decreased capacities under hydrated conditions [Plaza et al., 2010].
As a consequence, current research focuses on how to improve the CO2
adsorption capacity and selectivity via two ways: (1) to improve surface area and pore
structure of the carbonaceous adsorbents either using different precursors or
fabricating different structures such as ordered mesoporous carbon [Saha et al., 2010],
carbon nanotubes, graphene, etc.; or (2) to increase alkalinity by chemical modification
on surface.
4.2.2. Zeolites
The lower heat capacities of solid porous adsorbents have led to investigation of
new materials for CO2 capture. In particular, as shown in Figure 4.2, zeolites are porous
aluminosilicate materials that possess a high chemical and thermal stability [Cejka et
al., 2010]. Zeolites have been studied especially in the context of upgrading of natural
gas and CO2 capture from post-combustion flue gas [Kusakabe et al., 1997; Cavenati et
al., 2006; Himeno et al. 2007; Ghoufi et al., 2009].
Their packing structures allow the formation of regular cavities joint by the
channels, where the molecules with an appropriate size such as carbon dioxide and the
metallic exchangeable cations (Li+, Na+, K+, Ca2+, Ba2+, Cu2+, Zn2+, Mg2+, etc) can

Chapter 4. Review of prospective materials for CO2 capture
51
penetrate and compensate for the negative charges created by the substitution of AlO4
tetrahedron by SiO4 tetrahedron [Bonenfant et al., 2008; Aguilar-Armenta et al., 2001].
Figure 4.2. Zeolite 13X.
The adsorption efficiencies of zeolites are largely affected by their size, charge
density, and chemical composition of cations in their porous structures [Wang et al.,
2011]. Accordingly, a number of reports focus on zeolites with highly crystalline
structure, high surface area and 3-dimensional pore structures by altering their
composition as Si/Al ratio. Another research field focuses on the exchange with alkali
and alkaline-earth cations in the structure of zeolites to enhance the CO2 adsorption:
highly charged species on the surfaces of porous solids can afford high affinities for
CO2 over other components of flue gas owing to the propensity for CO2 to be polarized
to a higher extent compared with N2 (or other light gases like H2) [Zhang et al., 2008].
Most of the known zeolites have a capacity of CO2 adsorption at high pressures
and low temperatures which varies from 0.15 to 5.5 mmol/g at 273–373K [Lee et al.,
2002; Ko et al., 2003; Dunne et al., 1996; Khelifa et al., 2004; Pakeresht et al., 2002; Xu et
al.; 2002]. For example, zeolite 13X, which has a relatively high surface area (SBET = 726
m2/g) and micropore volume (0.25 cm3/g), has been shown to display promising
capacities for CO2 at room temperature (16.4wt% at 0.8bar and 298 K) [Wang and
LeVan, 2009]. The large variety of structures [O’Keefe et al., 2008; Jiang et al.,2010] that
have been reported to date present an opportunity for the study of the effect of
composition, or certain structural or chemical features, on the adsorption performance.
As mentioned, the adsorption capacity depends on several factors including the
size, polarizing power, distribution and the number of cations in their porous
structure, Si/Al ratio, size, the form of their pores, the polarity and size of adsorbed
molecules, the presence of water and other gas and presence of carbonates at their
surface. Moreover, the distribution of exchangeable cations in the different sites of the
structure causes the heterogeneous character of the CO2 adsorption [Martin et al., 2010;
Martra et al., 2002; Jacobs et al.; 1973].

Chapter 4. Review of prospective materials for CO2 capture
52
It has also been shown that the adsorption capacity and selectivity of zeolites
for the polar molecules increases when the Si/Al ratio decreases [Allan et al., 2010].
This effect is more important when the quadrupole moment of molecules is great. This
phenomenon could be due to an increase of electric field in the zeolites pores induced
by increasing number of charged sites present at the surface of zeolites, as shown in
zeolite LTA, with crucial implications toward the adsorption selectivity and
regeneration costs associated with the capture process [Duren et al., 2009].
In addition, the basicity of zeolites framework enhances with the content of Al3+
ions due to the presence of a greater amount of exchangeable cations [Laspèras et al.,
1996]. Hence, at low pressure, the zeolites that possess the more small Si/Al ratios
should have the best adsorption capacity and selectivity for the polar molecules such
as CO2.
Though CO2 adsorption can be enhanced by these approaches, there exist
several drawbacks: the CO2 adsorption capacity greatly declines in the presence of
moisture in gas because of their highly hydrophilic character, thus a high regeneration
temperature is needed. Besides, since the CO2 can also interact with the pore wall of
zeolites, the CO2 adsorption might be limited by the size of zeolites pores at high
pressures because the CO2–CO2 interactions might prevent the adsorption of new
molecules of CO2 into the pore wall sites that are thus occupied by other molecules of
CO2 [Petit et al., 2012; Li et al., 2011; Karra et al., 2010]. Moreover, although natural
zeolites are abundant and inexpensive, these attributes may not offset the effects of
impurities and inconsistency of properties relative to the more uniform materials [Sand
et al., 1978].
In the case of several cationic zeolites, the chemical adsorption of CO2 is
accompanied by the formation of carbonates at their surface, due to the interaction of
CO2 with the oxygen bridging aluminum and silicon atoms [Park et al., 2012; Wiersum
et al., 2013; McEwen et al., 2013; Yang et al., 2013; Yu et al., 2013; Bastin et al., 2008],
that might decrease the accessibility of carbon dioxide at a great part of the surface of
zeolites and thereby contribute to limit its adsorption.
In comparison with post-combustion CO2 capture, small-scale pilot plants using
zeolites have demonstrated more rapid adsorption of CO2 and lower energy penalty
for the process than other traditional materials [Zhang et al., 2008]. However,
compared to activated carbons, many of the zeolites studied to date become readily
saturated with the water vapor present in the flue gas stream, and the CO2 adsorption
capacity is consequently reduced over time [Li et al., 2009a].
Furthermore, the large enthalpy of adsorption of CO2 leads to relatively high
CO2 desorption temperatures (i.e. 135ºC) [Konduru et al., 2007]. This point highlights
the importance of materials optimization for controlling the affinity of the pore
surfaces, and while improved synthetic procedures that provide a greater degree of

Chapter 4. Review of prospective materials for CO2 capture
53
control over the properties of the resulting zeolite have emerged, it still remains
challenging to precisely tune the materials to the extent possible for MOFs [Li et al.,
2011]. Nevertheless, the robust nature of zeolites coupled with their low cost and well-
developed structural chemistry makes these materials an attractive target for use in
CO2 capture applications.
In addition to zeolites and carbon-based materials, other classes of porous
materials are emerging as potential adsorbents in CO2 capture applications, including
amine-grafted silicas [Hicks et al., 2003; Xu et al., 2003; Jones et al., 2008] and covalent-
organic frameworks (COFs) [El-Kaderi et al., 2007; Han et al., 2008; Glover et al., 2010;
Dogru et al., 2011; Choi et al., 2011].
4.2.3. Amine-Impregnated/Grafted Adsorbents
Combining the high affinity of amines and the advantages of using a porous
solid adsorbent holds tremendous promise for the development of new materials that
exhibit appropriate properties for CO2 capture applications (see Figure 4.3). Ordered
mesoporous silica may be a candidate because of its high surface area, high pore
volume, tunable pore size and good thermal and mechanical stability. So far
mesoporous silicas including the families of M41S, Santa Barbara Amorphous type
material (SBA-n), anionic surfactant-templated mesoporous silica (AMS), etc., have
been reported [Sun et al., 2007].
Figure 4.3. Mesoporous silica impregnated with amines.

Chapter 4. Review of prospective materials for CO2 capture
54
According to the type of the interactions between amines and supports, the
amine-based adsorbents can be categorized as amine-impregnated and amine-grafted
materials via weak interactions and strong covalent bonding, respectively [Sayari et al.,
2011]. Typically, the amine-grafted adsorbents exhibit comparatively higher adsorption
rate and higher stability in cyclic runs than the amine-impregnated ones. However, the
grafted amount of amine depends on surface silanol groups, sometimes leading to a
comparatively lower amine loading as compared with the impregnated amount.
Impregnation or grafting of amines, alkanolamines, or alkylamines have been
proposed to enhance the originally limited adsorption capacity and to promote the
mass transfer rate of CO2 into porous, or mesoporous adsorbents [Xu et al., 2002].
Besides, their use in the interior surfaces of activated carbons and zeolites are currently
being surveyed experimentally [Plaza et al., 2009; Bezerra et al., 2011; Builes et al.,
2012]: recently, activated carbons and zeolite 13X were loaded with MEA and TEA
[Jadhav et al., 2007], founding that both materials exhibited selectivity for CO2 over N2,
although the CO2 capacity was decreased compared with the bare material owing to
the lower surface area accessible to the gas molecules following installation of the
amines.
The functionalization of pore surfaces, despite reducing the CO2 capacity upon
engrafting, shows strong interaction between CO2 and framework with a higher
CO2/N2 selectivity, especially at low pressure. The interaction between the acidic CO2
molecules and modified basic active sites on the surface facilitates CO2 adsorption
through the formation of covalent bonding.
Amine-based adsorbents have widely been studied and exhibited the
advantage as low heat of regeneration over aqueous amines due to the low heat
capacity of solid supports [López-Aranguren et al., 2014]. However, the high cost and
the CO2 adsorption capacities are not high enough, especially at atmospheric pressure,
to allow their practicability.
Leal and coworkers [Leal et al., 1995] firstly published the work on APS grafted
silica gel for CO2 capture. This APS grafted silica gel exhibited a CO2 adsorption
capacity as 0.41 and 0.89 mmol/g under an anhydrous and hydrous flow with pure
CO2 at 27°C, respectively. Huang and coworkers [Huang et al., 2007] studied CO2
capture by the APS-grafted mesoporous silica MCM-48 and silica xerogel, obtained
adsorption capacities at room temperature of 2.05 and 1.14 mmol/g under anhydrous
condition. In a previous work [Leal et al., 1995a], APS, 2N-APS and 3N-APS were
grafted onto MCM-41, SBA-15 and pore expanded-SBA- 15 [Chang et al., 2009],
showing that SBA-15 was the most appropriate support because its pore size could
accommodate more amines and avoid blocking during CO2 adsorption. Besides, its
high pore surface area providing large amount of silanol group was more beneficial for
aminosilane grafting. Among the studied amines, 3N-APS exhibited the highest CO2

Chapter 4. Review of prospective materials for CO2 capture
55
adsorption capacity as 2.74 and 3.06 mmol/g at 40°C under anhydrous and hydrous
(78%RH) flows containing 17%CO2, respectively, followed by 2N-APS and APS.
The supports other than mesoporous materials to impregnate amines have also
been reported in the literature. For instance, Song and coworkers reported the effects of
polyethylenimine (PEI) loading, gas conditions, temperature, moisture and supports
on CO2 adsorption capacity for the PEI-impregnated mesoporous silica and
carbonaceous materials [Wang et al., 2011; Jiang et al., 2011; Wang et al., 2009; Ma et al.,
2009]. A higher PEI loading significantly enhanced CO2 adsorption capacity together
with the decreases of surface area, pore size and pore volume of the PEI impregnated
supports. The highest CO2 adsorption capacity of 3.02 mmol/g for the PEI-
impregnated MCM-41 (PEI/MCM-41) with 75 wt% of PEI loading was observed under
pure CO2 at 75°C, while the highest amine efficiency (CO2/N2 molar ratio) occurred at
50 wt% PEI loading and was reduced with an increase of PEI loading. Thus, how to
promote the performance of amine-impregnated adsorbent needs further studies.
4.2.4. Metal-Organic Frameworks (MOFs)
Metal-Organic Frameworks emerged approximately two decades ago and since
then have allow a quickly development into a fruitful research field. MOFs are
crystalline compounds consisting of metal ions or clusters (linker) coordinated to often
rigid organic molecules to form one, two, or three-dimensional structures that can be
porous. Figure 4.4 presents an schematic construction of these materials. In some cases,
the pores are stable during elimination of the guest molecules (often solvents) and can
be used for the storage of gases such as carbon dioxide.
Figure 4.4. Schematic construction of MOFs.
The choice of metal and linker has significant effects on the structure and
properties of the MOF. For example, the metal’s coordination preference influences the
size and shape of pores by dictating how many ligands can bind to the metal and in
which orientation. The material selection has become a significant challenge because of

Chapter 4. Review of prospective materials for CO2 capture
56
the large number of compounds reported each year. Some of the most typical
structures are shown in Figure 4.5.
The high internal surface areas of MOFs provide an opportunity for large CO2
adsorption capacities to be achieved, owes to the efficient packing and close approach
of the guest molecules on the pore surface. Indeed, selected MOFs have recently been
evaluated in detail for use in post-combustion CO2 capture via TSA and a pre-
combustion CO2 capture via PSA [Plaza et al., 2009; Jadhav et al., 2007; Sayari et al.,
2011]. For instance, at 35bar and 298K, the volumetric CO2 adsorption capacity for
MOF-177 reaches a storage density of 320 cm3(STP)/cm3 (e.g. 33.5 mol/L), which is
approximately 9 times higher than the quantity stored at this pressure in a container
without the MOF and is higher than conventional materials used for such an
application, namely, zeolite 13X and MAXSORB [Jiang et al., 2007]. The authors
ascribed this large CO2 capacity to the large pore space enclosed in MOF-177.
Figure 4.5. Several MOFs structures.
Millward and Yaghi [Millward and Yaghi, 2005] published a pioneering work
in which CO2 isotherms up to 42bar were reported for nine MOF materials, in order to
examine a range of structural and pore attributes. Since then, several MOFs with high
porosity and surface area have been examined for CO2 storage, with the initial record
capacity changing from MOF-177 to MIL-101 [Cooper et al., 2009]. MOF-210,
synthesized again by Yaghi’s group currently holds the CO2 storage record with the
saturated CO2 uptake of 2400 mg/g at room temperature and up to 50bar
[D’Alessandro et al., 2010]. This MOF has an estimated pore volume of 3.60 cm3/g and
a BET surface area of 6240 m2/g, the highest reported for any crystalline material. It
can be note that, as mentioned earlier, the volumetric adsorption capacity of activated
carbon materials at high pressures has been demonstrated to be competitive with
MOFs [Choi et al., 2009].
Usually, the CO2 adsorption isotherms in rigid porous materials such as
traditional zeolites and the majority of rigid MOFs present a normal type-I shape, but

Chapter 4. Review of prospective materials for CO2 capture
57
in a few rigid MOFs stepwise isotherms have been observed. This can be related to the
structural features of these MOFs, as for example, Zhang and coworkers reported a
two-step CO2 adsorption at low temperature in a highly connected MOF which has a
biporous structure with cages and channels that co-exist [Llewellyn et al., 2008].
Conversely, several similar stepwise CO2 adsorption behaviors, giving sigmoidal
isotherms, have been observed in some ultrahigh pore MOFs, such as IRMOF-1 (MOF-
5), MOF-177 and MOF-210 at near room temperature and high pressures [Jiang et al.,
2007; D’Alessandro et al., 2010].
Several MOFs have been experimentally examined for single-component CO2
adsorption and related gas separation. Zhou’s group [Li et al., 2009; Zhou et al., 2011]
reviewed the progress of MOFs for CO2 capture from experimental to molecular
simulation. In their review, MOFs exhibit exceptional CO2 adsorption capacity to deal
with pure CO2 at high pressures. Their adsorption capacities are dramatically reduced
when they are exposed to a gas mixture. Though MOFs have been shown to be the
promising adsorbents for CO2 capture in laboratory, more studies are required to
verify their practical applications.
The concept of designing a MOF with a pore size between the kinetic diameters
of CO2 and other gases, thus allowing only CO2 to pass, is easily understood, but
designing and synthesizing such a pore in practice is tremendously challenging. In
some cases, the actual pore size is larger than the sizes of all tested gases; however,
only CO2 adsorption is observed, which is usually attributed to a kinetic sieving effect.
For example, Mn-(HCO2)2 has a porous framework structure containing cages with a
diameter of about 5.5 Å connected to each other via small windows of about 4.5 Å
[Banerjee et al., 2009]. This MOF showed almost no N2 sorption at 78K but significant
CO2 uptake at 195K. This size-dependent and diffusion-controlled gas selective
adsorption has been also systematically investigated in a series of ZIFs with
incrementally tuned pore sizes [Mason et al., 2011].
Flexible MOFs have a different story in the selective adsorption of CO2 over N2.
A “gate” phenomenon (see Figure 4.6) has been observed [Llewellyn et al., 2008;
Furukawa et al., 2010; Banerjee et al., 2009; Zhang et al., 2009; Coudert et al., 2009; Kim
et al., 2008]. An early example that clearly illustrates this “gate” effect is
Cu(pyrdc)(bpp) reported by Kitagawa’s group [Tanaka et al., 2008]. The CO2
adsorption isotherm of this MOF shows a sudden increase at a relatively low pressure,
referred to as the gate-opening pressure, and saturation at another pressure.
Conversely, the desorption isotherm, does not retrace the adsorption isotherm and
shows a hysteresis behavior.

Chapter 4. Review of prospective materials for CO2 capture
58
Figure 4.6. Example of gate opening in MOFs.
The impact on CO2 adsorption in MOFs by various other factors has also been
explored. Through the insertion of metal ions into a stable MOF, it was also observed
the enhanced adsorption selectivity of CO2 over N2 in (MOF-253)3.0.97Cu(BF4)2 as
compared to MOF-253 [Ma et al., 2009]. Kajiro and coworkers [Maji et al., 2005]
examined the effect of metal ions on the CO2 adsorption in two isostructural structures,
M(4,4-bipy)2(OTf)2 (M= Cu and Co). Although the difference in metal ions in these
MOFs results in only slightly different structures, the gas adsorption properties, based
on the expansion/shrinkage of these MOF structures, are largely dependent on the
metal ions. As an alternative strategy, partial doping of MOF-5 with Co(II) by
isomorphic substitution during synthesis has been investigated to explore the effect on
CO2 adsorption [Chun et al., 2009]. The adsorption result showed that the CO2 uptake
of these MOF-5-based materials systematically increases with the increase of Co(II)
content at high pressure. Rosi and coworkers [An et al., 2010] recently demonstrated
that post-synthetic exchange of extra-framework cations within an anionic MOF (bio-
MOF-1) can be used as a means to systematically modify its pore dimensions, thereby,
tuning the CO2 adsorption capacity. In addition, Cao and coworkers [Xiang et al., 2011]
recently showed that the incorporation of CNTs into MOFs can enhance the uptake of
CO2, which can be further improved by doping the CNT-modified MOFs with lithium.
4.2.5. Zeolitic Imidazolate Frameworks
Zeolitic Imidazolate Frameworks (ZIFs) are a class of Metal-Organic
Frameworks that are topologically isomorphic with zeolites. ZIFs are composed of
tetrahedrally-coordinated transition metal ions (e.g. Fe, Co, Cu, Zn) connected by
organic imidazole linkers. Since the metal-imidazole-metal angle is similar to the 145°
Si-O-Si angle in zeolites, ZIFs take on zeolite-like topologies, as shown in Figure 4.7.
ZIFs generally have high thermal and moister stability compared to other types
of MOFs. Like zeolites and other porous materials, Zeolitic Imidazolate Framework
membranes can be used for the separation of gases because of their highly porous
structure, large accessible pore volume with fully exposed edges and faces of the
organic links, pore apertures in the range of the kinetic diameter of several gas
molecules and high CO2 adsorption capacity. For instance, ZIF-8 crystals are non-toxic

Chapter 4. Review of prospective materials for CO2 capture
59
and require little energy to be created, making them an attractive possibility for carbon
capture and storage. The porous structures can be heated to high temperatures without
decomposing and can be boiled in water or solvents for a week and remain stable,
making them suitable for use in hot, energy-producing environments like power plants
[An et al., 2010a].
Figure 4.7. Several ZIF topologies.
Functionalized materials
MOFs functionalized with basic nitrogen-containing organic groups have been
intensively studied for their CO2 adsorption properties. The dispersion and
electrostatic forces resulting from the interaction of the quadrupole moment of CO2
with localized dipoles generated by heteroatom incorporation are typically responsible
for the enhanced CO2 adsorption. In some cases, acid-base type interactions between
the lone-pair of nitrogen and CO2 have been observed. For example, bio- MOF-11 was
synthesized from adeninate and acetate linkers [Kondo et al., 2009]. Its CO2 adsorption
capacity is 5.8wt% at 298K and 0.15bar, with a corresponding isosteric heat of
adsorption of 45 kJ/mol at zero-coverage. The large initial isosteric heat is likely
partially attributable to the presence of an aromatic amine that also decorates the pore
surface, however, the effects of the nitrogen heterocycle are considerable because the
CO2 capacity exceeds that of any other aromatic amine functionalized framework
reported to date at 1bar, despite a surface area of only 1040 m2/g. As for zeolites and
amorphous silicas, the commercial availability of aromatic amine containing linkers,
especially 2-aminoterephthalic acid (NH2-BDC), and the expected affinity of amino
groups toward CO2 has generated significant interest in aromatic amine functionalized
frameworks [Botas et al., 2010; Arstad et al., 2008; Vaidhyanathan et al., 2009], in
particular, the IRMOF series. At 298K and 1.1bar, IRMOF-1 (or MOF-5) adsorbs
approximately 4.6wt% CO2, while the amine-functionalized variant, IRMOF-3, adsorbs
5.0wt% CO2, despite a decrease in the BET surface area from 2833 to 2160m2/g [Jiang et

Chapter 4. Review of prospective materials for CO2 capture
60
al., 2007]. The reduced surface area of IRMOF-3 decreases the high-pressure CO2
adsorption capacity, but the higher uptake observed within the material at lower
pressures leads to it being a higher performance material compared with IRMOF-1 in
the context of post-combustion CO2 capture.
Amine functionalization has been shown to enhance CO2 capacity in a number
of other MOFs, including Ni2(NH2-BDC)2(DABCO), NH2-MIL-53(Al) and In(OH)(NH2-
BDC), when their low-pressure capacities are compared with that of the parent
material [Lee et al., 2008]. However, the amine may not always be directly responsible
for the enhanced adsorption. It was recently shown for the well studied compound
NH2-MIL-53(Al) that the aromatic amine has little direct interaction with adsorbed CO2
at low pressures.
Nevertheless, significant work still needs to be performed to identify the most
promising class of materials for CO2 capture, although the rich and highly diverse
nature of the materials discovered recently holds tremendous promise for the
discovery of next-generation structures that are optimized for this application.
4.3. Simulation in selected systems for CO2
adsorption and separation
Despite hundreds of activated carbons, zeolites, amine-silicas and MOFs have
been explored experimentally to date in CO2 adsorption and separation, far fewer
structures regarding typical (or representative) structures has been studied by
theoretical calculations based on molecular simulations. Computational modeling has
been mainly used in the virtual screening for zeolites and Metal-Organic Frameworks,
[Wilmer and Snurr, 2011] new hypothetical structures with high performance
parameters, [Low et al., 2009] and predicting the stability of existing materials toward
contaminants, such as H2O [Yang et al., 2008]. While we do not provide a thorough
coverage of the theoretical studies pertaining to CO2 adsorption here, we introduce
certain computational results as appropriate in the forthcoming sections. Zhong and
coworkers systematically investigated nine typical MOFs with various pore sizes,
topologies, organic linkers and electrostatic properties using molecular simulations
[Zheng et al., 2009]. The results indicated that a suitable pore size for CO2 storage is
around 10-20Å. CO2 uptake is governed by the strength of the CO2–MOF interactions
at low pressures. Other factors, such as accessible surface area and free volume, are
also crucial to CO2 adsorption capacity at high pressures. The electrostatic interactions
between CO2 and MOFs contribute up to 30% of the total adsorption capacity at low
pressures, however, the contribution decreases rapidly with the increase of pressure
and the percentage drops at high pressures. In general, MOFs have higher capacities

Chapter 4. Review of prospective materials for CO2 capture
61
for CO2 storage and comparable self-diffusivity in comparison to most zeolites and
carbon materials.
In a further study, Zhong and coworkers [Zheng et al., 2009] examined 20
different MOFs. The results show that at low pressures CO2 molecules preferentially
adsorb around the polar centers in the framework and the electrostatic contribution is
therefore large. The adsorption sites are saturated at high pressures and most CO2
molecules are located far from the charge centers. The effect is more pronounced in
large pores. Consequently, the electrostatic interaction decreases and can be neglected
in many cases.
Babarao and Jiang [Babarao and Jiang, 2008] systematically evaluated the
performance of various MOFs using Gibbs ensemble Monte Carlo (GEMC)
simulations. Their work revealed that MOFs exhibit remarkably higher adsorption
capacity than zeolites and single-wall nanotubes. The capacity is primarily determined
by the strength of CO2 adsorption at low pressures, while it is mainly dependent on the
free volume and accessible surface area at high pressures. In 2007, Snurr and
coworkers studied the adsorption sites of light gases in MOF-5 by using Monte Carlo
(MC) simulations [Dubbeldam et al., 2007]. They reported that the positions and
occupations of the binding sites can be correctly predicted when an appropriate force
field was applied. Snurr and coworkers also compared the performance of 14 MOFs for
CO2 capture at low pressures using a combined experimental and computational
approach. Their study aimed to develop a model for fast screening of MOFs for gas
capture, leading to substantial savings in the experimental time and cost. CO2 uptake
correlates with the heat of adsorption at low pressures. The proposed model gave some
successful predictions. For instance, MOFs with a high density of open metal sites has
the highest efficiency for CO2 uptake.
Recently, Sholl and coworkers [Keskin et al., 2009] proposed an efficient
method to characterize the features which control gas diffusion in the MOFs. The
method is based on the information from X-ray crystal structures and able to rapidly
predict the Henry’s constant for adsorption and diffusion activation energy for simple
gases. The approach was used to screen more than 500 structures and has
demonstrated to be effective in identifying suitable materials for kinetic separation of
adsorbates. However, there are some limits which need to be overcome in the method:
(1) the method is unable to examine non-spherical molecules; (2) the calculated Henry’s
constant for adsorption and diffusion activation energy are only applicable for non-
polar adsorbates; and (3) the method may lead to large deviations at high pressures.
On the performance of zeolites and MOFs [Liu and Smit, 2009], a comparative
study was carried out by Liu and Smit. They selected MFI-type for its arrangement
with intersecting channels, DDR and LTA for their structures with open cages, and
seven MOFs (CuBTC, MIL-47, IRMOF-1, -11, -12, -13 and -14) with a wide range of

Chapter 4. Review of prospective materials for CO2 capture
62
chemical compositions, pore sizes and topologies. The simulation results show that
although MOFs outperform over zeolites for gas storage, their separation performance
is comparable to zeolites. The catenated IRMOFs exhibit a slightly higher selectivity
than non-catenated counterparts. Also, they suggested that the difference in the
quadrupole moments of sorbates should be considered in selecting a suitable material
for separation. This indicates the important role of electrostatic interactions in the
observed high selectivity in ionic MOFs. Together with early discussion, ionic MOFs
with open metal sites show considerably larger selectivity and adsorption capacities,
and have demonstrated to be good candidates for gas storage and CO2 capture.
However, experimental confirmation is required to further ascertain their performance.
Recently, a combined experimental and computational study on the adsorption
of CO, N2 and CO2 on Mg-MOF-74, was conducted by Palomino and coworkers
[Palomino et al., 2012]. The results showed that CO and N2 form roughly linear 1:1
complexes with Mg2+ while CO2 forms an angular complex. Remarkably, dispersion
interactions contribute 1/2 gas-framework interaction energies in all the adsorption
complexes and should be included in the calculations. The calculated adsorption
enthalpy indicated that CO2 has the strongest adsorption on Mg-MOF-74 among the 3
gases, in good agreement with the experimental values.
For ZIFs, Zhong and coworkers [Liu et al., 2009] studied the adsorption and
diffusion behaviors of CO2 in two typical structures, ZIF-68 and ZIF-69 using combined
GCMC and MD techniques. They found that CO2 molecules preferentially adsorb in
the small pores encompassed by the nIM (nitroimidazole) linkers. With the increasing
pressure, the molecules can also be adsorbed in the corners formed by the phenyl ring
in the large pores and further occupy the pores. Similar to many other MOF systems,
the contribution of framework charges cannot be ignored at low pressures. Their MD
calculations indicated that the diffusion of CO2 in ZIF-69 is slower than ZIF-68 due to
the pore size and steric hindrance. Recently, Nieto-Draghi and coworkers [Perez-
Pellitero et al., 2010] investigated the adsorption of CH4, N2, and CO2 on ZIF-8 and ZIF-
76 and ZIF-69. Their GCMC simulations showed that standard force fields were not
reliable and failed to reproduce experimental data. A modified force field optimized by
experimental data was adopted to examine the adsorption behavior. The simulated
adsorption isotherms predicted the CO2 uptake order (ZIF-69 < ZIF-8 < ZIF-76) at high
pressures, which is partially verified by experiments. The simulations also indicated
preferential adsorption sites of ZIF-8, located at the organic linkers. Furthermore, the
charge–quadrupole contribution prevails in the interactions between the metal atoms
and CO2; whereas the vdW contribution is only <10% in the overall binding energy.
According to the calculated Henry’s constant and isosteric heats of adsorption, vdW
interactions dominate the adsorption of N2, while vdW and electrostatic interactions
co-govern the adsorption of CO2 in the ZIFs. Remarkably, the study indicated ZIFs
possess some properties similar to zeolites.

Chapter 4. Review of prospective materials for CO2 capture
63
MIL-53 has already triggered great interest due to its unusual microscopic
adsorption behavior. Two interchanging configurations named the large pore (MIL-
53lp(Al)) and narrow pore (MIL-53np(Al)) forms, were identified [Babarao and Jiang,
2010]. The two forms share the same chemical composition but differ in the pore width.
Maurin and coworkers suggested that a structural transition occurs during the CO2
adsorption process. Their GCMC simulation further provided evidence for the
breathing effect (structural transition upon CO2 adsorption) [Bourrelly et al., 2005]: the
simulated isotherms for each MIL-53(Al) form are in good agreement with the
corresponding region of the experimental isotherm. Furthermore, the calculated
enthalpies of adsorption correspond to the experimental data at low pressures (<6bar)
and at high pressures, respectively. The structural analysis showed that the breathing
mechanism can only be induced by molecules with large dipole or quadrupole
moments such as CO2 and H2O [Babarao and Jiang, 2010]. To further understand this
breathing effect in MIL-53, Maurin and coworkers [Ramsahye et al., 2007b] compared
adsorption of CO2 in MIL-53(Al) and MIL-47(V). The breathing was found in MIL-
53(Al) but not in MIL-47(V). They also successfully reproduced the breathing in the
process of CO2 adsorption for MIL-53(Cr) using a bonded force field [Ramsahye et al.,
2007c].
To study the effect of small pockets on gas separation, Zhong and coworkers
[Xue et al., 2009] perform simulations in IRMOFs and CuBTC (HKUST-1). Their
simulation showed that gas separation was influenced by the geometry and pore size.
MOF-5 possesses a simple channel structure and consequently exhibits simple
selectivity properties; whereas CuBTC has a more complicated channel/pocket
structure, leading to complex selectivity. More importantly, the strength of electrostatic
interactions can tremendously alter the gas separation performance, particularly for the
components with different dipoles/quadrupoles. Moreover, blocking of the side
pockets results in large differences in their simulated selectivity curves at low-pressure
range. The phenomenon was also noticed by Krishna and van Baten [Krishna and van
Baten, 2010]. They pointed out that the experimentally inaccessible pockets of MOFs
should be blocked appropriately in GCMC simulations or otherwise inaccurate and
unrealistic results will be obtained.
Moreover, as well as in zeolites, introducing ions into MOF systems generally
leads to enhanced adsorption and selectivity for CO2. For example, the structure and
separation properties of Li+ exchanged MOFs (Li+-MOFs) were examined by Babarao
and Jiang [Babarao and Jiang, 2010]. Li+-MOFs possess higher selectivity than non-ionic
MOFs and most other porous materials. According to GCMC simulations, the high
selectivity is originated from the charges of cations and frameworks.
Generally, in the simulation studies of nanoporous crystalline materials, the
coordinates of framework atoms are usually adopted from experimental
crystallographic data. Most studies use rigid frameworks with atomic positions fixed.
Chapter 4. Review of prospective materials for CO2 capture
64
To date, only few simulation studies have been performed in the adsorption of flexible
materials, in this case, MOFs [Lee and Sircar, 2008; Salles et al., 2008]. This has two
advantages: first, there is no need to evaluate intra-framework interactions second, the
interactions between framework and guest can be pre-tabulated and simulation can be
accelerated. Such a simplified treatment is acceptable, particularly for small guest
molecules like CO2 and N2. However, due to the large amount of time required it is not
practical yet to perform this kind of simulations.
4.4. Literature review on materials for CO2
capture
We present here a detailed comparison of CO2 capacity of different materials,
separated in high and low pressures. The review focused on publications in the last ten
years.
It should be noted that different literature sources present their results in
different units (as mmol/g, mol/mol, wt, kmol/m3, cm3/g, etc.). In order to make a
more appropriate comparison between different materials and conditions employed,
we made an effort and took all the values to the same unit of measurement focus our
attention in volumetric capacity (in this case, kmol/m3); calculated data are
distinguished by the asterisk on the value. Some materials are presented with their
short or most common name, for aesthetic of the tables.
The gravimetric CO2 uptake, which refers to the quantity of CO2 adsorbed
within a unit mass of the material, dictates the mass of the adsorbent material required
to form the adsorbent bed. Meanwhile, the volumetric capacity refers to how densely
the CO2 can be stored within the material and is an equally crucial parameter, since it
has a significant influence on the volume of the adsorbent bed (from an engineering
point of view, the exchange between materials should not affect the dimensions of the
adsorption unit). Both parameters also have an important role in determining the
heating efficiency of the material, which directly impacts the energy penalty required
for material regeneration and desorption.
4.4.1. CO2 adsorption at high pressures
The high-pressure adsorption capacities for selected frameworks are tabulated
in Table 4.1. Indeed, the greatest capacities at high pressures are observed for materials
exhibiting large surface areas, although excellent adsorption properties have also been

Chapter 4. Review of prospective materials for CO2 capture
65
demonstrated in a number of materials with modest surface areas that have a
significant density of high-affinity adsorption sites, such as exposed metal cations.
Table 4.1. List of materials for CO2-capture at high pressures.
MATERIAL TEMP (K) P (bar) kmol/m3 %wt EXP (E)/ SIM (S)
REFERENCE
MIL-101(Cr) 283 5.3 2.6 26 E+S Chowdhuri et al (2009)
IRMOF-1 (MOF-5) 273 10 8.2* 58 E+S Botas et al (2010)
DUT-4 303 10 4.6 26.4 E+S Senkovska et al (2009)
SNU-M10 298 10 3.5* 15.2 E+S Choi et al (2008)
IRMOF-1 (MOF-5) 298 14 6.8 11.0 E+S Saha et al (2010)
MOF-177 298 14 3.8* 12 E+S Saha et al (2010)
Zn2(BDC)2(DABCO) 298 15 7.4* 37.6 E+S Liang et al (2009b)
CuBTC (HKUST-1) 298 15 7.2* 35.9 E+S Liang et al (2009a)
MIL-53(Cr) 304 18 8.0 55 E Llewellyn et al (2006)
UiO-66 303 18 7.3 24.3 E+S Weirsum et al (2011)
MIL-47 298 20 10.8* 36 E Bourrelly et al (2005)
NOTT-140 293 20 7.1* 46.2 E+S Tan et al (2011)
MIL-96(Al) 303 20 5.2* 18.6 E+S Surblé et al (2006b)
MIL-47(V) 304 20 0.0 55 E+S Bourrelly et al (2005)
Ni-MOF-74 278 22 14.9* 54.2 E Dietzel et al (2008)
MIL-53(Cr) 304 25 10.5* 44 E Bourrelly et al (2005)
MIL-53(Al) 298 25 9.8* 45 E Bourrelly et al (2005)
MIL-53(Al) 304 25 6.8 30.6 E Bourrelly et al (2005)
USO-2-Ni 298 25 0.0 41 E+S Arstad et al (2008)
Zn4O(FMA)3 300 28 12.7* 69 S Xue et al (2009)
CuBTC (HKUST-1) 313 30 8.6* 42.8 E Moellmer et al (2011)
MIL-101(Cr) 298 30 5.0* 50.2 S Zhang et al (2011)
IRMOF-11 298 35 8.9 39.3 E Millward and Yaghi (2005)
IRMOF-6 298 35 6.8* 46.2 E+S Millward and Yaghi (2005)
MOF-505 298 35 6.5 31 S Millward and Yaghi (2005)
PCN-61 298 35 6.5* 50.8 E Yuan et al (2010)
IRMOF-3 298 35 6.5* 45.1 E Millward and Yaghi (2005)
IRMOF-1 (MOF-5) 298 35 5.8 40.8 S Millward and Yaghi (2005)
PCN-66 298 35 5.5 53.6 E+S Yuan et al (2010)
PCN-68 298 35 4.9 57.2 E+S Yuan et al (2010)
MOF-2 298 35 0.0 10.0 S Millward and Yaghi (2005)
Mg-MOF-74 278 36 14.2 68.9 E Dietzel et al (2008)
Co-BDP 313 40 9.4* 41.3 E Helm et al (2011)

Chapter 4. Review of prospective materials for CO2 capture
66
MATERIAL TEMP (K) P (bar) kmol/m3 %wt EXP (E)/ SIM (S)
REFERENCE
CuBTC (HKUST-1) 303 40 8.0* 40.1 S Hamon et al (2010)
Cu-BTTri 313 40 7.3* 42.8 E Helm et al (2011)
DUT-9 298 47 5.1* 62.1 S Gedrich et al (2010)
MIL-100(Cr) 304 50 7.0* 44.2 E Féreand et al (2004)
MOF-177 298 50 5.9* 60.8 E+S Furukawa et al (2010)
MIL-101(Cr) 304 50 5.7 56.9 E Llewellyn et al (2006)
MOF-205 298 50 5.4* 62.6 E Furukawa et al (2010)
MOF-210 298 50 4.2* 74.2 E Furukawa et al (2010)
MOF-200 298 50 3.7* 73.9 E Furukawa et al (2010)
As inferred from the table, several MOFs have higher saturated CO2 capacities
than benchmark adsorbents such as zeolites NaX (or 13X) and activated carbon
MAXSORB. Their results also showed that the saturated CO2 capacities of the MOFs
are qualitatively correlated with their surface areas.
4.4.2. CO2 adsorption at sub-atmospheric pressures
The lower-pressure (<1.2bar) CO2 uptake capacities for all materials collected at
ambient temperatures (293-313 K) are listed in Table 4.2. At these conditions, the
adsorptive properties are predominantly dictated by the chemical features of the pore
surface, and most of the high-capacity materials are those bearing highly
functionalized surfaces, or by electrostatic interactions. Many of them exhibit large CO2
adsorption capacities at pressures at and above 1bar, owing to their high surface areas.
However, these compounds are generally not well suited for post-combustion capture,
since the adsorption capacity at lower pressures is a more relevant consideration due to
the low partial pressure of CO2 [Sayari et al., 2011]. However, the Mg-MOF-74 requires
further investigation, given its high capacity at low pressure
Table 4.2. List of materials for CO2-capture at low pressures
MATERIAL TEMP
(K) P (bar) kmol/m3 %wt
EXP (E)/
SIM (S) REFERENCE
CuBTC (HKUST-1) 298 0.8 2.1* 10.6 E+S Liu et al (2010)
Co-MOF-74 296 1 6.2* 23.4 S Caskey et al (2008)
Mg-MOF-74 298 1 5.7* 27.5 E Bao et al (2011)
Ni-MOF-74 296 1 5.6* 20.4 S Caskey et al (2008)
Zn-MOF-74 298 1 5.5* 19.8 S Millward and Yaghi

Chapter 4. Review of prospective materials for CO2 capture
67
MATERIAL TEMP
(K) P (bar) kmol/m3 %wt
EXP (E)/
SIM (S) REFERENCE
(2005)
Cu-tdpat 298 1 4.6* 25.8 S Li et al (2012)
Cu(bpy-1)2(SiF6) 298 1 4.5 23.1 E Nugent et al (2013)
UTSA-16 298 1 4.3 19 E Xiang et al (2011)
CuBTC (HKUST-1) 295 1 3.7 18.3 S Yazaydin et al (2009)
USO-2-Ni-A 298 1 3.2* 14 E Surblé et al (2006b)
PCN-6 298 1 3.1* 15.9 E Kim et al (2011)
bio-MOF-11 298 1 2.8* 15.2 E An et al (2010)
NH2-MIL-53(Al) 298 1 2.7* 12 S Arstad et al (2008)
UMCM-150(N2) 298 1 2.5 10.8 S Yazaydin et al (2009)
Cu-BTTri 298 1 2.4 14.3 E Demesence et al (2009)
MIL-53(Al) 298 1 2.4* 10.6 E Arstad et al (2008)
UMCM-150 298 1 2.3* 10.2 E Yazaydin et al (2009)
USO-2-Ni 298 1 2.3* 10 E+S Arstad et al (2008)
Cu-TATB-30 298 1 2.2* 13.4 E Kim et al (2011)
ZIF-82 298 1 2.1* 9.1 E+S Banerjee et al (2009)
ZIF-78 298 1 2.0 9.1 E+S Banerjee et al (2009)
MIL-53(Al) 303 1 2.0 9.2 E Rallapalli et al (2011)
SNU-50 298 1 2.0 13.7 E Prasad et al (2010)
MIL-53(Cr) 304 1 2.0* 8.5 E Llewellyn et al (2006)
ZIF-69 298 1 2.0* 8.6 E+S Banerjee et al (2009)
USO-3-In-A 298 1 1.8 8 E Arstad et al (2008)
MIL-47 298 1 1.8* 8.1 S Yazaydin et al (2009b)
NOTT-140 298 1 1.8 11.7 E+S Chen et al (2011b)
ZIF-81 298 1 1.6* 7.2 E+S Banerjee et al (2009)
Zn-MOF-74 296 1 1.6 5.8 E Caskey et al (2008)
Zn2(BDC)2(DABCO) 296 1 1.6* 8.1 E Chen et al (2011b)
ZIF-68 298 1 1.5 6.7 E Banerjee et al (2009)
ZIF-70 298 1 1.3* 5.7 E Banerjee et al (2009)
en-CuBTTri 298 1 1.3* 5.5 E Demesence et al (2009)
USO-3-In 298 1 1.3 5.5 E Arstad et al (2008)
IRMOF-1 (MOF-5) 296 1 1.2* 8.5 E+S Zhao et al (2009)
ZIF-8 298 1 1.1* 4.3 E+S Yazaydin et al (2009)
bio-MOF-1 313 1 0.9* 5.2 S An et al (2010)
UMCM-1 298 1 0.9 3.8 E Yazaydin et al (2009)
UMCM-50 298 1 0.8 10.2 E Yazaydin et al (2009b)
IRMOF-3 298 1 0.7* 4.7 S Yazaydin et al (2009)

Chapter 4. Review of prospective materials for CO2 capture
68
MATERIAL TEMP
(K) P (bar) kmol/m3 %wt
EXP (E)/
SIM (S) REFERENCE
MOF-177 298 1 0.6* 6.5 E+S Saha et al (2010)
Mg-MOF-1 298 1 0.6* 2.7 S Mallick et al (2010)
MOF-2 298 1 0.5 2.4 S Millward and Yaghi (2005)
SNU-30 298 1 0.4 4.9 S Park et al (2010)
MIL-101(Cr) 319 1 0.4* 4.2 S Chowdhuri et al (2009)
MOF-177 298 1 0.3* 3.6 E Mason et al (2011), Yazaydin et al (2009)
SNU-31 298 1 0.3 2.6 E+S Park et al (2010)
MOF-505 298 1.1 2.7* 12.6 E Millward and Yaghi (2005)
IRMOF-11 298 1.1 1.7 7.3 E Millward and Yaghi (2005)
ZIF-79 298 1.1 1.4* 6.2 S Banerjee et al (2009)
IRMOF-6 298 1.2 0.7 4.6 E Millward and Yaghi (2005)
SNU-50 296 0.15 4.28
E Prasad et al (2010)
Zn2(atz)2(ox) 293 0.15 1.89
E Vaidhyanathan et al (2009)
Zn-MOF-74 296 0.15 1.38
E Caskey et al (2008)
USO-2-Ni-A 298 0.15 0.48
E Arstad et al (2008)
MIL-53(Al) 298 0.15 0.38
E Arstad et al (2008)
UMCM-1 298 0.15 0.11
E Yazaydin et al (2009b)
IRMOF-3 298 0.15 0.09
E Millward and Yaghi (2005)
Note that in Table 4.2, the adsorption capacities at 1bar (the most commonly
reported value) are tabulated to facilitate a general comparison. However, the
adsorption capacities for CO2 (0.15bar) and N2 (0.75bar) at pressures relevant to post-
combustion CO2 capture are often not directly reported, and these have been carefully
estimated from the literature gas adsorption isotherms.
For post-combustion CO2 capture, the pressure of the flue gas (aprox. 1bar) and
the low partial pressure of CO2 thereof (PCO2 0.15bar) leads to the lower pressure region
of the CO2 adsorption isotherm being the area of interest. Thus, maximizing the
adsorption capacity specifically around 0.15bar would be expected to lead to new
materials with enhanced performance for post-combustion CO2 capture. In this sense,
Yazaydin and coworkers [Yazaydin et al., 2009], using both experiments and
simulation to screen MOFs for the highest CO2 capacities at about 0.1atm, found that

Chapter 4. Review of prospective materials for CO2 capture
69
Mg-MOF-74 and Ni-MOF-74 have the highest CO2 capacities (5.95 mol/1 and 4.07
mol/l) among the 14 MOFs that they considered. This corroborated the findings of Liu
and coworkers [Li et al., 2013], who found that Ni-MOF-74 has a higher gravimetric
CO2 capacity than NaX and 5A zeolites at 0.1atm, and 25°C. In contrast to CO2
adsorption in MOFs at high pressures, there is no correlation between the CO2 capacity
and the surface area or the free volume.
4.4.3. Selective adsorption of CO2 (CO2/N2
Separation)
In the majority of reported literature, selective adsorption is the primary tool
used to give the reader a guided view of a particular material’s potential for separation.
Table 4.3 provides a survey of the equilibrium CO2 and N2 capacities, and selectivities,
of various commercial and novel adsorbents. CO2 possesses the largest quadrupole in
the mixtures and thus the strongest electrostatic interactions with the framework, while
N2 have smaller quadrupole moments and relatively weaker interaction. GCMC
simulations have demonstrated that difference of electrostatic interactions enhanced
the separation of gases. Remarkably, the gas selectivity also depend on temperature
and gas composition: the selectivity decreases sharply with increasing temperature,
and also significantly changes with the ratio of the components. These factors are
important and need to be considered.
Table 4.3. Adsorbents for CO2 capture from a CO2/N2 mixture.
MATERIAL TYPE TEMP
(K) P1/P2 (bar)
S1/2 CO2 uptake
(kmol/m3)
N2 uptake
(kmol/m3) REFERENCE
Zn4O(L3)1.5 MOF 298 0.15/0.75 580.8 0.92 0.5 Lan et al (2011)
UTSA-16 MOF 296 0.15/0.75 262 2.64* 3.2 Xiang et al (2012)
mmen-CUBTTri
MOF 298 0.15/0.75 165 2.16* 4.5 McDonald et al (2011)
Zn4O(L2)1.5 MOF 298 0.15/0.75 108 0.86 2.5 Bloch et al (2010)
Zn2(atz)2(ox) MOF 273 0.15/0.75 80.8 3.07 12.3 Vaidhyanathan et al (2009)
NaX ZEO 298 0.15/0.75 67.7 4.32* 20.0 Lee et al (2002)
NJU-Bai8 MOF 298 0.15/0.75 60.5 0.62* 5.2 Du et al (2013)
NJU-Bai7 MOF 298 0.15/0.75 58.3 0.95* 8.2 Du et al (2013)
Mg-MOF-74 MOF 313 0.15/0.75 52.3 3.90* 45.5 Mason et al (2011)
Mg-MOF-74 MOF 303 0.15/0.75 44 4.26 59.4 Mason et al (2011)
en-Cu-BTTri MOF 298 0.15/0.75 44 0.52 3.9 Demessence et al (2009)
bio-MOF-11 MOF 298 0.15/0.75 36 0.98 8.0 Chen et al (2010)

Chapter 4. Review of prospective materials for CO2 capture
70
MATERIAL TYPE TEMP
(K) P1/P2 (bar)
S1/2 CO2 uptake
(kmol/m3)
N2 uptake
(kmol/m3) REFERENCE
CuBTC (HKUST-1)
MOF 293 0.15/0.75 34.4 0.91* 13.2 Aprea et al (2010)
Ni-MOF-74 MOF 298 0.15/0.75 30 4.63 92.2 Dietzel et al (2009)
ZIF-78 MOF 298 0.15/0.75 30 0.74* 12.7 Phan et al (2010)
PCN-88 MOF 296 0.15/0.75 29.8 0.69 7.3 Li et al (2012)
CuTATB-60 MOF 298 0.15/0.75 24 0.95 21.1 Kim et al (2011)
Cu(bpy-1)2(SiF6)
MOF 298 0.15/0.75 22.5 0.60* 13.2 Burd et al (2012)
ZIF-100 MOF 298 0.15/0.75 22 0.23* 3.4 Wang et al (2008)
Cu-BTTri MOF 298 0.15/0.75 19 0.49* 13.1 Demessence et al (2009)
CuTATB-60 MOF 298 0.15/0.75 18.1 0.53 9.3 Kim et al (2011)
Fe-BTT MOF 298 0.15/0.75 18 1.20 21.6 Sumida et al (2010)
NOTT-202a MOF 293 0.15/0.75 11.36 0.35 9.8 Yang et al (2007)
IRMOF-1 (MOF-5)
MOF 298 0.15/0.75 10.1 0.11* 5.3 Rao et al (2014)
MOF-253 MOF 298 0.15/0.75 9 0.23* 8.4 Bloch et al (2010)
MOF-177 MOF 298 0.15/0.75 4 0.06 5.9 Mason et al (2011)
NTU-105 MOF 273 0.15/0.75 2 0.15 23.9 Wang et al (2008)
MOF-508 MOF 323 0.1/0.9 2 0.10 0.60 Bastin et al (2008)
Activated Carbon
AC 298 0.1/0.9 1.2 0.34* 0.28 Na et al (2001)
ZIF-82 MOF 298 0.5/0.5 35.5 2.18* 0.2 Banerjee et al (2009)
ZIF-78 MOF 298 1 50 2.04* 0.2 Banerjee et al (2009)
bio-MOF-11 MOF 298 1 75 3.28 0.10 An et al (2010)
ZIF-81 MOF 298 1 23 1.57 0.1 Banerjee et al (2009)
ZIF-79 MOF 298 1 22.5 1.37 0.1 Banerjee et al (2009)
ZIF-69 MOF 298 1/1 20 9.18 119.6 Banerjee et al (2009)
ZIF-68 MOF 298 1 19.5 1.50 0.1 Banerjee et al (2009)
ZIF-70 MOF 298 1 18 1.29 0.1 Banerjee et al (2009)
MOF-253 MOF 298 1 2.8 1.41* 10.9 Bloch et al (2010)
MOF-508b MOF 303 4.5/4.5 3 5.91 43.2 Bastin et al (2008)
NaX ZEO room 0.15/0.75 5.76 24.5 Bae et al (2013)
13X ZEO room 0.15/0.75 4.93 51.6 Rao et al (2014)
LiCHA ZEO room 0.15/0.75 4.88 40.2 Yang et al (2007)
Co-MOF-74 MOF 298 0.15/0.75 4.35 Mason et al (2011)
CaA ZEO room 0.15/0.75 4.19 26.8 Bae et al (2013)
NaCHA ZEO room 0.15/0.75 4.05 38.0 Yang et al (2007)
LTA-5A ZEO room 0.15/0.75 3.97 28.2 Rao et al (2014)
NaX(17.3)A ZEO room 0.15/0.75 3.84 1.3 Yang et al (2007)

Chapter 4. Review of prospective materials for CO2 capture
71
MATERIAL TYPE TEMP
(K) P1/P2 (bar)
S1/2 CO2 uptake
(kmol/m3)
N2 uptake
(kmol/m3) REFERENCE
NaKA (17.4%) ZEO room 0.15/0.75 3.19 17.5 Liu et al (2010)
LiKFI ZEO room 0.15/0.75 3.18 22.0 Yang et al (2007)
CaCHA ZEO room 0.15/0.75 3.05 46.6 Yang et al (2007)
Zn2(atz)2(ox) MOF 298 0.15/0.75 2.05 Vaidhyanathan et al (2009)
KCHA ZEO room 0.15/0.75 1.85 12.7 Cavenati et al (2004)
Cu-SSZ-13 AC room 0.15/0.75 1.80 16.1 Hudson et al (2012)
H-SSZ-13 AC room 0.15/0.75 1.79* 13.6 Hudson et al (2012)
NaA ZEO room 0.15/0.75 1.78* 4.1 Bae et al (2013)
DT-200 ZEO room 0.15/0.75 0.56* 10.0 Bao et al (2011)
DT-100 ZEO room 0.15/0.75 0.54* 10.2 Bao et al (2011)
DT-300 ZEO room 0.15/0.75 0.49* 10.0 Bao et al (2011)
USO-2-Ni MOF 298 0.15/0.75 0.35* Arstad et al (2008)
USO-2-Ni-A MOF 298 0.15/0.75 0.27* Arstad et al (2008)
MIL-47 MOF 298 0.15/0.75 0.25* Yazaydin et al (2009b)
NaX ZEO room 0.15/0.75 0.12* 12.3 McEwen et al (2013)
Mg-MOF-74 MOF 296 0.1/0.9 4.87 Britt et al (2009)
Co-MOF-74 MOF 296 0.1/0.9 3.28 Caskey et al (2008)
Ni-MOF-74 MOF 296 0.1/0.9 3.26 Caskey et al (2008)
LiX (Si/Al=1) ZEO 303 0.1/0.9 3.10 Walton et al (2006)
SWCNT SWNT 308 0.1/0.9 0.50 Cinke et al (2003)
5A (Sinopec) ZEO 298 1/1 1.03* 12.7 Saha et al (2010)
Natural Chabazite
ZEO 303 1/1 0.75* 10.2 Jensen et al (2011)
PCB, Calgon Corp.
AC 296 1/1 0.55* Ritter and Yang (1987)
Norit RB1 Extra AC 298 1/1 0.50* 8.9 Dreisbach et al (1999)
Sutcliffe AC 298 1/1 0.42* 6.1 Esteves et al (2008)
ZIF-100 MOF 298 1/1 0.24* Wang et al (2008)
MOF-177 MOF 298 1/1 0.15* 0.2 Saha et al (2010)
IRMOF-1 (MOF-5)
MOF 298 1/1 0.13* 2.4 Saha et al (2010)
Sutcliffe AC 298 10/10 1.82 41.4 Esteves et al (2008)
Norit RB1 Extra AC 298 10/10 1.73 45.9 Dreisbach et al (1999)
PCB, Calgon Corp.
AC 296 10/10 1.64 Ritter and Yang (1987)
H-mordenite ZEO 293 10/10 0.70 Delgado et al (2006)
Na-Mordenite ZEO 293 10/10 0.68 34.1 Delgado et al (2006)
* Calculated value from the data presented in each paper (framework densities in supporting information)

Chapter 4. Review of prospective materials for CO2 capture
72
Liu and Smit compared the separation and storage efficiency of CO2/N2
mixture in three zeolites and seven MOFs using GCMC simulations [Liu and Smit,
2010]. Not surprisingly, CO2 adsorption is more preferable for all the materials.
Although the gas storage capacity of all the MOFs is substantially higher than that of
zeolites at higher pressures, comparable separation selectivity of the two classes of
materials was obtained. In the simulation, switching off the electrostatic interactions
between gases and adsorbents resulted in lower selectivity, indicating the framework
charges play a more significant role for CO2 adsorption than for N2 adsorption.
The charged zeolite-like MOF (rho-ZMOF), which contains an anionic
framework and extraframework Na+ ions, was investigated by Babarao and Jiang
[Babarao and Jiang, 2009]., showing extraordinary CO2 separation selectivities in
CO2/N2 mixture (15:85), the selectivity reaches to 19000 at infinite dilution and drops
500 under ambient conditions, but so far, these results have not been experimentally
confirmed. All of these selectivities are the highest predicted to our knowledge. In rho-
ZMOF, Na+ ions have larger mobility in the framework and can be acted as additional
binding centers. This gives stronger charge–quadrupole interactions and accordingly,
higher adsorption selectivity. However, the adsorption uptake is not as high as in other
materials, and the simulations also showed that CO2 adsorption drops sharply with
only 0.1% of H2O.
Some reports have approximated the adsorption selectivity factors by
comparing the adsorption capacity of single-component adsorption isotherms. For
instance, Chaffee and coworkers [Liang et al., 2009] calculated the adsorption
selectivities of CO2/N2 in CuBTC (HKUST-1) from the single gas isotherms by dividing
the CO2 adsorption capacity by that of N2 at each pressure point. Their results showed
that the selectivity towards CO2 at 25ºC decreases slowly as pressure is increased. The
similar method has also been used by Yaghi and coworker [Britt et al., 2008] in series of
ZIFs for their selectivities, by Long and coworkers [Herm et al., 2012] in Fe-BTT, and by
Rosi and coworkers [Li et al., 2013b] for bio-MOF-11.
Adsorption selectivities of CO2 over other gases evaluated from experiments
were recently reported. Deng and coworkers [Deng et al., 2010] reported the
adsorption equilibrium selectivity of CO2 over N2 in MOF-5 and MOF-177, which were
calculated from the ratio of Henrys constants. The results showed that the selectivity of
CO2 over N2 is 17.48 for MOF-5 and 17.73 and MOF-177, both of which are lower than
that of Zeolite 5A. In another example, Goj and coworkers reported the separation of
CO2/N2 mixture in three siliceous zeolites with identical chemical composition but
differing pore structures (MFI, ITQ-3 and ITQ-7) [Goj et al., 2002]. The predicted
adsorption isotherms of pure CO2 and N2 agree well with available experimental data
in MFI. CO2/N2 selectivities in the three zeolites vary strongly with the crystal
structure. The study indicates that the electric fields of different strengths present in
zeolites lead to the observed selectivities and suggests the appropriate selection of
Chapter 4. Review of prospective materials for CO2 capture
73
zeolite structure is important for the separation of flue gas. Jiang and Sandler further
simulated the adsorption of CO2/N2 mixture in Na+-exchanged ZSM-5 [Jiang and
Sandler, 2006]. With experimentally validated potentials, the predicted selectivity in
Na-ZSM-5 is significantly higher than in siliceous ZSM-5 and increases with increasing
density of Na+ ions. As mentioned, similar behavior was also observed in cation-
exchanged MOFs.
Selective adsorption, in most cases, uses single-component isotherms and the
IAST method [Myers and Prausnitz, 1965] to calculate a material’s selectivity factor.
This approximate theory is known to work accurately in many porous materials [Kim
et al., 2007; Murthi et al., 2004] (most of the reports on CO2 selective adsorption in
MOFs are based on simulated adsorption isotherms). However, as the name indicates,
the calculation does not always account for all experimental variables, and should be
viewed as a reference; gas mixture adsorption experiments should thus be conducted
to complete the picture.
Using experimental single-component adsorption isotherms to calculate the
adsorption selectivity of a multi-component mixture by IAST were pioneered by Snurr
and Hupp in the MOF field. They studied the selective adsorption of CO2 over N2 in
several modified MOFs based on the ZN2(bttb)(X)2 (X = pyridine substitutes) parent
framework [Bae et al., 2009].
It should also be noted that the relevance of selectivity values calculated for
flexible frameworks via the aforementioned method has not been fully established,
although it is likely that the quantities calculated by this methodology would
overestimate the true adsorptive selectivity. This is because flexible structures
generally adsorb little N2 at 0.75bar since the apertures of the framework are not
opened by N2 in single component gas adsorption experiments. However, if CO2
affords the necessary gate opening pressure, the quantity of N2 adsorbed is likely to be
significantly higher than that observed during the single-component experiment. Since
IAST cannot account for such effects, direct selectivity measurements of binary
mixtures are likely the only accurate gauge of selectivity in flexible MOFs.
One of the most valuable techniques to evaluate the selective adsorption of CO2
from a gas mixture is by directly measuring separation by breakthrough experiments.
Some breakthrough experiments on CO2 separation in MOFs have been performed and
gave at least qualitative evaluations in most cases. An example of an efficient
separation of CO2 from a mixed CO2/N2 gas stream was demonstrated by a
breakthrough measurement made by Chen and co-workers [Wang et al., 2006] who
examined MOF-508 for its performance in the separation and removal of CO2 from
binary CO2/N2 and CO2/CH4, and ternary CO2/CH4/N2 mixtures by fixed-bed
adsorption. The separation efficiency was rationalized and compared in terms of the
sorption selectivity. The results indicated that SCO2/N2 of this MOF is moderate at 303K,

Chapter 4. Review of prospective materials for CO2 capture
74
which is lower than the selectivity of activated carbon, and decreases with increasing
temperature.
In addition, Yaghi and coworkers examined several ZIFs have also shown high
CO2 separation capacities as demonstrated by breakthrough experiments, including
ZIF-68, -69, and -70 for CO2/CO, [Rowsell et al., 2005] and ZIF-95 and -100 for
CO2/CH4, CO2/CO, and CO2/N2 separations [Deng et al., 2010]; these MOFs are
feasible for the separation of CO2 from other gases and have longer retention times for
CO2 than BPL Carbon under the same conditions. Besides these ZIFs, Dietzel and
coworkers studied CPO-27-M (M= Ni, Mg), i.e. Ni-MOF-74 and Mg-MOF-74, for the
separation of CO2/N2 mixtures by breakthrough experiments, giving similar results of
preferential adsorption of CO2 [Dietzel et al., 2008] and so on. Breakthrough
experiments have also been performed on the MIL-53 series [Lee et al., 2008; Yu et al.,
2011], and Al4(OH)2(OCH3)4(2-NH2-bdc)3 MOF [Caskey et al., 2008], to name a few.
In summary, although carbonaceous and MOFs materials exhibiting relatively
higher CO2 adsorption capacity seem to be as the promising CO2 adsorbents, the
operations at which they have been tested are at high pressures and low temperatures.
Conversely, silica materials have lower adsorption capacity and selectivity toward
CO2, their abundant surface OH groups can facilitate chemical modification to improve
their CO2 adsorption capacity and selectivity and thus treat a flue gas with low CO2
partial pressure. The materials displaying higher selectivities are generally those
bearing functionalized pore surfaces. However, these materials do not show enough
improvement of the adsorption uptake in comparison to the values found for some
specific MOFs, but they are a good choice if they can be synthesized with lower cost,
and are mechanically stable and more readily available materials. Moreover, although
a variety of MOFs show good CO2 adsorption capacity and excellent selectivity, at
present their industrial application may be limited by their powder form, high cost and
small available quantities, and poor chemical and thermal stability. In addition to the
widely available synthetic zeolites such as 13X and 4A, maybe the new class of zeolitic
materials known ZIFs can emerge as gas potential high capacity CO2 adsorbents.
4.4.4. Studies at process conditions
On account of industrial application, an effective and less energy-consumed
regeneration of the CO2 captured adsorbents is definitely needed to be developed.
Yang’s group studied the feasibility of the PSA process for the first time to
concentrate and recover CO2 from the flue gas using AC, carbon molecular sieve
(CMS), and zeolite 13X as adsorbents [Kikkinides et al., 1993]. They compared zeolite
13X and AC by the heat of adsorption, working capacity, purge requirement, and
equilibrium selectivity, and concluded that the former adsorbent was a better

Chapter 4. Review of prospective materials for CO2 capture
75
adsorbent for bulk separation of CO2 from the flue gas. Krishna and coworkers
examined a variety of MOFs by PSA process due to the flexible framework exhibiting
large pressure-dependent changes in pore volume [Krishna and Long, 2012; Krishna
and van Baten, 2012]. Webley and coworkers presented an optimization methodology
and results for the structure of adsorbents at a pore level by evaluating the effect of
pore geometry, size and overall adsorbent porosity on ultimate working capacity of
adsorbents applied in PSA process [Rezaei and Webley, 2012]. Dasgupta and
coworkers [Dasgupta et al., 2012] studied PEI impregnated SBA-15 as an adsorbent
used in a single column five-step PSA, which was found to be comparable with
reported commercial zeolite adsorbents in literature. Rodrigues and coworkers
investigated the integration of PSA process by altering the operation stages and steps.
The performance parameters of each proposed process, such as CO2 purity, CO2
recovery, and power consumption, were evaluated and compared with those of other
processes reported previously in the literature [Ribeiro et al., 2012; Lopes et al., 2012].
Ho and coworkers [Ho et al., 2008] examined the economic feasibility of CO2 capture
from power-plant flue gas by PSA process. Zhang and coworkers [Zhang et al., 2009]
made a comparison between 6 and 9 step cyclic operations with their VSA systems,
demonstrating that the power consumption and CO2 capture cost are significantly
influenced by adsorbent type, process configuration, and operating parameters such as
feed gas pressure, vacuum pressure, temperature, and extents of purge.
In TSA, in contrast, the regeneration is achieved by hot air or steam, and the
regeneration time is in general longer than PSA. Chuang and coworkers carried out the
TSA process using solid amine in a dual column. One adsorbent bed column was
expected to capture more than 90% of CO2 from the flue gas at 30–40°C and the other
one was regenerated at 120–135°C to produce more than 99% purity of CO2. To achieve
continuous removal of the CO2 from the flue gas, a number of dual columns were
necessary which depended on the time needed for CO2 adsorption, sorbent
regeneration, and cooling of the regenerated column as well as specific CO2 adsorption
capacity of adsorbents [Fisher et al., 2009]. Pirngruber and coworkers [Pirngruber et al.,
2009] simulated the breakthrough curves to evaluate the diffusion rate of CO2 and
discussed the design of a potential adsorption process. They demonstrated that
desorption by heating with water vapor (TSA) was not very favorable, due to the high
vapor consumption needed for heating the column. Moreover, the time needed for
regeneration was much longer than the adsorption step since the thermal inertia
resulted in long heating and cooling times.
Therefore, the total number of columns in a regeneration mode for each column
would be largely increased. Clausse and coworkers demonstrated the experimental
and numerical parametric studies on the performance of zeolite (13X and 5A) in
indirect TSA processes by means of an internal heat exchanger. They reported that a
purity above 95% could be achieved with a CO2 recovery of 81%, CO2 adsorption

Chapter 4. Review of prospective materials for CO2 capture
76
capacity of 1.31 mmol/g, and a specific energy consumption of 3.23 GJ/tonne CO2.
Their results showed that this process exhibited potential as compared with other
adsorption processes [Merel et al., 2008; Clausse et al., 2011]. Kulkarni and Sholl
[Kulkani and Sholl, 2012] estimated a specific TSA process and suggested the operating
cost to be of the order 80–150 US/tonne CO2. They also demonstrated the monetary
cost as a function of increasing CO2 adsorption capacity of the adsorbent. The cost of
CO2 capture can be decreased to 50–80 US/tonne CO2 for different sources of electricity
by maintaining the CO2 adsorption capacity to 2 mmol/g.
Recently, some researchers have studied the use of a hybrid pressure (or
vacuum)/temperature swing adsorption (PTSA or VTSA) process to improve CO2
capture. Pugsley and coworkers [Both et al., 1994] studied the performance of PTSA
theoretically, which could achieve 90% purity with 70% recovery. Ishibashi and
coworkers [Ishibashi et al., 1996] investigated a VTSA to capture CO2 from the flue gas
in a pilot plant at 1000 Nm3/h. Tlili and coworkers [Tlili et al., 2009] also studied the
use of VTSA and could achieve 99% purity for both VSA and TSA processes. They
concluded that the recovery depended on desorption temperature and purge flow rate.
In addition, for Electric Swing Adsorption (ESA) processes, heat is generated by
Joule effect via electric current passing through the adsorbents. The in situ heating
route can effectively deliver heat to adsorbents without heating the additional media,
thus ESA offers several advantages including less heat demanded, fast heating rate,
better desorption kinetics and dynamics and independent control of gas and heat flow
rates as compared with PSA and TSA [An et al., 2011]. Grande and his coworkers have
reported several works on ESA for CO2 capture by monolith activated carbon, carbon
molecular sieves, and zeolite-based adsorbents [Grande et al., 2009]. However,
relatively low CO2 adsorption capacity and selectivity at the CO2 partial pressure
below 10 kPa were observed as well.
4.4.5. Influence of impurities
4.4.5.1. Behavior with Water
Selectivity between H2O and CO2 is important for using adsorbent materials to
separate CO2 from flue gas. However, to our knowledge, little research has been
published on CO2/H2O and CO2/N2/H2O mixtures adsorptions: Liu and coworkers
[Liao et al., 2012] reported CO2 isotherms for CuBTC (HKUST-1) and Ni-MOF-74 with
different amounts of preloaded water. Although they found that water does not affect
CO2 adsorption as much as in traditional zeolites (NaX and 5A) and it is much easier to
remove water by regeneration, those two MOFs strongly adsorbed water as indicated
by their steep water isotherms. Moreover, neither CuBTC (HKUST-1) nor Ni-MOF-74

Chapter 4. Review of prospective materials for CO2 capture
77
can adsorb any significant amount of CO2 when water loadings are high. This is due to
the strong interactions between water molecules and the Metal Centers in both
materials.
Hydration of flexible MIL-53(Cr) has been demonstrated to enhance the CO2
adsorption relative to CH4 [Farha et al., 2008]. They found that the terminal water
molecules in the hydrated MIL provide additional interaction sites and enhance gas
adsorption at low pressures. This enhancement is more pronounced for CO2, because
the carbon dioxide molecule has a strong quadrupole. However, terminal water
molecules reduce free volume and gas adsorption at high pressures. Liu and coworkers
[Fernández et al., 2010] also reported that the DOBDC series of MOFs (MOF-74) are
prone to lose their CO2 capacities after water adsorption. In addition, Kizzie and
coworkers [Kizzie et al., 2011] observed significant decreases in CO2 capacities for the
Mg-MOF-74 and Zn-MOF-74 which were regenerated after full hydration. The effect of
humidity on the performance of the MOF-74 series (M= Zn, Ni, Co, or Mg) as
adsorbents for CO2 capture has also been explored by Matzger and co-workers [Kizzie
et al., 2011a]. Mg-MOF-74 demonstrated an exceptional capacity for CO2 under flow
through conditions with dry flue gas (5N2 : 1CO2). The effect of humidity on the
performance of these MOFs was investigated by N2/CO2/H2O breakthrough
experiments at relative humidities (RHs) of 9%, 36%, and 70%. After exposure of the
MOFs to the gas stream at 70%RH and subsequent thermal regeneration, only about
16% of the initial CO2 uptake capacity was recovered for Mg-MOF-74. However, about
60% and 85% were recovered for Ni-MOF-74 and Co-MOF-74, respectively. These
results indicated that although Mg-MOF-74 has the highest CO2 uptake capacity, under
the conditions used in this study, Co-MOF-74 may be a more desirable material for
CO2 capture in a practical environment where water exists in varying quantities in
streams of flue gas.
The presence of trace H2O in the mixtures considerably affects the selectivity. At
low pressures, the selectivity slightly increases because the H2O binding around
trimers provides additional adsorption site for CO2. At high pressures, however, the
selectivity drops due to the competitive adsorption between CO2 and H2O.
For zeolites, as mentioned before, moisture content make them almost useless
for separation applications: for instance, a bed dried is used in industry before
separating CO2 from N2 for air purification. Brandani and Ruthven [Brandani and
Ruthven, 2004] have observed that small amounts of water can inhibited the CO2
adsorption on diverse cationic forms of type-X (NaLSX, LiLSX, CaX), at 35 and 70ºC.
According to these authors, this can be due to a reduction of the strength and
heterogeneity of the zeolites electric field caused by a high adsorption capacity of
water on the exchangeable cations generated by its strong polarity. Also, in some cases
the presence of water during the CO2 adsorption on the zeolites surface seems also to

Chapter 4. Review of prospective materials for CO2 capture
78
favor the formation of bicarbonates species via hydroxyl group formation, causing an
increase of the CO2 desorption temperature.
Song’s group [Wang et al., 2009] studied the effect of moisture on CO2 capture
using the PEI/MCM-41 and showed that the CO2 adsorption capacity was increased
from 2.03 mmol/g for an anhydrous flow containing 15% of CO2 to 2.84 mmol/g for a
flow containing 10% of moisture and 13% of carbon dioxide. The uptake improvement
was interpreted in terms of adsorption mechanisms, i.e., the formation of carbamate
and bicarbonate under anhydrous and hydrous conditions, respectively [Zhang et al.,
2010].
A straightforward approach to mitigate water effects on stability and CO2
adsorption is to make materials that dislike water, in other words, to create
hydrophobic surfaces. This can be done through hydrophobic surfaces or modifying
hydrophilic materials after synthesis. For this, Yang and coworkers [Yang et al., 2007]
synthesized some fluorous metal-organic frameworks (FMOFs), wherein hydrogen
atoms were substituted by fluorine atoms in all ligands. Compared to their non-
fluorous counterparts, FMOFs with fluoro-lined or fluoro-coated channels or cavities
have enhanced thermal stability and hydrophobicity.
4.4.5.2. Other impurities
Another issue to consider when designing a process for post-combustion CO2-
capture are the impurities. The flue gas generally brings traces of other molecules that
a priori would be removed, but to some extent, should be considered. The impurities
discussed herein include sulfur and nitrogen compounds, not only for possible
poisoning of the adsorbents but also for environmental considerations. A summary of
the main results found are listed in Table 4.4. Most of these gases are released as waste
gases from industrial processes into the environment. Effective capture of these is
extremely important to avoid “poisoning” the capture-related materials and for the
protection of the environment [DeCoste and Peterson, 2014].
As an example, Yaghi and co-workers [Britt et al., 2008] tested the adsorption
and separation performances of six MOFs: IRMOF-1, Zn4O(2-NH2-bdc)3, Zn-MOF-74,
MOF-177, CuBTC and IRMOF-62, for several harmful gases including SO2, Cl2, NH3,
CO, ethylene oxide and tetrahydrothiophene vapor. Kinetic breakthrough
measurements revealed that pore functionality, in particular by active adsorption sites,
such as functional groups (NH2-) and open metal sites (in MOF-74 and CuBTC), played
a key role in determining the dynamic adsorption performance of these MOFs. For
example, CuBTC revealed high efficacy equal to or greater than BPL carbon against all
gases tested, except Cl2. On the basis of experimental breakthrough data, it was found
that MOFs like CuBTC and M-MOF-74 (M = Zn, Co, Ni or Mg) are capable of removing

Chapter 4. Review of prospective materials for CO2 capture
79
toxic gases in dry environments, but failed to do so in humid conditions, where the
competitive adsorption of water nearly eliminated the adsorption capacity. It was also
confirmed that the identity of the metal atoms in this series of materials has a
significant impact on the loading capability for all chemicals tested in both dry and
humid conditions.
Table 4.4. Recent published studies related to the impurities capture in MOFs.
GAS MATERIAL CONDITIONS VALUE REFERENCE
Sulfur Dioxide (SO2) IRMOF-1 (MOF-5) 10.000 ppm <0.1 Britt et al (2008)
IRMOF-3 0.1
MOF-177 <0.1
CuBTC (HKUST-1) 0.5
IRMOF-62 <0.1
Zn-MOF-74 3.1
380 ppm, 293 K 0.3 Glover et al (2011)
Ni-MOF-74 <0.1
Mg-MOF-74 1.6
Co-MOF-74 0.6
FMOF-2 0.25/0.5 bar 1.1/1.4 Fernández et al (2010)
Hydrogen Sulfide (H2S)
MIL-47 5/30 kPa, 303 K 0.2/1.5 Hamon et al (2009)
MIL-53(Cr) 1.2/2.5
MIL-53(Al) 0.2/2.7
MIL-53(Fe) 0.2/1.2
Ni-MOF-74 5 kPa 6.4 Allan et al (2012)
CuBTC (HKUST-1) 1000 ppm, 70% RH 2.7 Petit et al (2010)
IRMOF-1 (MOF-5) 100 ppm 0.5 Huang et al (2012)
Nitrogen Oxide (NO) CuBTC 1 bar, 298 K 3.0 Xiao et al (2007)
Cu-SIP-3 1 bar, 293 K 1.1 Allan et al (2010)
Ni-MOF-74 10 mbar, 303 K 6.1 Bonino et al (2008)
MIL-88 1 bar, 303 K 2.5 McKinlay et al (2013)
MIL-88(B) 1.6
Nitrogen Dioxide (NO2)
CuBTC (HKUST-1) 1000 ppm 2.2 Levasseur et al (2010)
UiO-66 1.6 Ebrahim et al (2012)
UiO-67 1.7
Carbon Monoxide (CO)
CuBTC (HKUST-1) 1 bar, 295 K 0.7 Wang et al (2002)
MIL-100(Cr) 850 torr, 303 K 1.0 Munusamy et al (2012)
20 kPa, 298 K 0.9 Wang et al (2012)
Mil-100(Cr) TEM 0.1

Chapter 4. Review of prospective materials for CO2 capture
80
The removal of sulfur odorant components from natural gas was explored by
Mueller and co-workers [Mueller et al., 2006]. Control experiments revealed that
CuBTC has a higher volume specific uptake capacity for THT than two commercially
available activated carbon materials, Norit (type RB4) and CarboTech (type C38/4).
The adsorption of these polar molecules induced a color change of the CuBTC sample
from a deep blue into a light green, which allows for visual detection of contaminants.
Furthermore, after removal of the adsorbates by treatment under vacuum or heating,
the original color reappeared, indicating practical regeneration of the adsorbent. A
further example was demonstrated in flexible Zn(bchp), in which H2S and SO2 were
selectively adsorbed over N2, CO2, and CH4 at room temperature [Fernandez et al.,
2010]. The adsorption of H2S in MIL-53(Al, Cr, Fe), MIL-47, MIL-100(Cr), and MIL-101
also revealed that all of these MOFs are stable toward this corrosive gas and actually
have high loading capacities and are easily regenerable, thus making them potential
candidates in the purification of natural gas, or for a previous stage in a post-
combustion process [Stephenson et al., 1999].
Recently, Sun and coworkers [Sun et al., 2014] used molecular simulations to
study twelve representative porous materials, including six MOFs, two ZIFs and four
zeolites to remove SO2 and NOx from flue gases. CuBTC and MIL-47 were identified to
perform best for the removal of SO2, while considering the simultaneous removal of
SO2, NOx and CO2 from flue gases, Mg-MOF-74 was recommended as the most
promising due to its high density of open-metal sites which provides strong
interactions with dipole and quadrupole molecules.
Sulfur compounds
Sulfur dioxide: SO2 is a common toxic chemical used in industry and present as a
combustion byproduct. Along with NOx emissions from industrial processes, lead to
the formation of acid rain. Britt and coworkers investigated a variety of materials for
the removal of several toxic chemicals, including sulfur dioxide [Britt et al., 2008].
Materials were evaluated under dry conditions, and breakthrough results show that
Zn-MOF-74 provides excellent SO2 removal while CuBTC provides similar SO2
removal to activated carbon. All other MOFs studied show immediate breakthrough
and negligible SO2 loadings. Although this study shows the possibility of using MOF-
74 and CuBTC in dry environments, the effect of moisture was not studied; therefore, it
is unknown if H2O is preferentially adsorbed over SO2.
Glover and coworkers further investigated MOF-74 for SO2 removal, this time
looking at the effect of the metal in the SBU [Glover et al., 2011]. Four analogues were
evaluated: Co, Mg, Ni, and Zn, for SO2 dynamic breakthrough capacity at a
concentration of 380ppm at 293K. In this study, moisture was added to determine both

Chapter 4. Review of prospective materials for CO2 capture
81
dry (0%RH) and humid (80%RH) loadings. Under dry conditions, Mg-MOF-74
provided superior SO2 removal, Co-MOF-74 provides about one-third of the loading,
with the overall loadings decreasing according to the order Mg > Co > Zn > Ni. Under
humid conditions, only the Mg-MOF-74 sample provided any appreciable SO2
removal.
Additional work from a novel high temperature solid sorbent based on lithium
orthosilicate (Li4SiO4) [Pacciani et al., 2011] has shown promises results for post-
combustion CO2 capture, however its performance in the presence of contaminants
such as SO2 drastically decreases capacity. Thus, industrial application would require
desulfurization of flue gas prior to contacting the adsorbent.
In addition to experimental studies on sulfur dioxide sorption, a number of
theoretical studies have been conducted: Fioretos and coworkers performed ab initio
analyses of substituted benzenes, representing the linkers on the IRMOF series
[Fioretos et al., 2011]. Calculations showed interaction energies between SO2 and
aniline, and it was found that molecules with larger dipole moments will interact more
strongly with the amine group. The authors suggest that incorporating polar functional
groups onto MOF linkers allows for better interaction, and thus separation, of polar
compounds. Ding and Yazaydin performed DFT and GCMC calculations on the effects
of flue gas on the CO2 uptake of M-MOF-74 (M = Co, Mg, Ni) MOFs [Ding and
Yazaydin., 2012]. Specifically, they found adsorption energies greater than 200 kJ/mol
for the Co and Mg analogues, whereas the adsorption energy for the Ni analogue was
approximately 50 kJ/mol. The former are representative of chemisorption and
correspond to the experimental trend in SO2 capacities reported by Glover and
coworkers [Glover et al., 2011]. The study indicates that Ni-MOF-74 is actually
preferred for CO2 adsorption in flue gas applications, as SO2 will have less impact on
CO2 adsorption; however, it also indicates that the Co and Mg analogues are better for
SO2 removal.
Most of these type materials do not provide the necessary chemistry for SO2
reaction. Furthermore, moisture typically inhibits SO2 removal on MOFs. However,
some studies indicate that MOFs may be used as structures to hold nanoparticles or
salts for SO2 removal, and is a potential area for further study.
Hydrogen sulfide: H2S is a toxic chemical commonly encountered as an impurity in
the petroleum and natural gas industries and is also a byproduct of anaerobic
decomposition, which gives it the commonly referred to name of sewer gas.
For this gas, Watanabe and Sholl used GCMC simulations to calculate
adsorption in CuBTC [Watanabe and Sholl, 2010], founding that the material can
adsorb at 50% of active copper sites at 300K, even at partial pressures less than 10bar.
In addition, breakthrough experiments showed that H2S reacts with the CuBTC,

Chapter 4. Review of prospective materials for CO2 capture
82
causing the structure to breakdown and therefore may be promising for single-use
filters.
Nitrogen oxides
Mononitrogen oxides: NOx are produced from the reaction of nitrogen and oxygen
in the air during high-temperature combustion. NOx is composed of nitric oxide (NO)
and nitrogen dioxide (NO2).
As NO is a free radical, it strongly interacts with the metal centers of some
MOFs, such as the CuBTC, MOF-74, and MIL- [Bordiga et al., 2007; Bonino et al., 2008;
McKinlay et al., 2013] CuBTC shows a significant hysteresis observed in the NO
isotherm, indicating the strong irreversible adsorption of many of the molecules on the
coordinatively unsaturated copper sites. Furthermore, the binding energy for NO to
the Cu2+ ion is much less than that for H2O, meaning that NO likely cannot displace
H2O molecules that are preadsorbed onto CuBTC or found in the same streams as NO.
Besides, there is no subsequent filling of the micropores at low partial pressures as the
intermolecular forces between individual NO molecules are relatively weak. Ni-MOF-
74 was also investigated, showing the highest reported capacity for any MOF [Allan et
al., 2010]. Furthermore, NO is selective toward Ni(II), as there are minimal
intermolecular interactions between NO molecules, whereas H2O completely fills the
pores after interacting with Ni(II). In contrast, Yu and coworkers [Yu et al., 2012]
showed that NO has negligible loadings in Mg-MOF-74 through DFT studies, which
they attribute to the absence of d-electrons in Mg.
Contrarily, NO2 molecules do not make strong ligands for binding and rely
heavily upon physical adsorption in MOFs or chemical reaction with the surface. The
NO2 dipole gives it the ability to interact with functional groups that may be
incorporated onto the MOF linkers. Furthermore, it was shown that NO2 molecules can
react with carboxylate bonds to form species covalently bound to the MOF [Petit et al.,
2012; Levasseur et al., 2010; Petit et al., 2012].
For instance, the adsorption capacity for CuBTC under dry (0%RH) conditions
at room temperature for a 1000ppm NO2 stream was calculated to be 2.21 mmol/g,
however at conditions of 70%RH, the removal capacity is decreased to 1.13 mmol/g.
The reduction in capacity under humid conditions is due to the competitive adsorption
and coordination to Cu sites by water molecules. The structure of CuBTC is degraded
when exposed to NO2 as supported by FTIR and N2 isotherm data.
Wang and coworkers have shown through GCMC simulations that both NO
and NO2 are weakly adsorbed on Zn4O MOFs such as IRMOF-1 and MOF-177 [Wang
et al., 2009]. Furthermore, the isotherms at 298K are fairly linear, indicating minimal
interaction between the adsorbates and the inner surfaces.

Chapter 4. Review of prospective materials for CO2 capture
83
Nitrous oxide: N2O is present in air at concentrations of 300–350 ppb and represents
an increasing problem in the separation of air [Khatri et al., 2006]. The presence of N2O
is most troublesome in facilities designed primarily to supply gaseous O2, as well as in
those plants equipped to additionally recover the rare gases Kr and Xe. CO2 is
generally the first primary contaminant to breakthrough a TSA pre-purifier. As a
result, the adsorber effectiveness can be monitored continuously by sensing the CO2
concentration of the effluent. Since N2O breaks through the bed before CO2 in
conventional pre-purifiers, effective design for CO2 does not guarantee the removal of
N2O to the desired efficiency. To reverse this effect, selective adsorbents for N2O over
CO2 have been sought [Coudert et al., 2009]. The highest selectivity in zeolites,
determined by the ratio of Henry’s law constants was found for CaX, Na mordenite
and BaX. These results suggest zeolites with high cation charge density and low Si/Al
ratio for N2O removal. The typical configuration is a three-layer adsorbent bed in
which H2O is removed in the first layer, CO2 is removed in the second layer and the
combination of CO2 and N2O are removed in the third layer [Plaza et al., 2007b].
Both CO2 and N2O have a kinetic diameter of 3.3Å. Adsorption studies of 5Å
adsorbent with CO2 and N2O [Serna-Guerrero and Sayari, 2006] at relatively high
concentrations (1800–24000ppm) suggest that CO2 is the more strongly adsorbed
molecule, although co-adsorption was significant. In view of these observations, it is
doubtful that a selectivity of N2O-over-CO2 greater than 1.0 can be achieved in low
Si/Al ratio zeolites.
Although adsorbent materials would be expected to selectively adsorb N2O
over N2, such selectivity may be diminished by the large concentration advantage of N2
(790 000 ppm) over N2O (0.35 ppm) in the gas mixture. Thus, the problem becomes one
of finding an appropriate adsorbent that has high N2O/N2 separation factor, high N2O
capacity and low N2 loading.
Carbon Monoxide:
CO is a colorless and odorless gas, resulting from the partial oxidation of
carbon-containing compounds. Carbon monoxide separations have already been
thoroughly reviewed elsewhere [Li et al., 2009; Li et al., 2011a].
For this case, MOFs with unsaturated centers have the highest affinity for CO,
but their capacities are still not very high. However, the removal of CO can be
accomplished through catalytic oxidation to CO2 in many instances. Sorbents MOFs
such as CuBTC and MOF-74 have been studied for the removal of CO because of the
ability of the metal ions to coordinate to CO, forming carbonyl complexes. The
adsorption of CO on CuBTC was initially examined by Wang and coworkers [Wang et

Chapter 4. Review of prospective materials for CO2 capture
84
al., 2002]. Karra and coworkers calculated through GCMC methods that the CO
capacities are higher in CuBTC compared to Zn-based MOFs (IRMOF-1, IRMOF-3, and
DMOF), largely due to the electrostatic interactions between the open copper sites and
CO molecules [Karra et al., 2010; Zhou et al., 2011].
It has also been shown that amine groups can increase the adsorption capacity,
as observed in IRMOF-3 or even serve as sites for the synthesis of Pd catalysts within
the pores [Kleist et al., 2010]. Woo and coworkers [Prasad et al., 2010] carried out
GCMC and MD studies of CO and CO2 adsorption in ZIF-68 and ZIF-69. The GCMC
simulation was performed at low pressures (0–1atm) at 273K. In the low-pressure
range, the uptake of gas molecules is not determined by the geometric structure, but
controlled by the properties of binding sites in the framework.

85
85
5 5. MOLECULAR MODELING OF MATERIALS
FOR CO2 CAPTURE AT TSA PROCESS
CONDITIONS 1
1 Part of this chapter has been published in the Chem. Eng. Journal (doi: 10.1016/j.cej.2015.08.098)

Chapter 5. Materials for CO2 capture in a TSA under process conditions
86
5.1. Background information
Traditionally, the industrial needs for high purity gases require several
consecutive cycles of cryogenic fractional distillation [Parkes et al., 2013]; however the
selective isolation of these gases near room temperature, known as Swing Adsorption
Cycles, has reduced the dependence of the first less efficient energy processes in
specialized applications, and represents a revolutionary advance in order to achieve a
more dynamic production at industrial level.
For post-combustion CO2 capture, the absorption with amines is the process
used at demonstration and industrial scale. This has been the strategy further explored
to date, since it can be easily adapted to existing plants. Nevertheless, although this
process allows CO2 capture with a high selectivity, the use of aqueous absorbent carries
an energy penalty of about 30% of the energy produced in the central [Sumida et al.,
2012], which reinforces the search for more efficient processes. In spite of the increasing
interest for efficient materials for CO2 separation for a gas stream at different
conditions, most of the published work focused on adsorption isotherms and few to
mixture measurements, providing limited data to be used for the industrial conditions.
The composition of a typical post-combustion flue gas has a relatively low CO2
concentration (14-16% v/v), while the bulk of the effluent is composed of N2 (73-78%
v/v) and other minor components, such as H2O (5-7% v/v), O2 (3-4% v/v), CO, NOx,
and SOx (ppm). In this sense, a high selectivity toward CO2 is crucial, such that only
pure carbon dioxide be captured and subjected to permanent storage or utilization.
This is why these alternative adsorption processes (like PSA and TSA) advance in
order to achieve a more dynamic production, but require very efficient sorbent
materials to be practical. It should be noted that since the flue gas is released near
ambient pressure, compressing or applying a vacuum to such a large volume of gas is
expected to be more expensive than heating (that can even be supplied by the energy
of the combustion gases), and therefore, TSA might represent a most viable process
than PSA or VSA [Hedin et al., 2013]. The gas stream is released at a total pressure of
approximately 1atm, and since SOx removal would precede CO2 capture, the flue gas
would be expected to enter the scrubber at temperatures between 40 and 60ºC. As
outlined, an ideal adsorbent for CO2 capture from a post-combustion stream should
exhibit a high selectivity, but also high gravimetric and volumetric adsorption
capacities, minimal energy penalty for regeneration, long-term stability under the
operating conditions and rapid diffusion of the gas through the adsorbent material, to
name the key ones. Traditional industrial sorbents, such as zeolites and porous
carbons, usually have high surface areas and pore volumes, which generally promote
uptake of weakly interacting gases [Krishna and van Baten, 2010]. In addition, Metal–
Organic Frameworks (MOFs) have recently appeared with their synthetic versatility to
enable a “materials by design” approach [O’Keeffe and Yaghi, 2012].

Chapter 5. Materials for CO2 capture in a TSA under process conditions
87
Regarding the characterization of materials for separation, molecular simulation
has become a complementary tool to the experimental ones, and its value in this field
has been proven through the intense interest in MOFs for storage of hydrogen,
methane, and carbon dioxide [Duren et al., 2009; Meek et al., 2011]. Specifically, GCMC
simulations can be used as a screening method for adsorption properties, providing
valuable data such as adsorption isotherms, loadings, heats of adsorption and Henry’s
constants, all of which could have experimental counterparts that can be used for
model validation. According to literature, using standard force fields can predict MOF
adsorption trends and properties with reasonable accuracy, enabling both structural
correlations and specific high-performing MOFs to be identified [Li et al., 2012]. With
respect to the studied gases, both experimental measurements and computational
simulations of low temperature adsorption are commonly used to determine pore
volumes in MOFs and related frameworks [Walton et al., 2008]; however, only a few
published studies have considered the room temperature adsorption (or process
conditions) of other gases, and is what in part justifies this study [Huck et al., 2014].
Here, we present a systematic investigation of several types of families of MOFs
found in literature (that has shown good preliminary results in the CO2/N2 separation
type) vs. typically zeolites and materials used in industry for gas storage and CO2
purification. GCMC simulations are used to identify features of these structures. The
main objective is, by a fast screening using simulation, to find the most suitable
adsorbent for a real Temperature Swing Adsorption process.
5.2. Force field and simulation details
Models for the zeolites and Metal–Organic Frameworks used in this work were
taken from published single-crystal X-ray diffraction structures. Unit cells of non-
orthogonal crystals were orthogonalized for later ease in simulation and analysis.
Solvent molecules were deleted where appropriate, providing “activated” structures
[Tagliabue et al., 2009]. All frameworks were treated as rigid structures with atoms
fixed at their crystallographic positions. Using rigid crystallographic atom positions to
model MOFs has been found to be appropriate for GCMC simulations when predicting
adsorption of small gas molecules [Yan et al., 2009]. It should be noted that MOFs can
be more flexible than zeolites, and several authors have explicitly considered the
flexibility in their simulations [Coudert et al., 2011; Tan et al., 2010]. However, it is
expected that their flexibility will have little influence on the adsorption, due to the
range of pressures evaluated in this work (see, for instance the case of MIL-53(Al) in
Figure 5.10). Hence, as considering flexibility increases the computational time and it
should not affect our results, we have decided to simulate rigid frameworks.

Chapter 5. Materials for CO2 capture in a TSA under process conditions
88
The Lennard-Jones parameters for zeolites were taken from the force field of
Watanabe and coworkers [Watanabe et al., 1995], while most of MOFs atoms were
taken from the DREIDING force field [Mayo et al., 1990] with UFF [Rappé et al., 1992]
parameters taken for structures with open metal sites. UFF force fields have been
designed to be very generic, so that broad coverage of the periodic table, including
metals, and transition metals, could be achieved. All van der Waals parameters are
listed in Table 5.1, including the charges used for the frameworks atoms [Parkes et al.,
2013; Dubbeldam et al., 2007; Xu et al., 2010; Martín-Calvo et al., 2008; Yazaydin et al.,
2009; Ramsahye et al., 2007].
Table 5.1. Lennard-Jones parameters for each atom used in the GCMC simulations.
ATOM (Å) /kB (K) q (e
-)
Force Field
(REF)
Zeolites Si 2.3 22 2.05
Al 2.3 22 1.75 [Watanabe et al., 1995]
OSi-Si 3.3 53 -1.025
OAl 3.3 53 -1.2
Na 2.8 70 1
MOFs C 3.47 47.8 *
DREIDING
[Mayo et al., 1990]
H 2.85 7.6 *
O 3.03 48.2 *
N 3.26 34.7 *
Zn 2.46 62.4 *
UFF
[Rappé et al., 1992]
Cu 3.114 2.52 *
Zr 2.783 34.72 *
Mg 2.6914** 55.857 *
GASES
Nitrogen N 3.31 36 -0.482
COM(N2) - - 0.964
TraPPE
[Potoff and
Siepmann, 2001]
Carbon dioxide C 2.8 27 0.7
O 3.05 79 -0.35
Water
Hw - - -
TIP-4P/2005
Ow 3.159 93 0.5564 [Abascal and
Vega, 2005]
qwater - - -1.128
Parameters for the gas atoms were taken from the literature in a transferable
manner, as they accurately reproduce the condensed phase properties [Babarao and
Jiang, 2009]. CO2 and N2 were modeled using the TraPPE force field [Potoff and
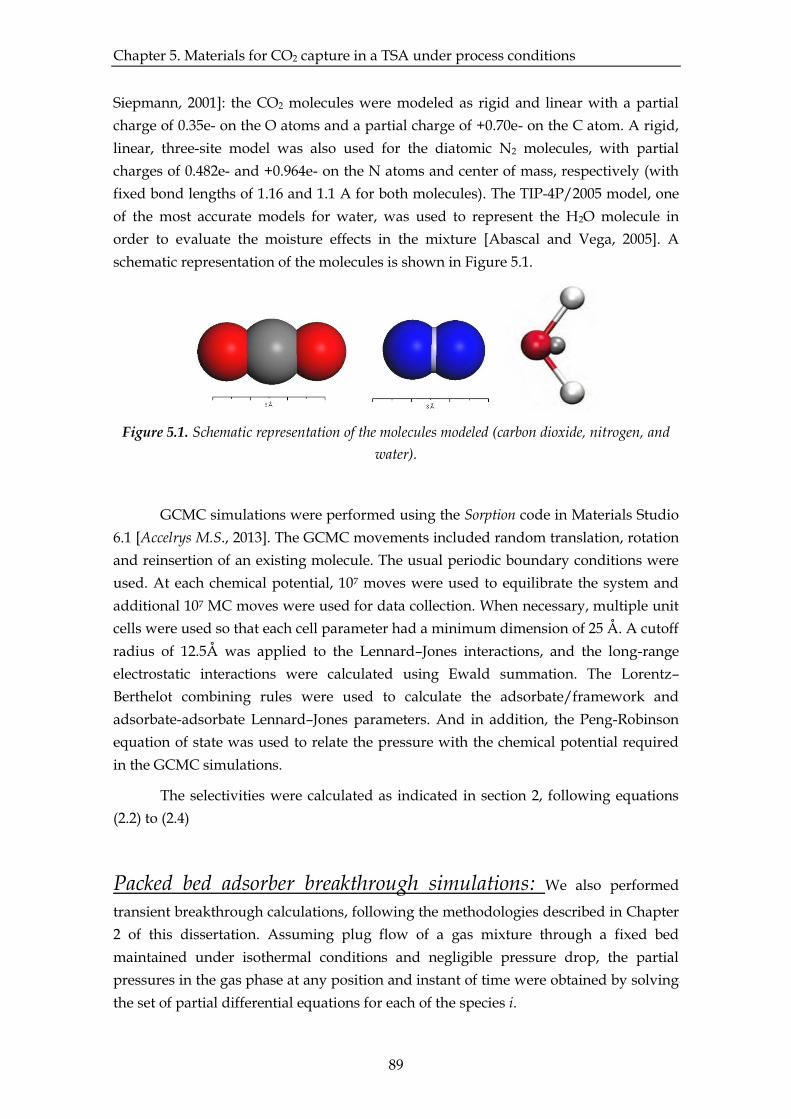
Chapter 5. Materials for CO2 capture in a TSA under process conditions
89
Siepmann, 2001]: the CO2 molecules were modeled as rigid and linear with a partial
charge of 0.35e- on the O atoms and a partial charge of +0.70e- on the C atom. A rigid,
linear, three-site model was also used for the diatomic N2 molecules, with partial
charges of 0.482e- and +0.964e- on the N atoms and center of mass, respectively (with
fixed bond lengths of 1.16 and 1.1 A for both molecules). The TIP-4P/2005 model, one
of the most accurate models for water, was used to represent the H2O molecule in
order to evaluate the moisture effects in the mixture [Abascal and Vega, 2005]. A
schematic representation of the molecules is shown in Figure 5.1.
Figure 5.1. Schematic representation of the molecules modeled (carbon dioxide, nitrogen, and
water).
GCMC simulations were performed using the Sorption code in Materials Studio
6.1 [Accelrys M.S., 2013]. The GCMC movements included random translation, rotation
and reinsertion of an existing molecule. The usual periodic boundary conditions were
used. At each chemical potential, 107 moves were used to equilibrate the system and
additional 107 MC moves were used for data collection. When necessary, multiple unit
cells were used so that each cell parameter had a minimum dimension of 25 Å. A cutoff
radius of 12.5Å was applied to the Lennard–Jones interactions, and the long-range
electrostatic interactions were calculated using Ewald summation. The Lorentz–
Berthelot combining rules were used to calculate the adsorbate/framework and
adsorbate-adsorbate Lennard–Jones parameters. And in addition, the Peng-Robinson
equation of state was used to relate the pressure with the chemical potential required
in the GCMC simulations.
The selectivities were calculated as indicated in section 2, following equations
(2.2) to (2.4)
Packed bed adsorber breakthrough simulations: We also performed
transient breakthrough calculations, following the methodologies described in Chapter
2 of this dissertation. Assuming plug flow of a gas mixture through a fixed bed
maintained under isothermal conditions and negligible pressure drop, the partial
pressures in the gas phase at any position and instant of time were obtained by solving
the set of partial differential equations for each of the species i.

Chapter 5. Materials for CO2 capture in a TSA under process conditions
90
The equations were discretized using the finite differences scheme, while the
molar loadings of the species i, qi, at any position z and time t, were determined from
correlations obtained GCMC calculations at different mixtures. Specifically, the
calculations presented here were performed by taking the following parameter values:
bed length, L = 0.1 m; voidage of bed, = 0.4; superficial gas velocity u = 0.1 m/s (at
inlet).
5.3. Main results
Results concerning this study were divided in two parts: simulations for pure
components and simulations for mixtures. Regarding the adsorption study of pure
components, we focused on validating the force fields employed, the adsorption
isotherms and the properties obtained for the substances at very low pressures (as QST
and KH). In the mixture study the focus was on calculating selectivities for different
materials (representative structures and those with the greatest potential for the
process evaluated were selected). An additional analysis considering the breakthrough
curves was also performed. Further analyses include the effect of water traces into the
process in an attempt to assess behaviors under real operating conditions.
5.3.1. Validation of models
As mentioned, we have performed GCMC simulations to obtain adsorption
isotherms of pure CO2 and pure N2 on eleven different types of materials and results
were compared with available experimental data found in literature in order to assess
the validity of the models for further predictions. The simulated isotherms were
compared with experimental gas adsorption curves when available. This allowed us to
quantify the accuracy of our predictions.
The materials were selected considering the results of the detailed review
presented in chapter 4 of this dissertation. A crystallographic 2D representation of the
evaluated structures is shown in Figure 5.2.

Chapter 5. Materials for CO2 capture in a TSA under process conditions
91
IRMOF-1 MOF-177 CuBTC
Zeolite 13X ZIF-8 PCN-14
Mg-MOF-74 LTA-4A MFI
MIL-53(Al) UiO-66(Zr)
Figure 5.2. Adsorbents materials considered for CO2 separation
For evaluating the performance of Mg-MOF-74 and MOF-177, the pure
component CO2 and N2 adsorption isotherm data were obtained from the works of
Dietzel et al. [Dietzel et al., 2009] and Mason et al. [Mason et al., 2011]. For evaluating
the performance in MIL-53(Al) and PCN-14, the data were obtained from the works of

Chapter 5. Materials for CO2 capture in a TSA under process conditions
92
Boutin et al. [Boutin et al., 2010] and Parkes et al. [Parkes et al., 2013]. For CuBTC, the
work from Wang et al. [Wang et al., 2002] was used. For evaluating the performance of
UiO-66(Zr) and LTA-5A the adsorption isotherms reported by Wiersum et al.
[Wiersum et al., 2013] were used, and for LTA-4A, the data from Bae et al. [Bae et al.,
2013]; for IRMOF-1, the data by Furukawa et al. [Furukawa et al., 2010] at various
temperatures, and for ZIF-8, the data by McEwen et al. [McEwen et al., 2013]. And
finally, for evaluating the performance of zeolites NaX and MFI, the pure-component
CO2, and N2 adsorption isotherms were taken by the reported data by Cavenati et al.
[Cavenati et al., 2004] and Krishna et al. [Krishna et al., 2010], respectively.
Figure 5.3 depicts the pure adsorption isotherms calculated in this work and
compared with the experimental data (the charges used for each atom of the MOFs
structures are also presented).
IRMOF-1 (MOF-5)
Element type Charge (e-)
Zn [O,O,O,O] 1.275
O [Zn,Zn,Zn,Zn] -1.50
O [C,Zn] -0.60
C [C,O,O] 0.475
C [C,C,C] 0.125
C [C,C,H] -0.15
H [C] 0.15 [Charges Ref: Dubbeldam et al. (2007)]
MOF-177
Element type Charge (e-)
Zn 1.59
Oa -1.92
Ob -0.79
Ca 0.80
Cb 0.05
Cc -0.13
H 0.11
[Charges Ref: Xu and Zhong (2010)]
0
0.5
1
1.5
2
2.5
3
3.5
0.001 0.01 0.1 1 10
Ad
sorp
tio
n (
mm
ol/
g)
Pressure (bar)
CO2 in IRMOF-1 (T = 298 K)
Furukawa et. al, 2010
Sim
0
0.2
0.4
0.6
0.8
1
0 0.4 0.8 1.2
Ad
sorp
tio
n (
mo
l/k
g)
Pressure (bar)
CO2 and N2 in MOF-177 (T = 303 K)
CO2, Mason et. al, 2011
CO2 Sim
N2, Mason et. al, 2011
N2, Sim

Chapter 5. Materials for CO2 capture in a TSA under process conditions
93
CuBTC (HKUST-1)
Element type Charge (e-)
Cu [O,O,O,O] 1.098
O [C,Cu] -0.665
C [C,O,O] 0.778
C [C,C,C] -0.092
C [C,C,H] -0.014
H [C] 0.109 [Charges Ref: Martín-Calvo et al (2008)]
MIL-53 (Al) - np
Element type Charge (e-)
Al [O,O,O,O,O,O] 1.420
O [Al,Al,H] -0.729
O [Al,C] -0.564
C [C,O,O] 0.584
C [C,C,C] -0.082
C [C,C,H] -0.089
H [C] 0.145
H [O] 0.301 [Charges Ref: Ramsahye et al. (2007)]
Note: only the “narrow pore” structure was evaluated in this work due to the pressure range used for TSA
(avoiding “breathing” effect; rigid structures)
ZIF-8
Element type Charge (e-)
Zn [N,N,N,N] 0.749
C [C,N,N] 0.698
C [C,H,H,H) -0.0093
C [C,H,N] 0.0117
N [C,C,Zn] -0.387
H [C] -0.139
H 0.0627 [Charges Ref: Xu and Zhong (2010)]
PCN-14
0
1
2
3
4
5
6
7
0 1 2 3
Ad
sorp
tio
n (
mm
ol/
g)
Pressure (bar)
CO2 and N2 in Cu-BTC (T = 295 K)
Wang et. al, 2002
Sim (mmol/g)
0
0.1
0.2
0.3
0.4
0.5
0.01 0.1 1 10
Pressure (bar)
Wang et. al, 2002
Sim (mmol/g)
CO2
N2
0
1
2
3
4
5
6
7
8
9
10
0.1 1 10
Ad
sop
rtio
n (
mm
ol/
g)
Pressure (bar)
CO2 and N2 in MIL-53 (Al)
Boutin et al., 2001 (T=298K)
CO2, Sim (T=298K)
Parkes et al., 2013 (T=308K)
N2, Sim (T=308K)
"narrow pore" (np)
"large pore" (lp)
0
0.4
0.8
0 0.25 0.5 0.75 1 1.25
Ad
sorp
tio
n (
mm
ol/
g)
P (bar)
CO2 and N2 in ZIF-8 (T = 298 K)
CO2
N2
Exp: McEwen et al., 2013
Sim ( )

Chapter 5. Materials for CO2 capture in a TSA under process conditions
94
Element type Charge (e-)
Cu [O,O,O,O] 1.05
O [C,Cu] -0.65
C [C,O,O] 0.79
C [C,C,C] 0.04
C [C,C,H] -0.14
H [C] 0.10
[Charges Ref: Parkes et al. (2013)]
Mg-MOF-74
Element type Charge (e-)
Mg 1.46 *
Oa -0.91
Ob -0.71
Oc -0.78
Ca 0.80
Cb -0.26
Cc 0.49
Cd -0.28
H 0.19
[Charges Ref: Yazaydin et al. (2009)]
Note: For Mg-MOF-74, the UFF sigma parameter assigned to the metal center (Mg) was adjusted (reduction
to the half) as mentioned in literature, in order to reliably produce exp data and also to give a good agreement
between the binding energy calculated with the force field and with DFT.
ZEOLITE 13X (NaX) LTA-4A
0
0.2
0.4
0.6
0.8
1
0 0.5 1 1.5 2 2.5
Ad
sorp
tio
n (
mm
ol/
g)
Pressure (bar)
N2 in PCN-14 (T = 308 K)
[N2] - Parkes et al., 2013 (mmol/g)
Sim. N2 (mmol/g)
0
1
2
3
4
5
6
7
8
9
10
0 0.2 0.4 0.6 0.8 1
ad
sorp
tion
(m
g/
g)
Pressure (bar)
CO2 and N2 in Mg-MOF-74 (T = 298 K)
Dietzel et al., 2009
Sim.
Sim.2 (metal center
adjustment)
CO2
N2
0
1
2
3
4
5
6
7
8
9
0 1000 2000 3000
Ad
sorp
tio
n (
mm
ol/
g)
P (KPa)
CO2 and N2 in NaX (T = 298 K)
CO2 N2
Exp: Cavenati et al., 2006
Sim ( )
0
1
2
3
4
5
0 0.2 0.4 0.6 0.8 1
Ad
sorp
tio
n (
mm
ol/
g)
Pressure (bar)
CO2 and N2 in LTA-4A (T = 298 K)
[CO2] - Bae et al.
CO2, Sim. (mmol/g)
[N2] - Bae et al.
N2, Sim. (mmol/g)
0
0.1
0.2
0 0.5 1 1.5
Pressure (bar)

Chapter 5. Materials for CO2 capture in a TSA under process conditions
95
MFI
Figure 5.3. Validation of adsorption isotherms obtained with GCMC (marked as “sim”), compared to experimental data.
The experimental and simulated gas uptake agree with each other well enough to feel
confident in drawing conclusions on the adsorption trends obtained for the pressure
range we are interested in, that is, close to atmospheric conditions (TSA process).
Therefore, the parameters used in this work give good reproduction of the
corresponding experimental adsorption isotherms, validating the use of these force
fields for a fast screening procedure.
5.3.2. Calculated pure adsorption isotherms
The pure-component CO2 and N2 adsorption calculated isotherm data for
zeolites and MOFs were fitted with the dual-site Langmuir–Freundlich (DSL-F) model
for a range equivalent with operational conditions (close to ambient pressure and
temperature, and with temperature rises above 400K). The parameters are provided in
Table 5.2a and 5.2b.
For the obtained pure component isotherms, a dual-site Langmuir–Freundlich
adjust was used:
(5.1)
with T-dependent parameters bi,A and bi,B:
(5.2)
Experimental gas isotherms are reported as excess adsorption, and simulated
data is obtained as total adsorption. Note that at the low pressures considered here,
excess and total gas adsorptions are nearly identical, so the difference can be ignored;
0
0.5
1
1.5
2
2.5
3
3.5
0 2 4 6 8 10
Ad
sorp
tio
n (
mm
ol/
g)
Pressure (bar)
CO2 and N2 in MFI
CO2, 303K (Exp. Krishna)
CO2, Sim.
N2, 303K (Exp. Krishna)
N2, Sim.

Chapter 5. Materials for CO2 capture in a TSA under process conditions
96
the situation will be different at high pressures, in this case, the simulation data should
be converted to excess adsorption.
Table 5.2. Temperature-dependent fit parameters for (a) CO2 and (b) N2 adsorption isotherms using a Langmuir-Freundlich Dual Site model (273 K < T < 450 K).
(a) Carbon dioxide
MATERIAL qA
(mmol/g) b0A
(kPa-1) EA
(kJ/mol) vA
qB (mmol/g)
b0B
(kPa-1) EB
(kJ/mol) vB
Activated Carbon
28.0 1.00x10⁻⁷ 5000 2.1 9.6 2.40x10⁻⁶ 16000 1
CuBTC (HKUST-1)
18.2 1.37x10⁻⁷ 25500 1 0 0 0 1
IRMOF-1 28.0 9.50x10⁻⁶ 10000 1 0 0 0 1
LTA-4A 1.75 4.19x10⁻⁴ 15500 1 2.5 1.07x10⁻⁵ 17500 1
MCM-41 14.0 1.50x10⁻⁷ 20000 0.9 20 2.20x10⁻⁷ 18000 1
MFI 2.0 3.48x10⁻⁷ 28000 1 1.9 1.80x10⁻⁵ 12000 1
MIL-53 (Al) 5.0 6.21x10⁻⁵ 12500 1 0.01 3.73x10⁻⁴ 35000 1
Mg-MOF-74 6.3 2.44x10⁻⁸ 40000 1 9.3 1.39x10⁻⁷ 24000 1
MOF-177 8.0 1.00x10⁻⁵ 12000 1 0 0 0 1
NaX 3.5 3.64x10⁻⁹ 35000 1 5.2 6.04x10⁻⁸ 35000 1
PCN-14 15.5 1.00x10⁻⁷ 25000 1 8.6 2.40x10⁻⁶ 16000 1
SWNT 3.0 1.00x10⁻⁵ 20000 1 2.0 2.40x10⁻⁹ 40000 1
UiO-66 (Zr) 23.5 1.00x10⁻¹⁰ 2000 2.1 8.6 2.40x10⁻⁶ 16000 1
ZIF-8 6.8 8.60x10⁻⁶ 12000 1 2 6.80x10⁻¹⁰ 35000 1
(b) Nitrogen
MATERIAL qA
(mmol/g) b0A
(kPa-1) EA
(kJ/mol) vA
qB (mmol/g)
b0B (kPa-1)
EB (kJ/mol)
vB
Activated Carbon
2.0 1.00x10⁻⁶ 15000 1 0.8 2.04x10⁻⁶ 16000 1
CuBTC (HKUST-1)
2.2 1.37x10⁻⁷ 24000 1 0 0 0 1
IRMOF-1 60.0 1.20x10⁻⁸ 20000 1 0 0 0 1
LTA-4A 4.2 2.00x10⁻⁵ 6500 1 0 0 0 1
MFI 6.6 7.00x10⁻⁸ 20000 1 3.8 8.00x10⁻⁸ 20000 1
MIL-53 (Al) 8.6 6.20x10⁻⁷ 15000 1 1 5.00x10⁻⁸ 10000 1
Mg-MOF-74 14.0 4.96x10⁻⁷ 17500 1 0 0 0 1
MOF-177 4.0 1.40x10⁻⁶ 15000 1 0 0 0 1

Chapter 5. Materials for CO2 capture in a TSA under process conditions
97
MATERIAL qA
(mmol/g) b0A
(kPa-1) EA
(kJ/mol) vA
qB (mmol/g)
b0B (kPa-1)
EB (kJ/mol)
vB
NaX 3.0 2.00x10⁻⁶ 12500 1 0.5 5.00x10⁻⁵ 12500 1
PCN-14 8.0 1.00x10⁻⁸ 25000 1 1.3 2.40x10⁻⁶ 16000 1
UiO-66 (Zr) 2.3 1.00x10⁻⁴ 2000 1 3.3 2.40x10⁻⁶ 15000 1
ZIF-8 4.0 1.60x10⁻⁶ 15000 1 0 0 0 1
In order to make a more realistic comparison for gas stream at temperatures
slightly over ambient conditions, Figure 5.4 shows the simulated pure gas sorption
isotherm of N2 and CO2 in the adsorbent materials as function of lower pressures and
at a temperature of 318K (i.e. 45ºC). Other simulated conditions can be found in Figure
5.5. In addition to the eleven materials simulated in this work we have included other
representative materials such as activated carbon, mesoporous silica (MCM-41) and
carbon nanotubes (SWCN) from the literature, obtained from Delgado et al. [Delgado
et al., 2014], Builes et al. [Builes et al., 2011] and Cinke et al. [Cinke et al., 2003],
respectively, and extrapolated when necessary by using the DSL-F model. In this
study, the adsorption is given in units of kmol gas per cubic meter of adsorbent, taking
into account that the different materials used in the adsorption column should not
affect its dimensions. Gravimetric comparison of carbon dioxide between different
materials over a wide range of pressures can be found elsewhere [Krishna and van
Baten, 2012; Krishna and Long, 2011].
a) Nitrogen
0
0.1
0.2
0.3
0.4
0.5
0 25 50 75 100
N2
up
tak
e (
km
ol/
m3)
Pressure (kPa)

Chapter 5. Materials for CO2 capture in a TSA under process conditions
98
b) Carbon dioxide
Figure 5.4. Comparison of simulated adsorption isotherms for (a) nitrogen and (b) carbon dioxide in selected MOFs, zeolites and other adsorbent materials selected (T = 318 K). Symbols represent the GCMC results, and the lines are guides to the eyes, obtained by the DSL-F model
(error bars are smaller than symbols).
As shown in Figure 5.4, the uptake amount of CO2 adsorbed is significantly
higher than that of N2 for all structures, with a type I isotherm shape in most of them,
indicating that these are a-priori good candidate materials for CO2/N2 separation, being
zeolite 13X (NaX) the highest carbon dioxide adsorbent, followed very closely by Mg-
MOF-74. Specifically, for Mg-MOF-74 it was observed that CO2 uptake capacity almost
doubles that of any other MOF material; it was also noted that MOF-177 showed the
lowest uptake capacity, mainly explained because of its low pore volume (Xu and
Zhong, 2010).
It was also noted that, for N2 isotherms comparison, most of the MOFs display
roughly linear plots of adsorption vs. pressure, indicating that the frameworks are not
saturated at these conditions. (Figure 5.5 shows simulated behaviors for higher
pressures).
0
1
2
3
4
5
6
7
0 25 50 75 100
CO
2u
pta
ke
(k
mo
l/m
3)
Pressure (kPa)
Mg-MOF-74 NaX LTA-4A
SWNT Cu-BTC (HKUST-1) MFI
MIL-53 (Al) PCN-14 UiO-66 (Zr)
Activated Carbon IRMOF-1 ZIF-8
MOF-177 MCM-41

Chapter 5. Materials for CO2 capture in a TSA under process conditions
99
(a) Carbon dioxide (volumetric uptake) at higher (left) and lower (right) pressures
(T=318K)
(b) Carbon dioxide (volumetric uptake) at higher (left) and lower (right) pressures (T=298K)
(c) Carbon dioxide (volumetric and gravimetric uptakes) at higher pressures (T=400K)
0
2
4
6
8
10
12
14
0 250 500 750 1000
CO
2u
pta
ke
(k
mo
l/m
3)
Pressure (kPa)
0
1
2
3
4
5
0 5 10 15
CO
2u
pta
ke
(k
mo
l/m
3)
Pressure (kPa)
0
2
4
6
8
10
12
14
0 250 500 750 1000
CO
2u
pta
ke
(k
mo
l/m
3)
Pressure (kPa)
0
1
2
3
4
5
0 5 10 15
CO
2u
pta
ke
(k
mo
l/m
3)
Pressure (kPa)
0
0.4
0.8
1.2
1.6
2
0 25 50 75 100
CO
2u
pta
ke
(k
mo
l/m
3)
Pressure (kPa)
Activated Carbon Cu-BTC (HKUST-1) IRMOF-1
LTA-4A MCM-41 MFI
MIL-53 (Al) Mg-MOF-74 MOF-177
NaX PCN-14 SWNT
UiO-66 (Zr) ZIF-8
0
0.4
0.8
1.2
1.6
2
0 25 50 75 100
CO
2u
pta
ke
(mo
l/k
g)
Pressure (kPa)
Activated Carbon Cu-BTC (HKUST-1) IRMOF-1
LTA-4A MCM-41 MFI
MIL-53 (Al) Mg-MOF-74 MOF-177
NaX PCN-14 SWNT
UiO-66 (Zr) ZIF-8

Chapter 5. Materials for CO2 capture in a TSA under process conditions
100
(d) Carbon dioxide (volumetric and gravimetric uptakes) at higher pressures (T=400K)
Figure 5.5. Comparison of simulated adsorption isotherms for carbon dioxide and nitrogen, at different conditions of pressure and temperature for 14 selected materials.
This pressure range is beneficial for zeolites like NaX and LTA-4A which more
easily attract the quadrupole structure of CO2. However, when the operating pressures
-Pt - exceed atmospheric value (pressures above 500 kPa), zeolites have lower uptake
capacities than some MOFs (see Figure 5.5). This can be rationalized as follows: the
zeolites have pore volumes of 0.25 - 0.3 cm3/g, significantly lower, for example, than
Mg-MOF-74 (0.57 cm3/g) and others. Therefore, the capacity of LTA-4A, MFI and NaX
for CO2 uptake becomes limiting for high-pressure operations. In other words, MOFs
with “open” structures are especially attractive for high-pressure separations. Mg-
MOF-74 is the most unusual MOF, because it has a combination of both high
selectivities and high capacities. This explains why MOF-74 type has shown excellent
separation performance in, for example, applications different than hydrogen
separation [Sumida et al., 2012].
In screening materials for selective uptake at low pressures, two additional
measures of adsorption must be considered: Henry’s constant (KH), a measure of the
partitioning of a gas between the gas phase and gas adsorbed onto the surface of an
adsorbent material at a constant temperature and very low pressure, and isosteric heat
of adsorption (QST), the energy released when the molecules of gas adsorb onto the
surface of the material. In order to quantitatively compare the uptakes, both values are
illustrated in Table 5.3, confirming the previous discussion and conclusions from the
evaluation of the isotherms. I this case, KH were calculated as the slope of the
adsorption isotherm in the linear region at very low pressure (generally below 15 kPa).
Although KH and QST measure two different processes, both can be thought of as the
sorbent’s affinity for gas adsorption [Vlugt et al., 2008].
0
0.5
1
1.5
2
2.5
3
3.5
4
0 250 500 750 1000
N2
up
tak
e (
km
ol/
m3)
Pressure (kPa)
Activated Carbon Cu-BTC (HKUST-1) IRMOF-1
LTA-4A MCM-41 MFI
MIL-53 (Al) Mg-MOF-74 MOF-177
NaX PCN-14 SWNT
UiO-66 (Zr) ZIF-8
0
0.5
1
1.5
2
2.5
3
3.5
4
0 250 500 750 1000
N2
up
tak
e (
km
ol/
m3)
Pressure (kPa)
Activated Carbon Cu-BTC (HKUST-1) IRMOF-1
LTA-4A MCM-41 MFI
MIL-53 (Al) Mg-MOF-74 MOF-177
NaX PCN-14 SWNT
UiO-66 (Zr) ZIF-8

Chapter 5. Materials for CO2 capture in a TSA under process conditions
101
Table 5.3. Henry’s constants (KH) and isosteric heats of adsorption (QST) from GCMC Simulations performed in this work (T = 318 K).
NITROGEN CARBON DIOXIDE
MATERIAL KH x10
3
(kmol/m3-kPa)
QST
(kJ/mol)
KH x103
(kmol/m3-kPa)
QST
(kJ/mol)
Mg-MOF-74 4.70 17.5 370.65 38.9
NaX 4.07 12.5 355.11 34.9
CuBTC (HKUST-1) 2.31 23.9 39.28 25.4
PCN-14 2.02 20.8 24.10 22.1
MFI 2.65 20.0 52.63 22.0
LTA-4A 1.55 6.6 252.62 18.2
UiO-66(Zr) 3.40 12.3 10.76 16.1
ZIF-8 1.79 14.8 5.72 15.5
MIL-53(Al) 1.61 15.0 38.41 12.5
MOF-177 0.72 15.1 3.44 12.0
IRMOF-1 0.89 20.0 6.91 10.0
The loading dependence of QST for CO2 is compared in Figure 5.6 for the
different types of simulated materials. The isosteric heats obtained for carbon dioxide,
between 10 and 40 kJ/mol, indicate physisorption phenomenon. The values are
comparable to that reported in literature [Sumida et al., 2012; Wang et al., 2002;
Cavenati et al., 2004], but considering that in this study the conditions are slightly
different.
Figure 5.6: Isosteric heat for CO2 adsorption on the selected materials as a function of uptake. Symbols are obtained from the simulations (see text for details) while lines are a guide to the
eye.
A high similarity between NaX and Mg-MOF-74 with higher energy values is
observed, while materials like MOF-177 and IRMOF-1 shown in the lower part of the
0
9
18
27
36
45
0 5 10 15
Iso
ste
ric
he
at
(kJ/
mo
l)
Uptake (kmol/m3)
Mg-MOF-74
NaX
CuBTC
MFI
PCN-14
LTA-4A
UiO-66(Zr)
ZIF-8
MIL-53(Al)
MOF-177
IRMOF-1

Chapter 5. Materials for CO2 capture in a TSA under process conditions
102
figure would be ideal materials when regeneration were needed because of their
reduced energy requirement, however their adsorption capacity is negligible compared
to the other mentioned materials. It should also be noted that the increase of the
isosteric heat in most of the materials at higher loadings is due to the fact that at these
high pressures the framework still has void regions, but there are no enough free
spaces in the framework surface and the molecules condense and strongly interact
among themselves.
In particular, it has been shown that MOFs with pore dimensions or cavities
similar in size to a particular gas, show enhanced adsorption for that gas (detailed
evaluation can be found in Babarao et al. [Babarao et al., 2011] and Liu et al. [Liu et al.,
2009]). In this case, the effect of geometry on gas adsorption can be assessed by
examining atomic density contour plots, showing the preferred location of adsorbed
gas particles. Such plots are shown in Figure 5.7 for CO2 and N2 uptake.
CuBTC IRMOF-1 Zeolite NaX
LTA-4A MFI UiO-66(Zr)
ZIF-8 Mg-MOF-74 MOF-177
Figure 5.7. Snapshots showing areas of high adsorbed CO2 density for selected materials, from
GCMC simulations at 318 K and 100 kPa.

Chapter 5. Materials for CO2 capture in a TSA under process conditions
103
As seeing in the snapshots, CO2 is preferably located close to the metals in MOFs, while
N2 occupies the larger portion of the pores, as can also be seen in zeolites with cations
like NaX and LTA-4A; conversely, for MFI-type zeolite, there are no preferred locations
found, so the competition does not depend on the difference of the nature of
interaction forces between the material and gas molecules, neither on the different
molecular diameters.
5.3.3. N2/CO2 separation selectivities
Turning now the attention on the selection of the most promising materials for
separation at lower pressures, the selectivity of the sorbent material for the gas over the
dominant component must be considered. Selectivities calculated for MOFs and
zeolites are depicted in Figure 5.8. Binary adsorption was simulated at 318K and a total
pressure of 100kPa, for a gas-phase molar composition of 14%CO2 and 86%N2.
As the gases considered here do not strongly interact with each other at low
pressures, it is reasonable to assume that the selectivities can be estimated by
considering the ratio of Henry’s constants obtained from single-component isotherms
[Dickey et al., 2012]. However, in order to determine if co-adsorption of the CO2 and N2
molecules has an impact on the amount adsorbed for the two species, we also
compared the CO2 and N2 adsorption from the GCMC binary mixture simulations and
with the adsorption from the single-component isotherms by using the equation 2.6 of
IAST method [Myers and Prausnitz, 1965], previously explained in Chapter 2. Since
using IAST to predict selectivity for a gas mixture requires accurate fits of the pure-
component isotherms, selectivities are reported using the adsorption values provided
in Tables 5.2.
Figure 5.8. Comparison of the 14%/86% CO2/N2 selectivities (T = 318 K) calculated from the IAST method (closed circles) and from a ratio of the Henry coefficients, KCO2/KN2, (open
triangles) with the selectivities from binary mixture GCMC simulations (x-axis).
0
50
100
150
200
0 50 100 150 200
Se
lect
ivit
y c
alc
ula
ted
by
IA
ST
/H
en
ry's
co
nst
an
t
Selectivity obtained by GCMC
Mg-MOF-74 NaX
MFI
MIL-53 (Al)
LTA-4A
0
5
10
15
20
0 10 20
Se
lect
ivit
y c
alc
ula
ted
by
IA
ST
/H
en
ry's
co
nst
an
t
Selectivity obtained by GCMC
UiO-66(Zr) MOF-177
IRMOF-1
CuBTC
PCN-14
ZIF-8

Chapter 5. Materials for CO2 capture in a TSA under process conditions
104
As shown in Figure 5.8, the selectivities from IAST (closed circles) show a good
agreement with those from the full mixture simulations for the large variety of
structures examined in this study under flue gas conditions, being the most diverted
the obtained for CuBTC. It can be noted that for MOFs with strongly polarizing sites,
the selectivity likely underestimate the true adsorptive selectivity of the adsorbent.
This is because in a realistic flue gas mixture, the strongest binding sites would be
predominantly occupied by CO2 owed to its greater polarizability and quadrupole
moment. Thus, single-component isotherms overestimate the adsorption of N2 and,
consequently, reduce the calculated selectivity [Maurin et al., 2005]. This can be clearly
observed in Figure 5.9.
Figure 5.8 also shows that the selectivities for different MOF materials vary by
about one order of magnitude and it can also be inferred that in IRMOF-1, the CO2 and
N2 adsorption in the mixture and single-component simulations are almost identical.
Similar behavior was observed for all MOFs, except CuBTC, where the adsorption is
slightly lower in the mixture than in the single component simulations, as previously
mentioned. Among all the porous materials, zeolite LTA-4A shows the biggest
selectivity, while NaX and Mg-MOF-74 have very similar values in the middle range,
and the rest of the MOFs show very low affinity for CO2 with respect to N2, except for
CuBTC, with a value close to 20. The specific orbital interactions of CO2 molecules with
the open Mg atoms accounts for the high selectivities offered by Mg-MOF-74
[Yazaydin et al., 2009]. Besides, one of the lowest adsorption selectivity is obtained for
MOF-177, which has the most open structure of all MOF materials considered here,
definitively not favorable for low-pressure CO2 capture.
Figure 5.9. Comparison between adsorbed CO2 compositions in the different structures as a
function of the gas stream, by using IAST (dotted lines) and GCMC simulations from this work (points).
0.001
0.01
0.1
1
0 0.2 0.4 0.6 0.8 1
YC
O2
XCO2
ZIF-8
CuBTC
NaX
Mg-MOF-74 LTA-4A

Chapter 5. Materials for CO2 capture in a TSA under process conditions
105
In order to evaluate the behavior of the selectivity with the increasing of the
temperature, several IAST calculations were performed at different temperatures. The
tendencies are shown in Figure 5.10, and as can be observed, zeolites present a decline
in the selectivity due to the loss of CO2 capacity. Instead, most of the MOFs do not
show such a decrease and in some families there is even an increase in the parameter.
Figure 5.10. CO2/N2 selectivity variation with temperature (P=100 kPa) for flue gas
composition 14%CO2/86%N2.
GCMC simulation also allow to identify the preferential adsorption sites for
each molecule. Figure 5.11 presents snapshots of selected materials to show the cloud
distribution of carbon dioxide (in red) and nitrogen (in blue) when a CO2/N2 binary
mixture is imposed to these adsorbents.
1
10
100
1000
300 350 400 450
Sele
cti
vit
y
Temperature (K)
Cu-BTC IRMOF-1 LTA-4A
MFI MIL-53 (Al) Mg-MOF-74
MOF-177 NaX PCN-14
UiO-66 (Zr) ZIF-8

Chapter 5. Materials for CO2 capture in a TSA under process conditions
106
CuBTC IRMOF-1 Zeolite NaX
LTA-4A MFI UiO-66(Zr)
ZIF-8 Mg-MOF-74 MOF-177
Figure 5.11. Contour plots showing areas of adsorbed nitrogen and carbon dioxide, from GCMC simulations at 318 K and 14%/ 86% CO2/N2 mixture at a bulk pressure of 100kPa.
5.3.4. Breakthrough calculations for TSA adsorber
Calculated breakthrough curves for a typical flue gas for coal fired power plant
to be used in a TSA process must be evaluated by taking into account engineering and
economic considerations. Based on this, a composition of 14%/86% CO2/N2, a total
pressure of 100kPa and a temperature of 318K were investigated by using GCMC
simulations, and shown in Figure 5.12. Additional different conditions (higher

Chapter 5. Materials for CO2 capture in a TSA under process conditions
107
temperatures and pressures), as well as differences between the adsorbed compositions
of CO2 obtained from IAST and GCMC, can be found in Figure 5.13.
Figure 5.12a presents a comparison of the typical breakthrough curves, where
the molar concentrations of the gas phase (CO2 is adsorbed and nitrogen pass though
the packed bed) is shown exiting the adsorber packed and maintained under
isothermal conditions at the inlet. Note that when comparing different materials, the
fractional voidage is held constant; this implies the volume of adsorbents remains the
same, so the total mass of the adsorbents used here is governed by the framework
density. The x axis is a dimensionless time, , defined by dividing the actual time, t, by
the characteristic time, L.t/u. On the basis of these calculations, the value of the
breakthrough time, break, can be determined for a specified purity of CO2 in the outlet
gas stream. When the composition in the exit gas reaches a certain desired purity level,
the adsorption cycle needs to be terminated and the contents of the bed regenerated.
Figure 5.12a shows that Mg-MOF-74 has τbreak higher than CuBTC and other MOFs
(for the combination of high selectivity and capacity), and it is even higher than the
best zeolite, NaX. These values are comparable to those reported by Mason and
coworkers [Mason et al., 2011] with a small difference in the operational conditions.
Besides, the shortest breakthrough time is obtained with MOF-177, while IRMOF-1 and
ZIF-8 have only slightly longer breakthrough times.
Additionally, a more visual comparison of the evaluated materials for the TSA
CO2/N2 separation is presented in Figure 5.12b, where the breakthrough time (before
saturation) is related to the CO2 adsorption capacity of the adsorbents in the mixture,
being the sphere diameter the selectivity of the material. As in the previous sections,
Mg-MOF-74 stands as the best individual properties for a MOF; however, a systematic
study on the cost of the regeneration as well as the influence of coexisting trace
compounds in the mixtures on the adsorption properties of CO2 is also needed before
assessing that this is the best type material for this specific process. Therefore, in the
following sections we study the effect of water traces in the behavior of the materials in
the process.

Chapter 5. Materials for CO2 capture in a TSA under process conditions
108
(a)
b)
Figure 5.12. Breakthrough calculations for TSA adsorber. (a) Breakthrough characteristics of an adsorber packed maintained at isothermal conditions. In these calculations, the partial pressures of CO2 and N2 at the inlet were taken to be P1 = 14 kPa and P2 = 86 kPa. (b) Plot of the number
of moles of CO2 captured per m3 of adsorbent material (in the 14%CO2/86%N2 mixture) against the breakthrough time for a packed bed adsorber at 318 K and total pressures of 100kPa.
For the sake of the Figure 5.13, the name of the materials are not included in the
graph. Hence, colors of the materials are as follows: MOF-177 (red), ZIF-8 (pink), UiO-
66(Zr) (dark blue), IRMOF-1 (blue, circles), MIL-53(Al) (dark green), MFI (light green),
PCN (white, triangles), LTA-4A (black), CuBTC (purple), NaX (yellow) and Mg-MOF-
74 (light blue).
0
0.5
1
1.5
2
2.5
3
3.5
0 500 1000
CO
2ca
pa
city
(k
mo
l/m
3)
Dimensionless breakthroughtime, break
Mg-MOF-74
Zeolite NaX
Cu-BTC
MOF-177
IRMOF-1
MFI
LTA-4A
PCN-14
MIL-53 (Al)

Chapter 5. Materials for CO2 capture in a TSA under process conditions
109
a) T=298K, P=100kPa b) T=318K, P=100kPa
c) T=400K, P=100kPa d) T=298K, P=1000kPa
e) T=318K, P=1000kPa f) T=400K, P=1000kPa
Figure 5.13. Breakthrough curves for selected materials at different conditions (molar composition: 14% CO2 / 86% N2).

Chapter 5. Materials for CO2 capture in a TSA under process conditions
110
5.3.4.1. Regeneration of the bed adsorber
The economics of an adsorption unit for post-combustion CO2 capture will be
determined first and foremost by the amount of CO2 captured during the adsorption
cycle, that is, during the time interval 0–τbreak; this amount can be determined from a
material balance of the discretized equations, and it is showed in Table 5.4. The CO2
capture here is expressed both in gravimetric as in volumetric units adsorbent material.
Again, we emphasize that the proper metric for comparing different crystal adsorbents
for use in an adsorption unit is on the basis of kmol captured per cubic meter of
adsorbent, because an existing adsorber will have a fixed volume. When considering
the choice of the best MOF to replace the existing adsorbent, it should be compared the
volumetric capture capacity should be compared. Thus, the relative costs of
regeneration of the bed will be largely dictated by desorption of the CO2 captured
during the time interval, 0–break.
Table 5.4. Amount of CO2 adsorbed per gravimetric and volumetric quantity of different
materials, during the interval 0–break for the binary 14%CO2/86%N2 mixture.
MATERIAL Cu-
BTC
IRMOF
-1
LTA-
4A MFI
MIL-
53(Al)
Mg-
MOF-74
MOF
-177 NaX
PCN-
14
UiO-66
(Zr)
ZIF-
8
q
(mol/kg) 0.63 0.13 1.11 0.30 0.33 3.11 0.10 1.96 0.32 0.08 0.09
q
(kmol/m3) 0.55 0.08 1.64 0.54 0.34 2.82 0.04 2.78 0.27 0.10 0.08
In consequence, for a total pressure of 100 kPa and by doing a material balance
on the adsorber, the amounts of CO2 captured during the time interval present the
following order (in terms of volumetric adsorption): Mg-MOF-74 > zeolite NaX > LTA-
4A > CuBTC > MFI > MIL-53(Al) > PCN-14 > UiO-66(Zr) > IRMOF-1 > ZIF-8 > MOF-
177. From the isosteric heats data, the values of QST are determined at these CO2
loadings to be 39.1, 34.7, 17.9, 25.6, 22.0, 12.5, 22.3, 16.2, 9.8, 15.1 and 12.0 kJ/mol,
respectively. This implies that in this case, the regeneration requirement of Mg-MOF-74
will be around 15% higher than that of the traditionally used zeolite NaX for a desired
production (besides the parasitic energies discussed by Huck and coworkers [Huck et
al., 2014]).

Chapter 5. Materials for CO2 capture in a TSA under process conditions
111
5.3.5. Water Effect
Whereas CO2 and N2 account for more than 90% of the flue gas composition
and can reach up to 99.9% before entering its final separation stage, understanding the
effects of the gases present as traces or impurities is critical to properly evaluate any
material for use in a realistic CO2 capture process.
While the primary challenge of carbon dioxide capture is the separation of CO2
and N2, a detailed study of Metal-Organic Frameworks and other adsorbent materials -
both novel and traditional- for post-combustion CO2 capture must take into account
the fact that flue gas is saturated with H2O (5-7% by volume). Although partial
dehydration of the effluent may be possible, completely drying the gas prior to
extracting CO2 is costly and most likely not feasible on such a large scale [Lee and
Sircar, 2008]. Therefore, adsorbents used in CO2 capture from flue gas must be stable in
the presence of at least some water vapor. To the best of our knowledge, there are no
direct experimental measurements of multi-component isotherms involving N2, CO2
and H2O in MOFs to date.
Indeed, small amounts of water, or other contaminant [Pacciani et al., 2011], can
significantly affect the CO2 adsorption properties of many zeolites due to its strong
adsorption on the highly hydrophilic surface, which prevents CO2 from interacting
with many of the strong adsorption sites in the material. Initial efforts at
understanding the effect of water on CO2/N2 separations in Metal-Organic
Frameworks have firstly focused on CuBTC [Li et al., 2007] and more recently in Mg-
MOF-74 [Yu and Balbuena, 2013], with encouraging results.
To assess how the choice of the best material is affected with operating
conditions, a series of GCMC simulation of ternary mixtures with different water
composition were carried out. Although the pure adsorption isotherms obtained for
water using the TIP-4P/2005 do not adjust as well as nitrogen and carbon dioxide to
the experimental data in some of the available materials found in literature [Liang et
al., 2009; DeCoste et al., 2013; Liu et al., 2010; Castillo et al., 2008; Wang et al., 2009;
Jaramillo et al., 2004] (see Figure 5.14). It should be noted that the TIP-4P/2005 is,
among the available models for water at this level of approximation, the one that best
describes the liquid-vapor density curve and the critical water conditions, capturing
what should be observed in adsorption processes when the material is saturated, and
condensation becomes important. Hence, the comparison is good enough to provide
more than qualitative trends in all cases, allowing elucidating the influence on the
process under real operating conditions.

Chapter 5. Materials for CO2 capture in a TSA under process conditions
112
CuBTC Mg-MOF-74
MOF-177 NaX
LTA-4A ZIF-8
Figure 5.14. Comparison of simulated adsorption isotherms for water with experimental data, for selected materials.
In Figure 5.15 we present the variation of calculated breakthrough curves with
the water content in the mixture. The value of break mainly decreases for the materials
with increasing water composition; this is due to limitations in the pore capacities,
being more critical in zeolites, highly hydrophilic materials. In this case, it is well-
known that the presence of water significantly decreases the adsorption of CO2 because
0
5
10
15
20
25
30
35
40
0 1 2 3 4 5
Am
ou
nt
ad
sorb
ed
(m
ol/
kg
)
Pressure (kPa)
Exp. (Liang et al.), 298K
Exp. (DeCoste et al.), 298K
Exp. (Liu et al.), 298K
Exp. (Castillo et al.), 295K
This work, 298K
Liang et al., 305K
305K
0
100
200
300
400
500
600
0 1 2 3
Am
ou
nt
ad
sorb
ed
(m
g/
g)
Pressure (kPa)
Exp. (DeCoste et al.), 313K
This work, 313K
0
2
4
6
8
10
12
0 0.2 0.4 0.6 0.8 1 1.2
Am
ou
nt
ad
sorb
ed
(w
t%)
Pressure (kPa)
Exp. (Li and Yang), 298K
This work, 298K
0
2
4
6
8
10
12
14
16
0 0.5 1 1.5 2
Am
ou
nt
ad
sorb
ed
(m
ol/
kg
)
Pressure (kPa)
Exp. (Wang et al.), 323K
This work, 323K
0
25
50
75
100
1 10 100
Am
ou
nt
ads.
(m
ole
c/u
nit
cel
l)
Pressure (kPa)
Exp (Jaramillo) 323K
This work, 323K
0
0.005
0.01
0.015
0.02
0.025
0 2 4 6
Am
ou
nt
ad
sorb
ed
(g
/g
)
Pressure (kPa)
Exp. (Canivet et al.), 298K
This work, 298K

Chapter 5. Materials for CO2 capture in a TSA under process conditions
113
water competitively adsorbs on the cations, blocking the access for CO2. Moreover, as
ZIF-8 is hydrophobic, its breakthrough time does not seem as affected as the other
materials, resulting in one with the best performances when moisture is in the mixture.
Figure 5.15. Variation of breakthrough curves with the water content as an impurity, for compositions of 0.01%, 0.1% and 1% H2O (P=100kPa, T=318 K).

Chapter 5. Materials for CO2 capture in a TSA under process conditions
114
Some of the calculated isotherms for the mixtures 0.1%H2O/14%CO2/85.9%N2
for the traditionally used zeolites NaX and LTA-4A, as well as the examined porous
frameworks Mg-MOF-74, CuBTC, ZIF-8, IRMOF-1 and MOF-177 can be found in
Figure 5.16.
Mg-MOF-74 ZIF-8
LTA-4A MFI
0.001
0.01
0.1
1
10
100
0 25 50 75 100
Ad
sorp
tio
n (
mo
l/k
g)
Pressure (kPa)
H2O CO2 N2
pure
mix
0.001
0.01
0.1
1
10
100
0 25 50 75 100
Ad
sorp
tio
n (
mo
l/k
g)
Pressure (kPa)
H2O CO2 N2
pure
mix
0.001
0.01
0.1
1
10
100
0 25 50 75 100
Ad
sorp
tio
n (
mo
l/k
g)
Pressure (kPa)
H2O CO2 N2
pure
mix
0,001
0,01
0,1
1
10
0 25 50 75 100
Ad
sorp
tio
n (
mo
l/k
g)
Pressure (kPa)
H2O CO2 N2
pure
mix

Chapter 5. Materials for CO2 capture in a TSA under process conditions
115
NaX CuBTC
IRMOF-1
MOF-177
Figure 5.16. Adsorption isotherms for pure components and in a ternary mixture with a composition of 0.1% H2O, 14% CO2, 85.9% N2 (T=318K).
To see the influence of the water content on the selectivity for the different materials,
the reader is differed to the Figure 5.17, where the dimensionless breakthrough time,
break Is also presented. For example, at a pressure of 100kPa and a water composition
0.001
0.01
0.1
1
10
100
0 25 50 75 100
Ad
sorp
tio
n (
mo
l/k
g)
Pressure (kPa)
H2O CO2 N2
pure
mix
0.001
0.01
0.1
1
10
100
0 25 50 75 100A
dso
rpti
on
(m
ol/
kg
)Pressure (kPa)
H2O CO2 N2
pure
mix
0.001
0.01
0.1
1
10
100
0 25 50 75 100
Ad
sorp
tio
n (
mo
l/k
g)
Pressure (kPa)
H2O CO2 N2
pure
mix
0.001
0.01
0.1
1
10
100
0 25 50 75 100
Ad
sorp
tio
n (
mo
l/k
g)
Pressure (kPa)
H2O CO2 N2
pure
mix

Chapter 5. Materials for CO2 capture in a TSA under process conditions
116
of 0.1%, the breakthrough times, have the following hierarchy: Mg-MOF-74 > NaX >
ZIF-8 > CuBTC > LTA-4A > MFI > MOF-177 > IRMOF-1. In other words, the decrease
in break is a reflection of the approach to pore saturation.
Figure 5.17. (up) CO2/N2 selectivity behavior for flue gas (composition 14%CO2/86%N2), variation with water content (T=318K, P=100kPa). (down) Evaluation of breakthrough time as
a function of water content in selected materials for CO2 capture (T=318 K).
5.3.6. Working Capacities
Finally, Table 5.5 summarizes different values of the working capacities for TSA
processes, including all the mixtures evaluated in this work for flue gas composition.
0
30
60
90
120
150
180S
ele
ctiv
ity
(S
CO
2/
N2
-H2
O) Dry material
0.01% water content
0
250
500
750
1000
1250
0.00% 0.01% 1.00%
B
rea
k
Water content
Mg-MOF-74 NaX LTA-4A IRMOF-1
MOF-177 ZIF-8 CuBTC MFI
PCN-14 UiO-66(Zr) MIL-53(Al)
0% 0.01% 0.1% 1%

Chapter 5. Materials for CO2 capture in a TSA under process conditions
117
The presented working capacity in TSA was calculated by the difference of CO2
adsorption capacity between 400K and 318K, at a pressure of 100kPa. The parameter
declines after water sorption in all cases, being more noticeable in zeolites as explained
before for the adsorption capacity. Other working capacities at different desorption
temperatures are provided in Figure 5.18.
Table 5.5. Summary of the working capacity (kmol/m3) of zeolites and MOF studied for TSA process under different conditions.
MATERIAL Pure CO2 Binary (GCMC)
14%CO2/86%N2 0.1% H2O 1% H2O
Mg-MOF-74 4.24 2.13 1.05 0.47
MOF-177 0.17 0.02 0.01 0.01
CuBTC 1.54 0.33 0.25 0.18
LTA-4A 1.33 0.52 0.18 0.03
IRMOF-1 0.35 0.05 0.03 0.02
ZIF-8 0.34 0.03 0.03 0.02
NaX 5.12 1.95 0.81 0.12
MFI 1.87 0.28 0.20 0.03
MIL-53(Al) 1.05 0.19 --- ---
PCN-14 1.72 0.18 --- ---
UiO-66(Zr) 0.67 0.08 --- ---
It can be observed that, although for pure-CO2 adsorption under TSA conditions, the
benchmark zeolite 13X (NaX) shows higher working capacity than Mg-MOF-74 and the
rest of materials, when it comes to water traces in the CO2/N2 mixture, Mg-MOF-74
shows around 1.3 times higher working capacity values than NaX. This ratio is
increased in the presence of more water, reaching a 3.9 ratio with 1% H2O. This
demonstrates that the Mg-MOF-74 is more appropriate for this process, in spite of
presenting slightly higher energy requirement for regeneration, and also lower CO2/N2
selectivities.

Chapter 5. Materials for CO2 capture in a TSA under process conditions
118
a)
b)
Figure 5.18. values for working capacity in selected materials under different desorption temperatures (P=100kPa, composition: 14%CO2/86%N2); b) Variation of working capacity
with moisture content as a function of material selectivity (P=100kPa, Tads=318K).
5.4. Conclusions
Eleven materials, including zeolites and several promising MOFs from different
families, were screened for their adsorption and separation behavior toward gases like
CO2 and nitrogen. A throughout study was carried out by GCMC simulation for the
0 0.5 1 1.5 2 2.5
Cu-BTC
IRMOF-1
LTA-4A
MFI
MIL-53 (Al)
Mg-MOF-74
MOF-177
NaX
PCN-14
UiO-66 (Zr)
ZIF-8
Working Capacity , TSA process (mol/kg)
wq3: 450K - 318K
wq3: 423K - 318K
wq2: 400K - 318K
wq1: 373K - 318K
1
10
100
1000
0.01 0.1 1 10
Sele
cti
vity
Working Capacity (kmol/m3)
14% CO2 / 86% N2
0.1% H2O/ 14% CO2/ 85.9% N2
Mg-MOF-74
NaXLTA-4A
CuBTC
MFIMIL-53 (Al)
PCN-14
UiO-66 (Zr)
IRMOF-1
MOF-177
ZIF-8

Chapter 5. Materials for CO2 capture in a TSA under process conditions
119
purpose of identifying key structural properties for selective adsorption from a post-
combustion stream in a TSA process. The effect of the water content on the mixtures
was also been explicitly evaluated.
After considering operating conditions and with respect to the results presented in
this chapter, Mg-MOF-74 stands up as the most promising material to be used in such
TSA processes; however, considering its current availability to large scale and from the
economic point of view, the zeolite 13X (NaX) still remains, at present, as a the
preferred candidate for the industrial process.
Besides, although CO2, N2, and H2O (the three components considered in the current
work) account for greater than 95% of the flue gas mixture, the other minor
components (mostly O2, SOx, NOx, and CO) cannot be ignored in assessing zeolites
and Metal-Organic Frameworks for post-combustion CO2 capture. Significantly, the
effects of these trace gases on the CO2/N2 separation performance of MOFs is so far
virtually unexplored. In the next chapter we address this issue for an specific MOFs, in
order to see its potential to be implemented in a post-combustion CO2 capture process.

Chapter 5. Materials for CO2 capture in a TSA under process conditions
120

121
121
6 6. EFFECT OF WATER AND IMPURITIES ON
THE ADSORPTION OF CO2 IN CUBTC AND
ZEOLITE 13X 2
2 Part of this chapter has been published in the Journal of Phys. Chem. C.

122
6.1. Background information
Physical adsorption by microporous zeolite 13X has been reported to provide
high CO2 adsorption capacity at ambient temperature, but relatively high energy
requirement for regeneration of the absorbents, especially in the presence of water
[Franchi et al., 2005, Cavenati et al., 2004]. Due to the difficulty of modifying these
materials to enhance selectivity and to regenerate them without significant heating [Ye
et al., 2013], the design and preparation of high capacity adsorbents for CO2 capture
have attracted the interests of research in advanced material and in environmental
areas.
A large number of studies have examined single-component adsorption of CO2
in MOFs, but only a limited amount of multicomponent breakthrough simulations
with MOFs have also been investigated [Krishna and Long., 2011]. It has clearly been
demonstrated through these studies that MOFs can be used for the adsorptive
separation of CO2/N2 and CO2/CH4, CH4/CO2 and CO2/CO binary mixtures, as well
as CH4/N2/CO2 ternary mixtures. Several groups [Wang et al., 2002; Millward and
Yaghi, 2005; Bourrelly, 2005] have reported MOFs with high CO2 adsorption capacity.
Among them, CuBTC [Cu3(BTC)2(H2O)3 (BTC: benzene-1,3,5-tricarboxylate)], first
reported by Chui and coworkers [Chui et al., 1999], is one of the most studied for gas
adsorption and storage. The CO2 adsorption capacities reported are in the range of 8.0
mol/kg by Wang and coworkers [Wang et al., 2002] and 10.2 mol/kg by Millward and
Yaghi at 25°C and 15 bar [Millward and Yaghi, 2005], the difference between the
studies is mainly due to slightly different structural properties of CuBTC prepared by
different methods [Yang et al., 2013]. In any case, the adsorption capacities at higher
pressures are much higher than that of the benchmark zeolite 13X. Such a high
performance for CO2 capture is mainly attributed to the stronger interaction between
exposed metal sites in the framework and CO2 molecules [Yang et al., 2007; Liang et al.,
2009]. In addition, the material could be completely regenerated under vacuum
condition which may be employed for PSA processes.
CO2 adsorption and separation processes over MOFs and zeolites have been
intensely studied by means of experimental techniques and computational simulations
in recent years, however, and in spite of the great importance from their final
implementation, the investigation of the effect of coexisting components or impurities
such as water, oxygen, sulfur compounds and other components in the flue gases has
been less explored [Yazaydin et al., 2009; Yu et al., 2012; Cychosz and Matzger, 2010;
Xiao et al., 2007]. Those impurities may significantly influence the stability and the
performance of the materials [Babarao and Jiang, 2009]. Hence, a throughout
understanding about the influence of the main components on the separation still
needs further investigation, which is one of the main objectives of the present work.

Chapter 6. Effect of impurities in CuBTC and zeolite 13X
123
As shown in Chapter 5, for practical applications, the adsorbents should not
only possess a high adsorption capacity for CO2 and high CO2 selectivity over other
species, but also exhibit good behavior under impurities and water presence. There are
few examples of published works in this respect in the last years. For instance,
Yazaydin and coworkers [Yazaydin et al., 2009] reported the CO2 uptake and its
selectivity over N2 and CH4 in the CuBTC, which significantly increased by the
presence of water molecules coordinated to open-metal sites in the framework. Also,
Liu and coworkers [Liu et al., 2010] studied adsorption equilibrium of CO2/H2O vapor
and the rates of CO2 adsorption in CuBTC and Ni/DOBDC. However, to our
knowledge, a systematic study on the effect of co-existing impurities in the mixture
behavior under operational conditions has not been performed yet. In addition, not
only high CO2 capacity, but also the resistance to flue gas components such as SO2 is
quite important for a good sorbent for industrial applications. Nevertheless, there are
very few studies available on the influence of SO2 in flue gas to MOFs structure and
CO2 adsorption performance [Xie et al., 2012; Sun et al., 2014; Liu et al., 2013].
In this chapter, we present results concerning adsorption potential for
application in CO2 adsorption separation from gas mixtures in MOF CuBTC and
zeolite 13X, evaluated by using GCMC simulations. The influence of these coexisting
species, i.e., water and SO2 in flue gas on CO2 separation was examined in detail in
order to reach a better understanding of their adsorption capacity, selectivity,
adsorption density location and isosteric heat distributions.
6.2. Methodology
6.2.1. Structures
Figure 6.1 shows the 2D projection structures for both CuBTC and 13X
materials, generated for a similar box with dimensions ~25Å (size pores of the
materials can also be seen). In the CuBTC framework, two octahedrally coordinated Cu
atoms are connected to eight oxygen atoms of tetra-carboxylate units. Each BTC ligand
holds three dimeric Cu paddle wheels that form two different microporous sites within
the framework: a system of tetrahedral-shaped cages accessible through small
windows (~3.5 Å in diameter) and large cavities connected through square shaped
windows with a diameter of ~9 Å [Krungleviciute et al., 2007]. The crystal structure of
CuBTC also includes axial oxygen atoms weakly bonded to the Cu atoms, which
correspond to water ligands. Upon removal of the guest molecules, open metal sites
(coordinatively unsaturated) are obtained. The partial positive charges on the metal
sites in CuBTC have the potential to enhance adsorption properties, , as previously

124
discussed in literature for increasing hydrogen adsorption in MOFs [Prestipino et al.,
2006].
Pore size < 6 Å 6 Å < Pore size < 8 Å Pore size > 8 Å
Pore size ~3.5 Å Pore size ~9 Å
Figure 6.1. Image of crystallographic data and pore types for CuBTC and zeolite 13X.
Zeolite 13X (Na-Faujasite), with molecular formula [Si104Al88O384]-88Na+88 is an
aluminosilicate with a Si/Al ratio = 1.18. Since crystallographic Si/Al ratio is 1.0, 8
Chapter 6. Effect of impurities in CuBTC and zeolite 13X
125
aluminium atoms have been replaced randomly by silicon atoms. Faujasites are
classified as microporous materials, with pore diameters between 6 to 12 Å. It should
be noted that most of the sodium atoms are located in pores with size diameter smaller
than 6 Å, keeping available the small pores for adsorption.
6.2.2. Simulation Details
Molecular models for the zeolite and MOF were taken from the crystallographic
data reported in literature: ccdc CuBTC reported by Chui [Chui et al., 1999], and zeolite
13X from Wang and coworkers [Wang et al., 2002]. The structures were orthogonalized
to facilitate simulations and subsequent analysis. Solvent molecules were deleted,
providing the so-called activated structures. It has been reported that only small
structural changes were observed with the removal of coordinated water molecules
after sample activation in CuBTC [Rowsell and Yaghi, 2005], so no further optimization
was required. All frameworks were treated as rigid structures with atoms fixed at their
crystallographic positions.
The Lennard-Jones parameters for zeolite 13X were taken from the force field of
Watanabe and coworkers [Watanabe et al., 1995], while for CuBTC the parameters
were taken from the DREIDING force field [Mayo et al., 1990] with UFF [Rappé et al.,
1992] parameters taken for Cu open metal sites. The charges for the CuBTC and 13X
atoms were obtained from the works of Castillo [Castillo et al., 2008] and Jaramillo
[Jaramillo and Auerbach, 1999], respectively. Parameters for the gas molecules were
taken from the literature in a transferable manner: CO2, N2 and O2 were modeled using
the TraPPE force field [Potoff et al., 2001]. Water was modeled with the TIP-4P/2005
model [Abascal and Vega, 2005], and SO2 in a similar way to carbon dioxide [Ketko et
al. 2011]. The full set of van der Waals parameters used is listed in Table 6.1 for
completeness.
GCMC simulations were performed using the Sorption code in Materials Studio
6.1 [Accelrys M.S., 2013]. The common movements and periodic boundary conditions
were used. At each chemical potential, 107 MC moves were performed to equilibrate
the system and then additional 107 MC moves were used for data collection. A cutoff
radius of 12.5Å was applied to the Lennard–Jones interactions, and the long-range
electrostatic interactions were calculated by using Ewald summation. The Lorentz–
Berthelot combining rules were used to calculate the adsorbate/framework and the
molecules Lennard–Jones crossed parameters, and the Peng-Robinson equation of state
was used to relate pressure with chemical potential.

126
Table 6.1. Force field parameters used in adsorption simulations.
Type ε0(K) σ0(Å) q(e-) Reference
Frameworks (CuBTC and Zeolite 13X) parameters
C_a 47.86 3.47 0.5035 (Mayo et al.,
1990)
[Charges: Castillo et al.,
2008]
C_b 47.86 3.47 0.1325
C_c 47.86 3.47 -0.159
H 7.65 2.85 0.159
O 48.19 3.03 -0.636
Cu 2.518 3.114 1.0 (Rappè et al.,
1992)
Al 22 2.3 1.75 (Watanabe et al., 1995)
[Charges: Jaramillo and
Aurebach, 1999]
Si 22 2.3 2.05
O-Al 58 3.6 -1.20
O-Si 53 3.3 -1.025
Na 70 2.786 1.00
Molecules parameters
N 36 3.31 -0.482
(Potoff et al., 2001)
COM N2 - - 0.964
C CO2 27 2.8 0.7
OCO2 79 3.05 -0.35
O O2 49 3.02 -0.113
COM O2 - - 0.226
S SO2 73.8 3.39 0.59 (Ketko et al., 2011) OSO2 79 3.05 -0.295
Owater 93 3.159 0 (Abascal et al.,
2005) H - - 0.5564
COM water - - -1.128
COM: Center of Mass
6.3. Results and discussion
In order to assess the accuracy of the force fields for multi-components
mixtures, the simulated isotherms were first compared with experimental gas
adsorption curves, when available. In addition, the isosteric heats of adsorption were

Chapter 6. Effect of impurities in CuBTC and zeolite 13X
127
also evaluated, as well as the selectivity for CO2. Besides post-combustion flue gas at
ambient conditions, other different scenarios were evaluated such as: flue gas at a
temperature of 400K, and air composition at 298K; both at an interval up to 10bar (i.e.
1000kPa). In order to study the structure behavior with the presence of SO2 and some
moisture, several mixtures were also evaluated.
Results are divided into three parts: simulations for pure components,
simulations for binary CO2/N2 mixtures, and evaluating the behavior of the adsorbents
for CO2 separation with the presence of impurities (either H2O, SO2, or multi-
component mixtures)
6.3.1. Adsorption isotherms of pure gases
The first step was focused on validating the force fields employed by
comparing GCMC simulation results with available experimental data at the same
conditions [Cavenati et al., 2004; Castillo et al., 2008; Yang et al., 2013; Liang et al., 2009;
Yazaydin et al., 2009; Liu et al., 2010; García-Pérez et al., 2009; Wang et al., 2009;
DeCoste et al., 2013; Küsgens et al., 2009; Gutiérrez-Sevillano et al., 2015]. For this
purpose isotherms of different gases (N2, CO2, H2O, O2 and SO2) on zeolite 13X and
CuBTC were obtained and compared with experimental data, showing good
agreement in all cases, as provided in Figure 6.2. Two special cases for CuBTC are
represented in Figure 6.3, where differences between experimental isotherms data
regarding the type of synthetization of the material are showed.
a) CuBTC (Exp comparison)
Nitrogen Oxygen
0
0.1
0.2
0.3
0.4
0.5
0.1 1 10 100
Am
ou
nt
ad
sorb
ed
(m
ol/
kg
)
Pressure (kPa)
Exp. (García-Pérez et al.), 295K
This work, 295K
0
0.05
0.1
0.15
0.2
0.25
0.3
1 10 100
Am
ou
nt
ad
sorb
ed
(m
ol/
kg
)
Pressure (kPa)
Exp. (García-Pérez et al.), 295K
This work, 295K

128
Carbon dioxide Water
b) Zeolite 13X (Exp comparison)
Nitrogen Carbon dioxide
Water
Figure 6.2. Validation of GCMC simulated adsorption isotherms in (a) CuBTC, and (b) Zeolite
13X (error bars included) versus experimental work.
However, there is some discrepancy between different sets of experimental data
for the adsorption of CO2 on CuBTC, depending on the material’s synthesis procedure
and the hydration stage. As can be observed in Figure 6.3, the simulated isotherm
0
3
6
9
12
15
0 200 400 600 800 1000
Am
ou
nt
ad
sorb
ed
(m
ol/
kg
)
Pressure (kPa)
Exp. (Liang et al.), 298K
This work, 298K
0
5
10
15
20
25
30
35
40
0 1 2 3 4 5
Am
ou
nt
ad
sorb
ed
(m
ol/
kg
)
Pressure (kPa)
Exp. (Liang et al.), 298K
Exp. (DeCoste et al.), 298K
Exp. (Liu et al.), 298K
Exp. (Castillo et al.), 295K
This work, 298K
Liang et al., 305K
305K
0
0.4
0.8
1.2
1.6
2
0 200 400 600 800 1000
Am
ou
nt
ad
sorb
ed
(m
ol/
kg
)
Pressure (kPa)
Exp. (Cavenati et al.), 298K
This work, 298K
0
1
2
3
4
5
6
7
8
0 200 400 600 800 1000
Am
ou
nt
adso
rbed
(m
ol/
kg
)
Pressure (kPa)
Exp. (Liang et al.), 298K
This work, 298K
0
2
4
6
8
10
12
14
16
0 0.5 1 1.5 2
Am
ou
nt
ad
sorb
ed
(m
ol/
kg
)
Pressure (kPa)
Exp. (Wang et al.), 323K
This work, 323K

Chapter 6. Effect of impurities in CuBTC and zeolite 13X
129
obtained in this work for CO2 is in agreement with the experimental data of Yang et al.
[Yang et al., 2008] on the material synthesized using CHCl3 at low pressures, and with
Yazaydin’s data for the dry-material [Yazaydin et al., 2009] at low-intermediate and
high pressures, as expected, since coordinated water molecules were not included in
the simulations.
Figure 6.3. Comparison of simulated and experimental isotherms for carbon dioxide in CuBTC.
Individual adsorption isotherms simulated for the five selected compounds
evaluated are provided in Figure 6.4 for both materials. The comparison of the
adsorption behavior between CuBTC and 13X is done considering 13X a benchmark for
CO2 separation by adsorption, as currently used today in some industrial processes.
Considerably different CO2 adsorption isotherm shapes are obtained in both materials
because of their different structure properties. The two materials have clear different
adsorption behavior at the same pressure: for instance, the CO2 adsorption capacity of
the CuBTC at high pressures is much larger than in the case of zeolite 13X reported at
298K and 1000kPa; however the situation is reversed for pressures close to atmospheric
conditions, where zeolite 13X shows best capacities.
It is remarkable that, even at the higher pressures evaluated, none of the
isotherms appear to be completely at the saturation point in the CuBTC. This is directly
related to the large surface area and pore volume of CuBTC accessible to the gas
molecules. As shown in Figure 6.4a, the adsorption of CO2 for CuBTC linearly
increases with pressure up to ~500 kPa, while the CO2 capacities reach saturation in the
low pressure range for zeolite 13X. This fact can be explained by the strong guest-host
interaction in zeolite 13X. However, in the MOF the CO2 sorption rapidly increases
with pressure above 100kPa due to the specific interactions between quadrupolar CO2
molecules and partial positive charges on the uncoordinated metal sites in CuBTC. It is
0
2
4
6
8
10
12
14
0 1 2 3 4 5
CO
2u
pta
ke (
mo
l/k
g)
Pressure (bar)
Exp. Yazaydin et al. (dry CuBTC)
Exp. Yazaydin et al. (hydrated 4%wt)
Exp. Liang et al.
Exp. Yang et al. (H2O as solvent)
Exp. Yang et al. (CHCl3 as solvent)
Simulated pure CO2 (this work, FF from TraPPE)
298 K
0
2
4
6
8
10
12
14
0 1 2 3 4 5
CO
2u
pta
ke (
mo
l/k
g)
Pressure (bar)
Exp. Yazaydin et al. (dry CuBTC)
Exp. Yazaydin et al. (hydrated 4%wt)
Exp. Liang et al.
Exp. Yang et al. (H2O as solvent)
Exp. Yang et al. (CHCl3 as solvent)
Simulated pure CO2 (this work, FF from TraPPE)
298 K

130
known that N2 and O2 molecules present weak interactions with zeolites and MOFs,
and this is why these structures have been extensively explored for the CO2/N2
separation, supported by their selectivity towards CO2. For example, at 100kPa, CO2
adsorbs 10-15 times more than N2 and O2 in 13X, while in CuBTC the adsorption is
about 5 times higher.
a) CuBTC
b) Zeolite 13X
Figure 6.4. Comparison of pure simulated adsorption isotherms of CO2, N2, SO2, O2, and H2O in a) CuBTC and b) zeolite 13X frameworks (lines are guide to the eyes; error bars are smaller
than symbols).
Contrary to the previously discussed compounds, water has a very marked
typical Type-I isotherm. In the low P/P0 region, the adsorption of water vapor reaches
saturation in both materials, indicating a strong guest-host interaction. It is observed
that CuBTC has a very high H2O adsorption capacity (e.g. 50 wt% at saturation
sorption). The high H2O capacities on CuBTC can be attributed to the high pore
volumes and the metal–oxide clusters present in the frameworks of CuBTC. According
to this, CuBTC and 13X are highly hydrophilic, because they retain high quantities of
water under very little pressures. Moreover, it is also interesting to note that the
materials have similar capacities for both SO2 and CO2 molecules, which originate a
competition for adsorption sites into the structure between them, being a–priori the SO2
molecules the favored ones because of the early saturation peak. This fact is of great
importance for separating CO2 from a flue gas in which traces of SO2 [Pacciani et al.,
2011] are also present.
0
5
10
15
20
25
30
35
0.01 0.1 1 10 100 1000
Am
ou
nt
ad
sorb
ed (
mo
l/k
g)
Pressure (kPa)
H2O
SO2
CO2
N2
O2
0
5
10
15
20
25
30
35
0.01 0.1 1 10 100 1000
Am
ou
nt
ad
sorb
ed
(m
ol/
kg
)
Pressure (kPa)
H2O
SO2
CO2
N2
O2

Chapter 6. Effect of impurities in CuBTC and zeolite 13X
131
6.3.2. Isosteric heat
Heats of adsorption of the compounds in CuBTC and zeolite 13X were also
calculated in this work. The isosteric heat, QST, is related to the energy released when a
molecule of gas adsorbs onto the surface of the material. For multiple molecules
adsorbed at different sites of the structure, relatively different energy values will be
obtained.
Therefore, to identify features in the adsorption in both frameworks, histograms
with the distribution profiles of the isosteric heats were calculated and are shown in
Figure 6.5 for the different gas molecules.
a) CuBTC
b) Zeolite 13X
Figure 6.5. Isosteric heat distribution profiles of pure components in (from left to right) nitrogen, carbon dioxide and water for a) CuBTC and b) zeolite 13X
It can be observed that N2 shows two different sites of adsorption in both
structures, having more affinity for intermediate pore sizes: in zeolite 13X, the N2
energy distribution plot has two peaks: the one closer to the y-axis corresponds to the
0.1 0.1 0.05
0.05
0.05 0.01

132
large pores and the second one to the intermediate pores, while in CuBTC, the two
peaks correspond to the site II and III reported by Castillo and coworkers [Castillo et
al., 2008], showing preferential adsorption at the octahedral side pockets.
For zeolite 13X, it is interesting to note that nitrogen changes the probability of
the peaks as pressure increases: at very low pressures, N2 prefers to be adsorbed in the
interstices with intermediate diameter where has greater interaction with the material
(and so more energy associated). However, when these intermediate pores are filled,
nitrogen molecules tend to locate in the larger pores until full saturation. In contrast,
CO2 and H2O have similar behavior, with nearly Gaussian curves meaning that there
are not preferential sites and is indifferent for adsorption whether small, intermediate
and large pores.
The behavior of the other gas components evaluated as well as snapshots
reinforcing the preferred sites for all molecules can be seen in Figure. 6.6 and 6.7.

Chapter 6. Effect of impurities in CuBTC and zeolite 13X
133

134
Figure 6.6. Energy distribution probability as a function of pressure for adsorption of pure components in CuBTC.

Chapter 6. Effect of impurities in CuBTC and zeolite 13X
135

136

Chapter 6. Effect of impurities in CuBTC and zeolite 13X
137
Figure 6.7. Energy distribution probability as a function of pressure for adsorption of pure components in zeolite 13X.
For CuBTC (see Figure 6.6), for example, more noticeable preference sites are
observed: nitrogen adsorption shows two sites in the histogram that do not change
substantially with increasing pressure. Meanwhile, carbon dioxide has a higher peak at
low pressures related to the octahedral side pockets, and as the pressure is increased,
the CO2 tends to stay near the copper-clusters to further achieve the Gaussian behavior
when saturation is reached. Similarly, water shows a marked tendency to adsorb
initially near the framework metals (initial points in the adsorption isotherm before the
sudden rise in capacity) and finally condenses and fills all pores.
As observed, GCMC simulations provide a series of distributions according to
the likelihood that more or less molecules may adsorb in a specific site. Therefore, in
Figure 6.8 we present the values corresponding to the highest peak of the histograms.
For CuBTC, an isosteric heat of 28kJ/mol was obtained for carbon dioxide, a value that
indicates a physisorption phenomenon. The value is comparable to that reported in
literature [Wang et al., 2002], but slightly lower than the heat of adsorption obtained
and/or reported for CO2 with zeolite 13X (40 and 45kJ/mol respectively) [Franchi et
al., 2005]. It is important to notice that the lower value for the MOF should be beneficial
for the adsorbent regeneration from the perspective of a reduced energy requirement.

138
a) CuBTC
b) Zeolite 13X
Figure 6.8. Isosteric heat patterns of (a) CuBTC and (b) zeolite 13X for the five pure components considered.
As observed in Figure 6.8, the isosteric heat for nitrogen and oxygen are lower
than for CO2, but water and SO2 have stronger interactions with the frameworks. As
mentioned before, the water isotherms show a very hydrophilic behavior typical for
zeolites, and understandable for the Cu open sites in the MOF [Yazaydin et al., 2009].
Moreover, the obtained isosteric heats of water are about 2-4 higher than CO2 and 4-6
than N2. The QST for water in CuBTC shows a peculiar behavior due to two different
reasons: the first values, the lower ones (enclosed) correspond to conditions where the
structure barely adsorbs water, while the higher ones are related to the sudden change
in adsorption capacity, where the molecules condense and strongly interact among
themselves. It should be noted that the values enclosed are in agreement with those
reported in literature at very low pressures [Castillo et al., 2008]. And finally, the N2
and O2 values show a reduction with the amount adsorbed (more marked in zeolite
13X) because the molecules adsorb in non-preferential sites as mentioned already. The
changing behaviors in isosteric heats and in adsorption isotherms regarding the
mixtures evaluated will be explained in detail in the next sections.
10
100
0.001 0.01 0.1 1 10 100
Iso
steri
c h
eat
(kJ/
mo
l)
Amount adsorbed (mol/kg)
H2O
SO2
CO2
N2
O2
10
100
0.001 0.01 0.1 1 10 100
Iso
steri
c h
eat
(kJ/
mo
l)
Amount adsorbed (mol/kg)
H2O
SO2
CO2
N2
O2

Chapter 6. Effect of impurities in CuBTC and zeolite 13X
139
6.3.3. CO2/N2 binary mixtures
Figure 6.9 depicts a comparison between the isosteric heat distributions of the
molecules in both materials for the pure compounds and the adsorption behavior in a
binary 15%CO2/85%N2 mixture (for flue gas composition at 298K). A close look at the
binary mixtures in the zeolite 13X reveals that, when nitrogen molecules compete with
CO2 for the intermediate sites, carbon dioxide displaces the nitrogen molecules and
adsorbs in large pores, leading to a decrease in the isosteric heat (as mentioned above,
but for pressure increasing). On the contrary, CO2 is not so affected by the presence of
nitrogen and adsorbs on its preferred sites because of its higher interaction with the
structure compared to N2.
a) CuBTC b) Zeolite 13X
Figure 6.9. Isosteric heat distribution profiles (top) and adsorption curves (bottom) for pure (dashed lines) and 15% CO2/85%N2 mixtures (full line and symbols) in a) CuBTC and b)
zeolite 13X at 298K.
0
0.2
0.4
0.6
0.8
1
0
1
0 20 40 60
Pro
bab
ilit
y d
istr
ibu
tio
n
Isosteric heat (kJ/mol)
0.1
N2
CO2
pure
mix
0
0.2
0.4
0.6
0.8
1
0
1
0 20 40 60
Pro
bab
ilit
y d
istr
ibu
tio
n
Isosteric heat (kJ/mol)
N2
CO2
pure
mix
0.1
0.001
0.01
0.1
1
10
1 10 100 1000
Ad
sorp
tio
n (
mo
l/k
g)
Pressure (kPa)
CO2
N2
pure
mix
0.001
0.01
0.1
1
10
1 10 100 1000
Ad
sorp
tio
n (
mo
l/k
g)
Pressure (kPa)
CO2
N2pure
mix
CO2 (CuBTC 4%wt H2O, Yu et al, 2012)

140
A completely different behavior is shown by the CO2 adsorption in CuBTC,
where more targeted adsorption sites are observed: an initial plateau (close to the
metals), within the middle size pores, corresponding to the highest peak at 25kJ/mol,
and a second peak located at higher isosteric heat values corresponds to adsorption of
CO2 in the channels of small pores.
In order to assess differences in operating conditions, three conditions have
been evaluated: the typical flue gas (i.e., 15/85 CO2/N2) at 298K, a high temperature
flue gas, at 400K (i.e., the conditions at the chimney), and air gas at 298K with a
concentration about 500 ppm of CO2 (the results are provided in Figures 6.10 and 6.11).
Although air and flue gas present more components, the first assessment for CO2
separation will come from the CO2/N2 mixture study.
a) N2/CO2, 298K air condition (99.95%N2/0.05%CO2)
b) N2/CO2 400K flue gas (85%N2/15%CO2)
Figure 6.10. Isosteric heat distribution profiles (P=100kPa) and adsorption isotherms for binary mixtures of N2/CO2 at different conditions in CuBTC.
0
1
0 20 40 60
Pro
bab
ilit
y d
istr
ibu
tio
n
Isosteric heat (kJ/mol)
N2
CO2
0.1
pure
mix
0.0001
0.001
0.01
0.1
1
10
0 25 50 75 100
Ad
sorp
tio
n (
mo
l/k
g)
Pressure (kPa)
CO2
N2
pure
mix
0
1
0 20 40 60
Pro
bab
ilit
y d
istr
ibu
tio
n
Isosteric heat (kJ/mol)
N2
CO2
0.1pure
mix
0.001
0.01
0.1
1
10
0 25 50 75 100
Ad
sorp
tio
n (
mo
l/k
g)
Pressure (kPa)
CO2
N2
pure
mix

Chapter 6. Effect of impurities in CuBTC and zeolite 13X
141
At air conditions, the percentage of adsorption of N2 is higher than that obtained
for CO2, caused by the extremely low concentration of CO2 in the modeled air (i.e.,
0.05%). The opposite behavior was found in flue gas conditions at 400K, where the
adsorbed percentages have reversed. It is also noted that when the temperature rises,
the percentage of CO2 decreases, showing a typical physisorption behavior; this is
because CO2 interactions become weaker and hence the material selectivity is reduced.
a) N2/CO2, 298K air condition (99.95%N2/0.05%CO2)
b) N2/CO2 400K flue gas (85%N2/15%CO2)
Figure 6.11. Isosteric heat distribution profiles (P=100kPa) and adsorption isotherms of binary mixtures N2/CO2 at different conditions in zeolite 13X.
The selectivity of different mixtures in an interval of 1-100kPa was also
calculated in order to assess the effect of the different conditions on the adsorption
behavior. Results are depicted in Figure 6.12 where it can be observed that CuBTC
0
1
0 20 40 60
Pro
bab
ilit
y d
istr
ibu
tio
n
Isosteric heat (kJ/mol)
N2 CO2
pure
mix
0.1
0
1
0 20 40 60
Pro
bab
ilit
y d
istr
ibu
tio
n
Isosteric heat (kJ/mol)
N2CO2
pure
mix
0.1
0.001
0.01
0.1
1
10
0 25 50 75 100
Ad
sorp
tio
n (
mo
l/k
g)
Pressure (kPa)
CO2
N2
pure
mix
0.0001
0.001
0.01
0.1
1
10
0 25 50 75 100
Ad
sorp
tio
n (
mo
l/k
g)
Pressure (kPa)
CO2
N2
pure
mix

142
presents values one order of magnitude lower than zeolite 13X: CuBTC shows lower
selectivity of CO2 than zeolite 13X at the three explored conditions because of the
relatively low heat of CO2 adsorption. In addition, zeolite 13X selectivity towards CO2
slightly decreases with increasing pressure whereas in the case of CuBTC is essentially
unchanged. However, the presence of impurities dictates whether the material is
appropriate or not for such separations. The lower selectivity for CO2 from flue gas at
400K with respect to that obtained at 298K is observed in both materials.
a) CuBTC b) Zeolite 13X
Figure 6.12. Selectivity for different CO2/N2 conditions in a) CuBTC and b) zeolite 13X: circles (green) represent simplified air composition at 298K (N2 with 500ppm of CO2); squares (blue),
flue gas composition (15%/85% CO2/N2) at 298K, and diamonds (light blue), flue gas composition (15%/85% CO2/N2) at 400K.
For practical applications it is also necessary to investigate the CO2 adsorption
behavior in the presence of water and impurities, because flue gas contains water
vapor and small amounts of other gases such as SO2 which compete for the adsorption
onto the material. Since the adsorption properties may be drastically affected by the
presence of some compounds, studies on the adsorption behavior or possible
“poisoning” of the material are important and they need to be assessed before the
material reaches the final application. According to this, a systematic study on the
influence of coexisting trace compounds in the mixtures on the adsorption properties
of CO2 in CuBTC and zeolite 13X is also presented here.
6.3.4. Influence of water on the adsorption behavior
Once the binary mixtures of gases were studied in detail, the effect of the
presence of water (moisture) on the adsorption properties was evaluated for both
structures at flue gas conditions; note that these simulations do not use coordinated
1
10
100
0 25 50 75 100
Sel
ecti
vity
(S
CO
2/
N2)
Pressure (kPa)
Air, 298K Flue gas, 298K Flue gas, 400K
1
10
100
0 25 50 75 100
Sel
ecti
vity
(S
CO
2/
N2)
Pressure (kPa)

Chapter 6. Effect of impurities in CuBTC and zeolite 13X
143
waters into the structures, as done in previous studies [Castillo et al., 2008; Krishna and
Long, 2011]. Initial studies, not included in this work, revealed that the exclusion of
these coordinated waters plays an important role at low pressures, while at
atmospheric conditions these interactions are small, being more important those
coming from uncoordinated waters. This fact should be a good approximation since
when dealing with real processes, the structure would be completely dried after
regeneration.
Figure 6.13 presents the adsorption sites preferences for the different
components in the CO2/N2/H2O mixture compared to those in the pure state. In this
case, simulations were carried out at 298K, and for different H2O compositions: 1%,
0.1%, 0.01% and 0.001%. For the sake of clarity only those for 1% and 0.001% H2O are
provided.
a) CuBTC
1% H2O (15% CO2, 84% N2):
0.001
0.01
0.1
1
10
100
0 25 50 75 100
Ad
sorp
tio
n (
mo
l/k
g)
Pressure (kPa)
H2O
CO2
N2
pure
mix
0
0.2
0.4
0.6
0.8
1
0 25 50 75 100
Ad
sorb
ed
mo
lar
fracti
on
Pressure (kPa)
H2O
CO2N2
1
10
100
1000
0 25 50 75 100
Sel
ecti
vity
(SC
O2/
N2)
Pressure (kPa)

144
0.001% H2O (15% CO2, 84.999% N2):
b) Zeolite 13X
1% H2O (15% CO2, 84% N2):
0
1
0 20 40 60 80 100 120
Pro
bab
ilit
y d
istr
ibu
tio
n
Isosteric heat (kJ/mol)
0.1
CO2
pure
mix
H2O
N2
0.001
0.01
0.1
1
10
100
0 25 50 75 100
Ads
orpt
ion
(mol
/kg)
Pressure (kPa)
H2O
CO2
N2
pure
mix
0
0.2
0.4
0.6
0.8
1
0 25 50 75 100Ad
sorb
ed
mo
lar
fracti
on
Pressure (kPa)
H2O
N2 CO2
1
10
100
1000
0 25 50 75 100
Sele
cti
vit
y (S
CO
2/
N2)
Pressure (kPa)

Chapter 6. Effect of impurities in CuBTC and zeolite 13X
145
0.001% H2O (15% CO2, 84.999% N2):
Figure 6.13. Adsorption isotherms, isosteric heat distribution profiles and representative adsorption sites snapshots in the different mixtures at 100kPa, for pure and two ternary
CO2/N2/H2O mixtures in a) CuBTC and b) zeolite 13X.
For zeolites it is well-known that the presence of water significantly decreases
the adsorption of CO2 in these materials because water competitively adsorbs on the
cations, blocking access for CO2 (see Chapter 5 of this Thesis). In Figure 6.13, the first
snapshot from 13X represents a mixture with 1% of water, and shows that the zeolite
becomes fully filled with water. There is a small adsorption of CO2 and N2 in specific
0
1
0 20 40 60 80 100 120
Pro
b. d
istr
ibu
tio
n
Isosteric heat (kJ/mol)
0.1
N2 CO2
H2O
pure
mix
0.001
0.01
0.1
1
10
100
0 25 50 75 100
Ad
sorp
tio
n (
mo
l/k
g)
Pressure (kPa)
H2O
CO2
N2
pure
mix
0
1
0 20 40 60 80 100 120
Pro
b. d
istr
ibu
tio
n
Isosteric heat (kJ/mol)
0.1
N2
CO2H2O
pure
mix

146
zones, where the zeolite attraction strongest (also observed in the energy adsorption
distribution plot where sharp distributions are obtained). As the amount of water is
reduced, the adsorbed CO2 increases. This fact allows that N2 and CO2 adsorb in lower
energy zones since there is no more water available to fill them up. A displacement of
the maximum respect the pure isotherms to lower energies is observed, and in the case
of N2, where the two sites of adsorption are differentiated, a shift in the maximum peak
is also observed. At the lower water composition (0.001% H2O) CO2 can compete
against water, then the CO2 energy distribution is similar to the pure component and
water molecules are displaced to occupy lower energy sites as N2.
For CuBTC, very strong preference for site I (region close to the Cu metal centers) is
found for water. As shown, CuBTC exposed to the mixture with 1% water content
shows no significant peak change from snapshots patterns, which indicates that the
CuBTC framework can be well maintained in the presence of moisture.
It is generally accepted that the presence of coordinatively unsaturated metal sites in
MOFs can enhance the separation of CO2 since it can coordinate to the metal clusters.
But, in addition, such unsaturated sites can also coordinate with water and other
molecules [Yu et al., 2012; Liu et al., 2010]. For instance, Yazaydin and coworkers
showed that the presence of 4%wt coordinated water in the CuBTC framework can
enhance CO2 capture capacity and selectivity over N2 [Yazaydin et al., 2009]. Initial
studies (see Figure 6.14) revealed that the exclusion of these coordinated waters plays
an important role at low pressures, while at atmospheric conditions these interactions
are small, being more important those coming from uncoordinated waters.
Figure 6.14. Adsorption isotherms for water and carbon dioxide in CuBTC, showing the difference between a dry framework and one with 4%wt of coordinated water.
It is interesting to see that for 1% H2O in CuBTC, the adsorption isotherm of CO2
shows a slightly increase after 80kPa, as depicted in Figure 6.15. As mentioned by
Castillo and coworkers [Castillo et al., 2008], the strong interactions between the
quadrupole moment of CO2 and the electric field created by water molecules are
0
2
4
6
8
10
12
14
16
0 50 100 150 200
Up
tak
e (
mo
l/k
g)
P (kPa)
H2O
4%wt
"dry"
0
0.5
1
1.5
2
2.5
0 50 100 150 200
Up
tak
e (
mo
l/k
g)
P (kPa)
CO2
4%wt
"dry"

Chapter 6. Effect of impurities in CuBTC and zeolite 13X
147
responsible for the enhanced CO2 uptake. Nevertheless, the enhanced selectivity
induced by uncoordinated water in the flue gas results in competition sites between
water and CO2: with more water molecules adsorbed at higher pressures, the
competition would lead to the decrease of the CO2 adsorption capacity.
From first look at the pure isotherms of water it may be inferred that there is higher
free volume available at CuBTC, however, when the zeolite is exposed to 0.01%H2O, its
CO2 adsorption capacity significantly decreases from 3 to 1.5 mol/kg at 100kPa (Figure
6.13b), and at a water composition of 0.1% the material is completely useless for CO2
separation: water precludes any adsorption of CO2 and N2 on this type of zeolite. Only
at a concentration of 0.001% of water, the molar composition of carbon dioxide inside
the materials is greater than water at 100kPa, showing that adsorption of CO2 can
compete with H2O. This is attributed to stronger interactions between water and zeolite
13X than those for the CuBTC. As H2O molecules are pre-adsorbed in the pores, the
CO2 capacity decreases with the decrease of adsorption sites on the porous surface.
Figure 6.15. Adsorption isotherms for pure and 15%CO2 / 84%N2 / 1%H2O mixtures in CuBTC
6.3.5. Other impurities
Moreover, the influence of flue gas components such as SO2 and O2 (besides
water) on the CO2 capacity of the adsorbent should be considered before the material is
0.001
0.01
0.1
1
10
100
1 10 100 1000
Ad
sorp
tio
n (
mo
l/k
g)
Pressure (kPa)
H2O
CO2
N2
pure
mix

148
designed for its final industrial applications. Therefore, the adsorbents should keep
their CO2 adsorption capacity (or similar) than in the absence of these impurities,
indicating that they are adequate materials for these type of conditions.
Typically, in a flue gas the concentration of water, O2 and SO2 in volume are 5-
8%, 3-5%, and 500-1500 ppm, respectively [Granite et al., 2002]. Therefore, we have
studied the behavior of CuBTC compared to zeolite 13X upon CO2 capture for ternary
and 5-component mixtures, including impurities that can be found in a real typical
operation conditions.
6.3.5.1. Ternary mixtures CO2/N2/SO2 (0.2% SO2)
In these simulations, the behavior of CuBTC and 13X were first tested with SO2.
Figure 6.16 shows the behavior under a relatively large quantity of SO2, 2000ppm,
which rarely can be found in a real flue gas streams. We have used this high
concentration to magnify the effect of this impurity for assessing its effect.
The results show that CuBTC and zeolite 13X maintain their adsorptive
properties in the presence of small quantities of SO2. In zeolite 13X, nitrogen changes
the adsorption site location, while CO2 competes with the SO2 molecules for the same
type of site. The adsorbed amount slightly decreases with respect to the binary original
mixture, while almost an equimolar composition inside the framework is observed.
a) CuBTC
0.001
0.01
0.1
1
10
0 25 50 75 100
Ad
sorp
tio
n (
mo
l/k
g)
Pressure (kPa)
SO2
CO2
N2
pure
mix
0
1
0 20 40 60 80 100 120
Pro
b. d
istr
ibu
tio
n
Isosteric heat (kJ/mol)
0.1
N2
CO2
SO2
pure
mix
0
0.2
0.4
0.6
0.8
1
0 25 50 75 100
Ad
sorb
ed
mo
lar
fracti
on
Pressure (kPa)
SO2
N2
CO2

Chapter 6. Effect of impurities in CuBTC and zeolite 13X
149
b) Zeolite 13X
Figure 6.16. Adsorption isotherms, isosteric heat distribution profiles and adsorbed molar fraction for pure and 15%CO2/84.8%N2/0.2%SO2 mixtures at 298K in a) CuBTC and b)
zeolite 13X.
In CuBTC, the amount of SO2 adsorbed is less than in zeolite 13X, and the molar
fraction in the framework barely reaches 20%. In this material, SO2 presents a radical
change in energy distribution that can be explained for competition with CO2, being
the MOF more attractive to the latter; in fact, the CO2 adsorption is similar than that
obtained for binary mixtures (SO2 molecules are placed in the small pores).
6.3.5.2. 5-component mixture
Finally, in order to explicitly quantify the computing effects on different gases
in the preferential adsorption, we have performed a simulation study of multi-
component system with the aim to elucidate the behavior in a real stream of post-
combustion. Figure 6.17 represents the isosteric heat probability distribution of
adsorption in a multi-component mixture (15%CO2 / 78.8%N2 / 5%O2 / 0.2%SO2 /
1%H2O) and the molecules density/location snapshots in both materials.
Results obtained from the simulations allow a molecular explanation of the
competing adsorption phenomena. In this case, it is obvious that water is the main
component being adsorbed, especially in the zeolite 13X, with very similar behavior
than those obtained for ternary CO2/N2/H2O mixtures with 1% of water. The CO2/N2
0.001
0.01
0.1
1
10
0 25 50 75 100
Ad
sorp
tio
n (
mo
l/k
g)
Pressure (kPa)
SO2
CO2
N2
pure
mix
0
1
0 20 40 60 80 100 120
Pro
b. d
istr
ibu
tio
n
Isosteric heat (kJ/mol)
0.1
N2
CO2 SO2
pure
mix
0
0.2
0.4
0.6
0.8
1
0 25 50 75 100A
dso
rbed
mo
lar
fracti
on
Pressure (kPa)
N2
CO2
SO2

150
selectivity does not change much even with relatively high concentrations of O2 in the
flue gas and it presents a similar behavior than nitrogen. These results are in agreement
with those found by Yu and coworkers in a related study [Yu et al., 2012]. Hence,
oxygen and SO2 impurities do not play a main role in this separation, although in
CuBTC, SO2 tends to compete with CO2 for adsorption sites, reducing the amount
adsorbed of both components.
Moreover, it is interesting to note that the probability curve for CO2 in CuBTC moves
slightly to the right (to higher energy values), which means the improved adsorption
by the presence of water, while in the zeolite the curve shifts to the left (i.e. lower
isosteric heat values). Likewise, SO2 presents a similar behavior but in the opposite
directions: the peak value of the isosteric heat is increased for the zeolite while
decreases for the MOF.
a) CuBTC
b) Zeolite 13X
Figure 6.17. Isosteric heat distribution profiles of pure compounds and multi-component mixture (15%CO2/78.8%N2/5%O2/1%H2O/0.2%SO2) in a) CuBTC and b) 13X; with snapshot
showing the preferential location of the different molecules [P=100kPa, T=298K].
0
0.2
0.4
0.6
0.8
1
0
1
0 40 80 120
Pro
bab
ilit
y d
istr
ibu
tio
n
Isosteric heat (kJ/mol)
0.1
CO
2H2O
SO2
pure
mix
O2
N2
0
0.2
0.4
0.6
0.8
1
0
1
0 40 80 120
Pro
bab
ilit
y d
istr
ibu
tio
n
Isosteric heat (kJ/mol)
0.1
CO
2
H2
O
SO2
pure
mixO2
N2

Chapter 6. Effect of impurities in CuBTC and zeolite 13X
151
As a final point, the selectivity of the different mixtures was calculated in order to
assess the effect of the different conditions on the adsorption behavior. Results are
depicted in Figure 6.18 where it can be observed that CuBTC presents values one order
of magnitude lower than zeolite 13X: CuBTC shows lower selectivity of CO2 than
zeolite 13X at the explored conditions because of the relatively low heat of CO2
adsorption. However, the presence of impurities affects more forcefully the zeolite than
the MOF CuBTC, being the mixture with 1% of water the closest to that in the faujasite.
Figure 6.18. CO2/N2 selectivity for different compositions in CuBTC and zeolite 13X [P=100KPa, T=298K].
A slightly higher CO2/N2 selectivity of the ternary and 5-component mixtures were
observed compared to that in a binary and ternary-water mixtures respectively,
especially at high pressures, due to the strong SO2 binding with the frameworks.
6.3.6. Implications for the application in a VSA, PSA
or TSA process
As performed in Chapter 5, we calculate the working capacity of both materials
at operating conditions Table 6.2 summarizes the different values for Vacuum Swing
Adsorption (VSA), Pressure Swing Adsorption (PSA) or Temperature Swing
Adsorption (TSA) processes, including all the mixtures evaluated in this work for flue
gas composition. The working capacity in PSA and VSA cases was calculated by the
1 10 100 1000
1 10 100 1000
N2/CO2 298K air
N2/CO2 400K flue
N2/CO2 298K flue
1% H2O
0.1% H2O
0.01% H2O
0.001% H2O
0.2% SO2
5-mix
Zeolite 13X CuBTC

152
difference of CO2 adsorption capacity between 1 and 10bar, and 1 and 0.15bar,
respectively, at 298K, while in TSA case was calculated by the difference between 400K
and 298K at 100kPa.
Table 6.2. Summary of the working capacity of zeolite 13X and CuBTC for VSA/PSA/PSA
processes. See text for details.
Zeolite 13X:
Working capacity
(mol/kg) Pure Binary 1% H2O 0.001% H2O 0.2% SO2 5-mix
PSA 1.38 1.13 0.002 0.78 0.62 0.002
VSA 2.49 2.01 0.005 1.41 1.12 0.003
TSA --- 2.81 --- --- --- ---
CuBTC:
Working capacity
(mol/kg) Pure Binary 1% H2O 0.001% H2O 0.2% SO2 5-mix
PSA 8.78 1.78 3.16 2.35 1.61 3.59
VSA 2.61 0.53 0.94 --- 0.48 1.07
TSA --- 0.58 --- --- --- ---
CuBTC shows much higher working capacity than the benchmark zeolite 13X in
PSA in the presence of impurities, with lower energy requirement for regeneration, but
also lower CO2/N2 selectivities. The CO2 adsorption capacity declines after water
sorption in both cases, being more noticeable in zeolite 13X. In addition, it is also clear
that vacuum is inefficient for desorption of CO2 from Cu active sites.
6.4. Conclusions
CuBTC and Zeolite 13X were evaluated in order to assess and compare their
performance for CO2 separation from N2 in the presence of impurities, including SO2
and H2O, providing molecular insights into the competing adsorption phenomena.
Results reveal that a very little amount of uncoordinated water molecules
induce an improvement on CO2 capture in, while zeolite 13X became useless with less
than 1% of water. As a consequence, zeolite 13X is not suitable for the adsorption of

Chapter 6. Effect of impurities in CuBTC and zeolite 13X
153
CO2 without a previous proper dehumidification process, because just a 0.01% of
moisture in the adsorbent is able to significantly reduce the adsorption capacity of CO2.
By comparing CO2 selectivity for different mixtures, it was found that even
with a concentration of SO2 in the flue gas as high as 2000ppm, the selectivity in the
flue gas mixtures remains essentially unaffected; there was only a slightly lower
adsorption, attributed to the decrease of CO2 adsorption with the introduction of SO2
in flue gas (sites competition).

154

155
155
7 7. GCMC SIMULATIONS OF ADSORPTION
ON KAOLINITE AND CHABAZITE3
3 Part of this chapter has been published in Langmuir

Chapter 7. GCMC simulations of adsorption on kaolinite and chabazite
156
7.1. Introduction
Clay minerals (aluminosilicates) are frequently used in many industrial and
natural processes due to their interesting physico-chemical properties. Kaolinite (i.e.,
Si4Al4O10(OH)8), is a non-expansive phyllosilicate composed of plate-like structures. In
Figure 7.1 is shown the kaolinite and chabazite natural minerals.
Chabazite kaolinite
Figure 7.1. Chabazite and kaolinite minerals
As kaolinite is the main constituent of kaolin, is cheap and abundant in nature
with external surfaces of octahedral alumina and tetrahedral silica faced and held
together by hydrogen bonds. The important role played in industry is demonstrated by
the increasing amount of kaolin produced per year. In the side of natural processes, the
aerosolized mineral dust is another source of clay minerals directly expelled to the
atmosphere. The dust is basically produced from arid zones (e.g., Sahara desert, Asian
dust storms . . . ) and it is formed by quartz and mineral clays and in a lower extent by
feldspar, carbonates, sulfates and metal oxides.
Such a huge quantity of mineral dust present in the atmosphere along with the
ability of clay minerals to take up water can influence atmospheric composition, cloud
formation, visibility, climate as well as human health. A proof of this importance is the
high number of theoretical studies for water interaction in zeolites at different
pressures and mainly at 235 and 298 K. Moreover, experimental studies have reported
adsorption isotherms of water adsorption on kaolinite at temperatures of 296 and 298
K by means of Horizontal ATR- or ATR-FTIR.

Chapter 7. GCMC simulations of adsorption on kaolinite and chabazite
157
We have focused on reproducing the experimental adsorption isotherm at 298 K
and obtain new isotherms at other temperatures since the problem we want to solve is
mainly focused on outgoing gas flows that need to be processed by adsorbent materials
to capture CO2, but water presence can make useless the adsorbent material since they
use to be highly hydrophilic. A previous treatment of gas flow with kaolinite could be
enough to ensure the dehydration of the current flow and thus efficiently reach the
CO2 capture process increasing the efficiency of the entire process.
7.2. Methodology
Accelrys Materials Studio modeling package [Accelrys M.S., 2013] was used to
obtain crystallographic structures and the adsorption isotherms in a wide interval of
pressures and at different temperatures via GCMC method. The force field used to
simulate kaolinite structure was CLAYFF, a general Force Field developed by Cygan et
al. suitable for the simulation of hydrated aluminosilicates and their interfaces with
aqueous solutions. In addition, and as in previous chapters, the TIP4P- 2005 model was
used to represent the water-water and water-lattice interactions since it is considered
probably the best description of water that can be achieved with a single Lennard-
Jones (LJ) site and three charges. This Force field proposes a dummy site as a carrier of
the negative charge located on the H-O-H bisector at a distance of 0.1546 A from O
atom. The angle H-O-H corresponds to 104.52°, and the O-H distances are 0.9572Å. In
order to describe the crossed interactions, the Lorentz and Berthelot rules were used.
The bulk structure of kaolinite used corresponds to a triclinic P1 space group
with cell parameters a=5.149Å, b=8.934Å and c=7.384Å, cell angles =91.93=105.04°
and =89.79° and interlayer distance of 2.05Å. The interlayer distance points out the
presence of hydrogen bonds between the hydroxyl groups on the Al-terminated
surface and bridging oxygen atoms on the Si-terminated surface. This fact makes the
layers practically inseparable and confers kaolinite nonexpanding or non-swelling
properties. The charges, that ensure the neutrality of the simulation box, and the non-
bonded interaction parameters used in this study are listed in Table 7.1. The study is
performed on the hydroxylated surface since previous studies determined this
termination as the most favorable energetically. The 3D simulation box (see Figure 7.2)
contains a total of 1088 atoms and it is constructed stacking two pairs of kaolinite (001)
layers separated by a vacuum of 30Å (in z direction) to avoid interactions between both
pairs of layers and also to improve the statistics. The simulation box dimensions were
20.60Å, 17.87 Å and 160 Å, respectively. These values correspond to a 4x2x2 supercell
in both top and bottom layers, plus an intermediate space of 30Å used for locating
inside the water reservoir that interacts with both hydroxylated layers. The kaolinite

Chapter 7. GCMC simulations of adsorption on kaolinite and chabazite
158
layers was periodic in x and y dimensions but truncated in z. In order to avoid
unphysical fields originated from arbitrary truncation in z direction the top layers were
exactly the mirror image of the bottom ones. Finally, the long-range interactions were
calculated by means of 3D Ewald method leaving an empty space of 100Å enough to
prevent interactions in the z direction between top and bottom layers. The LJ and real
space interactions were cut off at half of the length of the x side of the simulation cell.
Table 7.1. Non-bond parameters for the CLAYFF and TIP4P/2005 FF.
CLAYFF (kaolinite)
species symbol charge(e) D0 (kcal/mol)
R0(Å)
Hydroxyl hydrogen
ho 0.4250
Hydroxyl oxygen
oh -0.950 0.1554 3.5532
Bridging oxygen
ob -1.050 0.1554 3.5532
Tetrahedral silicon
st 2.100 1.8405e-6 3.7064
Octahedral aluminum
ao 1.5750 1.3298e-6 4.7943
TIP4P/2005 (water)
species symbol charge(e) D0 (kcal/mol)
R0(Å)
Water hydrogen
h* 0.5564
Water oxygen o* 0.0000 0.1852 3.5457
Dummy M -1.113
Figure 7.3 shows the top view of a single Al-terminated layer of kaolinite
highlighting the unit cell area. Since the different adsorption amount of water can be
understood with the help of sites of adsorption it is convenient to separate this area in
six small ones, namely A-F, that correspond to the different sites of adsorption
characterized by the total surface area and charge associated to each one. Thus, the
surface areas are 8.38, 6.88, 7.88, 8.02, 6.98 and 7.90 Å2 for A-F sites and the total charge
associated to each site corresponds to 0.1, -1.2, -1.4, 1.1, 0.4 and 0.1 e- for A, B, C, D, E
and F sites, respectively.

Chapter 7. GCMC simulations of adsorption on kaolinite and chabazite
159
Figure 7.2. Simulation cell used (left) and detail of the two kaolinite layers faced. The adsorption of water is restricted to the volume in between both pairs of layers.
Figure 7.3. Top view of a single layer of kaolinite surface. The black lines fence the unit cell and the different sites are labeled as A-F. Also the distances between outermost hydrogen atoms that belong to hydroxyl groups are indicated. Atoms color as labeled in Fig. 1 although the outermost
hydrogen atoms are depicted in blue for convenience.

Chapter 7. GCMC simulations of adsorption on kaolinite and chabazite
160
The simulations were carried out employing the GCMC method. The
acceptance rate for insertion and deletion steps was 0.01%, and the maximum size of
the displacement steps was regulated to give an acceptance rate of 50%. The systems
were firstly equilibrated during 5x10⁷ MC steps. Hence, production stage was
performed during 2x10⁸ MC steps to obtain converged energy distributions, water
content and density profiles. This procedure was repeated for a wide range of
pressures and at different temperatures in order to get the adsorption isotherms.
7.3. Results and Discussion
From GCMC simulations we have obtained the loadings of water that were
transformed conveniently into RH using vapor pressure of water at the temperatures
explored through. Table 7.2 shows the saturation vapor pressures for water at the
selected temperatures where the isotherm was simulated from Wagner equation (Eq.
3).
lnPvp
Pc
æ
èçö
ø÷= 1- t( )-1
at + bt1.5 + ct3 + dt6éë ùû (7.1)
with: t =1- T
Tc( )
.
Critical variables (i.e., Tc and Pc) are also listed in Table 7.2.
Table 7.2. Saturation Vapor Pressure (Pvp) of Water from Wagner Equation.
T(K) Pvp(kPa) Wagner constants Critical values
283.15 1.23 a -7.7645 Tc (K) 647.3
298.15 3.17 b 1.4584 Pc (kPa) 22120
320.15 10.63 c -2.7758
360.15 62.53 d -1.233
Figs. 7.4 shows that the water content increases with increasing pressure and
diminishes as temperature increases. These results are consistent with type II
multilayer adsorption isotherms. Moreover, the quantity of adsorbed water increases
continuously as pressure does, but with different slopes depending on the region of the
pressures involved. Three zones are clearly noticeable: the first one at RH < 5% with a

Chapter 7. GCMC simulations of adsorption on kaolinite and chabazite
161
low slope (i.e., 4.44x10⁻⁴, 3.61x10⁻⁴ and 2.70x10⁻⁴ gH2Ogkaolinite -1%RH-1 for 283.15,
298.15 and 320.15K, respectively), the second one at 5% < RH < 15% with a higher slope
(i.e., 2.05x10⁻³, 2.61x10⁻³ and 3.48x10⁻³ gH2Ogkaolinite -1RH-1 for 283.15, 298.15 and
320.15K, respectively) and the last one at RH > 15% with a lower slope similar to that of
the first region (i.e., 4.74x10⁻⁴, 4.61x10⁻⁴ and 4.23x10⁻⁴ gH2Ogkaolinite -1%RH-1 )
Figure 7.4. Kaolinite water content at 10ºC (green), 25ºC (blue) and 47ºC (red) as a function of a) equilibrium pressure (kPa) and b) relative humidity, RH (%). The fitted BET isotherms (Eq.
4) are also showed with dashed lines.
The results at 298.15 K were compared with experimental data in Figure 7.5.
The experimental data were in agreement at RH values lower than 80%. However, at

Chapter 7. GCMC simulations of adsorption on kaolinite and chabazite
162
higher values of RH the simulations underestimate the experimental results although
the experimental errors associated to these values become important. Nevertheless, the
range of interest for industry applications in outgoing flow gases is at RH values lower
than 80%, so. In addition, the lack of experimental results in the interval 0 < RH < 10%
makes impossible to confirm the shape observed in theoretical adsorption isotherms up
to 10% of RH.
Figure 7.5. Kaolinite water content at 25ºC as a function of relative humidity (RH) or pressure (kPa) for GCMC simulations (blue) and experimental results at 23ºC and 25ºC, respectively.
In order to understand the shapes of adsorption isotherms we have studied the
changes in water density of adsorption over kaolinite surface and in the isosteric heat
of adsorption distributions at all the pressures studied (see Figure 7.6) at 298.15K. The
first zone until 5% of RH (i.e., P=0.17 kPa) corresponds to a smooth increase of
adsorption that comes from the adsorption of water molecules on site D as
corroborated by the single peaked isosteric heat distribution centered at 12 kcal/mol in
this range of pressure. As pressure is increased (i.e., from 5% < RH < 15%) the slope
increases abruptly. This fact clearly indicates that within this range, site D is already
fully occupied and that water molecules start to adsorb on site C. This new site of
adsorption produces a double peak in the isosteric heat distribution with a new peak
centered at 18 kcal/mol. At RH > 15% the adsorption isotherm increases again
smoothly with RH. At this point, adsorption of water molecules starts at site A but
regarding isosteric heat distributions, only a broadening of the peak centered at 18 kcal
mol-1 is observed along with a nearly embedding of the peak centered at 12 kcal mol-1
due to adsorption on site D. At higher values of pressure the adsorption of water
molecules reaches new available sites: first B sites and then F sites. The position of both

Chapter 7. GCMC simulations of adsorption on kaolinite and chabazite
163
peaks is maintained, although the distributions become a bit narrower when the
temperature is increased since the amount of adsorbed molecules is reduced
Figure 7.6. Isosteric heat distributions and adsorption location density for water adsorption on kaolinite surface at 25ºC. The adsorption location densities corresponds to the following
pressure (RH) values: a) 0.050 kPa (1.6%), b) 0.166 kPa (5.2%), c) 0.549 kPa (17.3%), d) 1.995 kPa (62.9%) and e) 3.162 kPa (99.7%).
The sequence obtained for water adsorption on kaolinite (i.e., D, C, A, B, F) as a
function of pressure can be also understood from the analysis of the accessible area per
site and also from the charge located on each site of adsorption. At low pressures water
molecules only adsorb on D site that presents an area of 8.02 A2 and a total charge of

Chapter 7. GCMC simulations of adsorption on kaolinite and chabazite
164
1.05e. The other site with high area, site A (i.e., 8.38 A2), does not present adsorption
because the total charge on it is 0.1e, a very low value that reduces drastically the
coulomb term and avoids any adsorption. As pressure increases (at P 0.17 kPa, RH 5%)
the adsorption starts on C site.
This site presents an effective area of 7.88 A2 very close to the value of F site
(i.e., 7.90 A2) but once again the first one is preferred for adsorption over the last one
where no adsorption is observed at these pressures. As in the previous case, the
coulombic term is decisive again; the C site has a net charge of -1.4e whereas the F site
has the same value of A site (i.e., 0.1e). Obviously, the net charge on D and C sites has
opposite sign, this fact indicates that adsorption of water molecules on D site comes
from the interaction with negative dummy position on modeled water molecule and
that adsorption on C site comes from the interaction with positive hydrogen atoms of
water model. At P > 0.5 kPa (RH 16%) adsorption on A site starts and at P 1.5 kPa (
47%) the adsorption on B site becomes also evident. At this point, once C and D sites
are fully occupied the increasing pressure allows the occupation of other zones, for
example A site is occupied before B site, that is, the available site that presents the
highest area is occupied before the one that presents the lowest effective area (i.e., 8.38
and 6.88 A2 for A and B site, respectively). Such a reduced area for B site dilutes the
high value of net charge on it (i.e., -1.2e) and adsorption on this site is only available
when A site becomes fully occupied. The next location in the sequence is the F site that
adsorbs water molecules at P 3.162 kPa ( 100%). In this case, the available area is 7.90
A2, a value higher than 6.98 A2 corresponding to site F. In this case, the area is the
main contribution to adsorption since the net charge on both sites is really low (i.e.,
0.4e and 0.1e for E and F sites, respectively).
Table 7.3. BET adsorption model fitting for water over kaolinite as a function of temperature
T (K) c Vm (cm3)
102
ML water content 102
kaoliniteOH gg /2
%RH at ML coverage
273.15 17.21 2.76 2.76 19.3 This work
298.15 15.93 2.14 2.13 19.9 This work
298 16 2 20 Exp.
320.15 8.81 1.92 1.90 24.8 This work
Finally, following the idea of Hatch et al., we have fitted the adsorption
isotherms to a Brunauer Emmett and Teller (BET) adsorption model. The fit of the
GCMC isotherms obtained was performed at each temperature in the range 0.08 P/Pvp

Chapter 7. GCMC simulations of adsorption on kaolinite and chabazite
165
0.45 obtaining the BET parameters reported in Table 7.3 with a good agreement with
experimental values at 298 K. The results confirm a type II BET.
CHABAZITE
Effect of cations in chabazites
We have evaluated the adsorption in CHA type zeolites with different alkali cations
exchange by molecular simulations in order to improve the CO2/N2 at a swing
adsorption process.
Contrasting with the behavior in faujasite zeolites type, the Ca-CHA zeolite did not
present the maximum adsorption capacity at a minimum Si/Al ratio. Instead, this
maximum appeared at an intermediate Si/Al ratio. This unexpected behavior offers
the possibility of performing a deep study of the behavior of this type of zeolites when
other cations are added instead of calcium in order to use the best conditions for
separation.
It is well known that CO2 adsorption capacity and selectivity from a fue gas is
strongly influenced by the composition and structural features of the adsorbents.
Although there is a good amount of work on new porous structures like MOF’s and
ZIF’s, it seems reasonable to evaluate other zeolite structures that could exhibit high
selectivities at low partial pressures. Adsorption separation process using zeolites as
adsorbents are still of great importance due their highly selective, energy efficient
operation and high chemical stability at a wide range of temperature. A clear
advantage of exploring zeolites is that the required pore sizes, densities, crush
strengths, electrostatic interactions, ease of synthesis, etc. of them is already
established.
In order to enhance the separation and purification processes, a good understanding
of adsorption process is needed. Therefore, one of the key factors for improving the
selectivity is to understand the interaction of the electric quadrupole moment of CO2
with the electrostatic field gradient created by the extra-framework cations.
Hence, the goal was focused on evaluate the adsorption effect in CHA type
zeolites with different alkali cations exchange using molecular modeling tools.
Among other adsorbents, chabazite zeolite is a promising but often ignored
option: chabazite is a tectosilicate mineral of the zeolite group, closely related to
gmelinite, with formula (Ca,Na2, K2,Mg)Al2Si4O12·6H2O. It was named chabasie in 1792
by Bosc d'Antic and later changed to the current spelling.
The published literature dealing with ion-exchange and its impact on
adsorption properties of chabazites has grown in the past years. Previous studies

Chapter 7. GCMC simulations of adsorption on kaolinite and chabazite
166
showed that cation siting and distribution in the framework are critical structural
parameters for generating adsorption sites and enhancing the strength of the
adsorption interaction (the thermal stability is largely dependent on the nature of the
exchangeable cations). Further studies have shown that the Si/Al ratio controls the
charge-balancing cation quantity and siting, which in turn controls the adsorption
characteristics of the zeolite [Singh et. al., 2005].
Chabazite can be obtained as the naturally occurring mineral or synthesized.
Natural chabazites, however are inherently variable in chemical composition [Ridha &
Webley, 2009] and therefore in their adsorption capacities. Now, synthesis of chabazite
with different Si/Al ratios is well known: Gaffney and Coe [1991] have reported
synthesis of chabazite with Si/Al ratio in range 1.8 to 2.3 and have demonstrated that
Ca and Sr exchanged chabazites are better for separation of N2 and Ar.
Chabazites structures (raw CHA and CaCHA)
The structure of a zeolite chabazite in a typical unit cell is shown in Figure 7.7.
(seen from different viewpoints).
Materials of this structural group (CHA) are crystalline microporous structures
with uniformly sized pores of molecular dimensions and cavities of 8-ring windows.
Exchangeable cations can be located within the cavities to balance the negative charge
introduced into the framework by the aluminum atoms. Depending on their size and
charge, the cations can effectively block the pore openings such that certain molecules
are excluded in an adsorption process. However, it should be noted that the cation can
also decrease the pore volume [Ridha & Webley, 2010].
For simplicity, a simulated synthetic material only includes Si and O. Therefore
the unit cell in this case only includes 12 Silicon atoms (in yellow) and 24 Oxygen
atoms (in red), in order to represent a complete ring and four quarters of rings.

Chapter 7. GCMC simulations of adsorption on kaolinite and chabazite
167
Figure 7.7. Chabazite structure framework
Carbon Dioxide Nitrogen
Figure 7.8. Probability cloud of nitrogen and carbon dioxide adsorption in raw chabazite and
CaCHA.
Now, in a qualitatively way, we present the most likely locations for adsorption
of different substances (at STP conditions). The probability cloud of adsorption (see
Figure 7.8) shows the preference for nitrogen (blue) and carbon dioxide (red) in a raw

Chapter 7. GCMC simulations of adsorption on kaolinite and chabazite
168
chabazite and a Ca-CHA material. It can be seen that the nitrogen adsorb in groups,
tending to be located close to the oxygen atoms in the chabazite ring, while for the
carbon dioxide we see a more compact cloud, with special preference for the center of
the unit cell.
In the following sections we will describe preliminary results of adsorption isotherms
for CO2 and N2 in raw chabazite and CaCHA.
CO2 adsorption
The first simulations in this subject were performed for adsorption of CO2 in a raw
chabazite (Figure 7.8). Here, it was possible to make a validation of the TraPPE force
field, which showed good results for this type of interactions.
Figure 7.9. Adsorption isotherm of CO2 in CHA and Adsorption isotherms of CO2 in CaCHA
materials with different number of exchanged-ions.
And from these results, a purely computational evaluation was made for
different chabazites, including different amounts of calcium (different Si/Al ratios in
the unit cell). The adsorption isotherms obtained are shown in Figure 7.10. It can be
seen that as Ca+2 ions were included, the amount of CO2 adsorbed increased
considerably, while a rise in the temperature decreases the adsorption (as logical).
0
1
2
3
4
5
6
0 100 200 300 400 500
Up
tak
e (
mm
ol/
g)
Pressure (kPa)
Exp. CO2 @300K (Li et. al, 2004)
Simulation; CO2 @300K

Chapter 7. GCMC simulations of adsorption on kaolinite and chabazite
169
In Figure 7.11 we present the main results of the adsorption isotherms. The
experimental data are shown as points, the dashed lines stand for T=296K and the solid
lines are for T=318K.
Figure 7.10. Adsorption isotherms of nitrogen in different structures of CaCHA, according to
the amount of ions exchanged (Ca+2 added)
Figure 7.11. Comparison of the amount adsorbed in different cation-exchanged chabazites
0
0,5
1
1,5
2
2,5
3
3,5
4
0 100 200 300 400 500
N2
up
tak
e (
mm
ol/
g)
Pressure (kPa)
Exp. N2 @296K (A.P., 061-19)
Exp. N2 @318K (A.P., 061-19)
Simulation @303K (ratio Si/Al = 2,0)
0
0,2
0,4
0,6
0,8
1
1,2
1,4
1,6
1,8
2
0,1 1 10

Chapter 7. GCMC simulations of adsorption on kaolinite and chabazite
170
7.4. Outlook
GCMC simulations of water adsorption on kaolinite surface, as well as carbon
dioxide and nitrogen over chabazite, lead to a great agreement with experimental data
(although for higher values of RH the simulated water results underestimate the
experimental ones). The shape of the adsorption isotherms is explained in basis of
isosteric heats and available surface per site of adsorption.
The adsorption isotherms obtained for kaolinite makes it a promising material
for eliminating water from these currents in order to avoid poisoning of adsorbent
materials used for CO2 capture and separation. These results confirm that this kind of
material can be used as a cheap treatment for drying the outgoing gases, so avoiding
adsorbent poisoning and increasing the efficiency of CO2 separation.

171
171
8 8. CONCLUSIONS AND FUTURE WORK

Chapter 8. Conclusions
172
Given the vast amount of work done in recent years regarding adsorbent for CO2
capture through pre and post-combustion processes, in the chapter 3 we provide an
overview of these recent literature results concerning structured adsorbents,
including reference and advanced zeolites, carbon based materials, microporous
polymers, amine-modified sorbents and Metal-Organic Frameworks (MOFs),
among others.
There are numerous different structural types of zeolites, MOFs and molecular
sieves. Considering all possible cation, metals, linkers, etc. variations results in an
unmanageable number of potential candidate adsorbents for any particular
separation. Thus, efficient and effective methods for screening adsorbents are
necessary. Conditions of the feed to be separated, the purity and value of the
desired product, competing processes and other important constraints will vary
widely across the many gas separations of interest.
Methods for evaluating adsorbent effectiveness for a given separation vary from
the measurement of a few isotherms to execution of detailed process models.
Isotherms alone would confirm an adsorbent’s ability to affect steric separations,
but would not be sufficient to select the best adsorbent for either kinetic or
equilibrium separations. Detailed process modeling requires accurate and extensive
adsorbent characteristic input data. Obtaining such data for a large number of
candidate adsorbents can be prohibitive. As a result, simple methods are required
for ranking adsorbents for a particular separation by relating adsorbent
characteristics to process performance.
Although MOFs may provide elegant solutions for CO2 sequestration and storage,
they are not particularly suitable for post-combustion gas treatment (only the M-
MOF-74 family shows good results for this type of application). Nevertheless, a
continuous effort is being deployed to circumvent such drawbacks. The strategies
being used include surface modification to enhance the interactions with CO2, thus
increasing the adsorption capacity at low pressure.
Taking into account that an ideal adsorbent for a post-combustion stream should
exhibit a high selectivity for CO2 over the other flue gas components, high
adsorption capacities under the operating conditions and minimal energy penalty
for regeneration, results from chapter 4 show that among the 11 studied
adsorbents, Mg-MOF-74 shows a great potential to become a material to be used for
this separation under the TSA operating conditions, with even better performance
than the most traditionally used zeolite 13X (NaX). This is a step forward in
moving Mg-MOF-74 to industrial applications in an advantageous manner versus
current used materials.
On the basis of this advanced analysis of the most important studies about the post-
combustion CO2 capture, it appears that the basicity and size of pores of zeolites, as

Chapter 8. Conclusions
173
well as the strength of electric field caused by the presence of exchangeable cations
in their cavities are the essential factors for the CO2 adsorption on zeolites. Thus,
the consideration of all these factors seems to be necessary for the best choice of an
appropriate material for CO2 adsorption. Hence, the optimization of all these
factors and experimental and simulating conditions may increase significantly the
adsorption capacities and thus develops efficient technologies to capture the
industrial emissions of CO2.
Material scientists and process engineers working together are likely to be more
productive than either working alone. Cost and performance are always factors.
Finding the match between a natural zeolite and a gas separation is a difficult
challenge. Meeting this challenge requires a change in the way gas separations
have been approached by all of us working in the field of natural zeolites.
Although CO2, N2, and H2O account for greater than 95% of the flue gas mixture,
the other minor components (mostly O2, SOx, NOx, and CO) present cannot be
ignored in assessing zeolites and Metal-Organic Frameworks for CO2 capture.
Significantly, the effects of these trace gases on the CO2/N2 separation performance
of MOFs is so far virtually unexplored. Future research must also address this
issue.
Regarding the CO2 capture in MOF CuBTC, results reveal that a very little amount
of uncoordinated water molecules induce a significant improvement on capture in
due to the enhanced binding energy between CO2 with the introduction of small
amounts of water, while zeolite 13X became useless with less than 1% of water. As
a consequence, zeolite 13X is not suitable for the adsorption of CO2 without a
previous proper dehumidification process, because just a 0.01% of moisture in the
adsorbent is able to significantly reduce the adsorption capacity of CO2.
In addition to water, the effects of other impurities on CO2 capture were also
analyzed, including O2 and SO2. By comparing CO2/N2 selectivity for different
CO2/N2/SO2 mixtures, it is found that even with a concentration of SO2 in the flue
gas as high as 2000ppm, the CO2/N2 selectivity in the flue gas mixtures remains
essentially unaffected; there was only a slightly lower adsorption, attributed to the
decrease of CO2 adsorption with the introduction of SO2 in flue gas (sites
competition).
Future work
The molecular simulation techniques used in this Thesis were demonstrated to be
versatile tools for studying different parts and features of materials for capture and

Chapter 8. Conclusions
174
separation. As we will see, a clear example of this versatility is demonstrated by the
study presented in the appendix of this work.
Further investigation on the scale-up of the Metal-Organic Frameworks, the
functionalization of mesoporous silica and other porous matrices will be necessary for
the implementation of the process in a larger scale. Preliminary results have shown
that … Hence, it would be useful to study the optimization of the processes at different
conditions in order to reduce the process costs.

175
175
Bibliography
Abascal, J. L. F., and C. Vega. A general purpose model for the condensed phases of water:
TIP4P/2005. The Journal of Chemical Physics 123, 23 (2005): 234505.
Accelrys Materials Studio. Accelrys Materials Studio.
Ackley, Mark W, Salil U Rege, and Himanshu Saxena. Application of natural zeolites in the
purification and separation of gases. Microporous and Mesoporous Materials 61, 1-3 (2003): 25-
42.
Adamson, A. W.; Gast, A. P., Physical chemistry of surfaces. 6th ed.; Wiley: New York, 1997; p
764.
Alaerts, Luc, Etienne Séguin, Hilde Poelman, Frédéric Thibault-Starzyk, Pierre A. Jacobs, and
Dirk E. De Vos. Probing the Lewis Acidity and Catalytic Activity of the Metal-Organic
Framework [Cu3(btc)2] (BTC=Benzene-1,3,5-tricarboxylate). Chem. Eur. J. 12, 28 (2006):
7353-7363.
Allen, M. P. and Tildesley, D. J. Computer simulation of liquids. (Clarendon, 1989).
Alvarez, Diego, and J. Carlos Abanades. Pore-Size and Shape Effects on the Recarbonation
Performance of Calcium Oxide Submitted to Repeated Calcination/Recarbonation Cycles.
Energy Fuels 19, 1 (2005): 270-278.
Allan, Phoebe K., Bo Xiao, Simon J. Teat, Jason W. Knight, and Russell E. Morris. In Situ Single-
Crystal Diffraction Studies of the Structural Transition of Metal-Organic Framework
Copper 5-Sulfoisophthalate, Cu-SIP-3. J. Am. Chem. Soc. 132, 10 (2010): 3605-3611.
Ammendola, Paola, Federica Raganati, and Riccardo Chirone. Effect of operating conditions on
the CO2 recovery from a fine activated carbon by means of TSA in a fluidized bed assisted
by acoustic fields. Fuel Processing Technology 134 (2015): 494-501.
An, Jihyun, and Nathaniel L. Rosi. Tuning MOF CO2 Adsorption Properties via Cation
Exchange. J. Am. Chem. Soc. 132, 16 (2010): 5578-5579.
Angell, C. L., and M. V. Howell. Infrared spectroscopic investigations of zeolites and adsorbed
molecules. Part V. Carbon dioxide. Can. J. Chem. 47, 20 (1969): 3831-3836.
Aprea, Paolo, Domenico Caputo, Nicola Gargiulo, Fabio Iucolano, and Francesco Pepe.
Modeling Carbon Dioxide Adsorption on Microporous Substrates: Comparison between
CuBTC Metal-Organic Framework and 13X Zeolitic Molecular Sieve. J. Chem. Eng. Data 55,
9 (2010): 3655-3661.

Bibliography
176
Arstad, Bjørnar, Helmer Fjellvåg, Kjell Ove Kongshaug, Ole Swang, and Richard Blom. Amine
functionalised metal organic frameworks (MOFs) as adsorbents for carbon dioxide.
Adsorption 14, 6 (2008): 755-762.
Atkins, P. W., Physical chemistry. 5 ed.; Oxford University Press: Oxford, 1998.
Attard, G.; Barnes, C., Surfaces. Oxford University press: Oxford, 2008; p 96.
Aukett, P. N., N. Quirke, S. Riddiford, and S. R. Tennison. Methane adsorption on microporous
carbons: A comparison of experiment, theory, and simulation. Carbon 30, 6 (1992): 913-924.
Babarao, R., and J. W. Jiang. Cation Characterization and CO2 Capture in Li+-Exchanged Metal-
Organic Frameworks: From First-Principles Modeling to Molecular Simulation. Ind. Eng.
Chem. Res. 50, 1 (2011): 62-68.
Babarao, Ravichandar, Jianwen Jiang, and Stanley I. Sandler. Molecular Simulations for
Adsorptive Separation of CO2/CH4 Mixture in Metal-Exposed, Catenated, and Charged
Metal-Organic Frameworks. Langmuir 25, 9 (2009): 5239-5247.
Babarao, Ravichandar, Sheng Dai, and De-en Jiang. Effect of Pore Topology and Accessibility on
Gas Adsorption Capacity in Zeolitic-Imidazolate Frameworks: Bringing Molecular
Simulation Close to Experiment. J. Phys. Chem. C 115, 16 (2011): 8126-8135.
Babarao, Ravichandar, and Jianwen Jiang. Molecular Screening of Metal-Organic Frameworks
for CO2 Storage. Langmuir 24, 12 (2008): 6270-6278.
Babarao, Ravichandar, and Jianwen Jiang. Unprecedentedly High Selective Adsorption of Gas
Mixtures in rho Zeolite-like Metal-Organic Framework: A Molecular Simulation Study. J.
Am. Chem. Soc. 131, 32 (2009): 11417-11425.
Bae, Youn-Sang, Brad G. Hauser, Omar K. Farha, Joseph T. Hupp, and Randall Q. Snurr.
Enhancement of CO2/CH4 selectivity in metal-organic frameworks containing lithium
cations. Microporous and Mesoporous Materials 141, 1-3 (2011): 231-235.
Bae, Youn-Sang, David Dubbeldam, Andrew Nelson, Krista S. Walton, Joseph T. Hupp, and
Randall Q. Snurr. Strategies for Characterization of Large-Pore Metal-Organic Frameworks
by Combined Experimental and Computational Methods. Chem. Mater. 21, 20 (2009): 4768-
4777.
Banerjee, Rahul, Hiroyasu Furukawa, David Britt, Carolyn Knobler, Michael O'Keeffe, and
Omar M. Yaghi. Control of Pore Size and Functionality in Isoreticular Zeolitic Imidazolate
Frameworks and their Carbon Dioxide Selective Capture Properties. J. Am. Chem. Soc. 131,
11 (2009): 3875-3877.
Bastin, Laurent, Patrick S. Bárcia, Eric J. Hurtado, José A. C. Silva, Alírio E. Rodrigues, and
Banglin Chen. A Microporous Metal-Organic Framework for Separation of CO2/N2 and
CO2/CH4 by Fixed-Bed Adsorption. J. Phys. Chem. C 112, 5 (2008): 1575-1581.
Belmabkhout, Youssef, Rodrigo Serna-Guerrero, and Abdelhamid Sayari. Amine-bearing
mesoporous silica for CO2 removal from dry and humid air. Chemical Engineering Science
65, 11 (2010): 3695-3698.

Bibliography
177
Berger, Adam Hughmanick, and Abhoyjit S. Bhown. Comparing physisorption and
chemisorption solid sorbents for use separating CO2 from flue gas using temperature
swing adsorption. Energy Procedia 4 (2011): 562-567.
Bezerra, Diôgo P., Ronan S. Oliveira, Rodrigo S. Vieira, Célio L. Cavalcante Jr, and Diana C. S.
Azevedo. Adsorption of CO2 on nitrogen-enriched activated carbon and zeolite 13X.
Adsorption 17, 1 (2011): 235-246.
Bonenfant, Danielle, Mourad Kharoune, Patrick Niquette, Murielle Mimeault, and Robert
Hausler. Advances in principal factors influencing carbon dioxide adsorption on zeolites.
Sci. Technol. Adv. Mater. 9, 1 (2008): 013007.
Botas, Juan A., Guillermo Calleja, Manuel Sánchez-Sánchez, and M. Gisela Orcajo. Cobalt
Doping of the MOF-5 Framework and Its Effect on Gas-Adsorption Properties. Langmuir
26, 8 (2010): 5300-5303.
Both, K., D. W. Henderson, and D. R. Turner. Asbestos and erionite fibres can induce mutations
in human lymphocytes that result in loss of heterozygosity. Int. J. Cancer 59, 4 (1994): 538-
542.
Bourrelly, Sandrine, Philip L. Llewellyn, Christian Serre, Franck Millange, Thierry Loiseau, and
Gérard Férey. Different Adsorption Behaviors of Methane and Carbon Dioxide in the
Isotypic Nanoporous Metal Terephthalates MIL-53 and MIL-47. J. Am. Chem. Soc. 127, 39
(2005): 13519-13521.
Boutin, Anne, François-Xavier Coudert, Marie-Anne Springuel-Huet, Alexander V. Neimark,
Gérard Férey, and Alain H. Fuchs. The Behavior of Flexible MIL-53(Al) upon CH4 and
CO2 Adsorption. J. Phys. Chem. C 114, 50 (2010): 22237-22244.
Brandani, Federico, and Douglas M. Ruthven. The Effect of Water on the Adsorption of CO2
and C3H8 on Type X Zeolites. Ind. Eng. Chem. Res. 43, 26 (2004): 8339-8344.
Britt, David, David Tranchemontagne, and Omar M. Yaghi. Metal-organic frameworks with
high capacity and selectivity for harmful gases. PNAS 105, 33 (2008): 11623-11627.
Britt, David, Hiroyasu Furukawa, Bo Wang, T. Grant Glover, and Omar M. Yaghi. Highly
efficient separation of carbon dioxide by a metal-organic framework replete with open
metal sites. PNAS 106, 49 (2009): 20637-20640.
Brunauer, S.; Deming, L. S.; Deming, W. S.; Teller, E., On a Theory of the van der Waals
Adsorption of Gases. J. Am. Chem. Soc. 1940, 62, 1723 - 32.
Brunauer, Stephen, P. H. Emmett, and Edward Teller. Adsorption of Gases in Multimolecular
Layers. J. Am. Chem. Soc. 60, 2 (1938): 309-319.
Builes S., Lórez-Aranguren, P.; Fraile, J.; Vega, L. F.; Domingo, C. Alkylsilane-functionalized
microporous and mesoporous materials: molecular simulation and experimental analysis
of gas adsorption. J. Phys. Chem. C. 2012, 116(18): 10150-10161.
Bukowski, R.; Szalewicz, K.; Groenenboom, G. C.; van der Avoird, A. Science 2007, 315, 1249.

Bibliography
178
Caskey, Stephen R., Antek G. Wong-Foy, and Adam J. Matzger. Dramatic Tuning of Carbon
Dioxide Uptake via Metal Substitution in a Coordination Polymer with Cylindrical Pores. J.
Am. Chem. Soc. 130, 33 (2008): 10870-10871.
Castillo, Juan Manuel, Thijs J. H. Vlugt, and Sofía Calero. Understanding Water Adsorption in
CuBTC Metal-Organic Frameworks. J. Phys. Chem. C 112, 41 (2008): 15934-15939.
Cavenati, Simone, Carlos A. Grande, and Alírio E. Rodrigues. Adsorption Equilibrium of
Methane, Carbon Dioxide, and Nitrogen on Zeolite 13X at High Pressures. J. Chem. Eng.
Data 49, 4 (2004): 1095-1101.
Cavenati, Simone, Carlos A. Grande, and Alírio E. Rodrigues. Separation of mixtures by layered
pressure swing adsorption for upgrade of natural gas. Chemical Engineering Science 61, 12
(2006): 3893-3906.
Cinke, Martin, Jing Li, Charles W. Bauschlicher Jr., Alessandra Ricca, and M. Meyyappan. CO2
adsorption in single-walled carbon nanotubes. Chemical Physics Letters 376, 5-6 (2003): 761-
766.
Claquin, T., M. Schulz, and Y. J. Balkanski. Modeling the mineralogy of atmospheric dust
sources. J. Geophys. Res. 104, D18 (1999): 22243-22256.
Clausse, Marc, Jérôme Merel, and Francis Meunier. Numerical parametric study on CO2
capture by indirect thermal swing adsorption. International Journal of Greenhouse Gas Control
5, 5 (2011): 1206-1213.
Cooper, Andrew I. Conjugated Microporous Polymers. Adv. Mater. 21, 12 (2009): 1291-1295.
Coudert, François-Xavier, Anne Boutin, Marie Jeffroy, Caroline Mellot-Draznieks, and Alain H.
Fuchs. Thermodynamic Methods and Models to Study Flexible Metal-Organic
Frameworks. ChemPhysChem 12, 2 (2011): 247-258.
Coughlan, Brendan, and Seán Kilmartin. Zeolites X, and Y. A enriched with trivalent cations:
sorption of carbon dioxide and ammonia. Part 1. Isotherms and affinities. J. Chem. Soc.,
Faraday Trans. 1 71, 0 (1975): 1809-1817.
Croteau, T., A. K. Bertram, and G. N. Patey. Adsorption and Structure of Water on Kaolinite
Surfaces: Possible Insight into Ice Nucleation from Grand Canonical Monte Carlo
Calculations. J. Phys. Chem. A 112, 43 (2008): 10708-10712.
Croteau, T., A. K. Bertram, and G. N. Patey. Simulation of Water Adsorption on Kaolinite under
Atmospheric Conditions. J. Phys. Chem. A 113, 27 (2009): 7826-7833.
Croteau, T., A. K. Bertram, and G. N. Patey. Water Adsorption on Kaolinite Surfaces Containing
Trenches. J. Phys. Chem. A 114, 5 (2010): 2171-2178.
Cygan, Randall T., Jian-Jie Liang, and Andrey G. Kalinichev. Molecular Models of Hydroxide,
Oxyhydroxide, and Clay Phases and the Development of a General Force Field. J. Phys.
Chem. B 108, 4 (2004): 1255-1266.
Challa, Sivakumar R., David S. Sholl, and J. Karl Johnson. Adsorption and separation of
hydrogen isotopes in carbon nanotubes: Multicomponent grand canonical Monte Carlo
simulations. The Journal of Chemical Physics 116, 2 (2002): 814-824.

Bibliography
179
Chen, Y. F., J. Y. Lee, R. Babarao, J. Li, and J. W. Jiang. A Highly Hydrophobic Metal-Organic
Framework Zn(BDC)(TED)0.5 for Adsorption and Separation of CH3OH/H2O and
CO2/CH4: An Integrated Experimental and Simulation Study. J. Phys. Chem. C 114, 14
(2010): 6602-6609.
Chen, Y. F., R. Babarao, S. I. Sandler, and J. W. Jiang. Metal-Organic Framework MIL-101 for
Adsorption and Effect of Terminal Water Molecules: From Quantum Mechanics to
Molecular Simulation. Langmuir 26, 11 (2010): 8743-8750.
Cheon, Young Eun, Jungeun Park, and Myunghyun Paik Suh. Selective gas adsorption in a
magnesium-based metal-organic framework. Chem. Commun., 36 (2009): 5436-5438.
Choi, Sunho, Jeffrey, H. Drese, and Christopher, W. Jones. Adsorbent Materials for Carbon
Dioxide Capture from Large Anthropogenic Point Sources. ChemSusChem 2, 9 (2009): 796-
854.
Choi, Yoon Jeong, Jung Hoon Choi, Kyung Min Choi, and Jeung Ku Kang. Covalent organic
frameworks for extremely high reversible CO2 uptake capacity: a theoretical approach. J.
Mater. Chem. 21, 4 (2011): 1073-1078.
Chui, Stephen S.-Y., Samuel M.-F. Lo, Jonathan P. H. Charmant, A. Guy Orpen, and Ian D.
Williams. A Chemically Functionalizable Nanoporous Material [Cu3(TMA)2(H2O)3]n.
Science 283, 5405 (1999): 1148-1150.
Chun, Hyungphil, and Jinwoo Seo. Discrimination of Small Gas Molecules through Adsorption:
Reverse Selectivity for Hydrogen in a Flexible Metal-Organic Framework. Inorg. Chem. 48,
21 (2009): 9980-9982.
D'Alessandro, Deanna, M., Berend Smit, and Jeffrey, R. Long. Carbon Dioxide Capture:
Prospects for New Materials. Angewandte Chemie International Edition 49, 35 (2010): 6058-
6082.
Dabrowski, A., Adsorption - from theory to practice. Adv. Colloid Interface Sci. 2001, 93, (1-3),
135-224.
DeCoste, Jared B., Gregory W. Peterson, Bryan J. Schindler, Kato L. Killops, Matthew A. Browe,
and John J. Mahle. The effect of water adsorption on the structure of the carboxylate
containing metal-organic frameworks CuBTC, Mg-MOF-74, and UiO-66. J. Mater. Chem. A
1, 38 (2013): 11922-11932.
DeCoste, Jared B., and Gregory W. Peterson. Metal-Organic Frameworks for Air Purification of
Toxic Chemicals. Chem. Rev. 114, 11 (2014): 5695-5727.
Delgado, José A., V. I. Águeda, M. A. Uguina, J. L. Sotelo, P. Brea, and Carlos A. Grande.
Adsorption and Diffusion of H2, CO, CH4, and CO2 in BPL Activated Carbon and 13X
Zeolite: Evaluation of Performance in Pressure Swing Adsorption Hydrogen Purification
by Simulation. Ind. Eng. Chem. Res. 53, 40 (2014): 15414-15426.
Demessence, Aude, Deanna M. D'Alessandro, Maw Lin Foo, and Jeffrey R. Long. Strong CO2
Binding in a Water-Stable, Triazolate-Bridged Metal-Organic Framework Functionalized
with Ethylenediamine. J. Am. Chem. Soc. 131, 25 (2009): 8784-8786.

Bibliography
180
Deng, Wei-Qiao, Xin Xu, and William A. Goddard. New Alkali Doped Pillared Carbon
Materials Designed to Achieve Practical Reversible Hydrogen Storage for Transportation.
Phys. Rev. Lett. 92, 16 (2004): 166103.
De Pablo, J. J.; Laso, M.; Suter, U. W. Journal of Chemical Physics 1992, 96, 6157.
Dickey, Allison N., A. Özgür Yazaydin, Richard R. Willis, and Randall Q. Snurr. Screening
CO2/N2 selectivity in metal-organic frameworks using Monte Carlo simulations and ideal
adsorbed solution theory. Can. J. Chem. Eng. 90, 4 (2012): 825-832.
Dietzel, Pascal D. C., Vasileios Besikiotis, and Richard Blom. Application of metal-organic
frameworks with coordinatively unsaturated metal sites in storage and separation of
methane and carbon dioxide. J. Mater. Chem. 19, 39 (2009): 7362-7370.
Dietzel, Pascal D. C. Adsorption properties and structure of CO2 adsorbed on open
coordination sites of metal-organic framework Ni2(dhtp) from gas adsorption, IR
spectroscopy and X-ray diffraction. Chem. Commun., 41 (2008): 5125-5127.
Ding, Lifeng, and A. Özgür Yazaydin. How Well Do Metal-Organic Frameworks Tolerate Flue
Gas Impurities? J. Phys. Chem. C 116, 43 (2012): 22987-22991.
Dodd, L. R.; Boone, T. D.; Theodoru, D. N. Molecular Physics 1993, 78, 961.
Dogru, Mirjam, Andreas Sonnauer, Andrei Gavryushin, Paul Knochel, and Thomas Bein. A
Covalent Organic Framework with 4 nm open pores. Chem. Commun. 47, 6 (2011): 1707-
1709.
Doonan, Christian J., David J. Tranchemontagne, T. Grant Glover, Joseph R. Hunt, and Omar M.
Yaghi. Exceptional ammonia uptake by a covalent organic framework. Nat Chem 2, 3
(2010): 235-238.
Doskocil, Eric J., and Robert J. Davis. Spectroscopic Characterization and Catalytic Activity of
Zeolite X Containing Occluded Alkali Species. Journal of Catalysis 188, 2 (1999): 353-364.
Dubbeldam, David, Houston Frost, Krista S. Walton, and Randall Q. Snurr. Molecular
simulation of adsorption sites of light gases in the metal-organic framework IRMOF-1.
Fluid Phase Equilibria 261, 1-2 (2007): 152-161.
Dubbeldam, D.; Calero, S.; Vlugt, T.J.H.; Krishna, R.; Maesen, Th.L.M.; Smit, B. J. Phys. Chem. B
2004, 108, 12301–12313.
Dunne, J. A., M. Rao, S. Sircar, R. J. Gorte, and A. L. Myers. Calorimetric Heats of Adsorption
and Adsorption Isotherms. 2. O2, N2, Ar, CO2, CH4, C2H6, and SF6 on NaX, H-ZSM-5,
and Na-ZSM-5 Zeolites. Langmuir 12, 24 (1996): 5896-5904.
Düren, Tina, Youn-Sang Bae, and Randall Q. Snurr. Using molecular simulation to characterise
metal-organic frameworks for adsorption applications. Chem. Soc. Rev. 38, 5 (2009): 1237-
1247.
Ebrahim, Amani M., Benoit Levasseur, and Teresa J. Byosz. Interactions of NO2 with Zr-Based
MOF: Effects of the Size of Organic Linkers on NO2 Adsorption at Ambient Conditions.
Langmuir 29, 1 (2013): 168-174.

Bibliography
181
Eddaoudi, Mohamed. Systematic Design of Pore Size and Functionality in Isoreticular MOFs
and Their Application in Methane Storage. Science 295, 5554 (2002): 469-472.
Erucar, Ilknur, and Seda Keskin. High CO2 Selectivity of an Amine-Functionalized Metal
Organic Framework in Adsorption-Based and Membrane-Based Gas Separations. Ind. Eng.
Chem. Res. 52, 9 (2013): 3462-3472.
Ewald, P.P. Annalen Der Physik 64, 253-287 (1921).
Farha, Omar K., Karen L. Mulfort, and Joseph T. Hupp. An Example of Node-Based
Postassembly Elaboration of a Hydrogen-Sorbing, Metal-Organic Framework Material.
Inorg. Chem. 47, 22 (2008): 10223-10225.
Farha, Omar K.. Metal-Organic Framework Materials with Ultrahigh Surface Areas: Is the Sky
the Limit? J. Am. Chem. Soc. 134, 36 (2012): 15016-15021.
Férey, Gérard. Hybrid porous solids: past, present, future. Chem. Soc. Rev. 37, 1 (2007): 191-214.
Férey, Gérard, and Christian Serre. Large breathing effects in three-dimensional porous hybrid
matter: facts, analyses, rules and consequences. Chem. Soc. Rev. 38, 5 (2009): 1380-1399.
Fioretos, Konstantinos A., George M. Psofogiannakis, and George E. Froudakis. Ab-Initio Study
of the Adsorption and Separation of NOx and SOx Gases in Functionalized IRMOF
Ligands. J. Phys. Chem. C 115, 50 (2011): 24906-24914.
Fischer, Michael, Frank Hoffmann, and Michael Fröba. Metal-organic frameworks and related
materials for hydrogen purification: Interplay of pore size and pore wall polarity. RSC Adv.
2, 10 (2012): 4382-4396.
Formenti, P., W. Elbert, W. Maenhaut, J. Haywood, and M. O. Andreae. Chemical composition
of mineral dust aerosol during the Saharan Dust Experiment (SHADE) airborne campaign
in the Cape Verde region, September 2000. J. Geophys. Res. 108, D18 (2003): 8576.
Förster, Horst, and Monika Schumann. Infrared spectroscopic studies on carbon dioxide
adsorption in alkali-metal and alkaline-earth-metal ion-exchanged A-type zeolites. Part 1.
General features of CO2 interaction with A-type zeolites. J. Chem. Soc., Faraday Trans. 1 85, 5
(1989): 1149-1158.
Franchi, Robert S., Peter J. E. Harlick, and Abdelhamid Sayari. Applications of Pore-Expanded
Mesoporous Silica. 2. Development of a High-Capacity, Water-Tolerant Adsorbent for
CO2. Ind. Eng. Chem. Res. 44, 21 (2005): 8007-8013.
Frenkel, Daan, and Berend Smit. Understanding Molecular Simulation: From Algorithms to
Applications. Academic Press, 2001.
Frenkel, D.; Mooij, G. C. A. M.; Smit, B. Journal of Physics - Condensed Matter 1992, 4, 3053.
Frost, Houston, Tina Düren, and Randall Q. Snurr. Effects of Surface Area, Free Volume, and
Heat of Adsorption on Hydrogen Uptake in Metal-Organic Frameworks. J. Phys. Chem. B
110, 19 (2006): 9565-9570.
Furukawa, Hiroyasu. Ultrahigh Porosity in Metal-Organic Frameworks. Science 329, 5990 (2010):
424-428.

Bibliography
182
García, Edder J., John P. S. Mowat, Paul A. Wright, Javier Pérez-Pellitero, Christian Jallut, and
Gerhard D. Pirngruber. Role of Structure and Chemistry in Controlling Separations of
CO2/CH4 and CO2/CH4/CO Mixtures over Honeycomb MOFs with Coordinatively
Unsaturated Metal Sites. J. Phys. Chem. C 116, 50 (2012): 26636-26648.
García-Pérez, Elena, Jorge Gascón, Víctor Morales-Flórez, Juan Manuel Castillo, Freek Kapteijn,
and Sofía Calero. Identification of Adsorption Sites in CuBTC by Experimentation and
Molecular Simulation. Langmuir 25, 3 (2009): 1725-1731.
Ghoufi, A., and G. Maurin. Hybrid Monte Carlo Simulations Combined with a Phase Mixture
Model to Predict the Structural Transitions of a Porous Metal-Organic Framework Material
upon Adsorption of Guest Molecules. J. Phys. Chem. C 114, 14 (2010): 6496-6502.
Goj, Anne, David S. Sholl, E. Demet Akten, and Daniela Kohen. Atomistic Simulations of CO2
and N2 Adsorption in Silica Zeolites: The Impact of Pore Size and Shape. J. Phys. Chem. B
106, 33 (2002): 8367-8375.
Grajciar, Lukáš, Andrew D. Wiersum, Philip L. Llewellyn, Jong-San Chang, and Petr Nachtigall.
Understanding CO2 Adsorption in CuBTC MOF: Comparing Combined DFT-ab Initio
Calculations with Microcalorimetry Experiments. J. Phys. Chem. C 115, 36 (2011): 17925-
17933.
Grande, Carlos A., and Richard Blom. Dual Pressure Swing Adsorption Units for Gas
Separation and Purification. Ind. Eng. Chem. Res. 51, 25 (2012): 8695-8699.
Granite, Evan J., and Henry W. Pennline. Photochemical Removal of Mercury from Flue Gas.
Ind. Eng. Chem. Res. 41, 22 (2002): 5470-5476.
Grant Glover, T., Gregory W. Peterson, Bryan J. Schindler, David Britt, and Omar Yaghi. MOF-
74 building unit has a direct impact on toxic gas adsorption. Chemical Engineering Science
66, 2 (2011): 163-170.
Greathouse, Jeffery A., Tiffany L. Kinnibrugh, and Mark D. Allendorf. Adsorption and
Separation of Noble Gases by IRMOF-1: Grand Canonical Monte Carlo Simulations. Ind.
Eng. Chem. Res. 48, 7 (2009): 3425-3431.
Greathouse, Jeffery A., and Mark D. Allendorf. The Interaction of Water with MOF-5 Simulated
by Molecular Dynamics. J. Am. Chem. Soc. 128, 33 (2006): 10678-10679.
Gregg, J. S.; Sing, K. S. W., Adsorption, Surface Area and Porosity;. 2nd ed.; Academic Press:
London, 1982; p 303.
Guillot, B. Journal of Molecular Liquids 2002, 101, 219.
Gutiérrez-Sevillano, Juan José, Sofia Calero, and Rajamani Krishna. Selective Adsorption of
Water from Mixtures with 1-Alcohols by Exploitation of Molecular Packing Effects in
CuBTC. J. Phys. Chem. C 119, 7 (2015): 3658-3666.
Haldoupis, Emmanuel, Sankar Nair, and David S. Sholl. Efficient Calculation of Diffusion
Limitations in Metal Organic Framework Materials: A Tool for Identifying Materials for
Kinetic Separations. J. Am. Chem. Soc. 132, 21 (2010): 7528-7539.

Bibliography
183
Hamon, Lomig. Comparative Study of Hydrogen Sulfide Adsorption in the MIL-53(Al, Cr, Fe),
MIL-47(V), MIL-100(Cr), and MIL-101(Cr) Metal-Organic Frameworks at Room
Temperature. J. Am. Chem. Soc. 131, 25 (2009): 8775-8777.
Han, Sang Soo, Hiroyasu Furukawa, Omar M. Yaghi, and William A. Goddard. Covalent
Organic Frameworks as Exceptional Hydrogen Storage Materials. J. Am. Chem. Soc. 130, 35
(2008): 11580-11581.
Hao, Shiyou, Hong Chang, Qiang Xiao, Yijun Zhong, and Weidong Zhu. One-Pot Synthesis and
CO2 Adsorption Properties of Ordered Mesoporous SBA-15 Materials Functionalized with
APTMS. J. Phys. Chem. C 115, 26 (2011): 12873-12882.
Harlick, Peter J. E., and Abdelhamid Sayari. Applications of Pore-Expanded Mesoporous Silicas.
3. Triamine Silane Grafting for Enhanced CO2 Adsorption. Ind. Eng. Chem. Res. 45, 9 (2006):
3248-3255.
Hasegawa, Yasuhisa, Kaori Watanabe, Katsuki Kusakabe, and Shigeharu Morooka. The
separation of CO2 using Y-type zeolite membranes ion-exchanged with alkali metal
cations. Separation and Purification Technology 22-23 (2001): 319-325.
Hatch, Courtney D., Jadon S. Wiese, Cameron C. Crane, Kenneth J. Harris, Hannah G. Kloss,
and Jonas Baltrusaitis. Water Adsorption on Clay Minerals As a Function of Relative
Humidity: Application of BET and Freundlich Adsorption Models. Langmuir 28, 3 (2012):
1790-1803.
Hedin, Niklas, Linnéa Andersson, Lennart Bergström, and Jinyue Yan. Adsorbents for the post-
combustion capture of CO2 using rapid temperature swing or vacuum swing adsorption.
Applied Energy 104 (2013): 418-433.
Herm, Zoey R., Joseph A. Swisher, Berend Smit, Rajamani Krishna, and Jeffrey R. Long. Metal-
Organic Frameworks as Adsorbents for Hydrogen Purification and Precombustion Carbon
Dioxide Capture. J. Am. Chem. Soc. 133, 15 (2011): 5664-5667.
Heymans, N., S. Vaesen, and G. De Weireld. A complete procedure for acidic gas separation by
adsorption on MIL-53 (Al). Microporous and Mesoporous Materials 154 (2012): 93-99.
Hicks, Jason C., Jeffrey H. Drese, Daniel J. Fauth, McMahan L. Gray, Genggeng Qi, and
Christopher W. Jones. Designing Adsorbents for CO2 Capture from Flue Gas-
Hyperbranched Aminosilicas Capable of Capturing CO2 Reversibly. J. Am. Chem. Soc. 130,
10 (2008): 2902-2903.
Himeno, Shuji, Toshihiro Tomita, Kenji Suzuki, and Shuichi Yoshida. Characterization and
selectivity for methane and carbon dioxide adsorption on the all-silica DD3R zeolite.
Microporous and Mesoporous Materials 98, 1-3 (2007): 62-69.
Ho, Minh T., Guy W. Allinson, and Dianne E. Wiley. Reducing the Cost of CO2 Capture from
Flue Gases Using Pressure Swing Adsorption. Ind. Eng. Chem. Res. 47, 14 (2008): 4883-4890.
House, Kurt Zenz, Charles F. Harvey, Michael J. Aziz, and Daniel P. Schrag. The energy penalty
of post-combustion CO2 capture \& storage and its implications for retrofitting the U.S.
installed base. Energy Environ. Sci. 2, 2 (2009): 193-205.

Bibliography
184
Hu, Xiao Liang, and Angelos Michaelides. Water on the hydroxylated (0 0 1) surface of
kaolinite: From monomer adsorption to a flat 2D wetting layer. Surface Science 602, 4 (2008):
960-974.
Huang, Chih-Hung, Kai-Ping Chang, Ching-Tsung Yu, Pen-Chi Chiang, and Chu-Fan Wang.
Development of high-temperature CO2 sorbents made of CaO-based mesoporous silica.
Chemical Engineering Journal 161, 1-2 (2010): 129-135.
Huck, Johanna M.. Evaluating different classes of porous materials for carbon capture. Energy
Environ. Sci. 7, 12 (2014): 4132-4146.
Jacobs, Peter A., Franz H. van Cauwelaert, and Etienne F. Vansant. Surface probing of synthetic
faujasites by adsorption of carbon dioxide. Part 2. Infra-red study of carbon dioxide
adsorbed on x zeolites exchanged with mono- and bi-valent ions. J. Chem. Soc., Faraday
Trans. 1 69, 0 (1973): 2130-2139.
Jaramillo, E., and M. Chandross. Adsorption of Small Molecules in LTA Zeolites. 1. NH3, CO2,
and H2O in Zeolite 4A. J. Phys. Chem. B 108, 52 (2004): 20155-20159.
Jaramillo, Eugenio, and Scott M. Auerbach. New Force Field for Na Cations in Faujasite-Type
Zeolites. J. Phys. Chem. B 103, 44 (1999): 9589-9594.
Jiang, Hai-Long, and Qiang Xu. Porous metal-organic frameworks as platforms for functional
applications. Chem. Commun. 47, 12 (2011): 3351-3370.
Jiang, Jianwen, Ravichandar Babarao, and Zhongqiao Hu. Molecular simulations for energy,
environmental and pharmaceutical applications of nanoporous materials: from zeolites,
metal-organic frameworks to protein crystals. Chem. Soc. Rev. 40, 7 (2011): 3599-3612.
Jiang, Jianwen, and Stanley I. Sandler. Monte Carlo Simulation for the Adsorption and
Separation of Linear and Branched Alkanes in IRMOF-1. Langmuir 22, 13 (2006): 5702-5707.
Jobic, Hervé, and Doros N. Theodorou. Quasi-elastic neutron scattering and molecular
dynamics simulation as complementary techniques for studying diffusion in zeolites.
Microporous and Mesoporous Materials 102, 1-3 (2007): 21-50.
Karra, Jagadeswara R., and Krista S. Walton. Effect of Open Metal Sites on Adsorption of Polar
and Nonpolar Molecules in Metal-Organic Framework CuBTC. Langmuir 24, 16 (2008):
8620-8626.
Karra, Jagadeswara R., and Krista S. Walton. Molecular Simulations and Experimental Studies
of CO2, CO, and N2 Adsorption in Metal-Organic Frameworks. J. Phys. Chem. C 114, 37
(2010): 15735-15740.
Keskin, Seda, Jinchen Liu, J. Karl Johnson, and David S. Sholl. Atomically detailed models of
gas mixture diffusion through CuBTC membranes. Microporous and Mesoporous Materials
125, 1-2 (2009): 101-106.
Ketko, MaryBeth H., Ganesh Kamath, and Jeffrey J. Potoff. Development of an Optimized
Intermolecular Potential for Sulfur Dioxide. J. Phys. Chem. B 115, 17 (2011): 4949-4954.
Bibliography
185
Khelifa, Amine, Leila Benchehida, and Zoubir Derriche. Adsorption of carbon dioxide by X
zeolites exchanged with Ni2+ and Cr3+: isotherms and isosteric heat. Journal of Colloid and
Interface Science 278, 1 (2004): 9-17.
Kikkinides, E. S., R. T. Yang, and S. H. Cho. Concentration and recovery of carbon dioxide from
flue gas by pressure swing adsorption. Ind. Eng. Chem. Res. 32, 11 (1993): 2714-2720.
Kim, Se-Na, Won-Jin Son, Jung-Sik Choi, and Wha-Seung Ahn. CO2 adsorption using amine-
functionalized mesoporous silica prepared via anionic surfactant-mediated synthesis.
Microporous and Mesoporous Materials 115, 3 (2008): 497-503.
Kiselev, A. V. Lopatkin, A. A. and Shulga, A. A.. Zeolites 5, 261-267 (1985).
Kitagawa, Susumu, Ryo Kitaura, and Shin-ichiro Noro. Functional Porous Coordination
Polymers. Angewandte Chemie International Edition 43, 18 (2004): 2334-2375.
Ko, Daeho, Ranjani Siriwardane, and Lorenz T. Biegler. Optimization of a Pressure-Swing
Adsorption Process Using Zeolite 13X for CO2 Sequestration. Ind. Eng. Chem. Res. 42, 2
(2003): 339-348.
Koehler, K. A., S. M. Kreidenweis, P. J. DeMott, M. D. Petters, A. J. Prenni, and C. M. Carrico.
Hygroscopicity and cloud droplet activation of mineral dust aerosol. Geophys. Res. Lett. 36,
8 (2009): L08805.
Kohl, Arthur L., and Richard Nielsen. Gas Purification, Fifth Edition. 5 edition. Houston, Tex:
Gulf Professional Publishing, 1997.
Konduru, Naveen, Peter Lindner, and Nada Marie Assaf-Anid. Curbing the greenhouse effect
by carbon dioxide adsorption with Zeolite 13X. AIChE J. 53, 12 (2007): 3137-3143.
Krishna, Rajamani, and Jasper M. van Baten. A comparison of the CO2 capture characteristics of
zeolites and metal-organic frameworks. Separation and Purification Technology 87 (2012): 120-
126.
Krishna, Rajamani, and Jasper M. van Baten. Comment on Comparative Molecular Simulation
Study of CO2/N2 and CH4/N2 Separation in Zeolites and Metal-Organic Frameworks.
Langmuir 26, 4 (2010): 2975-2978.
Krishna, Rajamani, and Jasper M. van Baten. In silico screening of zeolite membranes for CO2
capture. Journal of Membrane Science 360, 1-2 (2010): 323-333.
Krishna, Rajamani, and Jeffrey R. Long. Screening Metal-Organic Frameworks by Analysis of
Transient Breakthrough of Gas Mixtures in a Fixed Bed Adsorber. J. Phys. Chem. C 115, 26
(2011): 12941-12950.
Krungleviciute, V. Argon Adsorption on Cu3(Benzene-1,3,5-tricarboxylate)2(H2O)3 Metal-
Organic Framework. Langmuir 23, 6 (2007): 3106-3109.
Kulkarni, Ambarish R., and David S. Sholl. Analysis of Equilibrium-Based TSA Processes for
Direct Capture of CO2 from Air. Ind. Eng. Chem. Res. 51, 25 (2012): 8631-8645.
Kusakabe, Katsuki, Takahiro Kuroda, Atsushi Murata, and Shigeharu Morooka. Formation of a
Y-Type Zeolite Membrane on a Porous ?-Alumina Tube for Gas Separation. Ind. Eng. Chem.
Res. 36, 3 (1997): 649-655.

Bibliography
186
Küsgens, Pia. Characterization of metal-organic frameworks by water adsorption. Microporous
and Mesoporous Materials 120, 3 (2009): 325-330.
Landau, D. P.; Binder, K. A guide to Monte Carlo simulations in statistical physics; Cambridge
University Press: New York, 2002.
Langmuir,I. J. Am. Chem. Soc. 38, 2221 (1916)
Laspéras, Monique, Hélène Cambon, Daniel Brunel, Isabel Rodriguez, and Patrick Geneste.
Cesium oxide encapsulation in faujasite zeolites effect of framework composition on the
nature and basicity of intrazeolitic species. Microporous Materials 7, 2-3 (1996): 61-72.
Leach, A.R. Molecular Modelling: Principles and Application, 2nd ed., Prentice-Hall,
Englewood Cliffs, NJ, (2001).
Leal, Orlyo, Carmelo Bolívar, César Ovalles, Juan José García, and Youssef Espidel. Reversible
adsorption of carbon dioxide on amine surface-bonded silica gel. Inorganica Chimica Acta
240, 1-2 (1995): 183-189.
Lee, K. B., and S. Sircar. Removal and recovery of compressed CO2 from flue gas by a novel
thermal swing chemisorption process. AIChE J. 54, 9 (2008): 2293-2302.
Lee, Yong-Gon, Hoi Ri Moon, Young Eun Cheon, and Myunghyun Paik Suh. A Comparison of
the H2 Sorption Capacities of Isostructural Metal-Organic Frameworks With and Without
Accessible Metal Sites: [\Zn2(abtc)(dmf)2\3] and [\Cu2(abtc)(dmf)2\3] versus
[\Cu2(abtc)\3]. Angewandte Chemie International Edition 47, 40 (2008): 7741-7745.
Levasseur, Benoit, Camille Petit, and Teresa J. Byosz. Reactive Adsorption of NO2 on Copper-
Based Metal-Organic Framework and Graphite Oxide/Metal-Organic Framework
Composites. ACS Appl. Mater. Interfaces 2, 12 (2010): 3606-3613.
Li, Gang, Penny Xiao, Paul A. Webley, Jun Zhang, and Ranjeet Singh. Competition of
CO2/H2O in adsorption based CO2 capture. Energy Procedia 1, 1 (2009): 1123-1130.
Li, Gang, Penny Xiao, Paul Webley, Jun Zhang, Ranjeet Singh, and Marc Marshall. Capture of
CO2 from high humidity flue gas by vacuum swing adsorption with zeolite 13X. Adsorption
14, 2-3 (2008): 415-422.
Li, Hailian, Mohamed Eddaoudi, M. O'Keeffe, and O. M. Yaghi. Design and synthesis of an
exceptionally stable and highly porous metal-organic framework. Nature 402, 6759 (1999):
276-279.
Li, Jian-Rong, Julian Sculley, and Hong-Cai Zhou. Metal-Organic Frameworks for Separations.
Chem. Rev. 112, 2 (2012): 869-932.
Li, Jian-Rong, Ryan J. Kuppler, and Hong-Cai Zhou. Selective gas adsorption and separation in
metal-organic frameworks. Chem. Soc. Rev. 38, 5 (2009): 1477-1504.
Li, Yingwei, and Ralph T. Yang. Gas Adsorption and Storage in Metal-Organic Framework
MOF-177. Langmuir 23, 26 (2007): 12937-12944.
Liang, Zhijian, Marc Marshall, and Alan L. Chaffee. CO2 Adsorption-Based Separation by Metal
Organic Framework (CuBTC) versus Zeolite (13X). Energy Fuels 23, 5 (2009): 2785-2789.

Bibliography
187
Liu, Bei, and Berend Smit. Molecular Simulation Studies of Separation of CO2/N2, CO2/CH4,
and CH4/N2 by ZIFs. J. Phys. Chem. C 114, 18 (2010): 8515-8522.
Liu, Dahuan, Chengcheng Zheng, Qingyuan Yang, and Chongli Zhong. Understanding the
Adsorption and Diffusion of Carbon Dioxide in Zeolitic Imidazolate Frameworks: A
Molecular Simulation Study. J. Phys. Chem. C 113, 12 (2009): 5004-5009.
Liu, Jian, Yu Wang, Annabelle I. Benin, Paulina Jakubczak, Richard R. Willis, and M. Douglas
LeVan. CO2/H2O Adsorption Equilibrium and Rates on Metal-Organic Frameworks:
HKUST-1 and Ni/DOBDC. Langmuir 26, 17 (2010): 14301-14307.
Liu, Qing, Liqi Ning, Shudong Zheng, Mengna Tao, Yao Shi, and Yi He. Adsorption of Carbon
Dioxide by MIL-101(Cr): Regeneration Conditions and Influence of Flue Gas
Contaminants. Sci. Rep. 3 (2013).
Liu, Yunhua, Dahuan Liu, Qingyuan Yang, Chongli Zhong, and Jianguo Mi. Comparative
Study of Separation Performance of COFs and MOFs for CH4/CO2/H2 Mixtures. Ind. Eng.
Chem. Res. 49, 6 (2010): 2902-2906.
Lopes, Filipe V. S., Carlos A. Grande, and Alírio E. Rodrigues. Fast-cycling VPSA for hydrogen
purification. Fuel 93 (2012): 510-523.
López-Aranguren, P.; Builes, S.; Fraile, J., Vega, L. F.; Domingo, C. Understanding the
performance of new amine-functionalized mesoporous silica materials for CO2 adsorption.
Ind. Eng. Chem. Res. 2014, 53(40): 15611-15619.
Loureiro, José Miguel, and Mykola T. Kartel, . Combined and Hybrid Adsorbents. Springer
Netherlands, 2006.
Low, John J., Annabelle I. Benin, Paulina Jakubczak, Jennifer F. Abrahamian, Syed A. Faheem,
and Richard R. Willis. Virtual High Throughput Screening Confirmed Experimentally:
Porous Coordination Polymer Hydration. J. Am. Chem. Soc. 131, 43 (2009): 15834-15842.
Llewellyn, Philip L., Sandrine Bourrelly, Christian Serre, Yaroslav Filinchuk, and Gérard Férey.
How Hydration Drastically Improves Adsorption Selectivity for CO2 over CH4 in the
Flexible Chromium Terephthalate MIL-53. Angewandte Chemie International Edition 45, 46
(2006): 7751-7754.
Llewellyn, Philip L. High Uptakes of CO2 and CH4 in Mesoporous Metal-Organic Frameworks
MIL-100 and MIL-101. Langmuir 24, 14 (2008): 7245-7250.
Ma, Shengqian, Daofeng Sun, Daqiang Yuan, Xi-Sen Wang, and Hong-Cai Zhou. Preparation
and Gas Adsorption Studies of Three Mesh-Adjustable Molecular Sieves with a Common
Structure. J. Am. Chem. Soc. 131, 18 (2009): 6445-6451.
Mahoney, M. W.; Jorgensen, W. L. Journal of Chemical Physics 2000, 112, 8910.
Martin, M.G.; Siepmann, J.I. J. Am. Chem. Soc. 1997, 119, 8921-8924.
Martín, C. F., M. G. Plaza, J. J. Pis, F. Rubiera, C. Pevida, and T. A. Centeno. On the limits of
CO2 capture capacity of carbons. Separation and Purification Technology 74, 2 (2010): 225-229.

Bibliography
188
Martín-Calvo, Ana, Elena García-Pérez, Juan Manuel Castillo, and Sofia Calero. Molecular
simulations for adsorption and separation of natural gas in IRMOF-1 and CuBTC metal-
organic frameworks. Phys. Chem. Chem. Phys. 10, 47 (2008): 7085-7091.
Mason, Jarad A., Kenji Sumida, Zoey R. Herm, Rajamani Krishna, and Jeffrey R. Long.
Evaluating metal-organic frameworks for post-combustion carbon dioxide capture via
temperature swing adsorption. Energy Environ. Sci. 4, 8 (2011): 3030-3040.
Maurin, G., P. L. Llewellyn, and R. G. Bell. Adsorption Mechanism of Carbon Dioxide in
Faujasites: Grand Canonical Monte Carlo Simulations and Microcalorimetry
Measurements. J. Phys. Chem. B 109, 33 (2005): 16084-16091.
Mayo, Stephen L., Barry D. Olafson, and William A. Goddard. DREIDING: a generic force field
for molecular simulations. J. Phys. Chem. 94, 26 (1990): 8897-8909.
McCash., E. M., Surface chemistry. Oxford University Press: Oxford 2001; p 177.
McEwen, Joe, Jim-Dario Hayman, and A. Özgür Yazaydin. A comparative study of CO2, CH4
and N2 adsorption in ZIF-8, Zeolite-13X and BPL activated carbon. Chemical Physics 412
(2013): 72-76.
Meek, Scott T., Jeffery A. Greathouse, and Mark D. Allendorf. Metal-Organic Frameworks:
Metal-Organic Frameworks: A Rapidly Growing Class of Versatile Nanoporous Materials.
Adv. Mater. 23, 2 (2011): 141-141.
Merel, Jérôme, Marc Clausse, and Francis Meunier. Experimental Investigation on CO2 Post-
Combustion Capture by Indirect Thermal Swing Adsorption Using 13X and 5A Zeolites.
Ind. Eng. Chem. Res. 47, 1 (2008): 209-215.
Metropolis, N.; Rosenbluth, A.W.; Rosenbluth, M.N.; Teller, A.N.; Teller, E. J. Chem. Phys. 1953,
21, 1087–1092.
Metropolis, N. Los Alamos Science 1987, 12, 125–130.
Millward, Andrew R., and Omar M. Yaghi. Metal-Organic Frameworks with Exceptionally
High Capacity for Storage of Carbon Dioxide at Room Temperature. J. Am. Chem. Soc. 127,
51 (2005): 17998-17999.
Moellmer, J. Insights on Adsorption Characterization of Metal-Organic Frameworks: A
Benchmark Study on the Novel soc-MOF. Microporous and Mesoporous Materials 129, 3
(2010): 345-353.
Mueller, U., M. Schubert, F. Teich, H. Puetter, K. Schierle-Arndt, and J. Pastré. Metal-organic
frameworks prospective industrial applications. J. Mater. Chem. 16, 7 (2006): 626-636.
Murray, B. J., S. L. Broadley, T. W. Wilson, J. D. Atkinson, and R. H. Wills. Heterogeneous
freezing of water droplets containing kaolinite particles. Atmos. Chem. Phys. 11, 9 (2011):
4191-4207.
Myers, A. L., and J. M. Prausnitz. Thermodynamics of mixed-gas adsorption. AIChE J. 11, 1
(1965): 121-127.
Neumann, M. Molecular Physics 1983, 50, 841.

Bibliography
189
Niu, Ji-Nan, and Ying-Huai Qiang. Molecular Dynamics Simulation on Structure of Water
Molecules in a Kaolinite-Water System. Acta Physico-Chimica Sinica 25, 6 (2009): 1-3.
Norman, G. E.; Filinov, V. S. High Temperature 1969, 7, 216.
O'Keeffe, Michael, and Omar M. Yaghi. Deconstructing the Crystal Structures of Metal-Organic
Frameworks and Related Materials into Their Underlying Nets. Chem. Rev. 112, 2 (2012):
675-702.
Olajire, Abass A. CO2 capture and separation technologies for end-of-pipe applications: A
review. Energy 35, 6 (2010): 2610-2628.
Pacciani, R.. Influence of the Concentration of CO2 and SO2 on the Absorption of CO2 by a
Lithium Orthosilicate-Based Absorbent. Environ. Sci. Technol. 45, 16 (2011): 7083-7088.
Palomino, Miguel, Avelino Corma, Jose L. Jordá, Fernando Rey, and Susana Valencia. Zeolite
Rho: a highly selective adsorbent for CO2/CH4 separation induced by a structural phase
modification. Chem. Commun. 48, 2 (2011): 215-217.
Panagiotopoulos, A. Z.. Molecular Physics 61(4), 813-826 (1987).
Papadopoulos, George K., Hervé Jobic, and Doros N. Theodorou. Transport Diffusivity of N2
and CO2 in Silicalite: Coherent Quasielastic Neutron Scattering Measurements and
Molecular Dynamics Simulations. J. Phys. Chem. B 108, 34 (2004): 12748-12756.
Park, Jinhee, Daqiang Yuan, Khanh T. Pham, Jian-Rong Li, Andrey Yakovenko, and Hong-Cai
Zhou. Reversible Alteration of CO2 Adsorption upon Photochemical or Thermal Treatment
in a Metal-Organic Framework. J. Am. Chem. Soc. 134, 1 (2012): 99-102.
Parkes, Marie V., Chad L. Staiger, John J. Perry Iv, Mark D. Allendorf, and Jeffery A.
Greathouse. Screening metal-organic frameworks for selective noble gas adsorption in air:
effect of pore size and framework topology. Phys. Chem. Chem. Phys. 15, 23 (2013): 9093-
9106.
Pathria, R. K. Statistical Mechanics, Second ed.; Butterworth-Heinemann: Oxford, 1996; Vol. 1.
Patra, M.; Karttunen, M.; Hyvonen, M. T.; Falck, E.; Lindqvist, P.; Vattulainen, I. Biophysics
Journal 2003, 84, 3636.
Petit, Camille, and Teresa J. Byosz. Exploring the coordination chemistry of MOF/graphite
oxide composites and their applications as adsorbents. Dalton Trans. 41, 14 (2012): 4027-
4035.
Pirngruber, Gerhard D., Stefania Cassiano-Gaspar, Sylvain Louret, Alexandra Chaumonnot,
and Bruno Delfort. Amines immobilized on a solid support for postcombustion CO2
capture: A preliminary analysis of the performance in a VSA or TSA process based on the
adsorption isotherms and kinetic data. Energy Procedia 1, 1 (2009): 1335-1342.
Plaza, M. G., C. Pevida, A. Arenillas, F. Rubiera, and J. J. Pis. CO2 capture by adsorption with
nitrogen enriched carbons. Fuel 86, 14 (2007): 2204-2212.
Plaza, M. G., S. García, F. Rubiera, J. J. Pis, and C. Pevida. Post-combustion CO2 capture with a
commercial activated carbon: Comparison of different regeneration strategies. Chemical
Engineering Journal 163, 1-2 (2010): 41-47.

Bibliography
190
Poling, Bruce, John Prausnitz, and John O. Connell. The Properties of Gases and Liquids. McGraw
Hill Professional, 2000.
Potoff, Jeffrey J., and J. Ilja Siepmann. Vapor-liquid equilibria of mixtures containing alkanes,
carbon dioxide, and nitrogen. AIChE J. 47, 7 (2001): 1676-1682.
Powell, Clem E., and Greg G. Qiao. Polymeric CO2/N2 gas separation membranes for the
capture of carbon dioxide from power plant flue gases. Journal of Membrane Science 279, 1-2
(2006): 1-49.
Prasad, Thazhe Kootteri, Dae Ho Hong, and Myunghyun Paik Suh. High Gas Sorption and
Metal-Ion Exchange of Microporous Metal-Organic Frameworks with Incorporated Imide
Groups. Chem. Eur. J. 16, 47 (2010): 14043-14050.
Prausnitz, J.M., Lichtenthaler, R.N, Gomes, E. Termodinámica Molecular de los equilibrios de
fases.3rd edición. Prentice Hall. España. 2000.
Prestipino, C.. Local Structure of Framework Cu(II) in HKUST-1 Metallorganic Framework:
Spectroscopic Characterization upon Activation and Interaction with Adsorbates. Chem.
Mater. 18, 5 (2006): 1337-1346.
Qiu, Shilun, Ming Xue, and Guangshan Zhu. Metal-organic framework membranes: from
synthesis to separation application. Chem. Soc. Rev. 43, 16 (2014): 6116-6140.
Ramsahye, N. A., G. Maurin, S. Bourrelly, P. Llewellyn, T. Loiseau, and G. Ferey. Charge
distribution in metal organic framework materials: transferability to a preliminary
molecular simulation study of the CO2 adsorption in the MIL-53 (Al) system. Phys. Chem.
Chem. Phys. 9, 9 (2007): 1059-1063.
Rankin, Rees B., Jinchen Liu, Anant D. Kulkarni, and J. Karl Johnson. Adsorption and Diffusion
of Light Gases in ZIF-68 and ZIF-70: A Simulation Study. J. Phys. Chem. C 113, 39 (2009):
16906-16914.
Rappe, A. K., C. J. Casewit, K. S. Colwell, W. A. Goddard, and W. M. Skiff. UFF, a full periodic
table force field for molecular mechanics and molecular dynamics simulations. J. Am.
Chem. Soc. 114, 25 (1992): 10024-10035.
Rege, Salil U., and Ralph T. Yang. Kinetic Separation of Oxygen and Argon Using Molecular
Sieve Carbon. Adsorption 6, 1 (2000): 15-22.
Ribeiro, Ana M., João C. Santos, Alírio E. Rodrigues, and Sébastien Rifflart. Pressure Swing
Adsorption Process in Coal to Fischer-Tropsch Fuels with CO2 Capture. Energy Fuels 26, 2
(2012): 1246-1253.
Rosenbluth, A. W., Metropolis, N. and Teller, A. H.. Journal of Chemical Physics 21, 1087–1092
(1953).
Rouquerol, F., Roquerol, J., Sing, K., Adsorption by Powders and Porous Solids, 1998, Academic
Press, San Diego
Rowsell, Jesse L. C., Elinor C. Spencer, Juergen Eckert, Judith A. K. Howard, and Omar M.
Yaghi. Gas Adsorption Sites in a Large-Pore Metal-Organic Framework. Science 309, 5739
(2005): 1350-1354.

Bibliography
191
Rowsell, Jesse L. C., and Omar M. Yaghi. Metal-organic frameworks: a new class of porous
materials. Microporous and Mesoporous Materials 73, 1-2 (2004): 3-14.
Rowsell, Jesse L. C., and Omar M. Yaghi. Strategies for Hydrogen Storage in Metal-Organic
Frameworks. Angewandte Chemie International Edition 44, 30 (2005): 4670-4679.
Safarifard, Vahid, and Ali Morsali. Influence of an amine group on the highly efficient
reversible adsorption of iodine in two novel isoreticular interpenetrated pillared-layer
microporous metal-organic frameworks. CrystEngComm 16, 37 (2014): 8660-8663.
Saha, Dipendu, and Shuguang Deng. Adsorption equilibrium and kinetics of CO2, CH4, N2O,
and NH3 on ordered mesoporous carbon. Journal of Colloid and Interface Science 345, 2
(2010): 402-409.
Saha, Dipendu, Zongbi Bao, Feng Jia, and Shuguang Deng. Adsorption of CO2, CH4, N2O, and
N2 on MOF-5, MOF-177, and Zeolite 5A. Environ. Sci. Technol. 44, 5 (2010): 1820-1826.
Salles, Fabrice, Aziz Ghoufi, Guillaume Maurin, Robert, G. Bell, Caroline Mellot-Draznieks, and
Gérard Férey. Molecular Dynamics Simulations of Breathing MOFs: Structural
Transformations of MIL-53(Cr) upon Thermal Activation and CO2 Adsorption. Angewandte
Chemie International Edition 47, 44 (2008): 8487-8491.
Sayari, Abdelhamid, and Youssef Belmabkhout. Stabilization of Amine-Containing CO2
Adsorbents: Dramatic Effect of Water Vapor. J. Am. Chem. Soc. 132, 18 (2010): 6312-6314.
Sayari, Abdelhamid, Youssef Belmabkhout, and Rodrigo Serna-Guerrero. Flue gas treatment via
CO2 adsorption. Chemical Engineering Journal 171, 3 (2011): 760-774.
Schuttlefield, Jennifer D., David Cox, and Vicki H. Grassian. An investigation of water uptake
on clays minerals using ATR-FTIR spectroscopy coupled with quartz crystal microbalance
measurements. J. Geophys. Res. 112, D21 (2007): D21303.
Serna-Guerrero, Rodrigo, and Abdelhamid Sayari. Modeling adsorption of CO2 on amine-
functionalized mesoporous silica. 2: Kinetics and breakthrough curves. Chemical
Engineering Journal 161, 1-2 (2010): 182-190.
Serna-Guerrero, Rodrigo, Youssef Belmabkhout, and Abdelhamid Sayari. Influence of
regeneration conditions on the cyclic performance of amine-grafted mesoporous silica for
CO2 capture: An experimental and statistical study. Chemical Engineering Science 65, 14
(2010): 4166-4172.
Shaw, D. J., Introduction to colloid and surface chemistry. 3rd ed.; Butterworths: London, 1980;
p 273.
Shelley, J. C., and G. N. Patey. A configuration bias Monte Carlo method for water. The Journal
of Chemical Physics 102, 19 (1995): 7656-7663.
Siepmann, J. I. Computer simulation of biomolecular systems: theoretical and experimental
applications; Escom Science Publisher: Leiden, 1993.
Siepmann, J. I.; Frenkel, D. Molecular Physics 1992, 75, 59.
Silvestre-Albero, Joaquín, Anass Wahby, Antonio Sepúlveda-Escribano, Manuel Martínez-
Escandell, Katsumi Kaneko, and Francisco Rodríguez-Reinoso. Ultrahigh CO2 adsorption

Bibliography
192
capacity on carbon molecular sieves at room temperature. Chem. Commun. 47, 24 (2011):
6840-6842.
Simmons, Jason M., Hui Wu, Wei Zhou, and Taner Yildirim. Carbon capture in metal-organic
frameworks: a comparative study. Energy Environ. Sci. 4, 6 (2011): 2177-2185.
Sing, K. W.; Everett, D. H.; Haul, R. A. W.; Moscou, L.; Pierotti, R. A.; Rouquerol, J.;
Siemieniewska, T., Reporting physisorption data for gas/solid systems with special
reference to the determination of surface area and porosity. Pure Appl. Chem. 1985, 57, (4),
603-19.
Siriwardane, Ranjani V., Ming-Shing Shen, and Edward P. Fisher. Adsorption of CO2, N2, and
O2 on Natural Zeolites. Energy Fuels 17, 3 (2003): 571-576.
Smirnov, Konstantin S., and Daniel Bougeard. A Molecular Dynamics Study of Structure and
Short-time Dynamics of Water in Kaolinite. J. Phys. Chem. B 103, 25 (1999): 5266-5273.
Snurr, Randall Q., Joseph T. Hupp, and SonBinh T. Nguyen. Prospects for nanoporous metal-
organic materials in advanced separations processes. AIChE J. 50, 6 (2004): 1090-1095.
Sokolik, F., Y. Guissani, and B. Guillot. Molecular dynamics simulations of thermodynamic and
structural properties of liquid SO2. Molecular Physics 56, 2 (1985): 239-253.
Steinbach, P. J.; Brooks, B. R. Journal of Computational Chemistry 1994, 15, 667.
Stephenson, Dale J., Charles I. Fairchild, Roy M. Buchan, and Maxine E. Dakins. A Fiber
Characterization of the Natural Zeolite, Mordenite: A Potential Inhalation Health Hazard.
Aerosol Science and Technology 30, 5 (1999): 467-476.
Stern, H. A.; Rittner, F.; Berne, B. J.; Friesner, R. A. Journal of Chemical Physics 2001, 115, 2237.
Sullivan, R. C., M. J. K. Moore, M. D. Petters, S. M. Kreidenweis, G. C. Roberts, and K. A.
Prather. Effect of chemical mixing state on the hygroscopicity and cloud nucleation
properties of calcium mineral dust particles. Atmos. Chem. Phys. 9, 10 (2009): 3303-3316.
Sumida, Kenji. Carbon Dioxide Capture in Metal-Organic Frameworks. Chem. Rev. 112, 2 (2012):
724-781.
Sun, Weizhen, Li-Chiang Lin, Xuan Peng, and Berend Smit. Computational screening of porous
metal-organic frameworks and zeolites for the removal of SO2 and NOx from flue gases.
AIChE J. 60, 6 (2014): 2314-2323.
Sun, Yan, Xiu-Wu Liu, Wei Su, Yaping Zhou, and Li Zhou. Studies on ordered mesoporous
materials for potential environmental and clean energy applications. Applied Surface Science
253, 13 (2007): 5650-5655.
Svensson, E. A., C. Delval, P. von Hessberg, M. S. Johnson, and J. B. C. Pettersson. Freezing of
water droplets colliding with kaolinite particles. Atmos. Chem. Phys. 9, 13 (2009): 4295-4300.
Tagliabue, Marco. Natural gas treating by selective adsorption: Material science and chemical
engineering interplay. Chemical Engineering Journal 155, 3 (2009): 553-566.
Tan, Jin Chong, Thomas D. Bennett, and Anthony K. Cheetham. Chemical structure, network
topology, and porosity effects on the mechanical properties of Zeolitic Imidazolate
Frameworks. PNAS 107, 22 (2010): 9938-9943.

Bibliography
193
Tlili, Nabil, Georges Grévillot, and Cécile Vallières. Carbon dioxide capture and recovery by
means of TSA and/or VSA. International Journal of Greenhouse Gas Control 3, 5 (2009): 519-
527.
Tokarský, Jonáš, Pavla Rapková, and Jaroslav V. Burda. Structure and stability of
kaolinite/TiO2 nanocomposite: DFT and MM computations. J Mol Model 18, 6 (2011): 2689-
2698.
Torrisi, Antonio, Caroline Mellot-Draznieks, and Robert G. Bell. Impact of ligands on CO2
adsorption in metal-organic frameworks: First principles study of the interaction of CO2
with functionalized benzenes. II. Effect of polar and acidic substituents. The Journal of
Chemical Physics 132, 4 (2010): 044705.
Torrisi, Antonio, Robert G. Bell, and Caroline Mellot-Draznieks. Functionalized MOFs for
Enhanced CO2 Capture. Crystal Growth \& Design 10, 7 (2010): 2839-2841.
Tunega, Daniel, Martin H. Gerzabek, and Hans Lischka. Ab Initio Molecular Dynamics Study of
a Monomolecular Water Layer on Octahedral and Tetrahedral Kaolinite Surfaces. J. Phys.
Chem. B 108, 19 (2004): 5930-5936.
Ungerer, P.; Tavitian, B.; Boutin, A., Applications of molecular simulation in the oil andgas
industry IFP publications; Paris, 2005.
Vaidhyanathan, Ramanathan, Simon S. Iremonger, Karl W. Dawson, and George K. H. Shimizu.
An amine-functionalized metal organic framework for preferential CO2adsorption at low
pressures. Chem. Commun., 35 (2009): 5230-5232.
Valderrama, J. O.; Vargas, D. A. Applied Thermal Engineering 2003, 23, 1417.
Valenzano, L., B. Civalleri, S. Chavan, G. T. Palomino, C. O. Areán, and S. Bordiga.
Computational and Experimental Studies on the Adsorption of CO, N2, and CO2 on Mg-
MOF-74. J. Phys. Chem. C 114, 25 (2010): 11185-11191.
Vega, L.F. El CO2 como recurso: de la captura a los usos industriales, (2010) Guías Técnicas y de
Medio Ambiente, 19, Fundación Gas Natural, ISBN: 978-84-614-1195-5. Second edition,
2011.
Vlugt, T. J. H., E. García-Pérez, D. Dubbeldam, S. Ban, and S. Calero. Computing the Heat of
Adsorption using Molecular Simulations: The Effect of Strong Coulombic Interactions. J.
Chem. Theory Comput. 4, 7 (2008): 1107-1118.
Vlugt, T.J.H.; Zhu, W.; Kapteijn, F.; Moulijn, J.A.; Smit, B.; Krishna, R. J. Am. Chem. Soc. 1998,
120, 5599–5600.
Vlugt, T. J. H.; Krishna, R.; Smit, B. Journal of Physical Chemistry B 1999, 103, 1102-1118.
Wagner, W.; Pruss, A. Journal of Physical and Chemical Reference Data 2002, 31, 387.
Walton, Krista S. Understanding Inflections and Steps in Carbon Dioxide Adsorption Isotherms
in Metal-Organic Frameworks. J. Am. Chem. Soc. 130, 2 (2008): 406-407.
Wang, Bo, Adrien P. Côté, Hiroyasu Furukawa, Michael O'Keeffe, and Omar M. Yaghi. Colossal
cages in zeolitic imidazolate frameworks as selective carbon dioxide reservoirs. Nature 453,
7192 (2008): 207-211.

Bibliography
194
Wang, Qiang, Jizhong Luo, Ziyi Zhong, and Armando Borgna. CO2 capture by solid adsorbents
and their applications: current status and new trends. Energy Environ. Sci. 4, 1 (2010): 42-55.
Wang, Xueguang, Jerry C. C. Chan, Yao-Hung Tseng, and Soofin Cheng. Synthesis,
characterization and catalytic activity of ordered SBA-15 materials containing high loading
of diamine functional groups. Microporous and Mesoporous Materials 95, 1-3 (2006): 57-65.
Wang, Yu, and M. Douglas LeVan. Adsorption Equilibrium of Carbon Dioxide and Water
Vapor on Zeolites 5A and 13X and Silica Gel: Pure Components. J. Chem. Eng. Data 54, 10
(2009): 2839-2844.
Wang, Zhenqiang, and Seth M. Cohen. Postsynthetic modification of metal-organic
frameworks. Chem. Soc. Rev. 38, 5 (2009): 1315-1329.
Warne, M. R., N. L. Allan, and T. Cosgrove. Computer simulation of water molecules at
kaolinite and silica surfaces. Phys. Chem. Chem. Phys. 2, 16 (2000): 3663-3668.
Watanabe, K., N. Austin, and M. R. Stapleton. Investigation of the Air Separation Properties of
Zeolites Types A, X and Y by Monte Carlo Simulations. Molecular Simulation 15, 4 (1995):
197-221.
Watanabe, Taku, and David S. Sholl. Molecular chemisorption on open metal sites in Cu[sub
3](benzenetricarboxylate)[sub 2]: A spatially periodic density functional theory study. The
Journal of Chemical Physics 133, 9 (2010): 094509.
Wells, Brad A., Zhijian Liang, Marc Marshall, and Alan L. Chaffee. Modeling gas adsorption in
metal organic frameworks. Energy Procedia 1, 1 (2009): 1273-1280.
Wiersum, Andrew D., Jong-San Chang, Christian Serre, and Philip L. Llewellyn. An Adsorbent
Performance Indicator as a First Step Evaluation of Novel Sorbents for Gas Separations:
Application to Metal-Organic Frameworks. Langmuir 29, 10 (2013): 3301-3309.
Widom, B. Journal of Chemical Physics 1963, 39, 2808.
Wilmer, Christopher E., and Randall Q. Snurr. Towards rapid computational screening of
metal-organic frameworks for carbon dioxide capture: Calculation of framework charges
via charge equilibration. Chemical Engineering Journal 171, 3 (2011): 775-781.
Wolf, D.; Keblinski, P.; Phillpot, S. R.; Eggebrecht, J. Journal of Chemical Physics 1999, 110, 8254-
8282.
Wu, Dong, Qing Xu, Dahuan Liu, and Chongli Zhong. Exceptional CO2 Capture Capability and
Molecular-Level Segregation in a Li-Modified Metal-Organic Framework. J. Phys. Chem. C
114, 39 (2010): 16611-16617.
Xie, Jiangkun, Naiqiang Yan, Zan Qu, and Shijian Yang. Synthesis, characterization and
experimental investigation of CuBTC as CO2 adsorbent from flue gas. Journal of
Environmental Sciences 24, 4 (2012): 640-644.
Xu, Bo, and Larry Kevan. Formation of alkali metal particles in alkali metal cation exchanged X
zeolite exposed to alkali metal vapor: control of metal particle identity. J. Phys. Chem. 96, 6
(1992): 2642-2645.

Bibliography
195
Xu, Qing, and Chongli Zhong. A General Approach for Estimating Framework Charges in
Metal-Organic Frameworks. J. Phys. Chem. C 114, 11 (2010): 5035-5042.
Xue, Chunyu, Qingyuan Yang, and Chongli Zhong. Effects of the side pockets on gas separation
in metal-organic framework CuBTC: a molecular simulation study. Molecular Simulation 35,
15 (2009): 1249-1255.
Yaghi, Omar M., Michael O'Keeffe, Nathan W. Ockwig, Hee K. Chae, Mohamed Eddaoudi, and
Jaheon Kim. Reticular synthesis and the design of new materials. Nature 423, 6941 (2003):
705-714.
Yamazaki, Tatsuya, Masahiro Katoh, Sentaro Ozawa, and Yoshisada Ogino. Adsorption of CO2
over univalent cation-exchanged ZSM-5 zeolites. Molecular Physics 80, 2 (1993): 313-324.
Yang, Chi, Xiaoping Wang, and Mohammad A. Omary. Fluorous Metal-Organic Frameworks
for High-Density Gas Adsorption. J. Am. Chem. Soc. 129, 50 (2007): 15454-15455.
Yang, Qingyuan, Chongli Zhong, and Jian-Feng Chen. Computational Study of CO2 Storage in
Metal-Organic Frameworks. J. Phys. Chem. C 112, 5 (2008): 1562-1569.
Yang, Qingyuan, Chunyu Xue, Chongli Zhong, and Jian-Feng Chen. Molecular simulation of
separation of CO2 from flue gases in CuBTC metal-organic framework. AIChE J. 53, 11
(2007): 2832-2840.
Yang, Ying, Pradeep Shukla, Shaobin Wang, Victor Rudolph, Xiao-Ming Chen, and Zhonghua
Zhu. Significant improvement of surface area and CO2 adsorption of CuBTC via solvent
exchange activation. RSC Adv. 3, 38 (2013): 17065-17072.
Yazaydin, A. Özgür. Enhanced CO2 Adsorption in Metal-Organic Frameworks via Occupation
of Open-Metal Sites by Coordinated Water Molecules. Chem. Mater. 21, 8 (2009): 1425-1430.
Yazaydin, A. Özgür. Screening of Metal-Organic Frameworks for Carbon Dioxide Capture from
Flue Gas Using a Combined Experimental and Modeling Approach. J. Am. Chem. Soc. 131,
51 (2009): 18198-18199.
Ye, Sheng. Post-combustion CO2 capture with the HKUST-1 and MIL-101(Cr) metal-organic
frameworks: Adsorption, separation and regeneration investigations. Microporous and
Mesoporous Materials 179 (2013): 191-197.
Yin, Yan, Sabine Wurzler, Zev Levin, and Tamir G. Reisin. Interactions of mineral dust particles
and clouds: Effects on precipitation and cloud optical properties. J.-Geophys.-Res. 107, D23
(2002): 4724.
Yu, Cheng-Hsiu. A Review of CO2 Capture by Absorption and Adsorption. Aerosol and Air
Quality Research, 2012.
Yu, Jiamei, and Perla B. Balbuena. Water Effects on Postcombustion CO2 Capture in Mg-MOF-
74. J. Phys. Chem. C 117, 7 (2013): 3383-3388.
Yu, Jiamei, Yuguang Ma, and Perla B. Balbuena. Evaluation of the Impact of H2O, O2, and SO2
on Postcombustion CO2 Capture in Metal-Organic Frameworks. Langmuir 28, 21 (2012):
8064-8071.

Bibliography
196
Yu, Kuang, Kalin Kiesling, and J. R. Schmidt. Trace Flue Gas Contaminants Poison
Coordinatively Unsaturated Metal-Organic Frameworks: Implications for CO2 Adsorption
and Separation. J. Phys. Chem. C 116, 38 (2012): 20480-20488.
Yue, Ming Bo, Lin Bing Sun, Yi Cao, Ying Wang, Zhu Ji Wang, and Jian Hua Zhu. Efficient CO2
Capturer Derived from As-Synthesized MCM-41 Modified with Amine. Chem. Eur. J. 14, 11
(2008): 3442-3451.
Zelenák, V., Z. Vargová, M. Almáši, A. Zelenáková, and J. Kuchár. Layer-pillared zinc(II) metal-
organic framework built from 4,4'-azo(bis)pyridine and 1,4-BDC. Microporous and
Mesoporous Materials 129, 3 (2010): 354-359.
Zhang, Jun, Paul A. Webley, and Penny Xiao. Effect of process parameters on power
requirements of vacuum swing adsorption technology for CO2 capture from flue gas.
Energy Conversion and Management 49, 2 (2008): 346-356.
Zhang, Jun, Penny Xiao, Gang Li, and Paul A. Webley. Effect of flue gas impurities on CO2
capture performance from flue gas at coal-fired power stations by vacuum swing
adsorption. Energy Procedia 1, 1 (2009): 1115-1122.
Zhang, Jun, Ranjeet Singh, and Paul A. Webley. Alkali and alkaline-earth cation exchanged
chabazite zeolites for adsorption based CO2 capture. Microporous and Mesoporous Materials
111, 1-3 (2008): 478-487.
Zhang, Zhijuan, Yonggang Zhao, Qihan Gong, Zhong Li, and Jing Li. MOFs for CO2 capture
and separation from flue gas mixtures: the effect of multifunctional sites on their
adsorption capacity and selectivity. Chem. Commun. 49, 7 (2012): 653-661.
Zhao, Xuebo, Bo Xiao, Ashleigh J. Fletcher, K. Mark Thomas, Darren Bradshaw, and Matthew J.
Rosseinsky. Hysteretic Adsorption and Desorption of Hydrogen by Nanoporous Metal-
Organic Frameworks. Science 306, 5698 (2004): 1012-1015.
Zheng, Baishu, Junfeng Bai, Jingui Duan, Lukasz Wojtas, and Michael J. Zaworotko. Enhanced
CO2 Binding Affinity of a High-Uptake rht-Type Metal-Organic Framework Decorated
with Acylamide Groups. J. Am. Chem. Soc. 133, 4 (2011): 748-751.
Zhou, Chenggang, Lujie Cao, Shihao Wei, Qiuju Zhang, and Liang Chen. A first principles
study of gas adsorption on charged CuBTC. Computational and Theoretical Chemistry 976, 1-3
(2011): 153-160.

197
197
A APPENDIX A. REMOVAL OF POLLUTANTS (IBUPROFEN)
IN WATER BY ADSORPTION IN ACTIVATED
CARBONS
Molecular simulations have been performed in order to understand, at the molecular
level, the interaction between the pollutants and the activated carbon. Models and methods, as
well as the most relevant results are detailed below, related to the simulation of ibuprofen
dissolved in water at the presence of different activated carbons.

Appendix A
198
A.1. Introduction
The presence of emerging contaminants in water has become a serious concern.
Typical water treatment facilities are not designed to remove pharmaceuticals from
drinking water. These drugs, both prescription and over-the-counter, can end up in
water supplies. There are many concerns that this is a result of flushing drugs, but
many drugs are not completely metabolized by the body, and enter the environment
after passing through wastewater treatment facilities [FDA, 2011]. The effluents from
such treatment facilities are discharged into bodies of water that can end up in water
supplies, from which drinking water is taken.
Removing ibuprofen from water is an important issue to address through
research and the development of effective technologies for removal. Ibuprofen is a
nonsteroidal anti-inflammatory drug (NSAID). The drug’s wide usage is why it is
being found in waterways. Despite current research in ibuprofen removal, little has
been done to look at the effectiveness of adsorption methods.
The purpose of this work was to investigate, by molecular simulations, the use
of different activated carbon materials to adsorb ibuprofen contented in drinking
water, in order to reach a better understanding towards the adsorption process.
Materials included carbon sheets and carbon nanotubes of different diameters.
These structures were first optimized by an energy minimization method, and
afterwards the most stable configuration of ibuprofen (IBP) were found for each
surface with and without water traces, leading to a final study of the adsorption
capacities at different compositions of IBP.
A.2. Structures and models
Ibuprofen molecule
With a molecular mass of 206.3 g/mol, IBP contains a chiral carbon in the
propionic acid chain which generates two enantiomers of the molecule, being the S-
enantiomer of the analgesic and anti-inflammatory activity (the R is inert). With this in
mind, the most stable form of the active molecule can be obtained from an energy
minimization [Vueba et al., 2008]. The structure is shown in Figure A.1.

Appendix A
199
Figure A.1. Ibuprofen structure (gray: carbon; white: hydrogen; red: oxygen).
Activated carbons
The arrangement and shape of the activated carbon, the defective crystals
which may contain, the capacity and other properties vary according to how the
starting material is transformed into graphite by the heat treatment used. Currently,
the shape and the microstructure of porous carbons cannot be determined from
experiments, since it is very complex. Therefore, a suitable model for the internal
structure of carbon for predicting the properties of adsorption and diffusion is required
[Jain et al., 2005; Striolo et al., 2006].
A morphological model presents rigid aromatic sp2 carbon plates randomly
located in a three-dimensional simulation cubic cell [Lastokie and Gubbins, 1997]. A
typical carbon plate has the structure shown in Figure A.2, and for this case, the plates
are roughly aligned but with variations in their inclination angles. Additionally, some
carbon atoms have been "lost" to create imperfections on the surface.
Figure A.2. Schematic representation of the interconnected carbon pore model.

Appendix A
200
Here we have used a model consisting of three layers of graphitic carbon,
comparing the rhombohedral and hexagonal structures (see center and right images in
Figure A.2), with a layer separation of 15Å. The dimensions of the simulation box were
27 x 20 x 40 Å. The unit cell was simulated with periodic boundary conditions in all
three axes for an effectively infinite plate in these directions, allowing represent what
happens at the macroscopic level in these materials.
A.3. Simulation details
An energy minimization of structures was made in order to calculate the
adsorption properties, by using the commercial software Materials Studio® [Accelrys
M.S., 2013].
Models and force fields used for molecules and structures were taken from the
literature. Once the structures were optimized in terms of the minimum energy, they
were simulated rigid, based on the Universal Force Field (UFF) [Rappé et al., 1992].
Each carbon atom in the structure was simulated as a Lennard-Jones sphere. The
behavior of water molecules was modeled by TIP4P/2005 [Abascal and Vega, 2005]
model, as shown in Chapters 5 and 6..
The ibuprofen-ibuprofen and ibuprofen-structure interactions were calculated
from the parameters of Lennard-Jones + Coulomb potential with mixing rules Lorentz-
Berthelot for cross-terms (see Table A.1); LJ interactions beyond 12.5 Å were obviated,
to be far-reaching. The coulombic interactions were calculated by partial charges on the
atoms while electrostatic interactions were calculated by the Ewald summation
method. The GCMC simulations consisted in 106 Monte Carlo cycles for phase
equilibration and 106 additional production cycles to calculate the equilibrium
properties. To balance the system and for an efficient production, the following MC
movements were used for both water and ibuprofen molecules: translation, rotation,
insertion, removal and reinsertion.
Table A.1. Lennard-Jones and Coulomb interaction parameters for ibuprofen and water.
Atom /kB (K) (Å) Charge (e-)
C_ring (C) 74.5 3.617 -0.2220
C_ring (CH) 74.5 3.617 -0.0420
C_CH1 (quiral) 19.6 3.875 -0.3420
C_CH2_ib 19.6 3.875 -0.4710
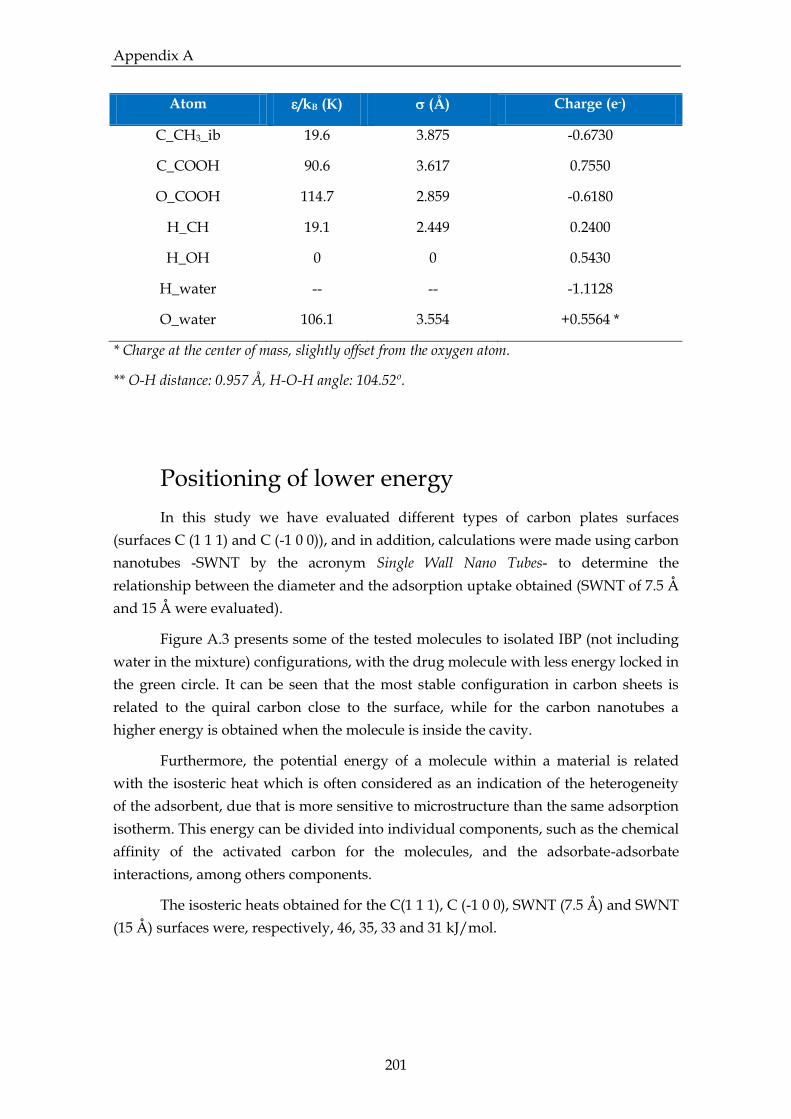
Appendix A
201
Atom /kB (K) (Å) Charge (e-)
C_CH3_ib 19.6 3.875 -0.6730
C_COOH 90.6 3.617 0.7550
O_COOH 114.7 2.859 -0.6180
H_CH 19.1 2.449 0.2400
H_OH 0 0 0.5430
H_water -- -- -1.1128
O_water 106.1 3.554 +0.5564 *
* Charge at the center of mass, slightly offset from the oxygen atom.
** O-H distance: 0.957 Å, H-O-H angle: 104.52º.
Positioning of lower energy
In this study we have evaluated different types of carbon plates surfaces
(surfaces C (1 1 1) and C (-1 0 0)), and in addition, calculations were made using carbon
nanotubes -SWNT by the acronym Single Wall Nano Tubes- to determine the
relationship between the diameter and the adsorption uptake obtained (SWNT of 7.5 Å
and 15 Å were evaluated).
Figure A.3 presents some of the tested molecules to isolated IBP (not including
water in the mixture) configurations, with the drug molecule with less energy locked in
the green circle. It can be seen that the most stable configuration in carbon sheets is
related to the quiral carbon close to the surface, while for the carbon nanotubes a
higher energy is obtained when the molecule is inside the cavity.
Furthermore, the potential energy of a molecule within a material is related
with the isosteric heat which is often considered as an indication of the heterogeneity
of the adsorbent, due that is more sensitive to microstructure than the same adsorption
isotherm. This energy can be divided into individual components, such as the chemical
affinity of the activated carbon for the molecules, and the adsorbate-adsorbate
interactions, among others components.
The isosteric heats obtained for the C(1 1 1), C (-1 0 0), SWNT (7.5 Å) and SWNT
(15 Å) surfaces were, respectively, 46, 35, 33 and 31 kJ/mol.

Appendix A
202
C(1 1 1) surface
Carbon nanotube, 15Å diameter
Figure A.3. lower energy position of an IBP adsorbed on a porous carbon material (excluding
water).
After delving into the IBP-activated carbon interaction, the energy change by
the presence of water was studied. The aim was to deepen the system behavior to
improve the efficiency of water treatment with activated carbon to remove the
ibuprofen molecule by adsorption. Figure A.4 shows a typical configuration for a
mixture of 1000 ppm of ibuprofen dissolved in water, and its interaction with a C (1 1
1) surface. A high concentration was chosen in order to obtain representative amount
of IBP molecules inside the simulation box.

Appendix A
203
Figure A.4. Representation of the equilibrium position of water molecules (in blue) and
ibuprofen on a C (1 1 1) carbon surface obtained by CMCG simulations [IBP concentration:
1000ppm]
A.4. Results of molecular adsorption
simulations
The selective adsorption of the activated carbon for ibuprofen as a function of
water was calculated in liquid phase (a liquid phase in the context of this work relates
to aqueous IBP solutions). Complete adsorption isotherms were not performed, but
different molar fractions of solute/solvent were evaluated, between 0.01 and 10%wt
(10 ppm - 10,000ppm) under ambient conditions, since this is the range of interest for
experimental measurements. The fugacity of the gas phase needed for the simulations
was calculated from the saturated vapor pressures of the components and the activity
coefficients in the liquid phase.
Table A.2 shows the summary of the results obtained by adsorption evaluated
at different scenarios. Figures A.5 and A.6 represent visually the adsorption of
ibuprofen in an aqueous mixture of 10 ppm, as a representative example of the study,
both for flat surfaces as for carbon nanotubes.
It should be noted that the capacities of all structures are very similar for the
different concentrations tested, confirming that the activated carbon is highly selective
for ibuprofen. In general, the molar composition in the different materials was in the

Appendix A
204
range of 30% IBP/70% H2O, and even at low concentrations, the activated carbon is
capable of removing traces of the drug that can lead water wastes after the primary
and secondary treatments.
Table A.2. Adsorption Capacity of different structures, as a function of the amount of ibuprofen in the initial aqueous mixture and of the material structure.
Uptake
(molecules/unit cell)
10
ppm
100
ppm
1,000
ppm
10,000
Ppm
Pure
components
C(1 1 1) 10.8 11.9 13.7 19.2 20.4 (IBP)
140.6 (H2O)
C(-1 0 0) 13.0 13.2 15.8 18.2 21.1 (IBP)
120.1 (H2O)
SWNT 7.5Å 11.1 --- 13.9 18.7 19.0 (IBP)
12.2 (H2O)
SWNT 15Å* 22.3 --- 27.8 34.9 37.4 (IBP)
61.3 (H2O)
* This unit cell contains 380 carbon atoms, while the other structures are in the range of 700 to
750 carbon atoms.
(C -1 0 0) C (1 1 1)
Figure A.5. Adsorption of Ibuprofen in a microporous carbon from an aqueous mixture of
10ppm.

Appendix A
205
SWNT (15Å) SWNT(7.5Å)
Figure A.6. Adsorption in SWNTs from an aqueous solution of 10 ppm IBP.
Finally, an interest feature was observed in SWNT: the ibuprofen molecules are
not capable of adsorbing within the smaller carbon nanotube (diameter of 7.5Å); at the
molecular level it can be seen that this is due mainly to the very narrow pore structure:
it does not allow free movement of the IBP molecules inside the cavity and the water
molecules (smaller) inside the nanotube displace the pharmaceutical molecule.
Therefore, this fact must be taken into account for application in the process of treating
water contaminated with ibuprofen.
A.5. Conclusions
Molecular simulations have been carried out in order to understand, at the
molecular level, the interaction between ibuprofen -content in a stream of water- and
activated carbon. For this, molecular simulation methods were used allowing the
calculation of adsorption and configurations of the liquid phase at low contaminant
concentrations, ranging from 10 to 10000 ppm.
Different structures for the carbonaceous adsorbent have been evaluated,
including sp2 flat plates morphological models and carbon nanotubes, to determine the
relationship between the diameter of the material and the adsorption obtained. The
results show that the capacities of all structures are very similar to each other for the
different concentrations tested, confirming that the activated carbon is highly selective
for ibuprofen.

Appendix A
206
A.6. References
Abascal, J. L. F.; Vega, C. A general purpose model for the condensed phases of water:
TIP4P/2005, Journal of Chemical Physics, 2005, 123 234505.
Jain, S.K.; Pikunic, J.P.; Pellenq, R.J.M.; Gubbins, K.E. Effects of Activation on the Structure and
Adsorption Properties of a Nanoporous Carbon Using Molecular Simulation. Adsorption,
2005, 11, 355–360.
Lastoskie. C.M.; Gubbins, K.E. Characterization of porous materials using molecular theory and
simulation. Book chapter (Molecular Modeling and Theory in Chemical Engineering).
Striolo, A.; Chialvo, A.A.; Cummings, P.T.; Gubbins, K.E. Simulated water adsorption in
chemically heterogeneous carbon nanotubes. The Journal of Chemical Physics, 2006, 124.
Vueba, M.L.; Pina, M.E.; Batista de Carvalho, L.A.E. Conformational Stability of Ibuprofen:
Assessed by DFT Calculations and Optical Vibrational Spectroscopy. Journal of
Pharmaceutical Sciences, 2008, 97 (2).

207
207
Curriculum Vitae
Daniel Bahamón García was born in Medellín, Colombia in 1987. He received his B.Sc. in
Chemical Engineering from the Universidad Pontificia Bolivariana in 2009 and his M.Sc. in
Engineering in 2012 from the same university. In 2012, he was admitted to the Ph.D. program
at the Universitat Autònoma de Barcelona and joined Dr. Lourdes Vega’s Molecular
Simulation research group in MATGAS 2000 AIE. His research interests are mainly focused
on the rational development of energy/environmental processes by optimization with simulation
tools. During the time as PhD student, he has coauthored 3 publications in peer-review
journals (with some more under final writing) and also contributed with oral presentations at
regional, national and international conferences.
He has been involved in several European and Spanish funded projects such as SOFCOM and
BioQuim_Rescue, as well as some industrial projects. He is amember of the Xarxa de Referencia
en Quimica Teòrica I Computationnal (XRQTC) and of the MOLSIMAP group, recognized as
a Group of Excellence by the Generaolitat of Catalonia, 2014SGR-1582).

Curriculum
208
List of publications
Referred journal papers
[1] D. Bahamón and L. F. Vega, Systematic evaluation of materials for post-combustion
CO2 capture in a Temperature Swing Adsorption process, Chemical Engineering
Journal, 2015. doi:10.1016/j.cej.2015.08.098
[2] D. Bahamon, A. Díaz-Márquez, P. Gamallo and L. F. Vega, Effect of water and
coexisting impurities on the adsorption of CO2 in CuBTC and zeolite 13X, Separation
and Purification Technology Journal, Submitted 2015.
[3] P. Gamallo, A. D. Márquez, D. Bahamon and L. F. Vega, Grand canonical Monte
Carlo simulations of water adsorption on kaolinite, Langmuir, Submitted 2015.
[4] D. Bahamon, L. Carro, S. Guri, L.F. Vega, Removal of ibuprofen in water by
activated carbons – a molecular simulation insight, to be submitted to International
Journal of Environmental Science and Technology, 2015.
[5] D. Bahamon, L.F. Vega, Propective materials for CO2 capture in a post-combustion
process: a review on recent advances and opportunities, to be submitted to Energy,
2015.
Conference contributions
S. Builes, D. Bahamón and L. F. Vega, Modeling novel adsorbent materials for gas
separation and CO2 capture, In XRQTC, Poster contribution, Barcelona (Spain),
May 13th, 2013.
A. García-Sánchez; F. Llovell; D. Bahamón; O. Vilaseca; R. M. Marcos; L. F. Vega , A
combined approach for the modelling of thermophysical properties: molecular
simulations and soft-SAFT. Oral Contribution. In XXIX Annual Meeting of
Theoretical and Computational Chemistry, Barcelona (Spain), July 10–11th, 2013.

Curriculum 209
209
D. Bahamón and L. F. Vega, Modeling Novel Adsorbent Materials For Application In
Carbon Dioxide Separation, In FLUCOMP, Poster contribution, Barcelona (Spain),
June 12-13th, 2014.
D. Bahamón and L.F. Vega. Evaluation of materials for application in CO2 capture.
Workshop Aportando Valor al CO2, organized by The Spanish Technological
Platform for CO2 (PTECO2) and the Spanish Technological Platform for
Sustainable Chemistry (SusChem). Madrid (Spain). February 17-18th, 2015.
A. Díaz-Márquez, P. Gamallo, D. Bahamón and L. F. Vega. Influence of impurities in
CO2 capture over a zeolitic material. Workshop Aportando Valor al CO2,
organized by The Spanish Technological Platform for CO2 (PTECO2) and the
Spanish Technological Platform for Sustainable Chemistry (SusChem). Madrid
(Spain). February 17-18th, 2015.
D. Bahamón, A. Díaz-Márquez, P. Gamallo and L. F. Vega, Effect of water and
coexisting impurities on the adsorption of CO2 in CuBTC and zeolite 13X, In
XRQTC Workshop 2015, Poster contribution, Girona (Spain), June 25-26th, 2015.
D. Bahamón and L. F. Vega, Comparison between different materials for CO2 capture
in a post-combustion stream, In EQUIFASE, Oral contribution, Alicante (Spain),
June 28- July 01, 2015.
D. Bahamón, A. Díaz-Márquez, P. Gamallo and L. F. Vega, CO2 separation from multi-
component mixtures by adsorption in MOF CuBTC and zeolite 13X , In RICI-6,
Oral contribution, Guimaräes (Portugal), July 08-10th, 2015.