new hampshire employment projections by industry and occupation
TRANSCRIPT
State of New HampshireMargaret Wood Hassan, Governor
New Hampshire Employment SecurityGeorge N. Copadis, Commissioner
Economic and Labor Market Information BureauBruce R. DeMay, Director
June 2014
New Hampshire Employment Projections
by Industry and Occupation
base year 2012 to projected year 2022
New Hampshire Employment Projecti ons, 2012-2022
New Hampshire Employment SecurityEconomic & Labor Market Informati on Bureau i www.nh.gov/nhes/elmi/projecti ons.htm
Table of Contents
Industry Highlights . . . . . . . . . . . . . . . . . . . . . . . 1
Industry Table . . . . . . . . . . . . . . . . . . . . . . . . . . 2
Occupational Highlights . . . . . . . . . . . . . . . . . . . . 6
Education and Training . . . . . . . . . . . . . . . . . . . . . 7
Occupational Descriptors . . . . . . . . . . . . . . . . . . . 8
Occupational Table . . . . . . . . . . . . . . . . . . . . . . . 9

New Hampshire Employment Projecti ons, 2012-2022
New Hampshire Employment SecurityEconomic & Labor Market Informati on Bureau 1 www.nh.gov/nhes/elmi/projecti ons.htm
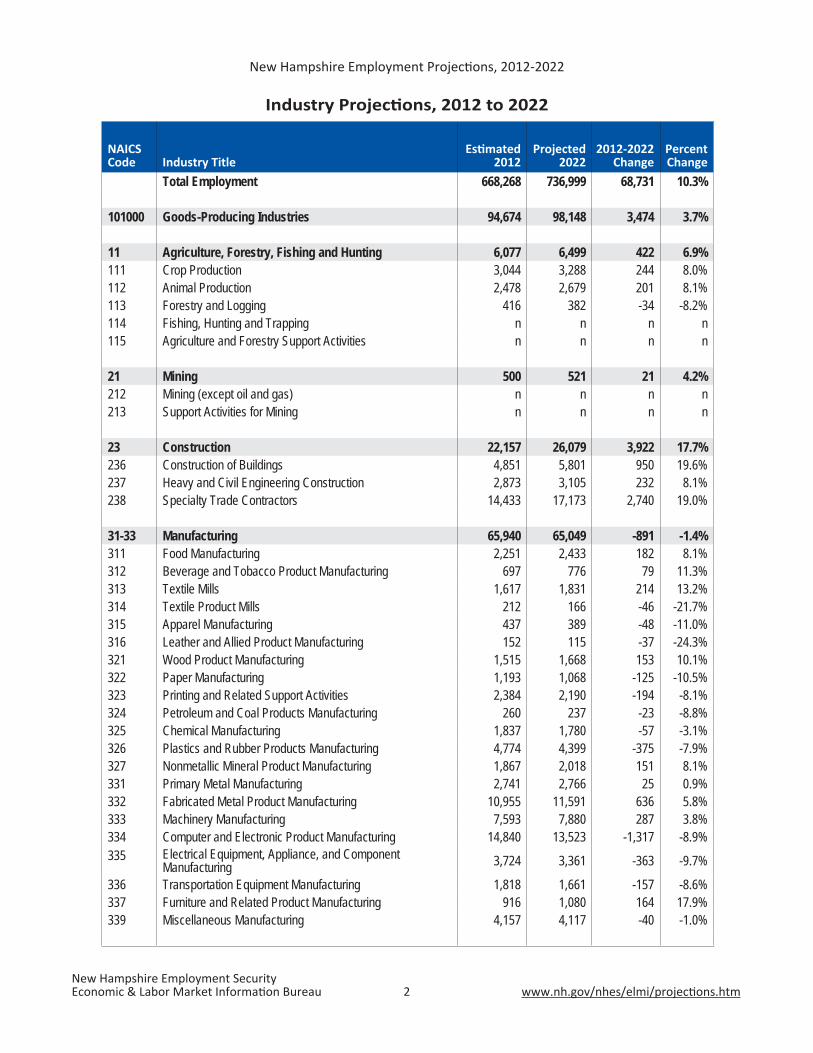
Over the ten-year period 2012 to 2022, total employment in New Hampshire is expected to grow by 10.3 percent, an average annual growth rate of just under one percent. Estimated employment is expected to increase from 668,268 to 736,999, an increase of 68,731 jobs. In comparison, projected growth for the United States for the same period is 10.8 percent, growing from 145.4 million jobs in 2012 to 161.0 million jobs in 2022.
Industry Highlights• Gains are expected in every sector with the exception of Manufacturing (891 fewer jobs) and Utilities (148 fewer
jobs).
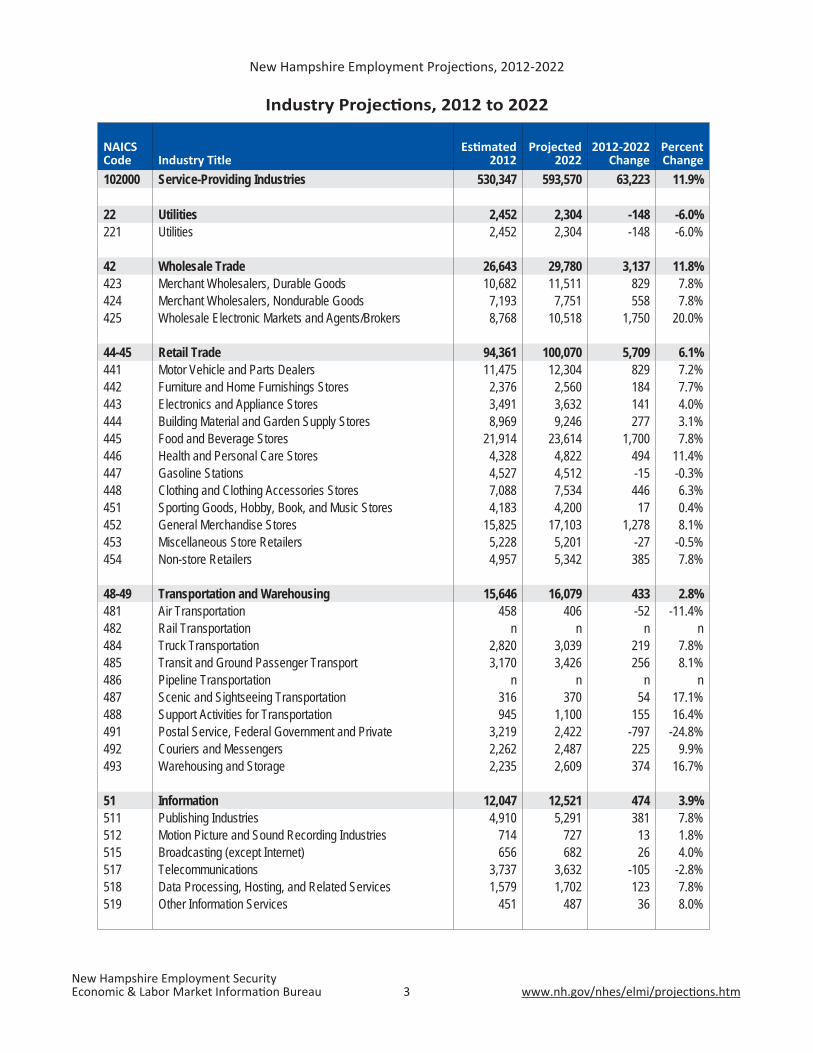
• Three sectors — Administrative support and waste management services, Health care and social assistance, and Professional, scientifi c, and technical services — will account for half of all projected new jobs in 2022.
• Health care and social assistance, the state’s largest employing sector in 2012, is expected to add the most jobs by 2022, accounting for nearly 30 percent of all new jobs in the decade.
• Employment in Construction is expected to grow by 17.7 percent over ten years, with more than 3,900 new jobs.
• Retail trade employment is expected to grow by 6.1 percent, adding 5,700 jobs over ten years.
Industry Highlights
Percent Change in Projected Employment by Sector, 2012 - 2022
23.8%22.6%
17.7%11.8%
11.4%11.2%
10.9%10.4%
9.1%7.0%6.9%
6.1%4.5%4.7%
4.2%3.9%3.7%
2.8%
-6.0%-1.4%
23.9%Admin and Support and Waste Management ServicesHealth Care and Social Assistance
Professional, Scien c, and Technical ServicesConstruc on
Wholesale TradeReal Estate and Rental and Leasing
Arts, Entertainment, and Recrea onFinance and Insurance
Accommoda on and Food ServicesOther Services (Except Government)
Educa onal ServicesAgriculture, Forestry, Fishing and Hun ng
Retail TradeGovernment
Self-employed and Unpaid Family WorkersMining
Informa onManagement of Companies and Enterprises
Transporta on and WarehousingManufacturingU li es Average, all sectors = 10.3%
`
Goods-producing industries
Self-employed and UFW
Service-providing industries
New Hampshire Employment Projecti ons, 2012-2022
New Hampshire Employment SecurityEconomic & Labor Market Informati on Bureau 2 www.nh.gov/nhes/elmi/projecti ons.htm
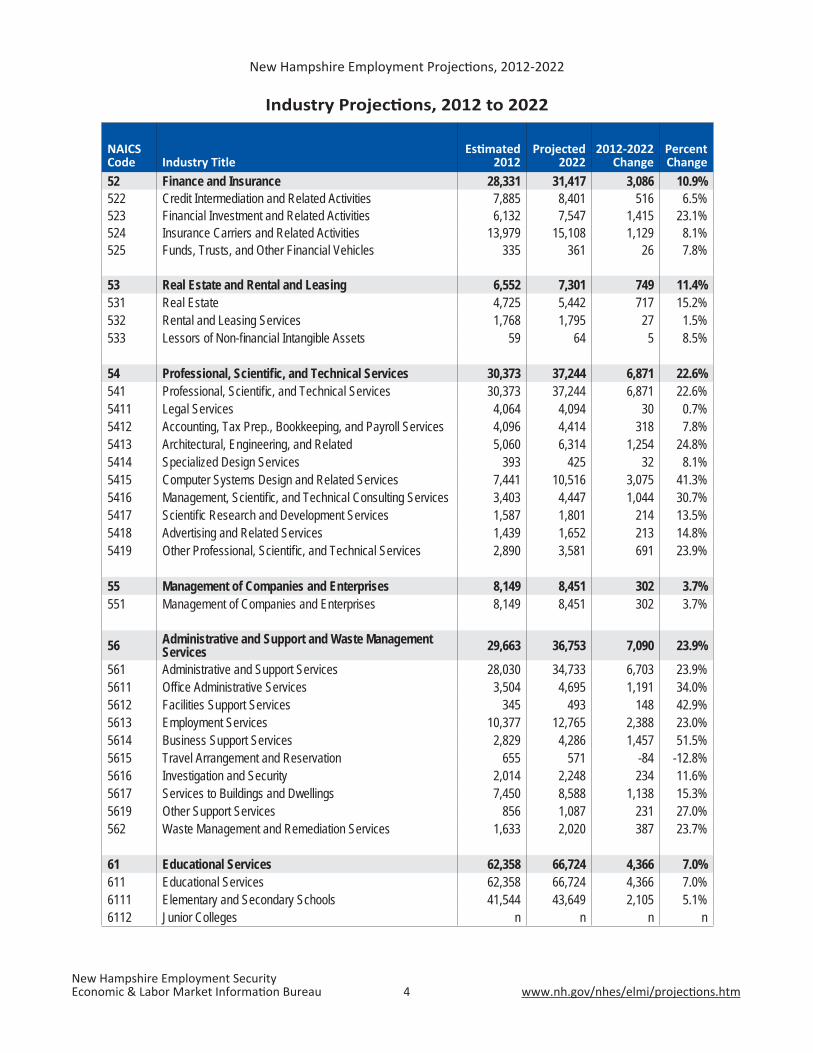
Industry Projecti ons, 2012 to 2022
NAICSCode Industry Title
Esti mated 2012
Projected 2022
2012-2022 Change
Percent Change
Total Employment 668,268 736,999 68,731 10.3%
101000 Goods-Producing Industries 94,674 98,148 3,474 3.7%
11 Agriculture, Forestry, Fishing and Hunting 6,077 6,499 422 6.9%111 Crop Production 3,044 3,288 244 8.0%112 Animal Production 2,478 2,679 201 8.1%113 Forestry and Logging 416 382 -34 -8.2%114 Fishing, Hunting and Trapping n n n n 115 Agriculture and Forestry Support Activities n n n n
21 Mining 500 521 21 4.2%212 Mining (except oil and gas) n n n n 213 Support Activities for Mining n n n n
23 Construction 22,157 26,079 3,922 17.7%236 Construction of Buildings 4,851 5,801 950 19.6%237 Heavy and Civil Engineering Construction 2,873 3,105 232 8.1%238 Specialty Trade Contractors 14,433 17,173 2,740 19.0%
31-33 Manufacturing 65,940 65,049 -891 -1.4%311 Food Manufacturing 2,251 2,433 182 8.1%312 Beverage and Tobacco Product Manufacturing 697 776 79 11.3%313 Textile Mills 1,617 1,831 214 13.2%314 Textile Product Mills 212 166 -46 -21.7%315 Apparel Manufacturing 437 389 -48 -11.0%316 Leather and Allied Product Manufacturing 152 115 -37 -24.3%321 Wood Product Manufacturing 1,515 1,668 153 10.1%322 Paper Manufacturing 1,193 1,068 -125 -10.5%323 Printing and Related Support Activities 2,384 2,190 -194 -8.1%324 Petroleum and Coal Products Manufacturing 260 237 -23 -8.8%325 Chemical Manufacturing 1,837 1,780 -57 -3.1%326 Plastics and Rubber Products Manufacturing 4,774 4,399 -375 -7.9%327 Nonmetallic Mineral Product Manufacturing 1,867 2,018 151 8.1%331 Primary Metal Manufacturing 2,741 2,766 25 0.9%332 Fabricated Metal Product Manufacturing 10,955 11,591 636 5.8%333 Machinery Manufacturing 7,593 7,880 287 3.8%334 Computer and Electronic Product Manufacturing 14,840 13,523 -1,317 -8.9%335 Electrical Equipment, Appliance, and Component
Manufacturing 3,724 3,361 -363 -9.7%
336 Transportation Equipment Manufacturing 1,818 1,661 -157 -8.6%337 Furniture and Related Product Manufacturing 916 1,080 164 17.9%339 Miscellaneous Manufacturing 4,157 4,117 -40 -1.0%
New Hampshire Employment Projecti ons, 2012-2022
New Hampshire Employment SecurityEconomic & Labor Market Informati on Bureau 3 www.nh.gov/nhes/elmi/projecti ons.htm
NAICSCode Industry Title
Esti mated 2012
Projected 2022
2012-2022 Change
Percent Change
102000 Service-Providing Industries 530,347 593,570 63,223 11.9%
22 Utilities 2,452 2,304 -148 -6.0%221 Utilities 2,452 2,304 -148 -6.0%
42 Wholesale Trade 26,643 29,780 3,137 11.8%423 Merchant Wholesalers, Durable Goods 10,682 11,511 829 7.8%424 Merchant Wholesalers, Nondurable Goods 7,193 7,751 558 7.8%425 Wholesale Electronic Markets and Agents/Brokers 8,768 10,518 1,750 20.0%
44-45 Retail Trade 94,361 100,070 5,709 6.1%441 Motor Vehicle and Parts Dealers 11,475 12,304 829 7.2%442 Furniture and Home Furnishings Stores 2,376 2,560 184 7.7%443 Electronics and Appliance Stores 3,491 3,632 141 4.0%444 Building Material and Garden Supply Stores 8,969 9,246 277 3.1%445 Food and Beverage Stores 21,914 23,614 1,700 7.8%446 Health and Personal Care Stores 4,328 4,822 494 11.4%447 Gasoline Stations 4,527 4,512 -15 -0.3%448 Clothing and Clothing Accessories Stores 7,088 7,534 446 6.3%451 Sporting Goods, Hobby, Book, and Music Stores 4,183 4,200 17 0.4%452 General Merchandise Stores 15,825 17,103 1,278 8.1%453 Miscellaneous Store Retailers 5,228 5,201 -27 -0.5%454 Non-store Retailers 4,957 5,342 385 7.8%
48-49 Transportation and Warehousing 15,646 16,079 433 2.8%481 Air Transportation 458 406 -52 -11.4%482 Rail Transportation n n n n 484 Truck Transportation 2,820 3,039 219 7.8%485 Transit and Ground Passenger Transport 3,170 3,426 256 8.1%486 Pipeline Transportation n n n n 487 Scenic and Sightseeing Transportation 316 370 54 17.1%488 Support Activities for Transportation 945 1,100 155 16.4%491 Postal Service, Federal Government and Private 3,219 2,422 -797 -24.8%492 Couriers and Messengers 2,262 2,487 225 9.9%493 Warehousing and Storage 2,235 2,609 374 16.7%
51 Information 12,047 12,521 474 3.9%511 Publishing Industries 4,910 5,291 381 7.8%512 Motion Picture and Sound Recording Industries 714 727 13 1.8%515 Broadcasting (except Internet) 656 682 26 4.0%517 Telecommunications 3,737 3,632 -105 -2.8%518 Data Processing, Hosting, and Related Services 1,579 1,702 123 7.8%519 Other Information Services 451 487 36 8.0%
Industry Projecti ons, 2012 to 2022
New Hampshire Employment Projecti ons, 2012-2022
New Hampshire Employment SecurityEconomic & Labor Market Informati on Bureau 4 www.nh.gov/nhes/elmi/projecti ons.htm
NAICSCode Industry Title
Esti mated 2012
Projected 2022
2012-2022 Change
Percent Change
52 Finance and Insurance 28,331 31,417 3,086 10.9%522 Credit Intermediation and Related Activities 7,885 8,401 516 6.5%523 Financial Investment and Related Activities 6,132 7,547 1,415 23.1%524 Insurance Carriers and Related Activities 13,979 15,108 1,129 8.1%525 Funds, Trusts, and Other Financial Vehicles 335 361 26 7.8%
53 Real Estate and Rental and Leasing 6,552 7,301 749 11.4%531 Real Estate 4,725 5,442 717 15.2%532 Rental and Leasing Services 1,768 1,795 27 1.5%533 Lessors of Non-fi nancial Intangible Assets 59 64 5 8.5%
54 Professional, Scientifi c, and Technical Services 30,373 37,244 6,871 22.6%541 Professional, Scientifi c, and Technical Services 30,373 37,244 6,871 22.6%5411 Legal Services 4,064 4,094 30 0.7%5412 Accounting, Tax Prep., Bookkeeping, and Payroll Services 4,096 4,414 318 7.8%5413 Architectural, Engineering, and Related 5,060 6,314 1,254 24.8%5414 Specialized Design Services 393 425 32 8.1%5415 Computer Systems Design and Related Services 7,441 10,516 3,075 41.3%5416 Management, Scientifi c, and Technical Consulting Services 3,403 4,447 1,044 30.7%5417 Scientifi c Research and Development Services 1,587 1,801 214 13.5%5418 Advertising and Related Services 1,439 1,652 213 14.8%5419 Other Professional, Scientifi c, and Technical Services 2,890 3,581 691 23.9%
55 Management of Companies and Enterprises 8,149 8,451 302 3.7%551 Management of Companies and Enterprises 8,149 8,451 302 3.7%
56 Administrative and Support and Waste Management Services 29,663 36,753 7,090 23.9%
561 Administrative and Support Services 28,030 34,733 6,703 23.9%5611 Offi ce Administrative Services 3,504 4,695 1,191 34.0%5612 Facilities Support Services 345 493 148 42.9%5613 Employment Services 10,377 12,765 2,388 23.0%5614 Business Support Services 2,829 4,286 1,457 51.5%5615 Travel Arrangement and Reservation 655 571 -84 -12.8%5616 Investigation and Security 2,014 2,248 234 11.6%5617 Services to Buildings and Dwellings 7,450 8,588 1,138 15.3%5619 Other Support Services 856 1,087 231 27.0%562 Waste Management and Remediation Services 1,633 2,020 387 23.7%
61 Educational Services 62,358 66,724 4,366 7.0%611 Educational Services 62,358 66,724 4,366 7.0%6111 Elementary and Secondary Schools 41,544 43,649 2,105 5.1%6112 Junior Colleges n n n n
Industry Projecti ons, 2012 to 2022

New Hampshire Employment Projecti ons, 2012-2022
New Hampshire Employment SecurityEconomic & Labor Market Informati on Bureau 5 www.nh.gov/nhes/elmi/projecti ons.htm
NAICSCode Industry Title
Esti mated 2012
Projected 2022
2012-2022 Change
Percent Change
6113 Colleges, Universities, and Professional Schools 15,691 16,958 1,267 8.1%6114 Business Schools and Computer and Management Training 429 515 86 20.0%6115 Technical and Trade Schools 414 473 59 14.3%6116 Other Schools and Instruction 2,043 2,549 506 24.8%6117 Educational Support Services n n n n
62 Health Care and Social Assistance 85,334 105,659 20,325 23.8%621 Ambulatory Health Care Services 29,063 37,358 8,295 28.5%622 Hospitals 27,831 31,800 3,969 14.3%623 Nursing and Residential Care Facilities 15,209 19,434 4,225 27.8%624 Social Assistance 13,231 17,067 3,836 29.0%
71 Arts, Entertainment, and Recreation 11,185 12,440 1,255 11.2%711 Performing Arts, Spectator Sports, and Related Industries 1,465 1,668 203 13.9%712 Museums, Historical Sites, and Similar Institutions 580 627 47 8.1%713 Amusements, Gambling, and Recreation 9,140 10,145 1,005 11.0%
72 Accommodation and Food Services 53,293 58,809 5,516 10.4%721 Accommodation 8,741 9,806 1,065 12.2%722 Food Services and Drinking Places 44,552 49,003 4,451 10.0%
81 Other Services (Except Government) 25,267 27,566 2,299 9.1%811 Repair and Maintenance 6,465 7,114 649 10.0%812 Personal and Laundry 6,330 7,032 702 11.1%813 Religious, Grantmaking, Civic, Professional, and Similar Org. 11,556 12,490 934 8.1%814 Private Households 916 930 14 1.5%
Government 38,693 40,452 1,759 4.5%Federal Government, excluding Postal Service 4,168 4,002 -166 -4.0%State Government, excluding Education and Hospitals 1, 2
12,310 12,863 553 4.5%
Local Government, excluding Education 1 22,215 23,587 1,372 6.2%
Self-employed and Unpaid Family Workers 43,247 45,281 2,034 4.7%Self-employed 42,778 44,840 2,062 4.8%Unpaid Family Workers 469 441 -28 -6.0%
Notes:1 Employment for public schools and colleges is included in sector 61, Educational Services2 Employment at the State Hospital is included in subsector 622, Hospitals
n = data does not meet disclosure standards
Industry Projecti ons, 2012 to 2022

New Hampshire Employment Projecti ons, 2012-2022
New Hampshire Employment SecurityEconomic & Labor Market Informati on Bureau 6 www.nh.gov/nhes/elmi/projecti ons.htm
• Employment in all of the 22 major occupational groups is projected to increase, led by Healthcare practitioners and technical occupations with nearly 7,400 jobs, followed by Offi ce and administrative support occupations with 7,100 new jobs.
• Healthcare support occupations are projected to be the fastest-growing major occupational group, at 22.6 percent over the ten-year period. Computer and mathematical occupations, Healthcare practitioners and technical occupations, and Personal care and service occupations are also projected to grow by 20 percent or more.
• As the population of older residents grows, employment of Home health aides and Personal care aides is projected to grow much faster than the 10.3 percent average. In addition to an aging population, a shift to home-based care provides a less expensive alternative to hospitals or nursing homes.
• The need to replace workers who retire or move into other occupations will create more than two-thirds of all openings.
• Cashiers, Retail salespersons, and Waiters and waitresses are expected to have the most openings over the ten-year period. A large proportion will be due to replacement needs. Openings for Registered nurses, on the other hand, are expected to have an even balance of openings from growth and replacement needs.
Occupati onal Highlights
Occupati ons with the most openings, 2012 - 2022
74161
86181
242
12878
18010668
223876812084
3188
37698971
969861
562442
244376243284
162186
20737
168186132167218
145184
141115129
CashiersRetail Salespersons
Waiters and WaitressesCombined Food Prep and Serving Workers, Incl Fast Food
Registered NursesStock Clerks and Order Fillers
Customer Service Representa vesO ce Clerks, General
Nursing AssistantsJanitors and Cleaners, Ex. Maids and Housekeeping Cleaners
Managers, All OtherPersonal Care Aides
First-Line Supervisors of O ce and Admin Support WorkersLaborers and Freight, Stock, and Material Movers, Hand
Secretaries/Admin Assts, Ex. Legal, Medical, and Execu veLandscaping and Groundskeeping Workers
First-Line Supervisors of Retail Sales WorkersGeneral and Opera ons Managers
Teacher AssistantsElementary School Teachers, Except Special Educa on
Maids and Housekeeping CleanersSales Reps, Wholesale/Mfg, Ex. Technical and Scien c Products
Growth Replacement

New Hampshire Employment Projecti ons, 2012-2022
New Hampshire Employment SecurityEconomic & Labor Market Informati on Bureau 7 www.nh.gov/nhes/elmi/projecti ons.htm
Educati on and TrainingEducation and training for each occupation is classifi ed by requirements in three categories: Education, Work Experience, and Job Training. The fi rst two categories identify education and training before an individual is employed, while the last category refers to training received after employment.
Educational RequirementsSimilar to the previous method of identifying education and training requirements, this category describes the typical level of education most workers need for an entry-level position in the occupation. The eight educational levels are:
• Doctoral (PhD) or professional degree (i.e., MD, DD, JD, DC)
• Masters degree (i.e., MA, MS, MEd)
• Bachelor’s degree (i.e., BS, BA, BFA)
• Associate’s degree (i.e., AS, AA)
• Postsecondary non-degree award (program completion, i.e., CNA, cosmetologist)
• Some college, no degree
• High school diploma or equivalent (GED)
• Less than high school
Work ExperienceSome occupations require related work experience as an entry-level qualifi cation. Frequently, these occupations are fi rst-line supervisory positions, where the worker performs the same job tasks as the workers under their supervision, such as retail supervisors, marketing managers, or construction managers. Non-supervisory workers may also have an experience requirement, such as restaurant cooks and industrial truck and tractor operators. The work experience requirement levels are less than fi ve years, fi ve years or more, or none.
Job TrainingThis category identifi es any additional training or preparation typically needed to gain competency in the occupation once the worker is employed. This type of training is occupation-specifi c, not job-specifi c, meaning skills can be transferred to another job in the same occupation. The job training categories are internships or residencies, apprenticeships, long-term on-the-job training, moderate-term on-the-job training, short-term on-the-job training, or none.
Examples:
Training Category for Architectural and Engineering Managers (11-9041): Bachelor | 5+ yrs | none
A Bachelor’s degree is the typical level of education needed for an entry-level position. Work experience of more than fi ve years is typically required. No additional on-the-job training is required once a worker is employed.
Training Category for Registered Nurses (29-1141): Associate | none | none
An Associate’s degree is the typical level of education needed for an entry-level position. No related work experience is required as an entry-level qualifi cation. No additional on-the-job training is required once a worker is employed.
Training Category for Electricians (47-2111): High School | none | Apprenticeship
A high school diploma or equivalent is the typical level of education needed for an entry-level position. No related work experience is required as an entry-level qualifi cation. Additional on-the-job training in an apprenticeship is typically required once a worker is employed.
New Hampshire Employment Projecti ons, 2012-2022
New Hampshire Employment SecurityEconomic & Labor Market Informati on Bureau 8 www.nh.gov/nhes/elmi/projecti ons.htm
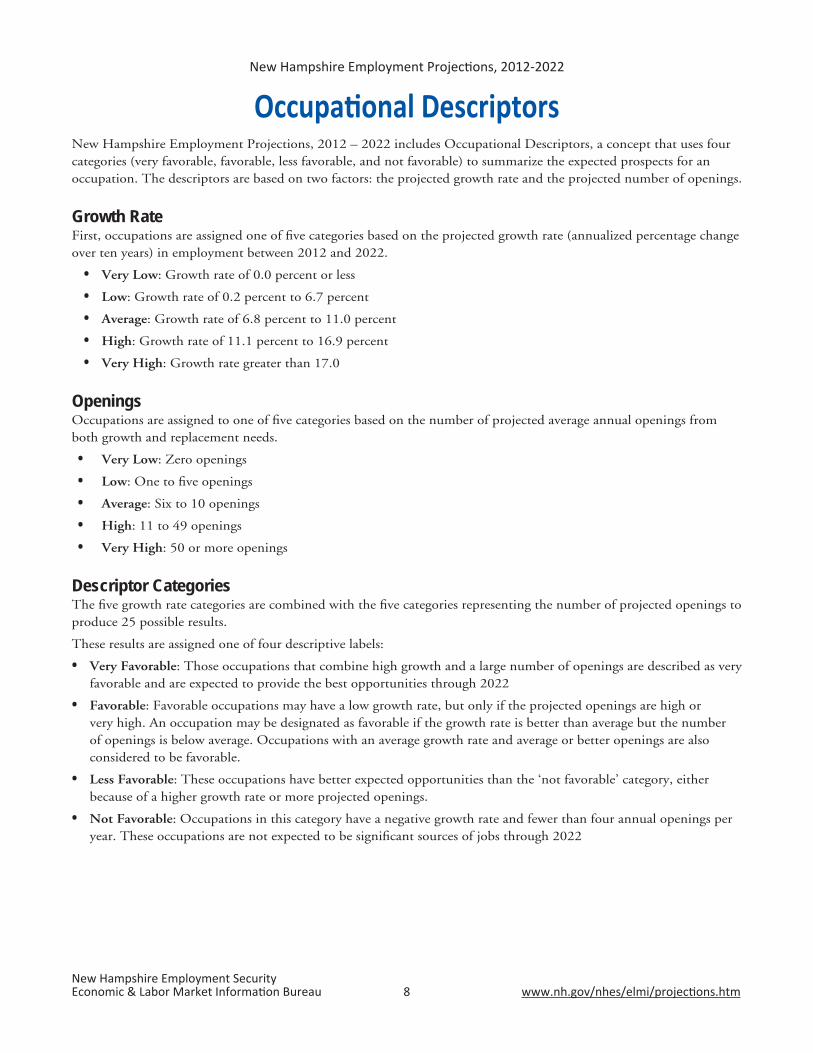
Occupati onal DescriptorsNew Hampshire Employment Projections, 2012 – 2022 includes Occupational Descriptors, a concept that uses four categories (very favorable, favorable, less favorable, and not favorable) to summarize the expected prospects for an occupation. The descriptors are based on two factors: the projected growth rate and the projected number of openings.
Growth RateFirst, occupations are assigned one of fi ve categories based on the projected growth rate (annualized percentage change over ten years) in employment between 2012 and 2022.
• Very Low: Growth rate of 0.0 percent or less
• Low: Growth rate of 0.2 percent to 6.7 percent
• Average: Growth rate of 6.8 percent to 11.0 percent
• High: Growth rate of 11.1 percent to 16.9 percent
• Very High: Growth rate greater than 17.0
OpeningsOccupations are assigned to one of fi ve categories based on the number of projected average annual openings from both growth and replacement needs.
• Very Low: Zero openings
• Low: One to fi ve openings
• Average: Six to 10 openings
• High: 11 to 49 openings
• Very High: 50 or more openings
Descriptor CategoriesThe fi ve growth rate categories are combined with the fi ve categories representing the number of projected openings to produce 25 possible results.
These results are assigned one of four descriptive labels:
• Very Favorable: Those occupations that combine high growth and a large number of openings are described as very favorable and are expected to provide the best opportunities through 2022
• Favorable: Favorable occupations may have a low growth rate, but only if the projected openings are high or very high. An occupation may be designated as favorable if the growth rate is better than average but the number of openings is below average. Occupations with an average growth rate and average or better openings are also considered to be favorable.
• Less Favorable: These occupations have better expected opportunities than the ‘not favorable’ category, either because of a higher growth rate or more projected openings.
• Not Favorable: Occupations in this category have a negative growth rate and fewer than four annual openings per year. These occupations are not expected to be signifi cant sources of jobs through 2022

New Hampshire Employment Projecti ons, 2012-2022
New Hampshire Employment SecurityEconomic & Labor Market Informati on Bureau 9 www.nh.gov/nhes/elmi/projecti ons.htm
Occupati onal Projecti ons, 2012-2022SOCCode Occupation Title
Estimated 2012
Projected 2022
2012-2022 Change
Percent Change
AnnualOpenings
CategoriesEduc. | Exp. | Training Descriptor
n = employment data does not meet disclosure standards
1 Excludes State Legislators
Total, All Occupations 668,268 736,999 68,731 10.3% 22,85211-0000 Management Occupations 46,530 50,988 4,458 9.6% 1,39111-1011 Chief Executives 1,811 1,890 79 4.4% 46 Bachelor | 5+ yrs | none Favorable11-1021 General and Operations Managers 7,763 8,640 877 11.3% 233 Bachelor | < 5 yrs | none Very Favorable11-1031 Legislators1 354 377 23 6.5% 10 Bachelor | < 5 yrs | none Less Favorable11-2011 Advertising and Promotions Managers 225 249 24 10.7% 9 Bachelor | < 5 yrs | none Favorable11-2021 Marketing Managers 1,231 1,387 156 12.7% 42 Bachelor | 5+ yrs | none Very Favorable11-2022 Sales Managers 1,692 1,867 175 10.3% 54 Bachelor | < 5 yrs | none Very Favorable11-2031 Public Relations and Fundraising Managers 357 398 41 11.5% 12 Bachelor | 5+ yrs | none Very Favorable11-3011 Administrative Services Managers 845 943 98 11.6% 24 Bachelor | < 5 yrs | none Very Favorable11-3021 Computer and Information Systems Managers 2,081 2,507 426 20.5% 72 Bachelor | 5+ yrs | none Very Favorable11-3031 Financial Managers 3,432 3,756 324 9.4% 96 Bachelor | 5+ yrs | none Very Favorable11-3051 Industrial Production Managers 879 860 -19 -2.2% 16 Bachelor | 5+ yrs | none Less Favorable11-3061 Purchasing Managers 359 371 12 3.3% 9 Bachelor | 5+ yrs | none Less Favorable11-3071 Transportation, Storage, and Distribution
Managers 470 476 6 1.3% 12 High school | 5+ yrs | none Favorable11-3111 Compensation and Benefi ts Managers 118 133 15 12.7% 5 Bachelor | 5+ yrs | none Favorable11-3121 Human Resources Managers 403 455 52 12.9% 16 Bachelor | 5+ yrs | none Very Favorable11-3131 Training and Development Managers 84 91 7 8.3% 3 Bachelor | 5+ yrs | none Less Favorable11-9013 Farmers, Ranchers, and Other Agricultural
Managers 4,272 4,653 381 8.9% 107 High school | 5+ yrs | none Very Favorable11-9021 Construction Managers 1,752 1,944 192 11.0% 47 Bachelor | none |
Moderate-term OJT Favorable11-9031 Education Administrators, Preschool and
Childcare Center/Program 300 344 44 14.7% 12 Bachelor | < 5 yrs | none Very Favorable11-9032 Education Administrators, Elementary and
Secondary School 1,225 1,276 51 4.2% 38 Masters | 5+ yrs | none Favorable11-9033 Education Administrators, Postsecondary 728 798 70 9.6% 26 Masters | 5+ yrs | none Favorable11-9039 Education Administrators, All Other 187 216 29 15.5% 8 Bachelor | < 5 yrs | none Favorable11-9041 Architectural and Engineering Managers 1,089 1,125 36 3.3% 31 Bachelor | 5+ yrs | none Favorable11-9051 Food Service Managers 1,424 1,465 41 2.9% 29 High school |< 5 yrs | none Favorable11-9061 Funeral Service Managers n n n n n Associate | < 5 yrs | none Less Favorable11-9071 Gaming Managers n n n n n High school |< 5 yrs | none Not Favorable11-9081 Lodging Managers 219 225 6 2.7% 8 High school |< 5 yrs | none Less Favorable11-9111 Medical and Health Services Managers 1,694 2,093 399 23.6% 81 Bachelor | none | none Very Favorable11-9121 Natural Sciences Managers 103 107 4 3.9% 2 Bachelor | 5+ yrs | none Less Favorable11-9131 Postmasters and Mail Superintendents 198 156 -42 -21.2% 4 High school | < 5 yrs |
Moderate-term OJT Not Favorable
11-9141 Property, Real Estate, and Community Association Managers
1,095 1,236 141 12.9% 39High school |< 5 yrs | none Very Favorable
11-9151 Social and Community Service Managers 601 724 123 20.5% 24 Bachelor | 5+ yrs | none Very Favorable11-9161 Emergency Management Directors 65 70 5 7.7% 1 Bachelor | 5+ yrs | none Less Favorable11-9199 Managers, All Other 9,455 10,136 681 7.2% 275 High school |< 5 yrs | none Very Favorable13-0000 Business and Financial Operations
Occupations 30,218 34,153 3,935 13.0% 98013-1011 Agents and Business Managers of Artists,
Performers, and Athletes n n n n n Bachelor | < 5 yrs | none Less Favorable13-1021 Buyers and Purchasing Agents, Farm
Products n n n n nHigh school | none | Long-term OJT Less Favorable
13-1022 Wholesale and Retail Buyers, Except Farm Products 684 749 65 9.5% 23
High school | none | Long-term OJT Favorable

New Hampshire Employment Projecti ons, 2012-2022
New Hampshire Employment SecurityEconomic & Labor Market Informati on Bureau 10 www.nh.gov/nhes/elmi/projecti ons.htm
Occupati onal Projecti ons, 2012-2022SOCCode Occupation Title
Estimated 2012
Projected 2022
2012-2022 Change
Percent Change
AnnualOpenings
CategoriesEduc. | Exp. | Training Descriptor
n = employment data does not meet disclosure standards
13-1023 Purchasing Agents, Except Wholesale, Retail, and Farm Products 1,482 1,504 22 1.5% 29
High school | none | Long-term OJT Favorable
13-1031 Claims Adjusters, Examiners, and Investigators 1,330 1,386 56 4.2% 37
High school | none | Long-term OJT Favorable
13-1032 Insurance Appraisers, Auto Damage 45 41 -4 -8.9% 1 Postsecondary | none | Moderate-term OJT Not Favorable
13-1041 Compliance Offi cers 967 1,027 60 6.2% 24 Bachelor | none | Moderate-term OJT Favorable
13-1051 Cost Estimators 804 961 157 19.5% 42 Bachelor | none | none Very Favorable13-1071 Human Resources Specialists 1,666 1,839 173 10.4% 47 Bachelor | none | none Favorable13-1075 Labor Relations Specialists 133 132 -1 -0.8% 2 Bachelor | none | none Not Favorable13-1081 Logisticians 433 505 72 16.6% 12 Bachelor | none | none Very Favorable13-1111 Management Analysts 2,268 2,660 392 17.3% 74 Bachelor | < 5 yrs | none Very Favorable13-1121 Meeting, Convention, and Event Planners 305 404 99 32.5% 14 Bachelor | none | none Very Favorable13-1131 Fundraisers 399 457 58 14.5% 14 Bachelor | none | none Very Favorable13-1141 Compensation, Benefi ts, and Job Analysis
Specialists 332 357 25 7.5% 8 Bachelor | none | none Favorable13-1151 Training and Development Specialists 794 903 109 13.7% 25 Bachelor | < 5 yrs | none Very Favorable13-1161 Market Research Analysts and Marketing
Specialists 1,512 1,979 467 30.9% 68 Bachelor | none | none Very Favorable13-1199 Business Operations Specialists, All Other 5,969 6,606 637 10.7% 146 High school | none | none Very Favorable13-2011 Accountants and Auditors 4,522 5,114 592 13.1% 193 Bachelor | none | none Very Favorable13-2021 Appraisers and Assessors of Real Estate 408 443 35 8.6% 8 Bachelor | none | Long-
term OJT Favorable13-2031 Budget Analysts 200 208 8 4.0% 9 Bachelor | none | none Less Favorable13-2041 Credit Analysts 151 162 11 7.3% 5 Bachelor | none | none Less Favorable13-2051 Financial Analysts 786 946 160 20.4% 35 Bachelor | none | none Very Favorable13-2052 Personal Financial Advisors 1,322 1,747 425 32.1% 63 Bachelor | none | none Very Favorable13-2053 Insurance Underwriters 265 245 -20 -7.5% 7 Bachelor | none |
Moderate-term OJT Less Favorable13-2061 Financial Examiners 149 164 15 10.1% 6 Bachelor | none |
Moderate-term OJT Favorable13-2071 Credit Counselors 162 190 28 17.3% 6 Bachelor | none |
Moderate-term OJT Favorable13-2072 Loan Offi cers 1,070 1,173 103 9.6% 30 Bachelor | none |
Moderate-term OJT Favorable13-2081 Tax Examiners and Collectors, and Revenue
Agents 346 358 12 3.5% 13 Bachelor | none |
Moderate-term OJT Favorable13-2082 Tax Preparers 288 306 18 6.3% 8 High school | none |
Moderate-term OJT Less Favorable13-2099 Financial Specialists, All Other 1,401 1,558 157 11.2% 31 Bachelor | none |
Moderate-term OJT Very Favorable15-0000 Computer and Mathematical Occupations 18,193 22,047 3,854 21.2% 67315-1111 Computer and Information Research
Scientistsn n n n n Doctoral or Professional |
none | none Not Favorable15-1121 Computer Systems Analysts 2,470 3,060 590 23.9% 98 Bachelor | none | none Very Favorable15-1122 Information Security Analysts 185 242 57 30.8% 9 Bachelor | < 5 yrs | none Favorable15-1131 Computer Programmers 1,113 1,286 173 15.5% 46 Bachelor | none | none Very Favorable15-1132 Software Developers, Applications 4,823 6,168 1,345 27.9% 196 Bachelor | none | none Very Favorable15-1133 Software Developers, Systems Software 1,526 1,706 180 11.8% 38 Bachelor | none | none Very Favorable15-1134 Web Developers 992 1,250 258 26.0% 42 Associate | none | none Very Favorable15-1141 Database Administrators 579 688 109 18.8% 22 Bachelor | < 5 yrs | none Very Favorable

New Hampshire Employment Projecti ons, 2012-2022
New Hampshire Employment SecurityEconomic & Labor Market Informati on Bureau 11 www.nh.gov/nhes/elmi/projecti ons.htm
Occupati onal Projecti ons, 2012-2022SOCCode Occupation Title
Estimated 2012
Projected 2022
2012-2022 Change
Percent Change
AnnualOpenings
CategoriesEduc. | Exp. | Training Descriptor
n = employment data does not meet disclosure standards
15-1142 Network and Computer Systems Administrators 1,806 2,038 232 12.8% 51 Bachelor | none | none Very Favorable
15-1143 Computer Network Architects 291 358 67 23.0% 12 Bachelor | 5+ yrs | none Very Favorable15-1151 Computer User Support Specialists 2,469 3,029 560 22.7% 95 Some college | none |
Moderate-term OJT Very Favorable15-1152 Computer Network Support Specialists 543 583 40 7.4% 12 Associate | none | none Favorable15-1199 Computer Occupations, All Other 851 1,008 157 18.4% 29 Bachelor | none | none Very Favorable15-2011 Actuaries 53 65 12 22.6% 3 Bachelor | none | Long-
term OJT Favorable15-2031 Operations Research Analysts 187 237 50 26.7% 9 Bachelor | none | none Favorable15-2041 Statisticians 103 136 33 32.0% 6 Masters | none | none Favorable15-2091 Mathematical Technicians n n n n n Bachelor | none | none Less Favorable15-2099 Mathematical Science Occupations, All Other n n n n n Bachelor | none | none Favorable17-0000 Architecture and Engineering Occupations 11,886 12,567 681 5.7% 35517-1011 Architects, Except Landscape and Naval 283 343 60 21.2% 13 Bachelor | none | Internship
or Residency Very Favorable17-1012 Landscape Architects 25 31 6 24.0% 2 Bachelor | none | Internship
or Residency Favorable17-1021 Cartographers and Photogrammetrists 64 81 17 26.6% 3 Bachelor | none | none Favorable17-1022 Surveyors 244 281 37 15.2% 9 Bachelor | < 5 yrs | none Favorable17-2011 Aerospace Engineers n n n n n Bachelor | none | none Not Favorable17-2021 Agricultural Engineers n n n n n Bachelor | none | none Not Favorable17-2031 Biomedical Engineers 96 117 21 21.9% 4 Bachelor | none | none Favorable17-2041 Chemical Engineers 38 44 6 15.8% 2 Bachelor | none | none Favorable17-2051 Civil Engineers 999 1,253 254 25.4% 49 Bachelor | none | none Very Favorable17-2061 Computer Hardware Engineers 184 199 15 8.2% 6 Bachelor | none | none Favorable17-2071 Electrical Engineers 1,181 1,194 13 1.1% 27 Bachelor | none | none Favorable17-2072 Electronics Engineers, Except Computer 494 517 23 4.7% 13 Bachelor | none | none Favorable17-2081 Environmental Engineers 235 284 49 20.9% 11 Bachelor | none | none Very Favorable17-2111 Health and Safety Engineers, Except Mining
Safety Engineers and Inspectors 50 53 3 6.0% 2 Bachelor | none | none Less Favorable17-2112 Industrial Engineers 1,079 1,116 37 3.4% 36 Bachelor | none | none Favorable17-2131 Materials Engineers 106 109 3 2.8% 3 Bachelor | none | none Less Favorable17-2141 Mechanical Engineers 1,632 1,707 75 4.6% 64 Bachelor | none | none Favorable17-2151 Mining and Geological Engineers, Including
Mining Safety Engineers n n n n n Bachelor | none | none Not Favorable17-2161 Nuclear Engineers n n n n n Bachelor | none | none Not Favorable17-2199 Engineers, All Other 1,497 1,539 42 2.8% 32 Bachelor | none | none Favorable17-3011 Architectural and Civil Drafters 355 373 18 5.1% 7 Associate | none | none Less Favorable17-3012 Electrical and Electronics Drafters 121 127 6 5.0% 3 Associate | none | none Less Favorable17-3013 Mechanical Drafters 255 240 -15 -5.9% 3 Associate | none | none Not Favorable17-3019 Drafters, All Other 203 220 17 8.4% 5 Associate | none | none Less Favorable17-3021 Aerospace Engineering and Operations
Technicians n n n n n Associate | none | none Not Favorable17-3022 Civil Engineering Technicians 81 86 5 6.2% 2 Associate | none | none Less Favorable17-3023 Electrical and Electronics Engineering
Technicians 831 800 -31 -3.7% 17 Associate | none | none Less Favorable17-3024 Electro-Mechanical Technicians 50 45 -5 -10.0% 1 Associate | none | none Not Favorable17-3025 Environmental Engineering Technicians 25 26 1 4.0% 0 Associate | none | none Not Favorable

New Hampshire Employment Projecti ons, 2012-2022
New Hampshire Employment SecurityEconomic & Labor Market Informati on Bureau 12 www.nh.gov/nhes/elmi/projecti ons.htm
Occupati onal Projecti ons, 2012-2022SOCCode Occupation Title
Estimated 2012
Projected 2022
2012-2022 Change
Percent Change
AnnualOpenings
CategoriesEduc. | Exp. | Training Descriptor
n = employment data does not meet disclosure standards
17-3026 Industrial Engineering Technicians 309 297 -12 -3.9% 6 Associate | none | none Less Favorable17-3027 Mechanical Engineering Technicians 428 441 13 3.0% 10 Associate | none | none Less Favorable17-3029 Engineering Technicians, Except Drafters,
All Other 682 676 -6 -0.9% 14 Associate | none | none Less Favorable17-3031 Surveying and Mapping Technicians 205 240 35 17.1% 8 High school | none |
Moderate-term OJT Favorable19-0000 Life, Physical, and Social Science
Occupations 4,001 4,458 457 11.4% 16119-1011 Animal Scientists n n n n n Doctoral or Professional |
none | none Not Favorable19-1012 Food Scientists and Technologists 23 25 2 8.7% 1 Bachelor | none | none Less Favorable19-1013 Soil and Plant Scientists 15 14 -1 -6.7% 0 Bachelor | none | none Not Favorable19-1021 Biochemists and Biophysicists 56 70 14 25.0% 3 Doctoral or Professional |
none | none Favorable19-1022 Microbiologists n n n n n Bachelor | none | none Less Favorable19-1023 Zoologists and Wildlife Biologists 76 79 3 3.9% 2 Bachelor | none | none Less Favorable19-1029 Biological Scientists, All Other 85 86 1 1.2% 2 Bachelor | none | none Less Favorable19-1031 Conservation Scientists 39 38 -1 -2.6% 1 Bachelor | none | none Not Favorable19-1032 Foresters 65 79 14 21.5% 3 Bachelor | none | none Favorable19-1041 Epidemiologists n n n n n Masters | none | none Less Favorable19-1042 Medical Scientists, Except Epidemiologists 378 411 33 8.7% 11 Doctoral or Professional |
none | none Favorable19-1099 Life Scientists, All Other 48 57 9 18.8% 2 Bachelor | none | none Favorable19-2011 Astronomers n n n n n Doctoral or Professional |
none | none Not Favorable19-2012 Physicists 40 43 3 7.5% 1 Doctoral or Professional |
none | none Less Favorable19-2021 Atmospheric and Space Scientists 83 104 21 25.3% 4 Bachelor | none | none Favorable19-2031 Chemists 157 175 18 11.5% 6 Bachelor | none | none Favorable19-2032 Materials Scientists n n n n n Bachelor | none | none Not Favorable19-2041 Environmental Scientists and Specialists,
Including Health 432 509 77 17.8% 21 Bachelor | none | none Very Favorable19-2042 Geoscientists, Except Hydrologists and
Geographers 79 91 12 15.2% 3 Bachelor | none | none Favorable19-2043 Hydrologists 81 98 17 21.0% 4 Masters | none | none Favorable19-2099 Physical Scientists, All Other 179 190 11 6.1% 5 Bachelor | none | none Less Favorable19-3011 Economists 20 21 1 5.0% 1 Masters | none | none Less Favorable19-3022 Survey Researchers n n n n n Masters | none | none Not Favorable19-3031 Clinical, Counseling, and School
Psychologists510 559 49 9.6% 19 Doctoral or Professional
| none| Internship or Residency Favorable
19-3039 Psychologists, All Other 26 30 4 15.4% 1 Masters | none | Internship or Residency Favorable
19-3051 Urban and Regional Planners 176 188 12 6.8% 9 Masters | none | none Favorable19-3091 Anthropologists and Archeologists n n n n n Masters | none | none Less Favorable19-3093 Historians n n n n n Masters | none | none Less Favorable19-3099 Social Scientists and Related Workers, All
Other 68 73 5 7.4% 1 Bachelor | none | none Less Favorable19-4011 Agricultural and Food Science Technicians n n n n n Associate | none |
Moderate-term OJT Not Favorable19-4021 Biological Technicians 322 355 33 10.2% 13 Bachelor | none | none Favorable

New Hampshire Employment Projecti ons, 2012-2022
New Hampshire Employment SecurityEconomic & Labor Market Informati on Bureau 13 www.nh.gov/nhes/elmi/projecti ons.htm
Occupati onal Projecti ons, 2012-2022SOCCode Occupation Title
Estimated 2012
Projected 2022
2012-2022 Change
Percent Change
AnnualOpenings
CategoriesEduc. | Exp. | Training Descriptor
n = employment data does not meet disclosure standards
19-4031 Chemical Technicians 125 142 17 13.6% 5 Associate | none | Moderate-term OJT Favorable
19-4041 Geological and Petroleum Technicians n n n n n Associate | none | Moderate-term OJT Less Favorable
19-4051 Nuclear Technicians n n n n n Associate | none | Moderate-term OJT Favorable
19-4061 Social Science Research Assistants n n n n n Associate | none | none Favorable19-4091 Environmental Science and Protection
Technicians, Including Health 225 271 46 20.4% 14 Associate | none | none Very Favorable19-4092 Forensic Science Technicians 39 42 3 7.7% 2 Bachelor | none |
Moderate-term OJT Less Favorable19-4093 Forest and Conservation Technicians 71 70 -1 -1.4% 3 Associate | none | none Not Favorable19-4099 Life, Physical, and Social Science
Technicians, All Other 377 404 27 7.2% 18 Associate | none | none Favorable21-0000 Community and Social Services
Occupations 10,247 12,019 1,772 17.3% 41821-1011 Substance Abuse and Behavioral Disorder
Counselors 357 485 128 35.9% 21High school | none | Moderate-term OJT Very Favorable
21-1012 Educational, Guidance, School, and Vocational Counselors 1,337 1,447 110 8.2% 39 Masters | none | none Favorable
21-1013 Marriage and Family Therapists 145 190 45 31.0% 7 Masters | none | Internship or Residency Favorable
21-1014 Mental Health Counselors 628 809 181 28.8% 31 Masters | none | Internship or Residency Very Favorable
21-1015 Rehabilitation Counselors 644 770 126 19.6% 27 Masters | none | none Very Favorable21-1019 Counselors, All Other 337 414 77 22.8% 15 Masters | none | none Very Favorable21-1021 Child, Family, and School Social Workers 510 594 84 16.5% 19 Bachelor | none | none Very Favorable21-1022 Healthcare Social Workers 473 589 116 24.5% 22 Masters | none | none Very Favorable21-1023 Mental Health and Substance Abuse Social
Workers 239 291 52 21.8% 10 Bachelor | none | none Favorable21-1029 Social Workers, All Other 126 138 12 9.5% 4 Bachelor | none | none Less Favorable21-1091 Health Educators 250 314 64 25.6% 12 Bachelor | none | none Very Favorable21-1092 Probation Offi cers and Correctional Treatment
Specialists 229 230 1 0.4% 6Bachelor | none | Short-term OJT Less Favorable
21-1093 Social and Human Service Assistants 2,537 3,042 505 19.9% 116 High school | none | Short-term OJT Very Favorable
21-1094 Community Health Workers 145 177 32 22.1% 7 High school | none | Short-term OJT Favorable
21-1099 Community and Social Service Specialists, All Other 736 874 138 18.8% 33 Masters | none | none Very Favorable
21-2011 Clergy 850 908 58 6.8% 23 Bachelor | none | Moderate-term OJT Favorable
21-2021 Directors, Religious Activities and Education 471 499 28 5.9% 19 Bachelor | < 5 yrs | none Favorable21-2099 Religious Workers, All Other 233 248 15 6.4% 7 Bachelor | none | none Less Favorable23-0000 Legal Occupations 4,106 4,406 300 7.3% 9523-1011 Lawyers 2,275 2,384 109 4.8% 47 Doctoral or Professional |
none | none Favorable23-1021 Administrative Law Judges, Adjudicators, and
Hearing Offi cers 164 172 8 4.9% 4 Bachelor | < 5 yrs | Short-
term OJT Less Favorable
23-1022 Arbitrators, Mediators, and Conciliators 55 73 18 32.7% 3 Bachelor | < 5 yrs | Moderate-term OJT Favorable
23-1023 Judges, Magistrate Judges, and Magistrates 95 100 5 5.3% 2 Doctoral/Prof. Degree | 5+ yrs | Short-term OJT Less Favorable
New Hampshire Employment Projecti ons, 2012-2022
New Hampshire Employment SecurityEconomic & Labor Market Informati on Bureau 14 www.nh.gov/nhes/elmi/projecti ons.htm
Occupati onal Projecti ons, 2012-2022SOCCode Occupation Title
Estimated 2012
Projected 2022
2012-2022 Change
Percent Change
AnnualOpenings
CategoriesEduc. | Exp. | Training Descriptor
n = employment data does not meet disclosure standards
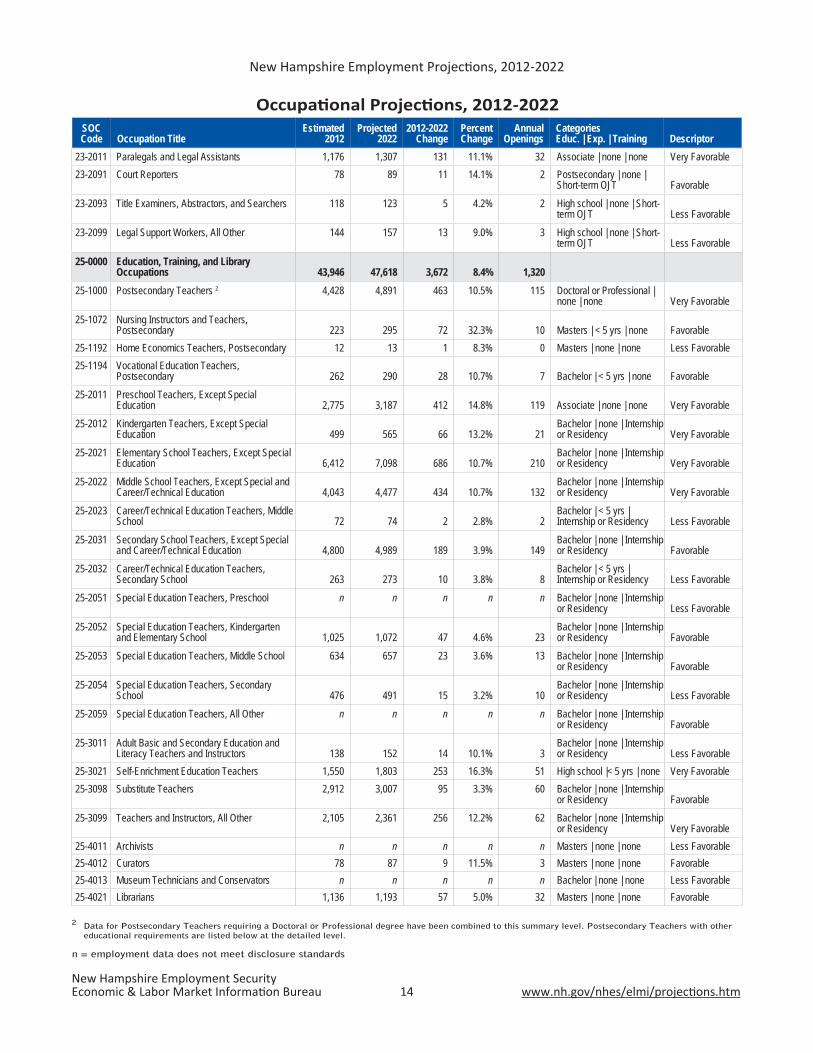
2 Data for Postsecondary Teachers requiring a Doctoral or Professional degree have been combined to this summary level. Postsecondary Teachers with other educational requirements are listed below at the detailed level.
23-2011 Paralegals and Legal Assistants 1,176 1,307 131 11.1% 32 Associate | none | none Very Favorable23-2091 Court Reporters 78 89 11 14.1% 2 Postsecondary | none |
Short-term OJT Favorable23-2093 Title Examiners, Abstractors, and Searchers 118 123 5 4.2% 2 High school | none | Short-
term OJT Less Favorable23-2099 Legal Support Workers, All Other 144 157 13 9.0% 3 High school | none | Short-
term OJT Less Favorable25-0000 Education, Training, and Library
Occupations 43,946 47,618 3,672 8.4% 1,32025-1000 Postsecondary Teachers 2 4,428 4,891 463 10.5% 115 Doctoral or Professional |
none | none Very Favorable25-1072 Nursing Instructors and Teachers,
Postsecondary 223 295 72 32.3% 10 Masters | < 5 yrs | none Favorable25-1192 Home Economics Teachers, Postsecondary 12 13 1 8.3% 0 Masters | none | none Less Favorable25-1194 Vocational Education Teachers,
Postsecondary 262 290 28 10.7% 7 Bachelor | < 5 yrs | none Favorable25-2011 Preschool Teachers, Except Special
Education 2,775 3,187 412 14.8% 119 Associate | none | none Very Favorable25-2012 Kindergarten Teachers, Except Special
Education 499 565 66 13.2% 21Bachelor | none | Internship or Residency Very Favorable
25-2021 Elementary School Teachers, Except Special Education 6,412 7,098 686 10.7% 210
Bachelor | none | Internship or Residency Very Favorable
25-2022 Middle School Teachers, Except Special and Career/Technical Education 4,043 4,477 434 10.7% 132
Bachelor | none | Internship or Residency Very Favorable
25-2023 Career/Technical Education Teachers, Middle School 72 74 2 2.8% 2
Bachelor | < 5 yrs | Internship or Residency Less Favorable
25-2031 Secondary School Teachers, Except Special and Career/Technical Education 4,800 4,989 189 3.9% 149
Bachelor | none | Internship or Residency Favorable
25-2032 Career/Technical Education Teachers, Secondary School 263 273 10 3.8% 8
Bachelor | < 5 yrs | Internship or Residency Less Favorable
25-2051 Special Education Teachers, Preschool n n n n n Bachelor | none | Internship or Residency Less Favorable
25-2052 Special Education Teachers, Kindergarten and Elementary School 1,025 1,072 47 4.6% 23
Bachelor | none | Internship or Residency Favorable
25-2053 Special Education Teachers, Middle School 634 657 23 3.6% 13 Bachelor | none | Internship or Residency Favorable
25-2054 Special Education Teachers, Secondary School 476 491 15 3.2% 10
Bachelor | none | Internship or Residency Less Favorable
25-2059 Special Education Teachers, All Other n n n n n Bachelor | none | Internship or Residency Favorable
25-3011 Adult Basic and Secondary Education and Literacy Teachers and Instructors 138 152 14 10.1% 3
Bachelor | none | Internship or Residency Less Favorable
25-3021 Self-Enrichment Education Teachers 1,550 1,803 253 16.3% 51 High school |< 5 yrs | none Very Favorable25-3098 Substitute Teachers 2,912 3,007 95 3.3% 60 Bachelor | none | Internship
or Residency Favorable25-3099 Teachers and Instructors, All Other 2,105 2,361 256 12.2% 62 Bachelor | none | Internship
or Residency Very Favorable25-4011 Archivists n n n n n Masters | none | none Less Favorable25-4012 Curators 78 87 9 11.5% 3 Masters | none | none Favorable25-4013 Museum Technicians and Conservators n n n n n Bachelor | none | none Less Favorable25-4021 Librarians 1,136 1,193 57 5.0% 32 Masters | none | none Favorable

New Hampshire Employment Projecti ons, 2012-2022
New Hampshire Employment SecurityEconomic & Labor Market Informati on Bureau 15 www.nh.gov/nhes/elmi/projecti ons.htm
Occupati onal Projecti ons, 2012-2022SOCCode Occupation Title
Estimated 2012
Projected 2022
2012-2022 Change
Percent Change
AnnualOpenings
CategoriesEduc. | Exp. | Training Descriptor
n = employment data does not meet disclosure standards
25-4031 Library Technicians 754 803 49 6.5% 46 Postsecondary | none | none Favorable
25-9011 Audio-Visual and Multimedia Collections Specialists n n n n n Bachelor | < 5 yrs | none Not Favorable
25-9031 Instructional Coordinators 420 479 59 14.0% 10 Masters | 5+ yrs | none Favorable25-9041 Teacher Assistants 8,090 8,463 373 4.6% 221 Some college | none | none Favorable25-9099 Education, Training, and Library Workers,
All Other 701 737 36 5.1% 10 Bachelor | none | none Less Favorable27-0000 Arts, Design, Entertainment, Sports, and
Media Occupations 9,133 9,898 765 8.4% 29627-1011 Art Directors 190 195 5 2.6% 4 Bachelor | 5+ yrs | none Less Favorable27-1012 Craft Artists 63 64 1 1.6% 2 High school | none | Long-
term OJT Less Favorable27-1013 Fine Artists, Including Painters, Sculptors, and
Illustrators 8 8 0 0.0% 0High school | none | Long-term OJT Not Favorable
27-1014 Multimedia Artists and Animators 266 300 34 12.8% 9 Bachelor | none | Moderate-term OJT Favorable
27-1019 Artists and Related Workers, All Other 37 37 0 0.0% 1 High school | none | Long-term OJT Not Favorable
27-1021 Commercial and Industrial Designers 111 120 9 8.1% 4 Bachelor | none | none Less Favorable27-1022 Fashion Designers 52 54 2 3.8% 1 Bachelor | none | none Less Favorable27-1023 Floral Designers 299 277 -22 -7.4% 8 High school | none |
Moderate-term OJT Less Favorable27-1024 Graphic Designers 1,086 1,188 102 9.4% 39 Bachelor | none | none Favorable27-1025 Interior Designers 201 218 17 8.5% 7 Bachelor | none | none Favorable27-1026 Merchandise Displayers and Window
Trimmers 532 581 49 9.2% 19High school | none | Moderate-term OJT Favorable
27-1027 Set and Exhibit Designers 28 30 2 7.1% 1 Bachelor | none | none Less Favorable27-1029 Designers, All Other 115 123 8 7.0% 4 Bachelor | none | none Less Favorable27-2011 Actors 154 175 21 13.6% 7 Some college | none |
Long-term OJT Favorable27-2012 Producers and Directors 221 241 20 9.0% 10 Bachelor | < 5 yrs | none Favorable27-2021 Athletes and Sports Competitors 25 26 1 4.0% 1 High school | none | Long-
term OJT Less Favorable27-2022 Coaches and Scouts 1,008 1,168 160 15.9% 46 Bachelor | none | none Very Favorable27-2023 Umpires, Referees, and Other Sports Offi cials n n n n n High school | none |
Moderate-term OJT Less Favorable27-2032 Choreographers n n n n n High school | 5+ yrs |
Long-term OJT Not Favorable27-2041 Music Directors and Composers 262 270 8 3.1% 8 Bachelor | < 5 yrs | none Less Favorable27-2042 Musicians and Singers 418 435 17 4.1% 13 High school | none | Long-
term OJT Favorable27-2099 Entertainers and Performers, Sports and
Related Workers, All Other n n n n n High school | none | none Less Favorable27-3011 Radio and Television Announcers 176 178 2 1.1% 4 Bachelor | none | none Less Favorable27-3012 Public Address System and Other
Announcers n n n n nHigh school | none | Short-term OJT Not Favorable
27-3022 Reporters and Correspondents 291 250 -41 -14.1% 10 Bachelor | none | none Less Favorable27-3031 Public Relations Specialists 941 1,062 121 12.9% 25 Bachelor | none | none Very Favorable27-3041 Editors 358 365 7 2.0% 10 Bachelor | < 5 yrs | none Less Favorable27-3042 Technical Writers 185 195 10 5.4% 7 Bachelor | < 5 yrs | Short-
term OJT Less Favorable

New Hampshire Employment Projecti ons, 2012-2022
New Hampshire Employment SecurityEconomic & Labor Market Informati on Bureau 16 www.nh.gov/nhes/elmi/projecti ons.htm
Occupati onal Projecti ons, 2012-2022SOCCode Occupation Title
Estimated 2012
Projected 2022
2012-2022 Change
Percent Change
AnnualOpenings
CategoriesEduc. | Exp. | Training Descriptor
n = employment data does not meet disclosure standards
27-3043 Writers and Authors 623 663 40 6.4% 18 Bachelor | none | Moderate-term OJT Favorable
27-3091 Interpreters and Translators 215 318 103 47.9% 13 Bachelor | none | Short-term OJT Very Favorable
27-3099 Media and Communication Workers, All Other 82 89 7 8.5% 2 High school | none | Short-term OJT Less Favorable
27-4011 Audio and Video Equipment Technicians 156 180 24 15.4% 5 Postsecondary | none | Short-term OJT Favorable
27-4012 Broadcast Technicians 114 122 8 7.0% 3 Associate | none | Short-term OJT Less Favorable
27-4014 Sound Engineering Technicians 42 45 3 7.1% 1 Postsecondary | none | Short-term OJT Less Favorable
27-4021 Photographers 498 512 14 2.8% 6 High school | none | Long-term OJT Less Favorable
27-4031 Camera Operators, Television, Video, and Motion Picture 106 115 9 8.5% 2 Bachelor | none | none Less Favorable
27-4032 Film and Video Editors 44 47 3 6.8% 0 Bachelor | none | none Less Favorable27-4099 Media and Communication Equipment
Workers, All Other 137 150 13 9.5% 3High school | none | Short-term OJT Less Favorable
29-0000 Healthcare Practitioners and Technical Occupations
36,373 43,760 7,387 20.3% 1,488
29-1011 Chiropractors 161 176 15 9.3% 5 Doctoral or Professional | none | none Less Favorable
29-1020 Dentists3 586 647 61 10.4% 20 Doctoral or Professional | none | none Favorable
29-1031 Dietitians and Nutritionists 283 344 61 21.6% 9 Bachelor | none | Internship or Residency Favorable
29-1041 Optometrists 138 162 24 17.4% 6 Doctoral or Professional | none | none Favorable
29-1051 Pharmacists 1,215 1,385 170 14.0% 46 Doctoral or Professional | none | none Very Favorable
29-1060 Physicians and Surgeons 3 3,109 3,599 490 15.8% 127 Doctoral or Professional | none| Internship or Residency Very Favorable
29-1071 Physician Assistants 469 640 171 36.5% 25 Masters | none | none Very Favorable29-1081 Podiatrists 39 46 7 17.9% 2 Doctoral or Professional
| none| Internship or Residency Favorable
29-1122 Occupational Therapists 687 858 171 24.9% 26 Masters | none | none Very Favorable29-1123 Physical Therapists 1,181 1,548 367 31.1% 66 Doctoral or Professional |
none | none Very Favorable29-1124 Radiation Therapists 92 110 18 19.6% 4 Associate | none | none Favorable29-1125 Recreational Therapists 82 89 7 8.5% 3 Bachelor | none | none Less Favorable29-1126 Respiratory Therapists 476 566 90 18.9% 16 Associate | none | none Very Favorable29-1127 Speech-Language Pathologists 612 701 89 14.5% 18 Masters | none | none Very Favorable29-1128 Exercise Physiologists 41 43 2 4.9% 0 Bachelor | none | none Not Favorable29-1129 Therapists, All Other 44 58 14 31.8% 1 Bachelor | none | none Favorable29-1131 Veterinarians 403 457 54 13.4% 18 Doctoral or Professional |
none | none Very Favorable29-1141 Registered Nurses 12,584 14,999 2,415 19.2% 486 Associate | none | none Very Favorable29-1151 Nurse Anesthetists 123 149 26 21.1% 5 Masters | none | none Favorable29-1161 Nurse Midwives 47 61 14 29.8% 2 Masters | none | none Favorable
3 Data for Dentists, all specializations and Physicians and Surgeons, all specializations have been combined to summary levels.
New Hampshire Employment Projecti ons, 2012-2022
New Hampshire Employment SecurityEconomic & Labor Market Informati on Bureau 17 www.nh.gov/nhes/elmi/projecti ons.htm
Occupati onal Projecti ons, 2012-2022SOCCode Occupation Title
Estimated 2012
Projected 2022
2012-2022 Change
Percent Change
AnnualOpenings
CategoriesEduc. | Exp. | Training Descriptor
n = employment data does not meet disclosure standards
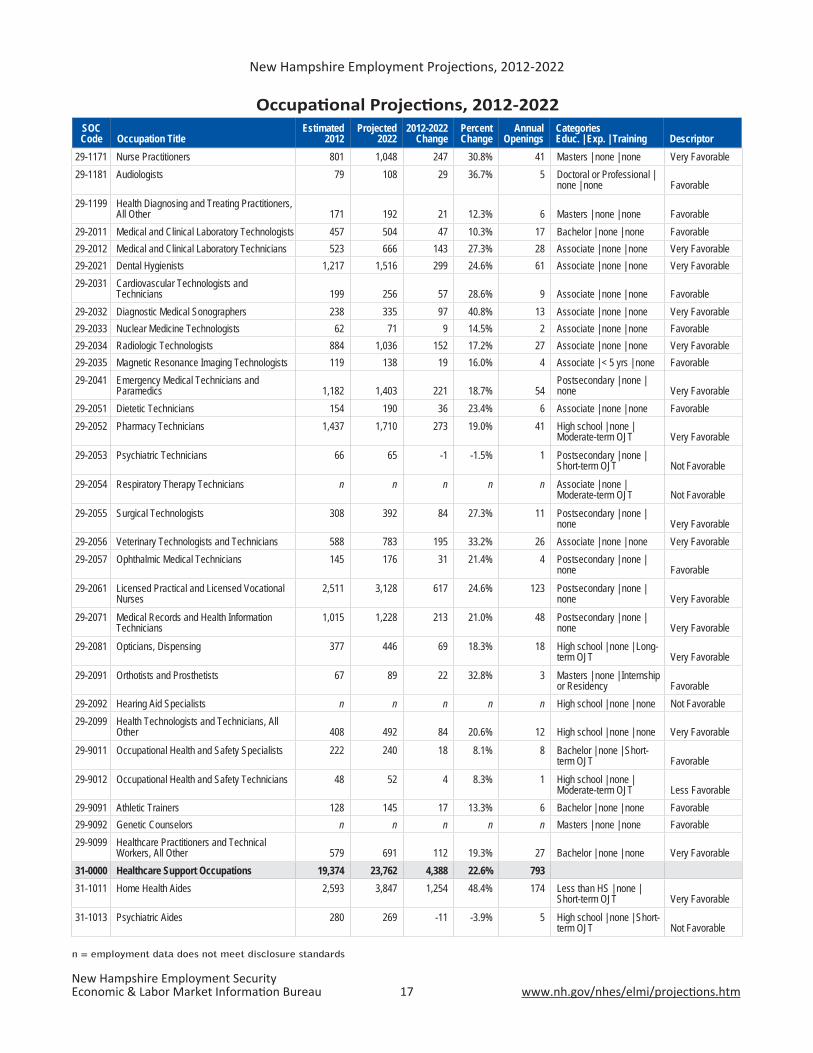
29-1171 Nurse Practitioners 801 1,048 247 30.8% 41 Masters | none | none Very Favorable29-1181 Audiologists 79 108 29 36.7% 5 Doctoral or Professional |
none | none Favorable29-1199 Health Diagnosing and Treating Practitioners,
All Other 171 192 21 12.3% 6 Masters | none | none Favorable29-2011 Medical and Clinical Laboratory Technologists 457 504 47 10.3% 17 Bachelor | none | none Favorable29-2012 Medical and Clinical Laboratory Technicians 523 666 143 27.3% 28 Associate | none | none Very Favorable29-2021 Dental Hygienists 1,217 1,516 299 24.6% 61 Associate | none | none Very Favorable29-2031 Cardiovascular Technologists and
Technicians 199 256 57 28.6% 9 Associate | none | none Favorable29-2032 Diagnostic Medical Sonographers 238 335 97 40.8% 13 Associate | none | none Very Favorable29-2033 Nuclear Medicine Technologists 62 71 9 14.5% 2 Associate | none | none Favorable29-2034 Radiologic Technologists 884 1,036 152 17.2% 27 Associate | none | none Very Favorable29-2035 Magnetic Resonance Imaging Technologists 119 138 19 16.0% 4 Associate | < 5 yrs | none Favorable29-2041 Emergency Medical Technicians and
Paramedics 1,182 1,403 221 18.7% 54Postsecondary | none | none Very Favorable
29-2051 Dietetic Technicians 154 190 36 23.4% 6 Associate | none | none Favorable29-2052 Pharmacy Technicians 1,437 1,710 273 19.0% 41 High school | none |
Moderate-term OJT Very Favorable29-2053 Psychiatric Technicians 66 65 -1 -1.5% 1 Postsecondary | none |
Short-term OJT Not Favorable29-2054 Respiratory Therapy Technicians n n n n n Associate | none |
Moderate-term OJT Not Favorable29-2055 Surgical Technologists 308 392 84 27.3% 11 Postsecondary | none |
none Very Favorable29-2056 Veterinary Technologists and Technicians 588 783 195 33.2% 26 Associate | none | none Very Favorable29-2057 Ophthalmic Medical Technicians 145 176 31 21.4% 4 Postsecondary | none |
none Favorable29-2061 Licensed Practical and Licensed Vocational
Nurses 2,511 3,128 617 24.6% 123 Postsecondary | none |
none Very Favorable29-2071 Medical Records and Health Information
Technicians 1,015 1,228 213 21.0% 48 Postsecondary | none |
none Very Favorable29-2081 Opticians, Dispensing 377 446 69 18.3% 18 High school | none | Long-
term OJT Very Favorable29-2091 Orthotists and Prosthetists 67 89 22 32.8% 3 Masters | none | Internship
or Residency Favorable29-2092 Hearing Aid Specialists n n n n n High school | none | none Not Favorable29-2099 Health Technologists and Technicians, All
Other 408 492 84 20.6% 12 High school | none | none Very Favorable29-9011 Occupational Health and Safety Specialists 222 240 18 8.1% 8 Bachelor | none | Short-
term OJT Favorable29-9012 Occupational Health and Safety Technicians 48 52 4 8.3% 1 High school | none |
Moderate-term OJT Less Favorable29-9091 Athletic Trainers 128 145 17 13.3% 6 Bachelor | none | none Favorable29-9092 Genetic Counselors n n n n n Masters | none | none Favorable29-9099 Healthcare Practitioners and Technical
Workers, All Other 579 691 112 19.3% 27 Bachelor | none | none Very Favorable31-0000 Healthcare Support Occupations 19,374 23,762 4,388 22.6% 79331-1011 Home Health Aides 2,593 3,847 1,254 48.4% 174 Less than HS | none |
Short-term OJT Very Favorable31-1013 Psychiatric Aides 280 269 -11 -3.9% 5 High school | none | Short-
term OJT Not Favorable

New Hampshire Employment Projecti ons, 2012-2022
New Hampshire Employment SecurityEconomic & Labor Market Informati on Bureau 18 www.nh.gov/nhes/elmi/projecti ons.htm
Occupati onal Projecti ons, 2012-2022SOCCode Occupation Title
Estimated 2012
Projected 2022
2012-2022 Change
Percent Change
AnnualOpenings
CategoriesEduc. | Exp. | Training Descriptor
n = employment data does not meet disclosure standards
31-1014 Nursing Assistants 8,494 10,293 1,799 21.2% 342 Postsecondary | none | none Very Favorable
31-1015 Orderlies 90 104 14 15.6% 3 High school | none | Short-term OJT Favorable
31-2011 Occupational Therapy Assistants 134 177 43 32.1% 7 Associate | none | none Favorable31-2012 Occupational Therapy Aides n n n n n High school | none | Short-
term OJT Favorable31-2021 Physical Therapist Assistants 380 509 129 33.9% 21 Associate | none | none Very Favorable31-2022 Physical Therapist Aides 107 139 32 29.9% 5 High school | none | Short-
term OJT Favorable31-9011 Massage Therapists 2,051 2,217 166 8.1% 39 Postsecondary | none |
none Favorable31-9091 Dental Assistants 1,246 1,456 210 16.9% 47 Postsecondary | none |
none Very Favorable31-9092 Medical Assistants 1,922 2,356 434 22.6% 80 Postsecondary | none |
none Very Favorable31-9093 Medical Equipment Preparers 322 372 50 15.5% 11 High school | none |
Moderate-term OJT Very Favorable31-9094 Medical Transcriptionists 336 362 26 7.7% 9 Postsecondary | none |
none Favorable31-9095 Pharmacy Aides n n n n n High school | none | Short-
term OJT Less Favorable31-9096 Veterinary Assistants and Laboratory Animal
Caretakers 231 255 24 10.4% 6High school | none | Short-term OJT Favorable
31-9097 Phlebotomists 613 735 122 19.9% 24 Postsecondary | none | none Very Favorable
31-9099 Healthcare Support Workers, All Other 534 620 86 16.1% 19 High school | none | none Very Favorable33-0000 Protective Service Occupations 11,639 12,578 939 8.1% 42333-1011 First-Line Supervisors of Correctional Offi cers 115 121 6 5.2% 5 High school | < 5 yrs |
Moderate-term OJT Less Favorable33-1012 First-Line Supervisors of Police and
Detectives 486 517 31 6.4% 17High school | < 5 yrs | Moderate-term OJT Favorable
33-1021 First-Line Supervisors of Fire Fighting and Prevention Workers 443 474 31 7.0% 22
Postsecondary | < 5 yrs | Moderate-term OJT Favorable
33-1099 First-Line Supervisors of Protective Service Workers, All Other 212 229 17 8.0% 7 High school |< 5 yrs | none Favorable
33-2011 Firefi ghters 1,471 1,594 123 8.4% 52 Postsecondary | none | Long-term OJT Very Favorable
33-2021 Fire Inspectors and Investigators 57 60 3 5.3% 2 High school | 5+ yrs | Moderate-term OJT Less Favorable
33-2022 Forest Fire Inspectors and Prevention Specialists 186 198 12 6.5% 7
High school | < 5 yrs | Moderate-term OJT Less Favorable
33-3011 Bailiffs 35 38 3 8.6% 1 High school | none | Moderate-term OJT Less Favorable
33-3012 Correctional Offi cers and Jailers 1,084 1,149 65 6.0% 35 High school | none | Moderate-term OJT Favorable
33-3021 Detectives and Criminal Investigators 372 395 23 6.2% 10 High school | < 5 yrs | Moderate-term OJT Less Favorable
33-3031 Fish and Game Wardens 46 48 2 4.3% 1 High school | none | Short-term OJT Less Favorable
33-3041 Parking Enforcement Workers 45 44 -1 -2.2% 1 High school | none | Short-term OJT Not Favorable
33-3051 Police and Sheriff’s Patrol Offi cers 2,971 3,169 198 6.7% 113 High school | none | Moderate-term OJT Favorable
New Hampshire Employment Projecti ons, 2012-2022
New Hampshire Employment SecurityEconomic & Labor Market Informati on Bureau 19 www.nh.gov/nhes/elmi/projecti ons.htm
Occupati onal Projecti ons, 2012-2022SOCCode Occupation Title
Estimated 2012
Projected 2022
2012-2022 Change
Percent Change
AnnualOpenings
CategoriesEduc. | Exp. | Training Descriptor
n = employment data does not meet disclosure standards
33-9011 Animal Control Workers 94 101 7 7.4% 3 High school | none | Moderate-term OJT Less Favorable
33-9021 Private Detectives and Investigators 234 263 29 12.4% 10 High school | < 5 yrs | Moderate-term OJT Favorable
33-9032 Security Guards 2,536 2,778 242 9.5% 63 High school | none | Short-term OJT Very Favorable
33-9091 Crossing Guards 347 410 63 18.2% 11 High school | none | Short-term OJT Very Favorable
33-9092 Lifeguards, Ski Patrol, and Other Recreational Protective Service Workers 447 492 45 10.1% 35
High school | none | Short-term OJT Favorable
33-9093 Transportation Security Screeners 158 177 19 12.0% 6 High school | none | Short-term OJT Favorable
33-9099 Protective Service Workers, All Other 300 321 21 7.0% 22 High school | none | Short-term OJT Favorable
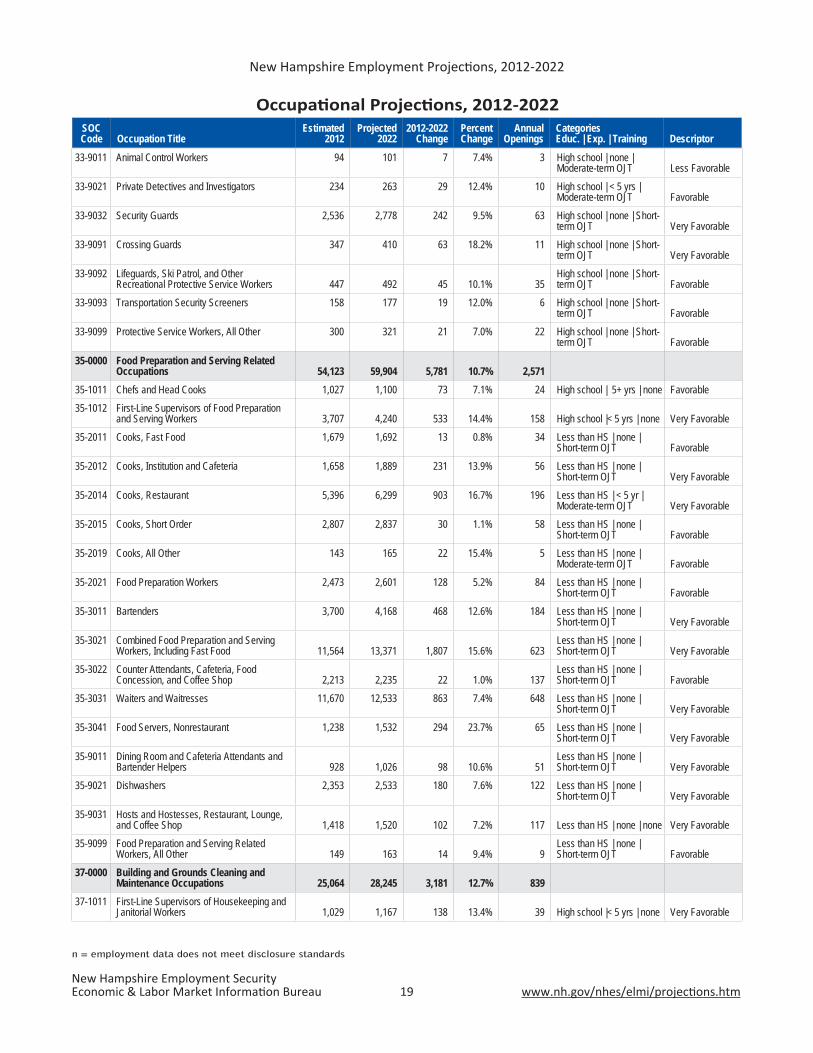
35-0000 Food Preparation and Serving Related Occupations 54,123 59,904 5,781 10.7% 2,571
35-1011 Chefs and Head Cooks 1,027 1,100 73 7.1% 24 High school | 5+ yrs | none Favorable35-1012 First-Line Supervisors of Food Preparation
and Serving Workers 3,707 4,240 533 14.4% 158 High school |< 5 yrs | none Very Favorable35-2011 Cooks, Fast Food 1,679 1,692 13 0.8% 34 Less than HS | none |
Short-term OJT Favorable35-2012 Cooks, Institution and Cafeteria 1,658 1,889 231 13.9% 56 Less than HS | none |
Short-term OJT Very Favorable35-2014 Cooks, Restaurant 5,396 6,299 903 16.7% 196 Less than HS | < 5 yr |
Moderate-term OJT Very Favorable35-2015 Cooks, Short Order 2,807 2,837 30 1.1% 58 Less than HS | none |
Short-term OJT Favorable35-2019 Cooks, All Other 143 165 22 15.4% 5 Less than HS | none |
Moderate-term OJT Favorable35-2021 Food Preparation Workers 2,473 2,601 128 5.2% 84 Less than HS | none |
Short-term OJT Favorable35-3011 Bartenders 3,700 4,168 468 12.6% 184 Less than HS | none |
Short-term OJT Very Favorable35-3021 Combined Food Preparation and Serving
Workers, Including Fast Food 11,564 13,371 1,807 15.6% 623Less than HS | none | Short-term OJT Very Favorable
35-3022 Counter Attendants, Cafeteria, Food Concession, and Coffee Shop 2,213 2,235 22 1.0% 137
Less than HS | none | Short-term OJT Favorable
35-3031 Waiters and Waitresses 11,670 12,533 863 7.4% 648 Less than HS | none | Short-term OJT Very Favorable
35-3041 Food Servers, Nonrestaurant 1,238 1,532 294 23.7% 65 Less than HS | none | Short-term OJT Very Favorable
35-9011 Dining Room and Cafeteria Attendants and Bartender Helpers 928 1,026 98 10.6% 51
Less than HS | none | Short-term OJT Very Favorable
35-9021 Dishwashers 2,353 2,533 180 7.6% 122 Less than HS | none | Short-term OJT Very Favorable
35-9031 Hosts and Hostesses, Restaurant, Lounge, and Coffee Shop 1,418 1,520 102 7.2% 117 Less than HS | none | none Very Favorable
35-9099 Food Preparation and Serving Related Workers, All Other 149 163 14 9.4% 9
Less than HS | none | Short-term OJT Favorable
37-0000 Building and Grounds Cleaning and Maintenance Occupations 25,064 28,245 3,181 12.7% 839
37-1011 First-Line Supervisors of Housekeeping and Janitorial Workers 1,029 1,167 138 13.4% 39 High school |< 5 yrs | none Very Favorable

New Hampshire Employment Projecti ons, 2012-2022
New Hampshire Employment SecurityEconomic & Labor Market Informati on Bureau 20 www.nh.gov/nhes/elmi/projecti ons.htm
Occupati onal Projecti ons, 2012-2022SOCCode Occupation Title
Estimated 2012
Projected 2022
2012-2022 Change
Percent Change
AnnualOpenings
CategoriesEduc. | Exp. | Training Descriptor
n = employment data does not meet disclosure standards
37-1012 First-Line Supervisors of Landscaping, Lawn Service, and Groundskeeping Workers 1,136 1,278 142 12.5% 27 High school |< 5 yrs | none Very Favorable
37-2011 Janitors and Cleaners, Except Maids and Housekeeping Cleaners 9,869 10,931 1,062 10.8% 292
Less than HS | none | Short-term OJT Very Favorable
37-2012 Maids and Housekeeping Cleaners 5,815 6,706 891 15.3% 204 Less than HS | none | Short-term OJT Very Favorable
37-2019 Building Cleaning Workers, All Other 45 53 8 17.8% 2 Less than HS | none | Short-term OJT Favorable
37-2021 Pest Control Workers 170 205 35 20.6% 9 High school | none | Moderate-term OJT Favorable
37-3011 Landscaping and Groundskeeping Workers 6,626 7,468 842 12.7% 251 Less than HS | none | Short-term OJT Very Favorable
37-3012 Pesticide Handlers, Sprayers, and Applicators, Vegetation 31 36 5 16.1% 1
High school | none | Moderate-term OJT Favorable
37-3013 Tree Trimmers and Pruners 219 263 44 20.1% 10 High school | none | Short-term OJT Favorable
37-3019 Grounds Maintenance Workers, All Other 124 138 14 11.3% 4 Less than HS | none | Short-term OJT Favorable
39-0000 Personal Care and Service Occupations 23,641 28,369 4,728 20.0% 95739-1011 Gaming Supervisors 56 60 4 7.1% 1 High school |< 5 yrs | none Less Favorable39-1021 First-Line Supervisors of Personal Service
Workers 913 1,012 99 10.8% 27 High school |< 5 yrs | none Favorable39-2011 Animal Trainers 140 164 24 17.1% 8 High school | none |
Moderate-term OJT Favorable39-2021 Nonfarm Animal Caretakers 981 1,151 170 17.3% 29 Less than HS | none |
Short-term OJT Very Favorable39-3011 Gaming Dealers n n n n n High school | none | Short-
term OJT Favorable39-3021 Motion Picture Projectionists n n n n n Less than HS | none |
Short-term OJT Not Favorable39-3031 Ushers, Lobby Attendants, and Ticket Takers 187 197 10 5.3% 11 Less than HS | none |
Short-term OJT Favorable39-3091 Amusement and Recreation Attendants 1,029 1,155 126 12.2% 65 Less than HS | none |
Short-term OJT Very Favorable39-3092 Costume Attendants n n n n n High school | none | Short-
term OJT Less Favorable39-3093 Locker Room, Coatroom, and Dressing Room
Attendants 75 84 9 12.0% 5High school | none | Short-term OJT Favorable
39-4011 Embalmers n n n n n Postsecondary | none | Short-term OJT Not Favorable
39-4021 Funeral Attendants 44 45 1 2.3% 1 High school | none | Short-term OJT Less Favorable
39-4031 Morticians, Undertakers, and Funeral Directors 114 127 13 11.4% 3
Associate | none | Long-term OJT Favorable
39-5011 Barbers 502 543 41 8.2% 17 Postsecondary | none | none Favorable
39-5012 Hairdressers, Hairstylists, and Cosmetologists 4,572 5,109 537 11.7% 161 Postsecondary | none | none Very Favorable
39-5092 Manicurists and Pedicurists 258 298 40 15.5% 6 Postsecondary | none | none Favorable
39-5093 Shampooers n n n n n Less than HS | none | Short-term OJT Not Favorable
39-5094 Skincare Specialists 160 222 62 38.8% 7 Postsecondary | none | none Favorable
New Hampshire Employment Projecti ons, 2012-2022
New Hampshire Employment SecurityEconomic & Labor Market Informati on Bureau 21 www.nh.gov/nhes/elmi/projecti ons.htm
Occupati onal Projecti ons, 2012-2022SOCCode Occupation Title
Estimated 2012
Projected 2022
2012-2022 Change
Percent Change
AnnualOpenings
CategoriesEduc. | Exp. | Training Descriptor
n = employment data does not meet disclosure standards
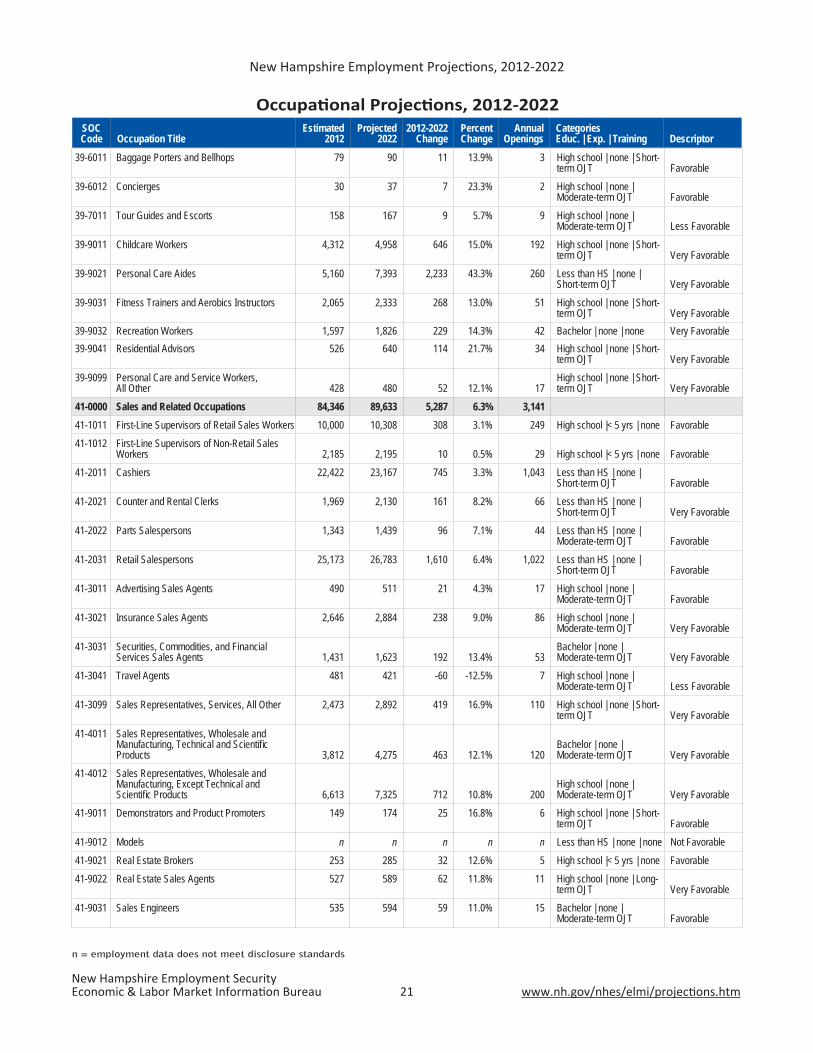
39-6011 Baggage Porters and Bellhops 79 90 11 13.9% 3 High school | none | Short-term OJT Favorable
39-6012 Concierges 30 37 7 23.3% 2 High school | none | Moderate-term OJT Favorable
39-7011 Tour Guides and Escorts 158 167 9 5.7% 9 High school | none | Moderate-term OJT Less Favorable
39-9011 Childcare Workers 4,312 4,958 646 15.0% 192 High school | none | Short-term OJT Very Favorable
39-9021 Personal Care Aides 5,160 7,393 2,233 43.3% 260 Less than HS | none | Short-term OJT Very Favorable
39-9031 Fitness Trainers and Aerobics Instructors 2,065 2,333 268 13.0% 51 High school | none | Short-term OJT Very Favorable
39-9032 Recreation Workers 1,597 1,826 229 14.3% 42 Bachelor | none | none Very Favorable39-9041 Residential Advisors 526 640 114 21.7% 34 High school | none | Short-
term OJT Very Favorable39-9099 Personal Care and Service Workers,
All Other 428 480 52 12.1% 17High school | none | Short-term OJT Very Favorable
41-0000 Sales and Related Occupations 84,346 89,633 5,287 6.3% 3,14141-1011 First-Line Supervisors of Retail Sales Workers 10,000 10,308 308 3.1% 249 High school |< 5 yrs | none Favorable41-1012 First-Line Supervisors of Non-Retail Sales
Workers 2,185 2,195 10 0.5% 29 High school |< 5 yrs | none Favorable41-2011 Cashiers 22,422 23,167 745 3.3% 1,043 Less than HS | none |
Short-term OJT Favorable41-2021 Counter and Rental Clerks 1,969 2,130 161 8.2% 66 Less than HS | none |
Short-term OJT Very Favorable41-2022 Parts Salespersons 1,343 1,439 96 7.1% 44 Less than HS | none |
Moderate-term OJT Favorable41-2031 Retail Salespersons 25,173 26,783 1,610 6.4% 1,022 Less than HS | none |
Short-term OJT Favorable41-3011 Advertising Sales Agents 490 511 21 4.3% 17 High school | none |
Moderate-term OJT Favorable41-3021 Insurance Sales Agents 2,646 2,884 238 9.0% 86 High school | none |
Moderate-term OJT Very Favorable41-3031 Securities, Commodities, and Financial
Services Sales Agents 1,431 1,623 192 13.4% 53Bachelor | none | Moderate-term OJT Very Favorable
41-3041 Travel Agents 481 421 -60 -12.5% 7 High school | none | Moderate-term OJT Less Favorable
41-3099 Sales Representatives, Services, All Other 2,473 2,892 419 16.9% 110 High school | none | Short-term OJT Very Favorable
41-4011 Sales Representatives, Wholesale and Manufacturing, Technical and Scientifi c Products 3,812 4,275 463 12.1% 120
Bachelor | none | Moderate-term OJT Very Favorable
41-4012 Sales Representatives, Wholesale and Manufacturing, Except Technical and Scientifi c Products 6,613 7,325 712 10.8% 200
High school | none | Moderate-term OJT Very Favorable
41-9011 Demonstrators and Product Promoters 149 174 25 16.8% 6 High school | none | Short-term OJT Favorable
41-9012 Models n n n n n Less than HS | none | none Not Favorable41-9021 Real Estate Brokers 253 285 32 12.6% 5 High school |< 5 yrs | none Favorable41-9022 Real Estate Sales Agents 527 589 62 11.8% 11 High school | none | Long-
term OJT Very Favorable41-9031 Sales Engineers 535 594 59 11.0% 15 Bachelor | none |
Moderate-term OJT Favorable
New Hampshire Employment Projecti ons, 2012-2022
New Hampshire Employment SecurityEconomic & Labor Market Informati on Bureau 22 www.nh.gov/nhes/elmi/projecti ons.htm
Occupati onal Projecti ons, 2012-2022SOCCode Occupation Title
Estimated 2012
Projected 2022
2012-2022 Change
Percent Change
AnnualOpenings
CategoriesEduc. | Exp. | Training Descriptor
n = employment data does not meet disclosure standards
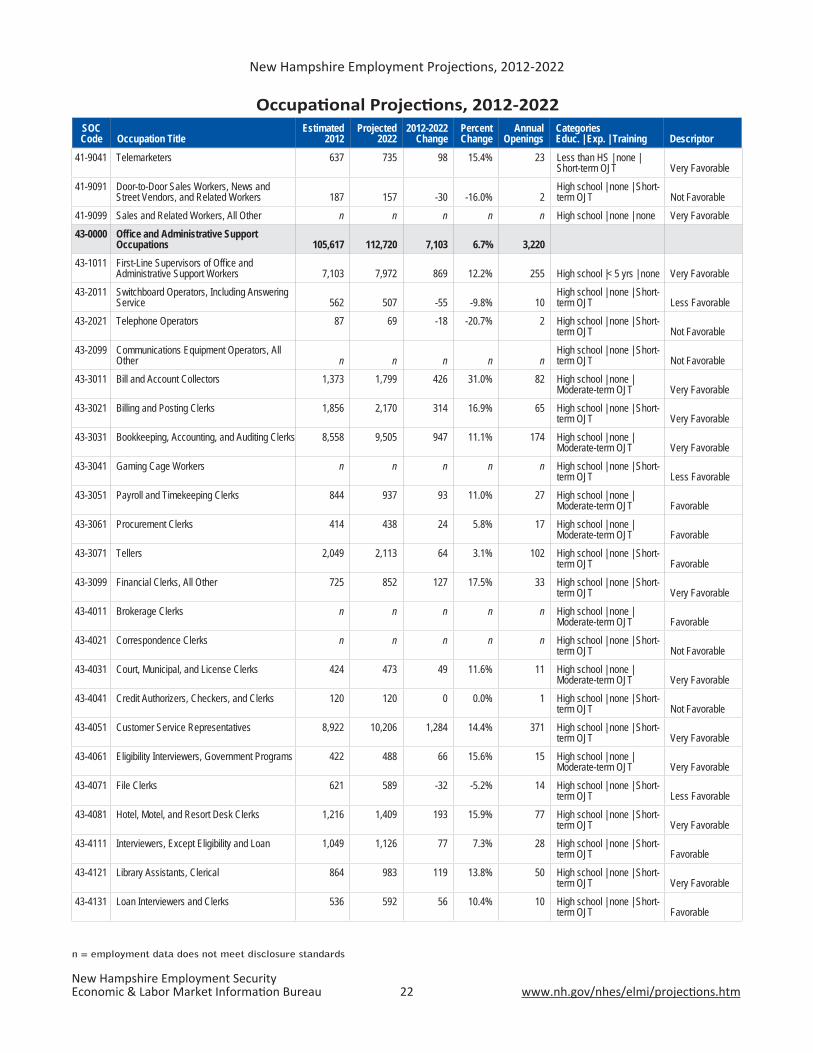
41-9041 Telemarketers 637 735 98 15.4% 23 Less than HS | none | Short-term OJT Very Favorable
41-9091 Door-to-Door Sales Workers, News and Street Vendors, and Related Workers 187 157 -30 -16.0% 2
High school | none | Short-term OJT Not Favorable
41-9099 Sales and Related Workers, All Other n n n n n High school | none | none Very Favorable43-0000 Offi ce and Administrative Support
Occupations 105,617 112,720 7,103 6.7% 3,22043-1011 First-Line Supervisors of Offi ce and
Administrative Support Workers 7,103 7,972 869 12.2% 255 High school |< 5 yrs | none Very Favorable43-2011 Switchboard Operators, Including Answering
Service 562 507 -55 -9.8% 10High school | none | Short-term OJT Less Favorable
43-2021 Telephone Operators 87 69 -18 -20.7% 2 High school | none | Short-term OJT Not Favorable
43-2099 Communications Equipment Operators, All Other n n n n n
High school | none | Short-term OJT Not Favorable
43-3011 Bill and Account Collectors 1,373 1,799 426 31.0% 82 High school | none | Moderate-term OJT Very Favorable
43-3021 Billing and Posting Clerks 1,856 2,170 314 16.9% 65 High school | none | Short-term OJT Very Favorable
43-3031 Bookkeeping, Accounting, and Auditing Clerks 8,558 9,505 947 11.1% 174 High school | none | Moderate-term OJT Very Favorable
43-3041 Gaming Cage Workers n n n n n High school | none | Short-term OJT Less Favorable
43-3051 Payroll and Timekeeping Clerks 844 937 93 11.0% 27 High school | none | Moderate-term OJT Favorable
43-3061 Procurement Clerks 414 438 24 5.8% 17 High school | none | Moderate-term OJT Favorable
43-3071 Tellers 2,049 2,113 64 3.1% 102 High school | none | Short-term OJT Favorable
43-3099 Financial Clerks, All Other 725 852 127 17.5% 33 High school | none | Short-term OJT Very Favorable
43-4011 Brokerage Clerks n n n n n High school | none | Moderate-term OJT Favorable
43-4021 Correspondence Clerks n n n n n High school | none | Short-term OJT Not Favorable
43-4031 Court, Municipal, and License Clerks 424 473 49 11.6% 11 High school | none | Moderate-term OJT Very Favorable
43-4041 Credit Authorizers, Checkers, and Clerks 120 120 0 0.0% 1 High school | none | Short-term OJT Not Favorable
43-4051 Customer Service Representatives 8,922 10,206 1,284 14.4% 371 High school | none | Short-term OJT Very Favorable
43-4061 Eligibility Interviewers, Government Programs 422 488 66 15.6% 15 High school | none | Moderate-term OJT Very Favorable
43-4071 File Clerks 621 589 -32 -5.2% 14 High school | none | Short-term OJT Less Favorable
43-4081 Hotel, Motel, and Resort Desk Clerks 1,216 1,409 193 15.9% 77 High school | none | Short-term OJT Very Favorable
43-4111 Interviewers, Except Eligibility and Loan 1,049 1,126 77 7.3% 28 High school | none | Short-term OJT Favorable
43-4121 Library Assistants, Clerical 864 983 119 13.8% 50 High school | none | Short-term OJT Very Favorable
43-4131 Loan Interviewers and Clerks 536 592 56 10.4% 10 High school | none | Short-term OJT Favorable

New Hampshire Employment Projecti ons, 2012-2022
New Hampshire Employment SecurityEconomic & Labor Market Informati on Bureau 23 www.nh.gov/nhes/elmi/projecti ons.htm
Occupati onal Projecti ons, 2012-2022SOCCode Occupation Title
Estimated 2012
Projected 2022
2012-2022 Change
Percent Change
AnnualOpenings
CategoriesEduc. | Exp. | Training Descriptor
n = employment data does not meet disclosure standards
43-4141 New Accounts Clerks 482 466 -16 -3.3% 12 High school | none | Moderate-term OJT Less Favorable
43-4151 Order Clerks 1,296 1,294 -2 -0.2% 34 High school | none | Short-term OJT Less Favorable
43-4161 Human Resources Assistants, Except Payroll and Timekeeping 642 651 9 1.4% 17
High school | none | Short-term OJT Favorable
43-4171 Receptionists and Information Clerks 5,120 5,512 392 7.7% 177 High school | none | Short-term OJT Very Favorable
43-4181 Reservation and Transportation Ticket Agents and Travel Clerks 226 213 -13 -5.8% 3
High school | none | Short-term OJT Not Favorable
43-4199 Information and Record Clerks, All Other 1,079 1,043 -36 -3.3% 23 High school | none | Short-term OJT Less Favorable
43-5011 Cargo and Freight Agents 82 93 11 13.4% 3 High school | none | Short-term OJT Favorable
43-5021 Couriers and Messengers 380 353 -27 -7.1% 5 High school | none | Short-term OJT Not Favorable
43-5031 Police, Fire, and Ambulance Dispatchers 700 756 56 8.0% 26 High school | none | Moderate-term OJT Favorable
43-5032 Dispatchers, Except Police, Fire, and Ambulance 771 812 41 5.3% 26
High school | none | Moderate-term OJT Favorable
43-5041 Meter Readers, Utilities 135 115 -20 -14.8% 3 High school | none | Short-term OJT Not Favorable
43-5051 Postal Service Clerks 475 338 -137 -28.8% 7 High school | none | Short-term OJT Less Favorable
43-5052 Postal Service Mail Carriers 1,492 1,137 -355 -23.8% 52 High school | none | Short-term OJT Less Favorable
43-5053 Postal Service Mail Sorters, Processors, and Processing Machine Operators 707 517 -190 -26.9% 5
High school | none | Short-term OJT Not Favorable
43-5061 Production, Planning, and Expediting Clerks 1,332 1,387 55 4.1% 39 High school | none | Moderate-term OJT Favorable
43-5071 Shipping, Receiving, and Traffi c Clerks 3,158 3,290 132 4.2% 96 High school | none | Short-term OJT Favorable
43-5081 Stock Clerks and Order Fillers 12,437 12,370 -67 -0.5% 376 Less than HS | none | Short-term OJT Less Favorable
43-5111 Weighers, Measurers, Checkers, and Samplers, Recordkeeping 302 314 12 4.0% 8
High school | none | Short-term OJT Less Favorable
43-6011 Executive Secretaries and Executive Administrative Assistants 1,867 1,779 -88 -4.7% 22 High school |< 5 yrs | none Less Favorable
43-6012 Legal Secretaries 781 704 -77 -9.9% 9 High school | none | Moderate-term OJT Less Favorable
43-6013 Medical Secretaries 2,418 3,173 755 31.2% 105 High school | none | Moderate-term OJT Very Favorable
43-6014 Secretaries and Administrative Assistants, Except Legal, Medical, and Executive 11,008 12,210 1,202 10.9% 252
High school | none | Short-term OJT Very Favorable
43-9011 Computer Operators 311 266 -45 -14.5% 3 High school | none | Moderate-term OJT Not Favorable
43-9021 Data Entry Keyers 1,014 803 -211 -20.8% 12 High school | none | Moderate-term OJT Less Favorable
43-9022 Word Processors and Typists 111 87 -24 -21.6% 0 High school | none | Short-term OJT Not Favorable
43-9031 Desktop Publishers 71 73 2 2.8% 1 Associate | none | Short-term OJT Less Favorable
43-9041 Insurance Claims and Policy Processing Clerks 1,081 1,146 65 6.0% 35
High school | none | Moderate-term OJT Favorable

New Hampshire Employment Projecti ons, 2012-2022
New Hampshire Employment SecurityEconomic & Labor Market Informati on Bureau 24 www.nh.gov/nhes/elmi/projecti ons.htm
Occupati onal Projecti ons, 2012-2022SOCCode Occupation Title
Estimated 2012
Projected 2022
2012-2022 Change
Percent Change
AnnualOpenings
CategoriesEduc. | Exp. | Training Descriptor
n = employment data does not meet disclosure standards
43-9051 Mail Clerks and Mail Machine Operators, Except Postal Service 543 513 -30 -5.5% 12
High school | none | Short-term OJT Less Favorable
43-9061 Offi ce Clerks, General 13,528 14,308 780 5.8% 362 High school | none | Short-term OJT Favorable
43-9071 Offi ce Machine Operators, Except Computer 427 406 -21 -4.9% 10 High school | none | Short-term OJT Less Favorable
43-9081 Proofreaders and Copy Markers 61 65 4 6.6% 1 Bachelor | none | none Less Favorable43-9111 Statistical Assistants 176 212 36 20.5% 9 Bachelor | none | none Favorable43-9199 Offi ce and Administrative Support Workers,
All Other 3,206 3,488 282 8.8% 118High school | none | Short-term OJT Very Favorable
45-0000 Farming, Fishing, and Forestry Occupations 1,914 1,929 15 0.8% 55
45-1011 First-Line Supervisors of Farming, Fishing, and Forestry Workers 98 97 -1 -1.0% 2 High school |< 5 yrs | none Not Favorable
45-2011 Agricultural Inspectors n n n n n Bachelor | none | Moderate-term OJT Not Favorable
45-2041 Graders and Sorters, Agricultural Products 39 39 0 0.0% 1 Less than HS | none | Short-term OJT Not Favorable
45-2091 Agricultural Equipment Operators 71 80 9 12.7% 3 Less than HS | none | Short-term OJT Favorable
45-2092 Farmworkers and Laborers, Crop, Nursery, and Greenhouse 1,023 1,033 10 1.0% 32
Less than HS | none | Short-term OJT Favorable
45-2093 Farmworkers, Farm, Ranch, and Aquacultural Animals 238 264 26 10.9% 10
Less than HS | none | Short-term OJT Favorable
45-2099 Agricultural Workers, All Other 54 58 4 7.4% 2 Less than HS | none | Short-term OJT Less Favorable
45-3011 Fishers and Related Fishing Workers 7 6 -1 -14.3% 0 Less than HS | none | Moderate-term OJT Not Favorable
45-4011 Forest and Conservation Workers 24 25 1 4.2% 0 High school | none | Moderate-term OJT Not Favorable
45-4021 Fallers 46 27 -19 -41.3% 1 High school | none | Moderate-term OJT Not Favorable
45-4022 Logging Equipment Operators 260 259 -1 -0.4% 4 High school | none | Moderate-term OJT Not Favorable
45-4023 Log Graders and Scalers 35 25 -10 -28.6% 0 High school | none | Moderate-term OJT Not Favorable
45-4029 Logging Workers, All Other n n n n n High school | none | Moderate-term OJT Not Favorable
47-0000 Construction and Extraction Occupations 23,401 26,787 3,386 14.5% 71547-1011 First-Line Supervisors of Construction Trades
and Extraction Workers 2,864 3,265 401 14.0% 71 High school | 5+ yrs | none Very Favorable47-2011 Boilermakers 103 96 -7 -6.8% 5 High school | none |
Apprenticeship Not Favorable47-2021 Brickmasons and Blockmasons 276 350 74 26.8% 10 High school | none |
Apprenticeship Favorable47-2022 Stonemasons 112 134 22 19.6% 3 High school | none |
Apprenticeship Favorable47-2031 Carpenters 3,637 4,267 630 17.3% 108 High school | none |
Apprenticeship Very Favorable47-2041 Carpet Installers 108 112 4 3.7% 2 Less than HS | none |
Short-term OJT Less Favorable47-2042 Floor Layers, Except Carpet, Wood, and Hard
Tiles 32 35 3 9.4% 1High school | none | Moderate-term OJT Less Favorable
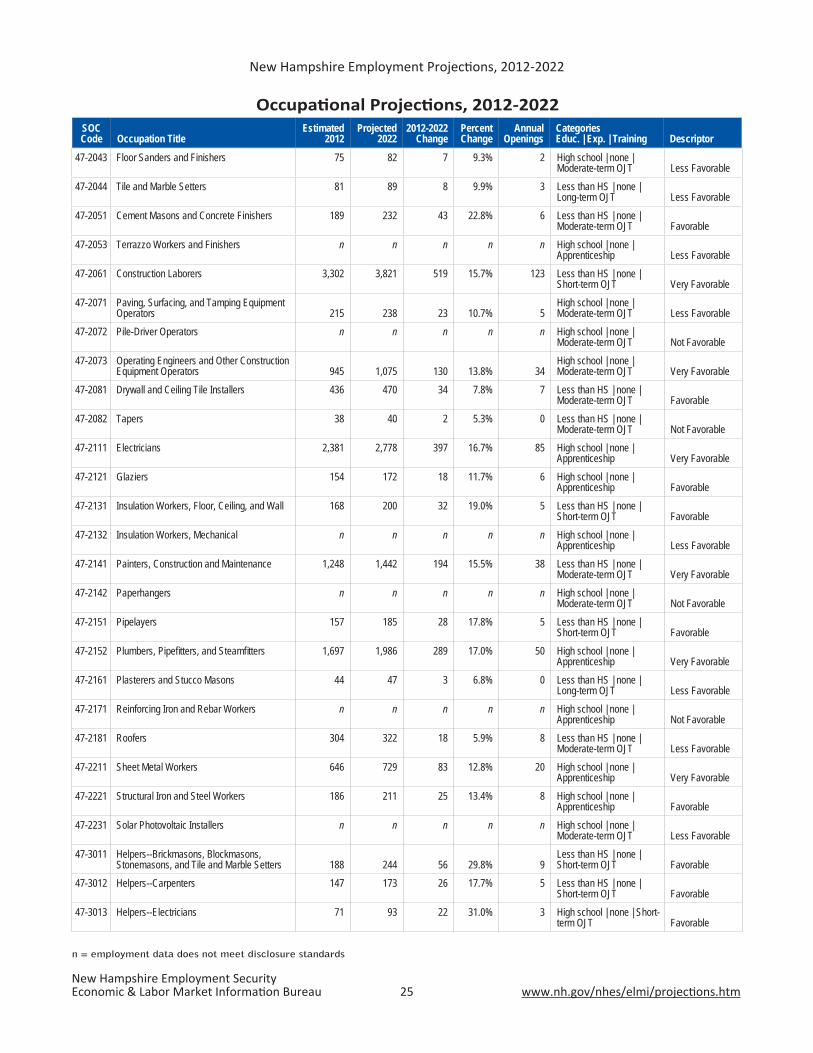
New Hampshire Employment Projecti ons, 2012-2022
New Hampshire Employment SecurityEconomic & Labor Market Informati on Bureau 25 www.nh.gov/nhes/elmi/projecti ons.htm
Occupati onal Projecti ons, 2012-2022SOCCode Occupation Title
Estimated 2012
Projected 2022
2012-2022 Change
Percent Change
AnnualOpenings
CategoriesEduc. | Exp. | Training Descriptor
n = employment data does not meet disclosure standards
47-2043 Floor Sanders and Finishers 75 82 7 9.3% 2 High school | none | Moderate-term OJT Less Favorable
47-2044 Tile and Marble Setters 81 89 8 9.9% 3 Less than HS | none | Long-term OJT Less Favorable
47-2051 Cement Masons and Concrete Finishers 189 232 43 22.8% 6 Less than HS | none | Moderate-term OJT Favorable
47-2053 Terrazzo Workers and Finishers n n n n n High school | none | Apprenticeship Less Favorable
47-2061 Construction Laborers 3,302 3,821 519 15.7% 123 Less than HS | none | Short-term OJT Very Favorable
47-2071 Paving, Surfacing, and Tamping Equipment Operators 215 238 23 10.7% 5
High school | none | Moderate-term OJT Less Favorable
47-2072 Pile-Driver Operators n n n n n High school | none | Moderate-term OJT Not Favorable
47-2073 Operating Engineers and Other Construction Equipment Operators 945 1,075 130 13.8% 34
High school | none | Moderate-term OJT Very Favorable
47-2081 Drywall and Ceiling Tile Installers 436 470 34 7.8% 7 Less than HS | none | Moderate-term OJT Favorable
47-2082 Tapers 38 40 2 5.3% 0 Less than HS | none | Moderate-term OJT Not Favorable
47-2111 Electricians 2,381 2,778 397 16.7% 85 High school | none | Apprenticeship Very Favorable
47-2121 Glaziers 154 172 18 11.7% 6 High school | none | Apprenticeship Favorable
47-2131 Insulation Workers, Floor, Ceiling, and Wall 168 200 32 19.0% 5 Less than HS | none | Short-term OJT Favorable
47-2132 Insulation Workers, Mechanical n n n n n High school | none | Apprenticeship Less Favorable
47-2141 Painters, Construction and Maintenance 1,248 1,442 194 15.5% 38 Less than HS | none | Moderate-term OJT Very Favorable
47-2142 Paperhangers n n n n n High school | none | Moderate-term OJT Not Favorable
47-2151 Pipelayers 157 185 28 17.8% 5 Less than HS | none | Short-term OJT Favorable
47-2152 Plumbers, Pipefi tters, and Steamfi tters 1,697 1,986 289 17.0% 50 High school | none | Apprenticeship Very Favorable
47-2161 Plasterers and Stucco Masons 44 47 3 6.8% 0 Less than HS | none | Long-term OJT Less Favorable
47-2171 Reinforcing Iron and Rebar Workers n n n n n High school | none | Apprenticeship Not Favorable
47-2181 Roofers 304 322 18 5.9% 8 Less than HS | none | Moderate-term OJT Less Favorable
47-2211 Sheet Metal Workers 646 729 83 12.8% 20 High school | none | Apprenticeship Very Favorable
47-2221 Structural Iron and Steel Workers 186 211 25 13.4% 8 High school | none | Apprenticeship Favorable
47-2231 Solar Photovoltaic Installers n n n n n High school | none | Moderate-term OJT Less Favorable
47-3011 Helpers--Brickmasons, Blockmasons, Stonemasons, and Tile and Marble Setters 188 244 56 29.8% 9
Less than HS | none | Short-term OJT Favorable
47-3012 Helpers--Carpenters 147 173 26 17.7% 5 Less than HS | none | Short-term OJT Favorable
47-3013 Helpers--Electricians 71 93 22 31.0% 3 High school | none | Short-term OJT Favorable
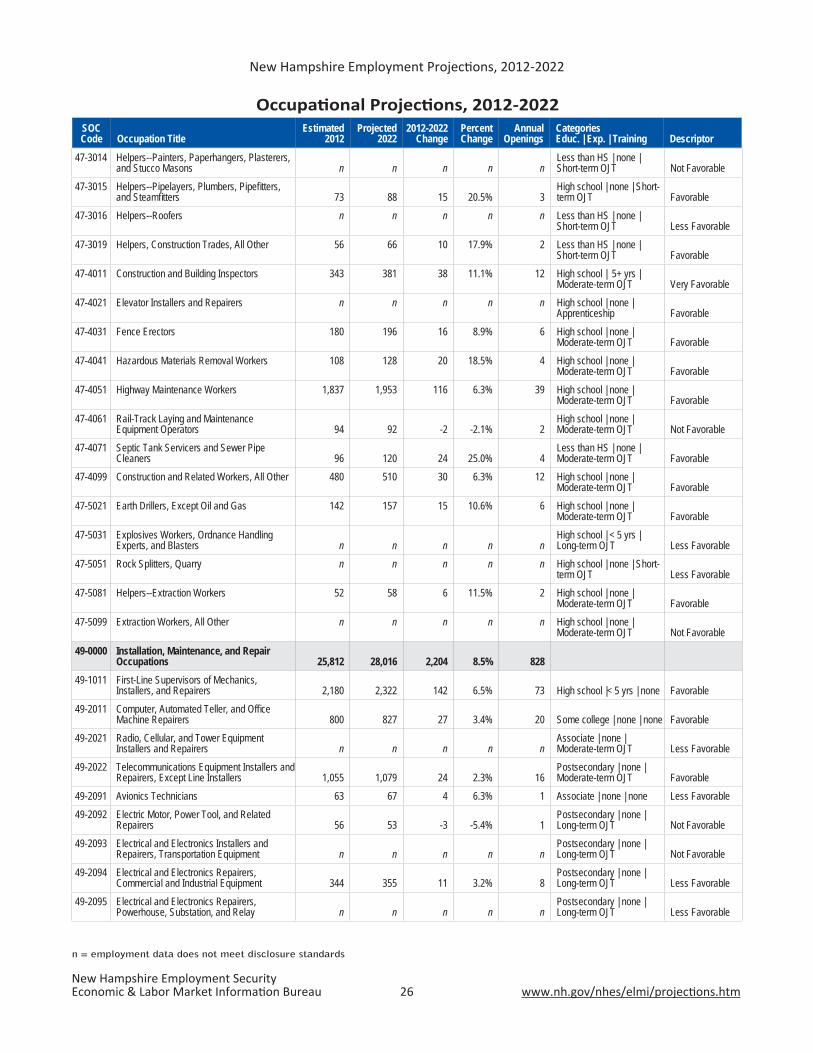
New Hampshire Employment Projecti ons, 2012-2022
New Hampshire Employment SecurityEconomic & Labor Market Informati on Bureau 26 www.nh.gov/nhes/elmi/projecti ons.htm
Occupati onal Projecti ons, 2012-2022SOCCode Occupation Title
Estimated 2012
Projected 2022
2012-2022 Change
Percent Change
AnnualOpenings
CategoriesEduc. | Exp. | Training Descriptor
n = employment data does not meet disclosure standards
47-3014 Helpers--Painters, Paperhangers, Plasterers, and Stucco Masons n n n n n
Less than HS | none | Short-term OJT Not Favorable
47-3015 Helpers--Pipelayers, Plumbers, Pipefi tters, and Steamfi tters 73 88 15 20.5% 3
High school | none | Short-term OJT Favorable
47-3016 Helpers--Roofers n n n n n Less than HS | none | Short-term OJT Less Favorable
47-3019 Helpers, Construction Trades, All Other 56 66 10 17.9% 2 Less than HS | none | Short-term OJT Favorable
47-4011 Construction and Building Inspectors 343 381 38 11.1% 12 High school | 5+ yrs | Moderate-term OJT Very Favorable
47-4021 Elevator Installers and Repairers n n n n n High school | none | Apprenticeship Favorable
47-4031 Fence Erectors 180 196 16 8.9% 6 High school | none | Moderate-term OJT Favorable
47-4041 Hazardous Materials Removal Workers 108 128 20 18.5% 4 High school | none | Moderate-term OJT Favorable
47-4051 Highway Maintenance Workers 1,837 1,953 116 6.3% 39 High school | none | Moderate-term OJT Favorable
47-4061 Rail-Track Laying and Maintenance Equipment Operators 94 92 -2 -2.1% 2
High school | none | Moderate-term OJT Not Favorable
47-4071 Septic Tank Servicers and Sewer Pipe Cleaners 96 120 24 25.0% 4
Less than HS | none | Moderate-term OJT Favorable
47-4099 Construction and Related Workers, All Other 480 510 30 6.3% 12 High school | none | Moderate-term OJT Favorable
47-5021 Earth Drillers, Except Oil and Gas 142 157 15 10.6% 6 High school | none | Moderate-term OJT Favorable
47-5031 Explosives Workers, Ordnance Handling Experts, and Blasters n n n n n
High school | < 5 yrs | Long-term OJT Less Favorable
47-5051 Rock Splitters, Quarry n n n n n High school | none | Short-term OJT Less Favorable
47-5081 Helpers--Extraction Workers 52 58 6 11.5% 2 High school | none | Moderate-term OJT Favorable
47-5099 Extraction Workers, All Other n n n n n High school | none | Moderate-term OJT Not Favorable
49-0000 Installation, Maintenance, and Repair Occupations 25,812 28,016 2,204 8.5% 828
49-1011 First-Line Supervisors of Mechanics, Installers, and Repairers 2,180 2,322 142 6.5% 73 High school |< 5 yrs | none Favorable
49-2011 Computer, Automated Teller, and Offi ce Machine Repairers 800 827 27 3.4% 20 Some college | none | none Favorable
49-2021 Radio, Cellular, and Tower Equipment Installers and Repairers n n n n n
Associate | none | Moderate-term OJT Less Favorable
49-2022 Telecommunications Equipment Installers and Repairers, Except Line Installers 1,055 1,079 24 2.3% 16
Postsecondary | none | Moderate-term OJT Favorable
49-2091 Avionics Technicians 63 67 4 6.3% 1 Associate | none | none Less Favorable49-2092 Electric Motor, Power Tool, and Related
Repairers 56 53 -3 -5.4% 1Postsecondary | none | Long-term OJT Not Favorable
49-2093 Electrical and Electronics Installers and Repairers, Transportation Equipment n n n n n
Postsecondary | none | Long-term OJT Not Favorable
49-2094 Electrical and Electronics Repairers, Commercial and Industrial Equipment 344 355 11 3.2% 8
Postsecondary | none | Long-term OJT Less Favorable
49-2095 Electrical and Electronics Repairers, Powerhouse, Substation, and Relay n n n n n
Postsecondary | none | Long-term OJT Less Favorable

New Hampshire Employment Projecti ons, 2012-2022
New Hampshire Employment SecurityEconomic & Labor Market Informati on Bureau 27 www.nh.gov/nhes/elmi/projecti ons.htm
Occupati onal Projecti ons, 2012-2022SOCCode Occupation Title
Estimated 2012
Projected 2022
2012-2022 Change
Percent Change
AnnualOpenings
CategoriesEduc. | Exp. | Training Descriptor
n = employment data does not meet disclosure standards
49-2096 Electronic Equipment Installers and Repairers, Motor Vehicles n n n n n
Postsecondary | none | Short-term OJT Not Favorable
49-2097 Electronic Home Entertainment Equipment Installers and Repairers n n n n n
Postsecondary | none | none Very Favorable
49-2098 Security and Fire Alarm Systems Installers 223 248 25 11.2% 6 High school | none | Moderate-term OJT Favorable
49-3011 Aircraft Mechanics and Service Technicians 173 178 5 2.9% 5 Postsecondary | none | none Less Favorable
49-3021 Automotive Body and Related Repairers 734 809 75 10.2% 22 High school | none | Moderate-term OJT Favorable
49-3022 Automotive Glass Installers and Repairers 41 44 3 7.3% 1 High school | none | Moderate-term OJT Less Favorable
49-3023 Automotive Service Technicians and Mechanics 4,377 4,661 284 6.5% 139
High school | none | Long-term OJT Favorable
49-3031 Bus and Truck Mechanics and Diesel Engine Specialists 851 928 77 9.0% 26
High school | none | Long-term OJT Favorable
49-3041 Farm Equipment Mechanics and Service Technicians 64 70 6 9.4% 3
High school | none | Long-term OJT Less Favorable
49-3042 Mobile Heavy Equipment Mechanics, Except Engines 543 600 57 10.5% 22
High school | none | Long-term OJT Favorable
49-3051 Motorboat Mechanics and Service Technicians 250 269 19 7.6% 7
High school | none | Long-term OJT Favorable
49-3052 Motorcycle Mechanics 161 167 6 3.7% 4High school | none | Long-term OJT Less Favorable
49-3053 Outdoor Power Equipment and Other Small Engine Mechanics 325 337 12 3.7% 8
High school | none | Moderate-term OJT Less Favorable
49-3091 Bicycle Repairers 92 107 15 16.3% 5 High school | none | Moderate-term OJT Favorable
49-3092 Recreational Vehicle Service Technicians 98 106 8 8.2% 4 High school | none | Long-term OJT Less Favorable
49-3093 Tire Repairers and Changers 583 626 43 7.4% 24 High school | none | Short-term OJT Favorable
49-9011 Mechanical Door Repairers n n n n n High school | none | Moderate-term OJT Favorable
49-9012 Control and Valve Installers and Repairers, Except Mechanical Door 96 96 0 0.0% 3
High school | none | Moderate-term OJT Not Favorable
49-9021 Heating, Air Conditioning, and Refrigeration Mechanics and Installers 1,106 1,192 86 7.8% 37
Postsecondary | none | Long-term OJT Favorable
49-9031 Home Appliance Repairers 139 141 2 1.4% 4 High school | none | Moderate-term OJT Less Favorable
49-9041 Industrial Machinery Mechanics 1,719 2,100 381 22.2% 88 High school | none | Long-term OJT Very Favorable
49-9043 Maintenance Workers, Machinery 208 239 31 14.9% 6 High school | none | Moderate-term OJT Favorable
49-9044 Millwrights 60 73 13 21.7% 2 High school | none | Apprenticeship Favorable
49-9051 Electrical Power-Line Installers and Repairers 722 773 51 7.1% 30 High school | none | Long-term OJT Favorable
49-9052 Telecommunications Line Installers and Repairers 762 803 41 5.4% 23
High school | none | Long-term OJT Favorable
49-9061 Camera and Photographic Equipment Repairers n n n n n
Associate | none | Long-term OJT Less Favorable
49-9062 Medical Equipment Repairers 146 181 35 24.0% 8 Associate | none | Moderate-term OJT Favorable

New Hampshire Employment Projecti ons, 2012-2022
New Hampshire Employment SecurityEconomic & Labor Market Informati on Bureau 28 www.nh.gov/nhes/elmi/projecti ons.htm
Occupati onal Projecti ons, 2012-2022SOCCode Occupation Title
Estimated 2012
Projected 2022
2012-2022 Change
Percent Change
AnnualOpenings
CategoriesEduc. | Exp. | Training Descriptor
n = employment data does not meet disclosure standards
49-9063 Musical Instrument Repairers and Tuners n n n n n High school | none | Apprenticeship Not Favorable
49-9064 Watch Repairers n n n n n High school | none | Long-term OJT Not Favorable
49-9069 Precision Instrument and Equipment Repairers, All Other 177 181 4 2.3% 5
High school | none | Long-term OJT Less Favorable
49-9071 Maintenance and Repair Workers, General 5,200 5,714 514 9.9% 151 High school | none | Long-term OJT Very Favorable
49-9081 Wind Turbine Service Technicians n n n n n Some college | none | Long-term OJT Less Favorable
49-9091 Coin, Vending, and Amusement Machine Servicers and Repairers 52 49 -3 -5.8% 0
High school | none | Short-term OJT Not Favorable
49-9092 Commercial Divers n n n n n Postsecondary | none | Moderate-term OJT Less Favorable
49-9093 Fabric Menders, Except Garment n n n n n Less than HS | none | Long-term OJT Not Favorable
49-9094 Locksmiths and Safe Repairers 64 67 3 4.7% 2 High school | none | Long-term OJT Less Favorable
49-9095 Manufactured Building and Mobile Home Installers 120 113 -7 -5.8% 3
High school | none | Moderate-term OJT Not Favorable
49-9096 Riggers n n n n n High school | none | Short-term OJT Less Favorable
49-9098 Helpers--Installation, Maintenance, and Repair Workers 432 465 33 7.6% 16
High school | none | Moderate-term OJT Favorable
49-9099 Installation, Maintenance, and Repair Workers, All Other 1,166 1,274 108 9.3% 31
High school | none | Moderate-term OJT Favorable
51-0000 Production Occupations 44,973 46,300 1,327 3.0% 1,08951-1011 First-Line Supervisors of Production and
Operating Workers 3,027 3,057 30 1.0% 46Postsecondary | < 5 yrs | none Favorable
51-2011 Aircraft Structure, Surfaces, Rigging, and Systems Assemblers n n n n n
High school | none | Moderate-term OJT Not Favorable
51-2021 Coil Winders, Tapers, and Finishers 107 99 -8 -7.5% 1 High school | none | Short-term OJT Not Favorable
51-2022 Electrical and Electronic Equipment Assemblers 2,595 2,557 -38 -1.5% 32
High school | none | Short-term OJT Less Favorable
51-2023 Electromechanical Equipment Assemblers 926 952 26 2.8% 14 High school | none | Short-term OJT Favorable
51-2031 Engine and Other Machine Assemblers 239 254 15 6.3% 6 High school | none | Short-term OJT Less Favorable
51-2041 Structural Metal Fabricators and Fitters 247 278 31 12.6% 13 High school | none | Moderate-term OJT Very Favorable
51-2091 Fiberglass Laminators and Fabricators n n n n n High school | none | Moderate-term OJT Not Favorable
51-2092 Team Assemblers 2,902 2,991 89 3.1% 55 High school | none | Moderate-term OJT Favorable
51-2099 Assemblers and Fabricators, All Other 2,546 2,645 99 3.9% 50 High school | none | Moderate-term OJT Favorable
51-3011 Bakers 546 612 66 12.1% 20 Less than HS | none | Long-term OJT Very Favorable
51-3021 Butchers and Meat Cutters 918 1,009 91 9.9% 32 Less than HS | none | Long-term OJT Favorable
51-3022 Meat, Poultry, and Fish Cutters and Trimmers
172 196 24 14.0% 6 Less than HS | none | Short-term OJT Favorable
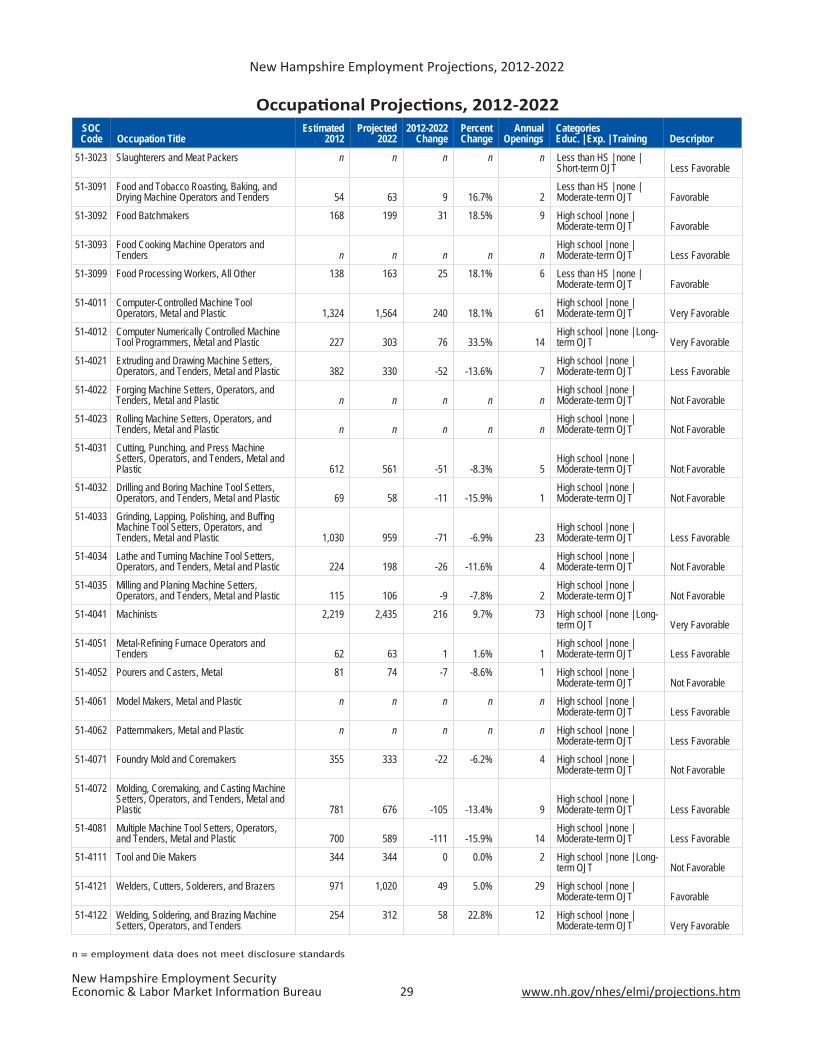
New Hampshire Employment Projecti ons, 2012-2022
New Hampshire Employment SecurityEconomic & Labor Market Informati on Bureau 29 www.nh.gov/nhes/elmi/projecti ons.htm
Occupati onal Projecti ons, 2012-2022SOCCode Occupation Title
Estimated 2012
Projected 2022
2012-2022 Change
Percent Change
AnnualOpenings
CategoriesEduc. | Exp. | Training Descriptor
n = employment data does not meet disclosure standards
51-3023 Slaughterers and Meat Packers n n n n n Less than HS | none | Short-term OJT Less Favorable
51-3091 Food and Tobacco Roasting, Baking, and Drying Machine Operators and Tenders 54 63 9 16.7% 2
Less than HS | none | Moderate-term OJT Favorable
51-3092 Food Batchmakers 168 199 31 18.5% 9 High school | none | Moderate-term OJT Favorable
51-3093 Food Cooking Machine Operators and Tenders n n n n n
High school | none | Moderate-term OJT Less Favorable
51-3099 Food Processing Workers, All Other 138 163 25 18.1% 6 Less than HS | none | Moderate-term OJT Favorable
51-4011 Computer-Controlled Machine Tool Operators, Metal and Plastic 1,324 1,564 240 18.1% 61
High school | none | Moderate-term OJT Very Favorable
51-4012 Computer Numerically Controlled Machine Tool Programmers, Metal and Plastic 227 303 76 33.5% 14
High school | none | Long-term OJT Very Favorable
51-4021 Extruding and Drawing Machine Setters, Operators, and Tenders, Metal and Plastic 382 330 -52 -13.6% 7
High school | none | Moderate-term OJT Less Favorable
51-4022 Forging Machine Setters, Operators, and Tenders, Metal and Plastic n n n n n
High school | none | Moderate-term OJT Not Favorable
51-4023 Rolling Machine Setters, Operators, and Tenders, Metal and Plastic n n n n n
High school | none | Moderate-term OJT Not Favorable
51-4031 Cutting, Punching, and Press Machine Setters, Operators, and Tenders, Metal and Plastic 612 561 -51 -8.3% 5
High school | none | Moderate-term OJT Not Favorable
51-4032 Drilling and Boring Machine Tool Setters, Operators, and Tenders, Metal and Plastic 69 58 -11 -15.9% 1
High school | none | Moderate-term OJT Not Favorable
51-4033 Grinding, Lapping, Polishing, and Buffi ng Machine Tool Setters, Operators, and Tenders, Metal and Plastic 1,030 959 -71 -6.9% 23
High school | none | Moderate-term OJT Less Favorable
51-4034 Lathe and Turning Machine Tool Setters, Operators, and Tenders, Metal and Plastic 224 198 -26 -11.6% 4
High school | none | Moderate-term OJT Not Favorable
51-4035 Milling and Planing Machine Setters, Operators, and Tenders, Metal and Plastic 115 106 -9 -7.8% 2
High school | none | Moderate-term OJT Not Favorable
51-4041 Machinists 2,219 2,435 216 9.7% 73 High school | none | Long-term OJT Very Favorable
51-4051 Metal-Refi ning Furnace Operators and Tenders 62 63 1 1.6% 1
High school | none | Moderate-term OJT Less Favorable
51-4052 Pourers and Casters, Metal 81 74 -7 -8.6% 1 High school | none | Moderate-term OJT Not Favorable
51-4061 Model Makers, Metal and Plastic n n n n n High school | none | Moderate-term OJT Less Favorable
51-4062 Patternmakers, Metal and Plastic n n n n n High school | none | Moderate-term OJT Less Favorable
51-4071 Foundry Mold and Coremakers 355 333 -22 -6.2% 4 High school | none | Moderate-term OJT Not Favorable
51-4072 Molding, Coremaking, and Casting Machine Setters, Operators, and Tenders, Metal and Plastic 781 676 -105 -13.4% 9
High school | none | Moderate-term OJT Less Favorable
51-4081 Multiple Machine Tool Setters, Operators, and Tenders, Metal and Plastic 700 589 -111 -15.9% 14
High school | none | Moderate-term OJT Less Favorable
51-4111 Tool and Die Makers 344 344 0 0.0% 2 High school | none | Long-term OJT Not Favorable
51-4121 Welders, Cutters, Solderers, and Brazers 971 1,020 49 5.0% 29 High school | none | Moderate-term OJT Favorable
51-4122 Welding, Soldering, and Brazing Machine Setters, Operators, and Tenders
254 312 58 22.8% 12 High school | none | Moderate-term OJT Very Favorable
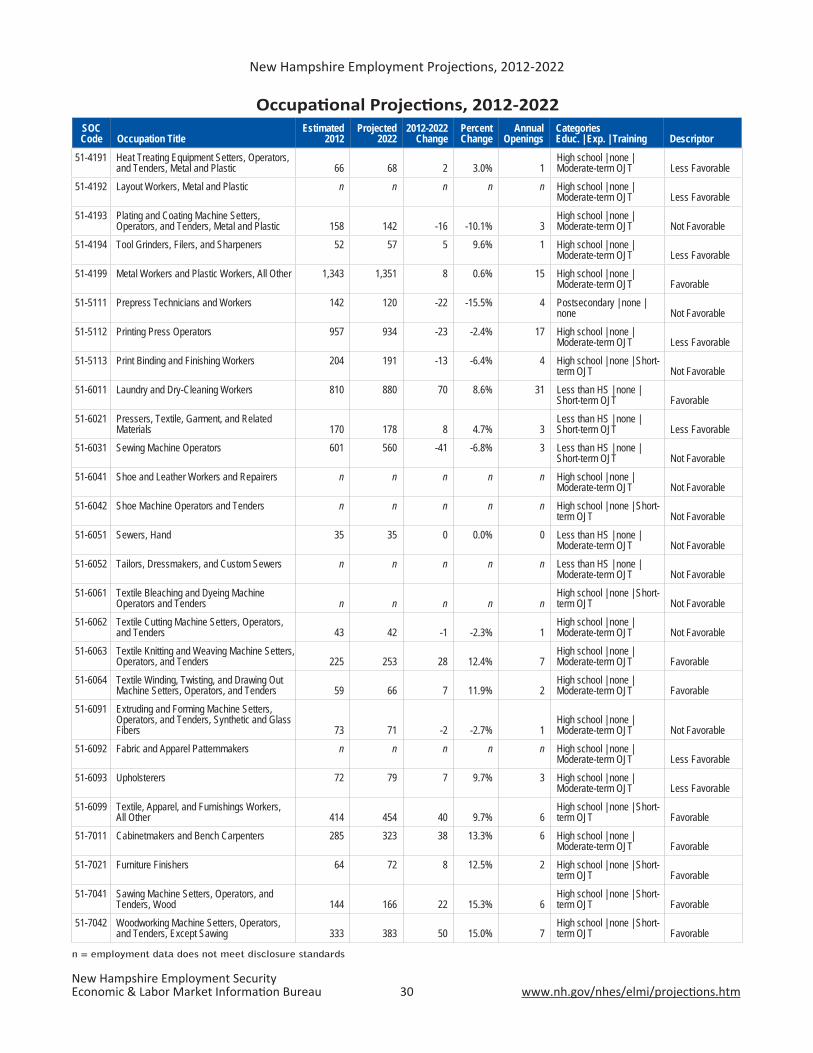
New Hampshire Employment Projecti ons, 2012-2022
New Hampshire Employment SecurityEconomic & Labor Market Informati on Bureau 30 www.nh.gov/nhes/elmi/projecti ons.htm
Occupati onal Projecti ons, 2012-2022SOCCode Occupation Title
Estimated 2012
Projected 2022
2012-2022 Change
Percent Change
AnnualOpenings
CategoriesEduc. | Exp. | Training Descriptor
n = employment data does not meet disclosure standards
51-4191 Heat Treating Equipment Setters, Operators, and Tenders, Metal and Plastic 66 68 2 3.0% 1
High school | none | Moderate-term OJT Less Favorable
51-4192 Layout Workers, Metal and Plastic n n n n n High school | none | Moderate-term OJT Less Favorable
51-4193 Plating and Coating Machine Setters, Operators, and Tenders, Metal and Plastic 158 142 -16 -10.1% 3
High school | none | Moderate-term OJT Not Favorable
51-4194 Tool Grinders, Filers, and Sharpeners 52 57 5 9.6% 1 High school | none | Moderate-term OJT Less Favorable
51-4199 Metal Workers and Plastic Workers, All Other 1,343 1,351 8 0.6% 15 High school | none | Moderate-term OJT Favorable
51-5111 Prepress Technicians and Workers 142 120 -22 -15.5% 4 Postsecondary | none | none Not Favorable
51-5112 Printing Press Operators 957 934 -23 -2.4% 17 High school | none | Moderate-term OJT Less Favorable
51-5113 Print Binding and Finishing Workers 204 191 -13 -6.4% 4 High school | none | Short-term OJT Not Favorable
51-6011 Laundry and Dry-Cleaning Workers 810 880 70 8.6% 31 Less than HS | none | Short-term OJT Favorable
51-6021 Pressers, Textile, Garment, and Related Materials 170 178 8 4.7% 3
Less than HS | none | Short-term OJT Less Favorable
51-6031 Sewing Machine Operators 601 560 -41 -6.8% 3 Less than HS | none | Short-term OJT Not Favorable
51-6041 Shoe and Leather Workers and Repairers n n n n n High school | none | Moderate-term OJT Not Favorable
51-6042 Shoe Machine Operators and Tenders n n n n n High school | none | Short-term OJT Not Favorable
51-6051 Sewers, Hand 35 35 0 0.0% 0 Less than HS | none | Moderate-term OJT Not Favorable
51-6052 Tailors, Dressmakers, and Custom Sewers n n n n n Less than HS | none | Moderate-term OJT Not Favorable
51-6061 Textile Bleaching and Dyeing Machine Operators and Tenders n n n n n
High school | none | Short-term OJT Not Favorable
51-6062 Textile Cutting Machine Setters, Operators, and Tenders 43 42 -1 -2.3% 1
High school | none | Moderate-term OJT Not Favorable
51-6063 Textile Knitting and Weaving Machine Setters, Operators, and Tenders 225 253 28 12.4% 7
High school | none | Moderate-term OJT Favorable
51-6064 Textile Winding, Twisting, and Drawing Out Machine Setters, Operators, and Tenders 59 66 7 11.9% 2
High school | none | Moderate-term OJT Favorable
51-6091 Extruding and Forming Machine Setters, Operators, and Tenders, Synthetic and Glass Fibers 73 71 -2 -2.7% 1
High school | none | Moderate-term OJT Not Favorable
51-6092 Fabric and Apparel Patternmakers n n n n n High school | none | Moderate-term OJT Less Favorable
51-6093 Upholsterers 72 79 7 9.7% 3 High school | none | Moderate-term OJT Less Favorable
51-6099 Textile, Apparel, and Furnishings Workers, All Other 414 454 40 9.7% 6
High school | none | Short-term OJT Favorable
51-7011 Cabinetmakers and Bench Carpenters 285 323 38 13.3% 6 High school | none | Moderate-term OJT Favorable
51-7021 Furniture Finishers 64 72 8 12.5% 2 High school | none | Short-term OJT Favorable
51-7041 Sawing Machine Setters, Operators, and Tenders, Wood 144 166 22 15.3% 6
High school | none | Short-term OJT Favorable
51-7042 Woodworking Machine Setters, Operators, and Tenders, Except Sawing 333 383 50 15.0% 7
High school | none | Short-term OJT Favorable
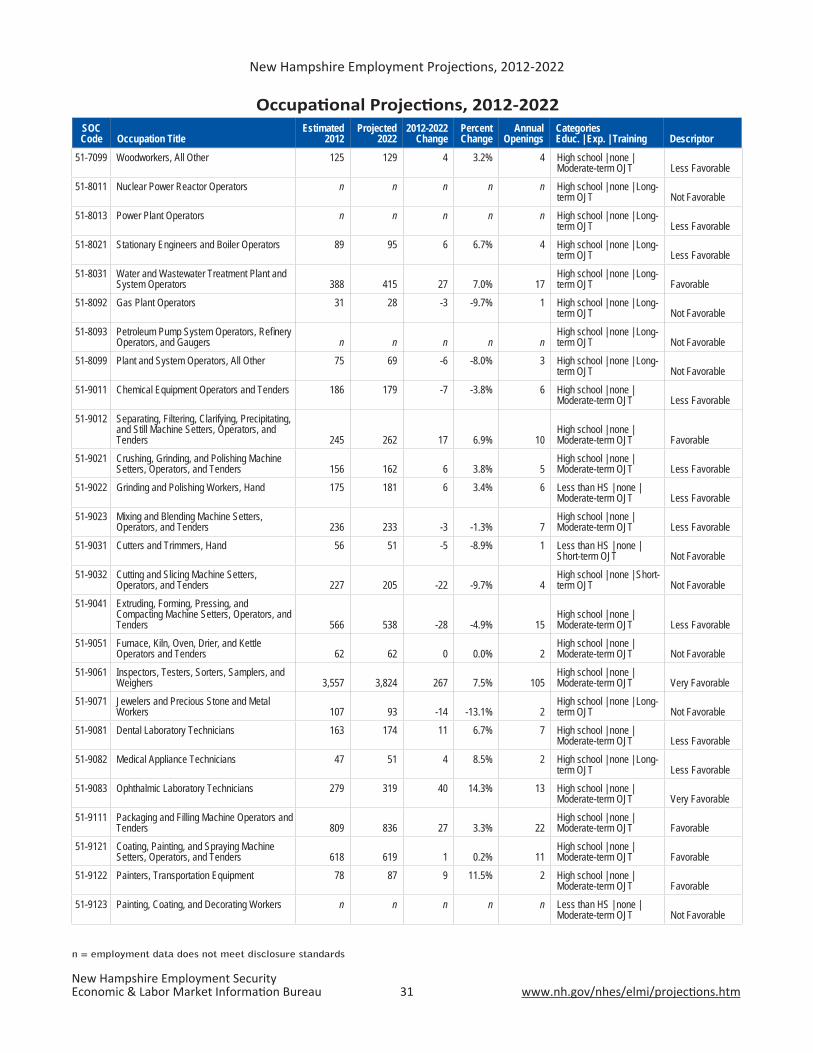
New Hampshire Employment Projecti ons, 2012-2022
New Hampshire Employment SecurityEconomic & Labor Market Informati on Bureau 31 www.nh.gov/nhes/elmi/projecti ons.htm
Occupati onal Projecti ons, 2012-2022SOCCode Occupation Title
Estimated 2012
Projected 2022
2012-2022 Change
Percent Change
AnnualOpenings
CategoriesEduc. | Exp. | Training Descriptor
n = employment data does not meet disclosure standards
51-7099 Woodworkers, All Other 125 129 4 3.2% 4 High school | none | Moderate-term OJT Less Favorable
51-8011 Nuclear Power Reactor Operators n n n n n High school | none | Long-term OJT Not Favorable
51-8013 Power Plant Operators n n n n n High school | none | Long-term OJT Less Favorable
51-8021 Stationary Engineers and Boiler Operators 89 95 6 6.7% 4 High school | none | Long-term OJT Less Favorable
51-8031 Water and Wastewater Treatment Plant and System Operators 388 415 27 7.0% 17
High school | none | Long-term OJT Favorable
51-8092 Gas Plant Operators 31 28 -3 -9.7% 1 High school | none | Long-term OJT Not Favorable
51-8093 Petroleum Pump System Operators, Refi nery Operators, and Gaugers n n n n n
High school | none | Long-term OJT Not Favorable
51-8099 Plant and System Operators, All Other 75 69 -6 -8.0% 3 High school | none | Long-term OJT Not Favorable
51-9011 Chemical Equipment Operators and Tenders 186 179 -7 -3.8% 6 High school | none | Moderate-term OJT Less Favorable
51-9012 Separating, Filtering, Clarifying, Precipitating, and Still Machine Setters, Operators, and Tenders 245 262 17 6.9% 10
High school | none | Moderate-term OJT Favorable
51-9021 Crushing, Grinding, and Polishing Machine Setters, Operators, and Tenders 156 162 6 3.8% 5
High school | none | Moderate-term OJT Less Favorable
51-9022 Grinding and Polishing Workers, Hand 175 181 6 3.4% 6 Less than HS | none | Moderate-term OJT Less Favorable
51-9023 Mixing and Blending Machine Setters, Operators, and Tenders 236 233 -3 -1.3% 7
High school | none | Moderate-term OJT Less Favorable
51-9031 Cutters and Trimmers, Hand 56 51 -5 -8.9% 1 Less than HS | none | Short-term OJT Not Favorable
51-9032 Cutting and Slicing Machine Setters, Operators, and Tenders 227 205 -22 -9.7% 4
High school | none | Short-term OJT Not Favorable
51-9041 Extruding, Forming, Pressing, and Compacting Machine Setters, Operators, and Tenders 566 538 -28 -4.9% 15
High school | none | Moderate-term OJT Less Favorable
51-9051 Furnace, Kiln, Oven, Drier, and Kettle Operators and Tenders 62 62 0 0.0% 2
High school | none | Moderate-term OJT Not Favorable
51-9061 Inspectors, Testers, Sorters, Samplers, and Weighers 3,557 3,824 267 7.5% 105
High school | none | Moderate-term OJT Very Favorable
51-9071 Jewelers and Precious Stone and Metal Workers 107 93 -14 -13.1% 2
High school | none | Long-term OJT Not Favorable
51-9081 Dental Laboratory Technicians 163 174 11 6.7% 7 High school | none | Moderate-term OJT Less Favorable
51-9082 Medical Appliance Technicians 47 51 4 8.5% 2 High school | none | Long-term OJT Less Favorable
51-9083 Ophthalmic Laboratory Technicians 279 319 40 14.3% 13 High school | none | Moderate-term OJT Very Favorable
51-9111 Packaging and Filling Machine Operators and Tenders 809 836 27 3.3% 22
High school | none | Moderate-term OJT Favorable
51-9121 Coating, Painting, and Spraying Machine Setters, Operators, and Tenders 618 619 1 0.2% 11
High school | none | Moderate-term OJT Favorable
51-9122 Painters, Transportation Equipment 78 87 9 11.5% 2 High school | none | Moderate-term OJT Favorable
51-9123 Painting, Coating, and Decorating Workers n n n n n Less than HS | none | Moderate-term OJT Not Favorable

New Hampshire Employment Projecti ons, 2012-2022
New Hampshire Employment SecurityEconomic & Labor Market Informati on Bureau 32 www.nh.gov/nhes/elmi/projecti ons.htm
Occupati onal Projecti ons, 2012-2022SOCCode Occupation Title
Estimated 2012
Projected 2022
2012-2022 Change
Percent Change
AnnualOpenings
CategoriesEduc. | Exp. | Training Descriptor
n = employment data does not meet disclosure standards
51-9141 Semiconductor Processors 122 89 -33 -27.0% 3 Associate | none | Moderate-term OJT Not Favorable
51-9151 Photographic Process Workers and Processing Machine Operators
221 214 -7 -3.2% 6 High school | none | Short-term OJT Less Favorable
51-9191 Adhesive Bonding Machine Operators and Tenders
n n n n n High school | none | Moderate-term OJT Not Favorable
51-9192 Cleaning, Washing, and Metal Pickling Equipment Operators and Tenders
98 101 3 3.1% 2 Less than HS | none | Moderate-term OJT Less Favorable
51-9193 Cooling and Freezing Equipment Operators and Tenders
n n n n n High school | none | Moderate-term OJT Less Favorable
51-9194 Etchers and Engravers n n n n n High school | none | Moderate-term OJT Not Favorable
51-9195 Molders, Shapers, and Casters, Except Metal and Plastic 356 366 10 2.8% 13
High school | none | Long-term OJT Favorable
51-9196 Paper Goods Machine Setters, Operators, and Tenders 116 108 -8 -6.9% 1
High school | none | Moderate-term OJT Not Favorable
51-9197 Tire Builders n n n n n High school | none | Moderate-term OJT Not Favorable
51-9198 Helpers--Production Workers 1,491 1,627 136 9.1% 40 Less than HS | none | Short-term OJT Favorable
51-9199 Production Workers, All Other 2,632 2,716 84 3.2% 77 High school | none | Moderate-term OJT Favorable
53-0000 Transportation and Material Moving Occupations 33,731 36,842 3,111 9.2% 1,044
53-1011 Aircraft Cargo Handling Supervisors n n n n n High school |< 5 yrs | none Not Favorable53-1021 First-Line Supervisors of Helpers, Laborers,
and Material Movers, Hand 471 523 52 11.0% 18 High school |< 5 yrs | none Favorable53-1031 First-Line Supervisors of Transportation
and Material-Moving Machine and Vehicle Operators 723 793 70 9.7% 27 High school |< 5 yrs | none Favorable
53-2011 Airline Pilots, Copilots, and Flight Engineers 40 37 -3 -7.5% 1 Bachelor | < 5 yrs | Moderate-term OJT Not Favorable
53-2012 Commercial Pilots 103 104 1 1.0% 3 High school | none | Moderate-term OJT Less Favorable
53-2021 Air Traffi c Controllers 441 470 29 6.6% 23 Associate | none | Long-term OJT Favorable
53-2022 Airfi eld Operations Specialists n n n n n High school | none | Long-term OJT Favorable
53-2031 Flight Attendants n n n n n High school | < 5 yrs | Moderate-term OJT Not Favorable
53-3011 Ambulance Drivers and Attendants, Except Emergency Medical Technicians 72 90 18 25.0% 3
High school | none | Moderate-term OJT Favorable
53-3021 Bus Drivers, Transit and Intercity 143 149 6 4.2% 4 High school | none | Moderate-term OJT Less Favorable
53-3022 Bus Drivers, School or Special Client 2,587 2,819 232 9.0% 71 High school | none | Short-term OJT Very Favorable
53-3031 Driver/Sales Workers 2,631 2,926 295 11.2% 72 High school | none | Short-term OJT Very Favorable
53-3032 Heavy and Tractor-Trailer Truck Drivers 6,580 7,313 733 11.1% 178 Postsecondary | none | Short-term OJT Very Favorable
53-3033 Light Truck or Delivery Services Drivers 4,460 4,800 340 7.6% 105 High school | none | Short-term OJT Very Favorable
53-3041 Taxi Drivers and Chauffeurs 1,293 1,381 88 6.8% 24 Less than HS | none | Short-term OJT Favorable
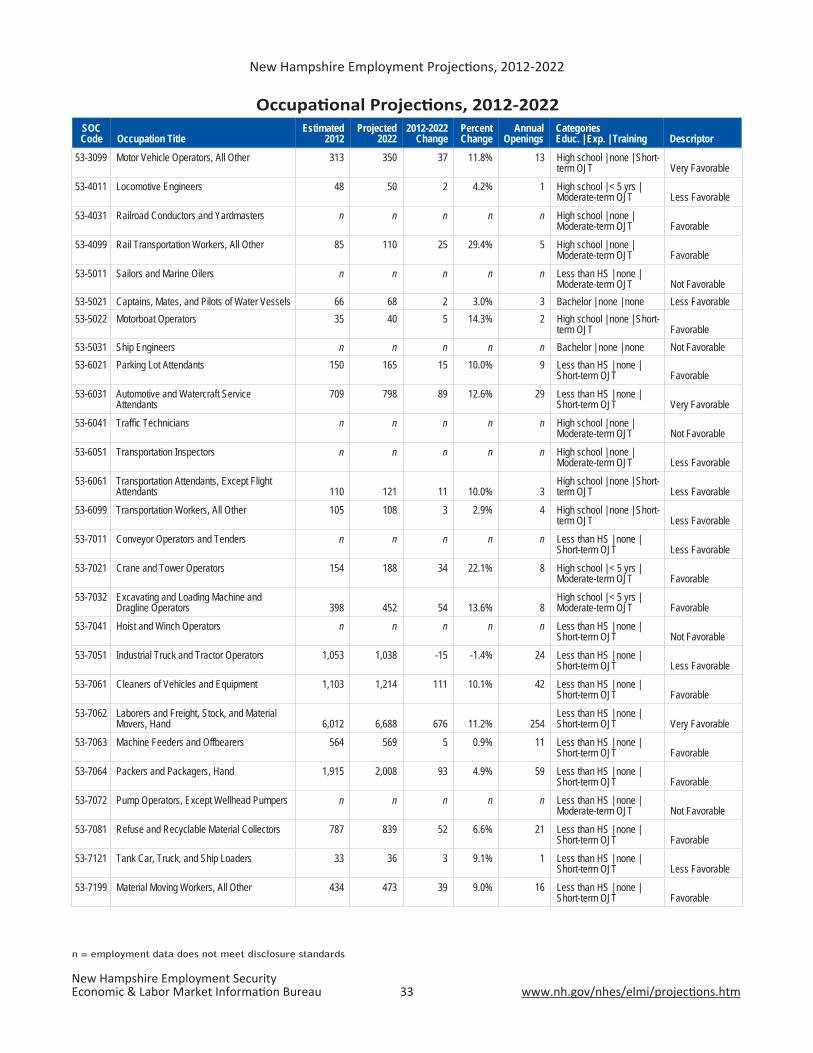
New Hampshire Employment Projecti ons, 2012-2022
New Hampshire Employment SecurityEconomic & Labor Market Informati on Bureau 33 www.nh.gov/nhes/elmi/projecti ons.htm
Occupati onal Projecti ons, 2012-2022SOCCode Occupation Title
Estimated 2012
Projected 2022
2012-2022 Change
Percent Change
AnnualOpenings
CategoriesEduc. | Exp. | Training Descriptor
n = employment data does not meet disclosure standards
53-3099 Motor Vehicle Operators, All Other 313 350 37 11.8% 13 High school | none | Short-term OJT Very Favorable
53-4011 Locomotive Engineers 48 50 2 4.2% 1 High school | < 5 yrs | Moderate-term OJT Less Favorable
53-4031 Railroad Conductors and Yardmasters n n n n n High school | none | Moderate-term OJT Favorable
53-4099 Rail Transportation Workers, All Other 85 110 25 29.4% 5 High school | none | Moderate-term OJT Favorable
53-5011 Sailors and Marine Oilers n n n n n Less than HS | none | Moderate-term OJT Not Favorable
53-5021 Captains, Mates, and Pilots of Water Vessels 66 68 2 3.0% 3 Bachelor | none | none Less Favorable53-5022 Motorboat Operators 35 40 5 14.3% 2 High school | none | Short-
term OJT Favorable53-5031 Ship Engineers n n n n n Bachelor | none | none Not Favorable53-6021 Parking Lot Attendants 150 165 15 10.0% 9 Less than HS | none |
Short-term OJT Favorable53-6031 Automotive and Watercraft Service
Attendants 709 798 89 12.6% 29 Less than HS | none |
Short-term OJT Very Favorable53-6041 Traffi c Technicians n n n n n High school | none |
Moderate-term OJT Not Favorable53-6051 Transportation Inspectors n n n n n High school | none |
Moderate-term OJT Less Favorable53-6061 Transportation Attendants, Except Flight
Attendants 110 121 11 10.0% 3High school | none | Short-term OJT Less Favorable
53-6099 Transportation Workers, All Other 105 108 3 2.9% 4 High school | none | Short-term OJT Less Favorable
53-7011 Conveyor Operators and Tenders n n n n n Less than HS | none | Short-term OJT Less Favorable
53-7021 Crane and Tower Operators 154 188 34 22.1% 8 High school | < 5 yrs | Moderate-term OJT Favorable
53-7032 Excavating and Loading Machine and Dragline Operators 398 452 54 13.6% 8
High school | < 5 yrs | Moderate-term OJT Favorable
53-7041 Hoist and Winch Operators n n n n n Less than HS | none | Short-term OJT Not Favorable
53-7051 Industrial Truck and Tractor Operators 1,053 1,038 -15 -1.4% 24 Less than HS | none | Short-term OJT Less Favorable
53-7061 Cleaners of Vehicles and Equipment 1,103 1,214 111 10.1% 42 Less than HS | none | Short-term OJT Favorable
53-7062 Laborers and Freight, Stock, and Material Movers, Hand 6,012 6,688 676 11.2% 254
Less than HS | none | Short-term OJT Very Favorable
53-7063 Machine Feeders and Offbearers 564 569 5 0.9% 11 Less than HS | none | Short-term OJT Favorable
53-7064 Packers and Packagers, Hand 1,915 2,008 93 4.9% 59 Less than HS | none | Short-term OJT Favorable
53-7072 Pump Operators, Except Wellhead Pumpers n n n n n Less than HS | none | Moderate-term OJT Not Favorable
53-7081 Refuse and Recyclable Material Collectors 787 839 52 6.6% 21 Less than HS | none | Short-term OJT Favorable
53-7121 Tank Car, Truck, and Ship Loaders 33 36 3 9.1% 1 Less than HS | none | Short-term OJT Less Favorable
53-7199 Material Moving Workers, All Other 434 473 39 9.0% 16 Less than HS | none | Short-term OJT Favorable