new insight into cainozoic sedimentary basins and ...rses.anu.edu.au/~nick/papers/grl2010.pdf ·...
TRANSCRIPT
ClickHere
for
FullArticle
New insight into Cainozoic sedimentary basins and Palaeozoicsuture zones in southeast Australia from ambient noise surfacewave tomography
P. Arroucau,1 N. Rawlinson,1 and M. Sambridge1
Received 30 November 2009; revised 27 January 2010; accepted 19 February 2010; published 6 April 2010.
[1] Detailed images of Rayleigh wave group velocity arederived from ambient seismic noise recorded by WOMBAT,a large rolling seismic array project in southeast Australia.Group velocity maps sensitive to crustal structure exhibitlow velocity anomalies in the presence of sedimentary basinsand recent hot‐spot volcanism, and high velocities in regionsof out‐cropping metamorphic and igneous rocks. Distinctand well‐constrained patches of low velocity within theMurray Basin provide new insight into the spatial extent andpossible composition of pre‐Tertiary infra‐basins. In abroader tectonic context, our results show little evidence forthe Palaeozoic building blocks of the southeast Australiancontinent that have been inferred from geological mappingand potential field data. This may mean that apparent changesin basement terrane near the surface are not associated withmajor changes in composition at depth. Citation: Arroucau, P.,N. Rawlinson, andM. Sambridge (2010), New insight into Cainozoicsedimentary basins and Palaeozoic suture zones in southeast Australiafrom ambient noise surface wave tomography, Geophys. Res. Lett.,37, L07303, doi:10.1029/2009GL041974.
1. Introduction
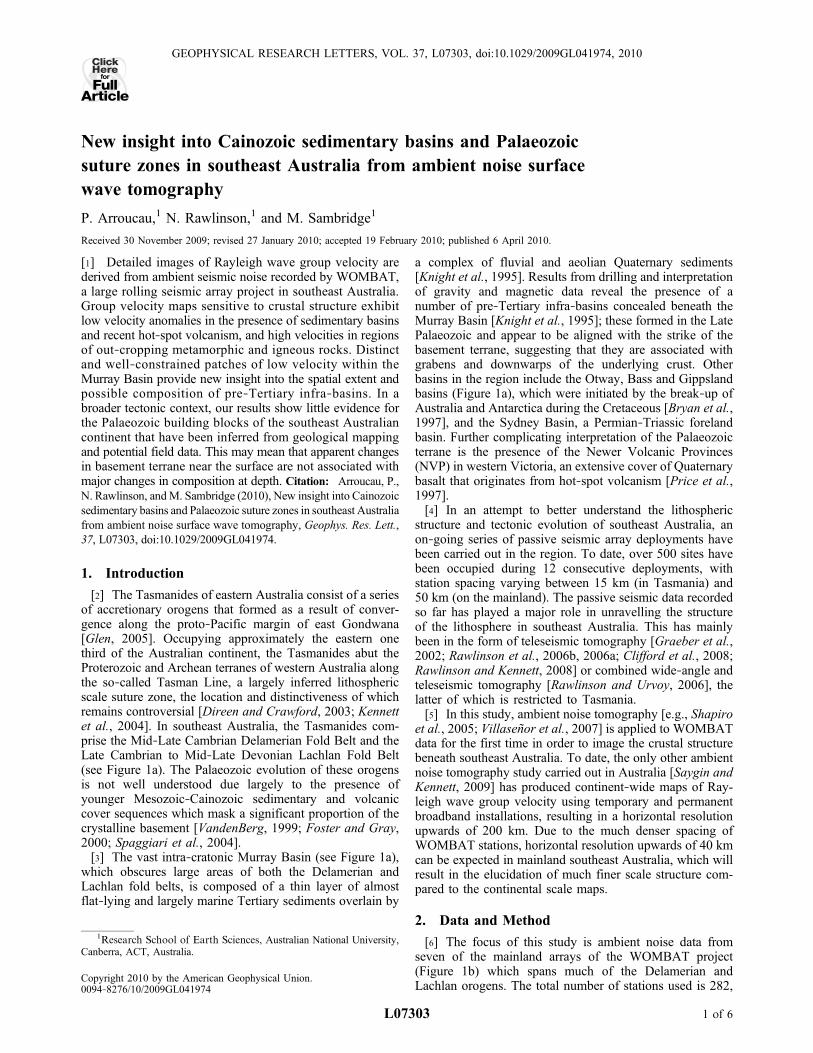
[2] The Tasmanides of eastern Australia consist of a seriesof accretionary orogens that formed as a result of conver-gence along the proto‐Pacific margin of east Gondwana[Glen, 2005]. Occupying approximately the eastern onethird of the Australian continent, the Tasmanides abut theProterozoic and Archean terranes of western Australia alongthe so‐called Tasman Line, a largely inferred lithosphericscale suture zone, the location and distinctiveness of whichremains controversial [Direen and Crawford, 2003; Kennettet al., 2004]. In southeast Australia, the Tasmanides com-prise the Mid‐Late Cambrian Delamerian Fold Belt and theLate Cambrian to Mid‐Late Devonian Lachlan Fold Belt(see Figure 1a). The Palaeozoic evolution of these orogensis not well understood due largely to the presence ofyounger Mesozoic‐Cainozoic sedimentary and volcaniccover sequences which mask a significant proportion of thecrystalline basement [VandenBerg, 1999; Foster and Gray,2000; Spaggiari et al., 2004].[3] The vast intra‐cratonic Murray Basin (see Figure 1a),
which obscures large areas of both the Delamerian andLachlan fold belts, is composed of a thin layer of almostflat‐lying and largely marine Tertiary sediments overlain by
a complex of fluvial and aeolian Quaternary sediments[Knight et al., 1995]. Results from drilling and interpretationof gravity and magnetic data reveal the presence of anumber of pre‐Tertiary infra‐basins concealed beneath theMurray Basin [Knight et al., 1995]; these formed in the LatePalaeozoic and appear to be aligned with the strike of thebasement terrane, suggesting that they are associated withgrabens and downwarps of the underlying crust. Otherbasins in the region include the Otway, Bass and Gippslandbasins (Figure 1a), which were initiated by the break‐up ofAustralia and Antarctica during the Cretaceous [Bryan et al.,1997], and the Sydney Basin, a Permian‐Triassic forelandbasin. Further complicating interpretation of the Palaeozoicterrane is the presence of the Newer Volcanic Provinces(NVP) in western Victoria, an extensive cover of Quaternarybasalt that originates from hot‐spot volcanism [Price et al.,1997].[4] In an attempt to better understand the lithospheric
structure and tectonic evolution of southeast Australia, anon‐going series of passive seismic array deployments havebeen carried out in the region. To date, over 500 sites havebeen occupied during 12 consecutive deployments, withstation spacing varying between 15 km (in Tasmania) and50 km (on the mainland). The passive seismic data recordedso far has played a major role in unravelling the structureof the lithosphere in southeast Australia. This has mainlybeen in the form of teleseismic tomography [Graeber et al.,2002; Rawlinson et al., 2006b, 2006a; Clifford et al., 2008;Rawlinson and Kennett, 2008] or combined wide‐angle andteleseismic tomography [Rawlinson and Urvoy, 2006], thelatter of which is restricted to Tasmania.[5] In this study, ambient noise tomography [e.g., Shapiro
et al., 2005; Villaseñor et al., 2007] is applied to WOMBATdata for the first time in order to image the crustal structurebeneath southeast Australia. To date, the only other ambientnoise tomography study carried out in Australia [Saygin andKennett, 2009] has produced continent‐wide maps of Ray-leigh wave group velocity using temporary and permanentbroadband installations, resulting in a horizontal resolutionupwards of 200 km. Due to the much denser spacing ofWOMBAT stations, horizontal resolution upwards of 40 kmcan be expected in mainland southeast Australia, which willresult in the elucidation of much finer scale structure com-pared to the continental scale maps.
2. Data and Method
[6] The focus of this study is ambient noise data fromseven of the mainland arrays of the WOMBAT project(Figure 1b) which spans much of the Delamerian andLachlan orogens. The total number of stations used is 282,
1Research School of Earth Sciences, Australian National University,Canberra, ACT, Australia.
Copyright 2010 by the American Geophysical Union.0094‐8276/10/2009GL041974
GEOPHYSICAL RESEARCH LETTERS, VOL. 37, L07303, doi:10.1029/2009GL041974, 2010
L07303 1 of 6
and the average station spacing is 50 km, resulting in themost dense dataset of its kind in the Australian region. Thepresence of tie stations common to adjacent arrays helpsmitigate the variable path coverage, which is dense withineach array but less dense near array boundaries, that arisesfrom the sequential nature of the deployments.[7] The data processing scheme described by Bensen et
al. [2007] has become the standard approach for ambientnoise tomography [e.g., Villaseñor et al., 2007; Nunziata etal., 2009]. In this work, we follow the modus operandidescribed by these authors with a few slight modificationsdeveloped further below. We compute the ambient noisecross‐correlation on the vertical component for all simulta-neously recording station pairs. The so‐called symmetriccomponent is then calculated by averaging the causal andacausal parts of the cross‐correlograms [Bensen et al., 2007].Following Saygin And Kennett [2009], we do not apply anynormalization prior to the correlation process in order not to
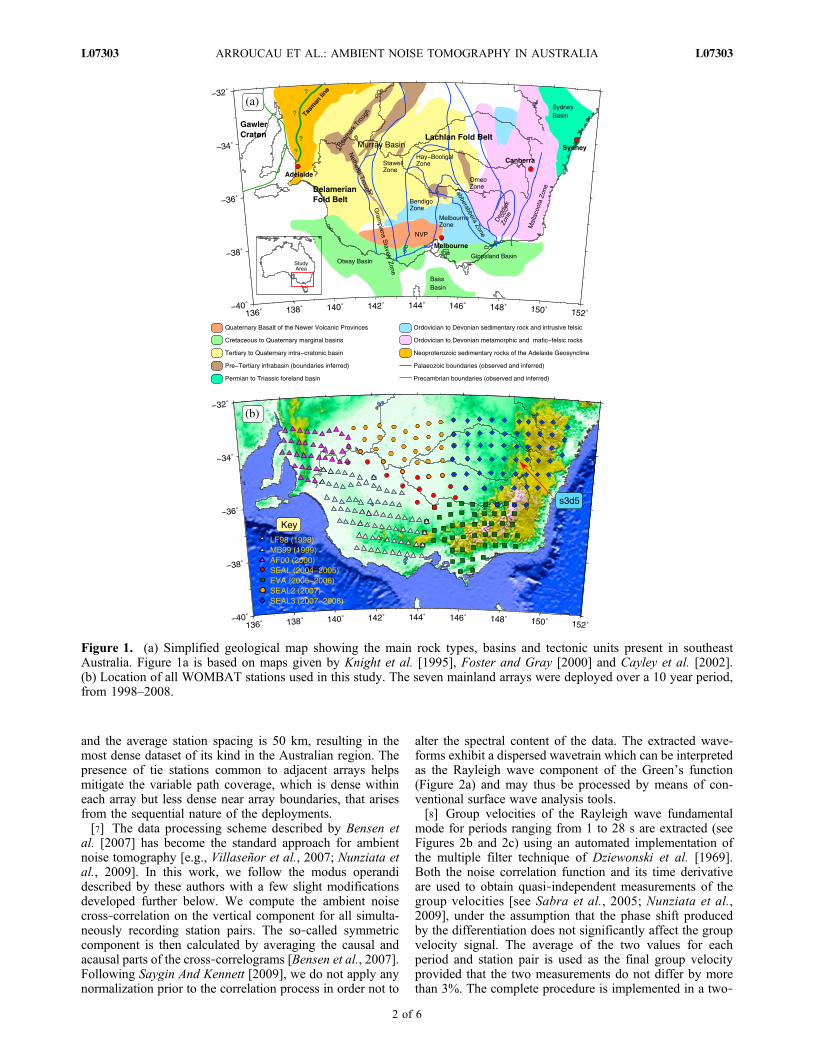
alter the spectral content of the data. The extracted wave-forms exhibit a dispersed wavetrain which can be interpretedas the Rayleigh wave component of the Green’s function(Figure 2a) and may thus be processed by means of con-ventional surface wave analysis tools.[8] Group velocities of the Rayleigh wave fundamental
mode for periods ranging from 1 to 28 s are extracted (seeFigures 2b and 2c) using an automated implementation ofthe multiple filter technique of Dziewonski et al. [1969].Both the noise correlation function and its time derivativeare used to obtain quasi‐independent measurements of thegroup velocities [see Sabra et al., 2005; Nunziata et al.,2009], under the assumption that the phase shift producedby the differentiation does not significantly affect the groupvelocity signal. The average of the two values for eachperiod and station pair is used as the final group velocityprovided that the two measurements do not differ by morethan 3%. The complete procedure is implemented in a two‐
Figure 1. (a) Simplified geological map showing the main rock types, basins and tectonic units present in southeastAustralia. Figure 1a is based on maps given by Knight et al. [1995], Foster and Gray [2000] and Cayley et al. [2002].(b) Location of all WOMBAT stations used in this study. The seven mainland arrays were deployed over a 10 year period,from 1998–2008.
ARROUCAU ET AL.: AMBIENT NOISE TOMOGRAPHY IN AUSTRALIA L07303L07303
2 of 6
stage approach; in the first stage, preliminary dispersioncurves are constructed and averaged in order to build aphase‐matched filter [see Levshin and Ritzwoller 2001]which is subsequently applied to the seismograms prior to asecond round of traveltime picking. This allows additionaldispersion measurements to be included that were discardedduring the first stage due to low signal‐to‐noise ratio.[9] Group traveltimes are mapped as variations in Rayleigh
wave group velocity for different periods using the iterativenon‐linear tomography scheme described by Rawlinson etal. [2008], which accounts for wavefront focusing and defo-cusing caused by velocity heterogeneity. Smoothly varying
cubic B‐spline functions are used to describe the velocitycontinuum, which is controlled by a regular grid of nodes inlatitude and longitude.
3. Results and Discussion
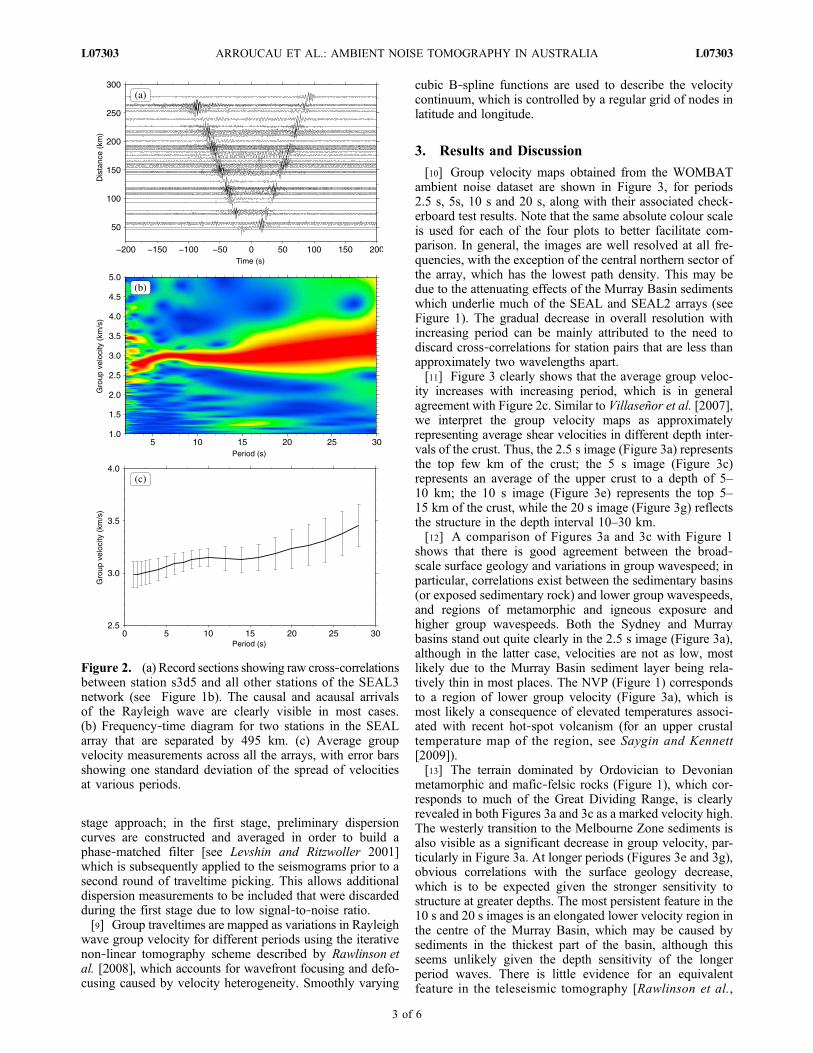
[10] Group velocity maps obtained from the WOMBATambient noise dataset are shown in Figure 3, for periods2.5 s, 5s, 10 s and 20 s, along with their associated check-erboard test results. Note that the same absolute colour scaleis used for each of the four plots to better facilitate com-parison. In general, the images are well resolved at all fre-quencies, with the exception of the central northern sector ofthe array, which has the lowest path density. This may bedue to the attenuating effects of the Murray Basin sedimentswhich underlie much of the SEAL and SEAL2 arrays (seeFigure 1). The gradual decrease in overall resolution withincreasing period can be mainly attributed to the need todiscard cross‐correlations for station pairs that are less thanapproximately two wavelengths apart.[11] Figure 3 clearly shows that the average group veloc-
ity increases with increasing period, which is in generalagreement with Figure 2c. Similar to Villaseñor et al. [2007],we interpret the group velocity maps as approximatelyrepresenting average shear velocities in different depth inter-vals of the crust. Thus, the 2.5 s image (Figure 3a) representsthe top few km of the crust; the 5 s image (Figure 3c)represents an average of the upper crust to a depth of 5–10 km; the 10 s image (Figure 3e) represents the top 5–15 km of the crust, while the 20 s image (Figure 3g) reflectsthe structure in the depth interval 10–30 km.[12] A comparison of Figures 3a and 3c with Figure 1
shows that there is good agreement between the broad‐scale surface geology and variations in group wavespeed; inparticular, correlations exist between the sedimentary basins(or exposed sedimentary rock) and lower group wavespeeds,and regions of metamorphic and igneous exposure andhigher group wavespeeds. Both the Sydney and Murraybasins stand out quite clearly in the 2.5 s image (Figure 3a),although in the latter case, velocities are not as low, mostlikely due to the Murray Basin sediment layer being rela-tively thin in most places. The NVP (Figure 1) correspondsto a region of lower group velocity (Figure 3a), which ismost likely a consequence of elevated temperatures associ-ated with recent hot‐spot volcanism (for an upper crustaltemperature map of the region, see Saygin and Kennett[2009]).[13] The terrain dominated by Ordovician to Devonian
metamorphic and mafic‐felsic rocks (Figure 1), which cor-responds to much of the Great Dividing Range, is clearlyrevealed in both Figures 3a and 3c as a marked velocity high.The westerly transition to the Melbourne Zone sediments isalso visible as a significant decrease in group velocity, par-ticularly in Figure 3a. At longer periods (Figures 3e and 3g),obvious correlations with the surface geology decrease,which is to be expected given the stronger sensitivity tostructure at greater depths. The most persistent feature in the10 s and 20 s images is an elongated lower velocity region inthe centre of the Murray Basin, which may be caused bysediments in the thickest part of the basin, although thisseems unlikely given the depth sensitivity of the longerperiod waves. There is little evidence for an equivalentfeature in the teleseismic tomography [Rawlinson et al.,
Figure 2. (a) Record sections showing raw cross‐correlationsbetween station s3d5 and all other stations of the SEAL3network (see Figure 1b). The causal and acausal arrivalsof the Rayleigh wave are clearly visible in most cases.(b) Frequency‐time diagram for two stations in the SEALarray that are separated by 495 km. (c) Average groupvelocity measurements across all the arrays, with error barsshowing one standard deviation of the spread of velocitiesat various periods.
ARROUCAU ET AL.: AMBIENT NOISE TOMOGRAPHY IN AUSTRALIA L07303L07303
3 of 6
Figure 3. (a, c, e, and g) Group velocity maps and (b, d, f, and h) checkerboard resolution test results for Rayleigh wavesranging in period from 2.5 s to 20 s. All images have been cropped so that velocities outside the combined array region(where there is no path coverage) are not shown. Note that the absolute colour scale used to represent velocity variationsis identical for each plot. Boundaries of major surface geological features (taken from Figure 1a) are superimposed onFigures 3a and 3c; similarly, major Palaeozoic boundaries are superimposed on Figures 3e and 3g.
ARROUCAU ET AL.: AMBIENT NOISE TOMOGRAPHY IN AUSTRALIA L07303L07303
4 of 6
2006a], but this is unsurprising since crustal structure ispoorly constrained by arrival time residuals from distantearthquakes.[14] In the western region of the Murray Basin at mid‐
upper crustal depths, a marked low velocity anomaly can beobserved, which is slightly elongated in the NNW directionin Figure 3a, but more distinct in Figure 3c (centred at about141.5°E and 35.5°S). This approximately corresponds to thelocation of the Netherbi Trough, the geometry of which ispoorly constrained [Knight et al., 1995]. It is possible thatthis anomaly is related to part of the infra‐basin that isthicker and broader than previously inferred. Earlier work[Knight et al., 1995] has indicated that the Netherbi Troughhas hydrocarbon potential, and the low group velocities inthe area may be a signature of higher concentrations oforganic rich sediments.[15] The Palaeozoic basement structure in southeast
Australia, indicated by the blue lines in Figure 1, has no realpresence in the group velocity maps, with the exception ofthe transition from the Omeo Zone to the TabberabberaZone. Each zone contains distinct crustal units [Foster andGray, 2000] that are largely defined by often limited out-crop and potential field data. These crustal units may bedistinguished by, for example, different deformational his-tories, rocks of different ages or type, or differences instructural vergence. The lack of any real signature of zonalboundaries in the group velocity maps at the very leastsuggests that they are probably not associated with com-positional differences at depth. Similarly, the transitionbetween Phanerozoic and Precambrian Australia, which isoften represented by the so‐called Tasman Line (Figure 1),has no signature in the group velocity maps. However, asFigures 3e and 3g show, the probable location of the tran-sition zone lies near the western edge of the array distri-bution, so information is limited. Nonetheless, this result isconsistent with the continental ambient noise tomographystudy of Saygin and Kennett [2009], and the argument putforward by Direen and Crawford [2003] that there is noclearly defined transition between Phanerozoic and Pre-cambrian Australia.
4. Conclusions
[16] We have presented the first ambient noise tomogra-phy results from the WOMBAT rolling array experiment insoutheast Australia. Using data from a total of 282 stations,high resolution Rayleigh wave group velocity maps havebeen produced which reveal a variety of structures in theshallow to mid‐crust. These include low velocity zones thatclosely correlate with known sedimentary basins and recentvolcanism, and high velocity zones associated with out‐cropping igneous and metamorphic rocks. Of particular noteis the low velocity anomaly associated with the NetherbiTrough, a pre‐Tertiary infra‐basin concealed beneath theMurray Basin, which has hydrocarbon potential, and thelack of any clear signature of the Palaeozoic building blocksof the continent that have previously been inferred fromgeological and geophysical analyses of near‐surface fea-tures. This latter result has important implications formodels which attempt to explain the tectonic evolution ofthe region. Future work will include combining other classesof seismic data extracted from WOMBAT (e.g., teleseismictraveltime residuals, receiver functions) with the ambient
noise data in order to jointly constrain crust and uppermantle structure, and the incorporation of new data fromon‐going deployments in northern New South Wales andQueensland.
ReferencesBensen, G. D., M. H. Ritzwoller, M. P. Barmin, A. L. Levshin, F. Lin,
M. P. Moschetti, N. M. Shapiro, and Y. Yang (2007), Processing seismicambient noise data to obtain reliable broad‐band surface wave dispersionmeasurements, Geophys. J. Int., 169, 1239–1260, doi:10.1111/j.1365-246X.2007.03374.x.
Bryan, S. E., A. E. Constantine, C. J. Stephens, A. Ewart, R. W. Schön, andJ. Parianos (1997), Early Cretaceous volcano‐sedimentary successionsalong the eastern Australian continental margin: Implications for thebreak‐up of eastern Gondwana, Earth Planet. Sci. Lett., 153, 85–102.
Cayley, R., D. H. Taylor, A. H. M. VandenBerg, and D. H. Moore (2002),Proterozoic‐Early Palaeozoic rocks and the Tyennan Orogeny in centralVictoria: The Selwyn Block and its tectonic implications, Aust. J. EarthSci., 49, 225–254.
Clifford, P., S. Greenhalgh, G. Houseman, and F. Graeber (2008), 3‐D seis-mic tomography of the Adelaide fold belt, Geophys. J. Int., 172, 167–186.
Direen, N. G., and A. J. Crawford (2003), The Tasman Line: Where is it,what is it, and is it Australia’s Rodinian breakup boundary?, Aust. J.Earth Sci., 50, 491–502.
Dziewonski, A., S. Bloch, and M. Landisman (1969), A technique for theanalysis of transient seismic signals, Bull. Seismol. Soc. Am., 59(1),427–444.
Foster, D. A., and D. R. Gray (2000), Evolution and structure of the LachlanFold Belt (Orogen) of eastern Australia, Ann. Rev. Earth Planet. Sci.,28, 47–80.
Glen, R. A. (2005), The Tasmanides of eastern Australia, in TerraneProcesses at the Margins of Gondwana, edited by A. P. M. Vaughan,P. T. Leat, and R. J. Pankhurst, Geol. Soc. Spec. Publ., 246, 23–96.
Graeber, F. M., G. A. Houseman, and S. A. Greenhalgh (2002), Regionalteleseismic tomography of the western Lachlan Orogen and the NewerVolcanic Province, southeast Australia, Geophys. J. Int., 149, 249–266.
Kennett, B. L. N., S. Fishwick, A. M. Reading, and N. Rawlinson (2004),Contrasts in mantle structure beneath Australia: Relation to TasmanLines?, Aust. J. Earth Sci., 51, 563–569.
Knight, L. A., P. A. McDonald, E. Frankel, and D. H. Moore (1995), Apreliminary appraisal of the pre‐Tertiary infrabasins beneath the MurrayBasin, northwestern Victoria, VIMP Rep. 16, Geol. Surv. of Victoria,Victoria, B. C., Canada.
Levshin, A. L., and M. H. Ritzwoller (2001), Automated detection, extrac-tion, and measurement of regional surface waves, Pure Appl. Geophys.,158, 1531–1545, doi:10.1007/PL00001233.
Nunziata, C., G. D. Nisco, and G. Panza (2009), S‐waves profiles fromnoise cross correlation at small scale, Eng. Geol., 105(3–4), 161–170,doi:10.1016/j.enggeo.2009.01.005.
Price, R. C., C. M. Gray, and F. A. Frey (1997), Strontium isotopic andtrace element heterogeneity in the plains basalts of the Newer VolcanicProvince, Victoria, Australia, Geochim. Cosmochim. Acta, 61, 171–192.
Rawlinson, N., and B. L. N. Kennett (2008), Teleseismic tomography ofthe upper mantle beneath the southern Lachan Orogen, Australia, Phys.Earth Planet. Inter., 167, 84–97.
Rawlinson, N., and M. Urvoy (2006), Simultaneous inversion of active andpassive source datasets for 3‐D seismic structure with application to Tas-mania, Geophys. Res. Lett., 33, L24313, doi:10.1029/2006GL028105.
Rawlinson, N., B. L. N. Kennett, and M. Heintz (2006a), Insights into thestructure of the upper mantle beneath the Murray Basin from 3D tele-seismic tomography, Aust. J. Earth Sci., 53, 595–604.
Rawlinson, N., A. M. Reading, and B. L. N. Kennett (2006), Lithosphericstructure of Tasmania from a novel form of teleseismic tomography,J. Geophys. Res., 111, B02301, doi:10.1029/2005JB003803.
Rawlinson, N., M. Sambridge, and E. Saygin (2008), A dynamic objectivefunction technique for generating multiple solution models in seismictomography, Geophys. J. Int., 174, 295–308.
Sabra, K. G., P. Gerstoft, P. Roux, W. A. Kuperman, and M. C. Fehler(2005), Extracting time‐domain Green’s function estimates from ambientseismic noise, Geophys. Res. Lett., 32, L03310, doi:10.1029/2004GL021862.
Saygin, E., and B. Kennett (2009), Ambient seismic noise tomography ofAustralian continent, Tectonophysics, 481, 116–125, doi:10.1016/j.tecto.2008.11.013.
Shapiro, N. M., M. Campillo, L. Stehly, and M. H. Ritzwoller (2005),High‐resolution surface wave tomography from ambient seismic noise,Science, 307, 1615–1618.
ARROUCAU ET AL.: AMBIENT NOISE TOMOGRAPHY IN AUSTRALIA L07303L07303
5 of 6
Spaggiari, C. V., D. R. Gray, and D. A. Foster (2004), Lachlan Orogen sub-duction‐accretion systematics revisited, Aust. J. Earth Sci., 51, 549–553.
VandenBerg, A. H. M. (1999), Timing of orogenic events in the LachlanOrogen, Aust. J. Earth Sci., 46, 691–701.
Villaseñor, A., Y. Yang, M. H. Ritzwoller, and J. Gallart (2007), Ambientnoise surface wave tomography of the Iberian Peninsula: Implications for
shallow seismic structure, Geophys. Res. Lett., 34, L11304, doi:10.1029/2007GL030164.
P. Arroucau, N. Rawlinson, and M. Sambridge, Research School of EarthSciences, Australian National University, Mills Road, Canberra, ACT0200, Australia. ([email protected])
ARROUCAU ET AL.: AMBIENT NOISE TOMOGRAPHY IN AUSTRALIA L07303L07303
6 of 6