new insights into solidification and phase equilibria in
TRANSCRIPT

1
New insights into solidification and phase equilibria in the Al-Al3Zr system:
theoretical and experimental investigations
A.V. Khvana), D.G. Eskinb, c), K.F. Staroduba), A.T. Dinsdaleb), F. Wangb), C. Fangb),
V.V. Cheverikina), M.V. Gorshenkova)
a Thermochemistry of Materials SRC, NUST MISIS, 4 Leninskiy Prosp., Moscow
119049, Russia
b BCAST, Brunel University London, Uxbridge UB8 3PH, United Kingdom
c Tomsk State University, 36 Lenin Avenue, Tomsk 634050, Russia
Abstract
Phase equilibria and phase transformations during the solidification of alloys in the Al-
Al3Zr corner of the Al-Zr system were investigated using both theoretical (DFT and
Calphad modelling) and experimental techniques. This work involved two separate
teams investigating the phase transformations of alloys of different compositions during
solidification at slow cooling rates using DTA, SEM, TEM, XRD, EPMA analysis of
as-cast and annealed samples.
The formation of eutectic type colonies at the boundaries of dendrites and three types of
primary intermetallic phase crystals were detected in the examined samples. A eutectic
reaction was implied from the results of a DTA analysis. The obtained results question
the currently accepted phase diagram for this part of the system which was based on
measurements of the solubility of Zr in the aluminium solid solution and the liquidus
surface.
Keywords: Al3Zr, eutectic reaction, Al solid solution, DTA, microstructure analysis
1. Introduction
The Al-Al3Zr region of the Al-Zr phase diagram has been of particular interest for many
*ManuscriptClick here to view linked References

2
decades due to the industrially important strengthening and anti-recrystallizing effects
of additions of Zr to aluminium alloys [1-4].
These effects are achieved by the complete suppression of the formation of primary
Al3Zr-D023 crystals in these alloys at relatively high but still typical casting cooling
rates, leading to the formation of a supersaturated solid solution, followed by the
formation of coherent or semi-coherent Al3Zr-L12 precipitates during annealing.
At the same time much work was carried out to analyse the grain refinement of
aluminium alloys resulting from the formation of fine compact particles of the primary
Al3Zr phase [2-3, 5]. Two types of the crystals were observed. Coarse large crystals
forming at slow cooling rates were identified as Al3Zr-D023, while more compact
“flower” type crystals were reported as either the metastable Al3Zr-L12 phase or a “new
phase” [2, 5]. However, there has been no detailed analysis of the formation of these
primary crystals and their subsequent transformation.
Finally, the most recent investigation showed the presence of eutectic-type colonies
forming at slow cooling at dendrite boundaries [6], and this seems to contradict the
previously accepted view that the invariant reaction between the aluminium solid
solution, the liquid phase and Al3Zr-D023 is peritectic in nature. However, the details
associated with this observed eutectic behaviour and the compositions of the phases in
equilibrium were not previously determined.
2. Critical evaluation of literature data on the invariant equilibria between Al,
Al3Zr and liquid phases.
The phase diagram and thermodynamic properties of the Al-Zr system have recently
been critically assessed by Fischer and Colinet [7] (Fig. 1). In the Al-rich side of the
phase diagram the assessment reinforces the accepted view that there is a peritectic

3
reaction between Al3Zr and the fcc Al-based solid solution. This view is essentially
based on the experimental data for the liquidus and solvus [8-14]. According to the
published experimental data the solubility of Zr in the liquid phase at the melting point
of Al is lower than that in the Al-based solid solution. There are a number of sets of
experimental data for the liquidus in concentrated aluminium alloys, the most recent [8]
being reported after the work of Janghorban et al. [9], but these are also consistent with
the earlier work of Chiotti and Woerner [10] and Fink and Willey [11] and with the
calculated phase diagram [7]. Extrapolating these experimental results down to the
invariant temperature (whether it is a eutectic or a peritectic reaction) gives a mole
fraction of Zr in the liquid of 0.0003 (Fig. 1). There is rather more scatter in the
experimental data for the solvus [11-14] which are derived from microstructural
examination, and studies of hardness and electrical resistivity on quenched samples. It is
felt that these are likely to be unreliable because of the known ability of Zr to
supersaturate in aluminium [15]. Hence, the quenching, especially from the liquid state,
may not be the right technique to assess the equilibrium solubility. Also the annealing
times to reach equilibrium in this system are rather long (as we show below in this
paper) and have not been used in the previously reported research. However, based on
these data, Fischer and Colinet [7] estimated the solubility of Zr in the fcc Al solid
solution to be approximately 0.0008 in terms of the mole fraction of Zr. Clearly if the
composition of Zr in the solid solution is higher than that in the liquid phase the reaction
must be peritectic in nature.
However, this view of the phase diagram is not consistent with the recent paper of
Janghorban et al. [9] who observed thermal arrests for a sample containing 1 at.% (3.3
wt%) Zr at 927 and 929 K (654 and 656 °C). This was obtained via careful thermal

4
analysis involving pure Al reference samples. These results indicated a eutectic reaction
with the invariant temperature approximately 5 K below the melting point of Al. These
authors also referenced the paper by McPherson and Hansen [16] which reported a
study of the Al-Zr system by thermal analysis. A thermal arrest had been reported for a
sample containing 6.4 at.% (18.7 wt%) Zr at 928 K (655 °C) although there had been no
discussion of this particular measurement. Janghorban et al. [9] ascribed the discrepancy
between the observed eutectic behaviour and the peritectic deduced from solubility
measurements as due to errors in the measurement of the liquid compositions, i.e. the Zr
content of the liquid in equilibrium with Al3Zr.
In order to clarify the phase equilibria and the nature of the phase transformation, we
have performed additional experiments which are reported in this current paper. These
experiments are supported by ab-initio and thermodynamic calculations.
3. Methodology
3.1 DFT and Calphad calculations
Ab initio
In order to provide extra insight into the solubility of Zr in the fcc Al solid solution,
calculations were carried out using ab-initio density functional theory in supercells to
estimate the partial enthalpy of solution of Zr in fcc Al to compare with the critically
assessed parameters of Fischer and Colinet [7]. These were undertaken using the plane
wave method implemented in the Vienna Ab initio Simulations Package (VASP v.
5.3.5) [17-18]. The Projector-Augmented Wave (PAW) framework was employed [19]
within the Generalised Gradient Approximation (GGA) [20, 21]. Experience has shown
that GGA is well suited to describe the properties of transition metals [22, 23]. High
cut-off energies for the wave functions (550.0 eV) and the augmentation functions

5
(700.0 eV) were employed in order to obtain reliable total-valence electron energies.
The electronic wave functions were sampled on dense grids, in the irreducible Brillouin
zone (BZ) for the crystals, using the Monkhorst and Pack method [24]. We performed
calculations for one Zr atom in a basic Al fcc lattice of size 2a0×2a0×2a0 (Al31Zr),
3a0×3a0×3a0 (Al107Zr) and 4a0×4a0×4a0 (Al255Zr) where a0 is the lattice parameter of a
conventional fcc Al lattice. To get accurate formation energies for the dilute solution of
Zr in Al, we used the same cells and k-mesh for pure Al as reference to minimize any
systematic errors.
Calphad calculations
For the Calphad calculations the MTDATA software package was used. The assessment
of Fischer and Colinet [7] was used as a starting point. The ab-initio DFT calculations
results were used to compare the assessed enthalpy of mixing in the fcc phase with what
might be justified theoretically. It should be pointed out that the excess of entropy of
Fischer and Colinet [7] was used unchanged.
3.2 Experimental
The experimental work at MISIS was concerned with differential thermal analysis
(DTA) and studying primary crystals by scanning electron microscopy (SEM), electron
back scattered diffraction (EBSD), transmission electron microscopy (TEM) and
electron probe microanalysis (EPMA). Experimental effort at Brunel University London
(BCAST) was concerned with studies on crystals at grain boundaries using SEM and
TEM.
Preparation of samples
The purity of the starting materials for samples prepared at MISIS was 99.99 wt% Al

6
and 99.99 wt% Zr. Alloys with 0.04 and 0.30 at.% (0.15 and 1 wt%) Zr were prepared in
an electric resistance furnace Nabertherm LF 30/14 in graphite crucibles. The melt was
held at 1273 K (1000 ºC) for 2 hours, mixed by crucible rotation (without introducing
any stirring rods in order to avoid contamination or overcooling of the melt) and then
left to solidify in a crucible covered with heated refractory bricks to reduce heat losses
in air (for alloys with 0.30 at.% (1 wt%) Zr). The cooling rate in the central part of the
sample was ~5 K/min in the temperature range 973-773 K (700-500 °C). The resulting
samples had a mass of about 170 g and were cut in half. Samples from the mid-section
were taken for microstructural and differential thermal analysis (Fig. 2). The final
compositions of the specimens used for the analysis were additionally determined by
EDX prior to the TEM experiments.
For the specimens used at BCAST high-purity 99.95 wt% Al (~750 g for each
experiment) was melted in a clay-bonded graphite crucible inside an electrical
resistance furnace and heated up to 1173 ± 3 K (900 ± 3 oC), at which point an Al-10
wt% Zr master alloy was added with mechanical stirring to obtain a range of alloys with
0.03 to 0.15 at.% (0.1 to 0.5 wt%) Zr alloy. The melt was then isothermally held for 1
hour with intermittent stirring before it was taken out of the furnace to solidify in a
crucible to room temperature with a cooling rate around 1 K/s as measured by K-
thermocouples.
For the Al-0.12 at.% (0.4 wt%) Zr alloy, additional experiments were carried out by
casting the melt into a wedge mould placed in an electrical resistance furnace which was
used to preheat the wedge mould to 773 K (500 oC) and then switched off during the
casting and solidification. The casting temperature was around 1123 K (850 oC) and the
cooling rate range obtained with this particular setup of wedge mould in a switched-off

7
furnace was from 3 to 12 K/s as estimated from the cooling curves recorded by K-type
thermocouples placed along the axis of the mould.
The ingots solidified in the crucibles were longitudinally sectioned along the central
symmetrical axis and specimens were prepared from the central bottom part because it
was felt that most of the primary Al3Zr particles would settle down to the bottom of the
ingot during solidification due to the larger density of Al3Zr and the slow cooling rate.
For the wedge-mould ingots, specimens were cut from the bottom along the longitudinal
axis to obtain specimens associated with different cooling rates. All the specimens were
then mechanically ground and polished for SEM (ZEISS SUPRA 35VP) examination.
Microstructure analysis
Metallographic specimens for microscopic examination were prepared by a grinding-
and-polishing machine (Struers Labopol-5). The grinding procedure was carried out
with SiC-paper and specialized Struers polishing disks (MD-Mol and MD-Nap) with
OP-U colloidal silica suspension. A suspension was applied at regular time intervals
during the preparation. The microstructure of the alloy was examined by means of
optical microscopy (OM) (Olympus-GX71F-5) and SEM (TESCAN VEGA LMH) with
a LaB6 cathode and an energy dispersive X-ray microanalysis system (Oxford
Instruments Advanced AZtecEnergy). A four-crystal wave spectrometer was used
during the electron probe microanalysis (EPMA) of all the phases (the analysed particle
size was larger than 2 μm). 20 kV was set for the EPMA acceleration voltage.
Transmission electron microscopy (TEM) was carried out using JEM2100 with a LaB6
cathode operated at 200 kV. Thin electron transparent foils were prepared in two ways
depending on the objective. For the observation of fine precipitates in the Al solid
solution the foils were prepared by dual-jet electrolytic polishing in a HNO3-methanol

8
electrolyte at 253 K (-20 °C). In case there were coarse individual particles, the samples
were prepared by a focused ion beam technique (FIB, FEI Quanta-3D) using precision
Pt sputtering, Ga+ ion milling and lift-out procedures.
The FIB technique was also used to prepare TEM thin foils for studying fine particles
along grain boundaries. These particles both with and without the presence of large
Al3Zr particles nearby were cut and lifted up using a tungsten manipulator and
transferred to an Omni lift-out copper grid in an FEI Quanta 3D FEG dual beam
microscope. After the transfer, the relatively thick foils on the copper grid were further
thinned by the ion beam step by step to around 80 nm. In total, four foil samples were
prepared and examined in a JEOL 2100F TEM operated at 200 kV. Energy-dispersive
X-ray spectroscopy was also carried out in the TEM to determine the composition of the
tiny particles.
Differential thermal analysis
Phase transition temperatures were measured with a DSC LABSYS from Setaram. The
alumina crucibles were used for the experiments. No side reaction between the sample
and the crucible was observed. Prior to the experiment, calibration of the apparatus was
performed with pure metal standards – 99.999 wt% Pb, 99.99 wt% Al, 99.99 wt% Cu
and 99.99 wt% Ag. The error range of the calibration results was ±0.3 K. Due to the fact
that the melting temperatures of the analysed Al-Zr samples are very close to the
melting point of pure Al, higher weight was put on the calibration values for pure (Al)
and all results were analysed in comparison with the melting point of pure Al. The DTA
experiments were carried out on as-cast and annealed samples taken from the centre of
the ingot in closed Al2O3 crucibles under a continuous flow of Ar (99.995% purity,
additionally filtered with an oxygen trap). Prior the experiment, the apparatus was

9
pumped out to 10-5 atm. and filled with Ar three times. The heating/cooling rates for
calibration and the experiments were 5, 1 and 0.5 K/min. The change in the weight of
the samples was less than 0.5% of their initial mass (0.2-0.5mg from 100mg original
samples). No reactions between sample and crucible were observed. The samples
retained their original metallic sheen.
Experiments were carried out with an empty crucible and with Al as a reference
sample. Additional experiments were carried with the sample and reference positions
exchanged in order to detect possible differences between the output signals from the
thermoelements on different sides of the detector. The DTA heating curves were used to
determine the solidus temperatures of the samples at different heating speeds. It should
be mentioned here that the DTA cooling curves in this particular case cannot provide
accurate results because the Al3Zr intermetallic particles are heavy and, during slow
solidification, fall to the bottom of the crucible (Fig. 3) creating large differences in the
concentration thereby reducing equilibrium within the sample.
4. Results of the DFT and Calphad calculations
The calculated ab-initio results are listed in Table 1 and compared with the values
derived from the available experimental data, which includes, in addition, the calculated
lattice parameters and formation enthalpies for 0 K (-273.15 °C) of the various potential
phase structures of Al3Zr. Clearly the calculations reproduce well (within 1 rel.%) the
experimental lattice parameters for the elemental solids extrapolated down to 0 K
(-273.15 °C) [25] and the Al3Zr phases [2,5,26-27]. This justifies the present approach
and settings.
The present calculations also showed that for Al3Zr, the D023 phase is the ground state

10
with a substantially lower energy of formation than the two other phases (L12 and D022),
which agrees with the previous theoretical study [28]. The calculations also showed that
the formation energies for the metastable L12 and D022 phases are very close. This is
consistent with the present observations (see the later section on primary phases in Al-
Zr alloys) that the Al3Zr-L12 and the Al3Zr-D022 phases may appear at high temperature,
as well as upon annealing of quenched samples [2, 5]. It can also be seen from Table 1
that the calculated enthalpy of formation of the D023 structure of Al3Zr for 0 K (-273.15
°C) is in very good agreement with the assessed data of Fischer and Colinet [7] for
298.15 K (25 °C). It should be noted here that enthalpies of formation generally do not
vary significantly with change in temperatures.
As shown in Table 1, the formation energy increases with a reduction in the Zr
concentration. Moreover, it should also be noted that the number of configurations (w)
of the Zr impurity in the cell increases with its size (Table 1). Normalisation of these
calculated results can give an estimate of the partial enthalpy of solution of Zr in fcc Al
which can then be compared with those from the assessed data of Fischer and Colinet
[7]. The ab initio values are clearly less negative than the assessed values, which
implies that the partial enthalpy of solution varies more markedly with composition. It
is not clear at the moment whether this variation of the enthalpy of solution is
significant or whether it represents a limitation on the results of the ab initio
calculations.
A less negative value for the partial enthalpy of solution of Zr in Al suggests a lower
solubility of Zr in the solid solution phase. Fisher and Colinet [7] used the parameter
G(FCC_A1,AL,ZR:VA;0)=-140764.18+24.15621*T while the value derived in the
present work is 13000 more positive, so the new parameter is G(FCC_A1,AL,ZR:VA;0)

11
=-127764.18+24.15621*T. The effect of changing the parameters for the fcc phase in
Fischer and Colinet’s assessment in this way is shown in Fig. 4 (although it should be
pointed out that the excess entropy of [7] was used unchanged). What is apparent from
these thermodynamic calculations is that there is a clear limit on how much the eutectic
temperature can be below the melting point of Al. The revised data, shown in Fig. 4,
indicates that a reduction of 0.1 K is reasonable. However even if there were no
solubility of Zr in fcc Al the maximum reduction that could be obtained would be 0.2 K
assuming that the liquidus curve remains unchanged. This is far less than had been
obtained in our previous experimental work [6], which is, in turn, less than that found
by Janghorban et al. [9]. These results forced us to make a more detailed experimental
analysis of the reactions and phase formation in the Al-Al3Zr region.
5. Experimental results
Fine particles along the grain boundaries
Fig. 5 shows typical SEM backscatter electron (BSE) images of specimens cut from a
number of Al-Zr alloy samples with different compositions following solidification in
crucibles. As we can see, in addition to typical large primary Al3Zr particles, there are
fine particles clearly visible along the grain boundaries in the alloy samples with 0.09,
0.12 and 0.15 at.% (0.3, 0.4 and 0.5 wt%) Zr. However, no distinct particles could be
detected in the alloy samples with 0.03 and 0.04 at.% (0.1 and 0.15 wt%) Zr. It should
be noted that the amount of these tiny particles along the grain boundaries increases as
the concentration of Zr increases.
Fig. 6 shows typical SEM backscatter electron (BSE) images of specimens solidified at
different cooling rates cut from samples of the Al-0.12 at.% (0.4 wt%) Zr alloy cast in
the wedge mould. The fine particles along the grain boundaries can only be observed in

12
specimens solidified with a cooling rate below 5 K/s; no sign of such particles could be
observed in the specimen solidified at a cooling rate of 12 K/s. It is also important to
point out that no large primary Al3Zr particles could be detected in samples of the Al-
0.12 at.% (0.4 wt%) Zr alloy cast in the wedge mould even with the slowest cooling rate
as shown in Fig. 6(a).
The identity of the particles observed along the grain boundaries is of great importance
for understanding the solidification behaviour of Al-Zr alloys under the current casting
conditions. In order to ascertain the identity of these fine particles, foil samples prepared
by FIB were examined by TEM. First of all, EDS mapping was done on all the fine
particles to determine their compositions. A typical EDS map is shown in Fig. 7. It is
clear that the fine particles contain only Al, Zr and small amounts of Cu without any
obvious presence of other elements. This therefore excludes the possibility that these
particles represent impurities such as oxides, nitrides or carbides. The presence of small
amounts of Cu could be attributed to contamination from Cu re-deposition as a result of
the milling of Cu grid holder which is used to support the TEM foil sample. This is a
common problem with FIB technique.
Although it is determined that these particles contain only Al and Zr, they could still be
in the form of one of the following phases: tetragonal Al3Zr-D023[29], metastable
tetragonal Al3Zr-D022 [5] , metastable cubic Al3Zr-L12 [30], Al2Zr [31] or even Al3Zr2
[32]. Therefore, selected area electron diffraction (SADP) patterns at different tilting
angles were obtained for all the fine particles in the four examined foil samples. It was
found that they can all be indexed as tetragonal Al3Zr-D023 phase [5] as illustrated in
Fig. 8 which shows a series of SADP patterns obtained from a representative tiny
particle at different tilting angles. The tilting angles from Fig. 8(b) and 8(c) and from

13
Fig. 8(b) to 8(d) are 6.57o and 10.97o, respectively. They agree well with the angles
between corresponding beam directions which are 6.38o and 10.69o, respectively.
Combining the EDS mapping results with the SADP patterns analysis, it was concluded
that the fine particles observed along the grain boundaries are tetragonal Al3Zr-D023
particles. It is interesting to point out that the tetragonal Al3Zr-D023 phase is the
equilibrium primary phase shown in the binary Al-Zr phase diagram.
The experimental results shown above provide evidence from microstructure
determination that a eutectic reaction takes place upon solidification of aluminium rich
Al-Zr alloys. This is not consistent with the accepted phase diagram for the system.
Primary phases in Al–Zr alloys
The previous sections show that solidification of Al rich Al-Zr alloys exhibits features
normally expected of eutectic reactions. In this section we explore this question in more
detail by analysing the microstructures of the “hypereutectic alloy” Al-0.3 at.% (1 wt%)
Zr where a large fraction of the primary intermetallic crystals forms. Through this we
hope to gain a more detailed understanding of the behaviour and possible
transformations in the intermetallic phase. Three different types of intermetallic primary
crystals were observed (Fig. 9-12), and this means that the as-cast samples are in a non-
equilibrium state and that metastable intermetallic phases may have been formed instead
of the stable ones. This made it necessary to analyse the structure of these crystals and
the phase transformations which take place during long annealing times while the
equilibrium is being reached.
Fig. 9 shows the microstructure of the as-cast sample I, taken from the mid-section of
the ingot (Fig. 2). Fig. 9 (a) and (b) are SEM images of the part of the sample close to
the crucible bottom or walls, while 9 (c) and (d) are images from the part closest to the

14
centre of ingot. As can be seen from these images, the higher cooling speed associated
with being close to the walls of the crucible and faster nucleation near the crucible walls
(in comparison to nucleation within the bulk melt), coupled to the gravitation effect (the
particles of Al3Zr-D023 nucleating in the liquid are heavy) promotes the formation of
Al3Zr phase in the form of significantly larger crystals (Fig. 10a). The electron back-
scattered diffraction (EBSD) analysis of these crystals determined them to be Al3Zr-
D023 phase (Fig. 10b). Different colours in Fig. 10b correspond to phases with different
crystallographic lattices. The phase marked with the blue colour has reflections of
Kikuchi lines corresponding to the aluminium solid solution (fcc_A1), while the green
coloured phase had Kikuchi lines corresponding to the Al3Zr-D023. Closer to the centre
of the ingot, where the cooling speed is lower, Al3Zr crystals with a more compact form
start to appear as well, and the degenerate eutectic appears. In the previous paper the
cooling rate range where the eutectic appears was determined to be 0.5 to 5 K/s [6].
In addition to the stable Al3Zr-D023 type of intermetallic primary crystals, two other
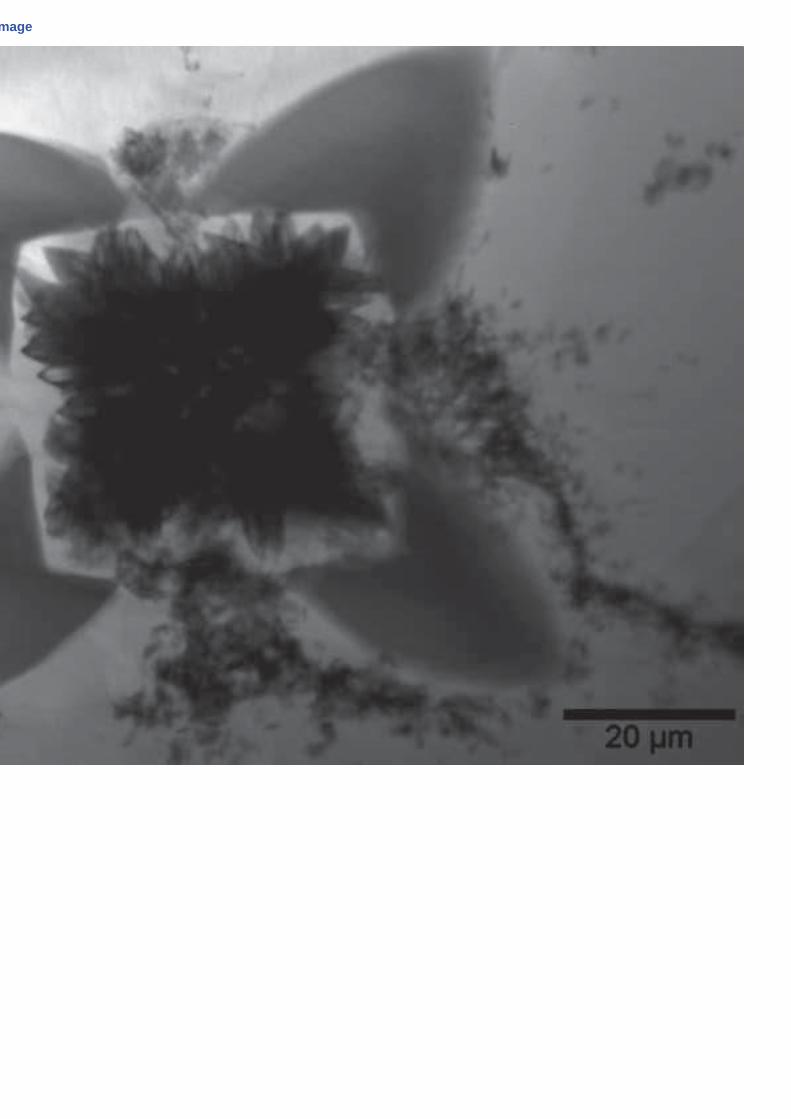
types of crystals were found: “flower crystals” (Fig. 11a) and “porous Al3Zr crystals”
(Fig. 12a) which frequently form either separately or in the middle of the flower crystal
(Fig. 12b).
The amount of Zr in the “petals” of the “flower crystals” is, according to EPMA, about
6.5 - 9.0 at.% (19.0–25.1 wt%) close to the centre, and about 3.0 - 6.0 at.% (9.5–17.8
wt%) on the edges, which does not correspond to any known phase in the system. The
results of the TEM investigations of the porous crystals in the central part of the “flower
crystals” are shown in Fig. 11. A selected area electron diffraction pattern (SADP)
associated with the central portion is shown on Fig. 11b. The SADP reveals that this
central part consists predominantly of the stable Al3Zr-D023 phase, fcc_A1 (Al), and

15
traces of the Al3Zr-L12 phase. The diffraction pattern in Fig. 11b represents the
orientation relation where the [001]-axis c of tetragonal Al3Zr-D023 is parallel to the
[001] fcc A1 (Al) and [001] Al3Zr-L12 axes respectively. The right part of Fig. 11b
shows a simulated image of a diffraction pattern with the abovementioned orientation
relationship. The kinematically forbidden reflections (002, 006 …) of the tetragonal
phase are not marked despite their existence on the obtained diffraction pattern due to
dynamical character of electron scattering. The bright-field and dark-field images of the
Al3Zr-D023 phase in Figure 11c and 11d show that the central part of the analyzed
crystal is not monocrystalline but consists of colonies of the Al3Zr-D023 phase with
different orientations but with almost the same orientation within a colony.
Investigations of the bright-field images and diffraction pattern of the “petals” of the
“flower crystal” showed that they consist of (Al) fcc A1, Al3Zr-L12 and traces of the
Al3Zr-D023 phase (Fig. 11d-f). The [001] direction – c-axis of Al3Zr-D023 is parallel to
[100] (Al) fcc_A1 and [100] Al3Zr-L12 axes. The presence and intensity of the
superstructure reflections corresponding to the Al3Zr-L12 phase indicate the
predominance of this phase in the structure of the “petals”. The Al3Zr-L12 precipitates
are elongated along [01-1]. This was also confirmed by observations in the dark-field of
reflections corresponding only to the Al3Zr-L12 phase (010) and in reflections
corresponding to the superposition of the (011) Al3Zr-L12 and Al3Zr-D023 phases. The
amount of the Al3Zr-D023 phase in the petals appears to be negligible.
It should be noted that the structure of the petals showed that they are also not
monocrystalline, but form colonies (Fig. 11e).
In order to understand which of the intermetallic phases is stable the samples were
annealed at 927 K (654 °C) for 144 h. Subsequent analysis showed complete

16
transformation of the Al3Zr-L12 crystals into Al3Zr-D023 both in the centre and in the
“petals”, and this was confirmed by TEM structure investigations shown in Fig. 13. Fig.
13a represents a secondary electron image of the “flower crystal” obtained by FIB. The
place from where the sample was cut for the TEM investigations is marked by a dashed
line. The bright-field TEM micrograph and enlarged HRTEM images of the thin lamella
precisely milled by FIB are shown on Fig. 13 b and 13 c. The elongated precipitates
along the [010] and [001] Al directions are seen on a bright-field image. The circles
with numbers 1, 2 and 3 depict the places corresponding to the SADPs in Fig. 13 d-f,
respectively. The diffraction patterns in Fig. 13 d-f are associated with an fcc Al crystal
along the [100] zone axis, and two variants of Al3Zr-D023 orientations in Al
corresponding to the c-axis ǁ [001] Al and c-axis ǁ [010] Al. It is seen that elongation of
the Al3Zr-D023 precipitates occurs along the c-axis and parallel to {001} Al directions.
According to the TEM investigations, both the central part and the “petals” are the
equilibrium Al3Zr-D023 phases and consequently the complete decomposition of the
metastable crystals indicates that the equilibrium state of the alloy has been reached.
The SEM images of the “porous crystals” are shown in Fig. 12a and 12b. The bright-
field image from a central portion cut by FIB and the associated diffraction pattern
indexed as the Al3Zr-D023 [010] zone axis are shown in Fig. 12с. The «pores» are not
true voids: they are filled with aluminium.
These observations of metastable intermetallic phases and their transformation during
annealing could be explained by the formation of clusters within the liquid of
aluminium atoms supersaturated with Zr or the metastable Al3Zr-L12 phase during
solidification possibly due to an incomplete diffusion processes taking place in the
liquid phase. These crystals undergo a cellular type decomposition during cooling. The

17
presence of the Al3Zr-D023 phase in the traces of the petals indicates that transformation
should finally lead to the formation of the stable Al3Zr-D023 phase. A possible reaction
path is: supersaturated fcc A1 (Al)/ Al3Zr-L12→ Al3Zr-L12+ fcc A1 (Al)→ Al3Zr-D023
+fcc A1 (Al).
Finally, for the better understanding of the phase relations in this corner of the phase
diagram of the Al-Zr system it was necessary to understand whether the previously
reported solubility of Zr in the aluminium solid solution is correct or too high (see the
section Results of DFT and Calphad calculations). In order to analyse the solubility of
Zr in the Al solid solution, a sample with 0.04 at.% (0.15 wt%) Zr was prepared, which
is below the maximum solubility of Zr in fcc Al proposed in [7, 28]. The sample was
annealed at 927 K (654 °C) for 42 h and quenched in water. A TEM analysis showed
the formation of the Al3Zr-L12 precipitates (Fig. 14) with the «zero contrast line»
parallel to the [001] Al direction. The presence of such precipitates indicates that a shift
of the solvus line towards lower concentration of Zr than suggested by Fischer and
Colinet [7] is necessary. The version of the eutectic phase diagram in Fig. 4 makes the
formation of these Al3Zr particles quite logical. The fact that the phase is metastable at
this temperature indicates that the precipitation of Al3Zr at such low contents of Zr is
slow and the alloy does not reach equilibrium. According to the classical theory of
nucleation [33], the growth rate of particles is in direct ratio to solute saturation. The
formation of very fine metastable Al3Zr-L12 particles can be the reason why the
precipitation has not been identified by SEM analysis in previous investigations as these
particles could not be seen at such resolution. Furthermore, their small amount makes
them effectively invisible to the electric resistance and hardness methods used
previously for the determination of solubility.
18
Results of the DTA investigations
The experimental DTA results described in section 2 appear to indicate that the
invariant reaction close to pure Al is a eutectic rather and a peritectic. However, it is
also possible that the decrease in the temperature of the invariant reaction relative to the
melting point of Al could be the result of the presence of the metastable phase Al3Zr-
L12 in the as-cast state. For this reason, a further DTA analysis was carried out on
samples that had been annealed for long periods and had shown only Al3Zr-D023 phase
precipitates in addition to (Al). This new investigation confirmed that the invariant
reaction is below the melting point of Al indicative of a eutectic reaction. However, this
decrease in temperature was smaller than that obtained from measurements on the as-
cast material which we believe was due to the formation of metastable phases in the as-
cast samples (Table 2, Fig. 15).
In carrying out these measurements it was found that care had to be taken in interpreting
results where samples were placed either in the reference pan or in the standard sample
position. In our studies on Al-Zr alloys the DTA measurements were carried out firstly
with pure Al as a reference material in the standard position of the crucible (the sample
on the sample side with pure Al on the reference side), and secondly in the opposite
configuration (the sample on the reference side and Al in the sample position). These
measurements gave contradictory results. For this reason, we carried out additional
experiments where both crucibles were filled with samples of pure aluminium of equal
weight and shape in order to detect any possible differences between the signal output
from the two sets of thermoelements. It appeared that the signal on the reference side is
delayed (see Fig. 15c). This means that, in practice, the contradictory results mentioned
above were because of the detector delay rather than due to the melting of the

19
aluminium at a lower temperature than that of the sample. It also means that this
technique should be used only with a great deal of care. Further measurements were
carried out with the sample on the sample side and an empty crucible on the reference
side and in the opposite configuration in order to confirm the invariant temperature (see
Table 2).
In conclusion, the results of DTA measurements on annealed samples are consistent
with the microstructural results on the fine particles found at the grain boundaries, and
on the primary phases themselves. They confirm that the invariant reaction close to pure
Al in the Al-Zr system is indeed eutectic in nature in contrast to the peritectic reaction
shown in the currently accepted binary phase diagram.
Conclusions
Ab initio calculations carried out in the present work indicate that that the
enthalpies of solution of Zr in fcc_Al (Al) are less negative than the critically assessed
values of Fischer and Collinet [7].
A less negative value for the partial enthalpy of solution of Zr in Al implies a
lower solubility of Zr in the fcc solid solution phase. The effect of changing the
parameters for the fcc phase in Fischer and Colinet's assessment to reflect the ab initio
results is demonstrated although the excess entropy was not changed. It is apparent from
these calculations that there is a limit on how much the eutectic temperature can be
below the melting point of Al. The revised data indicates that a reduction of 0.1 K is
reasonable. However, even if there was no solubility of Zr in fcc A1 (Al) the maximum
reduction that could be obtained would be 0.2 K assuming that the liquidus curve
remains unchanged.
A DTA analysis of as-cast samples identified a temperature arrest at 932.2 K

20
(659 °C). More refined DTA analyses on samples annealed for long times showed the
thermal arrest to be close to 933.1 K (659.9 °C). The discrepancy between these results
is thought to be due to lack of equilibration of the as-cast samples and the formation of
metastable phases. This correlates well with the thermodynamically predicted decrease
of the invariant reaction temperature using the results of ab initio calculations. The
experimentally determined temperature is lower than the melting point of pure
aluminum, which confirms the presence of a eutectic reaction.
Three types of primary intermetallic crystals were found. They were identified
as: (a) stable Al3Zr-D023, (b) colonies of the metastable mixture Al3Zr-D023+fcc A1
(Al)+traces of Al3Zr-L12 phase (“porous crystals”) and (c) colonies of the metastable
decomposed mixture Al3Zr-L12 phase+fcc A1 (Al)+traces of Al3Zr-D023 (“flower
crystals”)
It is suggested that during solidification, supersaturated crystals of (Al) or the
Al3Zr-L12 phase form possibly due to incomplete diffusion processes in the liquid
phase. These crystals undergo decomposition during cooling.
A TEM analysis of an Al-0.04 at.% (0.15 wt%) Zr sample annealed at 927 K
(654 °C) for 42h and subsequently quenched showed the presence of precipitates
of the metastable Al3Zr-L12 phase. This suggests for equilibrium conditions the
solubility of Zr in the aluminium solid solution should be lower than previously
observed. This was also predicted by a thermodynamic analysis of the results of
ab initio calculations.
Acknowledgements
The Russia-based team acknowledge financial support from the Ministry of Education

21
and Science of the Russian Federation, Contract No14.581.21.0017, dated on 02nd of
November 2015, Unique number RFMEFI58115X0017.
The UK-based authors acknowledge financial support from the Engineering and
Physical Sciences Research Council (EPSRC) for the UltraCast project (Grant
EP/L019884/1) and the LiME Hub (Grant EP/N007638/1).
References
[1] N. Ryum, Precipitation and recrystallization in an Al-0.5wt%Zr-alloy, Acta
Metallurgica 17 (1969) 269–278.
[2] J.Q. Guo, K. Ohtera, K. Kita, T. Shibata New metastable phases in rapidly solidified
Al-Zr and Al-Ti alloys with high solute contents. Materials Science and Engineering; A
181-182 (1994) 1397-1404.
[3] T.V. Atamanenko, D.G. Eskin, M. Sluiter, L. Katgerman, On the mechanism of
grain refinement in Al-Zr-Ti alloys, Journal of Alloys and Compounds 509 (2011) 57–
60.
[4] F.Wang, D. Qiu, Z.-L. Liu, J.A. Taylor, M.A. Easton, M.-X. Zhang, Acta Materialia
61 (2013) 5636–5645
[5] J.Q. Guo, K. Oheta, An intermediate phase appearing in L12-Al3Zr to D023-Al3Zr
phase transformation of rapidly solidified Al-Zr alloys. Materials Letters 27 (1996) 343-
347.
[6] F. Wang, D.G. Eskin, A.V. Khvan, K.F. Starodub, J.J.H. Lim, M.G. Burke, T.
Connolley, J.Mi, On the occurrence of a eutectic-like structure in solidification of Al-Zr
alloys. Scripta Materialia 133 (2017) 75–78.
[7] E. Fischer, C. Colinet, An Updated Thermodynamic Modeling of the Al-Zr System.

22
Journal of Phase Equilibria and Diffusion. 36(5), 2015, 404-413
[8] O. Dezellus, B. Gardiola, J Andrieux, On the Solubility of Group IV Elements
(Ti,Zr,Hf) in Liquid Aluminum below 800°C, Journal of Phase Equilibria and
Diffusion, 35(2) (2014)120-126
[9] A. Janghorban, A. Antoni-Zdziobek, M. Lomello-Tafin, C. Antion, Th Mazingue, A.
Pisch, Phase Equilibria in the Aluminium-Rich Side of the Al-Zr System, Journal of
Thermal Analysis and Calorimetry, 114(3) (2013) 1015-1020
[10] P. Chiotti, P.F. Woerner, Metal Hydride Reactions: I. Reaction of Hydrogen with
Solutes in Liquid Metal Solvents, Journal of the Less Common Metals. 7 (1964) 111-
119.
[11] W. L. Fink, L. A. Willey, Equilibrium relation in Al-Zr alloys, Transactions of the
Metallurgical Society of AIME, 1 (1939) 69-80
[12] M. E. Drits, E. S. Kadaner, V. I. Kuzmina, Solubility of Silicon and Zirconium in
Aluminium, Izvestia Akademii nauk SSSR. Metally, 1 (1968)170-175.
[13] G.M. Kuznetsov, A.D. Barsukov, M.I. Abas, Solubility of Mn, Cr, Ti, and Zr in Al
in the Solid State, Soviet Non-Ferrous Metals Research, 11 (1983) 11 47-51.
[14] V. M. Glazov, G. Lazarev, N. Korolkov, The solubility of certain transition metals
in aluminium, Metal Science and Heat Treatment, 10 (1959) 48-50.
[15] Z. A. Chaudhury, C. Suryanarayana, A TEM study of decomposition behaviour of
a melt-quenched Al–Zr alloy, Metallography 17 (1994) 231–52
[16] D. J. McPherson, M. Hansen, The system Zr–Al, Transactions ASM. 46(1954)
354–74.
[17] G. Kresse, J. Hafner, Ab initio molecular-dynamics simulation of the liquid-metal–
amorphous-semiconductor transition in germanium, Physical Review B, 49(1994)

23
14251- 14269.
[18] G. Kresse, J. Furthmller, Efficiency of ab-initio total energy calculations for metals
and semiconductors using a plane-wave basis set, Computational Materials Science
6(1996) 15-50.
[19] P.E. Blöchl, Projector augmented-wave method, Physical Review B, 50(1994)
17953-17979
[20] G. Kresse, D. Joubert, From ultrasoft pseudopotentials to the projector augmented
wave method, Physical Review B, 59 (1999) 1758-1775.
[21] J.P. Perdew, K. Burke, M. Ernzerhof, Generalized Gradient Approximation Made
Simple, Physical Review Letters, 77(1996) 3865-3868.
[22] C.M. Fang, M.A. van Huis, M.F.H. Sluiter, H. Zandbergen, Stability, structure and
electronic properties of γ-Fe23C6 from first-principles theory, Acta Materialia, 58
(2010), 2968-2977.
[23] C. Amador, R.L.W.L. Lambrecht, B. Segall, Application of generalized gradient-
corrected density functionals to iron, Physical Review B, 46 (1992) 1870-1873.
[24] H.J. Monkhorst, J.D. Pack, Special points for Brillouin-zone integrations, Physical
Review B, 13 (1976) 5188-5192.
[25] J. Arblaster, Private communication, 2017
[26] Y. Ma, C. Roeming, B. Lebech, J. Gjeonnes, J. Taftoe, Structure refinement of
Al3Zr using single-crystal X-ray diffraction, powder neutron diffraction and CBED,
Acta Crystallographica B, 48 (1992) 11-16.
[27] G. Brauer, Ueber die Kristallstruktur von TiAl3, NbAl3, TaAl3 und ZrAl3,
Zeitschrift für anorganische und allgemeine Chemie. 242 (1939) 1-22.
[28] C. Colinet, A. Pasturel, J. Phase stability and electronic structure in ZrAl3

24
compound, Journal of Alloys and Compounds 319 (2001) 154-161.
[29] Y. Ma, C. Romming, B. Lebech, J. Gjonnes, J. Tafto. Structure refinement of Al3Zr
using single-crystal X-ray diffraction, powder neutron diffraction and CBED, Acta
Crystallographica Section B 48 (1992) 11-16.
[30] E. Nes, H. Billdal. Non-equilibrium solidification of hyperperitetic Al-Zr alloys,
Acta Metallurgica, 25 (1977) 1031-1037.
[31] A. Israel, I. Jacob, J.L. Soubeyroux, D. Fruchart, H. Pinto, M. Melamud. Neutron
diffraction study of atomic bonding properties in the hydrogen-absorbing Zr(AlxFe1−x)2
system, Journal of Alloys and Compounds. 253–254 (1997) 265-267.
[32] T.J. Renouf, C.A. Beevers. The crystal structure of Zr2Al3, Acta
Crystallographica, 14 (1961) 469-472.
[33] J.W. Christian. The theory of phase transformation in metals and alloys, Oxford:
Pergamon (2002)
Figure captions
Figure 1 - Phase diagram of the Al corner of the Al-Zr system based on the literature
review with the phase boundaries calculated using the assessed data of Fischer and
Colinet [6].
Figure 2 – Schematic view of the as-cast samples (MISiS).
Figure 3- Alloy Al-0.3 at.% (1 wt%) Zr, sample after the DTA (heat rate 0.5K/min): a)
general view b) magnified bottom part (MISiS).
Figure 4 – Comparison of the calculated phase diagram for Al rich corner of the Al-Zr
system with the proposed phase diagram based on the present measurements and ab

25
initio results.
Figure 5 - SEM BSE images of the specimens cut from the Al-Zr alloy samples
solidified in the crucible with (a) 0.03 at.% (0.1 wt%) Zr; (b) 0.04 at.% (0.15 wt%) Zr;
(c) 0.09 at.% (0.3 wt%) Zr, (d) 0.12 at.% (0.4 wt%) Zr and (e) 0.15 at.% (0.5 wt%) Zr
(BCAST).
Figure 6 - SEM images of the specimens cut from the Al-0.12 at.% (0.4 wt%) Zr alloy
sample cast in the wedge mould at different cooling rates: (a) 3 K/s; (b) 5 K/s; and (c)
12 K/s (BCAST).
Figure 7 - (a) STEM image of a few tiny particles along the grain boundaries; EDS
maps of (b) Al; (c) Zr; (d) Cu; (e) O; and (f) Ti (BCAST).
Figure 8 - (a) TEM-BF image of a typical tiny particle at a grain boundary; (b), (c), and
(d) SADP patterns obtained from the intermetallic particle and indexed as tetragonal
D023 Al3Zr with beam directions (BDs): (b) [041]; (c) 051 and (d) [151] (BCAST).
Figure 9 - Sample of the alloy Al-0.3 at.% (1 wt%) Zr: a), b) microstructure of the
bottom part of the ingot; c), d) microstructure of the central part of the ingot (MISiS).
Figure 10 – Primary Al3Zr-D023 crystals: a) SEM image in backscattered signal; b)
EBSD mapping (MISiS).
Figure 11–TEM micrographs of the structure of the “flower crystals”: a) bright-field
TEM micrograph of the structure of «flower crystal» at a large scale; b) a [100]Al zone
axis diffraction pattern from the central part of the «flower crystal» corresponding to
area (c) and a schematic representation of a simulated diffraction pattern where [001]
Al3Zr-D023 is parallel to [001] fcc Al; c) bright-field image of the central part of the
«flower crystal»; d) dark-field image of the central part of the crystal taken in (011)
Al3Zr-D023 as image forming reflection; e) Enlarged bright-field micrograph of the

26
structure of the “petals”; f) a diffraction pattern along [100] Al3Zr-L12 zone axis
corresponding to the area represented on (e) and a simulated diffraction pattern along
[100] fcc Al ǁ [100] Al3Zr-L12 and ǁ [001] Al3Zr-D023 zone axis. The SADP exhibits
coexistence of Al3Zr-L12, fcc Al and traces of Al3Zr-D023. (MISiS)
Figure 12 - Structure of the “porous crystals” in the as-cast sample: a) alone; b) inside
the “flower crystal” с) a bright-field image of a «porous» crystal from a central part and
associated diffraction pattern indexed as Al3Zr-D023 [010] zone axis (MISiS).
Figure 13 – TEM microstructure of the “flower crystals” in the sample annealed at
927 K (654 °C) for 144h: a) a bright-field image of the thin lamella milled by FIB, the
circles with numbers 1, 2 and 3 depict the places corresponding to the SADPs on c), d)
and e) images respectively; b) enlarged area with a high-resolution image of D023
crystal; c) a SADP from circle 1 corresponding to Al [100] zone axis; d) a SADP from
circle 2 corresponding to Al3Zr-D023 crystal, c-axis ǁ [001]Al; e) a SADP from circle 3
corresponding to Al3Zr-D023 crystal, c-axis ǁ [010]Al; f) a secondary electron image of the
“flower crystal” obtained in FIB. The place where the sample for investigations was cut
is marked by dashed line. (MISiS)
Figure 14 – a) TEM structure of the sample of the alloy Al-0.04 at.% (0.15 wt%) Zr
annealed at 927 K (654 °C) for 42 h. The coherent particles with coffee-bean contrast
are marked by arrows; b) associated diffraction pattern along [3-10] Al zone axe. The
superlattice reflections corresponding to Al3Zr-L12 phase are invisible. (MISiS)

27
Figure 15 – DTA analysis: a) pure aluminium on the reference side; b) pure aluminium
on the sample side; c) pure on both the reference and sample sides. (MISiS)


Ab initio calculations carried out for Al-rich part of Al-Zr system.
The presence of a eutectic reaction confirmed by DTA.
Three types of primary intermetallic crystals were found.
Lower solubility of Zr in the aluminium solid solution suggested.
*Highlights (for review)

Table 1 - Calculated results from ab-initio calculations for the parent elemental solids, the binary
Al3Zr phases and dilute Zr in fcc Al. The experimental values available in the literature are
included in parenthesis for comparison. The formation energy (ΔE) is defined as: ΔE=E(AlnZr) –
[E(Zr) + nE(Al)] with the unit eV per formula (AlnZr).
Phases Symmetry
/space group (nr) Lattice parameters (Å)
ΔE (eV/f.u.)
ΔE (eV/kJ mol-1)
Assessed [7]
Al FCC, Fm͞3m (225) a=4.0397 (4.0325 [25])
-
Zr HCP, P63/mmc (196) A=3.2316 (3.2288 [25]) c=5.1716 (5.1406 [25])
-
Al3Zr_L12 Cubic, a=4.1047 (4.085 [2]; 4.0656 [5])
-1.850 -178.5
Al3Zr- D022
Tetragonal, a=3.9596 (3.8946 [5]) c=9.0242 (9.0304 [5])
-1.849 -178.4
Al3Zr- D023
Tetragonal, I4/mmm (139)
a=4.0167 (3.993 [26]; 4.005 27]) c=17.3211 (17.283 [26]; 17.2785 [27])
-1.954 -188.5 -187.12
Compositions of supercell
Al31Zr Cubic - -1.043 (w=32)
-100.6 -128.8
Al107Zr Cubic - -1.091 (w=108)
-105.3 -131.9
Al255Zr Cubic - -1.242 (w=256)
-119.8 -132.6
Tables 1, 2

Table 2 – DTA results
Alloy Condition Heating rate (K/min)
Melting point (°C) [K]
Al melting point, after thermocouple calibration (°C) [K]
Al-1 wt% Zr
As-cast 5 657.2(9) [930.4(4)] 660.33 [933.48]
As-cast 1 658.4(6) [931.6(1)] 660.32 [933.47]
Annealed 10 days at 654 °C [927 K] 0.5 659.1(4)
[932.2(9)] 660.33 [933.48]
Al-0.15 wt% Zr Annealed 7 days at 654 °C [927 K] 0.5 660.3(8)
[933.5(3)] 660.33 [933.48]
Al-1 wt% Zr
Annealed 6 days at 654 °C [927 K]
(measurement carried out on the
reference side)
0.5 659.2(6) [932.4(1)] 660.32 [933.47]
Al-1wt%Zr
Annealed 6 days at 654 °C [927 K]
(Al-Zr vs Al experiment)
0.1 660.0(5) [933.2(0)] 660.33 [933.48]
Average from the annealed 659.7 [932.85] –

mage

mage

mage

mage

mage

mage

mage

mage

mage

mage

mage

mage

mage

mage
mage

mage

mage

mage

mage

mage

Figure 12-aClick here to download high resolution image

Figure 12-bClick here to download high resolution image

mage

mage

Figure 14-aClick here to download high resolution image

Figure 14-bClick here to download high resolution image

mage

mage

mage

mage