new jersey heritage tourism plan economic impact … jersey econ impact … · · 2010-06-17new...
TRANSCRIPT

New Jersey Heritage Tourism Plan Economic Impact Data and Analysis
1
Summary Analysis of Heritage Tourism
Trends and Economic Impact Nationally and in New Jersey
Heritage Tourism: National Background and TrendsThe National Trust for Historic Preservation defines cultural heritage tourism as “traveling to xperience the places, artifacts and activities that authentically represent the stories and people eof the past and present. It includes cultural, historic and natural resources.” “Cultural” was added to the label of “heritage tourism” as research indicated that visitors to historic sites were similar in profile to visitors to cultural attractions and activities. Also, research indicates that the focus on “place” or the entire destination is important. The visitor wants to learn about the history of a place through immersion experiences including local uisine, craft, music, other indigenous entertainment, visiting historic and natural attractions, cand meeting local people. A national market study released October 2009 reports that “78% of all U.S. leisure travelers participate in cultural and/or heritage activities while traveling, translation to 118.3 million dults each year. With cultural and heritage travelers spending an average of $994 per trip, athey contribute more than $192 billion annually to the U.S. economy.”1 Why is o so many destinations? The National Trust cites these benefit
heritage tourism attractive t
• s s:
• Creates jobs and businesse
• Increases tax revenues
• Diversifies local economy
• y and preservation
Creates opportunities for partnerships
• Attracts visitors with interest in histor
• Increases historic attraction revenues
and culture •
Preserves local traditions
• Generates local investment in historic resources Builds community pride
and perception/image of the site or area’s significance • Increases awareness Domestic Segment Growing Since national organizations, such as the U. S. Travel Association (formerly the Travel Industry Association of America/TIA) and the National Tour Association, began tracking interest in and visitation to historic attractions more than two decades ago, heritage tourism has steadily demonstrated incremental growth as a segment category overall. 1 U.S. Cultural and Heritage Tourism Study (October 2009) conducted by Mandala Research, LLC for U.S. Cultural & Heritage Tourism Marketing Council, U.S. Department of Commerce, and Gozaic/Heritage Travel Inc., a subsidiary of the National Trust for Historic Preservation

New Jersey Heritage Tourism Plan conomic Impact Data and Analysis
2
E The 2009 Mandala Research Study cited that cultural and he
s vs 3.98 fo•
ritage tourists: • r non‐cultural/heritage travelers More frequent travelers: 5.01 leisure trip
• More frequent business and international travelers
• Prefer leisure travel to be “educational”
• Will spend more money on cultural and heritage activities Will travel farther to get the experiences they seek
• Most popular cultural and heritage activities include: visiting historic sites (66%); attending historical re‐enactments (64%); visiting art museums/galleries (54%); attending an art/craft far or festival (45%); attending a professional dance erformance (44%); visiting state/national parks (41%); shopping in museum
rhoods (30%). pstores (32%); and exploring urban neighbo
International Interest in U.S. Heritage Remains Strong In 2004, according to the U.S. Department of Commerce, there were over 10.6 million
e overseas visitors – approximately one in three – who participated in cultural and heritagtourism activities while within the country. The top fivvisitors are
e markets interested in cultural and heritage tourism as a share of their total : United Kingdom, Japan, Germany, France and Australia.
• The average overseas cultural and heritage tourism traveler visits the country for over 19 nights (16 nights for all overseas travelers).
• More than 72 percent are here for leisure/holidays as one of the purposes of theirtrip (62% for all overseas travelers).
• They are more willing to visit more than one state (41 percent) compared to only 30 percent for all overseas visitors.
Canadians are more interested in cultural and heritage activities than ever before. Of adults age 18+ e engaged in heritage activities., 2.2 million report that they hav
•
2 Of particular interest are:
%) • %)
General history museums (86kets (67
• Farmers’ fairs or mar
• Local festivals or fairs (65%) Historic sites (55%)
• Historical cities/towns (54%) ver two in five of these Canadian heritage travelers say they have taken a leisure trip to O
the United States (44%) in the past three years.3 These findings demonstrate several opportunities for states interested in attracting the international visitor to heritage activities:
2 Young Strategies, 2008 – Special TAMS Tabulations pages 10‐14 3 Young Strategies, 2008

New Jersey Heritage Tourism Plan Econom
3
ic Impact Data and Analysis
• y Major international gateway cities (such as Newark) provide a unique opportunitto lure foreign visitors off the plane and into local destinations
• Destinations that can thematically link activities – particularly across county and state boundaries – will have an advantage of offering the critical mix of packaged tour itineraries for international visitors
• Destinations that can focus on the “hub and spoke” strategy to provide a collection f day trips originating from a single place can increase the potential of
d more. ointernational visitors to stay longer and spen
Leading States Attracting Cultural Heritage Visitors Pennsylvania is the fourth most visited state in the country, tied with New York, with approximately 126 million visitors annually. The total impact of travelers’ spending on ennsylvania’s economy is approximately $34 billion a year and provides more than P563,000 jobs for Pennsylvania families. EconomRiver V
ics Research Associates (ERA) assessed the effects of Pennsylvania’s Schuylkill alley National Heritage Area on the regional economy.
• ge The region has approximately 5.87 million heritage visitors (5.05 million to heritaattractions and 825,000 to special events).
• ent from out of Over 70 percent of visitors come from outside the region: (43 perc
• state and 28 percent from elsewhere in Pennsylvania). Heritage visitors spend a total of 10.3 million nights in the region.
• Nearly all visitors come in the summer (37 percent) and fall (44 percent). Very fewcome in the winter – just three percent of all.
• Total annual spending by heritage visitors is $358 million, of which 28 percent is spent on food and drink, 21 percent on retail purchases, 20 percent on lodging, 11 percent on recreation/entertainment, and 20 percent on transportation and other purchases.
From the work of nonprofit arts agencies to the impact of cultural heritage tourism, it is clear that the creative sector is important to state economies all across the country. The creative industry in Arkansas, for example, employs nearly 27,000 individuals and generates $927 million in personal income for Arkansas citizens. Creative enterprises are the state’s third largest employer—after transport and logistics and perishable and processed foods. In North Carolina, the wages and income of workers employed by creative industries infused $3.9 billion into the state’s economy in 2006. And in assachusetts, the 17.6 percent yearly growth of the cultural sector contributed $4.23 M
billion to the state’s economy. Visitors to Colorado took 5.1 million trips to historic areas in 2003. An estimated $1.5 billion in direct expenditures by Colorado’s heritage tourists in 2003 generated an additional $1.9 billion in indirect economic impacts. Spending by heritage travelers also generated an estimated $1.1 billion in total earnings by Colorado workers and 60,964

New Jersey Heritage Tourism Plan ic Impact Data and Analysis
4
Econom jobs.4 Trends in Heritage Tourism While the industry segment is anticipating continued growth, certain historic sites are experiencing a decline in visitation or decrease in revenues. In part this is due to an overall travel industry trend reported by Young Strategies and Randall Travel Marketing in 2008 that “traveler behavior change is forcing the travel industry to reinvent the experience.” ravelers want to get away and explore UNIQUE places, but travelers are much more
n. Tsophisticated than twenty years ago when heritage tourism first gained national attentio “Today’s sophisticated traveler is a more demanding consumer. Providers of goods and services have to stay on top of rapidly changing trends to survive. Luxury experiences are no longer for the rich alone. And fine art/craft – especially objects made locally “in the USA” – are new choices for souvenirs,” said Berkeley Young, Young Strategies at the 2007 ultural & Heritage Tourism Alliance Meeting and British Columbia (Canada) Museums CAssociation annual meeting. With more than 16,500 museums and 9,000 historic house museums in the U.S., competition is fierce.5 The challenge for heritage sites today is to provide consistent xperiences that meet the expectation of the traveler without compromising the integrity eof or negatively impacting the historic resource. Another challenging trend is time poverty – more to do and less time to do it. With limited vacation and trip planning time, visitors are seeking easy to purchase, guaranteed quality experiences. A 2007 Expedia survey said that one‐third of respondents did not take all of their vacation days. Nearly 50% of all Americans report that because of time poverty, travelers want “all‐inclusives” to save time.6 And 55% of travelers now plan their vacations in less than two months, so destinations are providing seasonal or time‐specific ideas to attract visitors.7Offering incentives to visit (half price tickets but offering food, beverage and retail for sale on site), packaging experiences into multi‐day itineraries for one price (with lodging), and promoting special “insider” tours to attract repeat customers via e‐alerts are just a few ways that heritage sites and destinations are competing for today’s traveler. New Jersey & Tourism “One of New Jersey’s greatest advantages is that it is less than a tank of gas away for ore than 91 million people, making it an economical option for cost‐conscious onsumers.” New Jersey Secretary of State Nina Mitchell Wells mc
4 Source: The Economic Benefits of Historic Preservation in Colorado. 5 Source: American Association of Museums, 2008 6 Source: YPB&R/Y Report, 2007 7 Source: 2005 Image Study, DK Shifflet

New Jersey Heritage Tourism Plan Economic Impact Data and Analysis
5
At the 2009 New Jersey Governor’s Conference on Tourism, the state’s research firm Global Insight pre travel & tourism (direct and indirect) was $38.8 billion.
sented that the total impact of
o 8 W r, tourism declined in some areas: hile a critical economic generato
8 o
NJ visitation fell 4.3% in 200
o Visitor expenditures fell by 4.9%
o Total impact grew by 0.2%
.4% o 007) to $107.00 in 2008
Overnight stays were ‐6.4% and day trips were ‐2Spend‐per‐person‐per‐day fell from $116.00 (in 2
o NJ travel Inflation was 3.2% (in 2008) from 5.8% Global Insight also reported that travel & tourism represents 5.8% of Gross State Product. The ratio of the total impact to total expenditures reveals that 72% of each tourism dollar spent in New Jersey is retained in the state (the remainder represents import leakages.) These statistics demonstrate the opportunity for New Jersey to increase
visitors. market share and retain a greater portion of dollars spent by Impact of Visitors on New Jersey Employment and Revenues
As evidenced by this slide, tourism is an important industry for New Jersey. The Global Insight report presented in 2009 stated that 359,042 jobs – direct and indirect – were created by travel and tourism economic activity. (There were 443,094 travel & tourism‐related jobs in 2007). This accounts for 8.8% of total onfarm employment in the state in 008. n2
• m is the 3Travel & Touris ployer in the state.
Core Tourism’s average annual wage has grown to $30,000/year • 4 billion in wages and salaries was generated by travel
$17.0 billion in 2007)
rd largest pri mvate sector e•
Approximately $11.and tourism in 2008 (a decrease from
• axes Tourism generated $7.7 billion in federal, state, and local government tin 2008, a 3.3% decrease from 2007
• Tourism contributes disproportionately to state revenue. While tourism is state responsible for 5.8% of New Jersey’s GSP, it contributed 7.5% of
government revenue in 20089 • If tourism didn’t exist, each New Jersey household would have to pay $1,427
more in taxes to maintain current levels of state and local tax receipts
8 Source: Ken McGill, Global Insight, March 2009 9 Global Insight, March 2009

New Jersey Heritage Tourism Plan Economic Impact Data and Analysis
6
What do visitors mean to New Jersey?
• • $0.72 of each dollar spent by visitors is kept within New Jersey Every 160 visitors creates a new job in New Jersey
• About $109 per visitor in tax receipts, $64 of which goes to state and local
• ol student for the year authorities
• Every 204 visitors pays for one New Jersey public scho$393 per visitor in New Jersey GSP
• $240 per visitor in wages paid to New Jersey workers
New Jersey Heritage Tourism Plan Economic Impact Data and Analysis
7
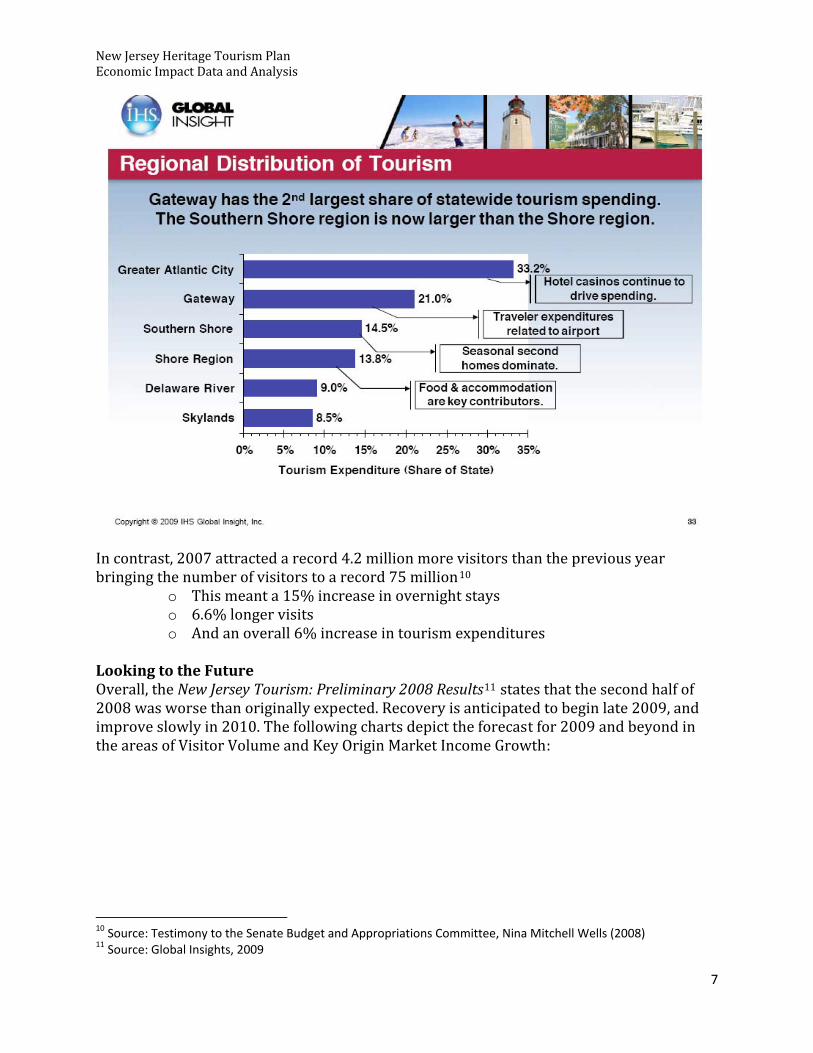
In contrast, 20 than the previous year bringing the n
07 attracted a record 4.2 million more visitorso a record 75 millionumber of visitors t
o
10
o This meant a 15% increase in overnight stays 6.6% longer visits
o And an overall 6% increase in tourism expenditures Looking to the Future Overall, the New Jersey Tourism: Preliminary 2008 Results11 states that the second half of 2008 was worse than originally expected. Recovery is anticipated to begin late 2009, and improve slowly in 2010. The following charts depict the forecast for 2009 and beyond in the areas of Visitor Volume and Key Origin Market Income Growth:
10 Source: Testimony to the Senate Budget and Appropriations Committee, Nina Mitchell Wells (2008) 11 Source: Global Insights, 2009

New Jersey Heritage Tourism Plan Economic Impact Data and Analysis
8
Heritage Tourism Impact in New Jersey As New Jersey seeks to increase its market share and economic impact of tourism, especially among competing/neighboring states, heritage sites and activities provide a great opportunity to expand products and experiences for the potential visitor. Recent estimony by Secretary Wells indicates the existing impact of heritage tourism to New tJersey12: In FY 08, the New Jersey State Council on the Arts awarded some $21.5 million in grants to over 700 organizations and projects in every corner of the state. The Historical Commission provided over ting support grants to 83 historical organizations
$3.4 million dollars in general opera
o statewide. These venues helped stimulate:
o Over $2 billion in economic activity
in state tax revenues o
Returned $40 millionSupported some 20,000 arts‐related businesses
o Created 90,000 jobs o Collectively produced 40,000 events that attracted 20 million attendees
With the national trend of interest in and visiting historic sites still strong, New Jersey has an opportunity to grow its heritage tourism. This effort requires more than marketing. The state must enhance its collection of consistent and quality experiences that meet the new
12 Source: Testimony to the Senate Budget and Appropriations Committee, Nina Mitchell Wells (2008)

New Jersey Heritage Tourism Plan
9
Economic Impact Data and Analysis expectations of today’s savvy traveler. Unfortunately, as indicated in the slide below, New Jersey’s historic sites are not motivating travelers from surrounding states or generating visitation from local residents compared to national averages.
o reap the benefits of heritage tourism requires constant investment, management, evelopment and marketing. Td Heritage Tourism Facts:13
• Every million dollars invested by city and state governments in heritage tourism creates between 50 and 250 jobs.
• 30 jobs For every million dollars invested in rehabilitation of historic buildings, about are created.
• Every million dollars of spending by heritage tourists results in about 30 jobs. Other social and local benefits of heritage tourism include increased community pride, additional job opportunities (related to restoration and preservation of sites, architectural planninand/or
g, exhibit design, planning, interpretation), and increased neighborhood aesthetics vitality. As one expert cited in the Economic Impact of Historical Preservation:14
•
Preservation programs within historic districts often increase the value of propertyand homes.
• to a Historic districts have distinct identities that add to their value and contributesense of local pride.
• Preserv cal supplie
ation increases the demand for labor and increases business for lors:
o all Preservation is an ideal strategy for attracting and retaining sm
n. businesses.
o Preservation can target areas appropriate for public attentio• Preservation creates a bond between a community and its citizens.
13 Source: Heritage Tourism in South Jersey, Rodney Carlisle, P.D. (2006) 14 Source: Heritage Tourism in South Jersey, Rodney Carlisle, P.D. (2006)

New Jersey Heritage Tourism Plan Economic Impac
10
t Data and Analysis
o ess districts. Preservation stabilizes neighborhoods and creates viable busino Preservation can be effective regardless of the size or location.
Local effects of Heritage Tourism in New Jersey Several New Jersey destinations are maximizing their historic assets to attract visitors and their spending. Expert interviews and market research identified examples of how heritag t, or offering an opp ic growth
e tourism is providing a positive impac ortunity for econom, in local townships across New Jersey:
• With tourism a $350 million industry, Gloucester County is launching a new marketing campaign with audio podcasts to promote historical, agricultural and
ecological assets. The county hopes to enhance its tourism market by attractingregional residents and visitors from Philadelphia.
• Over its 39‐year history, the Mid‐Atlantic Center for the Arts has used heritage tourism to stretch Cape May's tourism season from the traditional Jersey Shore beach resort 12‐week season (Memorial Day‐Labor Day) to almost year around. The heritage destinations attracts some 300,000 visitors a year to three restored historic sites (the 1879 Emlen Physick Estate, the 1859 Cape May Lighthouse and the World War II Lookout Tower), array of community history tours and its year around schedule of special events activities. These compelling heritage experiences – along with several equity theater companies, a Jazz Festival, a Film Festival and the birding and nature activities of two area New Jersey Audubon outposts – have helped put "heads in beds" in one of this country's largest collections of Bed‐and‐Breakfast inns (as well as scores of hotels, motels, guest houses, and over a
thousand rental houses and condos) while also bringing new customers to theseveral area restaurants.
• The U.S. Congress designated The Crossroads of the American Revolution as a rding national rec ith National Heritage Area in 2008, affo ognition and association w
the National Park Service. • The Heritage Trail Association15 in Somerset County coordinates an innovative
collection of programs to attract visitors including: bus & walking tours, lecture series and exhibits, educational school
ation assemblies, customized presentations, re‐
enactments, storytelling, preserv . • Trenton’s Downtown Association16 hosts more than 50 events annually providing
an economic impact of $111,400. Challenges According to a 2005 study conducted for New Jersey by D.K. Shifflet & Associates, “while many of NJ’s key attractions have high levels of awareness in the origin markets, some of the Sta estinations were unkno
17
te’s key cultural, historic, and outdoor recreation related dwn.”
• 82% of travelers did not know the location of Wheaton Village 15 www.heritagetrail.org/content/Case.pdf 16 Source: Trenton Downtown Association, R. Hunter (2007) 17 Source: 2005 New Jersey Image Study prepared for Winning Strategies Advertising on behalf of New Jersey Office of Travel & Tourism by D.K. Shifflet & Associates in partnership with Global Insight.
New Jersey Heritage Tourism Plan Econom
11
ic Impact Data and Analysis
• 74% did not know the location of Mountain Creek bertville
• Washington Crossing • 67% of travelers did not know the location of Lam
• 63% did not know the location of Jockey Hollow or
t Pleasant 46% did not know the location of Poin• 43% did not know the location of Monmouth Park • 41% did not know the location NJPAC
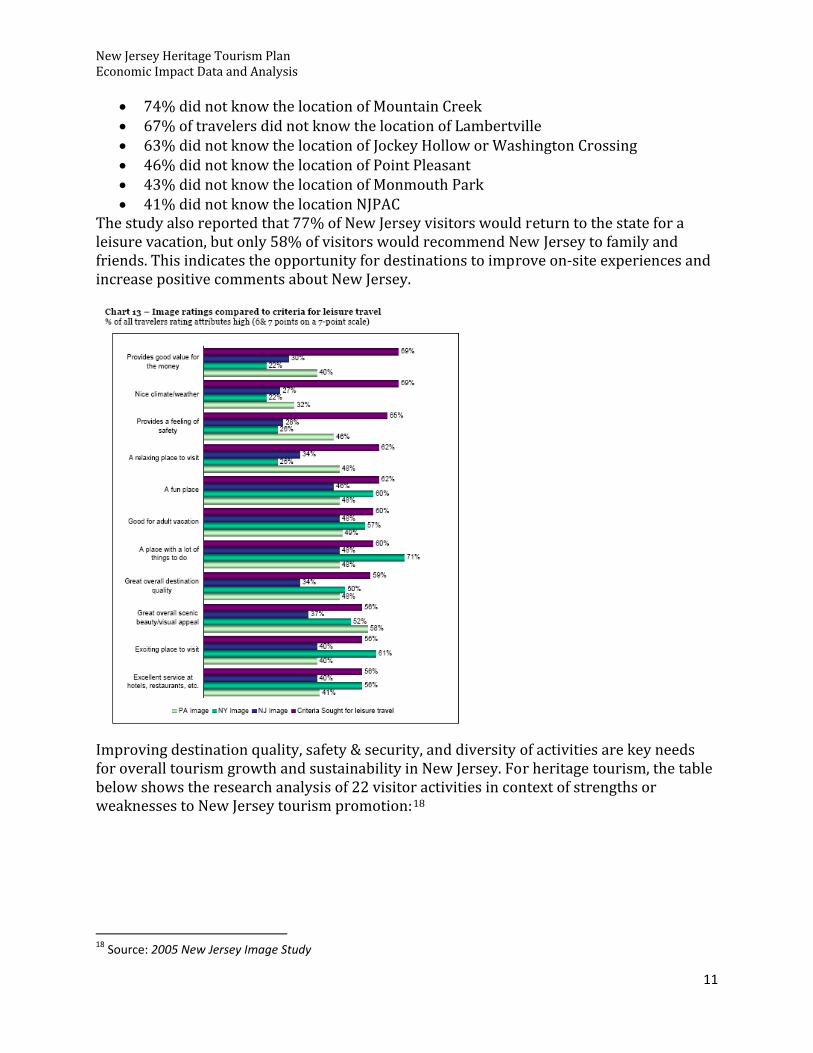
The study also reported that 77% of New Jersey visitors would return to the state for a leisure vacation, but only 58% of visitors would recommend New Jersey to family and riends. This indicates the opportunity for destinations to improve on‐site experiences and ncrease positive comments about New Jersey. fi
Improving destination quality, safety & security, and diversity of activities are key needs for overall tourism growth and sustainability in New Jersey. For heritage tourism, the table below shows the research analysis of 22 visitor activities in context of strengths or weaknesses to New Jersey tourism promotion:18
18 Source: 2005 New Jersey Image Study

New Jersey Heritage Tourism Plan Economic Impact Data and Analysis
12
Inconsistent hours of operation, lack of quality and diverse product experiences, dated exhibits or displays, limited signage (directional and interpretive), and under‐staffed sites are some of the challenges identified in reports and interviews. The need for investment to upgrade facilities and products, manage and market experiences to meet customers’ expectations, and increase revenue generation is frequently referenced. “While many of New Jersey’s key attractions have high levels of awareness in the origin markets, some of the State’s key cultural, historic, and outdoor recreation related destinations were unknown. Therefore, to develop and promote niche markets like ulture, heritage, or outdoor recreation, increased promotion of these destinations is eeded in the outofstate origin markets.”cn 19
New Jersey Heritage Tourism Potential in the Next Decade Heritage tourism potential should be considered in context to the overall tourism impact and potential for New Jersey. Understanding the opportunity and interdependency of heritage tourism as part of the larger travel & tourism industry (including all motivations for travel, business as well as leisure, and challenges such as image and perceptions) is vital to evaluating the segment’s potential return on investment. Expectations must be set according to the overall trend analysis for growth of tourism in general. As demonstrated by the slide below, Global Insight projects a rebound in 2010 with incremental growth fluctuating over the next five years.20
19 Source: DK Shifflet, 2005 Image Study 20 Source: Global Insights, March 2009

New Jersey Heritage Tourism Plan Economic Impact Data and Analysis
13
Wage and Job Growth Her gita e tourism can positively affect wages and employment in two key ways:
1) Move from seasonal to sustainable: expanding the hours and days of operation – in some situations, opening sites currently closed; offering food service, retail operations and other revenue generation areas at existing sites; staffing special events or seasonal activities; exte nd nding operation from summer to year‐rouadmission; etc.
2) Increase professional capacity: expert skills are required to develop new d activities and visitor experiences; rehab or expand heritage sites; build exhibits an
interpret themes; train and serve as guides; etc. Understanding how visitation can provide revenue generation is key to increasing wage and job growth. Expanding staff to keep facilities open longer and offer greater number of
rofessional needs to enhance, deliver, market activities will in turn grow the capacity of pand manage visitor experiences. Impact on Other Attractions, Destinations “It is time that New Jersey (government) partner with the State’s tourism industry to insure our economic vitality, to rebuild our downtowns and to instill a sense of state pride in our constituents. With the recent downturn of the national economy, the State of New Jersey needs to take greater advantage of the vast opportunity for economic growth and downtown revitalization and preservation, which can be realized by expanding travel and tourism as an important and integral business for the state. A business in an industry that has a well documented return on investment.”21 If New Jersey uses the recommendations outlined in other reports, and the strategic plan, to develop and market its heritage product to meet travelers standards, the impact on other attractions and the state overall can be profound. In addition to the increased 21 Source: New Jersey’s Travel & Tourism Industry White Paper, N. Bodman (2007)

New Jersey Heritage Tourism Plan
14
Economic Impact Data and Analysis economic impact, New Jersey may also realize an improved image as visitors see and explore undiscovered facets of the state or experience distinctive assets not found anywhere else in the country. The benefit is fourfold – a more diverse tourism industry, tronger heritage institutions, increased local community/resident pride and revenue eneration. sg Securing Baseline Data and Tracking Impact
ement can only Performance measur be conducted if a baseline is available for future comparison. Defining the desired measurements for success – such as sustainable jobs, increased tax revenue, and stewardship of important resources for enjoyment by future generations – is vital to det le ermining what information to collect and the frequency required for credibanalysis. Investing in the development, marketing, and management of heritage attractions is required to increase and sustain heritage tourism growth. Identifying and charging the entity responsible for managing the performance evaluation process is essential for consistent and relevant data collection. A major challenge for heritage tourism market research, however, is capturing accurate impact statistics for non‐gated attractions and activities (such as Main Streets, heritage communities, sites and events that do not charge admission.) Another challenge for heritage tourism documentation of its return on investment is attribution. Demonstrating the intrinsic value of a historic resource to a positive image, spending at other places (retail
otion stores, restaurants, lodging), is difficult unless the analysis is tracking a specific promor activity. For research to be valued, it must conducted consistently (annually, biannually) and through/by credible sources. State government (through comptroller’s office or other data
ational institutions are some of the collection agency), private research companies, or educmos noStra g
t table sources for conducting and analyzing economic impact data. te ies for Capturing Economic Impact Information tes, historic attractions, heritage 1. Annual Jobs and wages report (historic si
destinations)
2. Annual dollars leveraged for state grants
3. Annual revenues generated (comparison of visitors and other sources) 4. Tax revenue generation from visitors to historic sites, heritage destinations
ew Jersey’s Heritage Tourism Strategic Plan will highlight recommendations for ocumenting the economic impact in the next decade. Nd