new jersey tobacco point of sale...
TRANSCRIPT

New Jersey Tobacco
Point of Sale Project
FINAL REPORT
AUGUST 2014

Acknowledgements
The New Jersey Office of Tobacco Control (OTC) is a unit of the New Jersey Department of
Health (DOH) under the direction of Commissioner Mary E. O’Dowd. The OTC is
administratively located within the Community Health and Wellness Unit in the Division of
Family Health Services. This report was prepared for the DOH by Rutgers, The State
University of New Jersey through funding from the DOH. The interpretations of data,
conclusions, and recommendations expressed in this report are those of the authors and
may not represent the views of the DOH.
The 2014 New Jersey Point of Sale Project was completed by:
The Center for Tobacco Studies
School of Public Health
Rutgers, The State University of New Jersey
Field Data Collectors
Daniel Giovenco, MPH
Myriam Casseus, MPH
Suggested Citation
Giovenco DP, Casseus M, Hrywna M, Delnevo CD. New Jersey Tobacco Point of Sale Project.
New Brunswick, NJ: Rutgers School of Public Health; August 2014.

TABLE OF CONTENTS
Background ........................................................................................................................ 1
Methodology ....................................................................................................................... 2
Results
Overall ............................................................................................................................ 4
Atlantic City .................................................................................................................... 7
Cherry Hill ...................................................................................................................... 9
Edison .......................................................................................................................... 11
Elizabeth ...................................................................................................................... 13
Newark ......................................................................................................................... 15
Paterson ...................................................................................................................... 17
Perth Amboy ................................................................................................................ 19
Trenton ........................................................................................................................ 21
Vineland ....................................................................................................................... 23
City Comparisons ............................................................................................................. 25
Conclusion ........................................................................................................................ 28
References ....................................................................................................................... 29

1
BACKGROUND
After the 1998 Master Settlement Agreement banned many traditional forms of tobacco
advertising (e.g., billboards, transit advertisements, sponsorships, and product placement in
the media), the tobacco industry began investing billions of dollars marketing its products at
the point of sale (Figure 1). In 2011, for example, tobacco companies spent over $8 billion
on in-store promotional activities for cigarettes, including advertisements and price-related
marketing (e.g., discounts, coupons, special deals).1 Smokeless tobacco marketing
expenditures have also increased from $444.2 million in 2010 to $451.7 million in 2011.2 Comparable data on cigars and electronic cigarettes are not currently available.
Research has documented that exposure to point of sale
marketing is positively associated with tobacco use.3-6
The National Cancer Institute, in its 2008 monograph,
The Role of the Media in Promoting and Reducing
Tobacco Use, concluded that tobacco advertising and
promotion are causally linked with both smoking
initiation and an increase in per capita tobacco
consumption.7 The 2012 Surgeon General’s Report,
Preventing Tobacco Use among Youth and Young Adults,
echoed this sentiment, noting that “based on the weight
of the scientific evidence, it is concluded that advertising
and promotion has caused youth to start smoking and continue to smoke.”8 More research
is needed to investigate the relationship between point of sale marketing for other tobacco
products (e.g., smokeless tobacco, cigars, and e-cigarettes) and use of these products.
Although rates of cigarette smoking among adolescents have fallen in the past decade, the
prevalence of ever use and current use of cigarettes remains high. In 2013, 34.2% of New
Jersey high school students reported ever having tried a cigarette, and 12.9% had smoked
at least one cigarette in the past 30 days.9 Data from the 2012 New Jersey Youth Tobacco
Survey indicate that regular use of other tobacco products is not uncommon among high
school students. Current cigar use, for example, exceeded 6% but was markedly higher for
males and 12th graders. Rates of current use for smokeless tobacco and electronic
cigarettes were 3.4% and 6.1%, respectively, with differences by gender, race, and grade
level.
This project aims to characterize tobacco advertising and product availability in retail
locations near schools in nine New Jersey communities. Although youth may visit tobacco
vendors in other parts of their city, (e.g., near their homes, parks, etc.), they are likely
exposed to tobacco marketing before and after school in retail locations that are within
walking distance of school grounds. Monitoring this type of marketing may highlight youth
exposure to different types of tobacco products and indicate how exposure may vary among
the sample of New Jersey communities. Further, ongoing surveillance of point of sale
tobacco marketing may inform future legislation restricting this activity.
Figure 1 - Point of sale marketing
Source: Counter Tobacco

2
METHODOLOGY
Three large communities from each region of New Jersey (North, Central, and South) were
selected based on total middle and high school enrollment and the number of licensed
tobacco retailers. The overall sample comprised nine cities: Atlantic City, Cherry Hill, Edison,
Elizabeth, Newark, Paterson, Perth Amboy, Trenton, and Vineland. These cities are
ethnically diverse and present a mix of urban and suburban geographic areas (Figure 2).
Camden was excluded due to a spike in weapon/aggravated assaults and motor vehicle
thefts during the month of data collection.10
Figure 2 – City selection
A list of public and non-public schools with students in fifth grade or higher was obtained
from the New Jersey Department of Education. Youth typically experiment with tobacco
products during adolescence and teenage years, hence elementary schools and preschools
were not considered for this project. All schools and licensed tobacco retailers (source: New
Jersey Department of Health) in each community were geocoded using ArcGIS (v.10.1). A
half-mile buffer was drawn around each school in the sample, and any retailer that fell
within the buffer zone was extracted to create the sampling frame. Twenty retailers were
randomly selected from each city, yielding a total sample size of 180 businesses.

3
Figure 4 – Examples of tobacco advertisements (highlighted in red)
Source: Counter Tobacco
Data collectors visited the retailers between April and
June 2014. At each location, they documented the
presence of exterior and interior tobacco advertising,
and counted the total number of advertisements
using Qualtrics survey software on an iPad mini
(Figure 3). Advertisements were defined as any
promotional materials produced by tobacco
companies featuring images of tobacco products or
company logos. These included posters, shelving,
hanging signs, "sandwich" boards, stickers on doors
and windows, etc. (Figure 4). In addition to counting
the total number of tobacco advertisements, field
staff also calculated the proportion of advertisements
that featured an image or descriptor of a menthol or
flavored product.
This project examined marketing and product availability of cigarettes, cigars, smokeless
tobacco, and electronic cigarettes. Cigars included large, premium cigars, little cigars, and
cigarillos (e.g., Black & Mild, Phillies, Swisher Sweets). Smokeless tobacco (SLT) included
moist snuff and snus. Snuff is a form of smokeless tobacco, commonly called “dip,” that is
placed between the lip and the gum. Popular brands include Skoal, Copenhagen, and
Grizzly. Snus is a spit-free form of smokeless tobacco that is contained in teabag-like
pouches and also placed between the lip and the gum. Electronic cigarettes (e-cigs) are
battery-operated products designed to deliver nicotine, flavor, and other chemicals. They
turn chemicals, including nicotine, into an aerosol that is inhaled by the user. For the
purpose of this project, the term e-cigarettes includes products like e-hookahs, hookah
pens, vape pipes, and vape pens.
Figure 3 – Data collection instrument

4
RESULTS – Overall Sample
Tobacco Retail Establishments
Field staff collected data in 163 of the 180 sampled tobacco retail establishments.
Reasons for exclusion included: business not found at address provided (n=5), business
closed (n=2), environment felt unsafe (n=2), data collectors were asked to leave (n=5), and
business did not sell tobacco (n=3).
Most of the sampled retailers were convenience stores without a gas station, and of those,
the majority were “mom and pop” corner stores and bodegas. Drug stores, liquor stores,
convenience stores with a gas station, and grocery stores also comprised a substantial
portion of the sample (Figure 5).
Figure 5 – Business type, % (n=163 businesses)
Convenience
without gas, 41.7
Drug
store/pharmacy,
12.3
Liquor store, 12.3
Convenience with
gas, 11.7
Grocery store, 9.2
Restaurant/bar, 5.5
Dollar store, 3.1
Tobacco shop, 3.1 Other, 1.2

5
Exterior and Interior Advertising
Overall, 62.6% of retailers had at least one exterior advertisement for a tobacco product.
Slightly more than half (54.6%) displayed outdoor cigarette advertisements. Table 1
presents the percentage of businesses that featured exterior and interior promotions for
tobacco products. Interior advertising was more prevalent than exterior advertising,
especially for non-cigarette tobacco products, such as e-cigarettes and cigars. The majority
of retail outlets in the sample (81.6%) had some type of interior tobacco advertising. Almost
half (46.0%) advertised e-cigarettes.
Table 1 - Presence of exterior and interior tobacco advertisements (n=163 retailers)
% with
cigarette ads
% with
e-cigarette ads
% with
cigar ads
% with
smokeless ads
% with ANY
ads
Exterior 54.6 35.6 22.1 7.4 62.6
Interior 77.9 46.0 35.0 17.8 81.6
Field staff counted a total of 625 exterior and 2366 interior advertisements. Most of these
advertisements were for cigarettes, followed by e-cigarettes, cigars, and smokeless tobacco
(Table 2).
Table 2 – Exterior and interior advertisements by product type
Exterior % (n=625) Interior % (n=2366)
Cigarettes 63.2 77.0
E-cigarettes 18.6 10.1
Cigars 13.6 6.7
Smokeless 4.6 6.3

6
Flavoring in Advertisements
Advertisements for smokeless tobacco and cigars were more likely to promote
menthol/flavored products than advertisements for cigarettes or e-cigarettes. Except for
cigars, the percentage of advertisements promoting flavored/menthol products was higher
for exterior advertisements than for interior advertisements. Of note, approximately 44
percent of exterior cigarette advertisements were for menthol products, compared to 33
percent of interior cigarette advertisements (Figure 6).
Figure 6 - Percentage of advertisements promoting menthol/flavored products
Product Availability
Cigars
88.3% of retailers sold cigars
87.1% sold flavored cigars
87.1% sold cigars as single, individually-wrapped sticks
Smokeless
24.5% of retailers sold snuff
12.9% sold snus
E-cigarettes
60.1% of retailers sold e-cigarettes
49.1% sold menthol e-cigarettes
36.8% sold flavored e-cigarettes (e.g., fruit flavors)
43.8
52.9 55.2
43.1
33.0
56.1
47.5
40.2
0
10
20
30
40
50
60
Cigarettes Cigars Smokeless E-cigs
Exterior
Interior

7
Atlantic City
aBlack/African American, Asian, and Other may also have identified as Hispanic/Latino, bAmong those ages
25+, cPer household
Seventeen tobacco retail establishments were surveyed in Atlantic City. Sixty-five percent
were convenience stores not located within a gas station.
Business type, count (n=17)
Convenience
w/o gas, 11
Liquor store,
2
Grocery
store, 3
Tobacco
shop, 1
DEMOGRAPHICS
Total population 39,551
People per square mile 3,680.8
Racea
White, non-Hispanic 16.0%
Black/African American 38.3%
Hispanic/Latino 30.4%
Asian 15.6%
Other 5.4%
Educationb
Less than high school 31.5%
Income
Median incomec $29,886
Below poverty level 29.9%

8
Exterior and Interior Advertising
Most retailers featured exterior advertising (76.5%). Nearly all retailers (94.1%) had at least
one interior advertisement.
Presence of exterior and interior tobacco advertisements (n=17 retailers)
% with
cigarette ads
% with
e-cigarette ads
% with
cigar ads
% with
smokeless ads
% with ANY
ads
Exterior 70.6 52.9 35.3 5.9 76.5
Interior 94.1 47.1 76.5 11.8 94.1
Exterior and interior advertising varied according to tobacco products. The majority of
advertisements were for cigarettes. E-cigarettes were the second most commonly
advertised product.
Exterior and interior advertisements by product type
Exterior % (n=86) Interior % (n=233)
Cigarettes 60.5 81.6
E-cigs 26.7 12.5
Cigars 11.6 3.9
Smokeless 1.2 2.2
Product Availability
The proportion of retailers in Atlantic City that sold e-cigarettes was higher than the overall
sample. However, smokeless tobacco products were available at much lower rates.
Atlantic City Overall Sample
Cigars
Cigars 82.4% 88.3%
Flavored cigars 82.4% 87.1%
Single, individually-wrapped sticks 76.5% 87.1%
Smokeless tobacco
Snuff 11.8% 24.5%
Snus 5.9% 12.9%
E-cigarettes
E-cigarettes 76.5% 60.1%
Menthol e-cigarettes 29.4% 49.1%
Flavored e-cigarettes 52.9% 36.8%

9
Cherry Hill
aBlack/African American, Asian, and Other may also have identified as Hispanic/Latino, bAmong those age
25+, cPer household
Seventeen tobacco retail establishments were surveyed in Cherry Hill. They were
predominantly drug stores and convenience stores.
Business type, count (n=17)
Convenience
w/o gas, 6
Drug store, 6
Convenience w/
gas, 3
Dollar store, 1
Tobacco shop, 1
DEMOGRAPHICS
Total population 70,980
People per square mile 2,945.6
Racea
White, non-Hispanic 74.3%
Black/African American 6.9%
Hispanic/Latino 6.9%
Asian 11.5%
Other 4.6%
Educationb
Less than high school 6.6%
Income
Median incomec $88,450
Below poverty level 4.0%
10
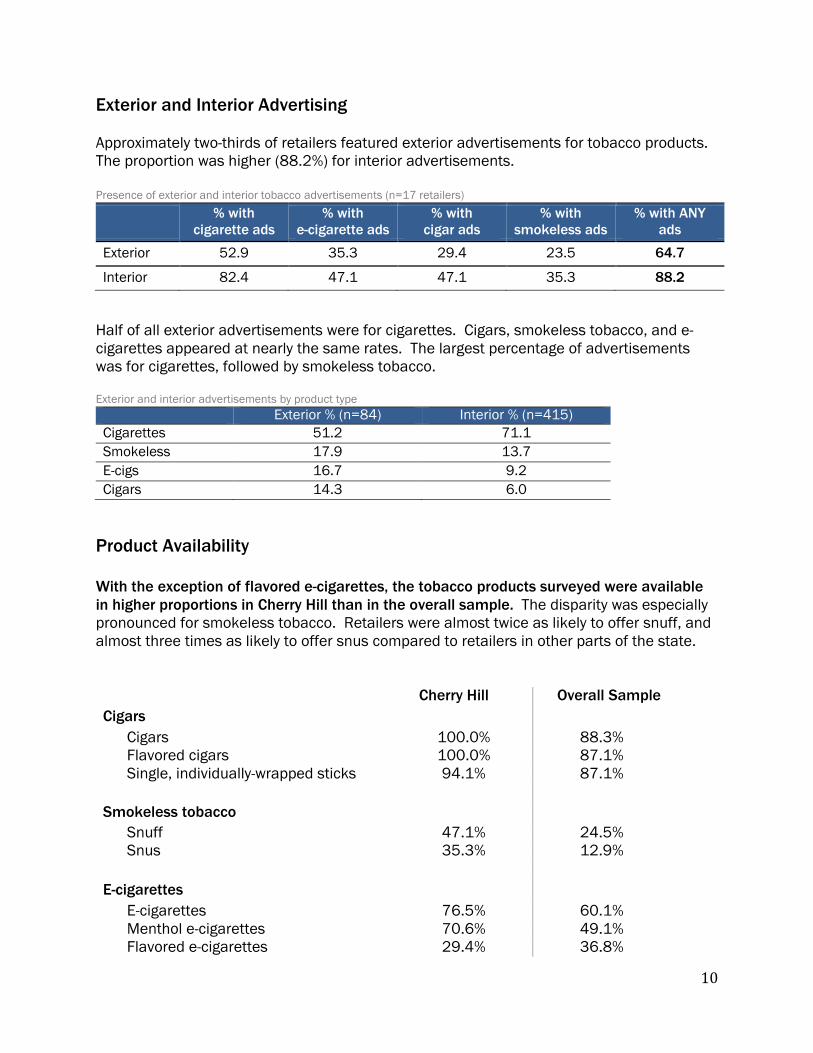
Exterior and Interior Advertising
Approximately two-thirds of retailers featured exterior advertisements for tobacco products.
The proportion was higher (88.2%) for interior advertisements.
Presence of exterior and interior tobacco advertisements (n=17 retailers)
% with
cigarette ads
% with
e-cigarette ads
% with
cigar ads
% with
smokeless ads
% with ANY
ads
Exterior 52.9 35.3 29.4 23.5 64.7
Interior 82.4 47.1 47.1 35.3 88.2
Half of all exterior advertisements were for cigarettes. Cigars, smokeless tobacco, and e-
cigarettes appeared at nearly the same rates. The largest percentage of advertisements
was for cigarettes, followed by smokeless tobacco. Exterior and interior advertisements by product type
Exterior % (n=84) Interior % (n=415)
Cigarettes 51.2 71.1
Smokeless 17.9 13.7
E-cigs 16.7 9.2
Cigars 14.3 6.0
Product Availability
With the exception of flavored e-cigarettes, the tobacco products surveyed were available
in higher proportions in Cherry Hill than in the overall sample. The disparity was especially
pronounced for smokeless tobacco. Retailers were almost twice as likely to offer snuff, and
almost three times as likely to offer snus compared to retailers in other parts of the state.
Cherry Hill Overall Sample
Cigars
Cigars 100.0% 88.3%
Flavored cigars 100.0% 87.1%
Single, individually-wrapped sticks 94.1% 87.1%
Smokeless tobacco
Snuff 47.1% 24.5%
Snus 35.3% 12.9%
E-cigarettes
E-cigarettes 76.5% 60.1%
Menthol e-cigarettes 70.6% 49.1%
Flavored e-cigarettes 29.4% 36.8%

11
Edison
aBlack/African American, Asian, and Other may also have identified as Hispanic/Latino, bAmong those age
25+, cPer household
Seventeen tobacco retail establishments were surveyed in Edison. Over half were
convenience stores.
Business type, count (n=17)
Convenience
w/o gas, 6
Convenience
w/gas , 4
Grocery store, 3
Drug store/
pharmacy, 2
Liquor store, 1
Dollar store, 1
DEMOGRAPHICS
Total population 98,996
People per square mile 3,397.0
Racea
White, non-Hispanic 50.2%
Black/African American 9.8%
Hispanic/Latino 8.5%
Asian 37.5%
Other 0.9%
Educationb
Less than high school 9.2%
Income
Median incomec $80,026
Below poverty level 8.1%

12
Exterior and Interior Advertising
Exterior advertising was present in nearly 60% of retailers. Interior promotions for tobacco
products were displayed at every retail establishment.
Presence of exterior and interior tobacco advertisements (n=17 retailers)
% with
cigarette ads
% with
e-cigarette ads
% with
cigar ads
% with
smokeless ads
% with ANY
ads
Exterior 58.8 41.2 29.4 11.8 58.8
Interior 100.0 82.4 58.8 47.1 100.0
Exterior and interior advertisements were most often for cigarettes. Although far less
dominant, e-cigarettes were second most common.
Exterior and interior advertisements by product type
Exterior % (n=79) Interior % (n=365)
Cigarettes 65.8 71.5
E-cigs 17.7 12.6
Cigars 13.9 9.0
Smokeless 2.5 6.8
Product Availability
Cigar sales for Edison were comparable to that of the overall sample. However, sales of
smokeless tobacco and e-cigarettes were markedly higher than the overall average. Snuff
and snus were more than twice as likely to be available.
Edison Overall Sample
Cigars
Cigars 88.2% 88.3%
Flavored cigars 82.4% 87.1%
Single, individually-wrapped sticks 88.2% 87.1%
Smokeless tobacco
Snuff 64.7% 24.5%
Snus 29.4% 12.9%
E-cigarettes
E-cigarettes 88.2% 60.1%
Menthol e-cigarettes 88.2% 49.1%
Flavored e-cigarettes 64.7% 36.8%

13
Elizabeth
aBlack/African American, Asian, and Other may also have identified as Hispanic/Latino, bAmong those age
25+, cPer household
Seventeen tobacco retail establishments were surveyed in Elizabeth, with convenience
stores representing more than half of all businesses.
Business type, count (n=17)
Convenience w/o
gas, 9
Liquor store, 3
Drug
store/pharmacy,
2
Convenience with
gas, 1
Grocery store, 1
Tobacco shop, 1
DEMOGRAPHICS
Total population 127,558
People per square mile 10,144.4
Racea
White, non-Hispanic 18.2%
Black/African American 21.1%
Hispanic/Latino 59.5%
Asian 2.1%
Other 5.4%
Educationb
Less than high school 27.2%
Income
Median incomec $43,590
Below poverty level 18.8%

14
Exterior and Interior Advertising
The percentage of businesses featuring exterior advertisements for e-cigarettes exceeded
those with advertisements for traditional cigarettes, 64.7% versus 58.8%, respectively. No
retailer exhibited exterior advertising for smokeless tobacco products, while a small
percentage had interior advertisements for the products.
Presence of exterior and interior tobacco advertisements (n=17 retailers)
% with
cigarette ads
% with
e-cigarette ads
% with
cigar ads
% with
smokeless ads
% with ANY
ads
Exterior 58.8 64.7 23.5 0.0 70.6
Interior 70.6 64.7 58.8 11.8 76.5
Most advertisements featured cigarettes and e-cigarettes. By contrast, there were almost
no advertisements observed for smokeless tobacco products.
Exterior and interior advertisements by product type
Exterior % (n=68) Interior % (n=283)
Cigarettes 57.4 77.4
E-cigs 36.8 14.1
Cigars 5.9 6.7
Smokeless 0.0 1.8
Product Availability
The percentage of retailers selling cigars in Elizabeth was similar to proportions in the
overall sample. Snuff was sold at a much lower rate, 5.9% compared to 24.5%.
Elizabeth Overall Sample
Cigars
Cigars 94.1% 88.3%
Flavored cigars 94.1% 87.1%
Single, individually-wrapped sticks 94.1% 87.1%
Smokeless tobacco
Snuff 5.9% 24.5%
Snus 11.8% 12.9%
E-cigarettes
E-cigarettes 76.5% 60.1%
Menthol e-cigarettes 64.7% 49.1%
Flavored e-cigarettes 52.9% 36.8%

15
Newark
aBlack/African American, Asian, and Other may also have identified as Hispanic/Latino, bAmong those age
25+, cPer household
Twenty tobacco retail establishments were surveyed in Newark. Convenience stores and
restaurant/bars comprised 70% of the sample.
Business type, count (n=20)
Convenience w/o
gas, 9
Restaurant/bar,
5
Liquor store, 2
Convenience with
gas, 1
Drug
store/pharmacy,
1
Grocery store, 1
Tobacco shop, 1
DEMOGRAPHICS
Total population 278,427
People per square mile 11,458.2
Racea
White, non-Hispanic 11.6%
Black/African American 52.4%
Hispanic/Latino 33.8%
Asian 1.6%
Other 4.4%
Educationb
Less than high school 29.9%
Income
Median incomec $34,387
Below poverty level 28.0%

16
Exterior and Interior Advertising
Half of all retailers displayed exterior advertisements. Seventy percent exhibited interior
promotions. Retailers did not exhibit advertisements for smokeless tobacco products.
Presence of exterior and interior tobacco advertisements (n=20 retailers)
% with
cigarette ads
% with
e-cigarette ads
% with
cigar ads
% with
smokeless ads
% with ANY
ads
Exterior 30.0 25.0 30.0 0.0 50.0
Interior 60.0 25.0 25.0 0.0 70.0
The percentage of exterior advertisements for cigars (44.2%) was slightly higher than for
cigarettes (42.3%). Conversely, 85.3% of interior advertisements were for cigarettes,
compared with only 6.9% for cigars.
Exterior and interior advertisements by product type
Exterior % (n=52) Interior % (n=116)
Cigarettes 42.3 85.3
Cigars 44.2 6.9
E-cigs 13.5 7.8
Smokeless 0.0 0.0
Product Availability
Newark retailers sold cigars, smokeless tobacco, and e-cigarettes at lower rates than the
overall New Jersey sample. For example, no retailer sold snus, and only 5% sold snuff.
Newark Overall Sample
Cigars
Cigars 70.0% 88.3%
Flavored cigars 65.0% 87.1%
Single, individually-wrapped sticks 70.0% 87.1%
Smokeless tobacco
Snuff 5.0% 24.5%
Snus 0.0% 12.9%
E-cigarettes
E-cigarettes 40.0% 60.1%
Menthol e-cigarettes 35.0% 49.1%
Flavored e-cigarettes 30.0% 36.8%

17
Paterson
aBlack/African American, Asian, and Other may also have identified as Hispanic/Latino, bAmong those age
25+, cPer household
Seventeen tobacco retailers were surveyed in Paterson. They represented a diverse group
of businesses.
Business type, count (n=17)
Convenience w/o
gas, 5
Liquor store, 3
Grocery store, 3
Drug store, 2
Restaurant/bar, 2
Dollar store, 1 Other,
1
DEMOGRAPHICS
Total population 145,948
People per square mile 17,346.8
Racea
White, non-Hispanic 9.2%
Black/African American 31.7%
Hispanic/Latino 57.6%
Asian 3.3%
Other 6.4%
Educationb
Less than high school 28.7%
Income
Median incomec $33,583
Below poverty level 27.6%

18
Exterior and Interior Advertising
Fewer than one third of tobacco retail establishments featured exterior advertising, while
half had interior promotions. Retailers did not exhibit advertisements for smokeless
tobacco products. They also did not display exterior cigar advertisements.
Presence of exterior and interior tobacco advertisements (n=17 retailers)
% with
cigarette ads
% with
e-cigarette ads
% with
cigar ads
% with
smokeless ads
% with ANY
ads
Exterior 23.5 17.6 0.0 0.0 29.4
Interior 47.1 17.6 11.8 0.0 52.9
Most exterior and interior advertisements were for cigarettes. No advertisements featured
smokeless tobacco products, and very few featured cigars. Exterior and interior advertisements by product type
Exterior % (n=23) Interior % (n=64)
Cigarettes 87.0 89.1
E-cigs 13.0 7.8
Cigars 0.0 3.1
Smokeless 0.0 0.0
Product Availability
Paterson retailers sold cigars and e-cigarettes at lower rates than the overall sample.
Smokeless tobacco was not available for sale in the businesses surveyed.
Paterson Overall Sample
Cigars
Cigars 82.4% 88.3%
Flavored cigars 82.4% 87.1%
Single, individually-wrapped sticks 82.4% 87.1%
Smokeless tobacco
Snuff 0.0% 24.5%
Snus 0.0% 12.9%
E-cigarettes
E-cigarettes 35.3% 60.1%
Menthol e-cigarettes 17.6% 49.1%
Flavored e-cigarettes 29.4% 36.8%

19
Perth Amboy
aBlack/African American, Asian, and Other may also have identified as Hispanic/Latino, bAmong those age
25+, cPer household
Twenty-one tobacco retail establishments were surveyed in Perth Amboy, more than half of
which were convenience stores.
Business type, count (n=21)
Convenience w/o
gas, 7
Convenience with
gas, 6
Drug
store/pharmacy,
2
Liquor store, 2
Grocery store, 1
Dollar store , 1
Tobacco shop, 1
Restaurant/bar, 1
DEMOGRAPHICS
Total population 51,982
People per square mile 10,806.9
Racea
White, non-Hispanic 12.0%
Black/African American 10.5%
Hispanic/Latino 78.1%
Asian 1.7%
Other 6.8%
Educationb
Less than high school 31.9%
Income
Median incomec $44,166
Below poverty level 21.2%

20
Exterior and Interior Advertising
Nearly three fourths of retailers displayed exterior advertising for tobacco products. Two
thirds of retailers featured exterior advertisements for cigarettes. The percentage of
businesses displaying advertisements for other tobacco products was substantially lower.
Presence of exterior and interior tobacco advertisements (n=21 retailers)
% with
cigarette ads
% with
e-cigarette ads
% with
cigar ads
% with
smokeless ads
% with ANY
ads
Exterior 66.7 23.8 4.8 4.8 71.4
Interior 81.0 47.6 38.1 19.0 85.7
Cigars and smokeless tobacco comprised only 1.3% of exterior advertisements. Proportions
were higher for interior advertisements, 7.5% and 5.6%, respectively.
Exterior and interior advertisements by product type
Exterior % (n=79) Interior % (n=268)
Cigarettes 83.5 76.9
E-cigs 13.9 10.1
Cigars 1.3 7.5
Smokeless 1.3 5.6
Product Availability
Cigars were available at higher rates in Perth Amboy than in the overall sample. All retailers
surveyed sold cigars. However, smokeless tobacco products were sold at lower rates.
Perth Amboy Overall Sample
Cigars
Cigars 100.0% 88.3%
Flavored cigars 100.0% 87.1%
Single, individually-wrapped sticks 100.0% 87.1%
Smokeless tobacco
Snuff 23.8% 24.5%
Snus 9.5% 12.9%
E-cigarettes
E-cigarettes 57.1% 60.1%
Menthol e-cigarettes 52.4% 49.1%
Flavored e-cigarettes 23.8% 36.8%

21
Trenton
aBlack/African American, Asian, and Other may also have identified as Hispanic/Latino, bAmong those age
25+, cPer household
Eighteen tobacco retail establishments were surveyed in Trenton. Convenience stores
were 72% of the sample.
Business type, count (n=18)
Convenience w/o
gas, 11
Liquor store, 3
Convenience
w/ gas, 2
Drug store, 1
Dollar store, 1
DEMOGRAPHICS
Total population 84,349
People per square mile 11,102.6
Racea
White, non-Hispanic 13.5%
Black/African American 52.0%
Hispanic/Latino 33.7%
Asian 1.2%
Other 4.9%
Educationb
Less than high school 29.5%
Income
Median incomec $36,727
Below poverty level 26.6%

22
Exterior and Interior Advertising
Over 80% of retailers displayed cigarette advertisements. The vast majority of retailers had
exterior and interior advertisements for tobacco products.
Presence of exterior and interior tobacco advertisements (n=18 retailers)
% with
cigarette ads
% with
e-cigarette ads
% with
cigar ads
% with
smokeless ads
% with ANY
ads
Exterior 77.8 27.8 33.3 5.6 83.3
Interior 83.3 33.3 22.2 16.7 83.3
One fourth of exterior advertisements were for cigars. The proportion of exterior and interior
advertisements for cigarettes was substantially higher than for all other products.
Exterior and interior advertisements by product type
Exterior % (n=80) Interior % (n=228)
Cigarettes 60.0 82.0
Cigars 25.0 4.4
E-cigs 13.8 7.5
Smokeless 1.3 6.1
Product Availability
Virtually all retailers in Trenton sold cigars. Although cigars were sold at higher rates than in
the overall sample, smokeless tobacco and e-cigarettes were available at lower rates.
Trenton Overall Sample
Cigars
Cigars 94.4% 88.3%
Flavored cigars 94.4% 87.1%
Single, individually-wrapped sticks 94.4% 87.1%
Smokeless tobacco
Snuff 16.7% 24.5%
Snus 11.1% 12.9%
E-cigarettes
E-cigarettes 38.9% 60.1%
Menthol e-cigarettes 38.9% 49.1%
Flavored e-cigarettes 27.8% 36.8%

23
Vineland
aBlack/African American, Asian, and Other may also have identified as Hispanic/Latino, bAmong those age
25+, cPer household
Nineteen tobacco retail establishments were surveyed in Vineland. Convenience stores,
pharmacies, and liquor stores were equally represented with four locations each.
Business type, count (n=19)
Convenience w/o
gas, 4
Drug
store/pharmacy, 4
Liquor store, 4
Grocery store, 3
Convenience
with gas, 2
Restaurant/bar, 1 Other,
1
DEMOGRAPHICS
Total population 61,050
People per square mile 887.5
Racea
White, non-Hispanic 46.3%
Black/African American 14.2%
Hispanic/Latino 38.0%
Asian 1.7%
Other 4.2%
Educationb
Less than high school 22.0%
Income
Median incomec $52,708
Below poverty level 13.7%

24
Exterior and Interior Advertising
Half of retailers displayed exterior cigarette advertisements. A third featured e-cigarette
advertisements. Eighty-four percent of retailers had interior advertisements for cigarettes,
while half promoted e-cigarettes.
Presence of exterior and interior tobacco advertisements (n=19 retailers)
% with
cigarette ads
% with
e-cigarette ads
% with
cigar ads
% with
smokeless ads
% with ANY
ads
Exterior 52.6 36.8 15.8 15.8 57.9
Interior 84.2 52.6 31.6 21.1 84.2
Cigarettes were the most heavily advertised product. Smokeless tobacco was the second
most prevalent, followed by e-cigarettes and cigars.
Exterior and interior advertisements by product type
Exterior % (n=74) Interior % (n=394)
Cigarettes 71.6 77.9
Cigars 5.4 5.6
Smokeless 12.2 9.4
E-cigs 10.8 7.1
Product Availability
Cigar sales in Vineland were comparable to overall rates. E-cigarettes were sold at lower
rates. Additionally, smokeless tobacco products were more widely available in this city.
Vineland Overall Sample
Cigars
Cigars 84.2% 88.3%
Flavored cigars 84.2% 87.1%
Single, individually-wrapped sticks 84.2% 87.1%
Smokeless tobacco
Snuff 47.4% 24.5%
Snus 15.8% 12.9%
E-cigarettes
E-cigarettes 57.9% 60.1%
Menthol e-cigarettes 47.4% 49.1%
Flavored e-cigarettes 26.3% 36.8%

These graphs compare the prevalence of advertisements in each city to the overall sample (i.e., all 9 cities combined)
City Comparisons – Percentage of Retailers with Exterior Advertising
Cigarettes
Cigars
E-cigarettes
Smokeless
77.8 70.6
66.7 58.8 58.8
54.6 52.9 52.6
30.0 23.5
0
10
20
30
40
50
60
70
80
90
100
35.3 33.3 30.0 29.4 29.4 23.5 22.1
15.8
4.8 0.0
0
10
20
30
40
50
60
70
80
90
100
64.7
52.9
41.2 36.8 35.6 35.3
27.8 25.0 23.8 17.6
0
10
20
30
40
50
60
70
80
90
100
23.5 15.8
11.8 7.4 5.9 5.6 4.8
0.0 0.0 0.0 0
10
20
30
40
50
60
70
80
90
100

These graphs compare the prevalence of advertisements in each city to the overall sample (i.e., all 9 cities combined)
City Comparisons – Percentage of Retailers with Interior Advertising
Cigarettes
Cigars
E-cigarettes
Smokeless
100.0 94.1
84.2 83.3 82.4 81.0 77.9 70.6
60.0
47.1
0
10
20
30
40
50
60
70
80
90
100
76.5
58.8 58.8
47.1
38.1 35.0 31.6 25.0 22.2
11.8
0
10
20
30
40
50
60
70
80
90
100
82.4
64.7
52.6 47.6 47.1 47.1 46.0
33.3 25.0
17.6
0
10
20
30
40
50
60
70
80
90
100
47.1
35.3
21.1 19.0 17.8 16.7 11.8 11.8
0.0 0.0 0
10
20
30
40
50
60
70
80
90
100

These graphs compare the prevalence of advertisements in each city to the overall sample (i.e., all 9 cities combined)
City Comparisons – Percentage of Ads for Flavored/Menthol Products
Cigarettes
Cigars
E-cigarettes
Smokeless
51.9 46.0 43.0 39.7 38.0 34.9 33.5 30.7 29.4
25.4
0
10
20
30
40
50
60
70
80
90
100
73.7 70.3 61.9 60.9
54.9 50.0 50.0 50.0 48.4
33.3
0
10
20
30
40
50
60
70
80
90
100
62.5
50.0 47.7 46.4 42.3 41.1 38.9 36.8
25.0 19.2
0
10
20
30
40
50
60
70
80
90
100 100.0 93.3
59.7 56.3 48.7
33.3 33.3
19.6
0
10
20
30
40
50
60
70
80
90
100

28
Conclusion
This report contains results from a pilot study of 163 tobacco retail establishments in nine
New Jersey cities. The objective was to describe the current landscape for tobacco
advertising and product availability in nine communities. The project explored possible
points of exposure to tobacco products, particularly by adolescents. The businesses
surveyed were located within a half-mile of a middle or high school. There were some
limitations with this study. First, the sample was relatively small. Second, although
businesses within each city were randomly selected, the cities were chosen to reflect
geographic diversity, and were not randomly selected. Nevertheless, the data revealed
several key findings:
Almost two thirds of businesses surveyed displayed exterior advertisements for
tobacco products.
Eighty-two percent of businesses had interior advertisements for tobacco products.
Advertisements for cigarettes predominated with 55% of exterior and 78% of interior
advertisements featuring cigarettes.
There is widespread promotion of flavored and menthol products, particularly among
cigars and smokeless products.
Although electronic cigarettes are relatively new to the tobacco retail environment,
the percentage of advertisements for these products exceeded those for cigars and
smokeless tobacco.
The overwhelming majority of retailers (87.1%) sold flavored, individually-wrapped
cigars. These cigars typically cost less than a dollar per cigar, and come in flavors
such as chocolate, tropical fusion, strawberry, and pink vanilla.
Approximately one fourth of establishments sold snuff and 13% sold snus. However,
there were regional variations among cities, with northern cities (Paterson, Elizabeth,
and Newark) less likely to sell smokeless tobacco products.
Regional variations in the sale of electronic cigarettes/electronic hookahs were also
observed. Retailers in Newark, Paterson, and Trenton were less likely to offer these
products.
The findings of this observational study are limited by the small sample size and the fact
that it was conducted in nine cities, and as such is not generalizable. Despite these
limitations, the data underscore need for further analyses with larger, more representative
samples to better understand tobacco marketing and point of sale at a statewide level.
Future research will benefit from examining variations in patterns of point of sale tobacco
advertising among communities over time. Overall, this report describes the tobacco retail
environment around schools in our sample and may potentially contribute to the
identification and development of policy options for regulating the sale and marketing of
tobacco products, especially to minors.

29
References
1 Federal Trade Commission Cigarette Report for 2011. Federal Trade Commission.
2013. http://www.ftc.gov/sites/default/files/documents/reports/federal-trade-
commission-cigarette-report-2011/130521cigarettereport.pdf. Accessed June 16,
2014.
2 Federal Trade Commission Smokeless Tobacco Report for 2011. Federal Trade
Commission. 2013.
http://www.ftc.gov/sites/default/files/documents/reports/federal-trade-
commission-smokeless-tobacco-report-2011/130521smokelesstobaccoreport.pdf.
Accessed June 16, 2014.
3 Paynter J, Edwards R. The impact of tobacco promotion at the point of sale: a
systematic review. Nicotine Tob Res. 2009;11(1):25-35. doi: 10.1093/ntr/ntn002.
4 Slater SJ, Chaloupka FJ, Wakefield M, Johnston LD, O’Malley PM. The impact of retail
cigarette marketing practices on youth smoking uptake. Arch Pediatr Adolesc Med.
2007;161(5):440-445. doi:10.1001/archpedi.161.5.440.
5 McCarthy WJ, Mistry R, Lu Y, Patel M, Zheng H, Dietsch B. Density of tobacco retailers
near schools: effects on tobacco use among students. Am J Public Health.
2009;99(11):2006-2013. doi: 10.2105/AJPH.2008.145128.
6 Henriksen L, Feighery EC, Wang Y, Fortmann SP. Association of retail tobacco
marketing with adolescent smoking. Am J Public Health. 2004;94(12):2081-2083.
7 National Cancer Institute. The role of the media in promoting and reducing tobacco
use. U.S. Department of Health and Human Services. 2008.
http://cancercontrol.cancer.gov/brp/tcrb/monographs/19/m19_complete.pdf.
Accessed June 18, 2014.
8 U.S. Department of Health and Human Services. Preventing tobacco use among
youth and young adults: A report of the Surgeon General. U.S. Department of Health
and Human Services, Centers for Disease Control and Prevention, National Center for
Chronic Disease Prevention and Health Promotion, Office on Smoking and Health.
2012. http://www.surgeongeneral.gov/library/reports/preventing-youth-tobacco-
use/full-report.pdf. Accessed June 18, 2014.
9 Centers for Disease Control and Prevention. Youth risk behavior surveillance – United
States, 2013. MMWR. 2014;63(4):13-17.
http://www.cdc.gov/mmwr/pdf/ss/ss6304.pdf. Accessed June 18, 2014.
10 New Jersey State Police. Crime trend feedback. June 13, 2014.
http://www.njsp.org/info/pdf/ucr/current/061314_crimetrend.pdf. Accessed June
14, 2014.