new layout - 01
TRANSCRIPT

Note 2016 2015(Rupees in ‘000)
ASSETSNON-CURRENT ASSETS
Property, plant and equipment 7 651,261 599,204 Intangible assets 8 8,940 8,256 Investment property 9 1,018 1,021 Long-term investments 10 4,342,212 4,065,195 Long-term loans 11 60,446 5,171 Long-term deposits 12 8,119 7,953 Deferred tax asset - net 13 297,640 84,253
5,369,636 4,771,053 CURRENT ASSETS
Stores, spares and loose tools 14 83,123 84,299 Stock-in-trade 15 2,764,329 2,295,029 Trade debts 16 1,003,946 1,118,354 Loans and advances 17 40,651 21,882 Trade deposits and short-term prepayments 18 37,348 70,010 Interest accrued 2,748 3,911 Other receivables 19 3,747 14,273 Short-term investments 20 3,678,355 3,104,278 Income tax - net 21 279,216 139,141 Sales tax refundable 20,367 - Cash and bank balances 22 402,159 507,726
8,315,989 7,358,903 TOTAL ASSETS 13,685,625 12,129,956
EQUITY AND LIABILITIES SHARE CAPITAL AND RESERVES
Authorised capital 100,000,000 (2015: 100,000,000) ordinary shares of Rs.5/- each 500,000 500,000
Issued, subscribed and paid-up capital 23 405,150 405,150 Reserves 24 11,822,428 10,366,720
12,227,578 10,771,870
NON-CURRENT LIABILITIES
Long-term deposits 25 1,624 1,714
CURRENT LIABILITIES
Trade and other payables 26 1,433,591 1,326,002 Short-term running finance 27 22,790 14,556 Accrued markup 42 55 Sales tax payable - 15,759
1,456,423 1,356,372
CONTINGENCIES AND COMMITMENTS 28
TOTAL EQUITY AND LIABILITIES 13,685,625 12,129,956
The annexed notes from 1 to 49 form an integral part of these financial statements.
ASIF RIZVICHIEF EXECUTIVE
SOHAIL P. AHMEDVICE CHAIRMAN
Balance SheetAs at June 30, 2016
62 Celebrating our 50th Year

Note 2016 2015(Rupees in ‘000)
Revenue - net 29 15,266,439 15,548,791
Cost of sales 30 11,897,093 12,604,896
Gross profit 3,369,346 2,943,895
Distribution costs 31 (249,291) (198,503)Administrative expenses 32 (572,773) (476,175)Other charges 33 (731,906) (217,356)
(1,553,970) (892,034)
Other income 34 1,167,489 898,102
Operating profit 2,982,865 2,949,963
Finance costs 35 (3,820) (4,749)
Profit before taxation 2,979,045 2,945,214
Taxation 36 (800,227) (796,301)
Profit after taxation 2,178,818 2,148,913
(Rupees)
Basic and diluted earnings per share 37 26.89 26.52
The annexed notes from 1 to 49 form an integral part of these financial statements.
ASIF RIZVICHIEF EXECUTIVE
SOHAIL P. AHMEDVICE CHAIRMAN
Profit and Loss AccountFor the year ended June 30, 2016
63Thal Annual Report 2016

2016 2015(Rupees in ‘000)
Profit after taxation for the year 2,178,818 2,148,913
Other comprehensive incomeItem to be reclassified to profit and loss account in subsequent periods:(Loss) / gain on revaluation of available-for-sale investments - net of tax (14,097) 14,519
Total comprehensive income for the year 2,164,721 2,163,432
The annexed notes from 1 to 49 form an integral part of these financial statements.
ASIF RIZVICHIEF EXECUTIVE
SOHAIL P. AHMEDVICE CHAIRMAN
Statement Of Comprehensive IncomeFor the year ended June 30, 2016
64 Celebrating our 50th Year

Note 2016 2015 (Rupees in ‘000)
CASH FLOWS FROM OPERATING ACTIVITIES Cash generated from operations 38 1,657,419 2,638,145 Finance costs paid (3,833) (4,728) Retirement benefits paid (2,356) (3,529) Income tax paid (837,197) (680,672) Long-term loans (55,275) 2,258 Long-term deposits - net (256) - Net cash generated from operating activities 758,502 1,951,474
CASH FLOWS FROM INVESTING ACTIVITIES Fixed capital expenditure (173,111) (119,239) Proceeds from disposal of operating fixed assets 12,610 10,466 Investment in a subsidiary - (100) Investment made during the year (514,999) (396,669) Redemption of short-term investments 33,259 44,834 Dividends received 852,567 663,683 Interest received 188,016 100,430 Net cash generated from investing activities 398,342 303,405 CASH FLOWS FROM FINANCING ACTIVITIES Dividends paid (704,796) (793,338) Net cash used in financing activities (704,796) (793,338)
NET INCREASE IN CASH AND CASH EQUIVALENTS 452,048 1,461,541
CASH AND CASH EQUIVALENTS AT THE BEGINNING OF THE YEAR 3,590,878 2,129,337
CASH AND CASH EQUIVALENTS AT THE END OF THE YEAR 39 4,042,926 3,590,878
The annexed notes from 1 to 49 form an integral part of these financial statements.
ASIF RIZVICHIEF EXECUTIVE
SOHAIL P. AHMEDVICE CHAIRMAN
Cash Flow StatementFor the year ended June 30, 2016
65Thal Annual Report 2016

Balance as at June 30, 2014 405,150 55,704 7,906,999 956,900 93,986 9,418,739
Transfer to general reserve - - 754,000 (754,000) - -
Final dividend @ Rs. 2.50/- per share for the year ended June 30, 2014 - - - (202,575) - (202,575)
First Interim dividend @ Rs. 3.75/- per share for the year ended June 30, 2015 - - - (303,863) - (303,863)
Second Interim dividend @ Rs. 3.75/- per share for the year ended June 30, 2015 - - - (303,863) - (303,863) - - - (810,301) - (810,301)
Profit for the year - - - 2,148,913 - 2,148,913
Other comprehensive income - - - - 14,519 14,519 Total comprehensive income for the year - - - 2,148,913 14,519 2,163,432
Balance as at June 30, 2015 405,150 55,704 8,660,999 1,541,512 108,505 10,771,870
Transfer to general reserve - - 1,136,000 (1,136,000) - - Final dividend @ Rs. 5.00/- per share for the year ended June 30, 2015 - - - (405,150) - (405,150)
Interim dividend @ Rs. 3.75/- per share for the year ended June 30, 2016 - - - (303,863) - (303,863) - - - (709,013) - (709,013)
Profit for the year - - - 2,178,818 - 2,178,818 Other comprehensive income - - - - (14,097) (14,097)Total comprehensive income for the year - - - 2,178,818 (14,097) 2,164,721
Balance as at June 30, 2016 405,150 55,704 9,796,999 1,875,317 94,408 12,227,578
The annexed notes from 1 to 49 form an integral part of these financial statements.
Issued, subscribed and paid-up
capital
Capital reserves
General reserve
Unappropriated profit
Reserves
Total equity
Gain / (loss) on changes in fair value of available
-for-sale investments
(Rupees in ‘000)
ASIF RIZVICHIEF EXECUTIVE
SOHAIL P. AHMEDVICE CHAIRMAN
Statement of Changes in EquityFor the year ended June 30, 2016
66 Celebrating our 50th Year

1. THE COMPANY AND ITS OPERATIONS
1.1 Thal Limited (the Company) was incorporated on January 31, 1966 as a public company limited by shares under the Companies Act, 1913 (now the Companies Ordinance, 1984) and is listed on the Pakistan Stock Exchange (formerly Karachi and Lahore Stock Exchanges).
The Company is engaged in the manufacture of jute goods, engineering goods, papersack and laminate sheets. The jute operations are located at Muzaffargarh, engineering operations at Karachi, papersack operations at Hub and Gadoon and laminate operations at Hub. The registered office of the Company is situated at 4th Floor, House of Habib, 3-Jinnah Co-operative Housing Society, Block 7/8, Sharae Faisal, Karachi.
1.2 These financial statements are separate financial statements of the Company in which investments in subsidiaries and associates are accounted for on the basis of direct equity interest and are not consolidated or accounted for by using equity method of accounting.
2. STATEMENT OF COMPLIANCE
These financial statements have been prepared in accordance with approved accounting standards as applicable in Pakistan. Approved accounting standards comprise of such International Financial Reporting Standards (IFRSs) issued by the International Accounting Standards Board and Islamic Financial Accounting Standards (IFASs) issued by the Institute of Chartered Accountants of Pakistan as are notified under the Companies Ordinance, 1984, provisions of and directives issued under the Companies Ordinance, 1984. In case requirements differ, the provisions or directives of the Companies Ordinance, 1984 shall prevail.
3. BASIS OF MEASUREMENT
3.1 These financial statements have been prepared under the historical cost convention, except for certain investments which are measured at fair value as required under IAS – 39 “Financial Instruments: Recognition and Measurement” as disclosed in note 20 to these financial statements.
3.2 These financial statements are presented in Pak Rupees which is also the Company’s functional currency.
4. SUMMARY OF SIGNIFICANT ACCOUNTING POLICIES
4.1 New / Revised Standards, Interpretations and Amendments
The Company has adopted the following revised standards, amendments and interpretations of IFRSs which became effective for the current year: IFRS 10 – Consolidated Financial Statements IFRS 11 – Joint Arrangements IFRS 12 – Disclosure of Interests in Other Entities IFRS 13 – Fair Value Measurement IAS 28 – Investments in Associates and Joint Ventures
The adoption of the above amendments to accounting standards and interpretations did not have any material effect on the financial statements.
In addition to the above standards and interpretations, certain improvements to various accounting standards have also been issued by the IASB and are generally effective for current period. The Company expects that such improvements to the standards do not have any impact on the Company’s financial statements for the period.
4.2 Property, plant and equipment
Operating assets
These are stated at cost less accumulated depreciation / amortisation and impairment loss, if any, except for freehold land and capital work-in-progress which are stated at cost.
Notes to the Financial StatementsFor the year ended June 30, 2016
67Thal Annual Report 2016

Depreciation / amortisation is charged to the profit and loss account applying the reducing balance method except for computer equipment and jigs and fixtures which are depreciated / amortised on straight line method at the rates specified in note 7 to the financial statements. Depreciation / amortisation on additions is charged from the month of addition and in case of deletion, up to the month preceding the month of disposal.
Leasehold land is amortised in equal installments over the lease period.
Maintenance and normal repairs are charged to profit and loss account as and when incurred. Major renewals and improvements are capitalized and the assets so replaced, if any, are retired.
An item of property, plant and equipment and any significant part initially recognised is derecognised upon disposal or when no future economic benefits are expected from its use or disposal. Any gain or loss arising on derecognition of the asset (calculated as the difference between the net disposal proceeds and the carrying amount of the asset) is included in the profit and loss account when the asset is derecognised.
The residual values, useful lives and methods of depreciation of property, plant and equipment are reviewed at each financial year end and adjusted prospectively, if appropriate.
Capital work-in-progress
All expenditures connected to the specific assets incurred during installation and construction period are carried under capital work-in-progress. These are transferred to specific assets as and when assets are available for use.
4.3 Intangibles
These are stated at cost less accumulated amortisation and impairment loss, if any.
Costs in relation to intangible assets are only capitalised when it is probable that future economic benefits attributable to that asset will flow to the Company and the same is amortised applying the straight line method at the rates stated in note 8 to these financial statements.
4.4 Investment property
Investment property is stated at cost less accumulated depreciation and impairment loss, if any. Depreciation is charged on reducing balance method at the rate specified in note 9 to the financial statements.
4.5 Impairment
Non-financial assets
The carrying values of assets are reviewed for impairment when events or changes in circumstances indicate that the carrying value may not be recoverable. If any such indication exists and where the carrying values exceed the estimated recoverable amount, the assets or related cash-generating units are written down to their recoverable amount.
Financial assets
A financial asset is assessed at each reporting date to determine whether there is any objective evidence that it is impaired. A financial asset is considered to be impaired if objective evidence indicates that one or more events have had a negative effect on the estimated future cash flows of that asset.
Individually significant financial assets are tested for impairment on an individual basis. The remaining financial assets are assessed collectively in groups that share similar credit characteristics.
All impairment assets are recognised in the profit and loss account. An impairment loss is reversed if the reversal can be related objectively to an event accruing after the impairment loss was recognised.
Notes to the Financial StatementsFor the year ended June 30, 2016
68 Celebrating our 50th Year

4.6 Investments
Subsidiaries and associates
Investment in shares of the Company’s subsidiaries and associates is stated at cost. Provision is made for impairment, if any, in the carrying value of the investment.
Others
Held-to-maturity
These represent non-derivative financial assets with fixed or determinable payments and fixed maturities in respect of which the Company has the positive intent and ability to hold till maturity. These investments are recognised initially at fair value plus directly attributable costs and are subsequently measured at amortised cost using effective interest rate method. Gains and losses are recognised in profit and loss account when the investments are derecognised or impaired, as well as through the amortisation process.
At fair value through profit or loss
Investments at fair value through profit or loss are initially recognised at fair value. Subsequently, these are measured at fair value whereas effects of changes in fair value are taken to the profit and loss account.
Available-for-sale
These are non-derivative financial assets which are intended to be held for an indefinite period of time but may be sold in response to the need for liquidity or changes in interest rates.
Quoted
These investments are initially measured at fair value plus transaction costs and subsequently carried at fair value. Changes in fair value are taken to a separate component of other comprehensive income until the investment is derecognised or determined to be impaired, at which time the cumulative gain or loss recorded in other comprehensive income is recognised in profit and loss account.
Un-Quoted
These investments are recorded at cost less accumulated impairment loss, if any.
4.7 Stores, spares and loose tools
Stores, spares and loose tools are stated at cost which is determined by the weighted moving average cost method except for those in transit which are valued at actual cost. Provision is made for slow moving and obsolete items.
4.8 Stock-in-trade
Stock-in-trade, except goods-in-transit, is stated at the lower of Net Realisable Value (NRV) and cost determined as follows:
Raw and packing materials - Purchase cost on weighted moving average basis Work-in-process - Cost of materials, labour cost and appropriate production overheads Finished goods - Cost of materials, labour cost and appropriate production overheads
Goods-in-transit are valued at purchase price, freight value and other charges incurred thereon upto the balance sheet date.
NRV signifies the estimated selling price in the ordinary course of business less the estimated costs of completion and the estimated costs necessary to make the sale. Provision is made for slow moving and obsolete items.
Notes to the Financial StatementsFor the year ended June 30, 2016
69Thal Annual Report 2016

4.9 Trade debts and other receivables
Trade debts originated by the Company are recognised and carried at original invoice amount less provision for impairment. Provision for doubtful debts is based on the management’s assessment of customers’ outstandings and creditworthiness. Bad debts are written-off as and when identified.
Other receivables are carried at cost less provision for doubtful receivables, if any.
4.10 Ijarah rentals
Ijarah payments for assets under Ijarah (lease) agreements are recognised as an expense in the profit and loss account on a straight line basis over the Ijarah term.
4.11 Cash and cash equivalents
For the purpose of cash flow statement, cash and cash equivalents comprise of cash in hand, bank balances and short-term investments with a maturity of three months or less from the date of acquisition net of short-term borrowings. The cash and cash equivalents are readily convertible to known amount of cash and are therefore subject to insignificant risk of changes in value.
4.12 Taxation
(a) Current
The charge for current taxation in respect of certain income streams of the Company is based on Final Tax Regime at the applicable tax rates and remaining income streams at current rate of taxation under the normal tax regime after taking into account tax credits and rebates available, if any, 1% of turnover or 17% alternate corporate tax, whichever is higher. The Company had also availed Group tax relief under the provisions of Section 59AA and 59B of the Income Tax Ordinance, 2001 as explained in note 21 to these financial statements.
(b) Deferred
Deferred tax is provided using the balance sheet liability method, on all temporary differences at the balance sheet date between the tax bases of assets and liabilities and their carrying amounts for financial reporting purposes.
Deferred tax liabilities are recognised for all taxable temporary differences. Deferred tax assets are recognised for all deductible temporary differences, carry-forward of unused tax assets and unused tax losses, to the extent that it is probable that taxable profit will be available against which the deductible temporary differences, carry forward of unused tax assets and unused tax losses can be utilized.
The carrying amount of deferred tax assets is reviewed at each balance sheet date and reduced to the extent that it is no longer probable that sufficient taxable profit will be available to allow all or part of the deferred income tax assets to be utilized. Unrecognised deferred tax assets are re-assessed at each balance sheet date and are recognised to the extent that it has become probable that future taxable profit will allow deferred tax asset to be recovered.
Deferred tax assets and liabilities are measured at the tax rates that are expected to apply to the period when the asset is realised or the liability is settled, based on tax rates (and tax laws) that have been enacted or substantively enacted at the balance sheet date.
4.13 Trade and other payables
Liabilities for trade and other amounts payable are carried at cost which is the fair value of the consideration to be paid in the future for goods and services received, whether or not billed to the Company.
4.14 Borrowing costs
Borrowing costs that are directly attributable to the acquisition and construction of assets and incurred during the period in connection with the activities necessary to prepare the asset for its intended use are capitalised as a part of the cost of related asset.
All other borrowing costs are recognised as an expense in the period in which they are incurred.
Notes to the Financial StatementsFor the year ended June 30, 2016
70 Celebrating our 50th Year

4.15 Staff retirement benefits
Defined contribution plan
Provident fund
The Company operates a recognised provident fund for its permanent employees. Equal monthly contributions are made to the fund by the Company and the employees in accordance with the rules of the scheme. The Company has no further obligation once the contributions have been paid. The contributions made by the Company are recognised as employee benefit expense when they are due.
Retirement benefit fund
The Company operates an approved funded scheme for retirement benefits for all employees on the basis of defined contribution made by the Company on attaining the retirement age with a minimum qualifying period of ten years which is managed by a Trust.
4.16 Compensated absences
Accrual is made for employees’ compensated absences on the basis of accumulated leaves and the last drawn pay. No actuarial valuation of compensated absences is carried out as the management considers that the financial impact is not material.
4.17 Provisions
General
Provisions are recognised in the balance sheet where the Company has a legal or constructive obligation as a result of past event, it is probable that outflow of resources embodying economic benefits will be required to settle the obligation and a reliable estimate of the amount can be made. Provisions are reviewed at each balance sheet date and adjusted to reflect current best estimate.
Warranty obligations
The Company recognises the estimated liability to repair or replace products under warranty at the balance sheet date. These are recognised when the product is sold or service provided to the customer. Initial recognition is based on historical experience. The initial estimate of warranty-related costs is reviewed annually and adjusted, if required.
4.18 Revenue recognition
Revenue
Revenue from the sale of goods is recognised when the significant risks and rewards of ownership of the goods have passed to the buyer, which is usually on dispatch of the goods.
Other income
- Dividend income is recognised when the right to receive the dividend is established. - Interest on Term Deposit Receipts is recognised on constant rate of return to maturity. - Interest on bank deposits are recognised on accrual basis.- Rental income arising from investment property is accounted for on a straight-line basis over the lease term.
4.19 Foreign currency transactions
Foreign currency transactions are translated into Pak Rupees at the exchange rates prevailing on the date of transaction. Monetary assets and liabilities in foreign currencies are translated into Pak Rupees at the exchange rates prevailing at the reporting date. Non-monetary items that are measured in terms of historical cost in a foreign currency are translated using the exchange rates at the dates of the initial transactions. Non-monetary items measured at fair value in a foreign currency are translated using exchange rates at the date when the fair value was determined. Exchange gains or losses are included in profit and loss account of the current period.
Notes to the Financial StatementsFor the year ended June 30, 2016
71Thal Annual Report 2016

4.20 Financial instruments
Financial assets and financial liabilities
Financial assets and financial liabilities are recognised at the time when the Company becomes a party to the contractual provision of the instrument. Financial assets are de-recognised when the contractual right to future cash flows from the asset expires or is transferred along with the risk and reward of ownership of the asset. Financial liabilities are de-recognised when obligation is discharged, cancelled or expired. Any gain or loss on de-recognition of the financial asset and liability is recognised in the profit and loss account of the current period.
Offsetting
Financial assets and financial liabilities are set off and the net amount is reported in the financial statements only when the Company has a legally enforceable right to set off and the Company intends to either settle on a net basis, or to realize the assets and to settle the liabilities simultaneously. Income and expense items of such assets and liabilities are also offset and the net amount is reported in the financial statements.
4.21 Research and development expenditure
Research expenditure is recognised as an expense as incurred. Costs incurred on development projects are recognised as intangible assets to the extent that such expenditure is expected to generate future economic benefits. Other development expenditure is recognised as an expense as incurred.
4.22 Dividends and appropriation to reserves
The Company recognises a liability for dividend to equity holder when it is authorized as per corporate laws in Pakistan. The transfer of reserves within the equity are recognised when these are approved as per the applicable laws.
5. SIGNIFICANT ACCOUNTING JUDGEMENTS, ESTIMATES AND ASSUMPTIONS
The preparation of the Company’s financial statements requires management to make judgments, estimates and assumptions that affect the reported amounts of revenues, expenses, assets and liabilities, and the disclosure of contingent liabilities, at the end of the reporting period. However, uncertainty about these assumptions and estimates could result in outcomes that require a material adjustment to the carrying amount of the asset or liability affected in future periods.
In the process of applying the accounting policies, management has made the following judgments, estimates and assumptions which are significant to the financial statements:
Notes
- determining the residual values, useful lives and impairment of property, plant 4.2, 4.4, 7 & 9 and equipment and investment property - determining the residual values, useful lives and impairment of intangibles assets 4.3 & 8 - impairment of financial and non-financial assets 4.5 - provision for slow moving stores, spares and loose tools and stock-in-trade 4.7, 4.8, 14 & 15 - provision for doubtful debts and other receivables 4.9 & 16 - provision for tax and deferred tax 4.12, 13, 21 & 36 - provision for compensated absences 4.16 - provision and warranty obligations 4.17 & 26.3 - contingencies 28
Notes to the Financial StatementsFor the year ended June 30, 2016
72 Celebrating our 50th Year

6. STANDARDS, INTERPRETATIONS AND AMENDMENTS TO APPROVED ACCOUNTING STANDARDS THAT ARE NOT YET EFFECTIVE
The following amendments and interpretations with respect to the approved accounting standards as applicable in Pakistan would be effective from the dates mentioned below against the respective standard or interpretation:
Effective date(annual periods
beginning onStandard or Interpretation or after)
IFRS 2 - Share-based Payments - Classification and Measurement of Share-based Payments Transactions (Amendments) 01 January 2018
IFRS 10 - Consolidated Financial Statements, IFRS 12 Disclosure of Interests inOther Entities and IAS 28 Investment in Associates and Joint Ventures -
Investment Entities: Applying the Consolidation Exception (Amendment) 01 January 2016 IFRS 10 - Consolidated Financial Statements and IAS 28 Investment in Associates
and Joint Ventures - Sale or Contribution of Assets between an Investorand its Associate or Joint Venture (Amendment) Not yet finalized
IFRS 11 - Joint Arrangements - Accounting for Acquisition of Interest in Joint Operation (Amendment) 01 January 2016
IAS 1 - Presentation of Financial Statements - Disclosure Initiative (Amendment) 01 January 2016 IAS 7 - Financial Instruments: Disclosures - Disclosure Initiative (Amendment) 01 January 2017 IAS 12 - Income Taxes - Recognition of Deferred Tax Assets for Unrealized
losses (Amendments) 01 January 2017 IAS 16 - Property, Plant and Equipment and IAS 38 Intangible assets Clarification
of Acceptable method of Depreciation and Amortization (Amendment) 01 January 2016 IAS 16 - Property, Plant and Equipment IAS 41 Agriculture - Agriculture: Bearer
Plants (Amendment) 01 January 2016 IAS 27 - Separate Financial Statements - Equity Method in Separate
Financial Statements (Amendment) 01 January 2016
The Company expects that the adoption of the above standards and amendments would not impact the Company’s financial statements in the period of initial application.
In addition to the above standards and amendments, improvements to various accounting standards have also been issued by the IASB. Such improvements are generally effective for accounting periods beginning on or after 01 Jan-uary 2016 . The Company expects that such improvements to the standards will not have any material impact on the Company’s financial statements in the period of initial application.
Further, following new standards have been issued by IASB which are yet to be notified by the SECP for the purpose of applicability in Pakistan.
IASB Effective date
(annual periods beginning
Standards on or after)
IFRS 9 – Financial Instruments: Classification and Measurement 01 January 2018 IFRS 14 – Regulatory Deferral Accounts 01 January 2016 IFRS 15 – Revenue from Contracts with Customers 01 January 2018 IFRS 16 – Leases 01 January 2018
Notes to the Financial StatementsFor the year ended June 30, 2016
73Thal Annual Report 2016

No
te20
1620
15(R
upee
s in
‘000
)7.
P
RO
PE
RT
Y, P
LA
NT
AN
D E
QU
IPM
EN
T
Ope
ratin
g fix
ed a
sset
s 7.
1 58
3,65
8 5
78,0
52
Cap
ital w
ork-
in-p
rogr
ess
7.5
67,
603
2
1,15
2 6
51,2
61
599
,204
7.1
Op
erat
ing
fix
ed a
sset
s
W R
I T
T E
ND
O W
NC
O
S
T
D
E P
R E
C I
A T
I O
N /
A M
O R
T I
S A
T I
O N
V
A L
U E
As
at
As
at
As
at
As
at
As
at
July
01,
A
dd
itio
ns
Jun
e 30
, Ju
ly 0
1,
Ch
arg
e fo
r O
n
Jun
e 30
, Ju
ne
30,
2015
(N
ote
7.1
.1)
Dis
po
sals
20
16
Rat
e 20
15
the
year
d
isp
osa
ls
2016
20
16
(Rup
ees
in ‘0
00)
%
(Rup
ees
in ‘0
00)
Land
- F
reeh
old
5,0
12
-
-
5,0
12
-
-
-
-
-
5,0
12
-
Leas
ehol
d
21,
829
-
-
2
1,82
9
3 4
,189
4
92
-
4,6
81
17,
148
Bui
ldin
g on
free
hold
land
-
Fact
ory
build
ing
270
,035
1
,900
-
2
71,9
35
10
161
,838
1
0,83
6
-
172
,674
9
9,26
1
-
Non
fact
ory
build
ing
62,
486
-
-
6
2,48
6
5-1
0
25,
041
3
,744
-
2
8,78
5
33,
701
Rai
lway
slid
ing
792
-
-
7
92
5 7
16
3
-
719
7
3
Pla
nt a
nd m
achi
nery
1
,061
,408
4
9,94
0
(8,
796)
1
,102
,552
1
0-30
7
51,4
64
59,
188
(
8,00
7)
802
,645
2
99,9
07
Fur
nitu
re a
nd fi
tting
s 2
5,77
5
753
(
284)
2
6,24
4
15-
20
16,
143
1
,501
(
250)
1
7,39
4
8,8
50
Veh
icle
s 7
4,25
3
3,6
28
(8,
514)
6
9,36
7
20
37,
257
7
,359
(
5,69
8)
38,
918
30,
449
Offi
ce a
nd m
ills
equi
pmen
t 5
6,39
3
25,
707
(
242)
8
1,85
8
10-
30
35,
673
5
,884
(
161)
4
1,39
6
40,
462
Com
pute
r eq
uipm
ent
79,
401
7
,259
(
10,7
61)
75,
899
33
.33
57,
858
9
,383
(
10,6
99)
56,
542
1
9,35
7
Jigs
and
fixt
ures
1
46,9
10
33,
273
-
1
80,1
83
33.3
3 1
36,0
63
14,
682
-
1
50,7
45
29,
438
2
016
1,80
4,29
4
122
,460
(
28,5
97)
1,89
8,15
7
1,2
26,2
42
113
,072
(
24,8
15)
1,3
14,4
99
58
3,65
8
Not
es to
the
Fina
ncia
l Sta
tem
ents
For t
he y
ear e
nded
Jun
e 30
, 201
6
74 Celebrating our 50th Year

W R
I T
T E
N
D
O W
N
C
O
S
T
D
E P
R E
C I
A T
I O
N /
A M
O R
T I
S A
T I
O N
V
A L
U E
As
at
As
at
A
s at
A
s at
A
s at
Ju
ly 0
1,
Ad
dit
ion
s
Jun
e 30
,
July
01,
C
har
ge
for
On
Ju
ne
30,
Jun
e 30
,
2014
(N
ote
7.1
.1)
Dis
po
sals
20
15
Rat
e 20
14
the
year
d
isp
osa
ls
2015
20
15
(Rup
ees
in ‘0
00)
%
(Rup
ees
in ‘0
00)
La
nd -
Fre
ehol
d 5,
012
-
-
5
,012
-
-
-
-
-
5
,012
- L
ease
hold
2
1,82
9
-
-
21,
829
3
3,6
98
491
-
4,1
89
17,
640
B
uild
ing
on fr
eeho
ld la
nd
- F
acto
ry b
uild
ing
270
,035
-
-
2
70,0
35
10
149
,814
1
2,02
4
-
1
61,8
38
108
,197
- N
on fa
ctor
y bu
ildin
g 6
2,48
6
-
-
6
2,48
6
5-1
0
20,
881
4
,160
-
25,
041
3
7,44
5
R
ailw
ay s
lidin
g 7
92
-
-
792
5
712
4
-
716
7
6
P
lant
and
mac
hine
ry
1,0
20,3
24
41,
084
-
1,06
1,40
8
10-
30
688
,587
6
2,87
7
-
75
1,46
4
309
,944
F
urni
ture
and
fitti
ngs
23,
672
2
,103
-
25,
775
1
5-20
1
4,68
7
1,4
56
-
1
6,14
3
9,6
32
V
ehic
les
58,
650
2
6,86
7
(11
,264
) 7
4,25
3
20
37,
390
6
,700
(
6,83
3)
37,
257
3
6,99
6
O
ffice
and
mill
s eq
uipm
ent
51,
183
5
,346
(
136)
5
6,39
3
10-3
0 3
2,26
0
3,5
07
(94
) 3
5,67
3
20,
720
C
ompu
ter
equi
pmen
t 5
9,00
3
21,
745
(
1,34
7)
79,
401
33
.33
51,
621
7
,584
(
1,34
7)
57,
858
2
1,54
3
Ji
gs a
nd fi
xtur
es
144
,320
2
,590
-
146
,910
33
.33
120
,345
1
5,71
8
-
1
36,0
63
10,
847
201
5 1
,717
,306
9
9,73
5
(12
,747
) 1
,804
,294
1,1
19,9
95
114
,521
(
8,27
4)
1,2
26,2
42
578
,052
7.
1.1
Add
ition
s in
clud
e tr
ansf
ers
from
cap
ital w
ork-
in-p
rogr
ess
amou
ntin
g to
Rs.
38.
126
mill
ion
(201
5: R
s. 4
4.77
7 m
illio
n).
7.
1.2
Jigs
and
fixt
ures
incl
ude
mou
lds
havi
ng w
ritte
n do
wn
valu
e of
Nil
(201
5: R
s. 0
.327
mill
ion)
in th
e po
sses
sion
of s
ub-c
ontr
acto
rs.
7.
2 O
pera
ting
fixed
ass
ets
incl
ude
fully
dep
reci
ated
ass
ets
amou
ntin
g to
Rs.
182
.361
mill
ion
(201
5: R
s. 1
50.1
61 m
illio
n).
Not
es to
the
Fina
ncia
l Sta
tem
ents
For t
he y
ear e
nded
Jun
e 30
, 201
6
75Thal Annual Report 2016

Note 2016 2015 (Rupees in ‘000) 7.3 The depreciation / amortisation charge for the year has been allocated as follows: Cost of sales 30 101,480 106,044 Distribution costs 31 1,297 969 Administrative expenses 32 10,295 7,508 113,072 114,521
7.4 The following operating fixed assets were disposed off during the year:
Written Particulars Original Accumulated down Sales Gain /
cost depreciation value proceeds (loss) Mode of disposal Particulars of buyers
(Rupees in ‘000)
Plant and machinery
Automation Conveyor 4,728 4,382 346 428 82 Negotiation Mr. Mumtaz Gul - Gadoon Bottomer 950 747 203 251 48 Negotiation Mr. Mumtaz Gul - Gadoon Fork lifter 1,650 1,500 150 420 270 Negotiation Mr. Mohammad Umer, Karachi Items having book value upto Rs. 50,000 1,468 1,378 90 749 659 Negotiation Various
8,796 8,007 789 1,848 1,059
Furniture and fittings
Items having book value upto Rs. 50,000 284 250 34 21 (13) Various Various
Vehicles Suzuki Mehran 696 154 542 565 23 Negotiation Mr. Shahid Saleem - Employee, Karachi Daihatsu Coure 434 381 53 422 369 Negotiation M/s Shehzad Motor Worshop, Karachi Toyota Corolla 1,391 1,030 361 689 328 Sold under Company’s Mr. Zafar Kamal Car Scheme - Employee, Karachi Toyota Corolla 1,583 927 656 1,031 375 Sold under Company’s Mr. Osama Mufti Car Scheme - Ex-employee, Karachi Suzuki Mehran 189 3 186 475 289 Sold under Company’s Mr. Aun Abbas Car Scheme - Employee, Karachi Daihatsu Coure 663 497 166 322 156 Sold under Company’s Mr. Muhammad Hashim Car Scheme - Employee, Karachi Toyota Corolla 1,389 1,100 289 292 3 Sold under Company’s Mr. Shahid Saleem Car Scheme - Employee, Karachi Items having book value upto Rs. 50,000 2,169 1,606 563 6,545 5,982 Various Various
8,514 5,698 2,816 10,341 7,525
Office and mills equipment
Items having book value upto Rs. 50,000 242 161 81 31 (50) Various Various
Computer equipment
Items having book value upto Rs. 50,000 10,761 10,699 62 369 307 Various Various
2016 28,597 24,815 3,782 12,610 8,828
2015 12,747 8,274 4,473 10,466 5,993
Notes to the Financial StatementsFor the year ended June 30, 2016
76 Celebrating our 50th Year

2016 2015(Rupees in ‘000)
7.5 Capital Work-In-Progress
Plant and machinery 44,121 16,420 Office and mills equipment 8,461 4,582 Furniture and fittings 80 - Vehicles 800 - Computer equipment 1,620 150 Jigs and fixtures 12,521 -
67,603 21,152
8. INTANGIBLE ASSETS
W R I T T E ND O W N
C O S T A M O R T I S A T I O N V A L U E
As at As at As at As at As atJuly 01, June 30, July 01, Charge for On June June 30,
2015 Additions Disposals 2016 Rate 2015 the year disposals 30, 2015 2016
(Rupees in ‘000) % (Rupees in ‘000)
Softwares 6,195 150 - 6,345 33.33 852 2,110 - 2,962 3,383
Licenses 3,476 4,050 - 7,526 33.33 563 1,406 - 1,969 5,557
2016 9,671 4,200 - 13,871 1,415 3,516 - 4,931 8,940
2015 - 9,671 - 9,671 - 1,415 - 1,415 8,256
Note 2016 2015(Rupees in ‘000)
8.1 The amortisation charge for the year has been allocated as follows:
Cost of sales 30 1,303 463 Distribution costs 31 23 4 Administrative expenses 32 2,190 948
3,516 1,415
9. INVESTMENT PROPERTY
W R I T T E N D O W N
C O S T D E P R E C I A T I O N V A L U E
As at As at Charge for As at As at
Note June 30, July 01, the year June 30, June 30, Depreciation
2016 2015 (Note 32) 2016 2016 Rate %
(Rupees in ‘000)
Freehold land 891 - - - 891 -Building on freehold land 694 564 3 567 127 5
2016 9.1 1,585 564 3 567 1,018
2015 1,585 560 4 564 1,021
9.1 Investment property comprises of a godown held at Multan which has been let out. The fair value of the property determined on the basis of a valuation carried out by an independent professional valuer, as at June 30, 2016 amounts to Rs. 66 million (2015: Rs. 62 million). The valuation was arrived on the basis of market intelligence, indexation of the original cost, year of construction and present physical condition and location.
Notes to the Financial StatementsFor the year ended June 30, 2016
77Thal Annual Report 2016

Note 2016 2015 2016 2015 Holding % (Rupees in ‘000)
10. LONG-TERM INVESTMENTS
Investments in related parties Subsidiaries, unquoted – at cost Noble Computer Services (Private) Limited 100 100 1,086 1,086 Pakistan Industrial Aids (Private) Limited 100 100 10,000 10,000 Habib METRO Pakistan (Private) Limited (HMPL) 60 60 2,789,223 2,789,223 A-One Enterprises (Private) Limited 100 100 61,395 61,395 Thal Boshoku Pakistan (Private) Limited 55 55 104,500 104,500 Thal Power (Private) Limited 100 100 100 100 Makro-Habib Pakistan Limited (MHPL) 100 100 223,885 223,885 Less: Provision for impairment 10.1 (223,885) - - 223,885 2,966,304 3,190,189 Associates – at cost 10.2 Quoted Indus Motor Company Limited 6.22 6.22 48,900 48,900 Habib Insurance Company Limited 4.63 4.63 561 561 Agriauto Industries Limited 7.35 7.35 9,473 9,473 Shabbir Tiles & Ceramics Limited 1.30 1.30 21,314 21,314 80,248 80,248 Un-Quoted METRO Habib Cash & Carry Pakistan (Private) Limited (MHCCP) 10.3 25 25 284,105 284,105 Other investments - Available for sale Quoted - At fair value Habib Sugar Mills Limited 69,710 78,112 GlaxoSmithKline (Pakistan) Limited 451 328 Dynea Pakistan Limited 37,173 40,032 Allied Bank Limited 16,357 18,171 Habib Bank Limited 12,865 14,010 136,556 150,653 Un- Quoted - At cost Sindh Engro Coal Mining Company Limited (SECMC) 10.4 862,499 360,000 TPL Properties Limited 10.5 12,500 - 874,999 360,000 TOTAL 4,342,212 4,065,195
10.1 Due to the closure of operation by MHPL as fully explained in note 33.1 to the financial statements, the Company impaired the total cost of investment amounting to Rs. 223.885 million.
10.2 Although the Company has less than 20% equity interest in all of its associates except MHCCP, the management believes that significant influence over these associates exists by virtue of the Company’s representation on the Board of Directors of the respective companies.
10.3 The Company holds a put option with respect to its holding in MHCCP whereby, if MHCCP does not achieve specified financial performance targets, the Company may require Metro Cash and Carry International Holding BV to acquire the shares of MHCCP at a price to be determined on the basis of a predefined mechanism. The put option is exercisable from June 27, 2014 to June 26, 2019 subject to certain conditions.
10.4 The Company undertook to invest USD 24.3 million in PKR equivalent and upto the balance sheet date it has invested Rs. 862.499 million acquiring 58,198,316 ordinary shares having face value of Rs. 10 each, at a price of Rs. 14.82 per share. The balance commitment of the investment is USD 15.94 million.
10.5 Subsequent to the year end, the shares were quoted on the Pakistan Stock Exchange effective July 04, 2016.
Notes to the Financial StatementsFor the year ended June 30, 2016
78 Celebrating our 50th Year

Note 2016 2015 (Rupees in ‘000)
11. LONG-TERM LOANS - considered good
Employees - secured Interest bearing 11.1 24 58 Interest free 19,056 264 19,080 322 Current portion 17 (4,070) (151) 15,010 171 Wholly owned subsidiaries - unsecured A-One Enterprises (Private) Limited 11.2 6,000 5,000 Thal Power (Private) Limited 11.3 39,436 - 45,436 5,000 60,446 5,171 11.1 These carry interest at the rate of 10% (2015: 10%) per annum.
11.2 Represents interest free loan given for day-to-day operations of the subsidiary. The loan is carried at cost as the financial impact of carrying at amortised cost is not material.
11.3 Represents interest free loan given for purchase of shares of ThalNova Power Thar (Private) Limited. The loan is carried at cost as the financial impact of carrying at amortised cost is not material.
Note 2016 2015 (Rupees in ‘000)
12. LONG-TERM DEPOSITS
Security deposits 5,628 5,472 Utilities 2,010 2,010 Others 481 471 12.1 8,119 7,953 12.1 These long term deposits are interest free.
13. DEFERRED TAX ASSET - net
Deferred tax asset arising in respect of provisions 351,668 146,622 Deferred tax liability arising due to accelerated tax depreciation allowance (54,028) (62,369) 297,640 84,253
14. STORES, SPARES AND LOOSE TOOLS
Stores 20,675 22,593 Spares - In hand 61,791 61,619 - In transit 551 - 62,342 61,619 Loose tools 106 87 83,123 84,299
Notes to the Financial StatementsFor the year ended June 30, 2016
79Thal Annual Report 2016

Note 2016 2015(Rupees in ‘000)
15. STOCK-IN-TRADE
Raw material- In hand 15.1 1,629,607 1,451,245 - In transit 458,302 401,582
2,087,909 1,852,827 Work-in-process 213,115 192,326 Finished goods 463,305 249,876
15.2 2,764,329 2,295,029
15.1 Raw materials amounting to Rs. 9.635 million (2015: Rs. 9.577 million) are held with the sub-contractors.
15.2 Includes items amounting to Rs. 504.582 million (2015: Rs. 592.848 million) carried at net realisable value. [Cost Rs. 554.813 million (2015: Rs. 648.972 million)].
Note 2016 2015(Rupees in ‘000)
16. TRADE DEBTS - unsecured
Considered good 16.1 1,003,946 1,118,354
Considered doubtful 81,199 13,431 Provision for doutful debts 16.2 (81,199) (13,431)
- - 1,003,946 1,118,354
16.1 This includes amount due from following related parties:
Indus Motor Company Limited 323,195 321,750 Shabbir Tiles & Ceramics Limited 15,445 7,511 Auvitronics Limited 24 -
338,664 329,261
16.2 Reconciliation of provision for doubtful debts:
Balance at the beginning of the year 13,431 10,001 Charge for the year 31 72,131 5,726 Reversal for the year 34 - (2,296)Bad debts written off during the year (4,363) - Balance at the end of the year 81,199 13,431
17. LOANS AND ADVANCES - unsecured
Loans
Considered goodEmployees - interest free 20,000 - Current portion of long term loans 11 4,070 151
24,070 151 Considered doubtfulMakro-Habib Pakistan Limited (MHPL) 286,508 - Provision for doubtful debts 33.1 (286,508) -
- - 24,070 151
Advances - considered goodSuppliers 15,102 19,843 Employees 1,479 1,888
17.1 16,581 21,731 40,651 21,882
17.1 These advances are interest free.
Notes to the Financial StatementsFor the year ended June 30, 2016
80 Celebrating our 50th Year

Note 2016 2015 (Rupees in ‘000) 18. TRADE DEPOSITS AND SHORT-TERM PREPAYMENTS
Trade deposits
Tender / Performance guarantee 20,329 53,856 Margin against letter of credit 175 231 Container deposits 6,180 3,775 18.1 26,684 57,862 Short-term prepayments
Rent - 3,780 Insurance 4,777 5,332 Others 5,887 3,036 10,664 12,148 37,348 70,010 18.1 These deposits are interest free.
19. OTHER RECEIVABLES Duty drawback 1,101 2,875 Custom duty refundable 759 - Rent 788 487 Workers’ profit participation fund 26.5 - 7,750 Others 19.1 1,099 3,161 3,747 14,273
19.1 This includes receivable from the following related parties:
Pakistan Industrial Aids (Private) Limited 558 1,393 Indus Motor Company Limited - 36 Agriautos Industries Limited 131 26 Habib Insurance Company Limited - 10 Habib METRO Pakistan (Private) Limited - 453 Noble Computer Services (Private) Limited - 459 Habib Metropolitan Bank Limited - 87 Auvitronics Limited 118 1 Thal Boshoku Pakistan (Private) Limited 177 78 984 2,543
20. SHORT-TERM INVESTMENTS
Held-to-maturity - at amortised cost
Term deposit receipts 20.1 2,921,811 2,800,909 Accrued interest 11,815 4,050 2,933,626 2,804,959 Musharika certificate 20.2 - 100,000 Accrued interest - 37 - 100,037
Treasury bills 20.3 741,746 196,747 Accrued interest 2,983 2,535 744,729 199,282 3,678,355 3,104,278
Notes to the Financial StatementsFor the year ended June 30, 2016
81Thal Annual Report 2016

20.1 These include deposits amounting to Rs. 500.961 million (2015: Rs. 2,500 million) with Habib Metropolitan Bank Limited, a related party and carry interest rate ranging from 6.05% to 6.4% (2015: 6.60% to 7.40%) per annum and having maturity ranging from July 12, 2016 to September 14, 2016. Included in the above investment, Rs. 521.811 million (2015: Rs. 0.909 million) is under lien against a letter of guarantee issued by the banks on behalf of the Company.
20.2 These carry interest at the rate of Nil (2015: 6.75%) per annum.
20.3 These carry interest rate ranging from 5.90% to 6.21% (2015: 6.84% to 7.38%) per annum and having maturity ranging from July 07, 2016 to September 15, 2016.
Note 2016 2015 (Rupees in ‘000) 21. INCOME TAX - net
Group Tax Relief adjustments 21.1 593,466 593,466 Group Taxation adjustments 21.2 278,440 - Income tax provision less tax payments – net 21.3 (592,690) (454,325) 279,216 139,141 21.1 In terms of the provisions of Section 59B of the Income Tax Ordinance, 2001 (the Ordinance), a subsidiary
company may surrender its tax losses in favour of its holding company for set off against the income of its holding company subject to certain conditions as prescribed under the Ordinance.
Accordingly, the Company adjusted its tax liabilities for the tax years 2008 to 2010 by acquiring the losses of its subsidiary company and consequently an aggregate sum of Rs. 593.466 million equivalent to the tax value of the losses acquired has been paid to the subsidiary company.
The original assessments of the Company for the tax years 2008 to 2010 were amended under Section 122(5A) of the Ordinance by the tax authorities by disallowing Group Relief claimed by the Company under Section 59B of the Ordinance aggregating to Rs. 593.466 million. The Company preferred appeals against the said amended assessments before the Commissioner Inland Revenue (Appeals) who vide his orders dated 10th June 2011 and 11th July 2011 has held that the Company is entitled to Group Relief under Section 59B of the Ordinance. However, the tax department filed an appeal before the Appellate Tribunal Inland Revenue (ATIR) against the Commissioner Inland Revenue (Appeal) (CIR) Order. The ATIR has passed an order in favour of the Company for the above tax years; the Tax department filed reference application / appeal against the order of ATIR before the High Court of Sindh and with the Chairman ATIR which are under the process of hearings.
21.2 In terms of the provision of Section 59AA of the Income Tax Ordinance, 2001 (the Ordinance), the Company and MHPL have irrevocably opted to be taxed as one fiscal unit for the tax year 2016. Accordingly, the tax loss of MHPL for the tax year 2016 has been adjusted against the taxable income of the Company which resulted in a reduction of tax liability of Rs. 278.440 million (2015: Nil) for the current year.
The Company has adjusted the balance loan receivable (net of tax loss) from MHPL.
21.3 Includes adjustment of tax challans acquired from MHPL amounting to Rs. 38.052 million (2015: Nil).
Note 2016 2015 (Rupees in ‘000)
22. CASH AND BANK BALANCES
In hand 5,290 2,243 With banks in:
Current accounts 22.1 49,236 132,417 Deposit accounts 22.2 347,633 373,066 22.3 396,869 505,483 402,159 507,726
Notes to the Financial StatementsFor the year ended June 30, 2016
82 Celebrating our 50th Year

22.1 These include account maintained with Habib Metropolitan Bank Limited, a related party amounting to Rs. 34.748 million (2015: Rs. 103.053 million).
22.2 These represent deposits with Habib Metropolitan Bank Limited, a related party and carry markup ranging from 4.75% to 5.5% (2015: 5.5%) per annum.
22.3 Bank balances in deposit accounts are placed under interest arrangements. The company has conventional banking relationships with all the banks having Islamic window operations except Meezan Bank Limited and Al-Baraka Bank (Pakistan) Limited.
23. ISSUED, SUBSCRIBED AND PAID-UP CAPITAL
2016 2015 2016 2015 Number of ordinary (Rupees in ‘000) shares of Rs. 5/- each
5,149,850 5,149,850 Fully paid in cash 25,750 25,750 64,640,390 64,640,390 Issued as fully paid bonus shares 323,202 323,202 Shares issued under the Scheme of 11,239,669 11,239,669 Arrangement for Amalgamation 56,198 56,198 81,029,909 81,029,909 405,150 405,150
23.1 As at June 30, 2016: 7,334,889 (2015: 7,512,043) ordinary shares are held by related parties.
2016 2015 (Rupees in ‘000) 24. RESERVES
Capital reserves
Reserve on merger of former Pakistan Jute and Synthetics Limited and former Thal Jute Mills Limited 13,240 13,240 Reserve on merger of former Pakistan Paper Sack Corporation Limited and former Khyber Papers (Private) Limited 42,464 42,464 55,704 55,704 Revenue reserves
General reserve 9,796,999 8,660,999 Unappropriated profit 1,875,317 1,541,512 11,672,316 10,202,511 Gain on revaluation of available-for-sale investments - net of tax 94,408 108,505 11,822,428 10,366,720
25. LONG TERM DEPOSITS
Represents security deposits from Thal Boshoku Pakistan (Private) Limited, a related party (2015: Rs. 1.624 million).
Notes to the Financial StatementsFor the year ended June 30, 2016
83Thal Annual Report 2016

Note 2016 2015 (Rupees in ‘000)
26. TRADE AND OTHER PAYABLES
Creditors 26.1 163,749 266,671 Accrued liabilities 26.2 707,373 588,796 Custom duty payable 54,981 10,875 Unclaimed salaries 5,887 7,733 Warranty obligations 26.3 249,384 179,853 Royalty payable 26.4 101,683 107,938 Workers’ profit participation fund 26.5 28 - Workers’ welfare fund 60,811 60,106 Security deposits 207 537 Unclaimed and unpaid dividend 64,593 60,376 Other liabilities 26.6 24,895 43,117 1,433,591 1,326,002 26.1 This includes amounts due to the following related parties:
Auvitronics Limited 10,837 8,574 Makro-Habib Pakistan Limited - 1,750 Pakistan Industrial Aids (Private) Limited 90 5,425 Habib Insurance Company Limited 84 70 11,011 15,819 26.2 This includes amounts due to the following related party:
Habib Insurance Company Limited 1,816 591 26.3 Warranty obligations
Balance at the beginning of the year 179,853 117,642 Charge for the year 31 78,495 75,899 Claims paid during the year (8,964) (13,688) Balance at end of the year 249,384 179,853 26.4 Royalty payable
Balance at the beginning of the year 107,938 60,799 Charge for the year 30 178,253 156,177 Paid during the year (184,508) (109,038) Balance at the end of the year 101,683 107,938 26.5 Workers’ profit participation fund (WPPF)
Receivable from WPPF at the beginning of the year (7,750) (5,505) Allocation for the current year 33 160,028 157,250 152,278 151,745 Paid during the year (152,250) (159,495) Payable to / (receivable from) WPPF at the end of the year 28 (7,750) 26.6 Other liabilities
Tax deducted at source 974 1,557 Employees Old-Age Benefits Institution (EOBI) 753 128 Advances from customers 8,581 26,182 Payable to provident fund - 986 Payable to retirement benefit fund 5,087 4,538 Others 9,500 9,726 24,895 43,117
Notes to the Financial StatementsFor the year ended June 30, 2016
84 Celebrating our 50th Year

Note 2016 2015 (Rupees in ‘000)27. SHORT-TERM RUNNING FINANCE - secured
Related party - 13,921 Others 22,790 635 27.1 22,790 14,556 27.1 Available limits of the running finance facilities amounts to Rs. 2,453 million (2015: Rs. 2,453 million). The facilities
carry mark-up at rates ranging from one month to three months’ KIBOR plus spreads of 0.75% to 0.90% (2015: 0.75% to 0.90%) per annum. The facilities are secured by way of joint pari passu charge against hypothecation of the Company’s stock-in-trade and trade debts. The facilities have a maturity till April 20, 2018.
2016 2015 (Rupees in ‘000)28. CONTINGENCIES AND COMMITMENTS
28.1 Contingencies
28.2 Commitments
28.2.1 Letters of credit outstanding for raw material and spares 1,347,522 1,237,316 28.2.2 Commitments in respect of capital expenditure 114,614 - 28.2.3 Commitments for rentals under Ijarah (lease) agreements
Within one year 5,575 2,209 After one year but not later than five years 7,179 220 12,754 2,429 Represent Ijarah (lease) agreement entered into with a Modaraba in respect of vehicles. Total Ijarah
payments due under the agreements are Rs. 12.754 million and are payable in monthly installments latest by February 2019. These commitments are secured by on-demand promissory notes of Rs. 19.476 million.
28.2.4 Commitment in respect of investment is disclosed in note 10.4 to these financial statements.
Notes to the Financial StatementsFor the year ended June 30, 2016
28.1.1 Represents letter of guarantees issued by banks on behalf of the Company. These include a Standby Letter of Credit (SBLC) amounting to Rs. 2.083 billion issued by United Bank Limited favoring Habib Bank Limited as Intercreditor Agent and Sindh Engro Coal Mining Company Limited (SECMCL) as Project Company for balance equity participation of the Company. The term of SBLC is 42 months and its amount will reduce as and when the Company injects equity in SECMCL.
28.1.2 Post dated cheques have been issued to Collector of Custom in
respect of differential duty between commercial and concessional rate of duty, duty and tax remission on exports and safe transport requirement under various SRO’s.
2,118,040 12,310
155,254 166,379
85Thal Annual Report 2016

Note 2016 2015 (Rupees in ‘000) 29. REVENUE - net
Export sales 29.1 526,933 930,322 Local sales 29.2 17,105,912 16,850,364 17,632,845 17,780,686 Less: Sales tax 2,372,796 2,228,507 Sales discount 1,089 1,322 2,373,885 2,229,829 Add: Duty drawback 7,479 (2,066) 15,266,439 15,548,791 29.1 Export sales are stated net of export related freight and other expenses of Rs. 19.034 million (2015: Rs. 42.311
million).
29.2 Local sales are stated net of freight and other expenses of Rs. 51.920 million (2015: Rs. 59.111 million).
Note 2016 2015 (Rupees in ‘000)
30. COST OF SALES
Raw material consumed 30.1 10,429,409 10,486,649 Salaries, wages and benefits 938,017 1,076,825 Stores and spares consumed 131,956 140,096 Repairs and maintenance 89,750 90,348 Power and fuel 206,297 301,853 Rent, rates and taxes 3,272 3,755 Vehicle running and maintenance 9,334 9,024 Insurance 8,149 9,163 Communication 4,529 4,337 Travelling and conveyance 9,372 12,110 Entertainment 200 413 Printing and stationery 4,767 4,372 Legal and professional 1,121 1,064 Computer accessories 3,928 6,424 Royalty 26.4 178,253 156,177 Depreciation / amortisation 7.3 101,480 106,044 Amortisation 8.1 1,303 463 Research and development 6,197 2,517 Ijarah rentals 3,240 2,625 Others 737 2,159 12,131,311 12,416,418 Work-in-process Opening 192,326 171,239 Closing (213,115) (192,326) (20,789) (21,087) Cost of goods manufactured 12,110,522 12,395,331 Finished goods Opening 249,876 459,441 Closing (463,305) (249,876) (213,429) 209,565 11,897,093 12,604,896 30.1 Raw material consumed
Opening stock 1,451,245 2,146,446 Purchases 10,607,771 9,791,448 Closing stock (1,629,607) (1,451,245) 10,429,409 10,486,649
Notes to the Financial StatementsFor the year ended June 30, 2016
86 Celebrating our 50th Year

Note 2016 2015 (Rupees in ‘000)31. DISTRIBUTION COSTS
Salaries and benefits 56,873 55,641 Vehicle running expense 2,641 4,089 Utilities 2,100 1,753 Insurance 2,535 2,728 Rent, rates and taxes 8,877 8,182 Communication 1,640 1,489 Advertisement and publicity 5,471 7,447 Travelling and conveyance 5,539 7,341 Entertainment 195 139 Printing and stationery 246 316 Legal and professional - 25 Computer accessories 379 209 Research and development 263 267 Depreciation 7.3 1,297 969 Amortisation 8.1 23 4 Provision for doubtful debts 16.2 72,131 5,726 Repairs and maintenance 3,454 1,154 Export expenses 6,189 23,412 Provision for warranty claims 26.3 78,495 75,899 Ijarah rentals 559 886 Others 384 827 249,291 198,503
32. ADMINISTRATIVE EXPENSES
Salaries and benefits 332,835 273,901 Vehicle running expense 9,854 12,682 Printing and stationery 3,300 2,522 Rent, rates and taxes 7,807 8,535 Utilities 5,888 5,740 Insurance 882 812 Entertainment 1,954 1,250 Subscription 669 2,058 Communication 3,050 3,204 Advertisement and publicity 2,435 593 Repairs and maintenance 12,104 6,282 Travelling and conveyance 21,684 18,271 Legal and professional 113,779 88,928 Computer accessories 2,100 3,673 Auditors’ remuneration 32.1 4,139 3,597 Depreciation / amortisation 7.3 10,295 7,508 Depreciation on investment property 9 3 4 Amortisation 8.1 2,190 948 Ijarah rentals 1,869 3,611 Charity and donations 32.2 33,521 29,968 Directors’ fee and meeting expenses 1,195 1,146 Others 1,220 942 572,773 476,175 32.1 Auditors’ remuneration
Audit fee 1,759 1,759 Half-yearly review 292 279 Taxation services 1,295 906 Other certification 355 337 Out of pocket expenses 438 316 4,139 3,597
Notes to the Financial StatementsFor the year ended June 30, 2016
87Thal Annual Report 2016

32.2 Charity and donations
Charity and donations include the following donees in whom directors or their spouses are interested:
Name of donee Address of donee Name of directors/spouse 2016 2015 (Rupees in ‘000)
Mohamedali Habib Welfare Trust 2nd Floor, House of Habib, 3-Jinnah Co-operative Housing Society, Mr. Rafiq M. Habib - Trustee Block 7/8, Sharae Faisal, Karachi. Mr. Ali S. Habib - Trustee 11,970 9,998
Habib Education Trust 4th floor, United Bank building, Mr. Ali S. Habib - Trustee I.I. Chundrigar Road, Karachi. Mr. Mohamedali R. Habib - Trustee 3,000 3,000
Habib University Foundation 147, Block 7&8, Banglore Mr. Rafiq M. Habib - Trustee Co-operative Housing Society, Mr. Ali S. Habib - Trustee Tipu Sultan Road, Karachi. Mr. Mohamedali R. Habib - Trustee 6,000 4,000
Anjuman -e- Behbood- ABSA School 26-C National Mrs. Rafiq M. Habib - Samat -e- Itefal Highway, Korangi Road, Karachi. Vice President 61 36
Note 2016 2015(Rupees in ‘000)
33. OTHER CHARGES
Workers’ profits participation fund 26.5 160,028 157,250 Workers’ welfare fund 61,485 60,106 Loans provided to MHPL 17 603,000 - Payable to MHPL 21.2/21.3 (316,492) -
33.1 286,508 - Impairment on investment in MHPL 33.2 223,885 -
731,906 217,356
33.1 As a consequence of the dismissal of the Review Petition by the Honorable Supreme Court of Pakistan (SCP) the Saddar Store of the subsidiary company, Makro Habib Pakistan Limited (MHPL), was closed down on September 11, 2015. Accordingly, the Operation Agreement with Metro Habib Cash & Carry Pakistan (Private) Limited (MHCCP) stands terminated.
As per the Operations Agreement, MHPL was required to make a payment of Rs. 792 million to MHCCP on account of the closure of Saddar Store. Therefore, during the year, the Company provided interest free loans amounting to Rs. 603 million to MHPL in order to enable it to discharge its obligation to MHCCP and meet other working capital requirements. The Company has recorded a provision for impairment against the balance amount of loan to MHPL.
33.2 As explained in Note 10.1, the Company has fully impaired the total investment in MHPL amounting to Rs. 223.885 million.
Notes to the Financial StatementsFor the year ended June 30, 2016
88 Celebrating our 50th Year

Note 2016 2015(Rupees in ‘000)
34. OTHER INCOME
Income from financial assetsDividend income from: Related parties
Indus Motor Company Limited 489,000 310,515 Agriauto Industries Limited 21,156 10,578 Habib Insurance Company Limited 10,037 11,471 Makro Habib Pakistan Limited - 49,761 Pakistan Industrial Aids (Private) Limited - 7,500 Habib METRO Pakistan (Private) Limited 323,473 267,718
843,666 657,543 Others
Dynea Pakistan Limited 2,042 1,021 Habib Sugar Mills Limited 4,667 4,201 Allied Bank Limited 1,273 682 Habib Bank Limited 912 228 GlaxoSmithKline Pakistan Limited 7 8
8,901 6,140 Interest on:
Deposit accounts 32,250 40,828 Term deposit receipts 136,884 47,958 Musharika certificates 1,664 933 Government treasury bills 24,231 16,872
195,029 106,591 Gain on revaluation / redemption of investments at fair value through profit and loss 33,259 44,834 Reversal of provision for doubtful debts - 2,296 Liabilities no longer payable written back 486 116 Exchange gain - net 34.1 1,941 3,554
1,083,282 821,074
Income from non-financial assetsGain on disposal of property, plant and equipment 7.4 8,828 5,993 Rental income 5,712 6,535 Service income 34.2 29,604 30,711 Scrap sales 10,530 4,553 Claim from suppliers 29,409 26,845 Insurance claim 124 2,391
84,207 77,028 1,167,489 898,102
34.1 Represents exchange gain - net arising on revaluation of foreign currency financial assets and liabilities and on transactions in foreign currencies.
34.2 The Company has entered into a service agreement with Thal Boshoku Pakistan (Private) Limited, a subsidiary company. As per the agreement, the Company will provide service and support for production engineering, plant maintenance and engineering, imports, logistics & material handling, sales administration, HR and general administration and financial corporate legal and tax advisory.
2016 2015(Rupees in ‘000)
35. FINANCE COSTS
Mark-up on Short-term running finance: - Related party 34 41
- Others 81 582 115 623
Bank charges and guarantee commission 3,705 4,126 3,820 4,749
Notes to the Financial StatementsFor the year ended June 30, 2016
89Thal Annual Report 2016

Note 2016 2015 (Rupees in ‘000)
36. TAXATION
Current 998,283 822,067 Prior 15,331 12,932 Deferred (213,387) (38,698) 36.1 800,227 796,301 36.1 Relationship between income tax expense and accounting profit
Profit before taxation 2,979,045 2,945,214 Tax at the rate of 32% (2015: 33%) 953,294 971,921 Super tax @ 3% of taxable income 36.1.1 95,145 78,882 1,048,439 1,050,803 Tax effects of: Income taxed at reduced rates (247,880) (230,095) Income tax under Final Tax Regime (13,730) (33,811) Tax effect of inadmissible items (1,933) (3,528) Prior years 15,331 12,932 800,227 796,301
36.1.1 The Federal Government vide Finance Act 2016 has imposed a one time super tax at the rate of 3% on income of companies for the tax year 2016. This tax has been levied for financing the rehabilitation of internally displaced persons affected by the ongoing war on terror.
2016 2015 (Rupees in ‘000)
37. BASIC AND DILUTED EARNINGS PER SHARE
There is no dilutive effect on the basic earnings per share of the Company, which is based on: Profit after taxation 2,178,818 2,148,913 Number of shares in thousands Weighted average number of ordinary shares of Rs. 5/- each in issue 81,030 81,030
(Rupees)
Basic and diluted earnings per share 26.89 26.52
Notes to the Financial StatementsFor the year ended June 30, 2016
90 Celebrating our 50th Year

Note 2016 2015(Rupees in ‘000)
38. CASH GENERATED FROM OPERATIONS
Profit before taxation 2,979,045 2,945,214
Adjustments for non-cash charges and other items:Depreciation and amortisation 116,591 115,940 Finance costs 3,820 4,749 Interest income (195,029) (106,591)Liabilities no longer payable written back (486) (116)Gain on revaluation / redemption of investments at fair value through profit and loss (33,259) (44,834)Dividend income (852,567) (663,683)Provision for doubtful debts - net 72,131 3,430 Provision for retirement benefits 2,905 3,595 Provision for impairment on loan to MHPL 286,508 - Provision for impairment on investment in MHPL 223,885 - Gain on disposal of operating fixed assets (8,828) (5,993)
(384,329) (693,503) 2,594,716 2,251,711
(Increase) / decrease in current assets Stores, spares and loose tools 1,176 13 Stock-in-trade (469,300) 796,228 Trade debts 42,277 (248,308)Loans and advances (305,277) (348,138)Trade deposits and short-term prepayments 32,662 (38,193)Sales tax refundable (36,126) - Other receivables (305,966) 357,777
(1,040,554) 519,379 Increase / (decrease) in current liabilities
Trade and other payables 103,257 (173,123)Sales tax payable - 40,178
103,257 (132,945)1,657,419 2,638,145
39. CASH AND CASH EQUIVALENTS
Cash and bank balances 22 402,159 507,726 Short-term investments 20 3,663,557 3,097,708 Short-term running finance 27 (22,790) (14,556)
4,042,926 3,590,878
Notes to the Financial StatementsFor the year ended June 30, 2016
91Thal Annual Report 2016

40. TRANSACTIONS AND BALANCES WITH RELATED PARTIES
Related parties of the Company comprise of subsidiaries, associates and companies with common directorship, retirement funds, directors and key management personnel. Detail of transactions with related parties during the year, other than those which have been disclosed in note 41 and elsewhere in these financial statements, are as follows:
Relationship Nature of transactions 2016 2015 (Rupees in ‘000)
Subsidiaries Sales of goods - 71 Professional services acquired 107,843 82,883 Purchase of assets - 41 Purchase of goods 26,051 49,657 Supplies purchased 6,424 31,110 Rent received 5,190 5,025 Investment in subsidiary - 100 Service fee 27,090 25,200 Associates Sales of goods 9,081,881 8,303,593 Insurance premium 29,382 28,162 Purchase of assets 5,148 20,012 Purchase of goods 166,060 122,654 Supplies purchased 26,909 - Insurance claim received 228 11,307 Mark-up and bank charges paid 2,238 4,758 Profit received on deposits 156,444 79,542 Rent paid 800 800 Employee benefit plans Contribution to provident fund 32,686 35,309 Contribution to retirement benefit fund 3,202 3,319
40.1 There are no transactions with key management personnel other than under the terms of employment as disclosed in note 41 to the financial statements.
40.2 The receivable / payable balances with related parties as at June 30, 2016 are disclosed in the respective notes to the financial statements.
41. REMUNERATION OF EXECUTIVES, DIRECTORS AND CHIEF EXECUTIVE
2016 2015 Chief Chief executive Directors Executives executive Directors Executives
(Rupees in ‘000) (Rupees in ‘000)
Managerial remuneration 34,491 - 244,404 28,898 - 207,103 Company’s contribution to provident fund 770 - 8,965 694 - 7,562 Company’s contribution to retirement benefit fund - - 4,050 - - 3,425 35,261 - 257,419 29,592 - 218,090
Number of persons 1 6 80 1 6 92
41.1 The chief executive, directors and certain executives of the company are provided with free use of company maintained cars.
41.2 Four non-executive directors (2015: Four) have been paid fees of Rs. 1,175,000 (2015: Rs. 970,000) for attending board and other meetings.
Notes to the Financial StatementsFor the year ended June 30, 2016
92 Celebrating our 50th Year

2016 2015
42. PLANT CAPACITY AND ACTUAL PRODUCTION
Annual CapacityJute (Metric Tons) 33,800 33,800 Auto air conditioners (Units) 90,000 90,000 Paper bags (Nos. ‘000s) 140,000 140,000 Alternator (Units) 90,000 90,000 Starter (Units) 90,000 90,000
Actual ProductionJute (Metric Tons) 15,534 25,247 Auto air conditioners (Units) 82,560 72,078 Wire harness (Units) 128,578 107,890 Paper bags (Nos. ‘000s) 95,067 95,148 Alternator (Units) 57,529 51,655 Starter (Units) 57,609 51,753
Reason for shortfall Low demand Low demand
42.1 The capacity of wire harness is dependent on product mix.
42.2 The production capacity of Laminate Operations depends on the relative proportion of various types of products.
2016 2015Unaudited Audited
(Rupees in ‘000)
43. PROVIDENT FUND
Size of the fund 541,977 567,737 Percentage of investments made 97.24% 98.19%Fair value of investments 527,017 557,467 Cost of investments made 512,603 532,602
43.1 Break-up of investments in terms of amount and percentage of the size of the provident fund are as follows:
2016 2015 (Unaudited) (Audited)
investment investment as a % of as a % of
Investments size of Investments size of (Rs. ‘000) the fund (Rs. ‘000) the fund
Government securities 131,922 24.34% 266,929 47.02%Term finance certificates and Sukuks 100,511 18.55% 99,099 17.46%Term deposit receipts and call deposits 143,198 26.42% 31,588 5.56%Listed securities and mutual fund units 151,386 27.93% 159,851 28.16%
527,017 97.24% 557,467 98.19%
43.2 Investments out of provident fund have been made in accordance with the provisions of the section 227 of the Companies Ordinance, 1984 and the rules formulated for this purpose.
Notes to the Financial StatementsFor the year ended June 30, 2016
93Thal Annual Report 2016

44. FINANCIAL RISK MANAGEMENT OBJECTIVES AND POLICIES
The Company’s financial instruments are subject to credit risk, liquidity risk, foreign currency risk, interest rate risk andequity price risk. The Board of Directors oversees policies for managing each of these risks which are summarisedbelow.
44.1 Credit risk
Credit risk is the risk that one party to a financial instrument will fail to discharge an obligation and cause the other party to incur a financial loss.
Concentration of credit risk arises when a number of counterparties are engaged in similar business activities or have similar economic features that would cause their ability to meet contractual obligations to be similarly affected by changes in economic, political or other conditions. Concentration of credit risk indicates the relative sensitivity of the Company’s performance to developments affecting a particular industry.
The Company is mainly exposed to credit risk on trade debts, short-term investments and bank balances. The Company seeks to minimize the credit risk exposure through having exposure only to customers considered credit worthy and obtaining securities where applicable.
Quality of financial assetsThe credit quality of financial assets is analyzed as under:
2016 2015(Rupees in ‘000)
Trade debts
The analysis of trade debts is as follows:
Neither past due nor impaired [includes Rs. 328.857 million (2015: Rs. 324.831 million) receivable from related parties.] 797,627 860,645 Past due but not impaired - Less than 90 days [includes Rs. 9.807 million (2015: Rs. 4.430 million) receivable from related parties.] 175,982 168,925 - 91 to 180 days [includes Nil (2015: Nil) receivable from related parties.] 25,002 75,559 - 181 to 360 days [includes Nil (2015: Nil) receivable from related parties.] 5,335 13,225
1,003,946 1,118,354
Bank balances Ratings A1+ 383,379 491,339 A-1+ 13,466 7,274 A-1 24 - A2 - 6,870
396,869 505,483
Short term investmentsRatings A1+ 897,775 2,904,996 A-1+ 2,780,580 199,282
3,678,355 3,104,278
Financial assets other than trade debts, bank balances and short term investments, are not exposed to any material credit risk.
Notes to the Financial StatementsFor the year ended June 30, 2016
94 Celebrating our 50th Year

44.2 Liquidity risk
Liquidity risk is the risk that an enterprise will encounter difficulty in raising funds to meet commitments associated with the financial instruments. To guard against the risk, the Company has diversified funding sources and the assets are managed with liquidity in mind. The maturity profile is monitored to ensure that adequate liquidity is maintained.
Year ended June 30, 2016 Lessthan 3 to 12 1 to 5
On demand 3 months months years Total
(Rupees in ‘000)
Long term deposits - - - 1,624 1,624 Trade and other payables 1,018,218 - - - 1,018,218 Short-term running finance - secured 22,790 - - - 22,790 Accrued markup 42 - - - 42
1,041,050 - - 1,624 1,042,674
Year ended June 30, 2015 Lessthan 3 to 12 1 to 5
On demand 3 months months years Total
(Rupees in ‘000)
Long term deposits - - - 1,714 1,714 Trade and other payables 972,777 - - - 972,777 Short-term running finance - secured 14,556 - - - 14,556 Accrued markup 55 - - - 55 Sales tax payable 15,759 - - - 15,759
1,003,147 - - 1,714 1,004,861
44.3 Foreign Currency risk
Foreign currency risk is the risk that the value of financial assets or a financial liability will fluctuate due to a change in foreign exchange rates. It arises mainly where receivables and payables exist due to transactions in foreign currency. The Company’s exposure to foreign currency risks is as follows:
2016 2015(Rupees in ‘000)
Trade receivables (US Dollars) 107,959 418,857 Trade receivables (AED) 1,568,568 - Trade and other payables (US Dollars) 175,102 1,649,767 Trade and other payables (JPY) 8,002 109,201 Trade and other payables (CHF) - 1,481 Total (AED) - receivables 1,568,568 - Total (CHF) - payables - 1,481 Total (JPY) - payables 8,002 109,201 Total (US Dollars) - payables 67,143 1,230,910
The following significant exchange rates have been applied at the balance sheet date:
2016 2015 (Rupees)
US Dollar 104.70 101.70 AED 28.51 27.69 JPY 1.02 0.82 CHF 106.85 109.64
Notes to the Financial StatementsFor the year ended June 30, 2016
95Thal Annual Report 2016

Sensitivity analysis:
The following table demonstrates the sensitivity to a reasonably possible change in the US dollar, AED, JPY and CHF’s exchange rate, with all other variables held constant, of the Company’s profit before tax and the Company’s equity.
Change in Effect on profit Effect onUS dollars, AED, or (loss) equity
JPY & CHF’s before taxrate % (Rupees in ‘000)
2016 + 10 3,768 2,756 - 10 (3,768) (2,756)
2015 + 10 (12,544) (9,152)- 10 12,544 9,152
44.4 Interest rate risk
Interest rate risk is the risk that the fair value of future cash flows of a financial instrument will fluctuate because of changes in market interest rates. The Company’s exposure to the risk of changes in market interest rates relates primarily to the Company’s short-term borrowings and cash in deposit account. The interest rates on these financial instruments are disclosed in the respective notes to the financial statements.
Sensitivity Analysis:
The following figures demonstrate the sensitivity to a reasonably possible change in interest rate, with all other variables held constant, of the Company’s profit before tax:
Increase / Effect on decrease in profit
basis points before tax
2016KIBOR + 100 3,248 KIBOR - 100 (3,248)
2015 KIBOR + 100 3,568 KIBOR - 100 (3,568)
44.5 Equity price risks
Equity price risk is the risk that the fair value of future cashflows of financial instruments will fluctuate because of changes in market prices (other than those arising from interest rate risk or currency risk), whether those changes are caused by factors specific to the individual financial instrument or its issuer, or factors affecting all similar financial instruments traded in the market.
The Company’s quoted equity securities are susceptible to market price risk arising from uncertainties about future values of the investment securities. The Company manages the equity price risk through diversification. Reports on the equity portfolio are submitted to the Company’s Board of Directors on a regular basis. The Board of Directors review and approve all equity investment decisions.
45. CAPITAL RISK MANAGEMENT
The Company’s objective when managing capital is to safeguard the Company’s ability to continue as a going concernand continue to provide returns for shareholders and benefits for other stakeholders and to maintain an optimal capitalstructure to reduce the cost of capital. The Company is currently financing its operations through equity and workingcapital.
Notes to the Financial StatementsFor the year ended June 30, 2016
96 Celebrating our 50th Year
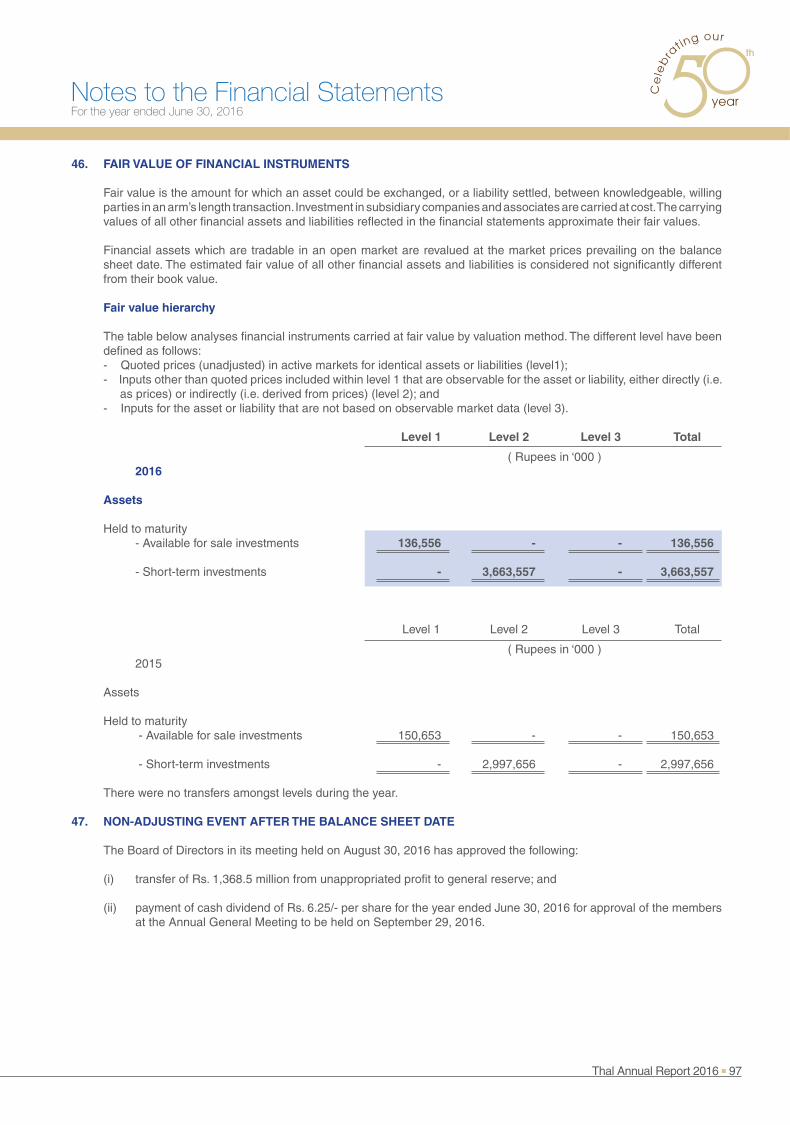
46. FAIR VALUE OF FINANCIAL INSTRUMENTS
Fair value is the amount for which an asset could be exchanged, or a liability settled, between knowledgeable, willing parties in an arm’s length transaction. Investment in subsidiary companies and associates are carried at cost. The carrying values of all other financial assets and liabilities reflected in the financial statements approximate their fair values.
Financial assets which are tradable in an open market are revalued at the market prices prevailing on the balance sheet date. The estimated fair value of all other financial assets and liabilities is considered not significantly different from their book value.
Fair value hierarchy
The table below analyses financial instruments carried at fair value by valuation method. The different level have been defined as follows:
- Quoted prices (unadjusted) in active markets for identical assets or liabilities (level1); - Inputs other than quoted prices included within level 1 that are observable for the asset or liability, either directly (i.e.
as prices) or indirectly (i.e. derived from prices) (level 2); and - Inputs for the asset or liability that are not based on observable market data (level 3).
Level 1 Level 2 Level 3 Total
( Rupees in ‘000 ) 2016 Assets
Held to maturity
- Available for sale investments 136,556 - - 136,556 - Short-term investments - 3,663,557 - 3,663,557
Level 1 Level 2 Level 3 Total
( Rupees in ‘000 ) 2015 Assets Held to maturity
- Available for sale investments 150,653 - - 150,653 - Short-term investments - 2,997,656 - 2,997,656 There were no transfers amongst levels during the year.
47. NON-ADJUSTING EVENT AFTER THE BALANCE SHEET DATE
The Board of Directors in its meeting held on August 30, 2016 has approved the following: (i) transfer of Rs. 1,368.5 million from unappropriated profit to general reserve; and
(ii) payment of cash dividend of Rs. 6.25/- per share for the year ended June 30, 2016 for approval of the members
at the Annual General Meeting to be held on September 29, 2016.
Notes to the Financial StatementsFor the year ended June 30, 2016
97Thal Annual Report 2016

ASIF RIZVICHIEF EXECUTIVE
SOHAIL P. AHMEDVICE CHAIRMAN
48. GENERAL
48.1 The number of employees as at June 30, 2016 was 3,368 (2015: 4,144) and average number of employeesduring the year was 3,702 (2015: 4,826) .
48.2 Corresponding figures have been re-arranged and reclassified, wherever necessary. However, there were no significant reclassifications to report.
48.3 Figures have been rounded off to the nearest thousands.
49. DATE OF AUTHORISATION FOR ISSUE
These financial statements were authorised for issue on August 30, 2016 by the Board of Directors of the Company.
Notes to the Financial StatementsFor the year ended June 30, 2016
98 Celebrating our 50th Year