new measurement techniques & procedures for measuring …€¦ · · 2017-02-06new...
TRANSCRIPT

1
New Measurement Techniques & Procedures for Measuring "Real World"
Emissions with PEMS and PAMS Carl Fulper
United States Environmental Protection Agency, OTAQ
PEMS Conference
UC-CERT
April 11, 2013

Outline
New Way to Think About How to Test in the “Real
World” – “The Modeling Way”
Using the right “tools” for the operation to achieve data
goals quickly, effectively and accurately
Data Reports
– Data Validation Report
– QA/QC, time alignment & corrected Emissions Rpt
Vehicle Representativeness
– Improve sample design and recruitment methods
PEMS Installation Techniques
2

PEMS Testing in the “Real” World
Measurement is difficult and expensive
– Vehicles and engines are diverse
– Vehicles are difficult to acquire or recruit (reduce burden to owne)
– Techniques are detailed and labor intensive
– Emissions are highly variable
Most test programs install PEMS and owner drives around their
“normal” route for 8 -10 hours and test the vehicle over 3-5 days
or longer.
Represents “real” driving, but in the modeling world, you could be
missing key operating modes or not get enough emission data
Is there a better way?
4

What kind of operation? “put the vehicle thru its paces”
On choreographed drive route:
– Start
– Parking lot
– Residential street
– Arterial
– On-ramp
– Freeway
– Off-ramp
– Idle
– Grade (hills)
or loads
– Accelerations
– Decelerations
– Cold/Hot Start 5
This can be used for all mobile
sources (HDVs, MDVs, LDVs and
nonroads) in about 2-3 hours.
For HDVs: load via trailer & hills
For Nonroad: Running set operations

6
0
500
1000
1500
2000
2500
3000
0 1 11 12 13 14 15 16 21 22 23 24 25 27 28 29 30 33 35 37 38 39 40
NO
x (
g/h
r)
opModeID
MOVES Drayage
inc. STP inc. STP inc. STP
1-25 mph 25-50 mph 50+ mph
Draft Data: Houston Drayage (weighted) vs. MOVES: MY 2003-2006

Shifts to higher or lower
VSP bins because of
grade (+ or -) No Grade
With Grade
VSP Bin (kW/ton)
VSP Bin Frequency

Benefits:
Full profile of a vehicle operations/emissions at
moment in time. (no missing data profiles)
More accurate emission data for mode of operation
Reduces time per choreographed drive route/test
Minimize possible failure of PEMS units
Allows for scheduled zeros/spans for drift correction
Allows for more “better” designed tests to be
conducted.
8

PAMS: What parameters are needed?
Date/Time Stamp
GPS
OBD Parameters – Normal
– Engine Speed (RPM)
– Vehicle Speed
– Load %
– Air/Fuel Ratio
– Catalyst Temperature
– Short-Term Fuel Trim
– Long Term Fuel Trim
– Ambient Temperature
– MAP or MAF
– Inlet Temperature
– OBD Codes
– Accelerator Position
– Others
9
• OBD Parameters – Enhanced
- Fuel Economy
- Battery State of Charge (hybrid)
- Others

Instruments and measurements: In-Use Activity
10
Instrument: Logger (by HemData)
Keys features:
• OBD/CAN & GPS (second-by-second)
• “Sleep mode”
• X,Y & Z Accelerometer
LDVs/MDVs HDVs/Nonroad (J1939)

Skid-steer loader: Operation by Day of Week
Measurement Period: Monday June 11, 2007 – Monday, July 2, 2007
Total operation: 16.6 hours

Skid-steer loader: Operation by Hour of Day

PEMS vs PAMS When to use one of them or both?
13
PEMS – Great for Measure emissions, activity & vehicle parameters
– Labor intensive to install/uninstall & calibrate
– High cost
PAMS – Small unit & easy to install
– Only records vehicle parameters & GPS
– Much lower costs
– Captures “real world” activity/non-activity for long periods of time

Use Right Data Gathering Tool: PEMS vs PAMS (Statistical Power)
Portable Emission Measurement Systems (PEMS) – Full emissions profile of vehicle at that moment of time
Represents its aging (odometer, maintenance, environmental
factors)
– Recruit, test, give back vehicle to owner in 2-3 days, allows for more
tests per vehicle or more vehicles tested.
– Include simulated loads emission profiles
– Repeat recruitment to document vehicle’s seasonal or longitudinal
deterioration effects
Portable Activity Measurement Systems (PAMS) – Able to rematch “real world” activity profiles by vehicle OBD
parameters back to emissions.
– Able to install more PAMS device on vehicles for 2-4 weeks or longer
including seasonal effects.
14

How Good is Your Data?
Do you know how good your data is from your PEMS
unit?
How long does it take to know the data gathered
from the PEMS unit is good?
– 15 minutes? 30 minutes?, 1 hour? or hours?
Quick Data Stream Validation is the key to your first
primary determination on data gathering &what next
test your going to conduct next.
15

One Solution: NI Diadem Software
Generates a graph data report on all data streams to confirm or
validate them.
Look to confirm minimum/maximum range values
Advance Features: Perform QA/QC procedures and provides
quick indications that data with “normal” ranges or within
min/max ranges.
Allows for creating set reports that calculated emissions for quick
comparisons between vehicles
Ability to reuse reports for other test programs …… reducing
data validation & QA/QC time and more time on analyzing
emission results.
16

17 Gives full report on data parameters

PM Mass (Int. Filter Time)
DIAdem REPORT Layout 18
Cold start : Peak not shown (2,700 μg/m3!)
PARTICULATE MEASUREMENT: CONTINUOUS AND AGGREGATE
Second by second
Particulate!
Summing the
second-by-second
gives a back-up to
mass on the filters
Exhaust Flow
Accumulating mass on
three filters

19

Why Worry about Vehicle Selection & Representativeness?
In modeling world ….. Is it critical to know
the selection criteria for the vehicle(s) tested
and how it fits within its like total population
20
Total State LDV
population:
N = 10,000
Tested LDV #1
Tested LDV #2
One Company’s LDV Fleet: N=300

Vehicle Selection: Is there a better way?
Is there a way to screen large numbers of vehicles? – Before selecting sample for laboratory measurement?
– By getting a quick inexpensive measure of emissions?
That correlates with lab measurements
– Best candidate: remote sensing
Has been demonstrated for LDV evaporative emissions
Has been demonstrated for Heavy-duty vehicles
Presently being conducted on Tier 2 RSD/PEMS correlation
21

Instruments & measurements: secondary screening (@ NVFEL)
22
Instrument: ESP 4000
HC/CO/NO (remote sensing):
Tier 2 LDVs RSD/PEMS corelation

RSD
Equipment
23
• Conducted by University of Denver (two weeks in July 2009)
• Gaseous pollutants (CO2, CO, THC & NOx)
• Measured at entry gate of Barbour’s Cut port
• Matched license plates to TX DOT database
• RSD readings: 4,032
• Unique vehicles: 1,877

Sampling methodology: HDVs
Classification – “Stratified sampling”
– Population divided into separate ‘classes’ based on RSD NOx
emissions and model year groups
– Each class sampled as an independent sub-population
Quota sampling within each class based on – Probability that a vehicle is actually in the assigned NOx Bin
– Frequency that the vehicle will drive in the Port of Houston during
PEMS & PAMS instrumentation
24

Sampling ‘classes’ based on RSD scores1
25
0
1
2
3
4
5
6
7
8
9
10
-4.5-4.1-3.7-3.3-2.9-2.5-2.1-1.7-1.3-0.9-0.5-0.1 0.3 0.7 1.1 1.5 1.9 2.3 2.7 3.1 3.5 3.9 4.3
Pe
rce
nt
(%)
RSD NOx z-Value
NOx Bin -2 (2.5%)
NOx Bin -1 (20%)
NOx Bin 0 (55%)
NOx Bin 1 (20%)
NOx Bin 2 (2.5%)
1 Data Collection of Drayage Trucks in Houston-Galveston Port Area Draft Report. EP-C-06-080. May 27, 2011

Emissions Analysis
Assign second-by-second measurements from
PEMS into MOVES operating mode bins
– Function of vehicle speed and Scaled Tractive Power
(STP)
– Consist of idle, braking, coast, and cruise modes
– Additional detail provided in the Appendix
Calculate average emission rates by model year
groups
26

Emissions Analysis (cont’d)
Apply population weights based on RSD sampling methodology – Why apply the weights?
In order to capture ‘high-emitting’ trucks in the sample, trucks were recruited with unequal probabilities of selection
Thus, it is necessary to adjust the sample distribution to conform to the known distribution in the RSD population
– Trucks without RSD measurements excluded from the analysis
Compare “in the wild” emissions data to MOVES emission rates for heavy-duty short-haul combination trucks
27

PEMS NOx vs. STP by RSD NOx Bin
0
500
1000
1500
2000
2500
3000
3500
0 1 2 3 4 5 6 7 8 9 10 11 12 13 14 15 16 17
PE
MS
NO
x (
g/h
r)
STP
MYG 1991-1997
0
500
1000
1500
2000
2500
0 1 2 3 4 5 6 7 8 9 10 11 12 13 14 15 16 17
PE
MS
NO
x (
g/h
r)
STP
MYG 1998
0
500
1000
1500
2000
2500
0 1 2 3 4 5 6 7 8 9 10 11 12 13 14 15 16 17 18 19 20
PE
MS
NO
x (
g/h
r)
STP
MYG 1999-2002
0
500
1000
1500
2000
2500
0 1 2 3 4 5 6 7 8 9 10 11 12 13 14 15 16 17 18 19 20
PE
MS
NO
x (
g/h
r)
STP
MYG 2003-2006
28
Cleaner
Bottom line: correlation between RSD readings and PEMS
measurements work but can be improved.

29
0
500
1000
1500
2000
2500
3000
0 1 11 12 13 14 15 16 21 22 23 24 25 27 28 29 30 33 35 37 38 39 40
NO
x (
g/h
r)
opModeID
MOVES Drayage
inc. STP inc. STP inc. STP
1-25 mph 25-50 mph 50+ mph
Draft Data: Houston Drayage (weighted) vs. MOVES: MY 2003-2006

Conclusions
The Tools (PEMS/PAMS) are there to measure
mobile sources
By improving are sampling techniques, selection
criteria, data gathering techniques, analyses and use
of PEMS/PAMS:
– Good data becomes better data
– Able to gathering more data (Statistical power)
More Cooperative Research/Discussions are
needed to support each other in Gathering Data
30

Gallery

32
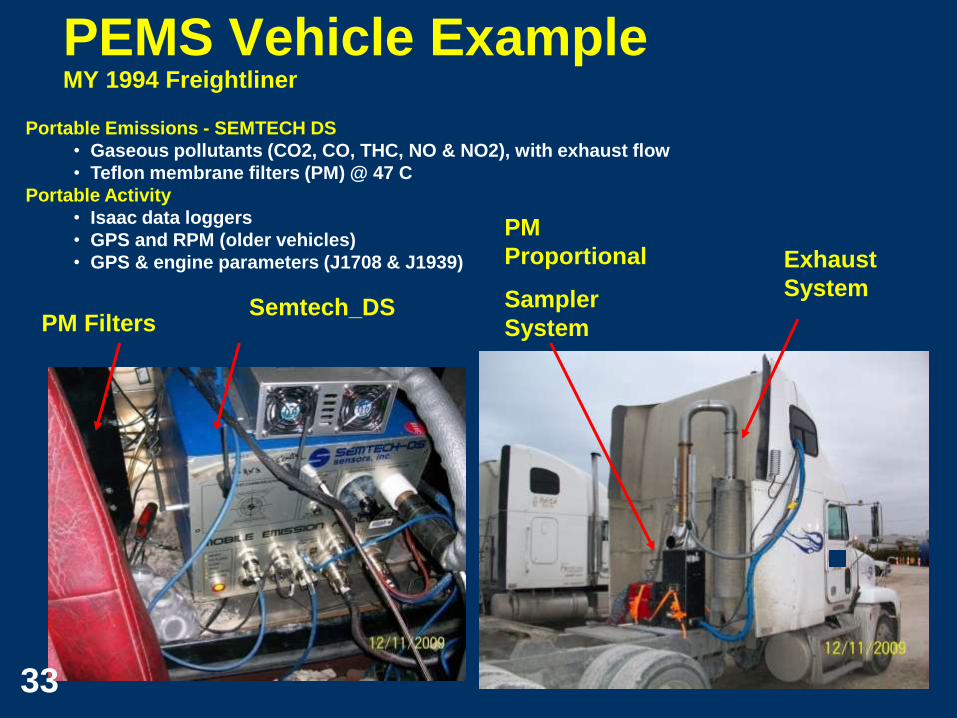
PEMS Vehicle Example MY 1994 Freightliner
Exhaust
System
PM
Proportional
Sampler
System Semtech_DS
PM Filters
33
Portable Emissions - SEMTECH DS
• Gaseous pollutants (CO2, CO, THC, NO & NO2), with exhaust flow
• Teflon membrane filters (PM) @ 47 C
Portable Activity
• Isaac data loggers
• GPS and RPM (older vehicles)
• GPS & engine parameters (J1708 & J1939)

34
PEMS
partially
inside with
Filters/MPS
outside cab
PEMS filters
and DS
inside cab
with MPS
flowmeter
outside

35
Typical PAMS installation to gather
activity:
• GPS & RPM (older vehicles)
• GPS & engine parameters
(J1708/J1939)

36
Questions?

Appendix
37

Time Alignment?
How are you determining time alignment of
data from all data streams?
– Each analyzer has a different , OBD/CAN;
flowmeter, GPS, environmental probe,
proportional sampling & sampling lines lengths
PEMS manufacturers or yourself need to
establish procedures to document this
properly for each equipment setup
38

Time Series: Engine Parameters
0
100
200
300
400
500
600
0
1,0
00
2,0
00
3,0
00
4,0
00
5,0
00
6,0
00
7,0
00
8,0
00
9,0
00
10
,00
0
Elapsed Time (Sec)
Exhaust Flow Temperature (°C)
Exhaust Mass Flow (SCFM)
Engine Speed (RPM × 0.1)