new methods for the preparation and analyses of paint
TRANSCRIPT

HAL Id: tel-01555714https://tel.archives-ouvertes.fr/tel-01555714
Submitted on 4 Jul 2017
HAL is a multi-disciplinary open accessarchive for the deposit and dissemination of sci-entific research documents, whether they are pub-lished or not. The documents may come fromteaching and research institutions in France orabroad, or from public or private research centers.
L’archive ouverte pluridisciplinaire HAL, estdestinée au dépôt et à la diffusion de documentsscientifiques de niveau recherche, publiés ou non,émanant des établissements d’enseignement et derecherche français ou étrangers, des laboratoirespublics ou privés.
New methods for the preparation and analyses of paintsamples from Cultural Heritage artifacts with combined
hyperspectral techniques.Emeline Pouyet
To cite this version:Emeline Pouyet. New methods for the preparation and analyses of paint samples from CulturalHeritage artifacts with combined hyperspectral techniques.. Materials Science [cond-mat.mtrl-sci].Université de Grenoble, 2014. English. �NNT : 2014GRENY088�. �tel-01555714�

THÈSE
Pour obtenir le grade de
DOCTEUR DE L’UNIVERSITÉ GRENOBLE ALPES
Spécialité : Physique des matériaux
Arrêté ministériel : 7 août 2006
Présentée par
Emeline POUYET Thèse dirigée par Marine COTTE et codirigée par Francesco SETTE préparée au sein du European Radiantion Synchrotron Facilities dans l'École Doctorale de Physique de Grenoble
Nouvelles méthodes de préparation et d'analyse par combinaison de techniques synchrotron
hyperspectrales pour l'étude de micro-fragments de peintures et d'autres matériaux du Patrimoine Culturel.
New methods for the preparation and analyses of paint samples from Cultural Heritage artifacts with combined
hyperspectral techniques
Thèse soutenue publiquement le 03 Octobre 2014, devant le jury composé de :
JANSSENS, Koen Professeur, University of Antwerp (Président, Rapporteur)
Ester FERREIRA Professeur, Swiss Institute for Art Research (Rapporteur)
Austin NEVIN Chercheur, CNR-IFN (Membre)
Pauline MARTINETTO Maître de Conférence, Institut Néel (Membre)
Phillipe SCIAU Professeur, Phillipe SCIAU, CEMES CNRS (Membre)
Marine COTTE Chargée de Recherche, LAMS CNRS, et chef du groupe Imagerie, ESRF (Membre)
Francesco SETTE Professeur et directeur général de l’ESRF, ESRF (Membre)


“After a certain high level of technical skill is achieved,
science and art tend to coalesce in esthetics, plasticity, and form.
The greatest scientists are artists as well.”
Albert Einstein


Acknowledgments
Science is a team experiment and for this I would like to deeply thank here all the persons
encountered during this unforgettable 3 years of PhD.
First of all, I would like to thank my promoters and advisors Dr. Marine Cotte and Dr.
Franceso Sette for their support and for allowing me to live my passion during three years in
this bright place which is ESRF.
During these three years I had the pleasure to work alongside wonderful scientists.
In particular I would like to thank Dr Philippe Sciau, Dr. Koen Janssens, Dr. Ester Ferreira, Dr.
Austin Nevin, and Dr. Pauline Martinetto who accepted to read this manuscript and to be
part of PhD jury. They provided me precious advices and comments concerning the years
past and the years to come.
I would like to thank the ID21 and ex-ID22 teams not only for the great professional
exchange we had as colleagues, but also for their personal support and inestimable human
skills: Giulia Veronesi, Hiram Castillo, Murielle Salomé, Barbara Fayard, Camille Rivard,
Bernhard Hesse, David Bugnazet, Jaime Segura Ruiz, Rémy Tucoulou, Anne Bonnin and Julie
Villanova. I would like to particularly thank Sylain Bohic which always made the time to
listen and to provide invaluable guidance; in particular I am really grateful for his daily
cheerful welcome together with such great music.
I would also like to thank the data analysis unit for their permanent support without which
some results would have missed, and in particular I would like to thank Jerôme Kieffer for
his patience and ability to translate computing language.
This work would not have been possible without the support of administrative staff of ESRF,
most notably thank you Elizabeth Dancer and Isabelle Combe.
The present study relates many experiments and I would like to thank collaborators of other
laboratories and institutes for fruitful and fascinating scientific discussions: Lucile Beck,
Austin Nevin, Daniela Saviello, Anna Lluveras, Claire Gervais, Philippe Sciau, Florian Meirer,
Apurva Mehta, Ilaria Cianchetta, Corinne Sanchez, Jana Sanyova, Katrien Keune, Jennifer
Mass, Erich Uffelman, Letizia Monico, Frederik Vanmeert, John Drennan and in particular
Sophie Cersoy and Marie Radepond which made from beamtime and data analyses life
memory.
I will end by thanking my family and my friends for providing me support, friendship, care
and strength in past present and future. In particular I would like thank Thibault which
always had faith in me, making my dream alive and everything possible.


TABLE OF CONTENTS
CHAPTER 1 : INTRODUCTION ............................................................................. 1
1.1. Context ......................................................................................................................................... 1
1.2. References ................................................................................................................................... 5
CHAPTER 2 : SYNCHROTRON-RADIATION MICRO-IMAGING TECHNIQUES FOR
THE ANALYSIS OF PAINTING FRAGMENTS: ADVANTAGES OF THIN-SECTIONS
OVER CROSS-SECTIONS ...................................................................................... 7
2.1. Introduction ................................................................................................................................. 8
2.2. Micro Fourier Transform InfraRed Spectroscopy ........................................................................ 9
2.2.1. Principles of FTIR and applications to painting fragments ................................................... 9
2.2.2. Different acquisition modes available, for an identical result? .......................................... 10
2.2.3. The FTIR end-station at ID21............................................................................................... 13
2.2.4. Assessment of the optimum thickness for FTIR analyses in transmission mode ............... 15
2.3. Micro X-ray Fluorescence .......................................................................................................... 16
2.3.1. Principles of XRF and applications to painting fragments .................................................. 16
2.3.2. µXRF set-up at ID21............................................................................................................. 16
2.3.3. Theoretical and experimental assessment of an optimum thickness for µXRF analyses ... 18
2.4. Micro-X-ray Absorption Spectroscopy ....................................................................................... 23
2.4.1. Principles of X-ray Absorption Spectroscopy and applications to painting fragments ....... 23
2.4.2. µXANES set-up at ID21 ........................................................................................................ 24
2.4.3. Determination of an optimum thickness for XAS measured in XRF mode ......................... 24
2.4.4. Determination of an optimum thickness for XANES acquisition in transmission ............... 26
2.5. Micro-X-ray diffraction ............................................................................................................... 28
2.5.1. Principles of XRD and applications to painting fragments .................................................. 28
2.5.2. Diffraction acquisition modes and related opportunities................................................... 29
2.5.3. μXRD set-up at ID13 (ESRF), P06 (PETRA) and ID21 (ESRF) ................................................. 30
2.5.4. Determination of an optimum thickness for μXRD analyses .............................................. 31

2.6. Conclusion and perspectives...................................................................................................... 33
2.7. References ................................................................................................................................. 35
CHAPTER 3 : PREPARING THIN-SECTIONS FROM PAINTING FRAGMENTS:
CHALLENGES AND INNOVATIVE SOLUTIONS .................................................... 43
3.1. Introduction ............................................................................................................................... 45
3.2. Strategies for section preparation: state of the art ................................................................... 46
3.2.1. Sampling achievement ........................................................................................................ 46
3.2.2. Sample handling and preliminary fragment preparation ................................................... 46
3.2.3. Documentation and storage ............................................................................................... 48
3.2.4. Classical preparation of section .......................................................................................... 49
3.2.4.1. Choice of the resin ....................................................................................................... 49
3.2.4.2. Procedure ..................................................................................................................... 52
3.2.4.3. Infiltration .................................................................................................................... 52
3.3. Common issues with the preparation of cross and thin-sections ............................................. 53
3.4. Alternatives for the preparation of sections .............................................................................. 56
3.4.1. Preparations without embedding: conventional compression using diamond micro-
compression cell ........................................................................................................................... 56
3.4.2. IR-transparent materials as embedding medium: an embedding without FTIR
interferences ................................................................................................................................. 58
3.4.3. Barrier coatings ................................................................................................................... 59
3.4.3.1. IR-transparent salts ...................................................................................................... 59
3.4.3.2. Metal covering / coating .............................................................................................. 60
3.4.3.3. Alternative organic barriers based on conservation treatments ................................. 60
3.5. Novel strategies for the preparation of thin-section ................................................................. 61
3.5.1. Specific issues related to the preparation of thin-section .................................................. 61
3.5.2. Sample Enclosing System (SES) approach ........................................................................... 63
3.5.3. AgCl Resin Embedding (ARE) approach ............................................................................... 66
3.5.4. Perspectives for future innovations .................................................................................... 67
3.6. Double polishing for hard materials .......................................................................................... 70
3.7. Sample mounting ....................................................................................................................... 71
3.7.1. Sample substrate ................................................................................................................ 72
3.7.2. Sample holder ..................................................................................................................... 76

3.8. Combining different SR-based techniques ................................................................................ 77
3.9. References ................................................................................................................................. 81
CHAPTER 4 : GOING TO FULL 2D SPECTRO-CHARACTERIZATION OF CULTURAL
HERITAGE MATERIALS WITH FULL-FIELD XANES .............................................. 85
4.1. Different approaches for 2D-XANES .......................................................................................... 86
4.2. XANES full-field instruments operating in hard X-ray domain................................................... 88
4.3. Acquisition strategy in XANES full-field mode at ID21 ............................................................... 89
4.3.1. The ID21 instrument ........................................................................................................... 89
4.3.2. Acquisition strategy ............................................................................................................ 90
4.3.3. Pre-processing challenges: image normalization and realignment .................................... 91
4.4. Different strategies available for data processing and analyses ............................................... 94
4.5. Typical example of full-field acquisition on model painting samples ........................................ 97
4.6. Sample intrinsic limits for transmission measurements .......................................................... 100
4.6.1. Iron-based mordant in wool ............................................................................................. 100
4.6.2. Degradation of lead chromate-based pigments ............................................................... 102
4.6.2.1. Previous results obtained using combined µXANES and µXRF methods ................... 102
4.6.2.2. Results obtained using full-field XANES approach ..................................................... 104
4.7. A possible solution against radiation damage ......................................................................... 108
4.7.1. Current research on Prussian Blue fading using µXANES, and associated difficulties ...... 109
4.7.2. New opportunities offered by full-field XANES approach ................................................ 110
4.8. Conclusions .............................................................................................................................. 115
4.9. References ............................................................................................................................... 116
CHAPTER 5 : APPLICATIONS TO PAINTINGS AND OTHER ARTISTIC MATERIALS
....................................................................................................................... 119
5.1. Introduction ............................................................................................................................. 120
5.2. Gilding technique in Asian artifacts ......................................................................................... 121
5.2.1. Unburnished gilding of Shuilu’ an temple, a secrete mordant layer ................................ 122
5.2.2. Gilding technology of the Qing Dinasty painters in civil buildings: the mural paintings in
the Five Northern Provinces’ Assembly Hall (Ziyang, China) ...................................................... 129

5.3. Degradation of cadmium yellow pigment in Henri Matisse’ paintings ................................... 133
5.3.1. Introduction ...................................................................................................................... 134
5.3.2. Paintings and samples location ......................................................................................... 137
5.3.3. Analytical methods and data processing .......................................................................... 138
5.3.4. Sample preparation and mounting ................................................................................... 142
5.3.5. The Joy of Life (1905-1906): study of the degradation process ........................................ 143
5.3.5.1. S5 sample: faded yellow field beneath the central reclining figures ......................... 143
5.3.5.2. S111 sample: darkened yellow foliage ...................................................................... 147
5.3.6. Flowers in a Pitcher: degradation and synthesis processes study .................................... 150
5.3.6.1. Darkened BF205 sample ............................................................................................ 150
5.3.6.2. Undarkened BF205 sample ........................................................................................ 152
5.3.7. Conclusion ......................................................................................................................... 155
5.4. Application to other artistic materials ..................................................................................... 157
5.4.1. Acrylonitrile-butadiene-styrene polymer photo-aging in design objects ......................... 157
5.4.2. Estimating Firing Conditions for Roman Ceramics ............................................................ 159
5.5. References ............................................................................................................................... 164
CHAPTER 6 : GENERAL CONCLUSIONS AND PERSPECTIVES ........................... 169
6.1. Conclusions .............................................................................................................................. 169
6.2. Perspectives ............................................................................................................................. 173
6.3. References ............................................................................................................................... 175
APPENDIX A ................................................................................................... 177
APPENDIX B: ABBREVIATIONS LIST ................................................................. 179
APPENDIX C: INDEX ........................................................................................ 181
APPENDIX D: PUBLICATIONS & COMMUNICATIONS ...................................... 183

1
CHAPTER 1 : INTRODUCTION
1.1. Context ......................................................................................................................................... 1
1.2. References ................................................................................................................................... 5
1.1.Context
The study of materials in Art and Archaeology is increasingly benefitting from
analytical spectroscopic techniques. Indeed determining the chemical composition of
matter help in answering major questions regarding the creation of the artwork such as:
Which were the technical skills (from a chemical and physical point of view) required for this
production? How did these skills evolve, from one place to another and from one period to
another? Even at a moderate scale, within the career of an artist, how did his/her technique
and taste evolve?
In addition to diving into History, chemical analyses bring fundamental information for the
conservation of this Cultural Heritage (CH). Identifying the chemical and physical processes
altering the objects, and understanding the factors (light, humidity, gas, etc.) responsible for
these alterations are essentials to develop adapted and efficient restoration and
preservation strategies.
Among the different materials studied (dyes, stones, metals, glass, ceramics, resins,
wood, synthetic materials, etc.), paintings usually present a complex and heterogeneous
structure made of organic/mineral, amorphous/crystallized, major/minor mixtures, evolving
with time.
The use of non-invasive investigation methods over the last few decades, avoiding or
minimizing the need for sampling, have increased in the CH domain, in particular with the
current development of portable equipment for in-situ characterization providing valuable
data at the painting scale (Legrand, et al., 2014, Miliani, et al., 2010, Miliani, et al., 2007).
These techniques (e.g. X-ray fluorescence (Alfeld, et al., 2013), infrared spectroscopy
(Daher, et al., 2014, Monico, et al., 2013, Rosi, et al., 2013), ultraviolet photography (Van
der Snickt, et al., 2009)), should receive priority over more invasive methods since painted

Chapter 1 : Introduction
2
cultural artefacts are unique, and their entire preservation is the ultimate goal of any
conservation study.
However, painting fragments are very complex multi-layered structures with
heterogeneities at the micrometer scale, consequently micro-sampling may be necessary for
probing the intrinsic in-depth stratigraphic structure of paint fragments. In this context,
spatial information at sub-millimetre scale can be obtained by manually separating the
different layers composing the structure of the fragment, but this completely destroys the
sample, and requires a minimum thickness layer (ca. >20 µm). Alternatively, obtaining a full
section preserves the 2D structural information and allows microscopic observation.
Therefore, complementary chemical and spatially resolved techniques, combining
spectroscopy and microscopy, are very well suited to attain a full 2D or even 3D description
of the constitution of painting fragments prepared as section. Considering that the typical
scale of heterogeneity of painting material is in the range of a few microns, the extremely
bright and collimated synchrotron source offers an appropriate high spatial resolution (a
few µm down to some tens of nm) as well as attaining very low detection limits (a few ppb).
Moreover, the energy tunability of the source allows spectroscopic analyses to be carried
out in a wide energy domain, ranging from the infrared to hard X-ray regions.
In this context, Synchrotron Radiation (SR)-based imaging techniques, in particular SR-micro
Fourier Transform InfraRed (µFTIR) spectroscopy, SR micro X-ray Fluorescence (µXRF), SR
micro X-ray Absorption Near Edge Spectroscopy (µXANES) and SR micro X-ray Diffraction
(µXRD), have been increasingly used within the last decades to analyse painting fragments
(Bertrand, et al., 2012, Cotte, et al., 2010, Cotte, et al., 2008, Janssens, et al., 2013).
Each SR-based micro-analytical technique emphasizes a different aspect of the painting
properties. Therefore, the combination of these different techniques is essential to obtain
an improved chemical characterization of the painting. Indeed, a full description of the
painting composition is a real advantage because this enables understanding how the
different ingredients (being original pigments, binders, varnishes, restoration products,
degradation composed, etc.) are related to the different chemical and physical processes
implied during the creation and/or the degradation of the artworks. Consequently in recent
years, the access to a multi-modal platform providing both X-ray and vibrational micro
spectroscopies has become a main asset in the characterization of painting samples. As an
example, the advantage of this approach is given by a recent study of the degradation of the

Chapter 1 : Introduction
3
cadmium-based yellow pigment in Van Gogh’s paintings (Van der Snickt, et al., 2012). This is
a typical example where the combination of µXRF, µXRD, µXANES and µFTIR was necessary
in order to understand the full picture of the organic/inorganic, crystallized/amorphous
materials composing the painting, and to get an insight into the way they interact.
However, the CH community requires an improved and easier combination of these
investigation techniques.
Consequently, the work presented in this manuscript aims at developing a new
methodological approach, providing a more efficient and synergetic use of FTIR and X-ray
microscopies for the analysis of paintings. In this context, developing micro-FTIR and X-ray
techniques through novel acquisition schemes, sample preparations, and instrumental
capabilities opens new ways to hyper-spectral characterization of ancient paintings.
In order to propose adapted new analytical strategies, the standard analytical
procedure for the micro analyses of painting fragments has been examined.
For classical laboratory characterization (visible and electron microscopy mainly), the
sample is usually embedded into synthetic resin before being polished to prepare the cross-
section to be analysed. The analyses are then carried out on the sample cross-section
surface. However this strategy may end into critical constraints regarding feasibility and
efficiency of further micro-analyses. Chapter 2 of the manuscript discusses these limits and
demonstrates the interest of a different strategy based on the preparation and analysis of
thin-sections. Following theoretical and experimental considerations, the optimum
thickness of the thin-sections is discussed and validated using single µFTIR, µXRF, µXRD and
µXANES.
Obtaining thin-section of controlled thickness, in the range of a few microns,
requires a suitable sample preparation strategy. However, the quality of sample preparation
is a quite frequent problem, as most standard sample preparation approaches may lead to
possible analytical and chemical interferences. In Chapter 3 of the manuscript, the state-of
the art of preparation methodologies for painting fragments is presented, and the extension
to thin-section preparation is reviewed and further developed. This allows the introduction

Chapter 1 : Introduction
4
of innovative sample preparation strategies for IR and X-ray spectroscopies to be carried out
on the same sample.
The development of new micro-spectroscopy protocols may also lead to an
improvement and a diversification of the imaging capabilities. This is the case for a new
micro-spectroscopy tool based on a 2D full-field XANES set-up combining XAS with full-field
X-ray microscopy. In Chapter 4 novel methodological capabilities based on full-field/µXANES
are illustrated through applications to paintings identified as ideal candidates to estimate
capabilities and limits of this new strategy in the field of CH in general.
Based on the work presented in the different chapters, Chapter 5 presents
applications to historical paintings. In particular, µFTIR and µXRF are used to reveal gilding
process, in Chinese sculptures and paintings from the XVIth and XIXth Century. In a second
example, µXRF, XANES (full-field and XRF mode), µXRD and µFTIR are combined to study
degradation mechanisms of cadmium yellow pigment in a set of original micro-samples
from Matisse’ s paintings.
Whereas the discussion is primarily focused on painting fragments, other materials also
benefit from the same methodological developments and results obtained on roman black
gloss ceramics and contemporary polymeric design objects are presented as well.
Finally, Chapter 6 presents concluding remarks and perspectives for future
developments.

Chapter 1 : Introduction
5
1.2. References
Alfeld, M., Pedroso, J. V., van Eikema Hommes, M., Van der Snickt, G., Tauber, G., Blaas, J., Haschke, M., Erler, K., Dik, J. & Janssens, K. 2013. A mobile instrument for in situ scanning macro-XRF investigation of historical paintings. Journal of Analytical Atomic Spectrometry, 28 (5):760.
Bertrand, L., Cotte, M., Stampanoni, M., Thoury, M., Marone, F. & Schöderg, S. 2012. Development in synchrotron studies of ancient and historical materials. Physics Reports, 519 (2):51-96.
Cotte, M., Susini, J., Dik, J. & Janssens, K. 2010. Synchrotron-based X-ray absorption spectroscopy for art conservation: looking back and looking forwards. Accounts of Chemical Research, 43 (6):705-14.
Cotte, M., Susini, J., Solé, V. A., Taniguchi, Y., Chillida, J., Checroum, E. & Walter, P. 2008. Applications of synchrotron-based micro-imaging techniques to the chemical analysis of ancient paintings. Journal of analytical atomic spectrometry, 23:820-8.
Daher, C., Pimenta, V. & Bellot-Gurlet, L. 2014. Towards a non-invasive quantitative analysis of the organic components in museum objects varnishes by vibrational spectroscopies: Methodological approach. Talanta.
Janssens, K., Alfeld, M., Van der Snickt, G., De Nolf, W., Vanmeert, F., Radepont, M., Monico, L., Dik, J., Cotte, M., Falkenberg, G., Miliani, C. & Brunetti, B. G. 2013. The Use of Synchrotron Radiation for the Characterization of Artists' Pigments and Paintings. Annual Review of Analytical Chemistry, 6 (1):399-425.
Legrand, S., Vanmeert, F., Van der Snickt, G., Alfeld, M., De Nolf, W., Dik, J. & Janssens, K. 2014. Examination of historical paintings by state-of-the-art hyperspectral imaging methods: from scanning infra-red spectroscopy to computed X-ray laminography. Heritage Science, 2 (1):13.
Miliani, C., Rosi, F., Brunetti, B. G. & Sgamellotti, A. 2010. In Situ Noninvasive Study of Artworks: The MOLAB Multitechnique Approach. Accounts of Chemical Research, 10.1021/ar100010t.
Miliani, C., Rosi, F., Burnstock, A., Brunetti, B. G. & Sgamellotti, A. 2007. Non-invasive in-situ investigations versus micro-sampling: a comparative study on a Renoirs painting. Applied Physics A: Materials Science & Processing, 89:849-56.
Monico, L., Rosi, F., Miliani, C., Daveri, A. & Brunetti, B. G. 2013. Non-invasive identification of metal-oxalate complexes on polychrome artwork surfaces by reflection mid-infrared spectroscopy. Spectrochim Acta A Mol Biomol Spectrosc, 116:270-80.
Rosi, F., Miliani, C., Braun, R., Harig, R., Sali, D., Brunetti, B. G. & Sgamellotti, A. 2013. Noninvasive Analysis of Paintings by Mid‐infrared Hyperspectral Imaging. Angewandte Chemie, 125 (20):5366-9.

Chapter 1 : Introduction
6
Van der Snickt, G., Dik, J., Cotte, M., Janssens, K., Jaroszewicz, J., De Nolf, W., Groenewegen, J. & Van der Loeff, L. 2009. Characterization of a degraded cadmium yellow (CdS) pigment in an oil painting by means of synchrotron radiation based X-ray techniques. Analytical Chemistry, 81:2600-10.
Van der Snickt, G., Janssens, K., Dik, J., De Nolf, W., Vanmeert, F., Jaroszewicz, J., Cotte, M., Falkenberg, G. & Van der Loeff, L. 2012. Combined use of Synchrotron Radiation Based Micro-X-ray Fluorescence, Micro-X-ray Diffraction, Micro-X-ray Absorption Near-Edge, and Micro-Fourier Transform Infrared Spectroscopies for Revealing an Alternative Degradation Pathway of the Pigment Cadmium Yellow in a Painting by Van Gogh. Analytical chemistry, 84 (23):10221–8.

7
CHAPTER 2 : SYNCHROTRON-RADIATION MICRO-IMAGING
TECHNIQUES FOR THE ANALYSIS OF PAINTING FRAGMENTS:
ADVANTAGES OF THIN-SECTIONS OVER CROSS-SECTIONS
2.1. Introduction ................................................................................................................................. 8
2.2. Micro Fourier Transform InfraRed Spectroscopy ........................................................................ 9
2.2.1. Principles of FTIR and applications to painting fragments ................................................... 9
2.2.2. Different acquisition modes available, for an identical result? .......................................... 10
2.2.3. The FTIR end-station at ID21............................................................................................... 13
2.2.4. Assessment of the optimum thickness for FTIR analyses in transmission mode ............... 15
2.3. Micro X-ray Fluorescence .......................................................................................................... 16
2.3.1. Principles of XRF and applications to painting fragments .................................................. 16
2.3.2. µXRF set-up at ID21............................................................................................................. 16
2.3.3. Theoretical and experimental assessment of an optimum thickness for µXRF analyses ... 18
2.4. Micro-X-ray Absorption Spectroscopy ....................................................................................... 23
2.4.1. Principles of X-ray Absorption Spectroscopy and applications to painting fragments ....... 23
2.4.2. µXANES set-up at ID21 ........................................................................................................ 24
2.4.3. Determination of an optimum thickness for XAS measured in XRF mode ......................... 24
2.4.4. Determination of an optimum thickness for XANES acquisition in transmission ............... 26
2.5. Micro-X-ray diffraction ............................................................................................................... 28
2.5.1. Principles of XRD and applications to painting fragments .................................................. 28
2.5.2. Diffraction acquisition modes and related opportunities................................................... 29
2.5.3. μXRD set-up at ID13 (ESRF), P06 (PETRA) and ID21 (ESRF) ................................................. 30
2.5.4. Determination of an optimum thickness for μXRD analyses .............................................. 31
2.6. Conclusion and perspectives...................................................................................................... 33
2.7. References ................................................................................................................................. 35

Chapter 2 : Synchrotron-radiation micro-imaging techniques for the analysis of painting fragments: Advantages of thin-sections over cross-sections
8
Abstract
Synchrotron Radiation (SR) - based techniques such as SR-µ Fourier Transform InfraRed
(FTIR) spectroscopy, SR-µ X-ray Fluorescence (XRF), SR-µ X-ray Absorption Near Edge
Spectroscopy (XANES) and SR-µ X-ray Diffraction (XRD) are increasingly used for the study of
artistic materials, as they offer enhanced spatial resolution and chemical sensitivity. For
such analyses, painting fragments are usually prepared as thick (typically several hundreds
of micrometers) polished cross-sections. The capabilities of these SR techniques can be
significantly improved (enhanced data quality, reduced acquisition time, improved lateral
and in-depth resolution, etc.) if carried out on thin-sections, i.e. less than ~30 µm in
thickness. This part details the different motivations in terms of associated increased
analytical capabilities for SR-µFTIR, SR-µXRF, SR-µXANES and SR-µXRD, used separately or
combined.
Pouyet, E., Fayard, B., Salomé, M., Taniguchi, Y., Sette, F., & Cotte, M. (2015). Thin-
sections of painting fragments: opportunities for combined synchrotron-based
micro-spectroscopic techniques. Heritage Science, 3(1), 3.
2.1.Introduction
The preparation of samples as thin-sections is a standard approach in varied scientific fields,
as in i) geological research, in particular petrography for which thin-section is a useful
methodology for the study and classification of a wide variety of materials, including rocks,
minerals, slags, concrete, mudbrick, and plaster, as well as fired clays, and in ii) biomedical
research, and in particular histological studies, where the preparation of thin-sections is of
prime interest for imaging techniques since it allows working at definite thickness and
correlatively preserved and defined cellular and structural levels (Kiernan, 2008). Derived
from these two domains, the preparation of thin-sections has been extended to artistic
materials (Reedy, 1994) (stone, ceramics (Peterson, 2009), wood (Echard, et al., 2010)), as
well as ancient biomaterials (tissue from mummies (Cotte, et al., 2005), hairs (Bertrand, et
al., 2014), bones (Lebon, et al., 2011), textiles, parchment (Kennedy, et al., 2004)). Over the
last ten years different protocols have been proposed to prepare thin-sections of painting

Chapter 2 : Synchrotron-radiation micro-imaging techniques for the analysis of painting fragments: Advantages of thin-sections over cross-sections
9
fragments: by pressing a fragment in an anvil diamond cell (Cotte, et al., 2008, Salvadó, et
al., 2012, Salvadó, et al., 2009, Van der Snickt, et al., 2012), by reducing sample thickness
following a double-polishing approach (van der Weerd, 2002), or using a microtome (Cotte,
et al., 2009, Herrera, et al., 2009, Pouyet, et al., 2014, Radepont, et al., 2011). However, the
complexity of preparing thin-sections compared with cross-sections hinders its introduction
as a standard approach. Here, we would like to highlight, on the primary basis of SR-based
µFTIR, µXRF, µXANES and µXRD analyses, that the preparation of thin-sections opens new
ways to examine samples from historical paintings using hyper-spectral elemental,
molecular and structural methods and that even if it is more difficult to implement,
deserves being considered. After a general discussion of the enhanced capabilities of each
technique when carried out on thin-sections, a specific discussion will be focused on
combining their results.
2.2.Micro Fourier Transform InfraRed Spectroscopy
2.2.1. Principles of FTIR and applications to painting fragments
FTIR is routinely applied for obtaining information on the presence of molecular groups by
the excitation and the identification of their characteristic vibrational modes.
Stretching vibrations are explained using a simple model which consists in describing a
covalent bond as a simple harmonic oscillator, with two atoms of mass M and m
respectively connected with a spring of strength k. Then according to Hooke’s law, the
frequency of the spring vibration ν is expressed as:
𝜈 =1
2𝜋√
k
μ with μ =
𝑚𝑀
𝑚 + 𝑀
This simple model may be used to describe diatomic molecules, but this becomes more
complicated for complex polyatomic molecules. However, this equation gives a first primary
link between atom nature, chemical bonds and the stretching vibration frequency.
FTIR spectroscopy has been used for the analysis of artistic materials since the
1960’s, and FTIR-microscopy was soon identified as a very promising method (van der
Weerd, et al., 2002). The 2D mapping capabilities offered by the development of coupling a
microscope to a FTIR spectrometer allowed both the selective determination and
localization of compounds present in mixtures. Probing simultaneously mixtures of organic,

Chapter 2 : Synchrotron-radiation micro-imaging techniques for the analysis of painting fragments: Advantages of thin-sections over cross-sections
10
inorganic and hybrid materials, this technique is extensively used for its versatility and its
non-invasiveness to study end-products of controlled or long term reactions of organic
binders with mineral pigments (e.g. in cosmetics (Cotte, et al., 2005) or in paintings
(Salvado, et al., 2005)). The limited lateral resolution (on the order of 100 µm) offered by
laboratory sources has hindered its extension to the microscopic analysis in CH studies
(Casadio, et al., 2001). The implementation of FTIR end-stations at synchrotron facilities, in
the 1990’s, was a real achievement offering a significant improvement regarding lateral
resolution (down to a few microns). The natural low divergence and corollary high
brightness of synchrotron radiation, 2-3 orders of magnitude higher than with the internal
source of laboratory spectrometers (Globar), allowed improved lateral resolution and signal
to noise ratio (SNR). It was soon exploited for the analysis of artworks (Casadio, et al., 2001,
Lepot, et al., 2009).
In parallel much effort has been made to further improve the capabilities of laboratory FTIR
microscopes, mainly through the introduction of Focal Plane Array (FPA) detectors. Such
microscopes enable reaching lateral resolution of the order of 10 µm, and are therefore very
competitive with synchrotron instruments (Spring, et al., 2008). Thanks to these different
developments, µFTIR is becoming a standard technique for the 2D characterization of
molecular groups in paint samples, and in particular for the mapping of organic materials. It
provides a good complement to Scanning Electron Microscopy coupled with an Energy
Dispersive Spectrometer (SEM-EDS) which is routinely used for the 2D elemental analysis of
the inorganic components of painting fragments.
2.2.2. Different acquisition modes available, for an identical result?
The µFTIR analysis of painting fragments can be carried out in three main modes: in specular
reflection, in Attenuated Total Reflectance (ATR), or in transmission (Derrick, et al., 1999).
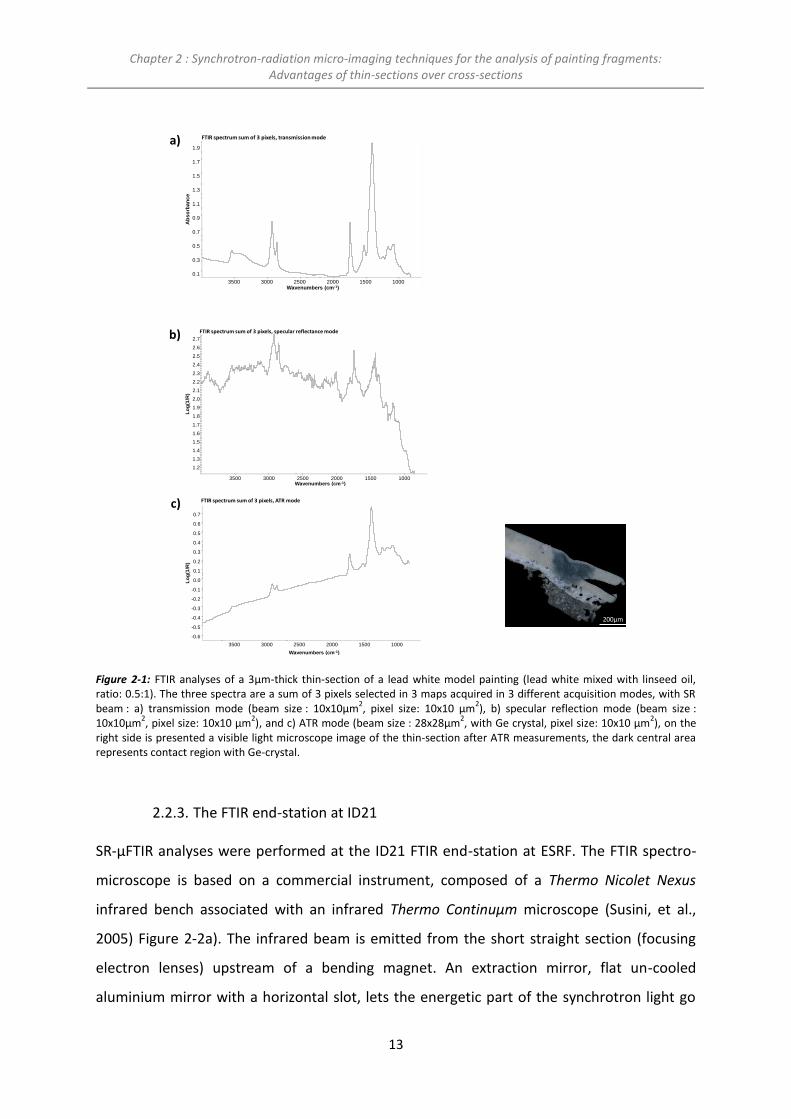
As an illustration, Figure 2-1 shows sum spectra (with 50 scans per spectrum and 0.8 cm-1
spectral resolution) acquired in the three configuration modes on the same 3µm section of a
model painting, made of lead white mixed with linseed oil (mass ratio 0.5:1).
Specular reflection mode relies on the measurements of refractive index changes at the
sample surface associated with absorption bands. Consequently, acquisitions can be

Chapter 2 : Synchrotron-radiation micro-imaging techniques for the analysis of painting fragments: Advantages of thin-sections over cross-sections
11
performed on cross-sections or sample surfaces, without need for physical contact, which
represents its main advantage compared with the two other acquisition schemes (Nevin,
2004, Prati, et al., 2013, van der Weerd, 2002, van der Weerd, et al., 2002, van der Weerd,
et al., 2004). However, spectra appearance can be modified as a function of the relative
amounts of surface reflection and of radiation that has penetrated the sample.
Consequently, spectral information can be difficult to interpret due to the presence of
diffuse reflection, refraction, or scattering effects (Joseph, et al., 2010). The sensitivity of the
FTIR technique in reflection mode is also affected and is typically 3-4 orders of magnitude
less than in transmission mode. In comparison with the two other modes (Figure 2-1b),
spectra present indeed a lower SNR. It can be improved with optimized sample preparation,
but, when compared to ATR mode, it still does not compete in terms of sensitivity and
achievable lateral resolution (Prati, et al., 2013).
ATR mode relies on the absorption measurement of an evanescent wave generated at the
interface of a crystal in contact with the sample surface. The penetration depth of the
evanescent wave into the sample typically ranges from 0.5 to 2µm, and varies depending on
the beam wavelength, its angle of incidence and the indices of refraction of both ATR crystal
and sample probed. A plane and smooth sample surface is the main constraint for ATR
measurement, explaining the increasing use of this device for the analysis of cross-sections
(Joseph, et al., 2010, Joseph, et al., 2010, Mazzeo, et al., 2007, Mazzeo, et al., 2008, Nevin,
2004). This step is nevertheless crucial. Analyses in ATR mode may be indeed complex due
to: i) the need for a high-quality contact between sample and crystal (any trapped air would
distort the spectra), ii) the risk to bend the sample, under the pressure of the tip (as seen in
Figure 2-1c); iii) the risk to contaminate the tip during a raster scanning map with the long
dwell time associated to moving the stage up and down at every pixel in this configuration,
and iv) the possible mismatch between visible and infrared images (Nevin, 2004). Data
treatment of ATR data also presents some challenges as spectra acquired in ATR mode may
differ from those obtained in transmission mode, with a distortion of the relative intensities
of bands and an introduction of a shift to lower frequencies (Cotte, et al., 2008). The relative
intensity shift is known and readily corrected in several softwares. The shift in frequency,
which can result in a displacement of the peak maximum by several wavenumbers, is
though hard to correct for unknown compounds.

Chapter 2 : Synchrotron-radiation micro-imaging techniques for the analysis of painting fragments: Advantages of thin-sections over cross-sections
12
While following discussion will be oriented towards measurements in transmission mode,
performing µFTIR in ATR mode on thin-section should be considered as a complementary
method in the future. Thanks to a four-fold improvement of the spatial resolution, with Ge
crystal, and the possibility to work on thicker sections, ATR measurements would present a
step forward for the combination with X-ray based methods.
Alternatively to reflection and ATR modes, µFTIR analysis of painting fragments can be
performed in transmission mode (Figure 2-1a). As this method necessitates the beam
crosses the sample, it is more demanding in term of sample preparation and requires thin-
section preparation. In this case, the simple correlation between the beam absorption and
the thickness of the sample is established, which facilitates semi quantitative analysis of the
results. Thus concentration of a particular molecular bonding is proportional to the integral
of its absorption peak. Moreover, even if the increasing use of portable in-situ FTIR
equipments in the field of CH is pushing for the development of databases in diffuse
reflectance mode, the most famous references were acquired in transmission mode (e.g.
IRUG, the Infrared and Raman Users Group (http://www.irug.org/), the IBeA, Ikerkuntza eta
Berrikuntza Analitikoa (Castro, et al., 2003)). In this case, spectra can be directly compared
to reference spectra from databases.
The recent combination of bright SR source with FPA detectors, at the Synchrotron
Radiation Center (SRC, Stoughton, USA), requires also thin-sections preparation as the
analyses are carried out in transmission mode. With a unique design of an array of 12 SR
beams, it creates a homogeneous beam over a large field of view. Recently successfully
employed for the analysis of a model painting fragment and some historic paint samples,
this approach offers new formidable performance in terms of spatial resolution and
acquisition time (Nasse, et al., 2011, Patterson, et al., 2013).
Chapter 2 : Synchrotron-radiation micro-imaging techniques for the analysis of painting fragments: Advantages of thin-sections over cross-sections
13
Figure 2-1: FTIR analyses of a 3μm-thick thin-section of a lead white model painting (lead white mixed with linseed oil, ratio: 0.5:1). The three spectra are a sum of 3 pixels selected in 3 maps acquired in 3 different acquisition modes, with SR beam : a) transmission mode (beam size : 10x10μm
2, pixel size: 10x10 μm
2), b) specular reflection mode (beam size :
10x10μm2, pixel size: 10x10 μm
2), and c) ATR mode (beam size : 28x28μm
2, with Ge crystal, pixel size: 10x10 μm
2), on the
right side is presented a visible light microscope image of the thin-section after ATR measurements, the dark central area represents contact region with Ge-crystal.
2.2.3. The FTIR end-station at ID21
SR-µFTIR analyses were performed at the ID21 FTIR end-station at ESRF. The FTIR spectro-
microscope is based on a commercial instrument, composed of a Thermo Nicolet Nexus
infrared bench associated with an infrared Thermo Continuµm microscope (Susini, et al.,
2005) Figure 2-2a). The infrared beam is emitted from the short straight section (focusing
electron lenses) upstream of a bending magnet. An extraction mirror, flat un-cooled
aluminium mirror with a horizontal slot, lets the energetic part of the synchrotron light go
a)
b)
c)
0.1
0.3
0.5
0.7
0.9
1.1
1.3
1.5
1.7
1.9
Ab
so
rba
nc
e
1000 1500 2000 2500 3000 3500 Wavenumbers (cm-1)
FTIR spectrum sum of 3 pixels, transmission mode
1.2
1.3
1.4
1.5
1.6
1.7
1.8
1.9
2.0
2.1
2.2
2.3
2.4
2.5
2.6
2.7
Lo
g(1
/R)
1000 1500 2000 2500 3000 3500 Wavenumbers (cm-1)
FTIR spectrum sum of 3 pixels, specular reflectance mode
-0.6
-0.5
-0.4
-0.3
-0.2
-0.1
0.0
0.1
0.2
0.3
0.4
0.5
0.6
0.7
Lo
g(1
/R)
1000 1500 2000 2500 3000 3500
Wavenumbers (cm-1)
FTIR spectrum sum of 3 pixels, ATR mode
200μm

Chapter 2 : Synchrotron-radiation micro-imaging techniques for the analysis of painting fragments: Advantages of thin-sections over cross-sections
14
through for absorption 2.5m further down (Figure 2-2b). The edge radiation is collected,
collimated and transferred to the spectrometer and microscope using a set of 12 mirrors. In
the microscope, two ×32 Schwarzschild objectives are used in a confocal mode and an
aperture defines the spot size illuminating the sample (Figure 2-2c).
In the mid-IR domain, the signal is detected using a liquid N2 cooled single element
50 µm MCT (HgCdTe) detector. In this configuration, the typical beam size is diffraction
limited in the range of 3 to 10 µm. For mid-IR, measurements can be carried out in
transmission, reflection, trans-reflectance or ATR mode as well.
In this work, spectra were mostly acquired in transmission mode, and samples were
mounted horizontally, on 10×10×0.2 mm³ BaF2 substrates.
µFTIR maps were analysed using the PyMca software package(Sole, et al., 2007) (in
particular the ROI imaging tool) and the OMNIC package (Thermo) (in particular for spectral
identification by comparison with the library data).
Figure 2-2: a)Overview of the SR-FTIR endstation, including the transfer line, the spectrometer and the microscope, b)Picture of extracting mirror of the SR-FTIR endstation, c) Picture of the SR-FTIR endstation combining mirror box, IR spectrometer, and optical microscope.
ID21 – Infrared microscopy end-station
Edge radiation
transfer line
spectrometermicroscope mirror-
box
a)
b) c)

Chapter 2 : Synchrotron-radiation micro-imaging techniques for the analysis of painting fragments: Advantages of thin-sections over cross-sections
15
2.2.4. Assessment of the optimum thickness for FTIR analyses in transmission mode
Analysis in transmission mode requires the beam to go through the sample. This imposes
some constraints and challenges in term of sample preparation. In contrast to X-ray
analyses, the determination of an optimum thickness through theoretical calculation is not
straightforward, and an experimental approach, based on the preparation of sections of
different thicknesses is usually more efficient. In the case of paintings, a typical thickness
ranging from 2 to 20 µm is needed to limit over-absorption and related artefacts (Tsang, et
al., 1991). The thickness choice is indeed challenging and can require preliminary tests on
the largest samples of the corpus in order to identify the correct thickness required to avoid
over- or under-absorption issues. As an example, FTIR maps were obtained on the same
model painting sample (lead white mixed in linseed oil, ratio: 1:1), for different section
thicknesses, from 3 to 8 µm. The structure of the section is visible on both optical (Figure
2-3a) and SEM images (Figure 2-3b): the dotted white line outlines the limit between the
priming layer, from the canvas (bottom layer), and the lead white based paint layer (top
layer). The spectra were specifically extracted from the latter for different thickness values
(Figure 2-3c). In this case, a maximum thickness of 3 µm is appropriate to avoid over-
absorption which would result in a deformation of characteristic C-H and C=O bands.
Figure 2-3: Example of µFTIR transmission spectra of thin-sections of a lead white model painting obtained following the SES method developed in section 3.5.2. a) Visible light microscope and b) SEM images of the 3 µm-thick section, c) FTIR
spectra on 3 to 8 µm-thick sections with a 88 µm2 beam size.
3µm
20
40
60
%T
4µm
20
40
60
%T
5µm
20
40
60
%T
8µm
20
40
60
%T
1000 1500 2000 2500 3000 3500
Wavenumbers (cm-1)
a)
b)
c)
400 μm
200 μm
0
0
0
0

Chapter 2 : Synchrotron-radiation micro-imaging techniques for the analysis of painting fragments: Advantages of thin-sections over cross-sections
16
2.3.Micro X-ray Fluorescence
2.3.1. Principles of XRF and applications to painting fragments
XRF results from the excitation of an inner shell of an atom by the ejection of an electron
from this inner shell. The de-excitation of the atom by the transition of an electron from a
higher shell leads to the emission of an XRF photon of energy characteristic of the excited
element. It is non-destructive, and when performed with micro-focused beams at
synchrotron sources, enables obtaining elemental 2D or 3D images at sub-micrometre scale
with enhanced detection limits (down to ppb). When performing µXANES or µXRD analyses
their combination with µXRF is usually straightforward and provides an elemental mapping
preliminary or complementary to molecular and structural analyses respectively.
In the case of paintings, XRF is commonly performed on thick cross-sections. In addition to
the major elements identification, e.g. those entering into the composition of pigments
(Cotte, et al., 2007), it allows probing the localisation of less concentrated elements such as
environmental contaminants, degradation products and trace elements that could bring
important information on the pigment’s history (provenance, production, etc.) (Janssens, et
al., 2000).
2.3.2. µXRF set-up at ID21
The X-ray Microscopy beamline is installed on a 4.8m long low-β straight section. This
section is equipped with different insertion devices: two U42, and one U32 which cover the
full energy range while maintaining the total power to manageable levels. The white beam
produced by one or two undulators is conditioned in the lead shielded optics hutch
principally by a fixed exit double mirror system (M0), acting as a low band-pass filter. Using
either Rh, Si or Ni reflective coatings it allows third harmonic rejection with factors greater
than 10-3 for any energy between 2 and 9 keV. The Si coating is usually used to cover the 2-
4keV range, the Ni coating to cover the 4-7.5 keV, and Rh for energies higher than 7.5keV.
The energy of the white beam is then defined thanks to a Kohzu fixed-exit double crystal
monochromator (DCM). In addition to a multi-layer, two types of crystals are installed: i)
Si(111) crystals (E/E=10-4, range 2.05-10 keV) are routinely used, ii) Si(220) crystals

Chapter 2 : Synchrotron-radiation micro-imaging techniques for the analysis of painting fragments: Advantages of thin-sections over cross-sections
17
(E/E~10-5, range 3.35-10 keV) are also available for experiments requiring higher spectral
resolution.
Downstream the monochromator, two different instruments are available: a
scanning X-ray microscope (SXM) (Salomé, et al., 2013) (Figure 2-4) and a full-field
microscope (Fayard, et al., 2013) (see Chapter 4). Both are usually operated under vacuum
in the tender X-ray domain (for any energy between 2 and 9 keV).
Figure 2-4: Optical principle of the SXM.
XRF measurements are all carried out in the SXM. In this chamber, the beam size can be
modulated by a set of pinholes (a few tens up to 200 µm) or focused down to less than 1 µm
thanks to different optics (namely a set of Fresnel Zone Plates, or a Kirkpatrick-Baez mirrors
system). The optical configuration of the SXM consists in a focusing optics creating a
demagnified image of the SR source. The sample is aligned in the focal plane of the focusing
device and raster scanned in the beam using a combination of stepper motors and piezo
actuators.
The typical beam size is 0.2 µm ver. × 0.6 µm hor. with a flux ranging from 109 to 1010 ph/s.
The samples are mounted in a vertical plane, at an angle of 60 with respect to the beam.
Transmission and fluorescence detectors surrounding the sample allow on-the-fly
data acquisition for each pixel of the scanned map. A photodiode upstream the sample
Photodiode
Undulator
Crystal monochromator
Focusingoptics
ApertureSample
Fluorescence detector

Chapter 2 : Synchrotron-radiation micro-imaging techniques for the analysis of painting fragments: Advantages of thin-sections over cross-sections
18
allows a continuous measurement of the incoming beam intensity. The transmission
intensity can be measured using a photodiode downstream the sample, while the
fluorescence is detected using different detectors (most often a photodiode or a Silicon Drift
Diode detector, with the configuration detailed in Figure 2-5). A video-microscope allows an
in-situ observation of the sample.
Figure 2-5: Optical image of the fluorescence detection geometry using SDD detector, for a distance of 26mm between sample and detector.
2.3.3. Theoretical and experimental assessment of an optimum thickness for µXRF
analyses
From a theoretical point of view (Van Grieken, et al., 2001), the relation between XRF
intensity of a given emission line and the element weight concentration in the specimen can
be calculated as follows. Considering a monochromatic collimated X-ray beam, with
intensity I0 at the incident energy E0, crossing a homogeneous object of interest with a
penetration angle φ (Figure 2-6), the incident radiation is gradually absorbed by the
specimen (represented as a progressively lightening black line in Figure 2-7a). At a distance t
from the surface, the remaining fraction It(E0) is given by the Beer Lambert law:
𝐼𝑡(𝐸0) = 𝐼0(𝐸0)𝑒−
𝜇𝑠( 𝐸0)𝜌𝑠𝑡
𝑠𝑖𝑛𝜙 (1)
where 𝜇𝑠( 𝐸0) is the mass attenuation coefficient (cm2.g) of the sample at E0 defined
as μ𝑠 =µ𝑙𝑖
ρ𝑠 , with of μli the linear absorption coefficient and ρs (g.cm-3) the sample density.

Chapter 2 : Synchrotron-radiation micro-imaging techniques for the analysis of painting fragments: Advantages of thin-sections over cross-sections
19
The element of interest i absorbs, between t and (t+dt), a fraction of the incident beam
given by: 𝑊𝑖 𝜇𝑖 (𝐸0) ρ𝑠𝑑𝑡
sin ϕ , where μi( E0) is the mass attenuation coefficient of the element of
interest, and Wi its mass fraction.
From the photons absorbed, only a fraction will lead to the emission of XRF photons, this
fraction will be designated as Qi. From this part, photons emitted at the energy Ef in the
volume from (t, t+dt) will be partially re-absorbed following: 𝑒−𝜇𝑠( 𝐸𝑓) ρ𝑠𝑡
𝑠𝑖𝑛𝜃 , where θ is the
detector angle with respect to the sample surface and μs( Ef) is the mass attenuation
coefficient of the sample for XRF photons with energy Ef. Assuming isotropic XRF emission,
only a fraction is emitted towards the detector solid angle Ω, given by Ω/4π. The
contributions from surface and bottom layers of the specimen can be summed as follows,
by integrating the different contributions over dt, following the assumption that the sample
is homogeneous over the thickness defined:
𝐼𝑓(𝐸0) = 𝐼0(𝐸0) Ω
4π𝑄𝑖
W𝑖μi(E0)
(μs(E0)
sin ϕ+
μs(Ef)
sin θ)
(1 − 𝑒−(
𝜇𝑠(𝐸 0)
𝑠𝑖𝑛 𝜙+
𝜇𝑠(𝐸𝑓)
𝑠𝑖𝑛 𝜃)ρst
) (2)
Figure 2-6: Schema of the primary fluorescence emission geometry involved in the eqn. 5.
Eqn. 2 shows that, in the simple model considered, the probability of detecting an
XRF photon depends on different experimental aspects, and in particular on the sample
absorption of both incoming X-ray photons and emitted XRF photons (the presence of filters
or the efficiency of the detector are not considered here).
tdt
θφSection
surface
I0(E0)
If

Chapter 2 : Synchrotron-radiation micro-imaging techniques for the analysis of painting fragments: Advantages of thin-sections over cross-sections
20
The 3D distribution and nature of heterogeneous elements constituting the matrix as well as
the granulometry of the mixture can therefore complicate XRF quantification, in particular
in the case of mixtures of low Z and high Z elements.
The eqn. 2 presented above can be simplified in two cases: the thin-sample and thick-
sample approaches (Van Grieken, et al., 2001).
In the case of an infinite-target (thick sample), a thickness can be defined as a limiting value
above which no further increase in the intensity of the characteristic XRF radiation is
observed when increasing thickness. In this case (𝜇𝑠(𝐸 0)
𝑠𝑖𝑛 𝜙+
𝜇𝑠(𝐸𝑓)
𝑠𝑖𝑛 𝜃) ρst >>1 and the
exponential term goes to 0, so that eqn. 2 is simplified as:
𝐼𝑓(𝐸0) = 𝐼0(𝐸0) 𝑄𝑖Ω
4π
W𝑖μi(E0)
(μs(E0)
sin ϕ+
μs(Ef)
sin θ) (3)
Consequently, the analysis of thick cross-section may relate to the analysis of infinite target,
which may simplify XRF quantification. However, this equation is verified only for
homogeneous sample and may be strongly affected by heterogeneities along beam path.
In the opposite, in the thin-target case, (𝜇𝑠(𝐸 0)
𝑠𝑖𝑛 𝜙+
𝜇𝑠(𝐸𝑓)
𝑠𝑖𝑛 𝜃) ρst << 1 using the Taylor series
expansion, the term (1- e-(
μ𝑠(E0)
sin ϕ+
μ𝑠(Ef)
sin θ)𝜌𝑠𝑡
) can be approximated to (μ𝑠(E0)
sin ϕ+
μ𝑠(Ef)
sin θ) 𝜌𝑠t and
eqn. 2 is simplified as:
𝐼𝑓(𝐸0) = 𝐼0(𝐸0) 𝑄𝑖Ω
4π 𝜌𝑠W𝑖𝜇𝑖(𝐸0)t (4)
The intensity of the characteristic X-ray depends, in a first approximation, linearly on the
concentration of the element of interest, i.e. matrix effects can be neglected.
Simplifying eq. 2 into eq. 4 is possible when the total mass per unit area satisfies:
𝑚𝑡ℎ𝑖𝑛 <0.1
μ𝑠(E0)
sin ϕ+
μ𝑠(Ef)
sin θ
(5)
with mthin=ρst.
Chapter 2 : Synchrotron-radiation micro-imaging techniques for the analysis of painting fragments: Advantages of thin-sections over cross-sections
21
To give an order of magnitude in the context of paintings, these maximum thicknesses were
calculated, using eqn. 5 for a set of common ingredients found in paintings: lead-based
pigments (PbCO3, Pb3O4, PbSO4), quartz (SiO2), atacamite ((CuCl(OH)2), considering the
following conditions ϕ=θ=45°. For all pigments presented, low energy XRF photons (<5 keV,
being from K-emission of low Z elements or L, M emission of high Z elements) are strongly
reabsorbed by the pigments limiting thin-sample case to section thickness of a few microns:
typically 0.5 µm for lead-based pigments considering the Pb Mα emission line (2.345 keV), 1
µm of quartz for the Si Kα emission line (1.739 keV), 1 µm of atacamite for the Cl Kα emission
line (2.622keV) and 5 µm for the Cu Kα emission line (8.047keV). Whereas Cu Kα emission
photons (Ef= 8.047 keV), escape from a 5µm thick section without being strongly absorbed
by surrounding matrix, Cl Kα emission photons (Ef= 2.622 keV) are almost completely
absorbed for the same thickness (with almost ~80% of the XRF photons absorbed on the
radiation path). Consequently, even if K emission lines of heavy elements (copper, iron, etc.)
can escape from high depth into the sample, the contribution of the lighter elements is
limited to the near surface, few microns or tenths of microns, limiting thin-sample case to
very thin-section.
The high penetration depth of X-ray may be an asset compared to electron probes,
for example since it allows 3D analysis of relatively thick samples. However, the high
penetration depth of X-ray complicates quantification measurements. In this context, 2D
µXRF of thin-sections can enable more reliable elemental co-localisation, quantitative
analyses, with better spatial resolution. With the worldwide development of SR-
nanoprobes, the issue of more and more asymmetric voxels will be even further critical and
the preparation of ultra thin samples should be considered.

Chapter 2 : Synchrotron-radiation micro-imaging techniques for the analysis of painting fragments: Advantages of thin-sections over cross-sections
22
Figure 2-7: Schema of experimental conditions for paint analysis a) by SR-μXRF, b) SR-μXANES (both in top view), c) SR-μXRD (side view) for both cross and thin-section cases
μX-RAY FLUORESCENCE
with Efj > Efi
THIN SECTION CASE
If j (Efj)
If i (Efi)
CROSS-SECTION CASE
μX-RAY ABSORPTION
SPECTROSCOPY
with μ(E1)> μ(E2) μ(E2)
μ(E1)
Io(Eo)
μX-RAY DIFFRACTION
Io(Eo)
I0(E1) I0(E2)
μ(E2)μ(E1)
I0(E1) I0(E2)If(Ef)
2D camera 2D camera
I0(E1) I0(E1)
If(Ef)
Thickness(E)=1/μ(E)
Thickness(E)=1/μ(E)
a)
b)
c)
If j (Efj)
If i (Efi)

Chapter 2 : Synchrotron-radiation micro-imaging techniques for the analysis of painting fragments: Advantages of thin-sections over cross-sections
23
2.4. Micro-X-ray Absorption Spectroscopy
2.4.1. Principles of X-ray Absorption Spectroscopy and applications to painting
fragments
X-ray Absorption Spectroscopy (XAS) consists in measuring the variation of the X-ray
absorption coefficient of an element of interest while scanning the energy of the probing X-
ray photons around one of its absorption edges. With the absorption of an X-ray photon, a
core electron is excited into unoccupied electronic states. XANES (X-ray Absorption Near
Edge Spectroscopy) focuses on a ~100eV region above the absorption edge and provides
information regarding the bonding environment (oxidation state, coordination numbers,
site symmetry, and distortion) of the considered element. Synchrotron sources offer not
only the necessary continuous spectral range, but also the necessary intensity to allow high
spectral and lateral resolution in conjunction with effective detection limits (in particular
when XANES experiments are performed in the XRF detection mode).
With respect to the analysis of paintings, this technique is employed to understand
processes taking place during the creation and possible subsequent degradation of
paintings. In fact, because both degradation and fabrication processes (choice of raw
compounds, reactions, temperature, atmospheric conditions etc.) are usually based on
oxidation-reduction reactions, XANES analysis is a powerful tool to understand the full
painting life (Cotte, et al., 2010).
Moreover, the possibility to easily switch from unfocused mode (millimetre scale) to
focused mode (sub-micrometre scale) is a real asset for the study of such heterogeneous
materials. For example, this combination was exploited to analyse degraded Pompeian
paintings, the millimetre beam being used for a macroscopic surface analysis of the
paintings, and the sub-micrometre beam for a more precise study of the painting transverse
cross-sections (Cotte, et al., 2006).
Furthermore, within the range of analytical techniques used for elemental
speciation, XAS is polyvalent, applicable to a large range of materials, without constraints in
term of samples long range order (unlike X-ray diffraction). For instance, while most
inorganic pigments are well crystallised compounds, there are also a few amorphous
pigments which can be well investigated by such a technique. This is for instance the case of

Chapter 2 : Synchrotron-radiation micro-imaging techniques for the analysis of painting fragments: Advantages of thin-sections over cross-sections
24
the smalt, a powdered blue potash glass coloured by the presence of cobalt ions. The study
of smalt discoloration with XAS techniques allowed confirmation that the increase of the
coordination number of Co2+ leads to the loss of pigment colour. It also gave valuable
information regarding the local environment of cobalt in alkali glasses, showing that a
decrease in alkali content causes a charge deficiency around the cobalt resulting in a loss of
the blue colour of the smalt (Robinet, et al., 2011).
2.4.2. µXANES set-up at ID21
XANES data presented in this work were all acquired at the ID21 beamline. This beamline
offers two geometries for XAS acquisition, the SXM geometry (in fluorescence and
transmission modes, with unfocused or focused beam) (see section 2.3.2) and the full-field
geometry (in transmission mode only, see section 4.3).
In the SXM, spectra are usually acquired as average spectra of ten scans, acquired in
continuous mode. This mode allows faster acquisitions and reduces the risk of radiation
damages. A graphical user interface allows an easy positioning of region of interest, both
based on visible and XRF images. XANES spectra presented in this work were normalized
and analysed using PyMca (Sole, et al., 2007) and ATHENA (Ravel, et al., 2005).
2.4.3. Determination of an optimum thickness for XAS measured in XRF mode
XAS analysis requires an accurate measurement of μi(E), the absorption coefficient
which corresponds to the probability that X-rays are absorbed or scattered by the element
of interest. It is related to the transmittance according to Beer’s Law developed in eqn. (1).
µ(E) can be determined in different configurations, either directly by measuring the sample
transmission, or indirectly, e.g. by measuring XRF or electron yields, as a function of the
energy of the incoming X-rays.
In most cases, painting samples are prepared as polished cross-sections, preventing any
measurement in transmission. Measurements are usually carried out in XRF mode (Cotte, et
al., 2010). In such a case, it is generally assumed that the linear X-ray absorption coefficient
μ𝑙𝑖(𝐸) is proportional to the emitted XRF yield 𝐼𝑓 as:

Chapter 2 : Synchrotron-radiation micro-imaging techniques for the analysis of painting fragments: Advantages of thin-sections over cross-sections
25
μ𝑙𝑖(𝐸) ∝𝐼𝑓
𝐼0 (6)
However, for a thick-section where the element of interest is concentrated, which is the
case in many experiments related to the study of pigments, this relation is not verified and
related problem of self-absorption should be considered.
As explained above in the XRF section, depending on the sample composition the XRF signal
can be attenuated and the detected signal will depend on the escape depth of those
photons. However, self-absorption term mainly refers to the attenuation of the incoming
beam and not of emitted photons. It is encountered when the element of interest is mainly
responsible for the penetration depth into the sample (Figure 2-7b). This effect reduces the
difference of XRF intensity measured between spectral regions where the absorption
coefficient is high or low. By damping the amplitude of the X-ray absorption fine structure
oscillations, it severally distorts XANES spectra which may lead to incorrect XANES peak
sizes, attenuated XANES amplitude, uncertainty in determination of coordination number
and wrong standards spectra for linear combination or for PCA target transform. This effect
is illustrated in (Figure 2-8) which represents the XANES spectra of a 4µm thick manganese
foil acquired at the Mn K-edge, both in transmission mode and in XRF mode. In this
example, self-absorption effect leads to a clear decrease of the XANES oscillations in the
spectrum acquired in XRF in comparison with the spectrum acquired in transmission. As
sample composition is well characterized correction procedures can be applied to recover
the true sub-shell photo absorption coefficient. This procedure is complicated or even
impossible in the case of complex samples with partially unknown compositions. In this
context, the analysis of thin-section validating the thin-sample limit considered in eqn. 4,
directly yields to a linear relationship between µli and If, as denoted in eqn. 6. Consequently,
the preparation of thin-section respecting the criteria of eqn. 5 may improve XRF
measurements.

Chapter 2 : Synchrotron-radiation micro-imaging techniques for the analysis of painting fragments: Advantages of thin-sections over cross-sections
26
Figure 2-8: Typical K-edge XANES spectrum of Mn pure metallic foil acquired in the same acquisition condition i) in XRF mode ,and ii) in transmission mode.
As a general rule if a sample, composed of a pure element (μs = μi) in a geometry for which
ϕ=θ=45°, absorbs ~10% of primary beam at edge energy, self-absorption reduces the signal
by about 5%, which is already enough to introduce noticeable errors into the analysis
(Calvin, 2013).
In conclusion when the element of interest is concentrated in the sample, performing
XANES analyses in XRF mode on thin-sections of appropriate thickness allows substantially
reducing the systematic effects which can degrade the analysis of XANES features in XRF
mode (Newville, 2004).
2.4.4. Determination of an optimum thickness for XANES acquisition in
transmission
Alternatively to XRF mode, measuring XANES spectra in transmission allows: i)
circumventing the self-absorption issue, and ii) limiting probed volume. For relevant
transmission measurements, the sample thickness is also a key factor which should be
0
0.2
0.4
0.6
0.8
1
1.2
6.53 6.55 6.57 6.59 6.61 6.63 6.65
Ab
sorb
an
ce
Energy (keV)
Mn foil
Fluorescence mode
Transmission mode
a)
b)
0
0.1
0.2
0.3
0.4
0.5
0.6
0 20 40 60 80 100
Rf
Thickness (microns)
MnSO4
Rf
Rf for thin
0
0.1
0.2
0.3
0.4
0.5
0.6
0 20 40 60 80 100
Rf
Thickness (microns)
Pb3O4
Rf
Rf for thin
0
0.1
0.2
0.3
0.4
0.5
0.6
0 20 40 60 80 100
Rf
Thickness (microns)
MnO2
Rf
Rf for thin
0
0.1
0.2
0.3
0.4
0.5
0.6
0 20 40 60 80 100
Rf
Thickness (microns)
PbCO3
Rf
Rf for thin
0
0.1
0.2
0.3
0.4
0.5
0.6
0 20 40 60 80 100
Rf
Thickness (microns)
Cu2Cl(OH)3
Rf
Rf for thin
0
0.1
0.2
0.3
0.4
0.5
0.6
0 20 40 60 80 100
Rf
Thickness (microns)
PbSO4
Rf
Rf for thin

Chapter 2 : Synchrotron-radiation micro-imaging techniques for the analysis of painting fragments: Advantages of thin-sections over cross-sections
27
carefully defined to achieve the optimal transmission intensity. The sample thickness is
determined by two guidelines:
- the X-ray should not be fully absorbed by the sample, which could then cause a distortion
of the XANES features called over-absorption effects. A typical absorbance maximum value
of μlit ~ 2 - 2.5 is usually advised (corresponding to transmission value in post-edge superior
to 8%).
- on the other hand, the contrast at the edge should be as large as possible: [µli (above edge)
- µli (below edge)]t ~ 1 (corresponding to a ratio of the transmission above the edge vs.
transmission below the edge of 36%). A too thin-section would reduce absorption edge
value and consequently XANES spectrum SNR.
From these considerations, the feasibility of XANES recorded in transmission mode
will be highly dependent on: the element and the edge of interest, the concentration of this
element, and the nature of the matrix.
Figure 2-9 presents theoretical X-ray transmission in the geometry ϕ=θ=45° through a
thickness of 1, 5, 10, 50 and 100 µm of different pure pigments as a function of the energy
of X-ray photons. Pigment layer thickness respecting transmission limit rules is easily
estimated from this figure if looking at the absorption edge of interest as well as the post-
edge region. As an example, a 10 µm layer of pure goethite (FeO(OH)) is suitable for the
acquisition of XANES at the Fe K-edge in transmission mode, since the ratio of transmission
above the Fe K-edge vs. transmission below the edge is of 40%, and transmission in the
post-edge region is still of 35%.
Another advantage of acquiring XANES spectra in transmission is the possibility to go
towards 2D XANES as developed in Chapter 4 of the manuscript.

Chapter 2 : Synchrotron-radiation micro-imaging techniques for the analysis of painting fragments: Advantages of thin-sections over cross-sections
28
Figure 2-9: Calculated transmission of photons with energy ranging from 1 to 30keV in pure pigments and fillers.
2.5.Micro-X-ray diffraction
2.5.1. Principles of XRD and applications to painting fragments
XRD is based on the constructive interferences of X-ray elastically scattered by a regular
array of atoms. For this study, the diffracted intensity (irradiance) of a monochromatic X-ray
beam from a powder is considered under the kinematic approximation. By means of an X-
ray sensitive detector, information on the scattering material, in particular the identification
of the crystallized phased, can be derived from the interference patterns.
XRD performed with a synchrotron source presents several advantages compared with
conventional sources, among which the brightness which, as for µXRF, improves the
achievable detection limit, acquisition dwell time and lateral resolution. The last two points
0
0.1
0.2
0.3
0.4
0.5
0.6
0.7
0.8
0.9
1
0 5 10 15 20 25 30
Tran
smis
sio
n
Energy (keV)
FeO(OH) (Goethite)
1 μm
5 μm
10 μm
50 μm
100 μm
0
0.1
0.2
0.3
0.4
0.5
0.6
0.7
0.8
0.9
1
0 5 10 15 20 25 30
Tran
smis
sio
n
Energy (keV)
Pb3O4 (Minium)
1 μm
5 μm
10 μm
50 μm
100 μm
0
0.1
0.2
0.3
0.4
0.5
0.6
0.7
0.8
0.9
1
0 5 10 15 20 25 30
Tran
smis
sio
n
Energy (keV)
PbCO3 (Cerussite)
1 μm
5 μm
10 μm
50 μm
100 μm
0
0.1
0.2
0.3
0.4
0.5
0.6
0.7
0.8
0.9
1
0 5 10 15 20 25 30
Tran
smis
sio
n
Energy (keV)
Cu2Cl(OH)3 (Atacamite)
1 μm
5 μm
10 μm
50 μm
100 μm
0
0.1
0.2
0.3
0.4
0.5
0.6
0.7
0.8
0.9
1
0 5 10 15 20 25 30
Tran
smis
sio
n
Energy (keV)
PbSO4 (Anglesite)
1 μm
5 μm
10 μm
50 μm
100 μm

Chapter 2 : Synchrotron-radiation micro-imaging techniques for the analysis of painting fragments: Advantages of thin-sections over cross-sections
29
are the key factors for the implementation of XRD in 2D and 3D mapping modes. Besides,
the access to high energies enables the analysis of thick and/or absorbing materials, such as
entire paintings (De Nolf, et al., 2011, De Nolf, et al., 2014).
In the context of the analysis of paintings, µXRD is extensively used for the identification of
various crystallized paint ingredients and degradation products. Beyond common pigment
identification, µXRD enables to differentiate the main compositional groups, which could be
specific of a period, a production process or a geographical origin (Welcomme, et al., 2007).
For the analysis of degradation products, usually present at low concentrations in
micrometric surface layers, where conventional XRD may be insufficient, the micrometric SR
beam proved to be a more selective probe suitable to detect those minor phases (Radepont,
et al., 2011).
2.5.2. Diffraction acquisition modes and related opportunities
XRD acquisitions, in laboratory or at synchrotron, can be performed in two main
configurations: in reflection mode or in transmission mode (Figure 2-7c).
In reflection mode, the sample (being for example a resin-embedded cross-section
(Welcomme, et al., 2007) or a painting (Dooryhée, et al., 2005)) is oriented at grazing angle
(~5-10) which increases beam spot size at sample surface and enhances sensitivity to the
surface topography (Figure 2-7c, left). Moreover, the diffraction scattering signal at low
angle is partially re-absorbed by the resin and the sample itself, therefore limiting the
accessible angle range (Welcomme, et al., 2007). However, this technique allows working on
cross-section already prepared for previous microscopic observation without need for
further sample preparation.
A second approach consists of using μ-XRD in transmission mode (Figure 2-7c, right),
in this case the surface of the section is perpendicular to the beam. This allows reaching
ultimate resolution in both lateral and in-depth directions, and acquiring XRD rings over the
full 2θ range. However, with contrast to the reflection approach, this approach may be more
demanding in term of sample preparation.

Chapter 2 : Synchrotron-radiation micro-imaging techniques for the analysis of painting fragments: Advantages of thin-sections over cross-sections
30
2.5.3. μXRD set-up at ID13 (ESRF), P06 (PETRA) and ID21 (ESRF)
SR-µXRD experiments described in this work were performed on two different beamlines at
ESRF and PETRA, presented below.
At ID13 (ESRF), the primary radiation source is an 18 mm in-vacuum undulator with
an optimum brilliance, for its first harmonics, at about 13 keV. The beamline itself is linear,
with an optics hutch housing a liquid-nitrogen-cooled channel-cut Si(111) monochromator
and three experimental hutches. μXRD experiments were performed in the experimental
hutch II dedicated to micro XRD measurements. Focusing optics like compound refractive
lenses, KB, mirrors and crossed linear Fresnel optics are currently used on this beamline.
(Davies, et al., 2009)
During our studies at ID13 (see Chapter 5), beam was focused with a Kirkpatrick-Baez mirror
optic down to 2.5 x 1.5 μm2 (hor. x vert.). Diffraction signals were recorded in transmission
geometry with a 2k x 2k FReLoN detector (50.0 (h) x 49.3 (v) µm2 pixel size).
μXRD experiments were also performed at P06, a hard-X-ray micro- and nanoprobe
beamline of the PETRA III storage ring (DESY, Hamburg, Germany). The primary energy was
settled to 18 keV by means of a Si(111) double crystal monochromator (Schroer, et al.,
2010). The beam was focused with a Kirkpatrick-Baez mirror optic down to 1.6 x 0.6 μm2
(hor. x ver.). Diffraction signals were recorded in transmission geometry with a 2kx2k
MarCCD area detector (MAR Research, CA, U.S.).
A new micro-diffraction end-station is currently under development at ID21
beamline. Using the side-branch of the line, this station will consist in a complementary and
independent experimental set-up for ID21 users, which will be particularly useful in CH
Sciences, as well as in Environmental, Earth and Planetary Sciences.
The micro-diffraction station will be a stable µXRF/µXRD instrument. The set-up will be
optimized for a single energy of 8.5 keV with the possibility to work in monochromatic or in
pink mode, and with or without any focusing optics. The ultimate beam size using KB
mirrors focalization system will be around 1 x 1 µm2. The set-up will be optimized for micro-
diffraction analyses in transmission but reflection analyses can be envisaged. The sample

Chapter 2 : Synchrotron-radiation micro-imaging techniques for the analysis of painting fragments: Advantages of thin-sections over cross-sections
31
environment will be under air which means that the detection of the lower elements (Na,
Mg, Al, Si, etc.) in XRF will be not possible if there are not major elements.
2.5.4. Determination of an optimum thickness for μXRD analyses
Contrarily to µFTIR and µXANES, in the case of µXRD analyses performed on paint
samples, the energy of the incoming X-ray is not severely imposed by spectroscopic
constraints. Accordingly, there is more flexibility regarding the implementation of diffraction
acquisition. The use of harder X-rays will allow the analysis of thicker samples. This explains
why µXRD is sometimes applied in transmission, to thick polished sections (100 µm)
(Welcomme, et al., 2007).
However, as discussed previously for XRF studies, the controlled thickness of thin-
sections may limit averaging effect along beam path. This point is crucial when dealing with
micrometric painting or degradation layer. The example illustrated in Figure 2-10 highlights
the micrometric features which can be revealed when working with thin-sections. In this
example, a fragment from a painting from the Monastery of Pedralbes, Spain, was sampled
to be analysed by different X-ray based techniques. This sample belongs to a set of
fragments sampled and analysed in 2007 and 2008, during the restoration of the
Monastery. Javier Chillida, in charge of the restoration, revealed original red decorations,
hidden behind a grey-back crust, and an ulterior lime wash. SEM analyses demonstrated the
presence of Hg and S mainly. XANES analyses at ID21, at the S and Cl K-edges revealed the
presence of “Hg-S-Cl” and “Hg-Cl” species. In the frame of Marie Radepont’s thesis
(Radepont, 2013), it was decided to further investigate this sample, by means of µXRD. The
sample was prepared as a thin-section (25μm thick), after embedding in Historesin. µXRD
maps were acquired at P06, Petra, at 18keV with a 21 μm2 step size, allowing the
identification and localisation of both the original red paint layer as well as the secondary
compounds formed during degradation (Figure 2-10). These results confirmed previous
XANES results and offered a more precise identification of degradation compounds (Da
Pieve, et al., 2013).

Chapter 2 : Synchrotron-radiation micro-imaging techniques for the analysis of painting fragments: Advantages of thin-sections over cross-sections
32
Figure 2-10: a) Optical image of a degraded sample from the Monastery of Pedralbes prepared as 25μm thick thin-section. Analysed area is marked with a white rectangle, b) High-resolution μ-XRD color maps, indicating the five minerals from (Da Pieve, et al., 2013).
The optimum thickness can be theoretically estimated considering the two contrary
effects: the thicker the sample, the more scattered (linear with the thickness), but also the
more absorbed (following equation 1) (He, 2011). Properly choosing both wavelength and
sample thickness allows absorption to be kept to an acceptable value, avoiding peak shift
and intensity corrections. This regime is expected for μt=1 corresponding to 33%
transmission of incoming beam across the sample (Sabine, et al., 1998).
Most XRD experiments performed on painting fragments are carried out with an incident
beam energy fixed to about 15 or 30keV. The classical thickness expected for maximum
diffracted intensity in transmission mode is evaluated at those two energies for the
pigments presented in the upper section, using transmission values plotted in Figure 2-9.
67% of absorption is expected at 15 keV and 30 keV respectively for: 60 μm and 400 μm
thick atacamite layer, 30μm (calculated at 13keV in order to avoid L absorption edges) and
150 μm thick for the three lead-based pigments, 70 μm and 500 μm thick goethite layer,
700μm and 5 mm thick quartz layer.
Hg2Cl2 -Hg3S2Cl2α-Hg3S2Cl2
-Hg3S2Cl2α-Hg3S2Cl2β-Hg3S2Cl2
50 μm
50 μm
50 μm
Hg2Cl2 -Hg3S2Cl2β-Hg3S2Cl2HgS
50 μm
a)
b)

Chapter 2 : Synchrotron-radiation micro-imaging techniques for the analysis of painting fragments: Advantages of thin-sections over cross-sections
33
2.6. Conclusion and perspectives
SR based µFTIR, µXRF, XANES and XRD are increasingly employed, for the study of paintings,
providing insight into historical practices and into degradation mechanisms. Their
combination offers a much more complete picture of chemical composition and reactions
involved in the artwork all along its history. In the present paper, the advantages offered by
the analysis of thin-sections, instead of cross-sections are presented. In summary,
advantages were highlighted concerning:
- spatial resolution, in particular by limiting in-depth averaging and by avoiding
chromaticity of penetration depth for ATR-FTIR, μXRF and μXANES.
- results reliability and quantification, by limiting matrix absorption effects in μXRF,
μXANES and μXRD, self-absorption effects in μXANES acquired in μXRF mode, and
by allowing the direct comparison of μFTIR spectrum acquired in transmission
with libraries.
- the possibility to perform fast and large field of view 2D-XANES.
A supplementary discussion was addressed to determine optimum thickness for single
microanalysis as a function of the incoming photons energy and of the sample composition.
In a few words:
- μFTIR is one of the most demanding techniques, with thickness requirements
between 0.5-20 μm.
Thin-section analysis offers new opportunities in terms of spatial resolution for all X-ray
techniques, but supplementary advantages were highlighted specifically for the examples
and the energy range considered (from 2 to 9 keV) in this study:
- Concerning μXRF, the possibility to extend analysis to more quantitative results
has been proposed when applied to a thin-sample case (< 5 μm) or to an
intermediate case (5-20 μm).
- Concerning μXANES, for samples with concentrated elements of interest,
transmission measurements should be preferred limiting data acquisition to
section thickness ranging from 1 to 20 μm. But performing μXANES analyses in
XRF mode on thin-sections of appropriate thickness allows also substantially

Chapter 2 : Synchrotron-radiation micro-imaging techniques for the analysis of painting fragments: Advantages of thin-sections over cross-sections
34
reducing the self-absorption effect, in this case section thickness represents only
a few microns (<5 μm).
- Finally concerning μXRD, thickness requirements are similar to the ones of
μXANES. However, as the energy beam is not sample-dependant, more flexibility
is offered regarding section thickness. Higher energies are usually used which
increase the optimum thickness values, e.g. for an energy ranging from 15 to
30keV thickness may range from tens to a few hundred of microns for the
examples considered.
Finally, out of the SR context the preparation and analysis of thin-sections could be of
interest for other imaging techniques increasingly used for the study of artistic materials. It
is already the case for Transmission Electron Microscopy for which the preparation of ultra
thin sections is a standard practice. Thus many other microscopy-based techniques may
benefit from the analysis of thin-sections, e.g. staining based techniques (Crina Anca Sandu,
et al., 2011), Particle Induced X-ray Emission, or the Scanning Transmission Ion Microscopy
(Beck, et al., 2010).

Chapter 2 : Synchrotron-radiation micro-imaging techniques for the analysis of painting fragments: Advantages of thin-sections over cross-sections
35
2.7. References
Alfeld, M., Pedroso, J. V., van Eikema Hommes, M., Van der Snickt, G., Tauber, G., Blaas, J., Haschke, M., Erler, K., Dik, J. & Janssens, K. 2013. A mobile instrument for in situ scanning macro-XRF investigation of historical paintings. Journal of Analytical Atomic Spectrometry, 28 (5):760.
Beck, L., de Viguerie, L., Walter, P., Pichon, L., Gutiérrez, P. C., Salomon, J., Menu, M. & Sorieul, S. 2010. New approaches for investigating paintings by ion beam techniques. Nuclear Instruments and Methods in Physics Research Section B: Beam Interactions with Materials and Atoms, 268 (11-12):2086-91.
Bertrand, L., Cotte, M., Stampanoni, M., Thoury, M., Marone, F. & Schöderg, S. 2012. Development in synchrotron studies of ancient and historical materials. Physics Reports, 519 (2):51-96.
Bertrand, L., Vichi, A., Doucet, J., Walter, P. & Blanchard, P. 2014. The fate of archaeological keratin fibres in a temperate burial context: microtaphonomy study of hairs from Marie de Bretagne (15th c., Orléans, France). Journal of Archaeological Science, 42 (0):487-99.
Calvin, S. 2013. XAFS for Everyone. CRC Press.
Casadio, F. & Toniolo, L. 2001. The analysis of polychrome works of art : 40 years of infrared spectroscopic investigations. Journal of Cultural Heritage, 2 (1):71-8.
Castro, K., Perez, M., Rodriguez-Laso, M. D. & Madariaga, J. M. 2003. FTIR spectra database of inorganic art materials. Analytical chemistry, 75 (9):214A-21A.
Cotte, M., Checroun, E., Mazel, V., Solé, V. A., Richardin, P., Taniguchi, Y., Walter, P. & Susini, J. 2009. Combination of FTIR and X-rays synchrotron-based micro-imaging techniques for the study of ancient paintings. A practical point of view. e-PRESERVATIONScience, 6:1-9.
Cotte, M., Dumas, P., Richard, G., Breniaux, R. & Walter, P. 2005. New insight on ancient cosmetic preparation by synchrotron-based infrared microscopy. Analytica chimica acta, 553 (1-2):105-10.
Cotte, M., Susini, J., Dik, J. & Janssens, K. 2010. Synchrotron-based X-ray absorption spectroscopy for art conservation: looking back and looking forwards. Accounts of Chemical Research, 43 (6):705-14.
Cotte, M., Susini, J., Metrich, N., Moscato, A., Gratziu, C., Bertagnini, A. & Pagano, M. 2006. Blackening of Pompeian cinnabar paintings: X-ray microspectroscopy analysis. Analytical chemistry, 78 (21):7484-92.

Chapter 2 : Synchrotron-radiation micro-imaging techniques for the analysis of painting fragments: Advantages of thin-sections over cross-sections
36
Cotte, M., Susini, J., Solé, V. A., Taniguchi, Y., Chillida, J., Checroum, E. & Walter, P. 2008. Applications of synchrotron-based micro-imaging techniques to the chemical analysis of ancient paintings. Journal of analytical atomic spectrometry, 23:820-8.
Cotte, M., Walter, P., Tsoucaris, G. & Dumas, P. 2005. Studying skin of an Egyptian mummy by infrared microscopy. Vibrational Spectroscopy, 38 (1-2):159-67.
Cotte, M., Welcomme, E., Solé, V. A., Salomé, M., Menu, M., Walter, P. & Susini, J. 2007. Synchrotron-based X-ray spectromicroscopy used for the study of an atypical micrometric pigment in 16th century paintings. Analytical chemistry, 79:6988-94.
Crina Anca Sandu, I., de Sá, M. H. & Pereira, M. C. 2011. Ancient ‘gilded’ art objects from European cultural heritage: a review on different scales of characterization. Surface and Interface Analysis, 43 (8):1134-51.
Da Pieve, F., Hogan, C., Lamoen, D., Verbeeck, J., Vanmeert, F., Radepont, M., Cotte, M., Janssens, K., Gonze, X. & Van Tendeloo, G. 2013. Casting Light on the Darkening of Colors in Historical Paintings. Physical Review Letters, 111 (20).
Daher, C., Pimenta, V. & Bellot-Gurlet, L. 2014. Towards a non-invasive quantitative analysis of the organic components in museum objects varnishes by vibrational spectroscopies: Methodological approach. Talanta.
Davies, R. J., Burghammer, M. & Riekel, C. 2009. A combined microRaman and microdiffraction set-up at the European Synchrotron Radiation Facility ID13 beamline. J Synchrotron Radiat, 16 (Pt 1):22-9.
De Nolf, W., Dik, J., Van der Snickt, G., Wallert, A. & Janssens, K. 2011. High energy X-ray powder diffraction for the imaging of (hidden) paintings. Journal of analytical atomic spectrometry, 26 (5):910-6.
De Nolf, W., Vanmeert, F. & Janssens, K. 2014. XRDUA: crystalline phase distribution maps by two-dimensional scanning and tomographic (micro) X-ray powder diffraction. Journal of Applied Crystallography, 47 (3):1107-17.
Derrick, M., Stulik, D. & Landry, J. M. 1999. Infrared spectroscopy in conservation science. Los Angeles: The Guetty conservation institute.
Dooryhée, E., Anne, M., Bardiès, I., Hodeau, J. L., Martinetto, P., Rondot, S., Salomon, J., Vaughan, G. B. M. & Walter, P. 2005. Non-destructive synchrotron X-ray diffraction mapping of a Roman painting. Applied Physics A: Materials Science & Processing, 81 (4):663-7.

Chapter 2 : Synchrotron-radiation micro-imaging techniques for the analysis of painting fragments: Advantages of thin-sections over cross-sections
37
Echard, J. P., Bertrand, L., von Bohlen, A., Le Hô, A. S., Paris, C., Bellot-Gurlet, L., Soulier, B., Lattuati-Derieux, A., Thao, S., Robinet, L., Lavédrine, B. & Vaidelich, S. 2010. The Nature of the Extraordinary Finish of Stradivarius Instruments. Angewandte Chemie, 49 (1):197-201.
Fayard, B., Pouyet, E., Berruyer, G., Bugnazet, D., Cornu, C., Cotte, M., Andrade, V. D., Chiaro, F. D., Hignette, O., Kieffer, J., Martin, T., Papillon, E., Salomé, M. & Sole, V. A. 2013. The new ID21 XANES full-field end-station at ESRF. Journal of Physics: Conference Series, 425 (19):192001.
He, B. B. 2011. Two-dimensional X-ray Diffraction. John Wiley & Sons.
Herrera, L. K., Montalbani, S., Chiavari, G., Cotte, M., Sole, V. A., Bueno, J., Duran, A., Justo, A. & Perez-Rodriguez, J. L. 2009. Advanced combined application of mu-X-ray diffraction/mu-X-ray fluorescence with conventional techniques for the identification of pictorial materials from Baroque Andalusia paintings. Talanta, 80 (1):71-83.
Janssens, K., Alfeld, M., Van der Snickt, G., De Nolf, W., Vanmeert, F., Radepont, M., Monico, L., Dik, J., Cotte, M., Falkenberg, G., Miliani, C. & Brunetti, B. G. 2013. The Use of Synchrotron Radiation for the Characterization of Artists' Pigments and Paintings. Annual Review of Analytical Chemistry, 6 (1):399-425.
Janssens, K., Vittiglio, G., Deraedt, I., Aerts, A., Vekemans, B., Vincze, L., Wei, F., De Ryck, I., Schalm, O., Adams, F., Rindby, A., Knöchel, A., Simionovici, A. & Snigirev, A. 2000. Use of microscopic XRF for non-destructive analysis in art and archaeometry. X-RAY SPECTROMETRY, 29 (1):73-91.
Joseph, E., Prati, S., Sciutto, G., Ioele, M., Santopadre, P. & Mazzeo, R. 2010. Performance evaluation of mapping and linear imaging FTIR microspectroscopy for the characterisation of paint cross sections. Analytical and Bioanalytical Chemistry, 396:899-910.
Joseph, E., Ricci, C., Kazarian, S., Mazzeo, R., Prati, S. & Ioele, M. 2010. Macro-ATR-FT-IR spectroscopic imaging analysis of paint cross-sections. Vibrational Spectroscopy, 53 (2):274-8.
Kennedy, C. J., Hiller, J. C., Lammie, D., Drakopoulos, M., Vest, M., Cooper, M., Adderley, W. P. & Wess, T. J. 2004. Microfocus X-ray Diffraction of Historical Parchment Reveals Variations in Structural Features through Parchment Cross Sections. Nano Letters, 4 (8):1373-80.
Kiernan, J. A. J. A. 2008. Histological and histochemical methods : theory and practice / J.A. Kiernan. 4th ed ed.: Scion.
Lebon, M., Muller, K., Bahain, J.-J., Frohlich, F., Falgueres, C., Bertrand, L., Sandt, C. & Reiche, I. 2011. Imaging fossil bone alterations at the microscale by SR-FTIR microspectroscopy. Journal of analytical atomic spectrometry, 26 (5):922-9.

Chapter 2 : Synchrotron-radiation micro-imaging techniques for the analysis of painting fragments: Advantages of thin-sections over cross-sections
38
Legrand, S., Vanmeert, F., Van der Snickt, G., Alfeld, M., De Nolf, W., Dik, J. & Janssens, K. 2014. Examination of historical paintings by state-of-the-art hyperspectral imaging methods: from scanning infra-red spectroscopy to computed X-ray laminography. Heritage Science, 2 (1):13.
Lepot, K., Benzerara, K., Rividi, N., Cotte, M., Brown Jr., G. E. & Philippot, P. 2009. Organic matter heterogeneities in 2.72 Ga stromatolites: Alteration versus preservation by sulfur incorporation. Geochimica et Cosmochimica Acta, 73 (21):6579-99.
Mazzeo, R., Joseph, E., Prati, S. & Millemaggi, A. 2007. Attenuated Total Reflection-Fourier transform infrared microspectroscopic mapping for the characterisation of paint cross-sections. Analytica chimica acta, 599 (1):107-17.
Mazzeo, R., Prati, S., Quaranta, M., Joseph, E., Kendix, E. & Galeotti, M. 2008. Attenuated total reflection micro FTIR characterisation of pigment-binder interaction in reconstructed paint films. Analytical and Bioanalytical Chemistry, file:///C:/Documents%20and%20Settings/cotte/Mes%20documents/Marine-C2RMF/bibliographie/lead/mazzeo-2008-anal-bioanal-chem.pdf:1-12.
Miliani, C., Rosi, F., Brunetti, B. G. & Sgamellotti, A. 2010. In Situ Noninvasive Study of Artworks: The MOLAB Multitechnique Approach. Accounts of Chemical Research, 10.1021/ar100010t.
Miliani, C., Rosi, F., Burnstock, A., Brunetti, B. G. & Sgamellotti, A. 2007. Non-invasive in-situ investigations versus micro-sampling: a comparative study on a Renoirs painting. Applied Physics A: Materials Science & Processing, 89:849-56.
Monico, L., Rosi, F., Miliani, C., Daveri, A. & Brunetti, B. G. 2013. Non-invasive identification of metal-oxalate complexes on polychrome artwork surfaces by reflection mid-infrared spectroscopy. Spectrochim Acta A Mol Biomol Spectrosc, 116:270-80.
Nasse, M. J., Walsh, M. J., Mattson, E. C., Reininger, R., Kajdacsy-Balla, A., Macias, V., Bhargava, R. & Hirschmugl, C. J. 2011. High-resolution Fourier-transform infrared chemical imaging with multiple synchrotron beams. Nat Meth, 8 (5):413-6.
Nevin, A. 2004. ATR and reflectance micro-FTIR: an exploration of their suitability for the analysis of wall paintings cross-sections. conservation of wall painting department, Courtauld Institute of Art, file:///C:/Documents%20and%20Settings/cotte/Mes%20documents/Marine-C2RMF/bibliographie/sample-preparation/Austin-2004-dissertation.pdf.
Newville, M. 2004. Fundamentals of XAFS. In: Chicago, U. o., ed. eds. pp. 1-43.
Patterson, C. S., Carson, D., Phenix, A., Khanjian, H., Trentelman, K., Mass, J. & Hirschmugl, C. J. 2013. Synchrotron-based Imaging FTIR Spectroscopy in the Evaluation of Painting Cross-sections. e-Preservation Science, 10.

Chapter 2 : Synchrotron-radiation micro-imaging techniques for the analysis of painting fragments: Advantages of thin-sections over cross-sections
39
Peterson, S. E. 2009. Thin-Section Petrography of Ceramic Materials.
Instap archaeological excavation manual 2 (Published by INSTAP Academic Press Philadelphia, Pennsylvania).
Pouyet, E., Lluveras-Tenorio, A., Nevin, A., Saviello, D., Sette, F. & Cotte, M. 2014. Preparation of thin-sections of painting fragments: classical and innovative strategies. Analytica Chimica Acta, 822 (0):51-9.
Prati, S., Rosi, F., Sciutto, G., Oliveri, P., Catelli, E., Miliani, C. & Mazzeo, R. 2013. Evaluation of the effect of different paint cross section preparation methods on the performances of Fourier transformed infrared microscopy in total reflection mode. Microchemical Journal, 110:314-9.
Prati, S., Rosi, F., Sciutto, G., Oliveri, P., Catelli, E., Miliani, C. & Mazzeo, R. 2013. Evaluation of the effect of different paint cross section preparation methods on the performances of Fourier transformed infrared microscopy in total reflection mode. Microchemical Journal, 110 (0):314-9.
Radepont, M. 2013. Understanding of chemical reactions involved in pigment discoloration, in particular in mercury sulfide (HgS) blackening, Université Pierre et Marie Curie-Paris VI.
Radepont, M., de Nolf, W., Janssens, K., Van der Snickt, G., Coquinot, Y., Klaassen, L. & Cotte, M. 2011. The use of microscopic X-ray diffraction for the study of HgS and its degradation products corderoite ([small alpha]-Hg3S2Cl2), kenhsuite ([gamma]-Hg3S2Cl2) and calomel (Hg2Cl2) in historical paintings. Journal of analytical atomic spectrometry, 26 (5):959-68.
Ravel, Ã. & Newville, M. 2005. ATHENA, ARTEMIS, HEPHAESTUS: data analysis for X-ray absorption spectroscopy using IFEFFIT. Journal of Synchrotron Radiation, 12 (4):537-41.
Reedy, C. L. 1994. Thin-section petrography in studies of cultural materials. Journal of the American Institute for Conservation, 33 (2):115-29.
Robinet, L., Spring, M., Pages-Camagna, S., Vantelon, D. & Trcera, N. 2011. Investigation of the Discoloration of Smalt Pigment in Historic Paintings by Micro-X-ray Absorption Spectroscopy at the Co K-Edge. Analytical chemistry, 83 (13):5145-52.
Rosi, F., Miliani, C., Braun, R., Harig, R., Sali, D., Brunetti, B. G. & Sgamellotti, A. 2013. Noninvasive Analysis of Paintings by Mid‐infrared Hyperspectral Imaging. Angewandte Chemie, 125 (20):5366-9.
Sabine, T. M., Hunter, B. A., Sabine, W. R. & Ball, C. J. 1998. Analytical Expressions for the Transmission Factor and Peak Shift in Absorbing Cylindrical Specimens. Journal of Applied Crystallography, 31 (1):47-51.

Chapter 2 : Synchrotron-radiation micro-imaging techniques for the analysis of painting fragments: Advantages of thin-sections over cross-sections
40
Salomé, M., Cotte, M., Baker, R., Barrett, R., Benseny-Cases, N., Berruyer, G., Bugnazet, D., Castillo-Michel, H., Cornu, C., Fayard, B., Gagliardini, E., Hino, R., Morse, J., Papillon, E., Pouyet, E., Rivard, C., Solé, V. A., Susini, J. & Veronesi, G. 2013. The ID21 Scanning X-ray Microscope at ESRF. Journal of Physics: Conference Series, 425 (18):182004.
Salvadó, N., Butí, S., Cotte, M., Cinque, G. & Pradell, T. 2012. Shades of green in 15th century paintings: combined microanalysis of the materials using synchrotron radiation XRD, FTIR and XRF. Applied Physics A, 111 (1):47-57.
Salvadó, N., Butí, S., Nicholson, J., Emerich, H., Labrador, A. & Pradell, T. 2009. Identification of reaction compounds in micrometric layers from gothic paintings using combined SR-XRD and SR-FTIR. Talanta, 79 (2):419-28.
Salvado, N., Buti, S., Tobin, M. J., Pantos, E. & Pradell, T. 2005. The nature of medieval synthetic pigments: the capabilities of SR-infrared spectroscopy. IRUG6 Conference, file:///C:/Documents%20and%20Settings/cotte/Mes%20documents/Marine-C2RMF/bibliographie/technique/Salvad%C3%B3-2005-IRUG.pdf:296-301.
Schroer, C. G., Boye, P., Feldkamp, J. M., Patommel, J., Samberg, D., Schropp, A., Schwab, A., Stephan, S., Falkenberg, G., Wellenreuther, G. & Reimers, N. 2010. Hard X-ray nanoprobe at beamline P06 at PETRA III. Nuclear Instruments and Methods in Physics Research Section A: Accelerators, Spectrometers, Detectors and Associated Equipment, 616 (2-3):93-7.
Sole, V. A., Papillon, E., Cotte, M., Walter, P. & Susini, J. 2007. A multiplatform code for the analysis of energy-dispersive X-ray fluorescence spectra. Spectrochimica Acta - Part B Atomic Spectroscopy, 62 (1):63-8.
Spring, M., Ricci, C., Peggie, D. & Kazarian, S. 2008. ATR-FTIR imaging for the analysis of organic materials in paint cross sections: case studies on paint samples from the National Gallery, London Analytical and Bioanalytical Chemistry, 392 (1-2):37-45.
Susini, J., Scheidt, K., Cotte, M., Dumas, P., Polack, F. & Chubar, O. 2005. Why infrared spectromicroscopy at the ESRF ? ESRF Newsletter, 41:24-5.
Tsang, J.-S. & Cunningham, R. H. 1991. SOME IMPROVEMENTS IN THE STUDY OF CROSS SECTIONS. Journal of the American Institute for Conservation, 30 (2):163-77.
Van der Snickt, G., Dik, J., Cotte, M., Janssens, K., Jaroszewicz, J., De Nolf, W., Groenewegen, J. & Van der Loeff, L. 2009. Characterization of a degraded cadmium yellow (CdS) pigment in an oil painting by means of synchrotron radiation based X-ray techniques. Analytical Chemistry, 81:2600-10.
Chapter 2 : Synchrotron-radiation micro-imaging techniques for the analysis of painting fragments: Advantages of thin-sections over cross-sections
41
Van der Snickt, G., Janssens, K., Dik, J., De Nolf, W., Vanmeert, F., Jaroszewicz, J., Cotte, M., Falkenberg, G. & Van der Loeff, L. 2012. Combined use of Synchrotron Radiation Based Micro-X-ray Fluorescence, Micro-X-ray Diffraction, Micro-X-ray Absorption Near-Edge, and Micro-Fourier Transform Infrared Spectroscopies for Revealing an Alternative Degradation Pathway of the Pigment Cadmium Yellow in a Painting by Van Gogh. Analytical chemistry, 84 (23):10221–8.
van der Weerd, J. 2002. Microspectroscopic analysis of traditional oil paint, AMOLF Thesis.
van der Weerd, J., Brammer, H., Boon, J. & Heeren, R. 2002. Fourier transform infrared microscopic imaging of an embedded paint cross-section. Applied Spectroscopy, 56 (3):275-83.
van der Weerd, J., Heeren, R. M. & Boon, J. J. 2004. Preparation methods and accessories for the infrared spectroscopic analysis of multi-layer paint films. Studies in conservation, 49 (3):193-210.
Van Grieken, R. & Markowicz, A. 2001. Handbook of X-ray Spectrometry. CRC Press.
Welcomme, E., Walter, P., Bleuet, P., Hodeau, J. L., Dooryhee, E., Martinetto, P. & Menu, M. 2007. Classification of lead white pigments using synchrotron radiation micro X-ray diffraction. Applied Physics A: Materials Science & Processing, 89 (4):825-32.
Welcomme, E., Walter, P., Bleuet, P., Hodeau, J. L., Dooryhee, E., Martinetto, P. & Menu, M. 2007. Classification of lead white pigments using synchrotron radiation micro X-ray diffraction. Applied Physics A, 89 (4):825-32

42

43
CHAPTER 3 : PREPARING THIN-SECTIONS FROM PAINTING
FRAGMENTS: CHALLENGES AND INNOVATIVE SOLUTIONS
3.1. Introduction ............................................................................................................................... 45
3.2. Strategies for section preparation: state of the art ................................................................... 46
3.2.1. Sampling achievement ........................................................................................................ 46
3.2.2. Sample handling and preliminary fragment preparation ................................................... 46
3.2.3. Documentation and storage ............................................................................................... 48
3.2.4. Classical preparation of section .......................................................................................... 49
3.2.4.1. Choice of the resin ....................................................................................................... 49
3.2.4.2. Procedure ..................................................................................................................... 52
3.2.4.3. Infiltration .................................................................................................................... 52
3.3. Common issues with the preparation of cross and thin-sections ............................................. 53
3.4. Alternatives for the preparation of sections .............................................................................. 56
3.4.1. Preparations without embedding: conventional compression using diamond micro-
compression cell ........................................................................................................................... 56
3.4.2. IR-transparent materials as embedding medium: an embedding without FTIR
interferences ................................................................................................................................. 58
3.4.3. Barrier coatings ................................................................................................................... 59
3.4.3.1. IR-transparent salts ...................................................................................................... 59
3.4.3.2. Metal covering / coating .............................................................................................. 60
3.4.3.3. Alternative organic barriers based on conservation treatments ................................. 60
3.5. Novel strategies for the preparation of thin-section ................................................................. 61
3.5.1. Specific issues related to the preparation of thin-section .................................................. 61
3.5.2. Sample Enclosing System (SES) approach ........................................................................... 63
3.5.3. AgCl Resin Embedding (ARE) approach ............................................................................... 66
3.5.4. Perspectives for future innovations .................................................................................... 67
3.6. Double polishing for hard materials .......................................................................................... 70
3.7. Sample mounting ....................................................................................................................... 71
3.7.1. Sample substrate ................................................................................................................ 72
3.7.2. Sample holder ..................................................................................................................... 76
3.8. Combining different SR-based techniques ................................................................................ 77
3.9. References ................................................................................................................................. 81

Chapter 3: Preparing thin sections from painting fragments: challenges and innovative solutions
44
Abstract
For more than a century, the analyses of painting fragments have been carried out mainly
through the preparation of thick resin-embedded cross-sections. Taking into account the
development of innovative micro-analytical imaging techniques, alternatives to this
standard preparation method need to be considered. Consequently, dedicated efforts are
required to develop preparation protocols limiting the risks of chemical interferences
(solubilisation, reduction/oxidation or other reactions) which modify the sample during its
preparation, as well as the risks of analytical interferences (overlap of detected signals
coming from the sample and from materials used in the preparation) which modifies the
sample signal during the acquisition.
This chapter focuses particularly on the preparation of thin-sections (1-20 µm) for single or
combined FTIR spectroscopy and X-ray 2D micro-analysis. A few strategies, specially
developed for the µFTIR analysis of painting cross-sections, have already been reported and
their potential extrapolation to the preparation of thin-sections is discussed. In addition, we
propose two new specific methods: i) the first is based on an embedding free approach,
ensuring a complete chemical and analytical neutrality, ii) the second is based on a barrier
coating approach which strengthens the sample and avoids the penetration of the resin into
the sample. The barrier coating investigated is a silver chloride salt, an infrared transparent
material, which remains malleable and soft after pellet compression, enabling microtoming.
Whereas a specific discussion in Chapter 2 was dedicated to the optimization of the
procedures for each SR micro-analytical technique, a specific discussion is focused here on
the challenges and solutions for their combination.
Pouyet, E., Lluveras-Tenorio, A., Nevin, A., Saviello, D., Sette, F., & Cotte, M. (2014).
Preparation of thin-sections of painting fragments: Classical and innovative
strategies. Analytica chimica acta, 822, 51-59.
Chapter 3: Preparing thin sections from painting fragments: challenges and innovative solutions
45
3.1.Introduction
For more than one century, painting fragments have been prepared mainly as resin-
mounted and polished thick sections (typically in the order of 1 mm3), called cross-sections.
Before the well-known paper by Laurie on Egyptian blue (Laurie, et al., 1914), an earlier
article reported the preparation of the first painting cross-sections in 1910 (Raehlmann,
1910). In 1934, Gettens extended the method to fine art in general (Gettens, 1936). An
important and exhaustive paper by Plesters, in 1956, discusses the advantages and the
necessity to prepare painting cross-sections and details the interest for using a very small
part of the entire object, which may be sufficient to extract significant information (Plesters,
1956). The sample preparation described in this reference is almost the same as the
preparation used today and is based on four steps: 1) mounting of the sample, 2)
embedding it in resin, 3) polishing the polymerized block to reveal the stratigraphy and 4)
storing of the whole resin block for future studies. Such cross-sections are relatively easy to
achieve, to handle and to store, and are compatible with classical investigations such as
visible and electron microscopies. This preparation method slowly became a routine for
micro-fragment examination in museums and related institutions, which continues to give
valuable information on painting layer structures, pigments and painting techniques
(Derrick, et al., 1994).
Nowadays, the set of micro-analytical techniques available for the study of paintings
is constantly expanding with the emergence and improvement of instrumentation. For
example Time-of-Flight Secondary Ion Mass Spectrometry (TOF-SIMS), X-ray photoelectron
spectroscopy (XPS), Electron Energy Loss Spectroscopy (EELS), X-Ray computed tomography
(CT), Atomic Force Microscopy (AFM), Surface Enhanced Raman Scattering (SERS) and
Scanning Transmission Ion Microscopy (STIM) have been applied to analyse micro-samples.
A careful and specific protocol for sample preparation is a major determining factor in the
success of these new analytical approaches. In most cases, these suitable procedures are
more time consuming than the classical cross-section method mentioned above, but offer a
gain in terms of data quality and reliability, and consequently in terms of data processing to
obtain new insights on the studied issue. Accordingly, an increasing number of scientists,
conservators, historians and archaeologists are interested in the definition of “best-
practices” and protocols for painting fragment preparation. This is nicely illustrated by the

Chapter 3: Preparing thin sections from painting fragments: challenges and innovative solutions
46
work carried out on this topic within the framework of the CHARISMA project (Spring, et al.,
2011).
The present chapter focuses on the analysis of painting fragments using, individually
or as a combination, the set of synchrotron based micro-analytical techniques developed
above µFTIR, µXRF, µXANES and µXRD. As detailed in the previous chapter, they can be
carried out on cross-sections, but they may offer improved capabilities if applied on thin-
sections. Therefore, in the following, after a generic discussion about technical issues
related to the preparation of sections, a specific discussion is proposed about the
preparation of thin-sections. Finally, the problematic related to the combination of
techniques on unique or adapted samples will be discussed.
3.2. Strategies for section preparation: state of the art
3.2.1. Sampling achievement
Sampling is defined as the process of selecting and collecting the sample for analysis. It was
discussed at European scale by the European Committee for Standardization (CEN) which
published a complete document providing a set of guidelines concerning the methodology
of sampling materials from cultural property (http://standards.cen.eu/ Technical Bodies EN
16085:2012).
However, once a fragment is sampled, the sample preparation into a suitable form for
analyses requires additional steps determining the quality of the preparation and so the
utility of the analytical results. Each step of the preparation has to follow an accurate
strategy to prevent any contamination or loss of the material as detailed in the following
parts.
3.2.2. Sample handling and preliminary fragment preparation
Depending on the size and the nature of painting fragment, different handling and cutting
tools are available.
In the case of wall painting, the quantity of painted material sampled is generally higher, as
a proportion of the size of the whole piece of art, than in the case of easel paintings.
Consequently, the manipulation of wall painting samples is usually eased avoiding fine tools

Chapter 3: Preparing thin sections from painting fragments: challenges and innovative solutions
47
requirements. However, the size of the sample as well as the possible dried and rough
preparing mural layer may need both to be reduced limiting further technical issues during
the section preparation, e.g. during resin infiltration or microtoming steps. In this context,
splitting the primary sample without disturbing the full stratigraphy (multiple layers: sizing,
grounding, painting, varnish or degraded layers) is not straightforward. Microsurgical
scalpels with sharp and thin blades are thus advised, being either commercial or home-
made, manufactured by adhering a small part of a broken razor blade to a wooden stick
(Hill, 1989) (Figure 3-1).
a) b)
Universal metal scalpel blade (pointed or curved-end)
Blade prepared from cut razor blade
Artist’s brush (a few bristles may be removed)
Tungsten fine-point needle
Eyelash brush
Figure 3-1: a) Scheme of classical tools used for painting fragment handling based on (Derrick, et al., 1999); b) Optical images of commercial micro-tool (from Electonic Microscopy Science): needle and knife (from left to right), with knife-edge of 0.5 and 1 µm respectively, used during the study for their fine-point characteristics.
Once the section from the fragment is sampled (typically less than 1mm for mural painting,
300µm for easel painting, or a few microns for small particles), brush, needle and tweezer
are fundamental for its manipulation, its transfer, and its storage. Very thin tungsten
needles and tweezers may be used (Figure 3-1), with extremely fine point around 1μm, or
less for smaller particles. As the home-made blade, thin brush adapted to very fine sample
or particles can be obtained by gluing a cat hair or a thick human eyelash to a wooden stick,
or just by removing most of the bristles of an original brush to keep only a few of them
(Reid, 1972).

Chapter 3: Preparing thin sections from painting fragments: challenges and innovative solutions
48
For any manipulation of the sample, gloves are advisable and cutting should occur under a
binocular magnification, in a semi-close surrounding box (e.g. Petri box) on a very clean and
large surface covered with a white clean sheet of paper to avoid any loss or pollution of
original material.
3.2.3. Documentation and storage
An accurate documentation about the sample is essential for the rest of the experiment. In
this context laboratories try to develop and update database for each new sample.
Important information can be recorded in a table, as below for example (Table 3-1):
DATE ARTWORK OR SITE
SAMPLED
SAMPLING AREA
(PHOTO)
SAMPLE NAME
SIZE/WEIGHT PROBLEMATIC GENERAL OBSERVATION
OPTICAL OBSERVATION
ANALYSES PROGRAMMED
Table 3-1: This table summarizes all important information to store before starting the handling of fragment sampled.
The labelling is directly performed on the sample containers. Various containers exist (Table
3-2), and a choice may be done among them case by case.
PAINTING FRAGMENT
SIZE TOOLS CONTAINERS
Wall painting > 1 cm
Tool available in any laboratory
Microsurgical scalpel
Membrane Box Glass Vials
Japanese Paper Polypropylene tube [-] Classical Plastic box [-]
Ziploc bags [-]
Wall painting Easel painting
>0.2 cm Microsurgical scalpel
Fine point forceps
Membrane Box Polypropylene tube [-]
Gelatine capsule [-]
Wall painting Easel painting
<0.2 cm Mini-Micro Tools Cupped microscope slides
Slide well Table 3-2: The different containers available and currently used for sample storage are summarized in this table. [-] represents possible contamination risks during analytical analyses.
For plastic containers, problems of electrical charging complicate removal of the sample
and the presence of additive on/in the bulk containers can lead to contamination of the
sample, hardly damageable if the sample is in solution. Gelatine capsule, rich in

Chapter 3: Preparing thin sections from painting fragments: challenges and innovative solutions
49
proteinaceous materials, could also contaminate the sample for further organic analysis. In
this context, Japanese paper or aluminium foil as well as glass-based containers are three
alternatives to minimize this contamination (Derrick, et al., 1999).
3.2.4. Classical preparation of section
The standard sample preparation practice largely used in the CH domain, especially for the
examination of painted surfaces in art conservation (Khandekar, 2003, Wachowiak Jr, 2004),
derives from the biomedical field and involve an embedding media with a twofold function:
- it consolidates the sample and allows the entire preservation of its structure during
polishing or microtoming,
- it provides an easy support to handle, to position (for microscopic analysis) and to store
the sample.
This strategy is identified of prime choice among the CH community since it gives valuable
information on i) painting’s layered structure (with additional information in case of relining,
overpainting or other restoration procedures), ii) pigments and iii) painting techniques
(Derrick, et al., 1994).
3.2.4.1. Choice of the resin
Cross and thin-sections are usually obtained after embedding a sample in a synthetic
embedding resin either: polyester, epoxies or acrylics.
Historically, natural resins and waxes have been first used as embedding media for painting
fragments (Laurie, et al., 1914), they were then partially supplanted by the use of catalyzed
polyester and methacrylate resins during the middle of the 20th century. Finally, several
alternatives were tested and adopted using resin including acrylic, polyester and epoxies
(Khandekar, 2003, Waentig, 1993) mainly employed for fine art.
All polymers are composed of long chain-like molecules consisting of many simple
repeating units. Polyester resins are a special type of alkyd resins. They are often used to
embed and encapsulate samples or objects in the CH field. They are formed by the reaction
of carboxylic diacids, and dialcohols. A conversion of initially liquid resin by cross-linking

Chapter 3: Preparing thin sections from painting fragments: challenges and innovative solutions
50
chain leads to the formation of a solid following the reaction illustrated below (Figure 3-2a)
in the case of Poly (ethylene terephtalate) polyester (PET).
Epoxy resins present the highest performances in term of mechanical properties and water
degradation resistance explaining their wide applications in CH embedding process. Curing
occurs by reacting an epoxy monomer with a hardener instead of catalyst, often an amine
but any molecule containing reactive hydrogen may react with the epoxy group. This
reaction is illustrated in the case of diglycidyl ether of bisphenol-A (DGEBA) polymerization
(Figure 3-2b).
Acrylic resin is a general term for any plastics generated through chemical reaction by
applying polymerization initiator and heat to acrylic acid, methacrylic acid, esters of these
acids, or acrylonitrile. As an example, polymethyl methacrylate (PMMA) is produced from
the methyl methacrylate monomer (MMA) (Figure 3-2c). They possess three main
advantages: excellent durability, high transparency and resistance as coating material
explaining their wide use for automotive coatings, architectural coatings, and plastic
coatings.
As mentioned in the CHARISMA report (Spring, et al., 2011), each laboratory uses its own
protocol. Among the institutes listed in the project, three types of embedding resin are
mainly employed for fine art: Polyester (most common), Epoxy and Polymethyl
methacrylate. Among these three top-resins, Derrick discussed their different particular
interest and identified polyester as the best resin for embedding and microtoming most
types of art materials (Derrick, et al., 1994) highlighting issues related respectively to i)
epoxy resins: color changes, which tend to turn yellow within time, and hardness properties,
too hard and too fragile for microtoming, and ii) acrylic resins: shrinkage reactions upon
curing.
In the present study, Histo Resin (Leica), 2-hydroxyethyl methacrylate, with the chemical
activator, dibenzolperoxide, was used for its soft cutting and transparency properties
without noticing any shrinkage issues.

Chapter 3: Preparing thin sections from painting fragments: challenges and innovative solutions
51
Figure 3-2: Simplified chemical reaction of polymerization for three different synthetic polymers namely polyester, epoxy and acrylic illustrated respectively in the case of a) Poly (ethylene terephtalate) polyester (PET), b) diglycidyl ether of bisphenol-A (DGEBA) and c) polymethyl methacrylate (PMMA).
If preparation methods are a combination of tradition and habit, the main effects
induced by classical embedding need to be evaluated for the sample considering the
different risks listed as:
- risk of interference with organic compounds present into the painting, such as binders,
- risk of exothermic reaction for polymerization of the resin, leading to chemical
modification of organic components,
- risk of discrepancy between the sample and resin presenting different hardness,
- risk of opacity which would affect the proper orientation of the sample and complicates its
handling,
- risk of resin shrinkage upon curing which will induce changes in the physical constraints
applied on the sample (stress or resin removal),
radical
polymerizationO
CH3
=
CH3
C = O
CH2 – C – CH2 – C ––
OCH3
C = O
––
OCH3
CH3
CH2 = C – C – OCH3
c)
MMA PMMA
a)
CCOO
OHHO
O – CH2 – CH2– O
HHCC
=
OO
–
=
– O – CH2 – CH2– O –
– ––
b)
bisphenol A
prepolymer polymerization
reticulation reaction
ethylene glycolterephtalic acid PET
epichlorohydrin
n
– –
DGEBA
CHO OH
––
O
CH2 – CH – CH2 – Cl
O
CH2 – CH – CH2 – O C
––
O–CH2–CH– CH2
O
CH2 – CH – CH2 – O C
––
O – CH2 – CH – CH2 – O C
––
O–CH2–CH– CH2
O–
OH
n
n n
n
CH3
CH3 CH3
CH3nO
CH3
CH3

Chapter 3: Preparing thin sections from painting fragments: challenges and innovative solutions
52
- risk of high infiltration for low-viscosity resin into fragile samples.
3.2.4.2. Procedure
For any type of resin, the liquid resin/catalyst ratio must be respected, an excess of catalyst
weakening the block and making the microtomed section crumbly.
Once the correct mixture resin/catalyst is achieved, a mold is half fill and let until the resin is
cured. The use of an oven at 35°C (room temperature) may accelerate and improve the
curing reaction (typically 2 hours in our case). The sample is then installed on the solid block
and oriented under binocular. A paper label may be placed on the free-sample area of the
polymerized block, labeled with a dye insoluble in the solvent resin present (e.g. printer
dye). Then, the mold is filled with fresh resin. A needle can be used to maintain the sample
orientation during the filling step.
It is advised to wait until the end of the polymerisation, i.e. more than two days for any
microtomimg or polishing action. For polyester, authors (Derrick, et al., 1994) recommend
to perform cutting within the month of embedding whereas for methacrylate resin, no
related long term storage issue is mentioned or was observed during this study.
3.2.4.3. Infiltration
In the case of porous and permeable sample, when the binder content is low enough
(Hansen, et al., 1993), containing less than 20% binding media (Martin de Fonjaudran, et al.,
2008) infiltrated resin can fill empty network around the pigments and coat the particles.
This consolidation can be necessary to prevent possible damage on the cross-section surface
during polishing or microtoming since the smooth block assures the preservation of leanly
bound sample. Some institutes, i.e. Centre de Recherche et de Restauration des Musées de
France (C2RMF) or Institut royal du Patrimoine artistique (IRPA), use a vacuum pump system
to assure the total resin infiltration into the sample, and to overcome air bubbles relaxing
during the resin curing (which could damage the sample during polishing or cutting, and
could induce loss of a part of the entire fragment).
However, this technique may present supplementary analytical challenges, as explained
below.

Chapter 3: Preparing thin sections from painting fragments: challenges and innovative solutions
53
3.3. Common issues with the preparation of cross and thin-sections
The long use of such organic embedding media demonstrates the efficiency of this
traditional approach. However, it also leads to critical chemical and/or analytical
interferences. In our terminology, chemical interference means that the sample has been
chemically modified (dissolved, oxidized, contaminated, etc.) during the sample
preparation; similarly, analytical interference implies that exogenous materials used for
sample preparation contribute to the detected signal, whatever the technique. This
interference may hide or distort the signal from the sample.
Regarding chemical interferences, the dissolution of some original or degraded
painting material in the liquid prepolymer is one of the most important issues (Derrick, et
al., 1994). The solubilisation of waxes present in furniture finish samples, the solubilisation
of organic dyes on inorganic carriers in modern pigments, and the solubilisation of natural
resin samples of dammar, mastic and copal have been reported (Derrick, et al., 1999).
Moreover, solubilisation can also take place after embedding; for example, water sensitive
compounds can be dissolved during wet polishing or wet cutting.
Analytical interferences will strongly depend on the problematic, the sample
permeability and obviously the analytical method(s) used. Such interferences are
particularly critical for the analysis of i) the surface of the fragments and ii) the bulk of
porous and permeable samples (Figure 3-3).
Figure 3-3: An identification scheme for a systematic preparation strategy of painting thin-sections.
ArtworkSampling ?
In-situ & non-
invasive analyses
Correct thickness
for transmission ?
No
preparation
Preparation: Chemically &
analytically neutral ?
Bulk
analysis
Surface and
bulk analysis
Non porous sample
Permeable and/or leanly
bound sample
Standard procedure
Alternative procedure
no
yes
yes
no
no
yes

Chapter 3: Preparing thin sections from painting fragments: challenges and innovative solutions
54
In the latter case, when the binder concentration is low (Hansen, et al., 1993), the
presence of such an embedding medium within the sample may affect the direct
observation with visible microscopy by hiding some aspects of the stratigraphy, thereby
preventing the identification of the different paint layers and their interfaces (Derrick, et al.,
1999).
The presence of an organic embedding medium within the section may also affect
the identification of the constitutive original organic components of the painting. This issue
concerns a large range of analytical techniques such as FTIR, Raman microscopy, TOF-SIMS,
STIM and visible microscopy with or without staining (Derrick, et al., 1994). For vibrational
spectroscopies and more precisely for FTIR, the strong absorption features related to the
resin C-H and C=O molecular groups, may compete or hide typical bands of the paint
materials. Many authors refer to the difficulties of identifying characteristic absorption
bands of paint components due to bands overlap issues (Derrick, et al., 1994, Lluveras, et al.,
2008). The identification of organic binders and varnishes, in particular those made of
polyester compounds such as oil, can be very difficult. Moreover, overlaps in the 1400-900
cm-1 region can compromise the identification and localisation of inorganic compounds such
as sulphates or phosphates. Data treatment which may involve computational subtraction
of the embedding media contribution is challenging. In the worst case, it could distort the
sample bands and limit the detection of other components, or even lead to erroneous
absorption bands (Pilc, et al., 1995).
For X-ray based techniques, an organic embedding medium usually presents less risk
of analytical interference. In the case of element-sensitive techniques (e.g. XRF, XAS), the
embedding resin should not contain any of the elements of interest. Otherwise, the
accurate localization of the endogenous contribution of this element is challenging. Some
compounds made of Al, Si, Fe and used as fillers, can be found in embedding resins.
Accordingly, elemental composition of embedding media should be evaluated before
application to historical samples.
Regarding µXRD, the presence of an organic resin is generally not an issue, except in the
particular case of the study of polymer samples, e.g. fibres, where sample and media have
similar structure, scattering features and power.
In addition to the embedding step itself, grinding and / or polishing of any embedded
sample can also affect the composition of the section, by contaminating the sample surface

Chapter 3: Preparing thin sections from painting fragments: challenges and innovative solutions
55
with the formation of a thin resin film, by smearing components of different layers
throughout the entire sample, and by depositing exogenous polishing materials such as
SiC (Prati, et al., 2012).
Consequently, depending on the sample and the analytical techniques, risk of chemical or
analytical interferences must be assessed and a preparation strategy must be adapted
(Figure 3-3).
Regarding analytical interferences, µFTIR, and generally speaking molecular group imaging
techniques (e.g. Raman, ToF-SIMS, fluorochrome stain tests) are the most demanding in
terms of adapted sample preparation. For µFTIR, various strategies have been proposed as
alternatives to classical embedding in resin. The following discussion reports the major
innovations (Derrick, et al., 1994, Martin de Fonjaudran, et al., 2008, Souza, et al., 1995).
In most cases, these protocols are developed for the preparation of cross-sections.
Even if the preparation of thin-sections shares the same fundamental requirements (mainly
avoidance of chemical and analytical interferences), additional constraints are faced when
achieving very thin-sections of controlled thickness. Indeed, the physical properties of
blocks or pellets prepared for cross-sectioning are scarcely adaptable to slicing procedures.
The extrapolation of established strategies from cross-section to thin-section preparation
will be discussed, opening new ways for the development of novel alternatives for painting
thin-section preparation.
Figure 3-4 summarizes the main strategies explored in previous works, as well as the
new protocols specifically developed in the present study.
In an ideal approach, the sample is prepared without any embedding process, either by
compression (see section 3.4.1), or with a microtome (see section 3.5.2). The handling of the
sample is rather challenging but risks of both chemical and analytical interferences are
minimized.
Alternatively, another strategy relies on the full substitution of the organic resin by an IR-
transparent material, usually a salt (see section 3.4.2). From an analytical point of view, this
fulfils the requirements for µFTIR, however it is better adapted for cross-sections than for
thin-sections and requires a double-polishing approach which is highly destructive. In
addition, salts do not guarantee the chemical stability of the sample.

Chapter 3: Preparing thin sections from painting fragments: challenges and innovative solutions
56
A last approach, derived from the previous one, consists in pre-encapsulating the sample
(formation of a barrier coating) before embedding it in resin. This has a twofold interest: the
barrier prevents the penetration of the resin into the sample, while the resin facilitates the
handling of the block and the preparation of thin-sections. Different strategies are detailed
in section 3.4.3.
Figure 3-4: Schematic view of the main alternatives for the preparation of painting thin-sections for µFTIR analysis in transmission mode.
3.4. Alternatives for the preparation of sections
3.4.1. Preparations without embedding: conventional compression using diamond
micro-compression cell
The diamond anvil micro-compression cell has long been identified as an efficient device
avoiding the use of embedding / coating material. This is an established sampling accessory
in FTIR microscopy studies, first reported to artistic materials in 1975 (Laver, et al., 1978).
In this set-up, the sample is flattened between two diamond windows before analysis.
Originally developed for high pressure microscopic investigation, this method consists of
two metal holders with a screw assembly, which hold polished diamond windows; a joint is
used between them to prevent that the diamond windows touch each other during
compression, producing breaking of the diamond crystal (Figure 3-5).
Painting sample
Non porous
Permeable / leanly bound
Bulk Standard preparation
Alternative preparations
Embedding without
analytical interferences
No embeddingSurface
Bulk/Surface
Barrier coating:
- IR transparent salts
- Metal
- Organic Barrier
Samples squeezed
between two
polycarbonate foils
Pre –slicing with
scalpel
Pre-conditionning Embedding
Embedding in polymeric resin
Embedding in IR-transparent salt
Embedding in Polymeric resin
Sectioning
Microtoming / Polishing
Microtoming / Polishing
Microtoming
Compression between two
diamond windows
If minimum
thickness
still too high
Polishing

Chapter 3: Preparing thin sections from painting fragments: challenges and innovative solutions
57
Figure 3-5: Optical image of painted sample from Bamyian’s Buddha prepared as thin-section a) following classical embedding approach and microtoming step (1,5μm thick) and b) following compression step using diamond anvil cell presented in c).
Finally a screw cap covers the system, which when tightened gives the rotational motion
necessary for a good compression without smears. An exhaustive paper on the applications
of this device in the FTIR analyses of art highlights the main advantages of this
technique (Laver, et al., 1978):
- small amount of sample is needed
- sample preparation is fast and the set-up handling is straightforward
- visible observation of the sample is always available even at high magnification for
birefringence or pleochroism studies with polarised light
- in some rare cases, it is possible to recover and retain the sample for further analyses
requiring removal of the diamonds (e.g. X-ray analyses at low X-ray energy).
The success of this technique relies on overcoming some main technical challenges:
the pressed fragment should be i) compatible with being as small as possible (a few tens of
microns), ii) representative of the entire sample and of the complete stratigraphy, iii)
positioning it on the first window so that the stratigraphy is perpendicular to the window
surface.
Even if this process avoids analytical interferences from embedding material, the main
drawback of this approach lies in the compression step, which may distort the stratigraphy,
and mix the different layers (van der Weerd, 2002) (Figure 3-5). In the case of highly
heterogeneous samples with a stratigraphy of successive layers which are different in terms
of hardness, an homogeneous compression is hardly achieved. Moreover, the absorption in
the diamond windows themselves can be highly limiting for (X-ray) analyses operated in
transmission mode.
a) b) c)

Chapter 3: Preparing thin sections from painting fragments: challenges and innovative solutions
58
3.4.2. IR-transparent materials as embedding medium: an embedding without FTIR
interferences
IR-transparent materials, i.e. materials that have no absorption bands in the wavenumbers
range of 4000 cm-1 to 400 cm-1, such as KBr, BaF2 or AgCl, have long been used for FTIR bulk
analyses. Recent developments using layers or pellets of compressed IR-transparent salts to
sandwich a paint sample, subsequently polished or cut to produce cross-sections allow
stratigraphic micro-FTIR analysis without contamination from the embedding material (van
der Weerd, 2002). The procedure can be briefly described as follows; a first pellet-die is
prepared by compression of the salt. The micro-fragment is then placed on this pellet-bed
before being covered with additional salt and pressed again. Some problems appear during
pellet preparation, such as the difficulties related to properly orient the sample or to the
disintegration of paint fragments during pressing, which occurs quite often (Pilc, et al.,
1995).
Four salts have been investigated, namely KBr, CaF2, BaF2 and AgCl, which present
different advantages and drawbacks.
KBr is a widespread IR-transparent medium for the preparation of pellets thanks to its solid
and transparent aspect after application of high pressure. A standard procedure for sample
embedding with this salt is extensively described elsewhere (Mazzeo, et al., 2007). Its
relatively high hygroscopy can however critically reduce the spectral quality during data
acquisition (Prati, et al., 2010).
In this context, the use of other infrared salts has been investigated such as CaF2 and BaF2,
without showing a clear improvement in terms of spectral quality. Furthermore, the opacity
of CaF2 to visible light complicates the sample preparation and orientation; the salt is also
opaque below 1100 cm-1, reducing its application range in the mid-IR domain.
An alternative IR-transparent salt, AgCl, offers other complementary advantages thanks to
its high softness and malleability (Pilc, et al., 1995). The pressure needed to obtain a pellet is
lower in comparison with the other salts, reducing the risk of disruption of the paint
structure. Moreover, it allows slicing with a scalpel, while with bromide and fluoride salts,
procedures to expose the sample stratigraphy are limited to polishing due to the glassy
state of the salt. Since AgCl is photosensitive, it is advised to work in low UV-content light
condition to prevent darkening of the material which in turn makes the sample location
difficult to assess.

Chapter 3: Preparing thin sections from painting fragments: challenges and innovative solutions
59
These salts offer an excellent solution in terms of analytical neutrality for FTIR analysis.
However, a risk of chemical interferences exists, in particular with AgCl and NaCl which are
known to accelerate corrosion processes. Thus, the sample has to be investigated within
one day after pellet preparation (van der Weerd, 2002). Some of them are hygroscopic,
which can as well affect the long term storage of sections.
In order to find an optimal balance between analytical neutrality and the mechanical
properties of the pellets, an intermediate solution merging the use of both such IR-
transparent salts with the classical embedding resins has been proposed. This solution
belongs to a more general strategy where the sample is first embedded into a barrier
coating, before being embedded in a standard resin. The barrier coating acts as a protection
towards the infiltration of the embedding resin and as well strengthens the painting
fragment. Different types of barriers have been tested such as inorganic salts transparent in
the IR range, metallic foils or coatings, and organic media.
3.4.3. Barrier coatings
3.4.3.1. IR-transparent salts
In the literature, two IR-transparent salts, KBr and NaCl, have been tested as barrier coatings
for the preparation of cross-sections for analysis in ATR mode (Prati, et al., 2013). In this
reference, an IR-transparent salt pellet is prepared as described above, it is then reduced in
size, embedded into a resin, and a dry polishing is finally performed with silica abrasive
papers to expose the paint stratigraphy. This procedure seems to be efficient to prevent the
contamination of polymeric compounds as the resin affects only a few micrometers of the
salts (Prati, et al., 2013).
The use of NaCl has been proposed as an alternative to KBr, even if the IR-accessible
spectral range is reduced at low wavenumbers from 400 cm-1 for KBr to 650 cm-1 for NaCl.
This salt presents some important advantages: its reduced hygroscopicity, cost and toxicity.
Compared to the pure IR-transparent pellets developed above, the presence of the resin
improves the handling of the sample as well as the mechanical stability of the system during
polishing. This leads to the improvement of the spectral quality for ATR analysis.

Chapter 3: Preparing thin sections from painting fragments: challenges and innovative solutions
60
3.4.3.2. Metal covering / coating
Metallic coatings have been tested as protection against resin infiltration and represent an
alternative to IR-transparent salts. A sputter coater is used to coat samples with greater
than a 5nm thick layer of gold. With gold spreading, the quality of the barrier depends on
the surface state of the sample (smoothness and lack of crevices). Moreover, the sample
positioning and manipulation during the coating and in following treatments are quite
complicated (Derrick, et al., 1994). However, successfull cross-section using 10nm thick gold
coating were recently carried out on historical fragments sampled on the edge of Cuno
Amiet’s painting Portrait of Max Leu (1898) (Gervais, et al., 2013).
A direct coating with a thin aluminium foil is also presented as an option for painting (Cotte,
et al., 2009, Derrick, et al., 1994) and for mummy skin fragments (Cotte, et al., 2005). It
indeed prevents resin infiltration, but the sample position is difficult to determine since the
foil is opaque. Its use for fragile and tiny historical samples is not advisable since the foil
does not remain adhered tightly to the sample. This can lead to partial or complete loss of
material during polishing or microtoming.
3.4.3.3. Alternative organic barriers based on conservation treatments
Other alternatives have been developed based on an organic barrier coating, which,
conversely to IR-transparent salts and metal coatings, penetrates inside the samples and
better maintains the structure during sectioning. This property is particularly useful for the
preparation of fragile or leanly bound samples. The choice of pre-coating materials has
usually been inspired from conservation treatments.
Among different trials, a commercially produced cyclic alkane called cyclododecane
(CDD, C12H24) has been proposed (Martin de Fonjaudran, et al., 2008). It is well known by
conservators to consolidate or to produce a hydrophobic barrier coating against water
infiltration. This alicyclic saturated hydrocarbon product presents the advantages to be
chemically stable and to sublimate slowly at room temperature. Accordingly, the full
analytical neutrality of this process relies on the fact that, after sublimation, the sample is
free of any coating/embedding medium. In the conservation field, two typical CDD
application methods are used: spray application (heated spray gun) and brush application.
In the case of cross-section preparation, the brush application is used. In a few words, the

Chapter 3: Preparing thin sections from painting fragments: challenges and innovative solutions
61
sample is first impregnated with a toluene solution of CDD, second it is coated with some
pure and melted CDD and third the system is embedded with an acrylic resin. The cross-
section is obtained using a microtome. At least 24h are needed for the CDD to sublimate,
then, ATR µFTIR analyses can be carried out. The complete procedure is complex, multi-
step, needs to use a solvent and to cure the sample at 58C; moreover, the surface quality is
never as good as that obtained with polished IR-transparent salt preparation (Prati, et al.,
2012).
Different non-penetrating gel-like solutions, e.g. methyl cellulose (Baker, 1984), acrylic
dispersion thickened with toluene (Keyser, 1981), acrylic dispersion thickened with fumed
silica, have also been tested. As for CDD, these materials encapsulate the sample and avoid
resin infiltration (Derrick, et al., 1994). Other classical organic material such as paraffin and
waxes were proposed. However, with these protocols, the analytical neutrality constraint is
not satisfied.
3.5. Novel strategies for the preparation of thin-section
3.5.1. Specific issues related to the preparation of thin-section
While the preparation of thin-sections is a very common practice in other research fields,
such as biology, this approach is rarely used for the analysis of artistic materials, and
paintings in particular. Indeed, obtaining thin-sections of paintings is far less easy than
polishing cross-sections, and section handling during transport, analysis and storage is more
complicated than with resin blocks.
Plesters was the first to notice these issues, at the same time than he was arguing for
cross-section preparation (Plesters, 1956):
“The preparation of paint cross-sections was begun than forty years ago. Pioneer work was
done by Laurie as early 1914 [1]. The scope of the method was extended and the technique
improved at the Fogg Art Museum, Cambridge, Massuchusetts, in the 1930’s [2]. At this
time waxes were used as mounting media for paint sections, which were cut with a
microtome. The friability of most old paint films makes this a difficult operation and since
then the process has been simplified by using modern synthetic resins as mounting media
and by grinding and polishing the section. It must be pointed out here that what is required
is not a transparent section, to be viewed by transmitted light, as is necessary in the case of

Chapter 3: Preparing thin sections from painting fragments: challenges and innovative solutions
62
many mineral sections, but an opaque section, the surface only of which is examined by
reflected light, etc.”
The preparation of thin-section requires supplementary steps which influence the quality of
prepared section (Fulton, 1980). However, as the analysis of thin-sections can offer
significant distinct advantages regarding feasibility and efficiency of micro-analyses, their
preparation deserves a specific effort.
For the samples and the analytical techniques considered here, the typical section
thickness required is in the range of a few microns to a few tens of microns. In this context,
reducing the sample thickness can be done following three different single or combined
strategies: compression, polishing and cutting. The possibility of using ion milling techniques
has not been explored in the present work, but should be considered in the future.
The compression procedure is largely used for FTIR microscopy since it avoids the
use of embedding media. The complete procedure and the discussion about its pros and
cons are detailed above.
The double polishing approach derives directly from the preparation of cross-
sections and relies on successive polishing of the two sides of an embedded sample, until
the appropriate thickness is obtained. This strategy is commonly used for the preparation of
petrographic sections of rocks, and can be adapted to hard artistic materials such as glasses
and ceramic samples (Meirer, et al., 2013). The application of this protocol to the
preparation of painting thin-section is not straightforward and some examples have been
reported (Cotte, et al., 2007, van der Weerd, 2002). This approach presents a main
drawback: most of the sample is lost during the process.
In the present study, we preferred investigating the cutting approach. In the
considered thickness range, microtomes are much more suitable than the diamond saw.
They offer a high accuracy (about 0.5 µm depending on the instrument and the knife)
combined with dry cutting conditions. A detailed description of the microtoming procedure
followed during this study is already largely described in (Derrick, et al., 1994).
From the development of different strategies for the preparation of cross-sections, the
possibility to extend these methods to the preparation of thin-sections is considered.

Chapter 3: Preparing thin sections from painting fragments: challenges and innovative solutions
63
Concerning the use of IR transparent salt as embedding media, the preparation of
thin-sections has been reported using KBr, when combined with double-polishing approach
(van der Weerd, 2002). As mentioned before, this strategy is rather time consuming, and for
ultimate thicknesses (~a few microns), the success of the whole process is not guaranteed:
the sample can be completely lost in the last polishing steps. Besides, the large set of
available resins allows choosing the resin best adapted to the sample physical properties,
whereas, with these salts, there is usually a mismatch between the softness of the
embedding and the embedded materials. Finally, all these salts present as pure embedding
medium or as barrier coating, when compressed, are more fragile than an organic resin and
application of a microtome to such pellets usually ends with the crumbling of the salt, which
no longer maintains the sample and consequently the section.
Concerning the use of metal material as barrier coating, and in particular the use of
aluminium foil, the hole between sample and aluminium (Figure 3-6b) foil avoids an
accurate thickness control and leads very often to a loss of the sample.
Finally for organic barriers based on conservation treatments, a clear hardness
mismatch between the barrier material and the embedded materials (Figure 3-6c and d)
leaded to uncertainty about section thickness and difficulties or impossibilities to achieve an
intact section.
a)
b)
c)
d)
Figure 3-6: Optical picture of cross-section of model sample made of ZnO mixed with linseed oil painted on modern canvas. They were prepared using either a) pure resin, or b) aluminium foil c) paraffin and d) waxe as barrier coating.
Hence from the established protocols detailed above, two novel approaches are
proposed and illustrated in the following sections (sections 3.5.2, 3.5.3, and 3.5.4).
3.5.2. Sample Enclosing System (SES) approach
The procedure described hereafter relies on the preparation of embedding-free thin-
sections, using a microtome. At first sight, it could seem rather trivial when compared to
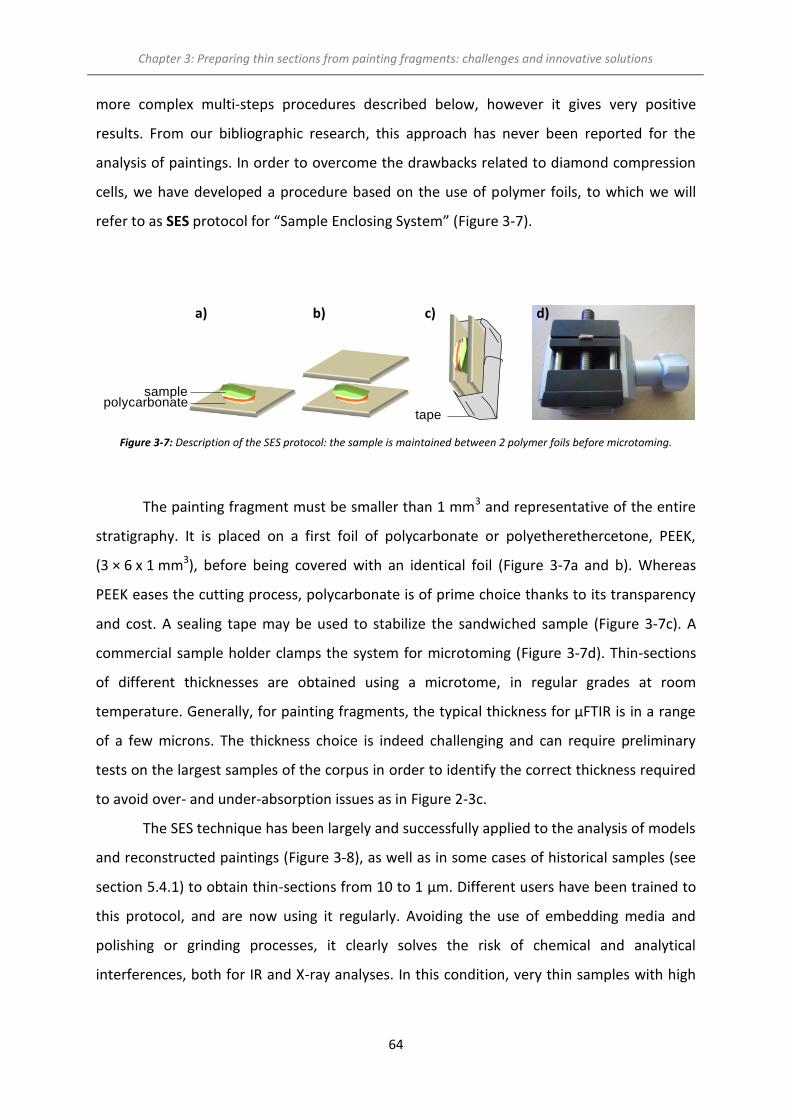
Chapter 3: Preparing thin sections from painting fragments: challenges and innovative solutions
64
more complex multi-steps procedures described below, however it gives very positive
results. From our bibliographic research, this approach has never been reported for the
analysis of paintings. In order to overcome the drawbacks related to diamond compression
cells, we have developed a procedure based on the use of polymer foils, to which we will
refer to as SES protocol for “Sample Enclosing System” (Figure 3-7).
Figure 3-7: Description of the SES protocol: the sample is maintained between 2 polymer foils before microtoming.
The painting fragment must be smaller than 1 mm3 and representative of the entire
stratigraphy. It is placed on a first foil of polycarbonate or polyetherethercetone, PEEK,
(3 × 6 x 1 mm3), before being covered with an identical foil (Figure 3-7a and b). Whereas
PEEK eases the cutting process, polycarbonate is of prime choice thanks to its transparency
and cost. A sealing tape may be used to stabilize the sandwiched sample (Figure 3-7c). A
commercial sample holder clamps the system for microtoming (Figure 3-7d). Thin-sections
of different thicknesses are obtained using a microtome, in regular grades at room
temperature. Generally, for painting fragments, the typical thickness for µFTIR is in a range
of a few microns. The thickness choice is indeed challenging and can require preliminary
tests on the largest samples of the corpus in order to identify the correct thickness required
to avoid over- and under-absorption issues as in Figure 2-3c.
The SES technique has been largely and successfully applied to the analysis of models
and reconstructed paintings (Figure 3-8), as well as in some cases of historical samples (see
section 5.4.1) to obtain thin-sections from 10 to 1 µm. Different users have been trained to
this protocol, and are now using it regularly. Avoiding the use of embedding media and
polishing or grinding processes, it clearly solves the risk of chemical and analytical
interferences, both for IR and X-ray analyses. In this condition, very thin samples with high
polycarbonatetape
sample
a) b) c) d)
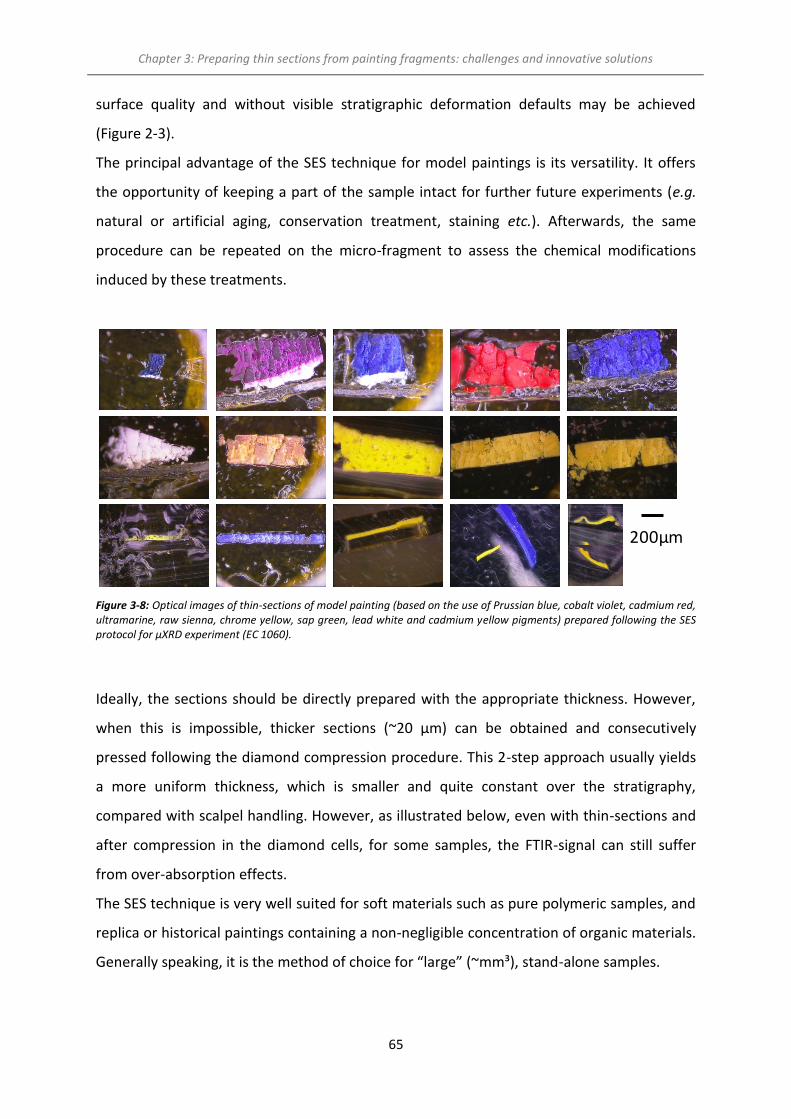
Chapter 3: Preparing thin sections from painting fragments: challenges and innovative solutions
65
surface quality and without visible stratigraphic deformation defaults may be achieved
(Figure 2-3).
The principal advantage of the SES technique for model paintings is its versatility. It offers
the opportunity of keeping a part of the sample intact for further future experiments (e.g.
natural or artificial aging, conservation treatment, staining etc.). Afterwards, the same
procedure can be repeated on the micro-fragment to assess the chemical modifications
induced by these treatments.
Figure 3-8: Optical images of thin-sections of model painting (based on the use of Prussian blue, cobalt violet, cadmium red, ultramarine, raw sienna, chrome yellow, sap green, lead white and cadmium yellow pigments) prepared following the SES protocol for μXRD experiment (EC 1060).
Ideally, the sections should be directly prepared with the appropriate thickness. However,
when this is impossible, thicker sections (~20 µm) can be obtained and consecutively
pressed following the diamond compression procedure. This 2-step approach usually yields
a more uniform thickness, which is smaller and quite constant over the stratigraphy,
compared with scalpel handling. However, as illustrated below, even with thin-sections and
after compression in the diamond cells, for some samples, the FTIR-signal can still suffer
from over-absorption effects.
The SES technique is very well suited for soft materials such as pure polymeric samples, and
replica or historical paintings containing a non-negligible concentration of organic materials.
Generally speaking, it is the method of choice for “large” (~mm³), stand-alone samples.
200μm

Chapter 3: Preparing thin sections from painting fragments: challenges and innovative solutions
66
For leanly bound samples, loss of material can occur during microtoming.
Consequently alternative methods, as shown in Figure 3-3, should be considered based on
an appropriate medium able to tightly maintain the sample as well as easy to handle and to
section.
3.5.3. AgCl Resin Embedding (ARE) approach
As discussed earlier, the few papers describing salt-barrier strategies focus mainly on the
preparation of cross-sections for ATR analyses. The potential of this approach for the
preparation of thin-sections has, to our knowledge, never been mentioned. Based on the
previous discussion about the pros and cons of the different salts, it was decided to carry
out the tests with AgCl as a barrier coating, considering its high softness and low
hygroscopic properties.
In Figure 3-9, the proposed strategy, hereafter named ARE for “AgCl Resin
Embedding”, is detailed: first, a 3 mm-diameter soft pellet-bed of AgCl is prepared by
pressing; then the micro fragment (typically 1 mm³) is placed on it, with the stratigraphy
parallel to the pellet surface (Figure 3-9a). Some AgCl powder is added on top of it and the
whole set is pressed a second time (Figure 3-9b). The standard embedding procedure
developed in 3.2.4.2 is then followed using a glycol methacrylate resin, in our case
HistoResin (Leica), which is relatively soft and therefore well adapted to microtoming
operations (Figure 3-9c-e).
Figure 3-9: Description of the ARE protocol: the sample is first embedded in AgCl. The obtained pellet is embedded in resin and microtomed.
The method was applied on two historical gilded samples collected from two
architectural Chinese sites. The detailed results are presented in section 5.2.
a) b) d) e) f)c)
AgCl salt
sample
AgCl pelletResin bed3µm pellet
Resin block
embedding the AgCl pellet
Pyramidal block
for microtoming

Chapter 3: Preparing thin sections from painting fragments: challenges and innovative solutions
67
The advantages of ARE method for FTIR analyses are that in addition to the analytical
neutrality, it strengthens the sample allowing microtome sections at extreme thinness
combined with the complete conservation of the stratigraphic structure.
3.5.4. Perspectives for future innovations
As expressed in 3.4.2, some long term issues are raised when dealing with AgCl. Based on
our previous results and on our experimental skill, supplementary barrier materials have
been considered: camphene, menthol, as well as alumina and carbon powder.
With regards to the previous results obtained on CDD for cross-section preparation,
substances used as volatile binding media in restoration were identified. These materials
share the same main criteria: they must be solids at room temperature, evaporate free of
residue within an appropriate time, and they must be non-toxic and environmentally
compatible. A series of non-polar cyclic hydrocarbons fulfils these criteria as cyclododecane
(C10H20O), camphene (C10H16) and menthol (CH12H24).
In order to compare their IR signature, ATR-FTIR analyses were performed for the 3
compounds provided by Sigma Aldrich. The results are presented in Figure 3-10.
In contrast to Leica historesin, the three volatile binding media do not interfere with
the carbonyl stretching band, often associated to the presence of lipids. Moreover, the
absence of absorption around 1650 cm-1 , for CDD and menthol, and 1550 cm-1 for all them,
are a real asset for the identification of amides I and II respectively and consequently for the
identification of proteins-based materials. Moreover, depending on the volatile binding
media used as barrier coating, the 1400-900 cm-1 region presents less absorption than with
classical resins. An appropriate choice of volatile media can solve some of the issues related
to the identification of sulphates, oxalates, etc.
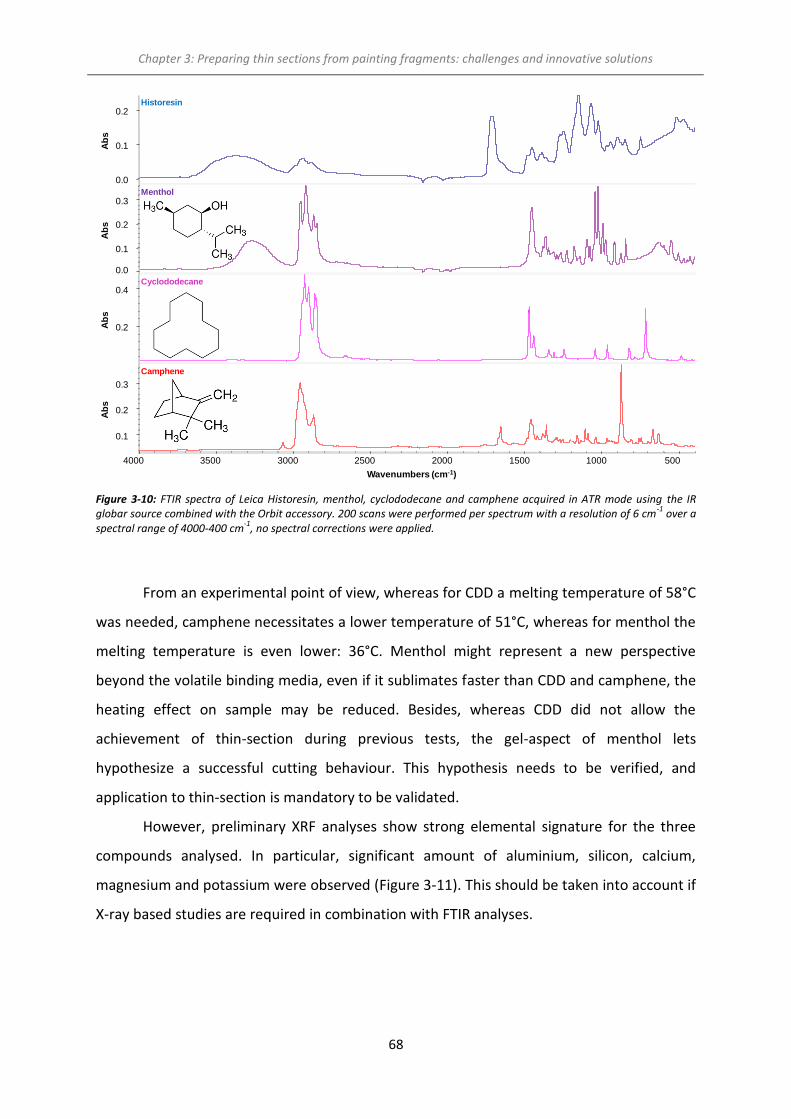
Chapter 3: Preparing thin sections from painting fragments: challenges and innovative solutions
68
Figure 3-10: FTIR spectra of Leica Historesin, menthol, cyclododecane and camphene acquired in ATR mode using the IR globar source combined with the Orbit accessory. 200 scans were performed per spectrum with a resolution of 6 cm
-1 over a
spectral range of 4000-400 cm-1
, no spectral corrections were applied.
From an experimental point of view, whereas for CDD a melting temperature of 58°C
was needed, camphene necessitates a lower temperature of 51°C, whereas for menthol the
melting temperature is even lower: 36°C. Menthol might represent a new perspective
beyond the volatile binding media, even if it sublimates faster than CDD and camphene, the
heating effect on sample may be reduced. Besides, whereas CDD did not allow the
achievement of thin-section during previous tests, the gel-aspect of menthol lets
hypothesize a successful cutting behaviour. This hypothesis needs to be verified, and
application to thin-section is mandatory to be validated.
However, preliminary XRF analyses show strong elemental signature for the three
compounds analysed. In particular, significant amount of aluminium, silicon, calcium,
magnesium and potassium were observed (Figure 3-11). This should be taken into account if
X-ray based studies are required in combination with FTIR analyses.
Historesin
0.0
0.1
0.2A
bs
Menthol
0.0
0.1
0.2
0.3
Ab
s
Cyclododecane
0.2
0.4
Ab
s
Camphene
0.1
0.2
0.3
Ab
s
500 1000 1500 2000 2500 3000 3500 4000
Wavenumbers (cm-1)

Chapter 3: Preparing thin sections from painting fragments: challenges and innovative solutions
69
a)
c)
b)
Figure 3-11: Fit of XRF sum spectra acquired at 6keV over 200x200 μm
2 area on a) camphene, b) CCD and c) menthol
material using PyMca software.
Whereas, ARE method provides successful results on historical painting, chemical
risks were also considered, consequently two other metals were tested as barrier materials:
carbone powder (99%pure, Sigma Aldrich) and aluminium powder (99%pure, Sigma Aldrich).
Preliminary results are presented in Figure 3-12. As expected for carbon and alumina IR
spectra, characteristic absorption bands are absent. Those two salts are thus chemically and
analytically neutral for any IR analysis. However, whereas aluminium pellets were easily
obtained, using hand-press, and cut, using a microtome, we did not succeed in the
preparation of carbon pellets, limiting its application to coating action.
Further tests should be performed using alumina powder; nevertheless the first trials
already gave positive results.
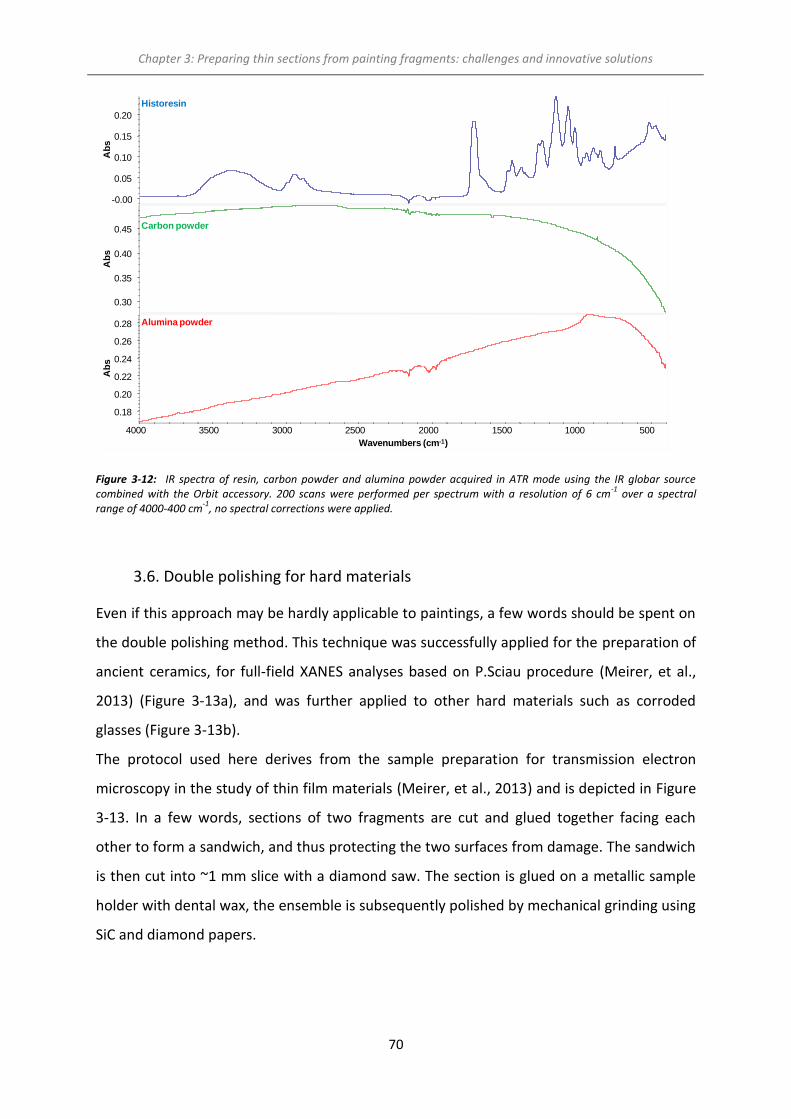
Chapter 3: Preparing thin sections from painting fragments: challenges and innovative solutions
70
Figure 3-12: IR spectra of resin, carbon powder and alumina powder acquired in ATR mode using the IR globar source combined with the Orbit accessory. 200 scans were performed per spectrum with a resolution of 6 cm
-1 over a spectral
range of 4000-400 cm-1
, no spectral corrections were applied.
3.6. Double polishing for hard materials
Even if this approach may be hardly applicable to paintings, a few words should be spent on
the double polishing method. This technique was successfully applied for the preparation of
ancient ceramics, for full-field XANES analyses based on P.Sciau procedure (Meirer, et al.,
2013) (Figure 3-13a), and was further applied to other hard materials such as corroded
glasses (Figure 3-13b).
The protocol used here derives from the sample preparation for transmission electron
microscopy in the study of thin film materials (Meirer, et al., 2013) and is depicted in Figure
3-13. In a few words, sections of two fragments are cut and glued together facing each
other to form a sandwich, and thus protecting the two surfaces from damage. The sandwich
is then cut into ~1 mm slice with a diamond saw. The section is glued on a metallic sample
holder with dental wax, the ensemble is subsequently polished by mechanical grinding using
SiC and diamond papers.
Historesin
-0.00
0.05
0.10
0.15
0.20A
bs
Carbon powder
0.30
0.35
0.40
0.45
Ab
s
Alumina powder
0.18
0.20
0.22
0.24
0.26
0.28
Ab
s
500 1000 1500 2000 2500 3000 3500 4000
Wavenumbers (cm-1)

Chapter 3: Preparing thin sections from painting fragments: challenges and innovative solutions
71
For XANES analysis, the appropriate thickness can be determined by successive
acquisitions of the absorption image of the section below and above the edge of the
element of interest, and repolishing can be performed when the section is too absorbing
The two examples presented in Figure 3-13 as well as other samples prepared similarly were
thinned down to ~50µm, which is appropriate for XANES measurements. It should be
noticed that with this protocol, even for hard materials, reaching thinner thickness is not
straightforward.
Figure 3-13: a) Schematic representation of TXM sample preparation from the sherd to the thin plate (50 μm thick) observed in optical microscopy from (Meirer, et al., 2013), b)Optical images of thin-section of model glasses corroded (70 μm thick) using the same technique.
3.7. Sample mounting
From a technical point of view, the sample mounting for X-ray analyses is usually more
challenging than for µFTIR, for different reasons. First, the incoming X-ray beam is
horizontal, so that, the best lateral resolution in both directions implies to place the sample
perpendicular to the beam in a vertical plane. For FTIR analyses, the sample is horizontal.
Second, operating in the soft X-ray domain, as at the ID21 beamline, requires working under
vacuum, with low absorbing and low fluorescing materials. Third, tiny samples can move
under the X-rays beam if they are not properly maintained. For these reasons, it is very
important to implement a reliable system to mount the samples. Hence, beyond the choice
400 μm
a) b)

Chapter 3: Preparing thin sections from painting fragments: challenges and innovative solutions
72
of suitable sample preparation, the previous discussion about chemical and analytical
interferences should be as well extended to the selection of holding materials as developed
below.
3.7.1. Sample substrate
During X-ray experiments, samples are always protected and fixed to the sample holder by
thin films/tapes. In order to avoid analytical contamination from sample substrate, a
suitable choice between common films daily used to protect / fix the samples inside the
SXM chamber may be performed based on their XRF signature.
These materials are: commercial double side tape, “sulphur free” tape (47µm thick, from
FLUXANA), double side tape as tip (2µm thick, from AGAR), carbon tape used for SEM
(125µm thick, from AGAR), kapton film (13µm thick, from Goodfellow), mylar film (13µm
thick, from Goodfellow), ultralene film (4µm thick, from Spex Sample Prep), electrostatic
tape (used at BM05, ESRF, glue free), and Leica Historesin (prepared as 15µm thick section).
In order to achieve a relative quantification of the elemental composition of the
substrates analysed, an aluminium foil was used as standard to define geometrical
parameters of the experiment. This reference was first analysed to settle the fundamental
parameters required for fitting XRF data during the rest of the experiment. Consequently,
the chemical compositions were defined at 7.2keV from the following fundamental
parameters: beam flux of 8.109 photons/s, and detector active area of 80mm2 distant of
34mm from the sample. Using these configuration parameters in the sample case, the XRF
fit was performed on a 100x100μm2 area (with 1x1 μm2 step size and 300ms acquisition per
point) with the PyMca software package (Sole, et al., 2007). The results of the quantification
are stated in the table below (Figure 3-14a).

Chapter 3: Preparing thin sections from painting fragments: challenges and innovative solutions
73
a)
b)
c)
Figure 3-14: a) Comparative fit results of XRF spectra corresponding to substrates analysed, and their elemental mass fraction in b) films, c) tapes and embedding resin.
Element
1-Commercial
double side
tape
2-Sulfur free
tape
3-Double side
tape tip4-Carbon tape
5-Kapton
film
6-Mylar
film
7-Ultralene
film
8-Electrostatic
tape9-HistoResin
Na 3.35E-04 1.93E-04 1.22E-04 1.06E-03 8.88E-05 7.32E-05 4.07E-05 0.00E+00 5.56E-05
Mg 3.78E-05 2.30E-04 5.09E-05 8.66E-05 1.10E-04 1.24E-04 3.81E-05 1.03E-04 9.25E-05
Al 3.83E-04 3.79E-04 4.63E-04 1.40E-03 1.51E-04 2.96E-04 9.94E-05 2.04E-03 9.98E-04
Si 4.49E-04 1.48E-03 8.69E-04 1.29E-03 1.14E-04 3.10E-04 3.58E-05 5.16E-03 2.03E-04
P 1.37E-04 3.25E-04 4.39E-06 1.16E-03 3.87E-04 2.39E-03 3.84E-06 9.28E-04 1.47E-05
S 7.55E-03 2.50E-05 1.74E-05 1.32E-02 1.27E-05 2.07E-05 4.01E-06 7.59E-04 1.53E-05
Cl 2.01E-03 9.11E-05 9.53E-04 7.61E-04 1.17E-05 1.01E-05 1.85E-05 4.20E-01 1.78E-04
K 3.03E-03 2.03E-04 0.00E+00 3.79E-04 9.51E-07 0.00E+00 6.58E-07 7.97E-06 4.30E-06
Ca 3.40E-04 2.59E-05 3.17E-05 5.09E-05 5.52E-04 4.72E-03 5.15E-06 2.28E-05 5.27E-06
Ti 2.70E-07 5.35E-03 0.00E+00 4.89E-04 2.62E-07 0.00E+00 3.77E-06 7.82E-05 1.39E-06
V 0.00E+00 3.92E-05 8.19E-07 8.59E-06 3.15E-07 4.82E-07 9.09E-08 0.00E+00 5.95E-06
Cr 6.11E-05 9.51E-05 9.94E-05 2.23E-04 1.75E-05 5.10E-05 1.05E-05 0.00E+00 1.66E-03
Mn 2.71E-06 3.93E-04 7.66E-06 1.90E-05 1.50E-06 2.69E-06 9.59E-07 2.66E-07 4.06E-05
Fe 1.75E-04 2.29E-04 2.35E-04 6.92E-04 3.74E-05 1.61E-04 2.19E-05 2.53E-05 1.55E-04
Sn 7.02E-05 0.00E+00 2.27E-03 1.64E-05 2.59E-06 0.00E+00 2.65E-07 1.40E-04 2.44E-06
Sb 0.00E+00 7.87E-04 9.14E-06 1.89E-06 9.04E-06 1.09E-03 5.47E-07 0.00E+00 2.82E-06
Ba nd nd nd nd nd nd nd 1.54E-04 nd
0.00E+00
5.00E-04
1.00E-03
1.50E-03
2.00E-03
2.50E-03
3.00E-03
3.50E-03
4.00E-03
4.50E-03
5.00E-03
Na Mg Al Si P S Cl K Ca Ti V Cr Mn Fe Sn Sb
Mas
s Fr
acti
on
Elements
5-Kapton film
6-Mylar film
7-Ultralene film
9-HistoResin
0.00E+00
5.00E-03
1.00E-02
1.50E-02
2.00E-02
Na Mg Al Si P S Cl K Ca Ti V Cr Mn Fe Sn Sb
Mas
s Fr
acti
on
Elements
1-Commercial double side tape
2-Sulfur free tape
3-Double side tape tip
4-Carbon tape
8-Electrostatic tape
9-HistoResin

Chapter 3: Preparing thin sections from painting fragments: challenges and innovative solutions
74
Resulting from the comparison of the film chemical compositions, two major comments can
be done (Figure 3-14b):
-mylar film contains the highest amount of Mg, Al, P, Ca, Fe and Sb elements, revealing
possible analytical interferences.
-the ultralene film is the cleanest film analysed.
Concerning the tapes, several observations were made (Figure 3-14c):
-the carbon tape presents several elements in high mass fraction content (e.g. Na, Al, P, S,
and Fe) resulting in possible interferences.
-the different tapes are all sulphur free except for commercial, carbon and electrostatic
tapes, which must be avoided if looking at sulphur localization or chemical speciation.
- whereas the sulphur free tape contains low contribution in most of the elements probed, a
non negligible amount of Ti is revealed limiting μXRF mapping and XAS analyses of this
element.
-double tape tip and electrostatic tape must be avoided for the identification and
localisation of respectively Sn and Cl-based compounds.
From identical observation the resin used for this study may interfere with chromium based
specie analysis and should be circumvented in this specific case.
From these results, the element of interest should clearly influence the choice of the most
appropriate substrate.
While chemical contamination from substrates is an important issue to take into account in
the analytical process, substrates absorption is another non negligible parameter when
dealing with transmission measurements. Consequently, transmission measurements of the
different materials presented above were acquired from 2 to 7keV in order to evaluate their
influence on total transmitted signal during an X-ray acquisition performed in transmission
mode (Figure 3-15).
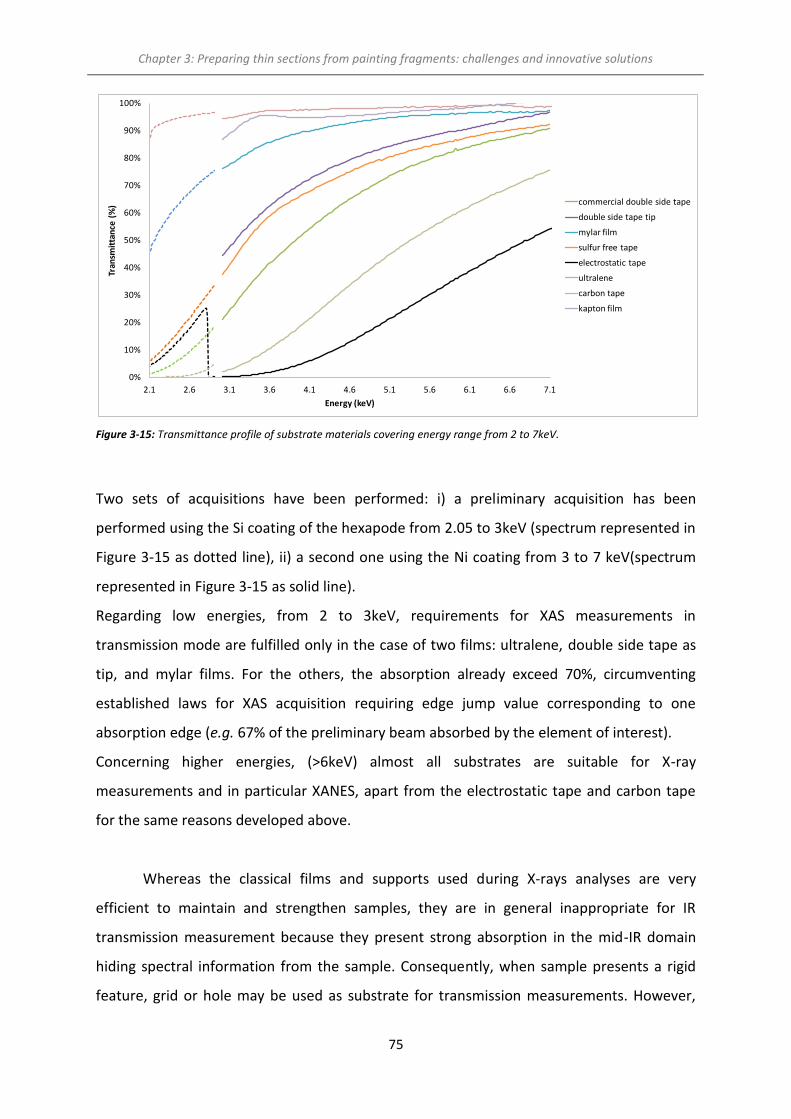
Chapter 3: Preparing thin sections from painting fragments: challenges and innovative solutions
75
Figure 3-15: Transmittance profile of substrate materials covering energy range from 2 to 7keV.
Two sets of acquisitions have been performed: i) a preliminary acquisition has been
performed using the Si coating of the hexapode from 2.05 to 3keV (spectrum represented in
Figure 3-15 as dotted line), ii) a second one using the Ni coating from 3 to 7 keV(spectrum
represented in Figure 3-15 as solid line).
Regarding low energies, from 2 to 3keV, requirements for XAS measurements in
transmission mode are fulfilled only in the case of two films: ultralene, double side tape as
tip, and mylar films. For the others, the absorption already exceed 70%, circumventing
established laws for XAS acquisition requiring edge jump value corresponding to one
absorption edge (e.g. 67% of the preliminary beam absorbed by the element of interest).
Concerning higher energies, (>6keV) almost all substrates are suitable for X-ray
measurements and in particular XANES, apart from the electrostatic tape and carbon tape
for the same reasons developed above.
Whereas the classical films and supports used during X-rays analyses are very
efficient to maintain and strengthen samples, they are in general inappropriate for IR
transmission measurement because they present strong absorption in the mid-IR domain
hiding spectral information from the sample. Consequently, when sample presents a rigid
feature, grid or hole may be used as substrate for transmission measurements. However,
0%
10%
20%
30%
40%
50%
60%
70%
80%
90%
100%
2.1 2.6 3.1 3.6 4.1 4.6 5.1 5.6 6.1 6.6 7.1
Tran
smit
tan
ce (
%)
Energy (keV)
commercial double side tape
double side tape tip
mylar film
sulfur free tape
electrostatic tape
ultralene
carbon tape
kapton film

Chapter 3: Preparing thin sections from painting fragments: challenges and innovative solutions
76
when the sample is tiny and / or fragile, an infrared-transparent support is necessary. At
ID21, materials used for this purpose are ZnS, ZnSe, BaF2, KBr, diamond window or Si3N4
membrane. Their spectral, mechanical and chemical properties can be found at
http://infrared.als.lbl.gov/content/web-links/58-irwindows.
Whereas these substrates are very useful for IR analysis, their use for X-rays analyses
is limited. For XRF analyses, the substrates can induce fluorescence which can be difficult to
differentiate from sample fluorescence itself, and which can saturate the detector, reducing
its sensitivity. For XAS analyses, identical analytical interferences may be expected;
moreover these substrates absorb most of the incoming beam limiting further transmission
measurements.
For this work the choice was made to use mainly IR transparent windows (usually
BaF2) as substrate for FTIR analyses in transmission mode, and a different substrate for X-ray
based analyses, chosen following the data reported on Figure 3-14 and Figure 3-15.
3.7.2. Sample holder
As explained above, the vertical orientation of the sample, the vacuum conditions and
possible sample electrostatic charging effects induced by the X-ray beam may complicate
the sample position stability.
In order to avoid drifts during X-ray analyses, a sample holder was specifically designed
following different design steps. Three handling were progressively envisaged and tested:
(a) The sample was squeezed between two ultralene foils, the sandwich was then
maintained between two screwed peek sample holders. In this case, zapon lack glue was
used to maintain the ensemble (Figure 3-16a).
(b) The sample was glued on a carbon tape, previously holed with a 3mm diameter punch,
itself mounted on the sample holder (Figure 3-16b), a final ultralene foil was applied on the
tape and sample assembly.
(c) Gluing step was avoided using a clipping system which strongly maintains the sample
between two layers of ultralene. Equipped with optional grids, several sections can currently
be mounted together in separated holes. By selecting appropriate grid holes size, the
sample stability and flatness were improved compared to classical sample holders (Figure
3-16c).
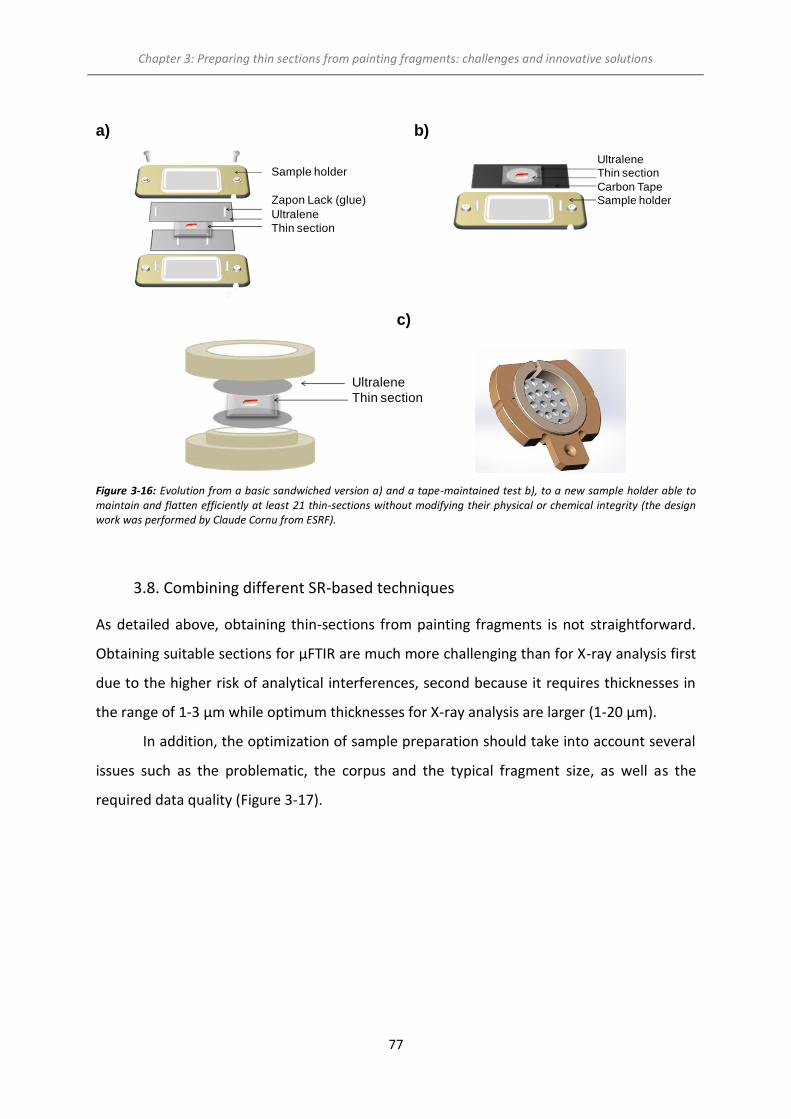
Chapter 3: Preparing thin sections from painting fragments: challenges and innovative solutions
77
a)
b)
c)
Figure 3-16: Evolution from a basic sandwiched version a) and a tape-maintained test b), to a new sample holder able to maintain and flatten efficiently at least 21 thin-sections without modifying their physical or chemical integrity (the design work was performed by Claude Cornu from ESRF).
3.8. Combining different SR-based techniques
As detailed above, obtaining thin-sections from painting fragments is not straightforward.
Obtaining suitable sections for µFTIR are much more challenging than for X-ray analysis first
due to the higher risk of analytical interferences, second because it requires thicknesses in
the range of 1-3 µm while optimum thicknesses for X-ray analysis are larger (1-20 µm).
In addition, the optimization of sample preparation should take into account several
issues such as the problematic, the corpus and the typical fragment size, as well as the
required data quality (Figure 3-17).
Sample holder
Zapon Lack (glue)
Ultralene
Thin section
Ultralene
Thin section
Carbon Tape
Sample holder
Ultralene
Thin section

Chapter 3: Preparing thin sections from painting fragments: challenges and innovative solutions
78
Figure 3-17: Schematic view of the main strategies for the combined analysis of painting thin-sections.
Different cases are distinguished:
If a unique technique is required to address the problem, an adapted preparation
optimized for this single technique is implemented.
When the problem necessitates the combination of different techniques, related
requirements are not necessarily shared. Accordingly, determining if a unique sample can
be analysed with all the techniques, or if adapted sections should and can be specifically
prepared is a major question, where both sample preparation strategy and thickness are key
factors.
Ideally, when sample preparation requirements are compatible, working with a
unique sample preparation is preferable because:
- it reduces the amount of sample needed. Indeed, fragments from historical paintings can
be too small to allow any splitting.
- it is less time consuming. This should be considered while studying a large corpus with a
large set of techniques.
When requirements differ, a compromise should be defined over the set of techniques, with
the priority given to the one which will best answer the problematic.
If appropriate in terms of thickness, it is even better to apply the different analyses
techniques on the very same section, since it allows a direct spatial combination of
hyperspectral data. Attention should be paid to the order of the different analyses so that
the techniques less susceptible to modify the sample are applied first: typically μFTIR
Painting
Fragment
One analytical method
Adapted preparation
Several analytical methods
One preparation
Several preparations
One thickness
Several thicknesses
Data quality
Sample amount
Time vsCorpus

Chapter 3: Preparing thin sections from painting fragments: challenges and innovative solutions
79
follows by μXRF, presenting reduced dwell time in comparison to μXRD and μXANES which
may be carried out at the end of the experiment.
From practical to theoretical considerations presented in the previous Chapter 2 and the
current Chapter 1, the Table 3-3 resumes the different analytical capabilities with regard to
associated sample preparation and handling constraint. Moreover, when working on thin-
section is advised (with regard to Chapter 2) typical thickness range is provided.

Chapter 3: Preparing thin sections from painting fragments: challenges and innovative solutions
80
Analytical method
Chemical identification
Spatial resolution (µm) Sample preparation Thin section Cross section Analytical interference risk Thickness (μm) Substrate Analytical complexity
SR-μFTIR Organic/Mineral
Identification 5.0-25.0
SES protocol ARE protocol
Diamond anvil cell 0.5-5
MidIR transparent salt, Si3N4 windows,
TEM grids
Difficulties to acquire spectra in specular
reflection. In ATR mode difficulties to obtain good contact
with all sample area and to compare results with
database acquired in transmission.
The presence of resin or embedding material from
organic origin may compete with the intrinsic signal of the
sample, preventing an accurate identification and
localisation of the material of interest
SR-μXRF Elemental
composition 0.7-200
SES protocol ARE protocol
Diamond anvil cell Classical resin embedding
Thin-sample case satisfied for a few microns thin-section using
𝜌𝑠𝑡 <0.1
μ𝑠(E0)
sin ϕ+
μ𝑠(Ef)
sin θ
Polymeric film, Specific tape,
Si3N4 windows, TEM grids
Voxel size increase
Any inorganic exogenous materials present in the
embedding compound , e.g. Ag or Cl in the case of ARE
protocol
SR-μXANES
Oxydation state determination/
Local coordination symmetry
0.03-200 Any compound which does
not interfere with the element of interest probed
Depending of incoming X-ray energy and sample composition, using:
μs (Eaboveedge)t ~ 2 - 2.5, and [µs(Eabove edge) - µs(Ebelow edge)]t ~ 1
but typically from 2 to 9keV
i) 1-20 μm in transmission mode, and ii) <5 μm in XRF mode
Polymeric film, Specific tape,
Si3N4 windows, TEM grids
Risk of possible self-absorption effect in XRF
mode
Voxel size increase
Any material which interferes with the element of interest
probed may limit the detection of chemical
signature of the element of interest
SR-μXRD Christallographic
phases 1-200
SES protocol ARE protocol
Diamond anvil cell Classical resin embedding
Depending of incoming X-ray energy, using:
𝜇𝑠(𝐸0)𝑡 = 1
typically a few tens or hundreds of microns at 15 and 30keV
Polymeric film, Specific tape,
TEM grids Voxel size increase No major analytical risk
Table 3-3 : Table summarizing the main spatially resolved analytical techniques for chemical / elemental imaging, and speciation presented in this work. These characteristics are given for SR-based instruments used in this work and can vary for each technique from one instrument to another one. As a complement thickness requirements, sample preparation and handling constraints are also presented with regard to the technique.

Chapter 3: Preparing thin sections from painting fragments: challenges and innovative solutions
81
3.9. References
Baker, C. A. 1984. Methylcellulose and sodium carboxymethylcellulose: an evaluation for use in paper conservation through accelerated aging. Studies in Conservation, 29 (Supplement-1):55-9.
Cotte, M., Checroun, E., Mazel, V., Solé, V. A., Richardin, P., Taniguchi, Y., Walter, P. & Susini, J. 2009. Combination of FTIR and X-rays synchrotron-based micro-imaging techniques for the study of ancient paintings. A practical point of view. e-PRESERVATIONScience, 6:1-9.
Cotte, M., Checroun, E., Susini, J. & Walter, P. 2007. Micro-analytical study of interactions between oil and lead compounds in paintings. Applied Physics a-Materials Science & Processing, 89 (4):841-8.
Cotte, M., Walter, P., Tsoucaris, G. & Dumas, P. 2005. Studying skin of an Egyptian mummy by infrared microscopy. Vibrational Spectroscopy, 38 (1-2):159-67.
Derrick, M., Souza, L., Kielich, T., Florsheim, H. & Stulik, D. 1994. embedding paint cross-section samples in polyester resins: problems and solutions. Journal of the American Institute for Conservation, 33 (3):227-45.
Derrick, M., Stulik, D. & Landry, J. M. 1999. Infrared spectroscopy in conservation science. Los Angeles: The Guetty conservation institute.
Fulton, I. S. 1980. Sample preparation techniques for the analysis of materials from conservation laboratories by spectroscopic methods: infrared, ultraviolet, visible, atomic absorption spectroscopies, and gas chromatography. ICCM Bulletin, 6 (2):8-19.
Gervais, C., Boon, J. J., Marone, F. & Ferreira, E. S. B. 2013. Characterization of porosity in a 19th century painting ground by synchrotron radiation X-ray tomography. Applied Physics A, 111 (1):31-8.
Gettens, R. J. 1936. The cross-sectioning of paint films. Technical Studies in the field of the fine arts, 5 (1):18-22.
Hansen, E. F., Lowinger, R. & Sadoff, E. 1993. CONSOLIDATION OF POROUS PAINT IN A VAPOR-SATURATED ATMOSPHERE. Journal of the American Institute for Conservation, 32 (1):1-14.
Hill, J. 1989. Micro-scalpel. Newsletter (Western Association for Art Conservation), 11 (1):7-8.
Keyser, B. W. 1981. Use of acrylic emulsions as non penetrating lining materials for paintings at the national gallery of canada. The International institute for conservation-canadian group, 6 (3):9-10.
Khandekar, N. 2003. Preparation of cross-sections from easel paintings. Studies in Conservation, 48 (Supplement-1):52-64.

Chapter 3: Preparing thin sections from painting fragments: challenges and innovative solutions
82
Laurie, A., McLintock, W. & Miles, F. 1914. Egyptian Blue. Proceedings of the Royal Society of London Series A, Containing Papers of a Mathematical and Physical Character (1905-1934), 89:418-29.
Laver, M. E. & Williams, R. S. 1978. the use of a diamond cell microsampling device for infrared spectrophotometric analyses of art and archaeological materials. JIIC-CG, 3 (2):34-9.
Lluveras, A., Boularand, S., Roqué, J., Cotte, M., Giráldez, P. & Vendrell-Saz, M. 2008. Weathering of gilding decorations investigated by SR: Development and distribution of calcium oxalates in the case of Sant Benet de Bages (Barcelona, Spain). Applied Physics A, 90:23-33.
Martin de Fonjaudran, C., Nevin, A., Piqué, F. & Cather, S. 2008. Stratigraphic analysis of organic materials in wall painting samples using micro-FTIR attenuated total reflectance and a novel sample preparation technique. Analytical and Bioanalytical Chemistry, 392 (1):77-86.
Mazzeo, R., Joseph, E., Prati, S. & Millemaggi, A. 2007. Attenuated Total Reflection-Fourier transform infrared microspectroscopic mapping for the characterisation of paint cross-sections. Analytica chimica acta, 599 (1):107-17.
Meirer, F., Liu, Y., Pouyet, E., Fayard, B., Cotte, M., Sanchez, C., Andrews, J. C., Mehta, A. & Sciau, P. 2013. Full-field XANES analysis of Roman ceramics to estimate firing conditions-A novel probe to study hierarchical heterogeneous materials. Journal of Analytical Atomic Spectrometry, 28 (12):1870 - 83.
Pilc, J. & White, R. 1995. The Application of FTIR-Microscopy to the Analysis of Paint Binders in Easel Paintings. National Gallery technical bulletin, 16:73-84.
Plesters, J. 1956. Cross-sections and chemical analysis of paint samples. Studies in conservation, 2 (3):110-57.
Prati, S., Joseph, E., Sciutto, G. & Mazzeo, R. 2010. New Advances in the Application of FTIR Microscopy and Spectroscopy for the Characterization of Artistic Materials. Accounts of Chemical Research, 43 (6):792–801.
Prati, S., Rosi, F., Sciutto, G., Mazzeo, R., Magrini, D., Sotiropoulou, S. & Van Bos, M. 2012. Evaluation of the effect of six different paint cross section preparation methods on the performances of Fourier Transformed Infrared microscopy in attenuated total reflection mode. Microchemical Journal, 103:79-89.
Prati, S., Sciutto, G., Catelli, E., Ashashina, A. & Mazzeo, R. 2013. Development of innovative embedding procedures for the analyses of paint cross sections in ATR FITR microscopy. Analytical and Bioanalytical Chemistry, 405 (2-3):895-905.

Chapter 3: Preparing thin sections from painting fragments: challenges and innovative solutions
83
Raehlmann, E. 1910. Uber die Maltechnik der Alten. Berlin.
Reid, N. 1972. Ultramicrotomy (part 2). Practical Methods in Electron Microscopy Amsterdam: North-Holland Publishing Co.
Sole, V. A., Papillon, E., Cotte, M., Walter, P. & Susini, J. 2007. A multiplatform code for the analysis of energy-dispersive X-ray fluorescence spectra. Spectrochimica Acta - Part B Atomic Spectroscopy, 62 (1):63-8.
Souza, L. A. C. & Derrick, M. The Use of Ft-Ir Spectrometry for The Identification and Characterization of Gesso-Glue Grounds in Wooden Polychromed Sculptures and Panel Paintings, in MRS Proceedings, (1995), pp. 573.
Spring, M. & Morrison, R. Evaluation report on protocols for representative sampling, (2011), pp. 1-39.
van der Weerd, J. 2002. Microspectroscopic analysis of traditional oil paint, AMOLF Thesis.
Wachowiak JR, M. J. 2004. efficient new methods for embedding paint and varnish samples for
microscopy. journal of the american institute for conservation, 43 (3):205-26.
Waentig, F. 1993. casting resin systems for embedding specimens.restauro3:195–99.

84
85
CHAPTER 4 : GOING TO FULL 2D SPECTRO-
CHARACTERIZATION OF CULTURAL HERITAGE MATERIALS
WITH FULL-FIELD XANES
4.1. Different approaches for 2D-XANES .......................................................................................... 86
4.2. XANES full-field instruments operating in hard X-ray domain................................................... 88
4.3. Acquisition strategy in XANES full-field mode at ID21 ............................................................... 89
4.3.1. The ID21 instrument ........................................................................................................... 89
4.3.2. Acquisition strategy ............................................................................................................ 90
4.3.3. Pre-processing challenges: image normalization and realignement .................................. 91
4.4. Different strategies available for data processing and analyses ............................................... 94
4.5. Typical example of full-field acquisition on model painting samples ........................................ 97
4.6. Sample intrinsic limits for transmission measurements .......................................................... 100
4.6.1. Iron-based mordant in wool ............................................................................................. 100
4.6.2. Degradation of lead chromate-based pigments ............................................................... 102
4.6.2.1. Previous results obtained using combined µXANES and µXRF methods ................... 102
4.6.2.2. Results obtained using full-field XANES approach ..................................................... 104
4.7. A possible solution against radiation damage ......................................................................... 108
4.7.1. Current research on Prussian Blue fading using µXANES, and associated difficulties ...... 109
4.7.2. New opportunities offered by full-field XANES approach ................................................ 110
4.8. Conclusions .............................................................................................................................. 115
4.9. References ............................................................................................................................... 116

Chapter 4 : Going to full 2D spectro-characterization of cultural heritage materials with full-field XANES
86
Abstract
While XRF, XRD and FTIR are routinely acquired as 2D (or even 3D) data set, XANES
acquisitions have long been limited to a few spectra or a few chemical maps. Recently, hard
X-ray full-field XANES instruments have been developed. It is a very promising alternative to
the scanning approach. Indeed, it offers the acquisition of sets of hyper-spectral data
containing 2D images combined with full spectral information and with reduced radiation
exposition. This technical afford is increasingly exploited at ID21 and at other synchrotron
facilities. In this chapter, we report the genesis of this approach, and present the set-up
currently available at ID21 as well as the analytical developments performed during the last
three years.
The main technical requirement to make this technique efficient is that the element of
interest is sufficiently concentrated and that the sample is prepared at an optimal thickness.
Therefore, painting thin sections were an ideal benchmark to characterize the capabilities of
the full-field XANES and illustrate the new possibilities offered in the CH field.
Fayard, B., Pouyet, E., Berruyer, G., Bugnazet, D., Cornu, C., Cotte, M., & Sole, V. A.
(2013). The new ID21 XANES full-field end-station at ESRF. In Journal of Physics:
Conference Series (Vol. 425, No. 19, p. 192001). IOP Publishing.
Paleo, P., Pouyet, E., & Kieffer, J. (2014). Image stack alignment in full-field X-ray
absorption spectroscopy using SIFT_PyOCL. Journal of synchrotron
radiation, 21(2), 0-0.
4.1.Different approaches for 2D-XANES
Imaging capabilities and chemical selectivity are both of key importance when analysing
artworks (at both the object and the fragment scales). This trend is observed for
synchrotron facilities, on laboratory instruments and more recently on portable equipment.
Considering the complexity of materials, both identification and localization of components
are required. While XRF, FTIR and XRD are routinely performed in mapping modes, 2D-
XANES use is still at its infancy.

Chapter 4 : Going to full 2D spectro-characterization of cultural heritage materials with full-field XANES
87
Currently, three XANES-based 2D approaches exist to access redox information on the
element of interest.
Most often, speciation images are obtained in scanning mode by acquiring n XRF
maps at n specific energies providing the maximum contrast between the different
speciation of the probed element. This approach is efficient if the different species show
well defined features in the edge region, corresponding at different oxidation states, e.g.
sulphur species. Nevertheless, in this approach, the field of view is limited by dwell time. In
this context, the use of ultra-fast detectors such as MAIA allows to decrease pixel
acquisition time and n to be significantly increased (>100), providing more accurate
chemical identification of the various species based on a few XANES features (Ryan, et al.,
2010). However, as described in the Chapter 2, whatever the detector, XRF measurements
may be affected by self-absorption effects when looking at thick and concentrated samples.
2D raster-scanned XANES acquisition becomes also reasonable on energy dispersive
beamlines, where spectra can be faster acquired (~1s/ pixel in transmission mode). For
example, this approach is increasingly used on the ID24 beamline at the ESRF (Pascarelli, et
al., 2006), but two main limitations restrict application for 2D mapping: the accessible field
of view and the ultimate resolution.
Similarly, transmission X-ray Microscopy (TXM) has been used for more than a decade in the
soft X-ray domain and offers the unique capability of combining spectroscopy and imaging.
Its application in the field of CH is still limited to a few cases, such as the study at the C K-
edge of fossil spores (Bertrand, et al., 2012) or at the Fe L-edges of a 450 year-old corroded
archaeological iron nail (Michelin, et al., 2013).
Whereas chemical mapping performed through soft TXM technique is a standard
technique, performing 2D-XANES in the hard X-ray range is still limited. Two approaches
have been recently explored, one based on hard X-ray microscopy (TXM), and another
based on hard X-ray lens-less imaging (full-field imaging). In both cases, a 2D camera is used
to provide imaging information on a static sample while scanning the energy of the
incoming beam around the absorption edge of the element of interest. The 3D (2D image
and energy) XANES stack consists of a series of normalized images (radiographs) that
characterize the sample absorption across the absorption edge of the element of interest.
After taking the negative logarithm of all normalized intensities, each pixel of the stack
contains a full XANES spectrum. The energy resolution of the XANES spectrum depends on

Chapter 4 : Going to full 2D spectro-characterization of cultural heritage materials with full-field XANES
88
the number of frames in the stack and is therefore only limited by the energy resolution of
the monochromator.
Thanks to the simultaneous acquisition of millions of pixels, over large sample areas with
sub-micron resolution, this technique is very well suited for the study of complex,
heterogeneous samples, in which the element of interest is concentrated, which is
frequently the case of archaeological materials, and especially of paintings.
After a general presentation of the current XANES devices operating in hard X-ray domain, a
specific discussion will be dedicated to data pre-processing and data processing, which
represent a challenging step of the full experiment. A set of simple cases (model paintings,
ink on paper and mordant on wool yarn) are used here to illustrate both the limits and the
advantages of this acquisition mode. Applications to historical objects, in particular the
study of degradation of CdS pigment and that of manufacturing processes in Roman
ceramics, are developed in Chapter 5.
4.2.XANES full-field instruments operating in hard X-ray domain
Recently developed for hard X-ray full-field XANES measurements, three devices are
presently available, at Stanford Synchrotron Radiation Lightsource (SSRL) (Andrews, et al.,
2010, Meirer, et al., 2011), at ANKA (Mangold, et al., 2013) and at the ESRF (De Andrade, et
al., 2011, Fayard, et al., 2013).
The SSRL, beamline 6-2c is based on a commercial TXM from X-Radia and is optimized
for photon energies in the range of 5 to 14 keV with spatial and energy resolutions of 30 nm
and ∆E/E = 10-4 respectively (Andrews, et al., 2010, Meirer, et al., 2011). It achieves a single
flat field of view (FOV) of about 15 x 15 µm2 or 30 x 30 µm2, depending on the X-ray optics.
At the ANKA XAS beamline the full uniform beam (9x1mm2) is used to perform sample
radiographs. Using a single crystal scintillator coupled with a microscope objective (with 3.6x
magnification and a 2x2 binning) onto a PCO camera, transmission images of the sample are
acquired with an effective pixel size of 5x5μm2 (Mangold, et al., 2013).
The ID21 full-field instrument (Figure 4-1) is based on a lens-less approach as at ANKA.
The first prototype operating in air was successfully tested and used to derive quantitative
Chapter 4 : Going to full 2D spectro-characterization of cultural heritage materials with full-field XANES
89
mapping of the ratio of Fe3+ over total iron content in complex metamorphic rocks (De
Andrade, et al., 2011). The new improved set-up is vacuum compatible to extend the range
of available K-edges, details about the ID21 set-up are given hereafter (Fayard, et al., 2013).
When starting this PhD thesis, the ID21 set-up was rather mature from the mechanical
point of view. Developments carried out over the last three years were related to the
sample holder, the data acquisition, the data processing, as well as on the assessment of the
capacities and limits of the instrument. This PhD work has contributed to these efforts with
a particular focus towards developments and applications in the field of CH as illustrated by
the examples developed below.
4.3.Acquisition strategy in XANES full-field mode at ID21
4.3.1. The ID21 instrument
The ID21 full-field instrument (Fayard, et al., 2013) (Figure 4-1) is operating under vacuum in
the same energy range as the SXM (2 to 9keV), using the same source and the same fixed-
exit double monochromator (Si(111), Si(220)). The focusing optics are removed from the
beam path, and the secondary slits are the unique element which defines the beam size
(typically 1.5mm×1.5mm). The beam spatial structures generated by the primary double
mirror system (used to remove 3rd harmonics, see section 2.3.2) can be easily smoothened
using an X-ray decoheror (a 125 μm graphite foil for E > 5keV or a paper filter for E < 5keV)
placed 1 meter upstream from the sample position. Samples are mounted vertically,
perpendicular to the beam on a fast motion sample stage. Sample radiographies are
acquired via a detecting ensemble made of a scintillator (Lu2SiO5:Tb), a magnifying long
working distance optical objective (Mitutoyo) and a CMOS camera (CMOS PCO camera). It
accommodates pixel size ranging from 0.3 µm to 1.4 µm and fields of view from 600 µm up
to 2 mm.

Chapter 4 : Going to full 2D spectro-characterization of cultural heritage materials with full-field XANES
90
Figure 4-1 : Two main data collection modalities available at the ID21 beamline: scanning and full-field imaging.
4.3.2. Acquisition strategy
One typical acquisition cycle may be defined as follow.
The monochromator is set at the first energy of the XANES energy range, the beam shutter
is closed and a dark image is acquired. Then, the shutter is open and a first image of the
beam is acquired without sample in the field of view. This image is called reference image.
Then, the sample is moved back into the field of view and radiography of the sample is
acquired named data. To correct the spatial heterogeneity of the beam intensity, each
sample transmission image data, is normalized by the corresponding reference image. A
corrected image acquired at specific energy Ei can be expressed as follows:
ApertureFocusing
optics
Sample
(thin section)TranslationDetector
Photodiode,
XRD camera
Scanning X-ray microscope
EDS,
photodiode
Insertion
device
Photodiode,
XRD camera
EDS,
photodiode
Insertion
device
Double crystal
monochromator
Unfocused mode
Focused mode
FULL-FIELD IMAGING
SCANNING MODE
Visible
camera
Insertion
device
Full-field X-ray microscope
Decoheror Scintillator
Chapter 4 : Going to full 2D spectro-characterization of cultural heritage materials with full-field XANES
91
𝑇𝑟𝑎𝑛𝑠𝑚𝑖𝑡𝑡𝑎𝑛𝑐𝑒 (𝐸𝑖) =𝐼 𝑑𝑎𝑡𝑎 (𝐸𝑖) − 𝐼 𝑑𝑎𝑟𝑘
𝐼 𝑟𝑒𝑓𝑒𝑟𝑒𝑛𝑐𝑒 (𝐸𝑖) − 𝐼 𝑑𝑎𝑟𝑘
The acquisition is repeated for all energy steps defined over the full energy range covered
by XANES acquisition. The beam structures strongly depend on the energy, therefore
reference images must be acquired also for each energy step across the absorption edge of
the element of interest.
This instrument allows easily defining different energy regions with different energy steps,
0.1 eV in edge regions to 1 or 2 eV in the post-edge region, optimizing acquisition time with
data relevance, hardly feasible with the current µXANES acquisitions.
The final acquisition time is in the order of 0.5h per sample, for a full XANES map of 1x1mm2
with an energy resolution of 1eV over a 100eV range. This makes this set-up very
competitive with respect to the scanning approach.
Basically, about 300 normalized radiographies are acquired over a few hundreds of
eV, with variable energy steps. Compared with usual XANES measurements acquired in
transmission mode, the final SNR of XANES spectrum is mostly dictated by: i) the
movements of X-ray beam, as reference image is not recorded simultaneously with the
sample and ii) sample movements due to in-out motion for each energy step.
To cope with the first limitation, a fast sample translation, reducing time between reference
and data image acquisitions, has been designed combined with the implementation of an
"accumulation mode" for fast multi frame 2D image acquisitions and with the possibility to
acquire reference image before and after data image.
In parallel regarding the second limitation, efforts were made in collaboration with ESRF
Data Analyses Unit to develop an accurate procedure of realignment of the normalized
images to achieve alignment precision better than 0.1 pixel as developed below.
4.3.3. Pre-processing challenges: image normalization and realignment
Since the sample moves in and out of the beam for every energy step, a realignment
procedure is needed for every frame to correct for the imperfect repositioning of the

Chapter 4 : Going to full 2D spectro-characterization of cultural heritage materials with full-field XANES
92
sample. This procedure is fundamental for the success of the measurement. In this case,
hyperspectral image construction requires an image alignment procedure with sub-pixel
precision. While the image and phase correlation algorithms have originally been
extensively used for image re-alignment, they present two main drawbacks: i) they only
measure translation movements, and ii) they are highly sensitive to artefacts present in the
image (dust or scratches on the scintillator).
In order to solve these specific issues, image alignment based on keypoints
extraction has been developed in collaboration with Pierre Paleo during his master thesis,
supervised by J. Kieffer at ESRF on 2013 (Paleo, et al., 2014). This method is called "feature-
based registration" and is based on the establishment of correspondence between a
number of distinctive points in images. Since these points are not defined by spatial position
and are associated to the scale of the features and their orientation, the keypoints method
is naturally robust versus translation, rotation and change of scale. Based on a widely used
panoramic image stitching algorithm (Lowe, 2004, Lowe, 1999), the Scale Invariant Feature
Transform (SIFT) has been adapted to full-field XANES from the IPOL implementation (Yu, et
al., 2011).
Whereas the alignment of full-field stack performed with SIFT algorithm and
correlation method gives similar result in term of quality very good reliability against
artefacts is observed for SIFT keypoint extraction only. This is mainly thanks to the
possibility to easily remove keypoints in unwanted areas of the image. This aspect is
illustrated in the following example aiming at better understanding the degradation of
cadmium yellow pigment in historical samples. An image stack was collected at the K-edge
of sulphur (2.45–2.66 keV, 346 frames) from a resin-based thin section (15 μm) of a paint
micro-sample from Matisse’s Flowers in a Pitcher (1906), belonged to the Barnes foundation
(accession number 205). The image in Figure 4–2a represents the normalized X-ray
transmission of this sample at 2.46 keV.
Each arrow on the figure represents a keypoint, as extracted by the SIFT algorithm. Red
arrows are characteristics of the region of interest (i.e. the sample) while the blue ones
correspond either to resin features (matrix) or scintillator features (that need to be removed
as they do not move with the sample). By, using correlation method, the XANES stack
alignment has failed for this sample. This is possibly due to the strong change in intensity on
the resin borders, forcing an alignment on the related line. Evidence of the poor alignment

Chapter 4 : Going to full 2D spectro-characterization of cultural heritage materials with full-field XANES
93
corresponding to correlation method (on the pixel scale) is given in Figure 4-2b. This figure
represents a section of the 3D XANES map along 1D spatial (vertical direction on the
radiographies, y [490, 580],) and 1D spectral (over the full energy range, 346 steps)
dimensions. These values were taken for x=500 (line crossing the sample; Fig .4-2a), in the
derivative of the transmission signal (by comparison with the transmission signal, the
derivative better highlights the sample boundaries). The section is presented both for
correlation (top) and for SIFT (bottom) alignment procedures. Maxima (red) and minima
(blue) of the derivative become horizontal lines when the alignment is perfect. In this
example, the correlation method presents clear bent sections and apparently
underestimates the displacement in comparison with results obtained by means of the SIFT
algorithm.
In this context, a Python module, named SIFT_PyOCL, has been developed and is
now daily used for stack realignment during full-field analyses at ID21 thanks to its
robustness against scale, rotation and illumination changes. It implements a parallel version
of the SIFT algorithm in OpenCL, providing high-speed image registration and alignment
both on processors and graphics cards. Whereas the performance of the algorithm allows
online processing of large datasets, this code was also made open-source for free
distribution as largely explained in (Paleo, et al., 2014). The stack of aligned images is saved
as a single file with .hdf5 format.
a)
b)
Figure 4-2:a) X-ray radiography of the painting thin section acquired at ID21 (at 2.46 keV). The position of SIFT keypoints are represented by red arrows for the sample and by blue arrows for the matrix, from (Paleo, et al., 2014). b) Alignment quality comparison between the correlation method (upper frame) and the SIFT method (lower frame). The figure is a vertical slice through the sample in a) at x = 500. To highlight the sample boundaries, the y-derivative of the transmission function is represented in false colours, from (Paleo, et al., 2014).
1000
800
600
400
200
0
200 400 600 800 1000 1200

Chapter 4 : Going to full 2D spectro-characterization of cultural heritage materials with full-field XANES
94
4.4.Different strategies available for data processing and analyses
After determining appropriate acquisition parameters and improved data pre-processing
strategy, the data treatment of these massive stacks posed some issues, as no software was
available at this time at the beamline to process the stack created at the end of the pre-
processing.
Indeed, this technical development induces changes in terms of data analysis due to the
substantial increase of collected spectra, which went up by several orders of magnitude:
from a few tens or hundreds in traditional scanning probes to several millions in e.g. a
mosaic full-field XANES measurement. On one hand the large XANES spectra number poses
an analytical and computational challenge, since manual processing (as commonly
performed for scanning mode) is no longer feasible. But, on the other hand it allows
powerful methods of multivariate analysis for data evaluation to be used.
Whereas some in-house program existed, some time was spent in looking at full-field XANES
specific software or possible extension of existing visualisation software. Consequently,
during this study, the free software PyMca, developed by V.A. Solé (Sole, et al., 2007), was
adapted to propose new tools which were tested for the analyses of full-field XANES stack,
e.g. XANES stack normalization. In parallel, the TXM-Wizard software, developed by Y. Liu
and F. Meirer originally for the TXM instrument at SSRL (Liu, et al., 2012), was modified to
allow reading and processing the stacks acquired at ID21.
Both softwares were tested and employed during this study since they provide a series of
complementary automated processing options for the extraction of scientifically meaningful
information from the data stacks, as developed below.
Data processing of XANES spectra starts with the edge normalization step (different
procedure with respect to the image normalization detailed earlier), that in our case mainly
uses linear regression in the pre- and post-edge region for normalizing the pre-edge and
post-edge regions respectively to 0 and 1. For both software packages the normalization is
now available and performed on almost 6Gb data within a few minutes time scale.

Chapter 4 : Going to full 2D spectro-characterization of cultural heritage materials with full-field XANES
95
Supplementary filtering can be applied to the entire stack when using the TXM-Wizard
software in order to rapidly improve the data quality, and the corresponding data
processing and analyses.
The low-absorbing area of the sample can be filtered out. Since these data
present a very low SNR, it is possible to easily remove them using threshold on the
edge jump value. If the edge jump threshold is smaller than the standard deviation in
the pre-edge region, the pixel is removed.
A second filter is also available to remove pixels that could not be efficiently
normalized by the normalization algorithm above mentioned. The filter threshold
allows removing unreasonable slope values in post- and pre- edge regions after the
normalization procedure.
We developed our own code (using Matlab) to make available a specific third
filter threshold to remove pixels with too high absorption. Some areas present a high
absorption which could lead to the deformation of the XANES spectra, and to a false
interpretation of the dataset. For such cases, looking at post-edge value map allows
removing pixels with too high absorption (typically a value of sample absorbance of
2.5 was set as maximum, which corresponds to 8% of transmittance).
Once spectra are normalized, different steps and strategies in the data interpretation
exist. For classical XANES experiments (few spectra), the simplest interpretation consists in
comparing spectra with a known reference compound. While this approach is feasible for
few single XANES profiles, it becomes rather complicated when millions of spectra are
recorded.
For 2D-XANES data, a simple mapping tool is available with the TXM-Wizard software
to extract qualitative maps of the different oxidation states of a same element. A map of the
energy value of the edge position allows, in most cases, the identification and localisation of
changes in the oxidation states to be achieved.
A second approach is the linear combination (LC) fitting, implemented on each pixel
of the map (details can be found in (Liu, et al., 2012)), this option is only available in TXM-
Wizard explaining the extensive use of this software in the coming data treatment. Each
pixel spectrum is fitted as the sum of a set of reference spectra using a least squares
method (LSLC). The difference between the theoretical fit and experimental data (factor R

Chapter 4 : Going to full 2D spectro-characterization of cultural heritage materials with full-field XANES
96
defined as 𝑅 =∑(data−fit)2
∑(data)2) gives a direct control of the quality of the fit at the map scale
and can allow identifying missing phases in the reference set. One of the most important
assets of this technique is its quantitative character, since it provides the relative
contribution of each reference present in the mixture. However, this strategy presents an
important drawback, as it necessitates an a priori knowledge of the phases present in the
sample. As for single XANES LC fitting, this method relies on: i) an accurate energy
calibration of references and datasets, ii) a reliable choice of references (guided for example
with complementary analyses: XRD, FTIR, Raman, etc.), and iii) a reference set as close as
possible to the actual composition of the sample itself to avoid differences in the
background shape, in pre- and post-edge regions between references and datasets.
These constraints and the massive dataset size motivate the use of a further strategy
for data analyses: the Principal Component Analyses (PCA), available in both softwares. This
alternative method relies on the definition of a function, which captures the largest variance
fraction between the original dataset and, at the same time, reduces the dimensionality of
the energy range, while preserving the relevant information (Johnson, et al., 2002, Jolliffe,
2005).
As a result, pixels with similar XANES spectra are closer in the reduced PC space or score
plot. This property is used to cluster pixels into groups in TXM-Wizard (details can be found
in (Boesenberg, et al., 2013)) resulting in an image segmentation very useful to represent
the variance in XANES features.
This technique is therefore very sensitive to noise and thickness effects, and the three filters
previously presented are mandatory to allow relevant PCA results. However, for most of the
samples analysed, most of PC are strongly affected by noise, thus specific attention should
be devoted in order to address this issue, either by smoothing the data by binning them
(energy resolution), with a Savitzky-Golay filter, or by analysing the Fourier transform of the
different eigenvectors of the PC (giving a direct observation of the spectral weight: either
distributed roughly for shot noise or with weight concentrated at low frequencies in energy
space, suggesting their origin from well-defined spectral features).
These developments are now mandatory to go a step forward in data analysis.

Chapter 4 : Going to full 2D spectro-characterization of cultural heritage materials with full-field XANES
97
As observed during this work, a close contact between the users and the developers is
mandatory to help pushing the limits of softwares, and should be continued.
4.5.Typical example of full-field acquisition on model painting samples
Thanks to the developments of improved data acquisition, pre-processing, and processing
steps, the full-field XANES technique was first tested on a painting sample. Whereas some
historical samples were already identified as good candidate, mock-up sample was first
chosen to characterize the possibilities of this system for the study of paint material (Fayard,
et al., 2013).
In this context, we carried out the first experiments in order to evaluate the
capabilities of the XANES full-field set-up to map the oxidation state of pigments that
constitute the painting layers. For the feasibility trial, model paint samples were primarily
designed as a biphasic system composed of one layer of manganese dioxide (MnO2) and
another one of manganese sulphate (MnSO4). Both pigments were mixed with linseed oil in
an unknown ratio. Their chosen was based on their different oxidation state and XANES
signatures. Thin-sections of 30μm in thickness were prepared using a microtome (Figure
4-3a). This value was chosen on the basis of preliminary theoretical calculations, using
PyMca; for 30 μm of pure MnO2, theoretical transmission corresponds to 60% and 20%
respectively in pre-edge and post-edge regions and to 50% and 7% in pre-edge and post-
edge regions for MnSO4. This thickness represents a good compromise between maximum
of absorption in edge position and post-edge region. The theoretical calculations were
confirmed by experimental measurements of model samples, that showed minima
transmission values of 40% and 8% in pre-edge and post-edge regions respectively (Figure
4-3). Whereas binder was present in high quantity into model samples, estimations made
for pure pigment fit with the experimental dataset. This highlights possible area of pure
pigment. Consequently for real samples, the possibility to cross only pure inorganic material
through the section thickness should be considered in theoretical preliminary thickness
estimation.

Chapter 4 : Going to full 2D spectro-characterization of cultural heritage materials with full-field XANES
98
a)
b)
Figure 4-3: Sample transmittance images acquired on a 30µm section of a bilayer model painting (MnO2/MnSO4) a) in the pre-edge region at 6.53keV and b) in the post-edge region at 6.63keV of the Mn K-edge.Cf. visible picture and sketch in Figure 4-4a.
This preparation allows for studying the painting cross-section with a good
preservation of the sample spatial structures (Figure 4-3b). 2D XANES analyses were then
performed around the Mn K-edge from 6.54 to 6.64 keV in 100 energy steps, in 45 minutes.
Results of full-field acquisition were obtained following two independent approaches
(Figure 4-4c and d): principle component analysis (PCA) combined to subsequent k-means
clustering, and (b) least squares linear combination (LSLC) fitting with MnO2 and MnSO4
standards and subsequent R-factor correlation analysis. Both methods gave 2D oxidation
state mapping of Mn-based pigments with a sub-micrometric resolution and a field of view
of ~1mm2. From PCA and LSLC results, XANES spectra are respectively extracted from i) a
single pixel in each of the two manganese layers and ii) XANES pixels sum of cluster 1 and 2.
For single pixel XANES spectrum, the SNR allows reliable LSLC fitting with low R-factor values
(between 0 and 0.1). This last procedure allows for highly sensitive and quantitative 2D
mapping of the two manganese species and opens new possibilities for investigations of
historical paint micro-samples.

Chapter 4 : Going to full 2D spectro-characterization of cultural heritage materials with full-field XANES
99
Figure 4-4: a) Optical image of a 30 μm thick section composed of MnO2 and MnSO4 layers as illustrated in the schema, b) One of the thousands transmission image of the sample recorded by a 2D detector (pixel size: 0.7×0.7µm²) at E=6.45keV, c) PCA and subsequent clustering results for localisation of the two Mn-based species with correlative sum of pixel XANES, d) LSLC results using MnO2 and MnSO4 reference standards for localisation and quantification of Mn-based species into the sample. From localisation, one pixel XANES spectrum was extracted from each phase.
Thin section (30 µm)
100 µm
MnSO4 MnO2
Cluster 1
Cluster 2
Energy (eV)
No
rmal
ized
ab
sorp
tion
(a.
u.)
6520 6540 6560 6580 6600 6620
XANES of cluster 1
XANES of cluster 2
0
0.5
1
1.5
2
MnSO4
MnO2
Energy (eV)
6520 6540 6560 6580 6600
0
0.5
1
1.5
2
XANES of single pixel in MnSO4
XANES of single pixel in MnO2
No
rmal
ized
ab
sorp
tion
(a.
u.)
6620
a) b)
c)
d)

Chapter 4 : Going to full 2D spectro-characterization of cultural heritage materials with full-field XANES
100
4.6.Sample intrinsic limits for transmission measurements
Whereas the full-field approach gave promising results on a large variety of CH materials,
this technique presents some intrinsic technical limitations based on transmission
acquisition mode.
As explained in section 2.4.4, the feasibility of XANES spectra acquisition in transmission
mode strongly depends on the element and the edge of interest, the concentration of this
element in the sample, and the nature of the sample matrix. Looking at very dilute element
or at element present in heavy absorbing matrix can represent an obstacle often limiting the
effectiveness of the transmission mode. Hereafter, limits of the applicability of full-field set-
up are illustrated by presenting and discussing the results obtained on iron mordant in wool,
and on lead chromate pigment in painting mock-up.
4.6.1. Iron-based mordant in wool
The first example is a wool yarn sample mordanted with iron. This sample was provided by
Ilaria Degano, University of Pisa (Italy), following the ESRF experiment EC1043.
The aim of the experiment was to investigate with combined FTIR and XANES
methods the substrate-mordant complex with particular attention to the wool-Fe-tannins
system, to better understand the mordant decay processes and thus find possible
preservation/conservation strategies.
The Fe K-edge absorption signal in transmission mode via full-field setup was acquired on a
fibre of wool containing iron mordant (Fe (III)-[GAFe]), that was originally prepared for FTIR
measurements, i.e. embedded into HistoResin an microtomed as a thin section 1μm thick.
The sample transmission values below and above the edge were very similar, comprised
between 100% to 67%, and fulfil consequently maximum absorption value requirements as
developed in section 2.4.4 (Figure 4-5a-b).

Chapter 4 : Going to full 2D spectro-characterization of cultural heritage materials with full-field XANES
101
a)
b)
c)
Figure 4-5 : Transmittance acquired over the thin section of a wool fiber, a) in the pre-edge region (7.10 keV) and b) in the post-edge region (7.25 keV) of Fe the K-edge. c) XANES sum of all pixels contained in sample area with transmittance comprised between 0.9 and 0.6 of Fe k-edge.
However, the edge value of XANES sum of all pixels contained in sample area was
quasi indistinguishable from the noise level. In this example iron based species were too
diluted and therefore not suited to extract useful XANES with sufficient SNR (Figure 4-5c).
From global concentration we foresaw that extracting useful XANES spectrum would have
been complicated, however we expected for equivalent concentration the presence of
aggregates which locally would increase Fe concentration and subsequent information. This
was not the case in this example. Consequently, increasing sample thickness or acquisition
number would not be sufficient to improve the results obtained here. XANES in XRF mode is
clearly the best approach for such cases.
0.077
0.079
0.081
0.083
0.085
0.087
0.089
7.05 7.1 7.15 7.2 7.25 7.3 7.35
xμ(E
)
E (keV)
XANES sum

Chapter 4 : Going to full 2D spectro-characterization of cultural heritage materials with full-field XANES
102
4.6.2. Degradation of lead chromate-based pigments
Conversely to dyes, pigments in paintings are usually less diluted. From a chemical point of
view, many inorganic pigments are made of one or several metals (e.g. Cr, Cd, Hg, As, etc.),
and can be present in the form of oxides, hydroxides, sulphides, etc. In terms of mass ratio,
metals are usually concentrated, offering ideal cases for XANES measurement in
transmission. This is well illustrated by the example of the MnO2 / MnSO4 study previously
discussed (Figure 4-4). However, pigments in painting specimens can present entangled
situations where the element of interest competes with highly absorbing matrix as
exemplified in the case of the chrome yellow pigment degradation case study presented
below.
4.6.2.1. Previous results obtained using combined µXANES and µXRF methods
Among the different synthesised pigments of the 19th century, the chrome yellow pigments,
because of their brightness and colour intensity, took an important position in the already
existing yellow pigments pallet. However due to their chemical instability, that leads to a
darkening of the original yellow color, they were rapidly abandoned and replaced by other
pigments believed to be more stable, such as for example cadmium sulphides yellows.
Chrome yellows are characterized by different chemical composition (PbCr1-xSxO4, 0≤x≤0.8)
and crystalline structure (monoclinic and/or orthorhombic).
Over the last five years, L. Monico, University of Perugia (Italy), under the co-supervision of
K. Janssens, University of Antwerp (Belgium), B. Brunetti, University of Perugia (Italy), C.
Miliani, ISTM-CNR (Italy), developed an intense study that aimed at identifying the effect of
the composition, as well as other factors on the chemical transformations leading to the
alteration of this class of pigments (Monico, 2012).
For this purpose, both i) artificially aged oil paint models were prepared with
commercial and in-house synthesized powders (PbCrO4 and PbCr1-xSxO4 co-precipitates with
different x concentration values), and ii) a set of original micro-samples from paintings by
Vincent van Gogh were characterized by means of multiple analytical methods.

Chapter 4 : Going to full 2D spectro-characterization of cultural heritage materials with full-field XANES
103
Scanning mode µXANES (in XRF mode) and µXRF measurements at the Cr K-edge
were performed at the ID21 beamline and allowed the darkening of chrome yellows to be
ascribed to a photo-reduction of the original CrVI to CrIII. This phenomenon was favoured for
the orthorhombic S-rich PbCr1-xSxO4 (x>0.4) co-precipitate and occurred not only when the
pigment was exposed to the UVA-light but also under the blue light (Monico, 2012, Monico,
et al., 2013, Monico, et al., 2013, Monico, et al., 2011, Monico, et al., 2011).
As an example, Figure 4-6a (uppermost image) shows the photographs of the oil paints
containing the photo-sensitive orthorhombic PbCr0.25S0.75O4 powder (noted S3D in (Monico,
2012)) before and after exposure to the different wavelength bands of the UV-visible light.
The picture of a resin-embedded cross-section (Figure 4-6a, OM_2) taken from the sample
treated using UVA-visible light (OM_1) is also illustrated (Monico, 2012, Monico, et al.,
2013, Monico, et al., 2013, Monico, et al., 2011, Monico, et al., 2011). The brown
degradation layer that is formed after the aging treatment is generally limited to the first 3-
4µm of the exposed surface of the sample.
The relative abundance percentage of CrVI (expressed as [CrVI]/[Crtotal]) was estimated by
performing a LC fitting procedure of the XANES spectra. Notably, three reference
components were required to adequately describe the profiles acquired along the
discoloured first 2-3 μm of the S3D cross-section: PbCrO4, Cr2O3∙2H2O, and either Cr(III)
potassium sulphate dodecahydrate [KCr(SO4)2∙12H2O] or Cr(III) acetylacetonate [Cr(acac)3].
Only two components [PbCrO4, and either Cr2O3·2H2O or Cr(acac)3] were included in the fit
for describing the spectra collected at greater depth (yellow bulk). The [CrVI]/[Crtotal] ratio
was consequently estimated in the superficial brown layer (ca. 40-60%) and yellow bulk (ca.
60-80%) showing a progressive decrease of this value toward the sample surface.
Considering the size of the corpus and the ease of preparing thin sections of
controlled thickness using SES protocol (see section 3.5.2), we aimed at evaluating the
potential capabilities of full-field set-up for this problematic in the case of the UVA-visible
aged S3D oil paint model. Consequently, the previous micro-investigations were here
complemented by a few tests using full-field instrument.

Chapter 4 : Going to full 2D spectro-characterization of cultural heritage materials with full-field XANES
104
4.6.2.2. Results obtained using full-field XANES approach
Following the SES protocol (see section 3.5.2), the sample was prepared as a 7μm thick thin-
section. The transmission measured on this section in the pre-edge region (~40%, Figure
4-6b) is equivalent to the one calculated for 4µm of pure PbCr0.25S0.75O4 pigment (with a
density of 6.12 g/cm3). This difference is explained by the dilution of the pigment in oil.
XANES spectra were acquired at the Cr K-edge from 5.98 to 5.99 in 230 steps, over
an image size of 500 x 200 μm2 with pixel size of 0.35 x 0.35μm2. The entire acquisition was
repeated 3 times in order to improve the SNR of pixel XANES spectrum. The stack sum of the
performed repetitions is used in the results presented below.
After normalization and pixel filtering a LC fitting of the entire map was performed.
In line with previous investigations acquired in fluorescence mode, three components were
necessary to adequately describe the XANES profiles acquired at the most exposed surface,
ca. first 10 μm see on the right side of the sample section shown in Figure 4-6b.
By decomposition of the full-field stack as LC of the three references Cr2O3.2H2O, Cr(III)
potassium sulphate dodecahydrate and PbCrO4, three respective speciation maps were
obtained (Figure 4-7a).
A decrease of PbCrO4 is noticed in the first 30 pixels (ca. 10 first microns) correlated with an
increase of CrIII+ species. As previously observed (Monico, 2012, Monico, et al., 2013,
Monico, et al., 2013, Monico, et al., 2011, Monico, et al., 2011), the surface area presents a
lower CrIV+ / CrTOT ratio (ca. 50%) which progressively increases when moving toward the
yellow bulk sample (ca. 75%) (Figure 4-7b).

Chapter 4 : Going to full 2D spectro-characterization of cultural heritage materials with full-field XANES
105
a)
b)
Figure 4-6: a) (on top)Image of several S3D paint models aged under different wavelenghts of the UV-visible light and optical microscope pictures of the unembedded (OM-1) and embedded (OM-2) UVA-Vis aged S3D, from (Monico, 2012). b) Transmittance images of the sample acquired at 5.980 (below the Cr K-edge) and 6.05keV (above the Cr K-edge) prepared as thin-section 7µm thick using SES protocol. The light exposed surface is on the right side of both images.
These preliminary results are similar to previous studies in XRF mode, though the quality of
the 2D-XANES pixel spectra compared to the scanning XANES spectra, and consequent LCLS
results, is lower.

Chapter 4 : Going to full 2D spectro-characterization of cultural heritage materials with full-field XANES
106
a) Distribution of PbCrO4
Distribution of Cr2O3.2H2O
Distribution of KCr(SO4)2 12H2O
b)
Figure 4-7: Full-field XANES analysis of a photo-aged chrome yellow paint. a) LC results providing distribution maps of KCr(SO4)2 12H2O, Cr2O3.2H2O, and PbCrO4 compounds. b) Single XANES spectrum extracted from the yellow bulk sample and the surface area.
In order to estimate the significance of these dataset, SNR of each pixel was
estimated using the software designed by Vitaly Khlebnikov during his master thesis at ID21
in 2013, supervised by B.Fayard. The histogram of SNR distributions is represented in Figure
4-8a. As presented in this figure, the majority of the pixels presents a SNR value close to 10.
This value limits the extraction of significant information, beside from the elemental
mapping. Consequently, even if the results obtained are in agreement with previous
µXRF/µXANES analyses of the same sample, the quality of data is too poor to encourage
further full-field analysis of similar samples.
100 μm
0
0.2
0.4
0.6
0.8
1
1.2
1.4
1.6
5980 6000 6020 6040
No
rmal
ize
d a
bso
rpti
on
E(eV)
Surface single XANES
Bulk single XANES

Chapter 4 : Going to full 2D spectro-characterization of cultural heritage materials with full-field XANES
107
a)
b)
c)
Figure 4-8: SNR automated calculation applied to full pixels of the acquisition, with complementary histogram of distribution of the SNR values a) and relative XANES with highest (224) b) and smallest (1) c) SNR values.
The major constraint of this example was an element of interest (Cr) partially substituted by
S, with edge absorption furthermore competing with the high absorption of Pb.
Figure 4-9 presents the X-ray absorption of 4µm of pure PbCrxS1-xO4, for x=1, 0.75, 0.5 and
0.25 with average density of 6.12g/cm3. As observed in Figure 4-9, the lower proportion of
Cr in this compound gives an edge jump value of 0.04, which dramatically depresses the SNR
(being 4 times smaller than the SNR expected if studying classical PbCrO4).
Figure 4-9: Theoretical calculation of absorption values of PbCrO4, PbCr0.75S0.25O4, PbCr0.5S0.5O4 and PbCr0.25S0.75O4 around the Cr K-edge absorption energy (for an average thickness of 4μm and density of 6.12g/cm
3).
0.3
0.32
0.34
0.36
0.38
0.4
0.42
0.44
0.46
5.5 5.7 5.9 6.1 6.3 6.5
Ab
sorp
tio
n
Energy (keV)
Pb Cr0.25 S0.75 O4
Pb Cr0.5 S0.5 O4
Pb Cr0.75 S0.25 O4
Pb Cr O4
PbCr0.25S0.75O4
PbCr0.5S0.5O4
PbCr0.75S0.25O4
PbCrO4

Chapter 4 : Going to full 2D spectro-characterization of cultural heritage materials with full-field XANES
108
In this context, a solution could be to increase the sample thickness. However, as shown in
Figure 4-9, Pb and S contribute to the majority of absorption. The Cr edge absorption
represents only 15% of the linear absorption coefficient in PbCrO4, and down to 4% in
PbCr0.25S0.75O4. In these conditions, acquisitions are possible, but far from optimal
conditions.
In both wool fibre and lead chromate cases, the absolute amount of the element of interest
and its absorption strength relative to that of the surrounding matrix played a key role on
the data quality and its analysis. If full-field measurements present a clear increase of data
amount and relevance at the sample scale, the requirements in terms of pre- and post-edge
absorption and of structure size may severely limit its application.
The current development of an automated SNR calculations will help in the future for
determining the more suitable data acquisition parameters to improve data quality in the
case of complex samples, such as for examples presented above.
4.7. A possible solution against radiation damage
Synchrotron analyses are usually presented as non-destructive. However, in some cases,
artistic materials may be damaged during beam exposure. Micro-probes, and even nano-
probes can generate radiation damage due to the higher power density of an X-ray beam
focused into a micro (nano) metric site.
These phenomena may generate new species, and consequently compromise the data
interpretation. In particular radiation damage issue has already been reported for several
compounds where a metal is present in an organic environment, e.g. iron gall ink
(Kanngiesser, et al., 2004, Wilke, et al., 2009), iron in haemoglobin (Mazel, et al., 2007), or
iron in Prussian Blue (Gervais, et al., 2013, Schroeder, et al., 2008). This effect may be
diagnosed using data (XANES, XRD, etc.) evolution over successive acquisitions. If noticed, a
few strategies exists to reduce the damages: i) by decreasing the exposure time (thanks for
efficient detectors), ii) by decreasing the beam intensity (e.g. with attenuators), by placing
the sample slightly out of the focal plane, where the photon density is lower (e.g. by losing
spatial resolution) iii) or as well by regularly changing the area exposed after each

Chapter 4 : Going to full 2D spectro-characterization of cultural heritage materials with full-field XANES
109
measurement. µXANES can be even more demanding since in addition to the micro-probe,
spectral information requires acquisition over hundreds of energy points.
In this context full-field acquisition mode may provide the low-dose beam combined with
micrometric resolution on millimetric sample area. In order to illustrate this possibility the
Prussian Blue case XANES study is presented below.
4.7.1. Current research on Prussian Blue fading using µXANES, and associated
difficulties
Prussian Blue (PB, iron(III) hexacyanoferrate(II)) is a well-known photosensitive
compound. It was widely used in Europe in the 18th and 19th centuries as artist’s pigment,
and was later employed as a dye in the first photographic printing processes, and for a wide
range of manufactured objects (Lavédrine, et al., 2005). It poses several problems of
conservation because of its fading under light and anoxia treatment (Rowe, 2004, Samain, et
al., 2011). This fading is directly correlated to the reduction of iron (III) into iron (II), in which
different factors play a role, in particular the environment, the substrate and the Prussian
Blue particles site distribution, within the substrate.
The “live” fading of this pigment has been recently studied using time-resolved energy-
dispersive XANES, at the synchrotron SOLEIL (Gervais, et al., 2013, Gervais, et al., 2013). The
research group led by C. Gervais, Bern University of the Arts (Switzerland), was interesting in
assessing the effects on the pigment stability of paper substrate, visible light, environmental
gas and humidity were investigated. However, the investigation of this degradation
presented two major challenges: i) studying the heterogeneity of the pigment at the fibre
scale (particles sites vs. paper fibre scale) and ii) solving its photosensitivity towards SR
beam.
As already observed, this study highlighted the difficulty to differentiate between visible
light degradation (under a Xe source) from the X-ray radiation damages (during the XANES
measurement) as both illuminations induce similar changes in the XANES spectrum scale
(Figure 4-10).

Chapter 4 : Going to full 2D spectro-characterization of cultural heritage materials with full-field XANES
110
Figure 4-10: Comparison of radiation damage effect and aged fading on Fe K-edge XANES of Prussian Blue impregnated sample, from (Schroeder, et al., 2008) modified.
4.7.2. New opportunities offered by full-field XANES approach
The PB-paper system was therefore considered as a good example to compare radiation
damage issues in different experimental configurations (scanning and full-field) of the X-ray
microscope at the ID21 beamline.
The studied sample was provided by C. Gervais: a Whatman paper impregnated with
Prussian Blue pigment. It was of appropriate thickness to allow good measurements in
transmission mode; consequently no preparation was applied on this sample. Acquisitions
were carried out at ID21 in three different set-ups all under vacuum, at the Fe K-edge
(Figure 4-11a):
1- unfocused beam: in the SXM, the beam size was defined using a pinhole (beamsize:
200 µm diameter and intensity: 8.2 1010 ph/s). The XANES spectra were collected in
transmission mode using a photodiode.
2- focused beam: in the SXM, the beam was focused using a zone-plate (beam size:
0.12 µm(ver.)×0.97 µm(hor.) and intensity: 1.12 1010 ph/s). The XANES spectra were
collected in transmission with the same photodiode.
3- full-field mode: the beam size was defined using secondary slits (0.9 mm(ver.)×0.4
mm(hor.) and intensity of 1.4 1011 ph/s) and radiographies were acquired in
transmission with a 2D camera.
Reduction in the intensity of the white line
feature at 7132 eV
Strong reduction of thenear-edge shoulder at
7122 eV
Beamdamage
Chapter 4 : Going to full 2D spectro-characterization of cultural heritage materials with full-field XANES
111
Results are shown in Figure 4-11b.
In the case of the unfocused 200 µm beam (pinhole), a series of 20 consecutive scans
were acquired (over 18 minutes) and did not show any temporal variation.
In the case of the focused beam (zone plate), a series of 10 consecutive scans were acquired
(over 9 minutes) and important temporal evolutions could be observed: the edge position
shifted to lower energies and the spectral pattern above and below the edge was modified.
By performing a comparison with the spectrum acquired in the unfocused mode, it can be
noticed that even after the first scan, the photo-reduction is already observable.
In the case of the full-field mode, four full stacks of 2D XANES data were acquired
(corresponding to a total acquisition time of 45×4 minutes). These four iterations were not
needed to get proper signal (one acquisition was enough); they aimed at overexposing the
sample. Average spectra were calculated over a surface corresponding to a 200 µm-
diameter disk, and no differences were observed between the first and the forth
acquisition, nor with the spectra acquired in unfocused mode.
The variations between unfocused (pinhole or full-field) and focused beam modes
can be easily understood when considering that the photon density is increased by a factor
105 in the latter case (Figure 4-11a).
The full-field mode therefore offers the combined micrometric resolution of the
focused beam but with the low dose level of the unfocused beam.

Chapter 4 : Going to full 2D spectro-characterization of cultural heritage materials with full-field XANES
112
a)
b)
Figure 4-11: Comparison of a) acquisition conditions in focused mode (ZP), unfocused mode (pinhole) and full-field mode; and of b) zoom on the pre-edge region highlighting radiation damage effects in XANES spectra obtained, on a Prussian blue pigment in the three acquisition modes. In focused mode, the first and last scans of 10 consecutive acquisitions are compared, showing the dramatic photo-reduction.
Setup Pinhole Zone Plate Full-Field
Acquisition Time 18min 10min 4h
Scan time 1min 1min 1h
Beam size(µm2) 200µm (diameter) 0.12µm(v.)0.97µm(h.) 950µm (v.) 400µm (h.)
Flux measured during acquisition
Flux (ph/s/µm2) 7.6 105 4.3 1010 3.6 105
7110 7160 7210 7260
No
rmal
ize
dab
sorp
tio
n (
a.u
.)
E (eV)
Focused Beam
(ZP)/1st scanFocused Beam (ZP)/10th scanUnfocused beam (Pinhole)Unfocused beam (Full Field)
0
0.2
0.4
0.6
0.8
1
1.2
1.4
1.6
7125 7130 7135 7140 7145 7150 7155
No
rmal
ized
abso
rpti
on
E (eV)
t10

Chapter 4 : Going to full 2D spectro-characterization of cultural heritage materials with full-field XANES
113
This micrometric resolution allows revealing XANES heterogeneities at the micron scale
(Figure 4-12a). Therefore, by coupling PCA with subsequent k-means clustering, two types of
XANES spectra were identified. A first cluster, number 2 in green, corresponds to the sample
area correlated to the pigment particles (Figure 4-12b). The sum of XANES spectra
presented in this cluster exhibits a more intense white line in comparison to the sum of the
XANES spectral features of the second cluster (Figure 4-12c), namely cluster 3, in red. This
second cluster represents mainly the area of small particles (Figure 4-12b) and whereas it
presents exactly the same edge and oscillations positions in energy, a clear difference in the
white line and first oscillations intensity is noted (Figure 4-12c).
The reason which may explain differences in the white line intensity is presently unclear. We
are considering two hypotheses, one based on different chemical composition in the sample
considered, and the second due to an experimental artifact linked to the acquisition
procedures. The second possible explanation relies on sample heterogeneity effects. Since
low concentrated area, correlated to smaller particle sizes, presents the spectra with lower
absorption at white line energy, possible “hole-effects” can be assumed (Koningsberger, et
al., 1988). In fact, if the particles are smaller than pixel size the resulting transmitted signal is
a mixture of beam absorbed by the particles and beam which is not absorbed by the
particles, this effect leads to a decrease of oscillation intensity as observed in this case. This
would highlight the presence of particles smaller than micrometric resolution.
In order to solve this problematic, further particle characterization and analyses with
defined granulometry, from nanometer to millimeter range, need to be performed.

Chapter 4 : Going to full 2D spectro-characterization of cultural heritage materials with full-field XANES
114
Figure 4-12: a) Transmittance image of Whatman paper impregnated with Prussian Blue pigment at 7.1 and 7.3keV, b) Result of the image segmentation based on PCA and k-means clustering of the data set recorded on the same sample, c) Average XANES of clusters 2 and 3.
In summary, this technique based on 2D XANES analysis could be used to study
radiation damage effects on heterogeneous and photosensitive ink samples. In addition to
the intrinsic structures of model sample, as identified above, heterogeneities artificially
created by applying visible light spots or solution droplets on model Prussian Blue will be
easily studied, whereas radiation damages on historical samples will be solved.
This set-up is also well suited to investigate oxidation and migration processes in ink-
corroded manuscripts. Different papers report the use of SXM to obtain spatially resolved
XANES spectral analysis at the Fe K-edge in iron-gall ink in ancient manuscripts (Kanngiesser,
et al., 2004, Wilke, et al., 2009). All studies mention the problem of radiation damage which
affects data acquisition and data interpretation. The full-field approach could shed a new
light on these fragile systems. Generally speaking, the application of low-dose spatially
resolved full-field approach will certainly open new roads for the study of photosensitive
samples.
Gervais et al., Appl, Phys A, 2013
@7.1keV
@7.3keV
100 µm
100 µm
100 µm
a) b)
c)

Chapter 4 : Going to full 2D spectro-characterization of cultural heritage materials with full-field XANES
115
4.8. Conclusions
As a conclusion, we suggest the use of full-field XANES as powerful tool spatially resolved for
the XANES spectroscopic studies of CH materials. It offers novel opportunities for their
study:
- based on XANES spectroscopy, the full-field set-up is applicable to a wide range of
materials without constraints regarding the organization level of material.
- it allows 2Dmapping at the micrometric scale with full XANES spectral information. A full
dataset is typically recorded on millimetric areas within ten minutes. This method is
consequently fully applicable to a large corpus of heterogeneous samples.
- based on a lens-less approach, the full-field set-up allows to easily manage the dose
deposition and the preservation of photosensitive historical samples.
- in comparison with the traditional unfocused approach, using pinholes, this method allows
the acquisition of reference spectra in transmission mode which can be specifically selected
to be unaffected by heterogeneity or thickness effects. Instead of acquiring XANES spectra
summed over a few hundred of microns, this system allows filtering out pixels suffering
from acquisition artefacts, selecting only the XANES spectra acquired in acceptable level of
transmission.
The full-field approach, as all other transmission approach, is however limited to samples
presenting element of interest in sufficiently high concentration with respect to a matrix
with relatively low absorption.
Though, a lot of successful results were obtained during this study when using full-field
approach. A few examples of relevant full-field acquisition on historical samples will be
presented in Chapter 5. Combined with other classical spectroscopy techniques, it provides
supplementary information that are essential for answering question about ancient artistic
processes and current degradation mechanisms of ancient materials.

Chapter 4 : Going to full 2D spectro-characterization of cultural heritage materials with full-field XANES
116
4.9.References
Andrews, J. C., Almeida, E., van der Meulen, M. C. H., Alwood, J. S., Lee, C., Liu, Y., Chen, J., Meirer, F., Feser, M., Gelb, J., Rudati, J., Tkachuk, A., Yun, W. & Pianetta, P. 2010. Microscopy and Microanalysis, 16(327.
Bertrand, L., Cotte, M., Stampanoni, M., Thoury, M., Marone, F. & Schöder, S. 2012. Development and trends in synchrotron studies of ancient and historical materials. Physics Reports, http://www.sciencedirect.com/science/article/pii/S0370157312000865 0).
Boesenberg, U., Meirer, F., Liu, Y., Shukla, A. K., Dell’Anna, R., Tyliszczak, T., Chen, G., Andrews, J. C., Richardson, T. J., Kostecki, R. & Cabana, J. 2013. Mesoscale Phase Distribution in Single Particles of LiFePO4 following Lithium Deintercalation. Chemistry of Materials, 25(9):1664-72.
De Andrade, V., Susini, J., Salome, M., Beraldin, O., Rigault, C., Heymes, T., Lewin, E. & Vidal, O. 2011. Submicrometer Hyperspectral X-ray Imaging of Heterogeneous Rocks and Geomaterials: Applications at the Fe K-Edge. Analytical Chemistry, 83(11):4220-27.
Fayard, B., Pouyet, E., Berruyer, G., Bugnazet, D., Cornu, C., Cotte, M., Andrade, V. D., Chiaro, F. D., Hignette, O., Kieffer, J., Martin, T., Papillon, E., Salomé, M. & Sole, V. A. 2013. The new ID21 XANES full-field end-station at ESRF. Journal of Physics: Conference Series, 425(19):192001.
Gervais, C., Languille, M.-A., Réguer, S., Gillet, M., Pelletier, S., Garnier, C., Vicenzi, E. P. & Bertrand, L. 2013. Why does Prussian blue fade? Understanding the role (s) of the substrate. Journal of Analytical Atomic Spectrometry, 28(10):1600-09.
Gervais, C., Languille, M.-A., Reguer, S., Gillet, M., Vicenzi, E. P., Chagnot, S., Baudelet, F. & Bertrand, L. 2013. “Live” Prussian blue fading by time-resolved X-ray absorption spectroscopy. Applied Physics A, 111(1):15-22.
Johnson, R. A. & Wichern, D. W. 2002. Applied multivariate statistical analysis. Prentice hall Upper Saddle River, NJ.
Jolliffe, I. 2005. Principal component analysis. Wiley Online Library.
Kanngiesser, B., Hahn, O., Wilke, M., Nekat, B., Malzer, W. & Erko, A. 2004. Investigation of oxidation and migration processes of inorganic compounds in ink-corroded manuscripts. Spectrochim. Acta B, 59(1511-16.
Koningsberger, D. & Prins, R. 1988. X-ray absorption: principles, applications, techniques of EXAFS, SEXAFS, and XANES.

Chapter 4 : Going to full 2D spectro-characterization of cultural heritage materials with full-field XANES
117
Lavédrine, B., Pesme, C., Gillet, M. & Garnier, C. 2005. Etude de possibilités d'exposition permanente des documents réputés fragiles: le cas des héliographies de Louis Ducos de Hauron. Support/Tracé, 5):38-44.
Liu, Y., Meirer, F., Williams, P. A., Wang, J., Andrews, J. C. & Pianetta, P. 2012. TXM-Wizard: a program for advanced data collection and evaluation in full-field transmission X-ray microscopy. Journal of Synchrotron Radiation, 19(2):281-87.
Lowe, D. G. 2004. Distinctive image features from scale-invariant keypoints. International journal of computer vision, 60(2):91-110.
Lowe, D. G. 'Object recognition from local scale-invariant features', in Computer vision, 1999. The proceedings of the seventh IEEE international conference on: Ieee, 1999), pp. 1150-57.
Mangold, S., Steininger, R., dos Santos Rolo, T. & Göttlicher, J. 'Full field spectroscopic imaging at the ANKA-XAS-and-SUL-X-Beamlines', in Journal of Physics: Conference Series: IOP Publishing, 2013), pp. 012130.
Mazel, V., Richardin, P., Debois, D., Touboul, D., Cotte, M., Brunelle, A., Walter, P. & Laprévote, O. 2007. Identification of ritual blood in African artifacts using TOF-SIMS and synchrotron radiation microspectroscopies. Analytical Chemistry, 79(9253-60.
Meirer, F., Cabana, J., Liu, Y., Mehta, A., Andrews, J. C. & Pianetta, P. 2011. Three-dimensional imaging of chemical phase transformations at the nanoscale with full-field transmission X-ray microscopy. Journal of Synchrotron Radiation, 18(5):773-81.
Michelin, A., Drouet, E., Foy, E., Dynes, J., Neff, D. & Dillmann, P. 2013. Investigation at the nanometre scale on the corrosion mechanisms of archaeological ferrous artefacts by STXM. Journal of Analytical Atomic Spectrometry, 28(1):59-66.
Monico, L. 2012. The Degradation Process of Lead Chromate Yellows in Paintings by Vincent Van Gogh.
Monico, L., Janssens, K. H., Miliani, C., Brunetti, B. G., Vagnini, M., Vanmeert, F., Falkenberg, G., Abakumov, A. M., Lu, Y., Tian, H., Verbeeck, J., Radepont, M., Cotte, M., Hendriks, E., Geldof, M., Van der Loeff, L., Salvant, J. & Menu, M. 2013. The Degradation Process of Lead Chromate in paintings by Vincent van Gogh studied by means of Spectromicroscopic methods. Part III: Synthesis, characterization and detection of different crystal forms of the chrome yellow pigment. Analytical Chemistry, 85(2):851-59.
Monico, L., Janssens, K. H., Miliani, C., Van der Snickt, G., Brunetti, B. G., Cestelli Guidi, M., Radepont, M. & Cotte, M. 2013. The Degradation Process of Lead Chromate in paintings by Vincent van Gogh studied by means of Spectromicroscopic methods. Part IV: Artificial ageing of model samples of co-precipitates of lead chromate and lead sulfate. Analytical Chemistry, 85(2): 860-67.

Chapter 4 : Going to full 2D spectro-characterization of cultural heritage materials with full-field XANES
118
Monico, L., Van der Snickt, G., Janssens, K., De Nolf, W., Miliani, C., Dik, J., Radepont, M., Hendriks, E., Geldof, M. & Cotte, M. 2011. Degradation Process of Lead Chromate in Paintings by Vincent van Gogh Studied by Means of Synchrotron X-ray Spectromicroscopy and Related Methods. 2. Original Paint Layer Samples. Analytical Chemistry, 83(4):1224-31.
Monico, L., Van der Snickt, G., Janssens, K., De Nolf, W., Miliani, C., Verbeeck, J., Tian, H., Tan, H., Dik, J., Radepont, M. & Cotte, M. 2011. Degradation Process of Lead Chromate in Paintings by Vincent van Gogh Studied by Means of Synchrotron X-ray Spectromicroscopy and Related Methods. 1. Artificially Aged Model Samples. Analytical Chemistry, 83(4):1214-23.
Paleo, P., Pouyet, E. & Kieffer, J. 2014. Image stack alignment in full-field X-ray absorption spectroscopy using SIFT_PyOCL. Journal of Synchrotron Radiation, 21(2):456-61.
Pascarelli, S., Mathon, O., Munoz, M., Mairs, T. & Susini, J. 2006. Energy-dispersive absorption spectroscopy for hard-X-ray micro-XAS applications. Journal of Synchrotron Radiation 13(351-58.
Rowe, S. 2004. The effect of insect fumigation by anoxia on textiles dyed with Prussian blue. Studies in conservation, 49(4):259-70.
Ryan, C. G., Siddons, D. P., Kirkham, R., Dunn, P. A., Kuczewski, A., Moorhead, G., Geronimo, G. D., Paterson, D. J., Jonge, M. D. d., Hough, R. M., Lintern, M. J., Howard, D. L., Kappen, P. & Cleverley, J. 2010. The New Maia Detector System: Methods For High Definition Trace Element Imaging Of Natural Material. AIP Conference Proceedings, 1221(1):9-17.
Samain, L., Silversmit, G., Sanyova, J., Vekemans, B., Salomon, H., Gilbert, B., Grandjean, F., Long, G. J., Hermann, R. P., Vincze, L. & Strivay, D. 2011. Fading of modern Prussian blue pigments in linseed oil medium. Journal of Analytical Atomic Spectrometry, 26(5):930-41.
Schroeder, S., Tsapatsaris, N. & Eastaughed, N. 'High-throughput and in situ X-ray absorption spectroscopy of pigment libraries', in 8th European Conference on Research for Protection, Conservation and Enhancement of Cultural Heritage: by J.Kolar, Ljubljana, 2008), pp. 50–51.
Sole, V. A., Papillon, E., Cotte, M., Walter, P. & Susini, J. 2007. A multiplatform code for the analysis of energy-dispersive X-ray fluorescence spectra. Spectrochimica Acta - Part B Atomic Spectroscopy, 62(1):63-68.
Wilke, M., Hahn, O., Woodland, A. B. & Rickers, K. 2009. The oxidation state of iron determined by Fe K-edge XANES-application to iron gall ink in historical manuscripts. Journal of Analytical Atomic Spectrometry, 24(10):1364-72.
Yu, G. & Morel, J.-M. 2011. ASIFT: an algorithm for fully affine invariant comparison. Image Processing On Line, 2011.

119
CHAPTER 5 : APPLICATIONS TO PAINTINGS AND OTHER ARTISTIC MATERIALS
5.1. Introduction ............................................................................................................................. 120
5.2. Gilding technique in Asian artifacts ......................................................................................... 121
5.2.1. Unburnished gilding of Shuilu’ an temple, a secrete mordant layer ................................ 122
5.2.2. Gilding technology of the Qing Dinasty painters in civil buildings: the mural paintings in
the Five Northern Provinces’ Assembly Hall (Ziyang, China) ...................................................... 129
5.3. Degradation of cadmium yellow pigment in Henri Matisse’ paintings ................................... 133
5.3.1. Introduction ...................................................................................................................... 134
5.3.2. Paintings and samples location ......................................................................................... 137
5.3.3. Analytical methods and data processing .......................................................................... 138
5.3.4. Sample preparation and mounting ................................................................................... 142
5.3.5. The Joy of Life (1905-1906): study of the degradation process ........................................ 143
5.3.5.1. S5 sample: faded yellow field beneath the central reclining figures ......................... 143
5.3.5.2. S111 sample: darkened yellow foliage ...................................................................... 147
5.3.6. Flowers in a Pitcher: degradation and synthesis processes study .................................... 150
5.3.6.1. Darkened BF205 sample ............................................................................................ 150
5.3.6.2. Undarkened BF205 sample ........................................................................................ 152
5.3.7. Conclusion ......................................................................................................................... 155
5.4. Application to other artistic materials ..................................................................................... 157
5.4.1. Acrylonitrile-butadiene-styrene polymer photo-aging in design objects ......................... 157
5.4.2. Estimating Firing Conditions for Roman Ceramics ............................................................ 159
5.5. References ............................................................................................................................... 164
Abstract
Applications of the different methodological developments implemented during this thesis
are illustrated in the present chapter through complementary examples. The complexity of
sample preparation, and the advantages of the ARE protocol are exemplified through the
study of fragments from a gilded Chinese sculpture and a mural painting fragments. Sections
were analysed combining µFTIR and µXRF and revealed atypical gilding stratigraphy. The
second example focused on combined 2D chemical analysis (FTIR, XRD, XRF and XANES) of
cadmium yellow pigment from two Matisse’s paintings, with a two-fold objective: obtaining
information about the synthesis of this pigment, and about its photo-degradation. Finally,

Chapter 5 : Applications to paintings and other artistic materials
120
beyond the field of paintings, this new methodological development was used in order to
study other artistic materials. Two examples are presented: the µFTIR study of photo-
degradation of polymer in Italian design objects from the 50’s, and the assessment of firing
conditions of Roman ceramics.
5.1.Introduction
The previous chapters allow building methodological strategy (in terms of acquisition
modes, sample thicknesses, preparations and mounting choices) to optimize the study of
painting fragments using combined SR-based micro-analytical techniques. Based on this
preliminary work, applications are now presented on historical materials.
The first set of examples is centred on micro-fragments from gilding material coming
from two architectural Chinese sites. This work necessitated a specific effort concerning
sample preparation to allow a clear identification of the organic materials used during the
gilding process. As detailed below, determining the organic composition of the different
gilding layers was necessary to unravel ancient gilding practices and to correlate this
information with state-of-the-art painting from the same period. Moreover, even if most of
the conclusions derived from molecular analyses, combined μXRF study of the same sample
allowed confirming inorganic species identification, improving and diversifying chemical
information on the samples.
The second set of samples is based on cadmium yellow painting micro-fragments
from two Matisse’s paintings. The complex composition of the cadmium yellow samples
(combination of nanocrystalline phases, degraded/undegraded inorganic and organic
materials organized as micrometric layers; variety and complexity of the initial pigment)
drastically complicated its characterization and its localisation. In this context particular
efforts were dedicated to define an improved combination of techniques on similar
sections. Coupling different chemical signatures, sensitivity, and spatial resolution, via
combined μFTIR, μXRF, μXRD, and full-field XANES, the characterization of the possible
remaining of starting reagent, and of the degradation mechanisms undergoing was allowed.

Chapter 5 : Applications to paintings and other artistic materials
121
Finally beyond the field of paintings, two further examples are presented in the last part of
this chapter. The first one deals with a set of fragments from polymeric design objects
suffering from discoloration and modification of physical properties. Dedicated effort during
sample preparation allowed for the first time, an accurate mapping and identification of
degradation processes taking place into the polymeric material using μFTIR spectroscopy.
The second one deals with a set of black gloss roman ceramics. State-of-the-art material
characterization, with a particular eye to chemical, mineralogical and porosity studies at
multiple spatial hierarchies (rom tens of nanometer to hundreds of microns), allowed the
rediscovering of firing protocols used during the manufacturing of Roman ceramics. This
work reveals a significant analytical advancement for full-field XAS method in studying
multilayered and heterogeneous materials.
5.2. Gilding technique in Asian artifacts
Pouyet, E., Lluveras-Tenorio, A., Nevin, A., Saviello, D., Sette, F., & Cotte, M. (2014).
Preparation of thin-sections of painting fragments: Classical and innovative
strategies. Analytica chimica acta, 822, 51-59.
Lluveras-Tenorio, A., Bonaduce, I., Sabatini, F., Degano, I., Blaensdorf, C., Pouyet, E.,
Cotte M., Colombini, M.P. (2015). The organic materials in the five northern
provinces’ assembly hall mural paintings (Ziyang, China): disclosing the
technologies of the qing dynasty painters in civil buildings. Applied Physics A,
submitted.
Asian culture has an old artistic tradition with silk paintings, ceramics and lacquer objects.
Whereas extensively studied all around the world, polychrome artworks (such as grottoes
paintings, temple decorations and polychrome clay figurines), are in comparison less
considered. Moreover treatises describing the technique and materials of traditional
Chapter 5 : Applications to paintings and other artistic materials
122
Chinese wall paintings are a few, dated from the 20th century, and summarize traditional
knowledge of many centuries without giving detailed information on the technique.
Since the 1990s a wide number of studies were published about pigments and distribution
of inorganic materials in Asian wall paintings, while fewer studies have been carried out on
organic binders. Animal glue and fruit gum have been identified as the most used
proteinaceous and saccharide binder respectively, while lipid materials, except for tung oil,
were nearly absent. Moreover additional materials, unknown to European tradition, have
been found in some artworks analyzed and thus identified as local materials. Therefore,
further studies have to be carried out in order to improve the database of raw reference
materials still uncharacterized, and develop new analytical techniques applicable on Asian
artworks, in particular concerning gilding techniques.
5.2.1. Unburnished gilding of Shuilu’ an temple, a secrete mordant layer
In the Shuilu’an temple near Lantian (Shaanxi Province, China) dating from the Ming dynasty
(1563-1568), there are more than 1372 clay sculptures ranging from several centimetres to
5 metres (Figure 5-1a). An architecture found in the first niche of the west wall shows
unburnished gilding with metal foil on the surface. A fragment was sampled in this area, and
was then provided to us by A. Lluveras from the University of Pisa (Italy), in order to identify
and localise organic materials used during gilding process. Indeed, the deposit of a very thin
metallic layer on a painting usually requires the use of an intermediate soft and adhesive
layer. Two main techniques are reported. The first one, water gilding, consists in applying a
first layer containing gypsum or calcium carbonate with glue, on which is added a bolus
layer (usually red earth mixed with glue) covered with some water (with glue) in order to
improve the adhesion of the gold leaf. The mordant technique, however, consists of
applying an adhesive containing drying oils (such as linseed oil) and terpenoid resins. Some
pigments (usually lead ones) may be added to help the drying process of the adhesive and
to enhance the shiny aspect of the gilding.
Whereas gilding technique rediscovering was the first goal of this study, degradation
phenomena were also observed on the surface of the gilding (resulting in a whitish covering
layer hiding the primary shiny effect of the gilding) and further characterized (Figure 5-1b).

Chapter 5 : Applications to paintings and other artistic materials
123
a)
b)
Figure 5-1: a)Optical picture of the clay statues at Shuilu'an Temple in Lantian County of Xi'an City, b)Detail of Buda’s leg (the third on the left) showing clear degradation phenomenon at the surface of the gilding.
The analysis of a sample thin-section by μFTIR technique in transmission mode was
identified as the best protocol to answer questions about sample molecular composition
and degradation phenomenon. The sample itself was millimetric and allows applying
different sample preparation protocols. In particular, the possibilities offered by the new
ARE protocol (see section 3.5.3) were compared with those offered by classical preparation
(resin embedding) and SES protocol (see section 3.5.2). The results allow choosing the more
appropriate approach.
Three pieces of the same fragment (named SL02) of about ~0.511 mm³ each were
prepared following three different protocols:
- with the SES approach (see section 3.5.2), a section of 10 µm was obtained (Figure
5-2a). It was impossible to achieve a thinner section, and unfortunately, this
thickness was too high for acceptable µFTIR transmission measurements.
Accordingly, after a first µFTIR analysis, this section was spread over diamond cells
and pressed until achieving FTIR maximum transmittance (Figure 5-2b).
- with the classical resin embedding followed by microtoming, a section of 3 µm was
obtained (Figure 5-2c). This thickness was appropriate for µFTIR in transmission.
- with the new ARE approach (see section 3.5.3), it was possible to reach a thickness
of 3 µm, thanks to the consolidating action of the AgCl salt and surrounding resin
(Figure 5-2d).
From the optical observation (Figure 5-2a-d) the sample is composed of five layers: a white
priming layer (layer V), a red/pink layer (layer IV), a mordant layer (layer III), a metallic foil

Chapter 5 : Applications to paintings and other artistic materials
124
(layer II) and a superficial layer, not systematically observed, probably resulting from
previous restoration treatment (layer I). The set of layers II-III-IV is characteristic of the so-
called mordant technique. The stratigraphy is well preserved on Figure 5-2a, c and d, but
partially destroyed on b.
Figure 5-2: SR µFTIR study of a fragment from Ming dynasty painting sculpture at Shuilu’an temple, China. Visible light microscope images of fragment SL02 prepared following different protocols: a) sliced without embedding media (SES approach, 10 µm), b) section a) spread over the diamond cell, c) sliced after embedding in a resin media (3 µm), d) sliced after embedding in a resin/ AgCl barrier coating (ARE approach, 3 µm), e) Scheme representing the main layers of the gilded sample and f) SR-µFTIR spectra of the section d) corresponding to layers III, IV and V.
The µFTIR analysis carried out on the different samples with a beam size of 66 µm2
allowed the identification of some major components, from bulk to surface (Figure 5-3f): the
white priming layer (layer V) is composed phyllosilicates, with mica type muscovite (3624,
1029 cm-1), and montmorillonite (3627, 1050 cm-1), and of organic material in low
quantities. Characteristic C=O ester and CH fatty chain bands could indicate the presence of
a lipidic material, possible result of the penetration of the oil identified in the above layers.
In layer IV a higher concentration of this oily binder as well as silicate-based compounds
have been identified together with muscovite. This red layer prepared the application of a
large mordant layer (layer III) composed of oil (1740-1710 cm-1) and lead white (1410 cm-1),
more precisely cerusite. Hydrocerusite (PbCO3/2PbCO3·Pb(OH)2) which presents an OH
a) b) c) d) e)
f)
I
II
III
IV
V
Layer III
0.2
0.3
0.4
0.5
0.6
0.7
Ab
s
Layer IV
0.0
0.2
0.4
0.6
0.8
1.0
Ab
s
Layer V
0.0
0.2
0.4
0.6
0.8
1.0
Ab
s
500 1000 1500 2000 2500 3000 3500 4000
Wavenumbers (cm-1)
Ox
CaCe
Ox
Mu
OxOx
CeMu
Mu
Mt
Mu
40 μm
• Oily binder
Ca: Lead carboxylate
Ce : Cerusite
Ox: Calcium oxalate
Mu: Muscovite
Mt: Montmorillonite
Chapter 5 : Applications to paintings and other artistic materials
125
characteristic band at 3450 cm-1 was not detected. In addition, the peak at 1550 cm-1 is
ascribed to the presence of carboxylates, possibly lead carboxylates (Zeng, et al., 1999),
which could indicate that the oil was pre-saponified with a lead based siccative (Cotte, et al.,
2006). Layer II does not show any absorption bands in the mid-IR domain. Finally, layer I was
barely detected, and contains mostly clays such as kaolinite and montmorillonite, gypsum as
well as oxalates in high proportion. Calcium oxalate, more precisely of the weddellite type,
was identified in all the different layers (1314 cm-1), with an enrichment in the upper layer.
To evaluate the respective pros and cons of the three preparation methods cited
above, µFTIR spectra from layer III are compared in Figure 5-3d. Besides, chemical maps of
muscovite, esters and acids (CO) signals are plotted in Figure 5-3a for the ARE protocol, in
Figure 5-3b for the classical embedding in a resin medium and in Figure 5-3c for the SES
protocol subsequently spread over diamond cells. The comparison of the different sample
preparations highlights several issues, in particular over-absorption and contamination.
For the paint fragments studied, the ideal thickness is found to be ~ 3 µm, however this
value highly depends on the sample composition and density. Even after compression with
diamond cells, the SES pre-sliced fragment (initially 10 µm) was still too thick; the low
transmitted signal distorted dramatically the absorption bands of the resulting spectra
(point 5).
With the ARE procedure, it was possible to obtain the proper thickness of 3 µm and
unique information was obtained, in particular regarding the fine structure of the mordant
layer (layer III). Both esters and acids were found, however, not co-localized since esters are
more concentrated in the upper part of the layer (Point 1 and 2 in Figure 5-3d and Figure
5-3a).
The observation of this micrometric complex sub-structure was not achievable with
the other preparation protocols. The compression procedure led to a clear spatial mixture of
components as illustrated in Figure 5-3c, where esters and acids cannot be separated. In the
standard embedding method, the resin (point 3 in Figure 5-3d) has penetrated over a few
microns and clearly interferes with the C-H and C=O bands of the sample (point 4) making
the identification of the organic materials far less easy and reliable. With ARE, AgCl does
prevent any diffusion of the embedding resin inside the sample as seen in Figure 5-3a (in
which no resin signal is detected around the section).

Chapter 5 : Applications to paintings and other artistic materials
126
Figure 5-3: SR µFTIR study of a fragment from Ming dynasty painting sculpture at Shuilu’an temple, China. Chemical maps of esters (green), acids (red) and OH from muscovite (blue) in the samples: a) sliced after embedding in a resin/ AgCl barrier coating (3 µm), b) sliced after classical embedding in a resin media (3 µm), c) section sliced without embedding (SES, 10 µm) and spread over diamond cells d) SR µFTIR spectra from the organic mordant (Layer II) and the embedding on the 5 points indicated in a), b) and c).
This example demonstrates the advantages of ARE protocol for µFTIR analyses: it
strengthens the sample allowing microtome sections at extreme thinness combined with
the complete conservation of the stratigraphic structure, and surface layers, and assuring
analytical neutrality as well. Even if the presented sample preparation (ARE, 3 µm) was
optimized for µFTIR and for the identification of organic components, similar questions
regarding analytical neutrality should be assessed for X-ray micro-analyses (µXRF, µXAS,
µXRD). Consequently, analyses were performed on the same ARE thin-section using µXRF at
7.2 keV. The goal was to obtain complementary elemental information in order to ease and
guide the interpretation of FTIR results and at the same time to test the compatibility of the
ARE protocol with µXRF (Figure 5-4).
Figure 5-4 shows the XRF maps of Ag and Cl. A profile is presented as well for better
readability. Ag and Cl were mostly detected around the sample, but presence of low
quantity of both elements in the entire sample reveals smearing of the barrier coating. They
were not of particular interest in the present study; accordingly, their presence was not
critical here. The choice of the barrier composition strongly depends on the elements of
interest within the sample, accordingly ARE protocol is clearly not suitable for the analysis of
a)
c)
Esters (1770-1720 cm-1)
Fatty acids (1720-1693 cm -1)OH in muscovite (3654-3600 cm-1)
b) d)
resin II
III
IV
V
3
4 51
2
c) Point 1
20
40
60
%T
Point 2
20
40
%T
50
%T
10
20
%T
20
40%
T
500 1000 1500 2000 2500 3000 3500 4000
Wavenumbers (cm-1)
Point 3
Point 4
Point 520µm
Point 1
1550 1650 1750 1850
Point 2
0
Wavenumbers (cm-1)
1734 1710
ν(C=O)
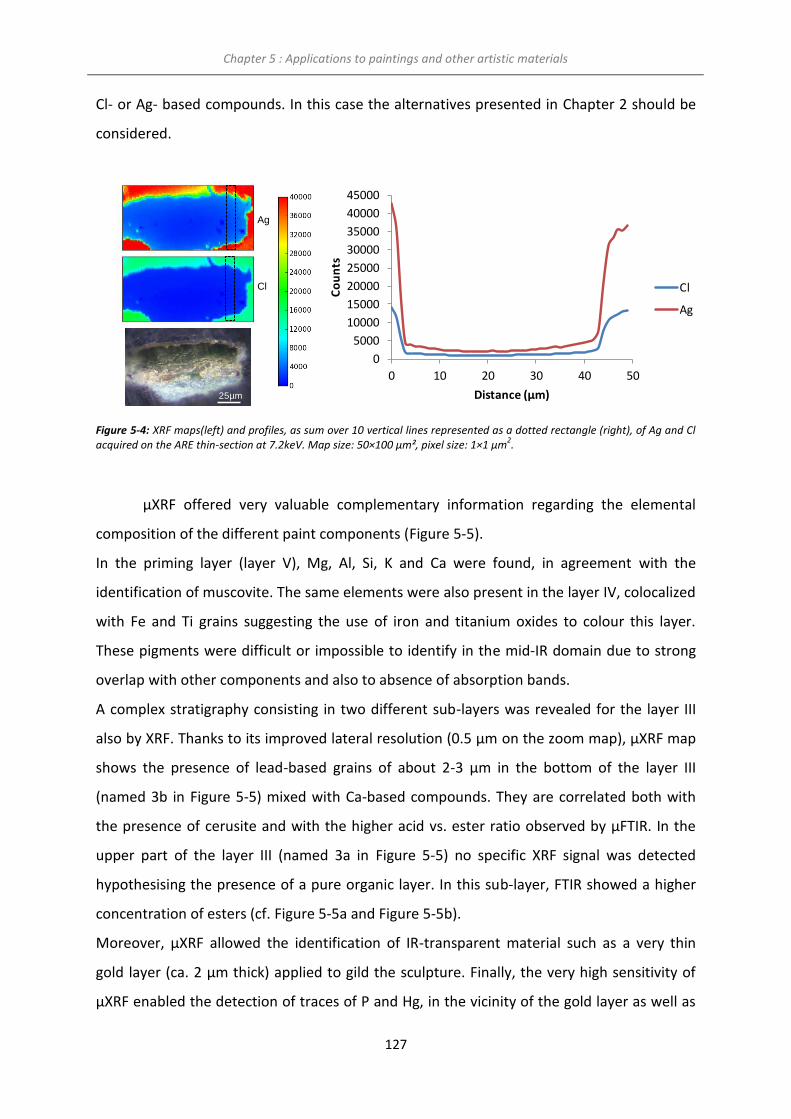
Chapter 5 : Applications to paintings and other artistic materials
127
Cl- or Ag- based compounds. In this case the alternatives presented in Chapter 2 should be
considered.
Figure 5-4: XRF maps(left) and profiles, as sum over 10 vertical lines represented as a dotted rectangle (right), of Ag and Cl acquired on the ARE thin-section at 7.2keV. Map size: 50×100 µm², pixel size: 1×1 µm
2.
µXRF offered very valuable complementary information regarding the elemental
composition of the different paint components (Figure 5-5).
In the priming layer (layer V), Mg, Al, Si, K and Ca were found, in agreement with the
identification of muscovite. The same elements were also present in the layer IV, colocalized
with Fe and Ti grains suggesting the use of iron and titanium oxides to colour this layer.
These pigments were difficult or impossible to identify in the mid-IR domain due to strong
overlap with other components and also to absence of absorption bands.
A complex stratigraphy consisting in two different sub-layers was revealed for the layer III
also by XRF. Thanks to its improved lateral resolution (0.5 µm on the zoom map), µXRF map
shows the presence of lead-based grains of about 2-3 µm in the bottom of the layer III
(named 3b in Figure 5-5) mixed with Ca-based compounds. They are correlated both with
the presence of cerusite and with the higher acid vs. ester ratio observed by µFTIR. In the
upper part of the layer III (named 3a in Figure 5-5) no specific XRF signal was detected
hypothesising the presence of a pure organic layer. In this sub-layer, FTIR showed a higher
concentration of esters (cf. Figure 5-5a and Figure 5-5b).
Moreover, µXRF allowed the identification of IR-transparent material such as a very thin
gold layer (ca. 2 µm thick) applied to gild the sculpture. Finally, the very high sensitivity of
µXRF enabled the detection of traces of P and Hg, in the vicinity of the gold layer as well as
Ag
Cl
25µm
0
5000
10000
15000
20000
25000
30000
35000
40000
45000
0 10 20 30 40 50
Co
un
ts
Distance (µm)
Cl
Ag

Chapter 5 : Applications to paintings and other artistic materials
128
Ca and K compounds present on the surface of the painting as degraded compounds or
exogenous pollutions.
Figure 5-5: Combination of SR µFTIR and µXRF for the study of a fragment from Ming dynasty painting sculpture at Shuilu’an temple, China. a) Visible light microscope images of fragment SL02 prepared following the ARE protocol; b) FTIR mapping of esters (1770-1720 cm
-1), acids (1720-1693 cm
-1), O-H from muscovite (3654-3600 cm
-1) and PbCO3 (1427-1400
cm-1
) in the sample, step size of 6×6 µm2; c) XRF maps at 7.2keV of Ag, Cl, P, Pb, Ca, Fe, K and Au acquired for the entire
sample with 1×1 µm2 pixel size and 0.5×0.5 µm
2 in the zoomed region.
Based on the combined results obtained from µFTIR and µXRF, hypotheses can be
further formulated regarding the gilding technique of the Asian painters. The fact that lead
is detected only in the lower part of layer III (IIIb) supports the evidence of a bi-layer
application. The deeper priming layer consists in oil mixed with lead compounds (cerusite
and carboxylates). Similar compositions made of lead white and partially saponified oil was
reported in mural Asian paintings (Cotte, et al., 2008). The lead carboxylates could result
from a long ageing reaction of oil with the lead pigment, but an intentional and fast
saponification should be considered as well. Indeed, curing oil with a siccative or drier, e.g.
lead oxide, as described in recipes of lead plasters, turns the liquid oil into a soft white paste
with unique mechanical properties, particularly optimal for priming (Cotte, et al., 2006).
Conversely, the upper sub-layer (IIIa) contains only organic materials, with variable
proportions of esters vs. acids, in particular a higher concentration of esters just below the
gold foil. This could be related to the application of a raw oil size, before the deposit of the
final gold layer.
IIIIIa
IV
V
IIIb
Muscovite
AcidsEsters
CerusiteEsters
c)
b)
Muscovite
K Au
Pb
a)
25µm
Ag P
Cl
Ca Fe
Pb
II
IIIa
V
IV
IIIb

Chapter 5 : Applications to paintings and other artistic materials
129
These results show some similarities with those reported by Katsibiri and Boon, on gilding
paintings from two post-Byzantine wall paintings (Katsibiri, et al., 2004). In their cases, the
stratigraphy of the paintings presented a red paint layer, then a thin white layer, containing
lead, and a third thicker golden-brown mordant layer below the final gold layer. The layers
were thick enough to allow specific subsampling of each of them, and could be selectively
analysed with direct temperature resolved mass spectrometry. The analysis of the mordant
layer shows the presence of both esters and acids, with a relative low degree of oxidation
(as determined by the concentration of azelaic acid). In our case, Gas Chromatography-Mass
Spectrometry (GC/MS) confirms the presence of a drying oil, together with a low content of
animal glue and another proteinaceous material. Layer III was too thin to be specifically
subsampled for GC/MS analyses, layers III (gold size) and IV (priming) were analyzed
together.
Thanks to an optimized sample preparation, the results obtained by the imaging
techniques allowed us to reveal some fundamental details on the painting technique used
by the Asian painters.
5.2.2. Gilding technology of the Qing Dinasty painters in civil buildings: the mural
paintings in the Five Northern Provinces’ Assembly Hall (Ziyang, China)
The development of the literati paintings in the Qing dynasty (AD 1636-1912) results in a
decline of the murals quality, as murals were then designed and drawn by the organization
of folk painters without unified standard and management. The technique was known to be
simplified in general. However, previous investigation indicated that mural paintings from
this period found in the Five Northern Provinces’ Assembly Hall are of high quality, and that
the techniques followed the traditional standard way (Hu, et al., 2013). It was of interest to
determine if the gilding technique evolved similarly, using the previous example as a
reference of quality gilding.
In the south of the Chinese province of Shaanxi located in Wafangdian, near Ziyang,
the Beiwusheng huiguan (“Meeting hall of the Five Northern Dynasties”) is a complex built
during the Qing dynasty. This building was richly decorated in AD 1848 by wall paintings

Chapter 5 : Applications to paintings and other artistic materials
130
including two scenes of the “Romance of the Three Kingdoms” (Figure 5-6a). The paintings
are a rare example of preserved wall paintings of high artistic value in civil buildings in the
Shaanxi Province.
A total of 13 samples from the 4 walls were studied by A. Lluveras to obtain information
about the painting technique. The chemical characterization of the paint binders was
performed through a multi analytical laboratory approach consisting of the combined use of
chromatographic-mass spectrometric techniques, GC/MS and Py/GC/MS, and high pressure
liquid chromatography with a diode array detector (HPLC-DAD).
Among this set of samples, two of them taken from two gilded weapons, were studied to
determine the gilding technique employed. Samples stratigraphy showed a gold leaf
followed by an adhesive layer and a white preparation layer (Figure 5-6b).
One of them (SD 2), was further studied by combined imaging techniques, μFTIR and μXRF
in order to locate the different ingredients entering in its composition and to reconstruct
the different steps involved in the gilding technique used. In order to easily combine organic
and elemental information the same thin-section was used for the analyses by XRF and FTIR.
ARE sample preparation strategy (see section 3.5.3) was used to obtain high quality sample
stratigraphy. The sample was prepared as a 5μm thin-section.
Figure 5-6: a) Optical pictures of the two scenes of the ‘Romance of the Three Kingdoms’, from the Beiwusheng huiguan (“Meeting hall of the Five Northern Dynasties”, AD 1636-1912). b) Optical images of sample 2 unprepared (top) and prepared as section. Pictures provided by C. Blaensdorf from the Technische Universität München (TUM, Germany).
Samples stratigraphies showed a gold leaf (layer I) followed by a pinkish adhesive layer
(layer II) and a white priming layer (layer III). A scheme of the sample build-up together with
a)b) 200μm
200μm

Chapter 5 : Applications to paintings and other artistic materials
131
elemental maps obtained by XRF are shown in Figure 5-7. Chemical maps obtained by FTIR
as well as some spectra representative of the features identified are presented in Figure 5-8.
Figure 5-7: SR XRF maps at 7.2 keV Ti, Ag, Ca, Au, Cl, Al, Fe, K, Pb, P, Si and S acquired for the entire sample with 1×1 μm2
pixel size.
a)
b)
Figure 5-8: SR FTIR study of the gilding sample SD 2. a) Chemical maps of synthetic resin (C-O, 1255-1316 cm-1
), amides I/II (1496-1680 cm
-1), hydrocerussite (OH st, 3560-3479 cm
-1), kaolinite (3714-3606 cm
-1), gypsum (OH st, 3365-3450 cm
-1); b)
SR μFTIR spectra from the adhesive layer (Layer II) and the priming layer (layer III).
XRF results highlighted the compositional difference between the adhesive layer (layer II),
characterized by the presence of Mn, Fe, Pb, Ca and P, and the priming layer (layer III),
containing Si, Al, K, Ca and Ti. The detection of Si, Al and K in the priming layer is in
agreement with the presence of a clay identified as kaolinite thanks to the octahedral
coordination external O-H absorption peaks (3697, 3669 and 3654 cm-1) in the FTIR spectra
(Figure 5-8b, layer III).
LayerI Au, SLayer II
Fe, Mn, Pb, Ca
Layer IIITi, Al, Si, K, Ca
Ti Ag
Cl
Ca Au
Fe K
Pb P Si S
Al
50µm
min
max
Layer II (gypsum area)
0,5
1,0
1,5
Abs
Layer III
0,5
1,0
1,5
Abs
1000 1500 2000 2500 3000 3500
Wavenumber (cm-1)

Chapter 5 : Applications to paintings and other artistic materials
132
The presence of Fe and Mn in the adhesive layer may point to the use of iron based
pigments (Fe2O3 or FeOOH) and MnO2, in agreement with the use of a natural earth named
umber as red-orange pigments added to the organic adhesive of the gold foil. In previous
work on murals in the Temples under Chieftain Lu in Liancheng, Gansu Province, a layer of
binding media within red iron oxide was found under the gold leaf (Lei, et al., 2012). In
literature, iron based pigment, red lead or other red pigments were commonly added into
the gilding adhesive aiming to enhance the color of gold.
Pb was also identified into the adhesive layer. The presence of the OH absorption band
around 3538 cm-1 (Figure 5-8b, layer II) combined with strong absorption of COO-
asymmetric stretching vibration around 1400 cm-1 supports the identification of
hydrocerusite (Pb3(CO3)2(OH)2). Previous studies on the murals of the Five Northern
Provinces’ Assembly Hall showed that lead white was used either as the major constituent
or mixed with other colored pigments to produce different hues(Hu, et al., 2013).
The presence of the characteristic OH stretching bands at 3544 and 3404cm-1, as well as the
OH bending band at 1620cm-1, is in agreement with the presence of gypsum (CaSO4·2H2O)
locally present in the adhesive layer.
FTIR results showed also the presence of a proteinaceous material (characterized by the
presence of amide I and II bands at 1650 and 1550 cm-1, respectively in Figure 5-8b, layer II)
in the layers underneath the gold leaf. The presence of P in layer II from the XRF maps
would be related to the use of animal glue in the adhesive. This identification confirms its
use as an adhesive for the gold leaf as suggested by the GC/MS results. The absence of an
ester carbonyl stretching band in this region is in agreement with the absence of a lipid
material observed by GC/MS. The presence of oxalates, known to be a degradation product
of the organic materials used as binders in paintings (Lluveras, et al., 2008, Salvadó, et al.,
2009) was not clearly confirmed by FTIR in the adhesive layer, due to the overlaps between
the characteristic absorption bands of gypsum and those characteristics of oxalates (COO-
asymmetric and symmetric stretching bands at 1643 and 1322 cm−1, respectively).
Finally, traces of carbonyl absorption around 1700 cm-1 with an additional absorption band
in 1280 cm-1 suggests the presence of a synthetic resin as PVAC on top of the gold leaf,
pointing to a restoration material.

Chapter 5 : Applications to paintings and other artistic materials
133
The use of micro-imaging techniques allowed establishing the distribution of materials
in the gilding sample and therefore the study of the gilding technique used in the 19th
century in China. Sample preparation allowed to work in transmission and to determine the
distribution of binders and pigments in the same area. Results showed the use of a thick
adhesive layer made with proteinaceous materials admixed with iron and manganese based
pigments as preparation for the gold foil. The gilding technique, therefore, is different with
respect to other Chinese gildings studied in the literature such us the Shuilu’an temple (15th
century, Xi’an, China) in which a partially saponified siccative oil admixed with lead white
has been applied as a large mordant on top of a red iron based paint layer. Further analyses
of gilding painting from the same region and the same periods are undergoing in order to
extend the first conclusions obtained on both sites to a larger corpus.
5.3.Degradation of cadmium yellow pigment in Henri Matisse’ paintings
Pouyet, E., Cotte, M., Fayard, B., Salomé, M., Meirer, F., Mehta, A., Uffelman, E.S.,
Hull, A., Vanmeert, F., Kieffer, J., Burghammer, M., Janssens, K., Sette, F., and Mass,
J. (2015). 2D X-ray and FTIR micro-analysis of the degradation of cadmium
yellow pigment in paintings of Henri Matisse. Applied Physics A, 1-14.
The chemical and physical alteration of cadmium yellow (CdS) paints in Henri Matisse’s The
Joy of Life (1905-1906, The Barnes Foundation) has been recognized since 2006, when a
survey by portable X-ray fluorescence identified this pigment in all altered regions of the
monumental painting. This alteration is visible as fading, discoloration, chalking, flaking, and
spalling of several regions of light to medium yellow paint. Since that time, synchrotron
radiation (SR)-based techniques including elemental and spectroscopic imaging, as well as X-
ray scattering have been employed to locate and identify the alteration products observed
in this and related works by Henri Matisse. This information is necessary to formulate one or
multiple mechanisms for degradation of Matisse’s paints from this period, and thus ensure
proper environmental conditions for the storage and the display of his works. This work
focuses on 2D full-field XANES imaging, 2D micro XRD, XRF and FTIR imaging of the altered

Chapter 5 : Applications to paintings and other artistic materials
134
paint layers to address one of the long-standing questions about cadmium yellow alteration
– the roles of cadmium carbonates and cadmium sulphates found in the altered paint layers.
These compounds have often been assumed to be photo-oxidation products, but could also
be residual starting reagents from an indirect wet process synthesis of CdS. The data
presented here allow identifying and mapping the location of cadmium carbonates,
cadmium chlorides, cadmium oxalates, cadmium sulphates, and cadmium sulphides in thin-
sections of altered cadmium yellow paints from The Joy of Life and Matisse’s Flower Piece
(1906, The Barnes Foundation). Distribution of various cadmium compounds confirms that
cadmium carbonates and sulphates are photo-degradation products in The Joy of Life,
whereas in Flower Piece, cadmium carbonates appear to have been a ((partially) unreacted)
starting reagent for the yellow paint, a role previously suggested in other altered yellow
paints.
5.3.1. Introduction
With the rapid rise of chemical industry during the end of the 19th century and the
beginning of the 20th century, numerous new inorganic and organic pigments were
developed and introduced as alternatives to well-established traditional pigments, often
outclassing them thanks to their colour intensity, purity, cost, and covering power.
However, in Impressionist and early Modernist paintings, various synthetic inorganic
pigments have started to undergo chemical and physical degradation phenomena ranging
from fading and color shifts to spalling and flaking. Several examples of the discoloration of
synthetic yellow pigments from the turn of the 20th century (e.g. zinc yellow
(K2O·4ZnCrO4·3H2O) (Zanella, et al., 2011), chrome yellow (PbCrO4) (Monico, et al., 2012,
Monico, et al., 2013, Monico, et al., 2014, Monico, et al., 2011, Monico, et al., 2011), and
cadmium yellow (CdS) (Van der Snickt, et al., 2009, Van der Snickt, et al., 2012)) have been
recently reported.
In particular, despite having a good reputation regarding permanency, physical
manifestations of photo-oxidative degradation of yellow cadmium sulphide (CdS) pigments
have been observed over the past decade in works by Pablo Picasso, Vincent Van Gogh,
Georges Seurat, Henri Matisse, Ferdinand Leger, Edvard Munch, and James Ensor (Leone, et
al., 2005, Plahter, et al., 2011, Van der Snickt, et al., 2009, Van der Snickt, et al., 2012). This
degradation appears in many different ways; from paint chalking, i.e. drying and crumbling,

Chapter 5 : Applications to paintings and other artistic materials
135
to fading, flaking, spalling, and in its most advanced cases to the formation of a thick (20 to
50µm) ivory to tan alteration crust covering the original yellow paint.
The first systematic study of CdS pigment degradation was performed in 2005 by
Leone et al. on 12 paintings dating from 1887–1923 (Leone, et al., 2005). In this study, based
on XRD and Scanning Electron Microscopy combined with an Energy Dispersive
Spectrometry (SEM-EDS), the presence of different oxidized Cd species, including cadmium
carbonate (CdCO3), cadmium hydroxide (Cd(OH)2), and cadmium sulphate (CdSO4) was
observed at the surface of paintings; these materials were believed to be the main products
of the degradation process. Combining these observations with the results from artificially
degraded mock-ups and supplementary Time of Flight-Secondary Ion Mass Spectrometry
(ToF-SIMS) analyses of the surface of the painting samples, a preliminary degradation
mechanism was suggested. The photo-oxidation of the CdS pigment was proposed to
generate CdO, CdSO4, and SO2 gas, which in high relative humidity environments, convert to
H2SO4 resulting in acid hydrolysis of the paint binding medium.
In 2009 and 2012, Van der Snickt et al. extended the study of CdS pigment degradation to
painting by James Ensor and Vincent van Gogh by using synchrotron radiation (SR)-based
techniques (Van der Snickt, et al., 2009, Van der Snickt, et al., 2012). In the case of Still Life
with Cabbage of James Ensor (Van der Snickt, et al., 2009), the degradation of yellow CdS
was related to the photo-oxidation of the cadmium sulphide to (hydrated) cadmium
sulphate (CdSO4·nH2O). Repeated hydration and drying of the paint surface resulted in the
formation of a thin (a few microns thick) layer of semi-transparent whitish globules of
CdSO4·nH2O on the surface of the CdS-based paint. Another notable finding of this study
was the identification of (NH4)2·Cd2(SO4)3 in the pigment layer, thought to be related to a
previous aggressive cleaning treatment with dilute ammonia. Two supplementary
degradation products were identified in the case of the Flowers in a blue vase of Vincent
Van Gogh (Van der Snickt, et al., 2012): cadmium oxalate (CdC2O4) and lead sulphate
(PbSO4). The presence of an apparently unoriginal varnish, likely applied after the initial
deterioration of the CdS yellow, was the possible source of C2O42- and Pb2+ ions. These ions
could have then reacted with Cd2+ and SO42- ions, produced during the initial photo-
oxidation of CdS, leading to the formation of a thin layer of CdC2O4 on the top of the
painting surface, and the precipitation of PbSO4 in the varnish layer.

Chapter 5 : Applications to paintings and other artistic materials
136
Simultaneously, Mass et al., from the Conservation Department of the Winterthur
Museum, initiated a study to characterize visible changes observed in cadmium yellow areas
of The Barnes Foundation’s The Joy of Life (Henri Matisse, 1905-6, Barnes Foundation 719,
Figure 5-9a), in particular for preservation purposes. Studies were performed at different
synchrotron facilities: at ID21 (ESRF) (Mass, et al., 2013), at BL4-3 (SSRL) (Mass, et al., 2013)
and at the IRENI (Synchrotron Radiation Center, SRC) (Mass, et al., 2013, Patterson, et al.,
2013). By combining µFTIR spectroscopy with micro µXRF and µXANES spectroscopy (at the
Cd LIII-edge and at the S K-edge in scanning mode) spectra were collected over dozens of
points. Degradation products were identified in the altered cadmium yellow area from the
darkened yellow foliage at the upper left of the painting (3 samples: S111, S112, S113 in
Figure 5-9b), the yellow fruit in the tree with an ivory-coloured alteration crust at the upper
right, (1 sample: S115 in Figure 5-9b), and in the faded yellow field beneath the central
reclining figures (2 samples: S117, S5 in Figure 5-9b). CdCO3 was present in high
concentrations in all altered regions, supporting the hypothesis that it is more likely a poorly
soluble photo-degradation product than a filler or residual starting reagent. In the unaltered
yellow paint, the identification of CdS and CdCl2·nH2O suggested that chloride was
introduced as the starting reagent for the synthesis of the cadmium yellow. CdSO4·nH2O was
also found to be enriched in the off-white alteration layers of the samples studied; as a
more soluble species, it was also found elsewhere in the cross-sections. Alteration crusts
identified had no remaining CdS, all of which had degraded into a mixture of cadmium
sulphates, carbonates, and oxalates.
These examples illustrate several advantages of combining synchrotron radiation
based X-ray techniques, such as μXRF, μXANES, and μXRD to elucidate the degradation
process of paint containing CdS yellow pigment. First, combined techniques allow the
identification of minor and major components even when present as
amorphous/nanocrystalline materials (as in the case of CdS) or in a crystallized form. The
sensitivity of these SR-techniques is critical for the identification of photo-alteration
products in paintings, allowing for preventive conservation measures (such as closer
management of light levels and relative humidity) to be implemented when degradation is
observed.
Secondly, the micrometric resolution of these probes is essential to reveal the
presence of the degradation/alteration layer on the painting’s surface, which is typically

Chapter 5 : Applications to paintings and other artistic materials
137
only a few microns thick, and to establish the stratigraphy of the alteration/degradation
products. The identification of CdCO3 and CdSO4·nH2O alone does not constitute a
conclusive proof for a photo-oxidation process. Both compounds are known to be reagents
in the wet and/or dry synthesis process of CdS. Thus, their identification as either unreacted
starting reagents, side products of the original synthesis or as degradation compounds relies
mostly on their location and distribution in regards to the original paint layer.
Mass et al. (Mass, et al., 2013) demonstrated the interest of using a scanning probe
to accurately localise and identify the stratigraphy of various species in order to decide
whether particular species can be categorized as unreacted starting reagents or as
degradation compounds. However, the recent use of 2D full-field XANES (FF-XANES),
combined with 2D µFTIR, µXRF and µXRD measurements when speciation through XANES is
ambiguous, has allowed faster and more detailed identification and distribution of various
chemical compounds, even in highly complex and heterogeneous sections. The new
approach allows for a more detailed elucidation of the degradation phenomena under way,
leading to more specific preservation recommendations, and the ability to identify
degradation at an earlier stage. In particular, the full-field analysis appears to be an ideal
way to extend this study over an entire 2D region, and to eliminate some of the ambiguities
that are inherently present when only a point-by-point analysis is performed.
5.3.2. Paintings and samples location
In order to complete the identification and localisation of the original paint components and
the degradation materials, two micrometric fragments S111 and S5 were sampled from The
Joy of Life painting (Figure 5-9a), in the altered cadmium yellow paint from the darkened
yellow foliage at the upper left of the work, and in the faded yellow field beneath the
central reclining figures respectively (Figure 5-9b).
Two other fragments (named BF205-darkened and BF205-undarkened) were
sampled from the Flower Piece painting (Figure 5-9c), from the dry and cracked darkened
region below the right side of the pitcher, and the intact yellow region above the darkened
area (Figure 5-9d) respectively. This sampling strategy was devised to compare degradation
phenomena in two of Matisse’s artworks showing two different stages of photo-

Chapter 5 : Applications to paintings and other artistic materials
138
degradation, and to obtain information on the cadmium yellow pigment synthesis in the
paints used by Matisse.
a)
c)
b)
d)
Figure 5-9 : a) Henri Matisse, French, 1869–1954 The Joy of Life, between October 1905 and March 1906, oil on canvas, 69 1/2 x 94 3/4 in. (176.5 x 240.7 cm), oil on canvas, The Barnes Foundation, BF719; b) upper left zoom showing tan-brown alteration crusts on the yellow foliage and on the yellow fruit in the tree at the upper right, and zoom on the faded region below the central reclining figures, sampling location for this study are represented by black cross; c) Henri Matisse, French, 1869-1954 Flower Piece, 1906, 21 7/8 x 18 1/4 in. (55.6 x 46.4 cm), oil on canvas, The Barnes Foundation, BF205; d) altered (brown) and non-altered (yellow) regions of yellow paint to the right of the pitcher, sampling locations are represented by black cross.
5.3.3. Analytical methods and data processing
µXRF data were collected at the X-ray micro-spectroscopy beamline ID21 at the
European Synchrotron Radiation Facility (ESRF) (Salomé, et al., 2013). Monochromatic
radiation was extracted from an undulator coupled with a fixed-exit double-crystal
monochromator equipped with a Si(111) crystal and focused using a Kirkpatrick-Baez mirror
pair to a typical beam size of 0.2 µm ver. × 0.6 µm hor. with a flux ranging from 109 to
1010 ph/s. The XRF data were collected by a single channel solid state detector.
S112
S113
S111
S5
S117
S115
altered
nonaltered

Chapter 5 : Applications to paintings and other artistic materials
139
This allowed the distribution of the different elements present in the paint cross-
sections, in particular of the Cd- and S-containing compounds, to be mapped at sub-
micrometre resolution.
In a few cases, the elemental composition maps have been complemented by
sulphur speciation maps. Two maps were recorded setting the energy of the incoming X-
rays to 2.4728 keV and 2.4825 keV respectively, i.e. to energies where the absorption and
consecutively the XRF from sulphides (S2-) or sulphates (S6+) is enhanced. By assuming a
binary composition consisting of CdS and CdSO4·nH2O, and determining the absorption of
these two compounds at these two specific energies, it is possible to derive the
concentration maps of CdS and CdSO4·nH2O, as detailed elsewhere (Cotte, et al., 2006, Van
der Snickt, et al., 2009). The XRF data were batch fitted using the PyMca software package
(Sole, et al., 2007).
FF-XANES data were collected at ID21 in the full-field configuration, across the S K-
edge, Cl K-edge, and Cd LIII-edge. The beam size of 1.5×1.5 mm2 was defined using slits; the
spatial structures of the beam were smoothed using an X-ray decoheror (rotating graphite
foil, 125 μm thick). Samples were mounted vertically, perpendicular to the beam, and
radiographs were acquired with a detection ensemble comprising a scintillator, a magnifying
objective and a CCD camera. It resulted in images with a pixel size of 300x300 nm2 and a
field of view of 315×360 μm2.
For data analysis, the 106 XANES spectra acquired in full-field mode were fitted as a linear
combination (LC) of references, using the TXM Wizard software (Liu, et al., 2012). The
primary set of Cd reference compounds (spectra presented in Figure 5-10) was composed
of: cadmium sulphate (CdSO4, 99.99 % metals basis), hydrated cadmium sulphate
(CdSO4·nH2O, 99.999 % metals basis), cadmium sulphide (CdS, 99.995 % metals basis),
cadmium nitrate tetrahydrate (Cd(NO3)2·4H2O, >99.999 % metals basis), cadmium oxide
(CdO, >99.99 % metals basis), hydrated cadmium chloride (CdCl2·nH2O, >99.99 % metals
basis), cadmium carbonate (CdCO3, >99.999 % metals basis) (all purchased from Sigma
Aldrich) and cadmium oxalate (synthesized at Washington and Lee University). The final
choice of references for the least squares fitting (LSLC) varies from one sample to another,
with regards to complementary µXRD and µFTIR results.

Chapter 5 : Applications to paintings and other artistic materials
140
Figure 5-10 : Cd LIII-edge XANES spectra acquired in
transmission mode using FF-XANES technique on various
cadmium references: cadmium sulphate (CdSO4, 99.99 %
metals basis), hydrated cadmium sulphate (CdSO4·nH2O,
99.999 % metals basis), cadmium sulphide (CdS, 99.995 %
metals basis), cadmium nitrate tetrahydrate
(Cd(NO3)2·4H2O, >99.999 % metals basis), cadmium chloride
(CdCl2, >99.99 % metals basis), hydrated cadmium chloride
(CdCl2·nH2O, >99.99 % metals basis), cadmium oxide (CdO,
>99.99 % metals basis), cadmium carbonate (CdCO3,
>99.999 % metals basis) (all purchased from Sigma Aldrich)
and cadmium oxalates (synthesized at Washington and Lee
University ).
3530 3580 3630
No
rma
lize
d a
bs
orp
tio
n
Energy (eV)
CdSO4·nH2O
CdSO4
Cd(NO3)2·4H2O
Cd(OH)2
CdC2O4
CdCl2·nH2O
CdCl2
CdO
CdS
CdCO3

Chapter 5 : Applications to paintings and other artistic materials
141
In the case of FF-XANES measurements across the S K-edge, the low energy of
incoming photons led to a strong absorption by the sample. Even the thinnest section
obtained by microtome was insufficiently thin to prevent over-absorption effects, drastically
reducing the white line intensity of sulphur species, distorting spectral features and making
LSLC analysis untenable. For these datasets, the selection of Region of Interest (ROI)
characteristics of the different sulphur species present was preferred as a qualitative
approach (Appendix A (4)).
At the Cd LIII-edge, the transmission obtained on a 10 µm section was sufficient to
allow LSLC treatment. One of the most important assets of LSLC is its quantitative character,
since it provides information on the relative contribution of each reference present in the
mixture. However, this strategy presents an important drawback, as it necessitates an a
priori knowledge of the phases constituting the sample. As for single XANES LC fitting, the
method also relies on: i) an accurate energy calibration of references and datasets, ii) a
reliable choice of references (guided for example by complementary analyses by methods
such as XRD, FTIR, Raman, etc.), and iii) a reference set as close as possible to the actual
composition of the sample itself to minimise differences in the background shape and in the
pre- and post-edge regions between references and datasets.
These constraints and the massive data set size motivated the use of another strategy for
data analyses in the case of sample S111, namely Principal Component Analyses (PCA) and
subsequent k-means clustering. Pixels with similar XANES spectra were pooled in reduced
PC space (in the score plot), effectively segmenting the image based on the variance in the
recorded XANES features into a pre-defined number of regions (k areas) consisting of pixels
with a similar XANES signature. PCA and clustering were performed using the TXM-Wizard
software (Boesenberg, et al., 2013).
Some samples were further studied by µXRD at the ID13 (ESRF) and P06
(PETRA III) beamlines. At ID13, the X-ray beam energy of 12.9 keV was selected by means of
a Si(111) double crystal monochromator. The beam was focused with a Kirkpatrick-Baez
mirror optic down to 2.5x1.5 μm2 (hor. x ver.). Diffraction signals were recorded in
transmission geometry with a 2k x 2k ESRF FReLoN detector (50.0 (h) x 49.3 (v) µm2 pixel
size).

Chapter 5 : Applications to paintings and other artistic materials
142
At P06, a hard-X-ray micro- and nanoprobe beamline at the PETRA III storage ring (DESY,
Hamburg, Germany), the X-ray beam energy of 21 keV was selected by means of a Si(111)
double crystal monochromator (Schroer, et al., 2010). The beam was focused with a
Kirkpatrick-Baez mirror optic down to 0.6x0.8 μm2 (hor. x ver.). Diffraction signals were
recorded in transmission geometry with a PILATUS 300K area detector.
Data were unwrapped using both XRDUA (De Nolf, et al., 2014) and PyFAI (Kieffer, et al.,
2013). The Match! and EVA packages were used as well during the preliminary phase
identification. 2D maps of compounds were then generated with PyMca by using ROIs (each
ROI corresponding to a particular diffraction angle range). These ranges were chosen based
on the peak intensity and the absence of overlaps with other phases (defined in Appendix A
(1)).
Organic compounds are known to play an important role in the degradation
mechanisms of paint layers (e.g. through hydrolysis of the drying oil binder), moreover some
of the alteration products are organometallic compounds. Thus, complementary µFTIR
analyses in the mid-IR domain were performed at ID21. In the microscope, a ×32
Schwarzschild objective was used in confocal mode; an aperture defined the size of the spot
illuminating the sample. The signal was detected using a liquid N2-cooled single element
50 µm MCT detector. In this configuration, the beam size was 8x8 µm2, and FTIR spectra
were acquired in transmission mode using the diamond compression technique.
The OMNIC and PyMca packages were used for data analysis.
5.3.4. Sample preparation and mounting
In previous work (Mass, et al., 2013), X-ray analyses were carried out on the surfaces of
polished cross-sections of painting fragments embedded in resin, the most classical
approach to prepare transversal sections from paint fragments. One unpublished result
obtained following this sample preparation method is detailed below for sample S5. The
examination of samples from historical paintings using combined elemental, molecular and
structural methods benefits from the preparation of thin-sections (Pouyet, et al., 2015).
Ideally, hyperspectral analyses are performed on a unique section. However, the sample
preparation requirements (thickness, embedding media etc.) differ as a function of the

Chapter 5 : Applications to paintings and other artistic materials
143
techniques involved (Pouyet, et al., 2014). Accordingly, in the present study, two adapted
thin-sections were prepared: one for combined XANES and XRD analyses, and another one
for FTIR analyses. For X-ray based techniques, the sample was first embedded using
synthetic resin (Historesin, Leica) and microtomed to obtain a section thinner than 20 µm.
The section was then sandwiched between two ultralene foils (4µm thick, from Spex Sample
Prep) to provide mechanical stability during data acquisition. For µFTIR analysis, micro-
compression was favoured because it prevents spectral contamination from the embedding
material (Mass, et al., 2013, Patterson, et al., 2013). Considering that µXRF results are not
affected by any of these forms of sample preparation (compressed sample between
diamond windows, cross-section and thin section from embedded fragment), the resulting
elemental maps allow the combination of results from X-ray and infrared spectroscopies
together with the visible observations.
5.3.5. The Joy of Life (1905-1906): study of the degradation process
5.3.5.1. S5 sample: faded yellow field beneath the central reclining figures
Following the above strategy, analyses were performed on two thin-sections from the same
initial S5 fragment, which had previously been analysed in scanning mode as a cross-section
(Mass, et al., 2013).
FF- XANES was acquired on an embedded thin section of 10 µm (Figure 5-11f), at the Cd-LIII
edge and the Cl K-edge (pixel size 0.6x0.6 μm2). Cd LIII-spectra were fitted with the following
set of references: CdS, CdCO3, CdCl2·nH2O, CdSO4·nH2O, based on the previous µXANES
results (Mass, et al., 2013). Results of LSLC fitting are presented in Figure 5-11i. µFTIR was
performed on a fragment prepared with the micro-compression cell (Figure 5-11a).
Chemical maps (recorded with a step size of 6x6 μm2) are presented in Figure 5-11d. µXRF
maps were acquired at 7.2 keV (step size: 1x1 μm2) on the two sections, allowing, together
with the optical observations, the correlation of results obtained with the three techniques.
The elemental maps obtained on the pressed sample and the thin embedded section are
shown in Figure 5-11c and 3h respectively. Additional speciation maps obtained in µXRF
mode at the S K-edge from the same sample but prepared as a cross-section, (pixel size: 1x1
µm2) are presented in Figure 5-12.

Chapter 5 : Applications to paintings and other artistic materials
144
Figure 5-11 : Combination of SR µFTIR, µXRF and FF-XANES for the study of a fragment from The Joy of Life (S5). Schematic
views of results obtained with b) µFTIR and µXRF; g) FF- XANES at the Cd LIII-edge and µXRF; c-e) results from the
compressed fragment displayed in a) Visible light microscope image; c) µXRF elemental maps of Cd, S and Cl (step size: 1×1
µm2). d) µFTIR maps of esters (1710-1750 cm
-1), amides (1616-1700 cm
-1), hydroxyls (3320-3450 cm
-1), sulphates (1022-
1206 cm-1
), oxalates (1306-1327 cm-1
) and carbonates (1342-1535 cm-1
) (step size: 6×6 µm2); e) IR spectra of carbonates
(point 1), poly (vinyl acetate) polymer (point 2) and zein (point 3) rich area; f-i) results from the 10 µm thick section
displayed in f) Visible light microscope image. h) µXRF elemental maps of Cd, S and Cl (step size: 1×1 µm2); i) Speciation
maps (full-field XANES) of CdCO3, CdS as well as the sum of the remainder Cd components used in LSLC fitting (CdCl2·nH2O
and CdSO4·nH2O) (pixel size: 0.3×0.3 µm2).
The visible images and chemical maps reveal a complex mixture and stratigraphy of
Cd-based compounds in the predominately unaltered yellow region and the alteration white
crust (Figure 5-11b and g).
In the yellow internal region, Cd is highly concentrated (µXRF, Figure 5-11h) and mainly
present as CdS (confirmed by XANES at Cd LIII-edge, Figure 5-11i and Appendix A (2)). XANES
C2O4CO32-
SO42-
Remainder
CdCO3
CdS
O-H
=
Carbonates
Sulfates
Cl, Cd
Acrylic
polymer
Carbonates, Cd
Zein
Oxalates
Carbonates
Sulfates
Cl, Cd
S
Cl Cd
S
Cl Cd
CdS, CdCO3,
CdSO4·nH2O,
CdCl2·nH2O,
Cd, K, S, Cl
CdCO3
Cd, K, Cl
CdC2O4
CdSO4·nH2O
Cd, S, Ca, Si
50 μm 50 μm
b)a)
c)
g)
d)
f)
h) i)
O
C-O-C
=
O
C-N
e)
1
3
2
Point 1
Point 2
Point 3
900140019002400290034003900
Ab
sorb
ance
(ar
bit
. un
its)
Wavenumber (cm-1)

Chapter 5 : Applications to paintings and other artistic materials
145
at the Cd LIII-edge allows the identification of other cadmium-based species as well:
carbonates (confirmed by µFTIR, Figure 5-11d), sulphates (confirmed by µFTIR, Figure 5-11d,
and chemical maps at S K-edge, Figure 5-12) and chlorides, CdCl2 (confirmed by µXRF, Figure
5-11c and h, and XANES at the Cl K-edge, Appendix A (3)). For sulphates and chlorides,
improved data fitting was obtained when spectra of hydrated references were employed.
The imaging capability combined with micrometric resolution achieved with the full-field
microscope reveals that CdS is heterogeneously present in the yellow layer and is
intermixed with CdCO3 and CdSO4·nH2O (Figure 5-11i). Cadmium chlorides have been
previously identified in several regions of this painting (sample S115: yellow fruit in the tree
at the upper right and sample S112:darkened upper left corner), and are thought to be the
residual starting reagent from the wet process synthesis of the CdS used for this painting
(Mass, et al., 2013). This conclusion is also supported by our present findings where
cadmium chlorides are found in the internal yellow region, rather than accumulated in the
alteration white crust (which would be the case if introduced as a contaminant from the
environment).
Concerning the white altered layer, chemical mapping highlights a complex stratigraphy
mainly composed of CdCO3 (µFTIR, Figure 5-11d and Figure 5-11e point1, and XANES at Cd
LIII-edge, Figure 5-11i and Appendix A (2)). In the upper part of the white layer, both
sulphates and oxalates are also identified (µFTIR, Figure 5-11d, XANES at the Cd LIII-edge,
Figure 5-11i and Appendix A (2), and chemical maps at the S K-edge, Figure 5-12). Since the
oxalates, carbonates, and sulphates are all colourless, it explains the chemical cause of the
fading observed in the altered region.
The cadmium carbonates are enriched in the white superficial layer (Figure 5-11d and i)
where CdS is completely absent (Figure 5-11i and Figure 5-12). They can also be observed in
smaller quantities in the yellow paint layer. This distribution confirms similar results found in
the altered yellow fruits from the same work, suggesting that in the off-white alteration
layer, the cadmium carbonate is a photo-degradation product, even though it has been
suggested as a residue of the CdS synthesis in other systems (Mass, et al., 2013, Plahter, et
al., 2011).
The presence of CdC2O4 is limited to the uppermost alteration layer (Figure 5-11d and i and
Appendix A (2)). Also observed in the darkened foliage in the upper left corner of The Joy of
Life (Mass, et al., 2013), and a painting by Van Gogh (Van der Snickt, et al., 2012), this
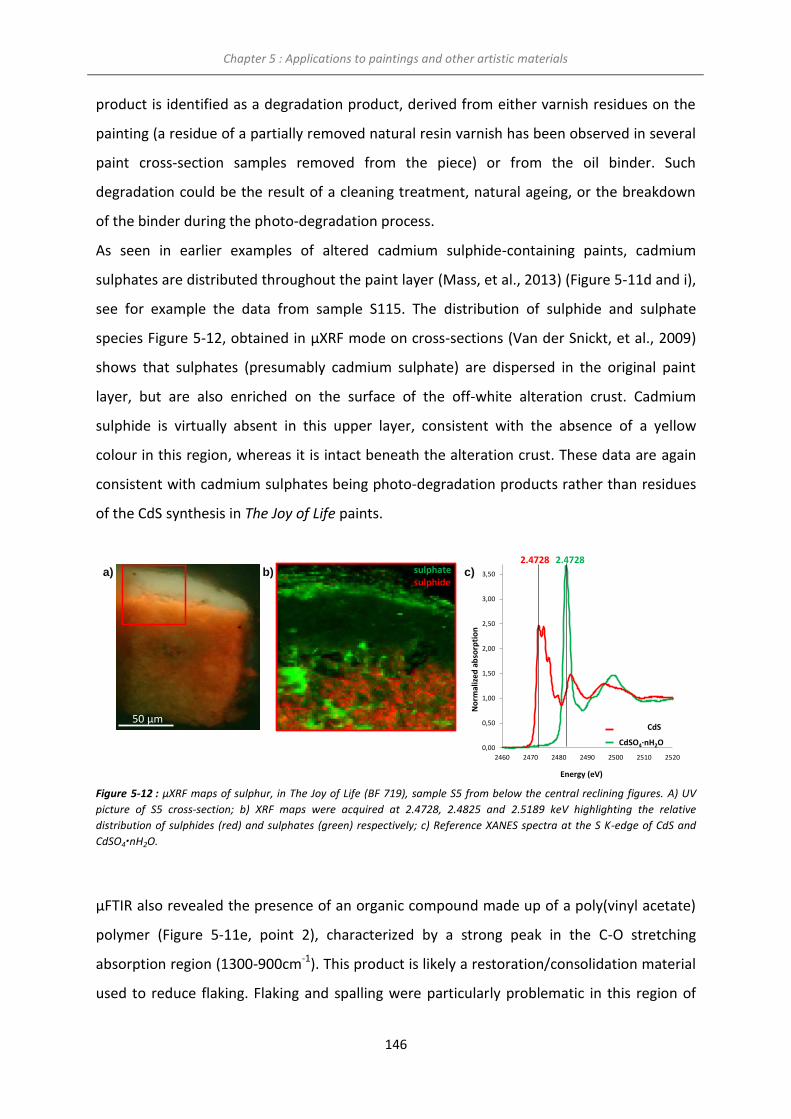
Chapter 5 : Applications to paintings and other artistic materials
146
product is identified as a degradation product, derived from either varnish residues on the
painting (a residue of a partially removed natural resin varnish has been observed in several
paint cross-section samples removed from the piece) or from the oil binder. Such
degradation could be the result of a cleaning treatment, natural ageing, or the breakdown
of the binder during the photo-degradation process.
As seen in earlier examples of altered cadmium sulphide-containing paints, cadmium
sulphates are distributed throughout the paint layer (Mass, et al., 2013) (Figure 5-11d and i),
see for example the data from sample S115. The distribution of sulphide and sulphate
species Figure 5-12, obtained in µXRF mode on cross-sections (Van der Snickt, et al., 2009)
shows that sulphates (presumably cadmium sulphate) are dispersed in the original paint
layer, but are also enriched on the surface of the off-white alteration crust. Cadmium
sulphide is virtually absent in this upper layer, consistent with the absence of a yellow
colour in this region, whereas it is intact beneath the alteration crust. These data are again
consistent with cadmium sulphates being photo-degradation products rather than residues
of the CdS synthesis in The Joy of Life paints.
Figure 5-12 : µXRF maps of sulphur, in The Joy of Life (BF 719), sample S5 from below the central reclining figures. A) UV
picture of S5 cross-section; b) XRF maps were acquired at 2.4728, 2.4825 and 2.5189 keV highlighting the relative
distribution of sulphides (red) and sulphates (green) respectively; c) Reference XANES spectra at the S K-edge of CdS and
CdSO4·nH2O.
µFTIR also revealed the presence of an organic compound made up of a poly(vinyl acetate)
polymer (Figure 5-11e, point 2), characterized by a strong peak in the C-O stretching
absorption region (1300-900cm-1). This product is likely a restoration/consolidation material
used to reduce flaking. Flaking and spalling were particularly problematic in this region of
sulphidesulphate
50 μm
0,00
0,50
1,00
1,50
2,00
2,50
3,00
3,50
2460 2470 2480 2490 2500 2510 2520
No
rmal
ized
ab
sorp
tio
n
Energy (eV)
CdSO4·nH2O
CdS
b)a) c)2.4728 2.4728

Chapter 5 : Applications to paintings and other artistic materials
147
the painting, and several campaigns of consolidation have been carried out, in particular to
allow the work to travel in 1992. In a Cd-free area of about 50 µm (Figure 5-11c), the µFTIR
spectra exhibit a peculiar feature, characteristic of amides. Comparison with databases
suggests the presence of zein, characterized by a band at 3286 cm-1 from amide A (Figure
5-11e point3). Zein is the major storage protein of maize and was proposed as a possible
base material for polymer applications in the early 20th century (Saviello, et al., 2014); here
it is again interpreted as a restoration treatment – the painting is known to have been
stabilized with a glue lining in the early 20th century, prior to the polymer-based
consolidation treatments.
5.3.5.2. S111 sample: darkened yellow foliage
Another discoloured area of The Joy of Life (1905-1906), from the darkened upper left
corner, was also sampled: sample S111. Since this fragment was very small, it was
impossible to employ more than one sample preparation strategy. Priority was given to
XANES analysis at the Cd and S edges, and thus a thin-section 10 μm thick was prepared.
Contrary to the previous fragment, no white alteration zone was observed (Figure 5-13a).
The white thick layer visible in the optical image relates to the lead white-rich ground layer
identified by µXRF analyses as a mixture of Ba- and S-containing coarse grains (most likely
barium sulphates, Figure 5-13b), dispersed in a Pb white-based matrix (lead white, Figure
5-13b). The degradation seems to be limited to a few micrometres on the uppermost part of
the Cd-yellow paint and is related to the browning of the original yellow pigment.
The section has been analysed using FF-XANES at the S, Cl K-edge and Cd LIII-edges.
Supplementary µXRF maps were also acquired at a primary energy of 3.7 keV. After
exposing the sample to these multiple XANES and XRF acquisitions, the embedding resin
started to lose its mechanical strength, thus preventing further investigation using other
techniques such as FTIR or XRD. At the S K-edge, over-absorption issues prevented reliable
LSLC fitting, limiting data analysis to the localisation of both sulphide and sulphate species
based on ROI calculations (as described in Appendix A (4); results not shown). At the Cl K-
edge, the main information obtained was the identification of CdCl2·nH2O as the single
chlorine-containing compound present. Both results were used to confirm the results
obtained at the Cd LIII-edge. [At the Cd LIII-edge, some pixels suffered from over-absorption
and were set to zero (and therefore not taken into account during data fitting).]

Chapter 5 : Applications to paintings and other artistic materials
148
Figure 5-13 : a) Visible light microscope images of S111 10 μm thick thin-section; b) µXRF elemental maps of Cl, K, S, Cd and Pb acquired at 3.7keV(step size: 0.7×0.7 µm
2); c)Results of k-means clustering combined with PCA analyses of FF-XANES
acquisition at Cd LIII-edge (step size: 0.7×0.7 µm2).
LSLC, using similar references to those used for the S5 sample, presented a large
difference between experimental data and fit results, suggesting the presence of species not
covered by the reference dataset. In order to identify the relevant cadmium spectral basis
set, principal component analysis was used. PCA followed by k-means clustering using the
PC basis identified four main clusters (Figure 5-13c): clusters 1, 3, 5 and 6 (cluster 2 and 4
are related to low absorbing area with noisy pixels and were not retained for further
analysis). From each cluster, the average XANES of the cluster was extracted and fitted with
the complete list of references presented above. Mixtures of CdS, CdSO4, CdSO4·nH2O,
CdCO3 and CdCl2·nH2O were able to fit the XANES for the four clusters adequately. The full
Cluster 6Cluster 5Cluster 2Cluster 3 Cluster 4Cluster 1
Cd
K
Pb
S
S
Clb)a)
c)
40 µm
40 µm40 µm
40 µm
0
0,2
0,4
0,6
0,8
1
1,2
1,4
1,6
1,8
3535 3585 3635
No
rma
lize
d a
bs
orp
tio
n
Energy (eV)
XANES of cluster 1
XANES of cluster 3
XANES of cluster 5
XANES of cluster 6
Chapter 5 : Applications to paintings and other artistic materials
149
spectral stack was then refitted using the spectra for the clusters identified above, leading
to a significantly improved fit.
Cluster 1 is representative of most of the sample. Its content of CdCO3 is higher than that of
any other cluster; it also contains traces of CdS and CdCl2·nH2O. On the surface of this
cluster is cluster 3, which displays a similar composition but with added CdSO4·nH2O, again
in significantly lower concentration than CdCO3. Below the surface of the left corner
(yellow), cluster 5 reveals an area where the CdS content increases but still contains a
relatively high amount of CdCO3. Consequently, even in the CdS-rich yellow region, the
CdCO3 is found in high amounts, suggesting that a large fraction of the CdCO3 present is
possibly unreacted starting reagent (Mass, et al., 2013). However, further investigation is
needed because the cadmium yellow hue in this region of the painting was intended to be a
dark yellow/orange (based on comparison to 1905 studies of The Joy of Life at The San
Francisco Museum of Modern Art and the Statens Museum for Kunst, Copenhagen), and
CdCO3 has typically been observed at high concentrations in the paler shades of cadmium
yellow. Another explanation for the CdCO3-rich interior of this yellow paint is the relatively
thin paint layer being studied here compared to samples S115 (Mass, et al., 2013) or S5,
which represent more advanced states of alteration where discrete alteration crusts are
visible. The entire yellow paint layer in this case may be in the process of converting into an
alteration zone.
On the surface of this area is cluster 6 that is highly concentrated in Cd (μXRF), present
mainly as CdS, and CdCO3. The high concentration of CdS in this region of the sample may be
due to the morphology of the brushstroke observed (Figure 5-13a). The top of the sample
would be more exposed to direct ambient light whereas the texture/impasto of the paint
that causes yellow paint to appear on both the side and top of this sample may have
protected the side from direct exposure.
Contrary to S5, this sample is missing the thick white alteration crust, maybe explaining the
lack of a distinct layering structure for the alteration products. However, the distribution
and amount of sulphates species suggests advanced photo-degradation. The degradation
mechanism appears to be a two-step process; in the first step sulphides are directly photo-
oxidized to sulphates, and in the second stage sulphur-based species, in particular cadmium

Chapter 5 : Applications to paintings and other artistic materials
150
sulphide, are completely lost, replaced by cadmium carbonate, as seen for cluster 1. The
presence of some CdSO4 in cluster 5 suggests that the degradation process is still not
complete.
However, the visible colour of the degraded sample (ochre brown) is not directly linked here
to the identification of Cd-based compounds. Consequently, supplementary µXRD analyses
and organic phase analyses are now mandatory to fully understand the photo-degradation
mechanism in this sample.
5.3.6. Flowers in a Pitcher: degradation and synthesis processes study
5.3.6.1. Darkened BF205 sample
Another micro-sample of cadmium yellow paint from the painting Flower Piece (1906),
demonstrating photo-degradation, was taken from the dry, cracked, and darkened region
below the right side of the painting’s pitcher. The sample was too brittle to allow sectioning
without adding strengthening material, consequently the surface of the resin block was first
covered with a sulphur-free tape insuring the integrity of the 10 µm section during slicing
with the microtome (Figure 5-14a). The optical stratigraphy is very similar to that observed
in sample S5, with a large off-white layer at the surface of the painting. A residual ground
layer was also identified on the left corner of the section.
Four main experiments were carried out on this section in order to identify the degraded
materials present: μXRF sulphur valence maps (step size 2x2 μm2), results are presented in
Figure 5-14b. μXRF at 7.3 keV (step size 2x2 μm2); elemental mapping results are illustrated
in Figure 5-14c. FF-XANES at Cd-LIII edge (pixel size 0.7x0.7 μm2); results of LSLC fitting are
presented in Figure 5-14d. μXRD 12.9 keV (ID13, step size 2x2 μm2); phase maps based on
the integrated diffraction intensity over regions of interest are shown in Figure 5-14e.

Chapter 5 : Applications to paintings and other artistic materials
151
Figure 5-14 : a) Optical image of BF205 darkened sample prepared as 10 μm thick thin-section (bottom); b) Sulphide and
sulphate distribution from sulphur valence maps in μXRF (step size: 1x1.2μm2); c) Elemental mapping results from fit of XRF
map (step size: 2x2μm2); d) LSLC fitting results of full-field stack acquired at Cd LIII-edge on the thin-section using CdS,
CdCO3, CdCl2·nH2 and CdSO4·nH2O (pixel size: 0.7x0.7μm2); e) μXRD maps of sphalerite (ZnS), barite (Ba0.99Sr0.01(SO4)),
anglesite (PbSO4), hydrocerussite (Pb3(CO3)2(OH)2), CdS, Cadmium oxalate (CdC2O4), Cadmium sulphate hydrated
(CdSO4·nH2O), and otavite (CdCO3) (step size: 2x2μm2).
Based on these four techniques, the painting’s ground layer, paint layer and alteration layer
could be chemically characterized.
μXRD (Figure 5-14e) combined with μXRF (Figure 5-14c) allowed for the identification
of sphalerite (ZnS), barite (Ba0.99Sr0.01(SO4)), anglesite (PbSO4) and hydrocerussite
(Pb3(CO3)2(OH)2) in the ground layer area. Two different ground layers were more accurately
identified: the first one (innermost) contains mainly hydrocerussite with sphalerite and
barite on which a very thin second layer containing hydrocerussite and barite with grains of
anglesite is applied. The presence of sphalerite and barite together suggests the use of
lithopone, a co-precipitate of BaSO4 and ZnS introduced in 1874. The first layer may be a
commercial ground, while the second has probably been prepared and applied by Matisse
himself. The anglesite was also seen by µ-FTIR in The Joy of Life, and may result from the
interaction of the unstable CdS with the lead white in the ground.
By combining FF-XANES at ID21 at the Cd LIII-edge with μXRD and μXRF at sulphide
and sulphate absorption-specific energies, the composition of the painting layer is defined
mainly as a mixture of CdS, CdCO3 and CdSO4·nH2O.
300 μm
Greenockite
(CdS)
Otavite (CdCO3)
Hydrocerussite
(Pb3(CO3)2(OH)2)
Barite
(B0.99Sr0.01(SO4)
Cadmium oxalates
(CdC2O4)
Cadmium sulfates
hydrated
(CdSO4·nH2O)CdS
CdCO3 CdSO4·nH2O
CdC2O4
Cl
Pb
S
Ba
Cd
Cr
μ-XRD (22µm² )
μ-XRF (22µm²)
Full-field XANES LC results at Cd L3-edge (0.70.7µm²)
Sulfur valence map (22µm²)
min
max
min
max
a) b)
d) e)
c)
sulphidesulphate

Chapter 5 : Applications to paintings and other artistic materials
152
The white degraded area is mainly composed of CdCO3 with a small amount of CdC2O4 and
CdSO4·nH2O, identified by FF-XANES and μXRD, similar to what was observed for samples S5
and S115 (Mass, et al., 2013). A small increase of the CdC2O4 and CdSO4·nH2O content is
observed at the surface of this area in FF-XANES data, however no clear stratigraphy inside
the degraded area was observed from the µXRD results.
The high concentration of CdCO3 in the off-white alteration crust of the paint layer may
suggest that this compound as well as CdSO4·nH2O and CdC2O4, are the products of
degradation processes. However, the presence of CdCO3 in a high amount in the paint layer
as well suggests that at least some of it may have been initially present as a filler or residual
starting reagent for this work. Though the former possibility is less likely since CdCO3, used
as cadmium white, would have been an expensive filler (Plahter, et al., 2011).
5.3.6.2. Undarkened BF205 sample
Cadmium carbonate (CdCO3), as illustrated above, has been identified in the altered
cadmium yellow (CdS) paints found in Impressionist, early modernist, and post-
Impressionist works. As CdCO3 is highly insoluble (Ksp of 1.0 ×10⁻¹²), when it is formed solely
as a result of photo-alteration, it is mostly confined to the location where it is formed, i.e. at
the surface of the paint layer. However, when an unclear stratigraphy is present and CdCO3
is distributed throughout the paint layer, conclusions about its origin in the paint layer are
equally unclear. In cadmium yellow paint in works such as Edvard Munch’s The Scream (c.
1910, The Munch Museum, Oslo), the hypothesis has recently been proposed that CdCO3
was used in the indirect wet process synthesis of CdS (for example, through reaction of
CdCO3 with Na2S) (Mass, et al., 2013, Plahter, et al., 2011).
To address the question of the origin of CdCO3, a flake of (to the naked eye)
undegraded pale cadmium yellow paint was removed from Henri Matisse’s Flower Piece so
that the distribution of CdCO3 could be studied, both as a function of depth in the paint
layer and in individual pigment particles. The visible fluorescence of the ultraviolet-
illuminated paint cross-section removed from Flower Piece (Figure 5-15a) shows that in the
top half of this sample, the cadmium yellow is dispersed in a zinc white base, and individual
cadmium sulphide particles are visible thanks to their orange fluorescence in the ultraviolet.

Chapter 5 : Applications to paintings and other artistic materials
153
A section of 15 μm thickness was prepared from a visually non-degraded paint fragment
from the lemon yellow area (Figure 5-15b).
a)
b)
Figure 5-15 :a) Lemon cadmium paint cross-section from Flower Piece (BF 205) showing cadmium yellow particles dispersed in a zinc white matrix (405 nm illumination), b) Optical image of the lemon-hued cadmium paint prepared as thin-section, 15μm thick.
Three main measurement types were carried out on this section to identify possible residual
starting reagents: μXRD at 21keV (P06, step size 2x2 μm2), results presented in Figure 5-16b;
FF-XANES at the S K-edge (ID21, pixel size 0.7x0.7 μm2), analysed as ROI integration
(Appendix A (4)) and FF-XANES at the Cd-LIII edge (ID21, pixel size 0.7x0.7 μm2), analysed by
LSLC fitting and presented in Figure 5-16c.
The Cd concentration map derived from FF-XANES at the Cd LIII-edge reveals that
cadmium-containing particles show up as “hot spots” evenly dispersed throughout the zinc
white base. The presence of CdCO3 grains is established by FF-XANES at the Cd-LIII edge, and
by μXRD (Figure 5-16b and c). The XRD measurements show CdS as a diffuse halo in the
vicinity of the larger CdCO3 grains. The Cd-LIII FF-XANES results suggest that cadmium
sulphide and sulphate form rings/shells surrounding the CdCO3 grains. This observation is
supported by sulphide and sulphate maps acquired at S K-edge in FF-XANES mode (Appendix
A (4)). However, the larger beam size and the relative insensitivity of XRD to poorly
crystalline material did not allow confirming the sulphate/sulphide/carbonate morphology
suggested by the FF-XANES measurements by diffraction imaging.
Even though XRD cannot confirm the core/shell morphology of the CdCO3 particles
surrounded by CdS or CdSO4, it clearly shows that in this sample, CdCO3 is co-localized with
CdS instead of forming a surface degradation layer.
50 μm 25 μm
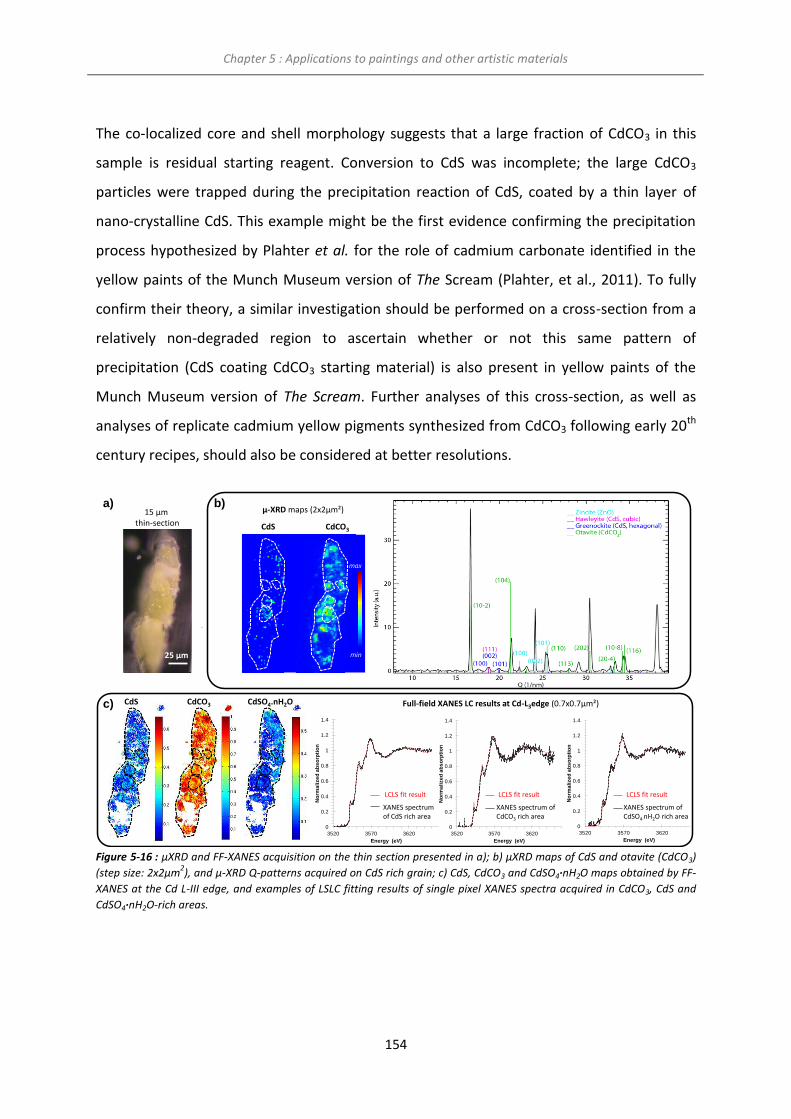
Chapter 5 : Applications to paintings and other artistic materials
154
The co-localized core and shell morphology suggests that a large fraction of CdCO3 in this
sample is residual starting reagent. Conversion to CdS was incomplete; the large CdCO3
particles were trapped during the precipitation reaction of CdS, coated by a thin layer of
nano-crystalline CdS. This example might be the first evidence confirming the precipitation
process hypothesized by Plahter et al. for the role of cadmium carbonate identified in the
yellow paints of the Munch Museum version of The Scream (Plahter, et al., 2011). To fully
confirm their theory, a similar investigation should be performed on a cross-section from a
relatively non-degraded region to ascertain whether or not this same pattern of
precipitation (CdS coating CdCO3 starting material) is also present in yellow paints of the
Munch Museum version of The Scream. Further analyses of this cross-section, as well as
analyses of replicate cadmium yellow pigments synthesized from CdCO3 following early 20th
century recipes, should also be considered at better resolutions.
Figure 5-16 : µXRD and FF-XANES acquisition on the thin section presented in a); b) μXRD maps of CdS and otavite (CdCO3)
(step size: 2x2μm2), and μ-XRD Q-patterns acquired on CdS rich grain; c) CdS, CdCO3 and CdSO4·nH2O maps obtained by FF-
XANES at the Cd L-III edge, and examples of LSLC fitting results of single pixel XANES spectra acquired in CdCO3, CdS and
CdSO4·nH2O-rich areas.
0
0.2
0.4
0.6
0.8
1
1.2
1.4
3520 3570 3620
No
rma
lize
d a
bs
orp
tio
n
Energy (eV)
Fit
XANES of
pixel rich in CdSO4.nH2O
0
0.2
0.4
0.6
0.8
1
1.2
1.4
3520 3570 3620
No
rma
lize
d a
bs
orp
tio
n
Energy (eV)
Fit
XANES of
pixel rich in CdCO3
Full-field XANES LC results at Cd-L3edge (0.7x0.7µm²)
μ-XRD maps (2x2µm²)
-
15 µmthin-section
OtaviteCdS
CdSO4.nH2O
CdS CdCO3
CdS CdCO3
25 μm min
max
0
0.2
0.4
0.6
0.8
1
1.2
1.4
3520 3570 3620
No
rma
lize
d a
bs
orp
tio
n
Energy (eV)
Fit
XANES of
pixel rich in CdS
XANES spectrumof CdS rich area
XANES spectrum of CdSO4·nH2O rich area
XANES spectrum of CdCO3 rich area
LCLS fit result LCLS fit result LCLS fit result
a) b)
c)

Chapter 5 : Applications to paintings and other artistic materials
155
5.3.7. Conclusion
The composition of sub-millimeter fragments of cadmium yellow paints from The Joy of Life
and Flower Piece as a function of depth using SR-µFTIR, µXRF, µXRD and FF-XANES imaging
confirmed that CdCO3, CdC2O4 and CdSO4·nH2O are degradation products rather than paint
fillers, and, in the case of The Joy of Life, that these compounds are no residual synthesis
reagents either.
These colourless compounds are responsible for the observed fading of the cadmium
yellow paint in The Joy of Life. Despite the high solubility that causes cadmium sulphate to
migrate through the paint layers in many of the samples studied, cadmium sulphate is also
identified as a photo-degradation product. In the case of sample S5 (from The Joy of Life)
and sample BF205-darkened (from Flower Piece), an oxidation of the original CdS pigment,
probably induced by UV-visible irradiation and uncontrolled relative humidity levels is the
initiation point and basis of the observed fading and discoloration. Based on previous work
(Mass, et al., 2013, Van der Snickt, et al., 2012), the oxidation of CdS to CdSO4·nH2O at or
just below the paint surface explains the formation of the CdSO4·nH2O compound which, as
it is highly water soluble, may then diffuse through the paint layer. The surface enrichment
of CdSO4·nH2O in the case of S5 suggests that while CdSO4·nH2O has the potential solubility
to migrate through the paint layer, surface accumulation resulting from photo-degradation
can also be observed. As suggested previously (Mass, et al., 2013), this compound can
initiate the subsequent stages of degradation by reacting with CO2 to form CdCO3. Acid
hydrolysis of the organic binder or the varnish, which leads to spalling and cracking of the
paint layer allows for further photo-oxidation of the newly exposed CdS in the micro-cracks.
The very high insolubility (Ksp of 1.0x10⁻¹²) of CdCO3 explains its presence as the dominant
end product of a series of degradation reactions. A tertiary degradation process involving
the further breakdown of cadmium oxalate into cadmium carbonate cannot be excluded.
The presence and the location of CdC2O4 are for the moment not fully understood, although
TOF-SIMS data from this same painting shows that long chain fatty acids are depleted in the
regions of CdS alteration, suggesting that the acid hydrolysis of the binding medium is a
possible mechanism for the formation of oxalate anions. Alternatively, the presence of
varnish, as observed in the case of the S5 sample, may have partially dissolved CdSO4 and

Chapter 5 : Applications to paintings and other artistic materials
156
freed Cd2+ ions, which in turn may then have precipitated out with C2O42- instead of SO4
2-,
explaining the formation of a cadmium oxalate film (Van der Snickt, et al., 2012).
The pale brownish appearance of the S111 sample appears to be organic in nature as
no evidence for the formation of a dark brown inorganic photo-degradation product was
established. Soil and other fine particulate may lodge in the interstices of the crumbling
paint surface, formed or enhanced during photo-oxidation, giving rise to the darkening
observed (Mass, et al., 2013). Acid hydrolysis of the drying oil paint binder may also result in
the formation of chromophores contributing to the darkened appearance. In either case
further analyses of organic degradation products and trace analyses of other particles
embedded in the paint are required to fully understand the observed darkening.
Both the intact lemon cadmium paint and photo-oxidized cadmium yellow paint
from Flower Piece were examined by UV and VIS photomicroscopy, XRD and FF-XANES.
Investigation of undarkened lemon cadmium paint from Flower Piece reveals that a large
amount of cadmium carbonate is present, however, it is not accumulated at the paint
surface but co-located with individual CdS yellow pigment particles suspended in a zinc
white base. Co-location of CdS and CdCO3, possibly in a core-shell morphology suggests that
the CdS pigment used by Henri Matisse to paint this work may have contained a large
fraction of unreacted starting reagents, leftovers of an incomplete synthesis. This finding
provides the first physical evidence supporting the theory of Plahter et al. that cadmium
carbonate-rich cadmium yellow paints in the first decade of the 20th century were likely
prepared by the indirect wet process method, and not invariably indicative of photo-
alteration. Consequently in the case of photo-oxidized paint, the high ratio of CdCO3
compounds present in yellow paint may be related to this starting reagent, whereas the
white crust may combine both CdCO3 as a starting reagent and CdCO3 as second
degradation product of photo alteration, as it is found in the presence of CdSO4·nH2O and
CdC2O4.
In final conclusion, analytical methods with a high sensitivity for chemical speciation and
ability to map the distribution of various compounds at sub-micron resolution are essential
for deciphering the synthesis and degradation pathways of pigments in hierarchically
complex objects such as paintings. The access to both molecular and structural mapping

Chapter 5 : Applications to paintings and other artistic materials
157
capabilities by combining FF-XANES, µXRF, µXRD and µFTIR in 2D is opening new possibilities
for the rigorous study of degradation products and mechanisms in paint layers, and more
generally for the micro-analysis of artworks for the benefit of these works’ long-term
preservation.
5.4.Application to other artistic materials
5.4.1. Acrylonitrile-butadiene-styrene polymer photo-aging in design objects
Saviello, D., Pouyet, E., Toniolo, L., Cotte, M., & Nevin, A. (2014). Synchrotron-based
FTIR microspectroscopy for the mapping of photo-oxidation and additives in
acrylonitrile–butadiene–styrene model samples and historical objects. Analytica
chimica acta, 843, 59-72.
Acrylonitrile-butadiene-styrene (ABS) has been largely used over the last 50 years as a
plastic material in industrial applications. It is present also in many design objects or
household items, such as telephones, domestic appliances, lamps, musical instruments,
exhibited in international museums. As observed with paintings, ABS suffers from photo-
aging. The objective of the present study was to assess the depth of oxidation in terms of
chemical modifications on two types of samples: artificially photo-aged ABS blocks and
fragments from historical Italian design objects from the 1960’s (Saviello, et al., 2014). In-
depth analysis of such phenomena has already been reported, but based on the progressive
removal of thin (50 µm) layers parallel to the exposed area of the plastic blocks, using a
microtome. However, considering the fragility of the degraded surface area, the in-depth
resolution in the first ~100 µm with this approach is critical (Bokria, et al., 2002). In the
present study, the microtome was used as well, but thin-sections (2µm) were obtained
perpendicularly to the block surface, following the SES protocol (see section 3.5.2).
Accordingly, in a single map, both the internal pristine polymer and the superficial products
formed during photoageing can be identified and localized. The visible image (Figure 5-17a)
and UV fluorescence images (Figure 5-17b) highlight a luminescent upper layer of about
45 µm on the surface of the block. In Figure 5-17c, three points are shown as references at

Chapter 5 : Applications to paintings and other artistic materials
158
three different depths: 40, 194 and 268 µm.
Figure 5-17: SR µFTIR study of the oxidation of an ABS model film (sample exposed to UV-irradiation for 1000 hours); a) Visible light microscope image of a 2 µm thin-section prepared following the SES method, b) UV light microscope images of 1000h aged ABS sample on the left, and of pure resin thin-section (2 µm) on the right c) FT-IR spectra acquired at different positions corresponding to three different depths from the sample surface and one spectrum characteristic of the absorption of a resin 2 µm thin-section.
The spectra from the exposed area of the sample show a clear increase of the signal relative
to C=O at 1735 cm-1 and the appearance of an intense and broad signal relative to O-H
stretching at 3436 cm-1. These bands are attributed to ketones, aldehydes, esters, α, β-
unsaturated carbonyl, carboxylic acids and alcohols. The depth of oxidation in samples was
evaluated, for materials aged for different amounts of time. µFTIR highlighted a selective
and progressive gradient of degradation, greatest at the surface of the sample and which
decreases in-depth. The oxidation compounds tend to form a passivation layer, limiting the
further oxidation of the bulk ABS. Results are further detailed in a dedicated publication
(Saviello, et al., 2014).
In order to show the strength of the SES protocol, Figure 5-17 shows as well the spectrum of
0.0
0.2
0.4
0.0
0.2
0.4
0.0
0.2
0.4
500
1000 1500 2000 2500 3000 3500 4000
a) c)40 µm
192 µm
268 µm
Wavenumbers (cm-1)
Ab
s
ν(C=O)ν(OH)
0.0
1.0
2.0 resinb)

Chapter 5 : Applications to paintings and other artistic materials
159
a standard embedding resin (Historesin, Leica). It presents strong overlaps with all the FTIR
bands characteristic of the chemical bonds formed during photo-ageing. Therefore, the
identification and precise localisation of these degradation compounds would have been
strongly compromised with a standard resin embedding protocol. Moreover, samples
prepared in this way could be examined successfully with other microscopic techniques (UV
and visible microscopy).
5.4.2. Estimating Firing Conditions for Roman Ceramics
Meirer, F., Liu, Y., Pouyet, E., Fayard, B., Cotte, M., Sanchez, C., Andrews, J.C.,
Apurva, M., and Sciau, P. (2013). Full-field XANES analysis of Roman ceramics to
estimate firing conditions—A novel probe to study hierarchical heterogeneous
materials. Journal of Analytical Atomic Spectrometry, 28(12), 1870-1883.
Ceramics and more generally artefacts obtained by firing techniques are increasingly studied
by XAS techniques. Indeed, most of the optical effects in glass and ceramics (color, opacity,
lustre effect, etc.) are obtained by mastering the redox state of key elements (most often
transition metals). The determination of the oxidation state of these elements can be
exploited to understand and model these optical effects, but can also offer information
regarding the firing conditions: choice of ingredients, successive temperatures and
atmosphere, etc. (Janssens, 2013). Many of these XAS experiments have been carried out
with millimetric, or sub-millimetric X-ray probes, giving an averaged bulk information. More
recently, micrometric beams have been further used, allowing to specifically probe
particular part of the matter: for example, for the spatial discrimination of crystals and glass
in Egyptian and Roman glasses opacified with calcium antimonite crystals (Lahlil, et al.,
2010, Lahlil, et al., 2011) or for the study of Mn speciation over brown-black Mn-rich
corrosion bodies, before and after conservation treatment (Cagno, et al., 2011).

Chapter 5 : Applications to paintings and other artistic materials
160
In this context the use of full-field XANES method rapidly appeared as an obvious
progression to further improve the spectro – imaging combination for the characterization
of these materials.
The following study has been initiated by Ph. Sciau, CEMES-CNRS (centre for elaboration of
materials and structural studies). The main objective was to obtain new insights about
possible differences in the firing protocols used for the manufacturing of two types of
Roman black gloss ceramics: a B type Campanian ceramic (with black gloss coating and a
non-vitrified body, from the 1st cent BCE) and Pre-sigilatta ceramic (presenting a black slip
on a non-vitrified red/brown paste, from 10 BCE to CE 10).
Ceramics coatings were obtained from the vitrification of an iron oxide-rich material coming
from the settling and decantation of natural clays, and their colors were settled (red or
black) through the control of redox chemistry of iron oxides present in the material. By
probing the subtle changes in redox chemistry of iron species, it was consequently expected
to obtain information on temperature and oxygen fugacity variations during the firing
processes (Meirer, et al., 2013). As these changes are often heterogeneously distributed and
frequently confined to the near surface regions and to the small interfacial region between
the slip and the body, their characterization necessitates a probe combining sub-
micrometric resolution and a large field of view. This is now available thanks to the new full-
field setups. Two full-field instruments were used: the zone plate based full-field
transmission X-ray microscope (TXM) at SSRL (with a FOV of 30 µm2 and a resolution of 30
nm) and the lens-less full-field microscope at ID21 (with a FOV from 600 µm2 up to 2 mm2
and resolutions ranging from 0.3 to 1.4 µm, see section 4.2 for more details).
Two sherds, one from each production, were sampled. Sample sections were prepared
following the protocol proposed by Ph. Sciau which is detailed in section 3.6.
The Campanian sherd was first analysed by F. Meirer, Ph. Sciau et al., with the nanoprobe
(TXM, SSRL). The results show a distinct phase composition with mainly hercynite (FeAl2O4,
black phase, Fe2+) in the slip, and maghemite (-Fe2O3, red phase, Fe3+), in the body. The
same sample was further investigated by performing X-ray tomography in order to map
micro-cracks and porosity distribution in the slip and in the body. The superposition of
Chapter 5 : Applications to paintings and other artistic materials
161
spectral and morphological results suggests oxidation of the sample from the body of the
ceramic to the slip. The combined information on Fe chemistry and ceramic porosity shows
possible pathways for fast transport of oxygen through micro-cracks and open micro-pores
to oxidize the ceramic next to these channels, quickly converting Fe minerals from hercynite
to maghemite, and then slowly diffusing through the denser slip to push the re-oxidation
front deeper into the slip.
Even if the ID21 full-field instrument does not compete with the SSRL one in terms of lateral
resolution (10 times higher), it appeared interesting for us to carry out complementary
experiments with the ID21 device. In particular, considering the different geometries and
the larger field of view (at least 20 times higher), we expected a clear gain in terms of SNR
and in statistic relevance.
Based on SSRL successful results similar approach on another thin-section from the same
ceramic sherd was followed by employing the lens-less full-field approach at ID21. Here, we
report the main information obtained at ID21, highlighting the benefit of this instrument,
with respect to the SSRL one, for this problematic. The complete study can be found in
(Meirer, et al., 2013).
Despite the lower spatial resolution both the high concentration of hercynite in the slip and
the predominant presence of maghemite in the body were confirmed (Figure 5-18a).
The increased field of view with larger pixel size and improved mineralogical sensitivity,
allow detecting the very heterogeneous and shallow oxidation of the surface of the slip.
Furthermore, it was possible to notice the presence of small islands of hematite in the body
(Figure 5-18a). Both thin patches of maghemite at the surface and small islands of hematite
in the body were confirmed by spot analysis using micro-Raman spectroscopy (Figure 5-18b-
d).
Moreover, thanks to the extremely large number of measured XANES, the LCLS fit results
revealed the presence of an additional iron phase in the body. Indeed, an area of the sample
presented bad fitting results in comparison with experimental spectrum, when taking into
account only hercynite, maghemite, hematite. Consequently, the set of references did not
represent all the iron phases present in this cluster. By adding the spectrum of almandine

Chapter 5 : Applications to paintings and other artistic materials
162
(Fe₃Al₂(SiO₄)₃) in the previous dataset, fitting results showed an improved match with the
sum spectrum from the cluster. Consequently a new iron phase was identified which help in
determining firing temperature and duration conditions for this specific sherd.
Figure 5-18: a) Phase map deduced from measurements performed at ID21 (ESRF) including Raman spectra recorded at
various points (b–d). Hercynite (green), maghemite (blue) and hematite (red), FOV: 2032 × 1036 (610 × 311 µm2), pixel size
300 nm, from (Meirer, et al., 2013).
In conclusion, the distribution of hercynite (black, Fe2+), hematite and maghemite (both red,
Fe3+) achieved with a large FOV explains the visible colors of the ceramic, and presents a
very pictorial evidence that this vessel was once reduced and then partially re-oxidized.
Moreover chemical differences between the two ceramics allow establishing assumption on
different firing conditions. Indeed the thinner surface oxidation (maghemite) layer on the
slip, the large amount of maghemite and the presence of patches of un-oxidized Fe2+
minerals in the body of the Campanian sherd suggest that the final re-oxidation step was
hercynite (FeAl2O
4)
maghemite (γ-Fe2O
3 )
hematite (α-Fe2O
3)

Chapter 5 : Applications to paintings and other artistic materials
163
performed under either lower oxygen fugacity or even more likely at significantly lower
temperature and/or short duration in comparison with the Pre-sigillita sherd.
This example demonstrates the benefits of combining nano and micro full-field XANES as
well as Raman spectroscopy. In this context the new full-field micrometric approach reveals
the interest to combine large field of view (i.e. increased sample heterogeneity probed) with
sub- micrometric pixel size. It should be also noted that one technique alone would have not
answered all questions on the firing of the ceramics since nanometric chemical
heterogeneities as well as larger scale porosity were determinant in the conclusions of this
study, further details can be found in (Meirer, et al., 2013).

Chapter 5 : Applications to paintings and other artistic materials
164
5.5.References
Boesenberg, U., Meirer, F., Liu, Y., Shukla, A. K., Dell’Anna, R., Tyliszczak, T., Chen, G., Andrews, J. C., Richardson, T. J., Kostecki, R. & Cabana, J. 2013. Mesoscale Phase Distribution in Single Particles of LiFePO4 following Lithium Deintercalation. Chemistry of Materials, 25 (9):1664-72.
Bokria, J. G. & Schlick, S. 2002. Spatial effects in the photodegradation of poly(acrylonitrile–butadiene–styrene): a study by ATR-FTIR. Polymer, 43 (11):3239-46.
Cagno, S., Nuyts, G., Bugani, S., De Vis, K., Schalm, O., Caen, J., Helfen, L., Cotte, M., Reischig, P. & Janssens, K. 2011. Evaluation of manganese-bodies removal in historical stained glass windows via SR-µ-XANES/XRF and SR-µ-CT. Journal of analytical atomic spectrometry, 26:2442-51.
Cotte, M., Checroun, E., Susini, J., Dumas, P., Tchoreloff, P., Besnard, M. & Walter, P. 2006. Kinetics of oil saponification by lead salts in ancient preparations of pharmaceutical lead plasters and painting lead mediums. Talanta, 70 (5):1136-42.
Cotte, M., Susini, J., Metrich, N., Moscato, A., Gratziu, C., Bertagnini, A. & Pagano, M. 2006. Blackening of Pompeian Cinnabar Paintings: X-ray Microspectroscopy Analysis. Analytical chemistry, 78 (21):7484-92.
Cotte, M., Susini, J., Solé, V. A., Taniguchi, Y., Chillida, J., Checroum, E. & Walter, P. 2008. Applications of synchrotron-based micro-imaging techniques to the chemical analysis of ancient paintings. Journal of analytical atomic spectrometry, 23:820-8.
De Nolf, W., Vanmeert, F. & Janssens, K. 2014. XRDUA: crystalline phase distribution maps by two-dimensional scanning and tomographic (micro) X-ray powder diffraction. Journal of Applied Crystallography, 47 (3):1107-17.
Hu, K., Bai, C., Ma, L., Bai, K., Liu, D. & Fan, B. 2013. A study on the painting techniques and materials of the murals in the Five Northern Provinces’ Assembly Hall, Ziyang, China. Heritage Science, 1 (1):18.
Janssens, K. H. 2013. Modern Methods for Analysing Archaeological and Historical Glass. Wiley Online Library.
Katsibiri, O. & Boon, J. J. 2004. Investigation of the gilding technique in two post-Byzantine wall paintings using micro-analytical techniques. Spectrochimica Acta Part B: Atomic Spectroscopy, 59 (10–11):1593-9.
Kieffer, J. & Karkoulis, D. PyFAI, a versatile library for azimuthal regrouping, in Journal of Physics: Conference Series, (2013), pp. 202012.
Chapter 5 : Applications to paintings and other artistic materials
165
Lahlil, S., Biron, I., Cotte, M., Susini, J. & Menguy, N. 2010. Synthesis of calcium antimonate nano-crystals by the 18th dynasty Egyptian glassmakers. Appl Phys A, 98 (1):1-8.
Lahlil, S., Cotte, M., Biron, I., Szlachetko, J., Menguy, N. & Susini, J. 2011. Synthesizing lead antimonate in ancient and modern opaque glass. Journal of analytical atomic spectrometry, 26 (5):1040-50.
Lei, Y., Wen, M. & Cheng, X. 2012. An investigation of the murals preserved in the temples under Chieftain Lu in Liancheng, Yongdeng County, Gansu Province. J Imperial Palace, 2:133-54.
Leone, B., Burnstock, A., Jones, C., Hallebeek, P., Boon, J. & Keune, K. The deterioration of cadmium sulphide yellow artists' pigments, in Triennial meeting (14th), The Hague, 12-16 September 2005: preprints, (2005), pp. 803-13, figs.
Liu, Y., Meirer, F., Williams, P. A., Wang, J., Andrews, J. C. & Pianetta, P. 2012. TXM-Wizard: a program for advanced data collection and evaluation in full-field transmission X-ray microscopy. Journal of Synchrotron Radiation, 19 (2):281-7.
Lluveras, A., Boularand, S., Roqué, J., Cotte, M., Giráldez, P. & Vendrell-Saz, M. 2008. Weathering of gilding decorations investigated by SR: Development and distribution of calcium oxalates in the case of Sant Benet de Bages (Barcelona, Spain). Applied Physics A, 90:23-33.
Mass, J., Sedlmair, J., Patterson, C. S., Carson, D., Buckley, B. & Hirschmugl, C. 2013. SR-FTIR imaging of the altered cadmium sulfide yellow paints in Henri Matisse's Le Bonheur de vivre (1905-6) - examination of visually distinct degradation regions. Analyst, 138 (20):6032-43.
Mass, J. L., Opila, R., Buckley, B., Cotte, M., Church, J. & Mehta, A. 2013. The photodegradation of cadmium yellow paints in Henri Matisse’s Le Bonheur de vivre (1905–1906). Applied Physics A, 111 (1):59-68.
Meirer, F., Liu, Y., Pouyet, E., Fayard, B., Cotte, M., Sanchez, C., Andrews, J. C., Mehta, A. & Sciau, P. 2013. Full-field XANES analysis of Roman ceramics to estimate firing conditions-A novel probe to study hierarchical heterogeneous materials. Journal of Analytical Atomic Spectrometry, 28 (12):1870 - 83.
Monico, L., Janssens, K., Miliani, C., Brunetti, B. G., Vagnini, M., Vanmeert, F., Falkenberg, G., Abakumov, A., Lu, Y. & Tian, H. 2012. Degradation Process of Lead Chromate in Paintings by Vincent van Gogh Studied by Means of Spectromicroscopic Methods. 3. Synthesis, Characterization, and Detection of Different Crystal Forms of the Chrome Yellow Pigment. Analytical chemistry, 85 (2):851-9.
Monico, L., Janssens, K., Miliani, C., Van der Snickt, G., Brunetti, B. G., Guidi, M. C., Radepont, M. & Cotte, M. 2013. Degradation Process of Lead Chromate in Paintings by Vincent van Gogh Studied by

Chapter 5 : Applications to paintings and other artistic materials
166
Means of Spectromicroscopic Methods. 4. Artificial Aging of Model Samples of Co-Precipitates of Lead Chromate and Lead Sulfate. Anal Chem, 85 (2):860-7.
Monico, L., Janssens, K., Vanmeert, F., Cotte, M., Brunetti, B. G., Van der Snickt, G., Leeuwestein, M., Salvant Plisson, J., Menu, M. & Miliani, C. 2014. Degradation Process of Lead Chromate in Paintings by Vincent van Gogh Studied by Means of Spectromicroscopic Methods. Part 5. Effects of Nonoriginal Surface Coatings into the Nature and Distribution of Chromium and Sulfur Species in Chrome Yellow Paints. Analytical chemistry, 86 (21):10804-11.
Monico, L., Van der Snickt, G., Janssens, K., De Nolf, W., Miliani, C., Dik, J., Radepont, M., Hendriks, E., Geldof, M. & Cotte, M. 2011. Degradation Process of Lead Chromate in Paintings by Vincent van Gogh Studied by Means of Synchrotron X-ray Spectromicroscopy and Related Methods. 2. Original Paint Layer Samples. Analytical chemistry, 83 (4):1224-31.
Monico, L., Van der Snickt, G., Janssens, K., De Nolf, W., Miliani, C., Verbeeck, J., Tian, H., Tan, H., Dik, J., Radepont, M. & Cotte, M. 2011. Degradation Process of Lead Chromate in Paintings by Vincent van Gogh Studied by Means of Synchrotron X-ray Spectromicroscopy and Related Methods. 1. Artificially Aged Model Samples. Analytical chemistry, 83 (4):1214-23.
Patterson, C. S., Carson, D., Phenix, A., Khanjian, H., Trentelman, K., Mass, J. & Hirschmugl, C. J. 2013. Synchrotron-based Imaging FTIR Spectroscopy in the Evaluation of Painting Cross-sections. e-Preservation Science, 10.
Plahter, U. & Topalova-Casadiego, B. 2011. The Scream by Edvard Munch: painting techniques and colouring materials, in Studying Old Master Paintings Technology and Practice The National Gallery Technical Bulletin 30th Anniversary Conference Postprints, ed by M Spring (London: Archetype, 2011): pp. 244–52.
Pouyet, E., Fayard, B., Salome, M., Taniguchi, Y., Sette, F. & Cotte, M. 2015. Thin-sections of painting fragments: opportunities for combined synchrotron-based micro-spectroscopic techniques. Heritage Science, 3 (1):3.
Pouyet, E., Lluveras-Tenorio, A., Nevin, A., Saviello, D., Sette, F. & Cotte, M. 2014. Preparation of thin-sections of painting fragments: Classical and innovative strategies. Analytica chimica acta, 822:51-9.
Salomé, M., Cotte, M., Baker, R., Barrett, R., Benseny-Cases, N., Berruyer, G., Bugnazet, D., Castillo-Michel, H., Cornu, C., Fayard, B., Gagliardini, E., Hino, R., Morse, J., Papillon, E., Pouyet, E., Rivard, C., Solé, V. A., Susini, J. & Veronesi, G. 2013. The ID21 Scanning X-ray Microscope at ESRF. Journal of Physics: Conference Series, 425 (18):182004.
Salvadó, N., Butí, S., Nicholson, J., Emerich, H., Labrador, A. & Pradell, T. 2009. Identification of reaction compounds in micrometric layers from gothic paintings using combined SR-XRD and SR-FTIR. Talanta, 79 (2):419-28.

Chapter 5 : Applications to paintings and other artistic materials
167
Saviello, D., Pouyet, E., Toniolo, L., Cotte, M. & Nevin, A. 2014. Synchrotron-based FTIR microspectroscopy for the mapping of photo-oxidation and additives in acrylonitrile–butadiene–styrene model samples and historical objects. Analytica chimica acta, 843 (0):59-72.
Schroer, C. G., Boye, P., Feldkamp, J. M., Patommel, J., Samberg, D., Schropp, A., Schwab, A., Stephan, S., Falkenberg, G., Wellenreuther, G. & Reimers, N. 2010. Hard X-ray nanoprobe at beamline P06 at PETRA III. Nuclear Instruments and Methods in Physics Research Section A: Accelerators, Spectrometers, Detectors and Associated Equipment, 616 (2-3):93-7.
Sole, V. A., Papillon, E., Cotte, M., Walter, P. & Susini, J. 2007. A multiplatform code for the analysis of energy-dispersive X-ray fluorescence spectra. Spectrochimica Acta - Part B Atomic Spectroscopy, 62 (1):63-8.
Van der Snickt, G., Dik, J., Cotte, M., Janssens, K., Jaroszewicz, J., De Nolf, W., Groenewegen, J. & Van der Loeff, L. 2009. Characterization of a Degraded Cadmium Yellow (CdS) Pigment in an Oil Painting by Means of Synchrotron Radiation Based X-ray Techniques. Analytical chemistry, 81 (7):2600-10.
Van der Snickt, G., Janssens, K., Dik, J., De Nolf, W., Vanmeert, F., Jaroszewicz, J., Cotte, M., Falkenberg, G. & Van der Loeff, L. 2012. Combined use of Synchrotron Radiation Based Micro-X-ray Fluorescence, Micro-X-ray Diffraction, Micro-X-ray Absorption Near-Edge, and Micro-Fourier Transform Infrared Spectroscopies for Revealing an Alternative Degradation Pathway of the Pigment Cadmium Yellow in a Painting by Van Gogh. Analytical chemistry, 84 (23):10221–8.
Zanella, L., Casadio, F., Gray, K. A., Warta, R., Ma, Q. & Gaillard, J.-F. 2011. The darkening of zinc yellow: XANES speciation of chromium in artist's paints after light and chemical exposures. Journal of analytical atomic spectrometry, 26 (5):1090-7.
Zeng, Z., Wang, S. & Yang, S. 1999. Synthesis and Characterization of PbS Nanocrystallites in Random Copolymer Ionomers. Chemistry of Materials, 11 (11):3365-9.

168

169
CHAPTER 6 : GENERAL CONCLUSIONS AND PERSPECTIVES
6.1. Conclusions .............................................................................................................................. 169
6.2. Perspectives ............................................................................................................................. 173
6.3. References ............................................................................................................................... 175
6.1.Conclusions
SR-based µFTIR, µXRF, µXAS and µXRD are increasingly employed, for the study of paintings,
providing insight into historical practices and into degradation mechanisms. Their
combination offers a detailed picture of chemical composition and reactions involved in the
artwork all along its history.
The thesis was dedicated to develop new methods for the preparation and analyses of paint
samples from CH artefacts with combined hyperspectral techniques. These efforts were
made simultaneously on the X-ray and the infrared microscopes at ID21, with the aim to
make available a complete multi-modal hyper-spectral analytical platform dedicated to the
study of historical paintings.
In particular, the advantages offered by the analysis of thin-sections, instead of
classical cross-sections were presented in Chapter 2. The advantages were highlighted
concerning spatial resolution (in particular by limiting in-depth averaging for X-ray beam and
the chromaticity of penetration depth for ATR-FTIR), as well as reliability and quantitative
aspect of the results (by limiting matrix absorption affecting XRF, XAS and XRD, and by
allowing the direct measure of absorbance value for FTIR and XAS in transmission mode)
(Pouyet, et al., 2015).
Taking into account the discussion on enhanced SR-based techniques if carried out
on thin-section, alternatives to the standard preparation of thick resin-embedded cross-
sections were considered in Chapter 1. This part represented a major challenge of the PhD
work (Pouyet, et al., 2014).
Sample preparation was particularly delicate for what concerns FTIR analyses, since organic
embedding resin usually interferes with sample ingredients. Consequently, dedicated efforts

Chapter 6 : General conclusions and perspectives
170
were involved in order to develop preparation protocols limiting the risks of chemical
interferences (solubilisation, reduction/oxidation or other reactions), as well as the risks of
analytical interferences (overlap of detected signals coming from the sample and from
materials used in the preparation). Several options, based on the use of (ultra)microtome
and on preliminary wrapping of samples with a barrier coating, were assessed, focusing
particularly on the preparation of thin-sections (1-20 µm) for single or combined FTIR
spectroscopy and X-ray 2D micro-analysis.
A few strategies specially developed for the preparation of painting cross-sections for µFTIR
analysis have been reported and their potential extrapolation to the preparation of thin-
sections have been discussed (section 3.4.) In addition, two new methods were developed
(section 3.5): i) the first one is based on a free-embedding approach, ensuring an enhanced
chemical and analytical neutrality (section 3.5.2). It is illustrated through the study of
degradation of plastic artefacts in design objects (Saviello, et al., 2014) (section 5.4.1); ii) the
second one is based on a barrier coating approach which strengthens the sample and avoids
the penetration of the resin into the sample. The barrier coating investigated here is a silver
chloride salt, an infrared transparent material, which remains malleable and soft after pellet
compression, enabling microtoming (section 3.5.3). This technique provided excellent
results regarding ancient Chinese gilding techniques rediscovery (Pouyet, et al., 2014)
(section 5.2).
Based on the successful results obtained following these strategies other barrier coatings
were also proposed, whereas not yet tested on historical paintings. Some of them already
presented interesting properties for further development in this direction (section 3.5.4).
If initially limited to the sample preparation, developments concerning sample handling and
mounting were rapidly identified as essential as well. With the development of a specific
sample holder for X-ray analyses combined with chemical and physical characterization of
film supports (section 3.7), the present work provides a preliminary handbook for adapting
sample mounting to specific study and to the required analytical conditions.
Considering that requirements in terms of section thickness and invasiveness effects
are not necessarily shared by the different analytical techniques, this work has considered a
series of validation tests aiming at determining if a unique sample can be analysed with all
the techniques in a selected order, or if adapted sections have to be specifically prepared.

Chapter 6 : General conclusions and perspectives
171
As a conclusion, FTIR technique is the most demanding in term of thinness, a few microns,
and sample preparation neutrality. As it is a non-invasive technique, this technique should
better be performed first in a combined approach.
The thickness and sample preparation determined for FTIR analyses can be compatible with
those required for supplementary XRF, XAS or XRD measurements. Alternatively, an adapted
section must be prepared. In most cases, optimized thickness, a few tenth of microns, and
sample preparation for combined XAS and XRD are similar allowing carrying out both
techniques on the same section.
Fast μXRF acquisition may help in the definition of areas of interest for XAS or XRD
measurements, and must consequently be performed previously or simultaneously on the
section.
The preparation and analyses of thin-sections allowed also assessing new
methodological capabilities, such as the full-field XANES approach (Chapter 4). While XRF,
XRD and FTIR acquisitions on historical paintings benefit from 2D (or even 3D) data set, XAS
acquisitions have long been limited to a few spectra or a few chemical maps. Recently, the
full-field XANES approach represented a very promising alternative to the scanning
approach for studying painting micro-sample, by offering the acquisition of a complete set
of hyper-spectral data and thus 2D images with full spectra information, and with reduced
radiation exposition. This thesis significantly contributed to its development, at ID21, in the
context of CH materials study (Fayard, et al., 2013).
Full-field XANES has been identified as a powerful tool which offers novel opportunities for
the study of CH materials, as it allows 2Dmapping at micrometric scale combined with full
spectral information to be recorded on millimetric sample area within a tenth of minutes.
This is consequently very efficient for the study of large corpus of heterogeneous samples.
Painting model samples based on two layers of different Mn-based pigments were first
prepared and analysed in order to assess the potential of the method (section 4.5). Both
pigments were easily identified and localized, even when present as a mixture (Fayard, et
al., 2013).
Moreover, based on XAS spectroscopy, this set up is applicable to a wide range of material
without limit concerning the organization level of material. Successful analyses were already
performed on fragments of glasses and ceramics (Meirer, et al., 2013).

Chapter 6 : General conclusions and perspectives
172
Based on a lens-less approach, the equipment limits dose deposition and preserve
photosensitive historical sample. Radiation damage issues were significantly reduced as
exemplified with the study of a highly photosensitive pigment, Prussian Blue (section 4.7).
This opened new possibilities for studying its degradation as well as other radiation sensitive
pigments.
In summary, new combinations among synchrotron-based µFTIR, µXRF, µXAS, full-field XAS
and µXRD techniques in transmission mode have been developed by carefully optimizing the
sample preparation and by developing new micro-spectroscopy tools. Accordingly, an
improved and easier combination of X-ray and infrared techniques for the complementary
characterization of painting fragments is now available at ID21 at the ESRF.
As an example, a complementary set of tools for elemental, molecular and structural
identification and mapping was offered in the study of cadmium yellow painting fragments
from two Matisse’s paintings discoloured area (section 5.3). The complex composition
(combination of nanocrystalline phases, degraded/undegraded inorganic and organic
materials organized as micrometric layers; variety and complexity of the initial pigment) of a
set of historical cadmium yellow micro-samples were analysed by a combination of
techniques on similar sections, in order to couple different chemical signatures / sensitivity
as well as spatial resolution. In this context the possible remaining of starting reagent, and
the degradation mechanisms undergoing were characterized and localised via coupled
μFTIR, μXRF, μXRD, and full-field XANES.
Whereas the discussion was focused on painting materials, this works started also to be
extended to other artistic materials (e.g. ceramics, and polymer-based materials) as
presented in section 5.4.

Chapter 6 : General conclusions and perspectives
173
6.2. Perspectives
This study gave promising results on historical cases, however further advances are
still required, from both technical and experimental point of views, to go a step forward in
an even better combination of techniques.
Concerning FTIR analyses, several directions should be explored for future
developments. As an alternative to the classical set-up in transmission, a new hemispherical
ATR device is under commissioning at ID21. If successful, this device should allow a
significant improvement in terms of acquisition time, data quality, sample damage in
comparison with classical ATR systems, and in terms of lateral resolution compared with the
transmission mode (× 4). Fully applicable on thin-section it may allow the analyses of a few
tenth of microns section mainly prepared for X-ray analyses, making easier the combination
of several techniques on a single section.
In parallel, the near infrared domain would need to be further investigated. This energy
domain is starting to be explored (Sciutto, et al., 2014), for the reason that beam intensity is
very high, the lateral resolution is not affected by diffraction and beam can go across thicker
sections. Macroscopic NIR analyses have already demonstrated its relevance for the
analyses of paintings. Its extension to microscopic characterization on thin-section might
complement the mid-µFTIR approach.
Concerning X-ray techniques, the present discussion was mainly focused on 2D
imaging capabilities, however as exemplified with the study of Roman ceramics, 3D
characterization offers novel opportunities in the characterization of complex material from
CH field, in particular of paintings (Gervais, et al., 2013). As an exemple, the implementation
of a 3D variant of full-field absorption XANES at the ID21 beamline is undergoing to extend
its capability for investigating heterogeneous materials, e.g. from CH field.
The 3D approach combined with micro and nano probes will be even more constraining in
term of sample preparation, and will raise new question in this direction.
The approach developed in this work could be of interest to other imaging
techniques increasingly used for the study of artistic materials. As an example, the

Chapter 6 : General conclusions and perspectives
174
preparation of ultra thin-sections is a standard for Transmission Electron Microscopy.
Staining based techniques are usually applied to cross-sections, but their use on thin-
sections should be assessed since it would limit the in-depth “contamination” of sample by
the dye. In summary, out of the SR context, many other microscopy-based techniques could
benefit from the study of thin-sections.
In addition to the development of instruments, the importance of data processing and data
analysis should not be neglected. The treatment of millions of spectra acquired over large
2D areas and ranging from IR to hard X-ray energies require ad-hoc software developments.
If for single technique computational advances allow the treatment of more and more
complex dataset, much work may be involved in a multivariate analyses of combined
spectroscopic results obtained on a unique section. Based on the image alignment algorithm
presented in section 4.3.3 (Paleo, et al., 2014), data acquired with different spatial scale and
energy range could be aligned together in order to create a huge dataset containing all
spectroscopic information as the third dimension. Adapted data-analysis packages will be
then necessary for an optimal exploration of these data. This aspect represents a major
challenge, for CH samples, but more generally for any heterogeneous and complex
materials.

Chapter 6 : General conclusions and perspectives
175
6.3.References
Fayard, B., Pouyet, E., Berruyer, G., Bugnazet, D., Cornu, C., Cotte, M., Andrade, V. D., Chiaro, F. D., Hignette, O., Kieffer, J., Martin, T., Papillon, E., Salomé, M. & Sole, V. A. 2013. The new ID21 XANES full-field end-station at ESRF. Journal of Physics: Conference Series, 425 (19):192001.
Gervais, C., Boon, J. J., Marone, F. & Ferreira, E. S. B. 2013. Characterization of porosity in a 19th century painting ground by synchrotron radiation X-ray tomography. Applied Physics A, 111 (1):31-8.
Meirer, F., Liu, Y., Pouyet, E., Fayard, B., Cotte, M., Sanchez, C., Andrews, J. C., Mehta, A. & Sciau, P. 2013. Full-field XANES analysis of Roman ceramics to estimate firing conditions-A novel probe to study hierarchical heterogeneous materials. Journal of Analytical Atomic Spectrometry, 28 (12):1870 - 83.
Paleo, P., Pouyet, E. & Kieffer, J. 2014. Image stack alignment in full-field X-ray absorption spectroscopy using SIFT_PyOCL. J Synchrotron Radiat, 21 (2):456-61.
Pouyet, E., Fayard, B., Salome, M., Taniguchi, Y., Sette, F. & Cotte, M. 2015. Thin-sections of painting fragments: opportunities for combined synchrotron-based micro-spectroscopic techniques. Heritage Science, 3 (1):3.
Pouyet, E., Lluveras-Tenorio, A., Nevin, A., Saviello, D., Sette, F. & Cotte, M. 2014. Preparation of thin-sections of painting fragments: Classical and innovative strategies. Analytica Chimica Acta, 822 (0):51-9.
Saviello, D., Pouyet, E., Toniolo, L., Cotte, M. & Nevin, A. 2014. Synchrotron-based FTIR microspectroscopy for the mapping of photo-oxidation and additives in acrylonitrile-butadiene-styrene model samples and historical objects. Analytica Chimica Acta.
Sciutto, G., Prati, S., Bonacini, I., Oliveri, P. & Mazzeo, R. 2014. FT-NIR microscopy: An advanced spectroscopic approach for the characterisation of paint cross-sections. Microchemical Journal, 112:87-96.

176

177
Appendix A
Appendix A (1) Table of 2theta angle ranges selected for mapping the different compounds
identified by µXRD (for E=12.89keV).
Appendix A (2) Cd LIII-edge spectra. The spectra in black were recorded on the sample displayed in
Figure 5-11. One pixel XANES has been extracted from: the unaltered area (1), rich in CdS, the
uppermost part of degraded layer (2), rich in CdC2O4, and from the center of the degraded layer (3)
typical from a pure CdCO3 compound. The dotted line in black were acquired from reference
powders CdS, CdSO4·H2O and CdCO3. Red spectra represent the LSLC fit results for each spectrum
using CdCO3, CdS, CdCl2·nH2 and CdSO4·nH2O references.
Compound formula Compound Name 2theta angle range
CdCO3 Otavite 22.4498-22.6506
CdSO4·nH2O Cadmium sulphatehydrated
11.06-11.44
Ba0.99Sr0.01(SO4) Barite 15.9502-16.255
CdS Greenockite 16.2829-16.7611
Pb3(CO2)2(OH)2 Hydrocerusite 16.7428-16.9585
ZnS Spharelite 19.1442-18.9418
CdC2O4 Cadmium oxalate 20.9358-20.3103
PbSO4 Anglesite 27.2971-27.625
3535 3555 3575 3595 3615 3635
No
rmal
ized
Ab
sorp
tio
n
Energy (eV)
XANES_of_pixel:_(127/161)
Fit_to_XANES_of_pixel:_(127/161)
XANES_of_pixel:_(52/229)
Fit_to_XANES_of_pixel:_(52/229)
XANES_of_pixel:_(124/93)
Fit_to_XANES_of_pixel:_(124/93)
CdC2O4
CdS
CdC2O4
CdS reference
CdCO3
XANES spectrumof CdS rich area (1)
LCLS fit result
XANES spectrumof CdC2O4 rich area (2)
XANES spectrumof CdCO3 rich area (3)
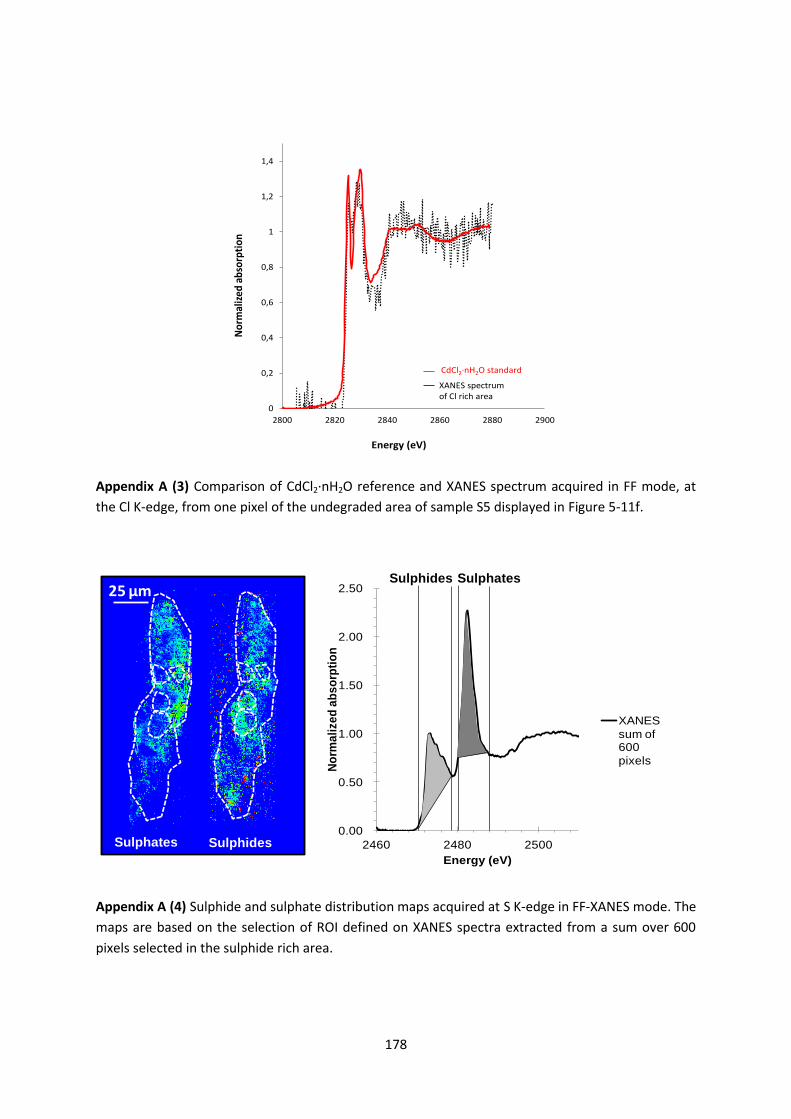
178
Appendix A (3) Comparison of CdCl2·nH2O reference and XANES spectrum acquired in FF mode, at
the Cl K-edge, from one pixel of the undegraded area of sample S5 displayed in Figure 5-11f.
Appendix A (4) Sulphide and sulphate distribution maps acquired at S K-edge in FF-XANES mode. The
maps are based on the selection of ROI defined on XANES spectra extracted from a sum over 600
pixels selected in the sulphide rich area.
0
0,2
0,4
0,6
0,8
1
1,2
1,4
2800 2820 2840 2860 2880 2900
No
rmal
ized
ab
sorp
tio
n
Energy (eV)
XANES spectrumof Cl rich area
CdCl2·nH2O standard
0.00
0.50
1.00
1.50
2.00
2.50
2460 2480 2500
No
rma
lize
d a
bs
orp
tio
n
Energy (eV)
XANES
sum of 600
pixels
Sulphates Sulphides
Sulphides25 μm
Sulphates

179
Appendix B: Abbreviations list
AFM: Atomic force microscopy
ARE: AgCl resin embedding
ATR: Attenuated total reflectance
BSE: Backscattered electrons
CCD: Charged coupled device
CDD: Cyclododecane
CEN: European committee for standardization
CH: Cultural heritage
CT: X-Ray computed tomography
C2RMF: Centre de recherche et de restauration des musées de France
DGEBA: diglycidyl ether of bisphenol-A
EDX: Energy dispersive X-ray spectroscopy
EELS: Electron energy loss spectroscopy
ESRF: European synchrotron radiation facility
EXAFS: Extended X-ray absorption fine structure
FF: Full-field
FOV: Field of view
FPA: Focal plane array
FTIR: Fourier transform infra-red spectroscopy
IBeA: Ikerkuntza eta Berrikuntza Analitikoa
IRPA : Institut royal du Patrimoine artistique
IRUG: Infrared and raman users group
LSLC: Least squares linear combination
PCA: Principal component analyses
PEEK: Polyetherethercetone

180
PET: Poly (ethylene terephtalate) polyester
PMMA: polymethyl methacrylate
ROI: Region of interest
SE: Secondary electrons
SEM: Scanning electron microscopy
SERS: Surface enhanced raman scattering
SES: Sample enclosing system
SIFT: Scale invariant feature transform
SNR: Signal to noise ratio
SR: Synchrotron
SRC: Synchrotron radiation center
SSRL: Stanford synchrotron radiation lightsource
STIM: Scanning transmission ion microscopy
SXM: Scanning X-ray microscope
ToF-SIMS: Time-of-flight secondary ion mass spectrometry
TXM: Transmission X-ray microscopy
XANES: X-ray absorption near edge structure
XAS: X-ray absorption spectroscopy
XRD: X-ray diffraction
XRF: X-ray fluorescence
XPS: X-ray photoelectron spectroscopy

181
Appendix C: Index
2D-XANES, 87
Absorbance, 27
Absorption coefficient, 24
Acrylic resin, 50
Acrylonitrile-butadiene-styrene, 157
AgCl resin embedding, 66
Atomic force microscopy, 45
ATR mode, 11
Barrier coatings, 60
Beer Lambert law, 18
Cadmium yellow pigment, 133
Chrome yellow pigment, 102
CMOS camera, 89
Correlation method, 92
Cyclododecane, 61
Diamond anvil micro-compression, 57
Edge normalization, 94
Electron Energy Loss Spectroscopy, 45
Epoxy resin, 50
European Committee for Standardization, 46
Fourier Transform InfraRed Spectroscopy, 9
Gilding technique, 121
ID13, 30
Infinite-target case, 20
IR-transparent materials, 58
Least squares method, 95
Linear combination method, 95
Long working distance optical objective, 89
Mass attenuation coefficient, 19
Mass fraction, 19
Metal covering / coating, 60
Non-penetrating gel-like, 61
P06, 30
Particle Induced X-ray Emission, 34
Polyester resin, 50
Prussian Blue pigment, 109
Radiation damage, 108
X-ray decoheror, 89
Resin, 50
Roman Ceramics, 159
Sample enclosing system, 64
Savitzky-Golay filter, 96
Scale Invariant Feature Transform, 92
Scanning Transmission Ion Microscopy, 34
Scintillator, 89
Self-absorption, 25
Speciation images, 87
Specular reflection mode, 11
Surface Enhanced Raman Scattering, 45
Principal Component Analyses, 96
Thin-target case, 20
Time-of-Flight Secondary Ion Mass
Spectrometry, 45
Transmission Electron Microscopy, 34
Transmission X-ray Microscopy, 87
X-ray Absorption Near Edge Spectroscopy, 23
X-ray Absorption Spectroscopy, 23
X-Ray computed tomography, 45
X-ray diffraction, 28
X-ray Fluorescence, 16
X-ray photoelectron spectroscopy, 45

182

183
Appendix D: Publications & Communications
PUBLICATIONS
PEER-REVIEWED PUBLICATIONS
E. Pouyet, M. Cotte, B. Fayard, M. Salomé, F. Meirer, A. Mehta, E. S. Uffelman, A. Hull, F. Vanmeert,
J. Kieffer, M. Burghammer, K. Janssens, F. Sette and J. Mass, 2D X-ray and FTIR micro-analysis of the
degradation of cadmium yellow pigment in paintings of Henri Matisse, Applied Physics A, 1-14, 2015.
E. Pouyet, B. Fayard, M. Salomé, Y. Taniguchi, F. Sette and M. Cotte, Thin-sections of painting
fragments: opportunities for combined synchrotron-based micro-spectroscopic techniques, Heritage
Science, vol. 3, no 1, 3, 2015.
E. Pouyet, M. Cotte, A. Lluveras, A.Nevin, D. Saviello and F.Sette, Preparation of thin-sections of
painting fragments: classical and innovative strategies, Analytica Chimica Acta, 822, 51-59, 2014.
D. Saviello, E. Pouyet, M. Cotte, L. Toniolo, A. Nevin, Synchrotron FTIR microspectroscopy for the
mapping of photo-oxidation and additives in ABS in model samples and historical object, Analytica
Chimica Acta, 843, 59-72, 2014.
P. Paleo, E. Pouyet and J. Kieffer, An implementation of SIFT in OpenCL, Journal of synchrotron
radiation, 21(2), 0-0, 2014.
F. Meirer, Y. Liu, E. Pouyet, B. Fayard, M. Cotte, C. Sanche , A. Mehta and P. Sciau, Full-field XANES
analysis of Roman ceramics to estimate firing conditions—A novel probe to study hierarchical
heterogeneous materials, Journal of Analytical Atomic Spectrometry, 28, 1870-1883, 2013.
M. Cotte, E. Pouyet, M. Radepont, J.Susini, Application des méthodes de spectroscopie d'absorption
X pour l'analyse des matériaux anciens et artistiques, Techniques de l'ingénieur, 2012.
PUBLICATIONS IN PROCEEDINGS WITH PEER-REVIEW
K. Keune, J. Mass, F. Meirer, C. Pottash, A. van Loon, A. Hull, J. Church, E. Pouyet, M. Cotte and A.
Mehta, Tracking the Transformation and Transport of Arsenic Sulfide Pigments in Paints:
Synchrotron-based X-ray micro-analyses, Journal of Analytical Atomic Spectrometry, 30(3), 813-827,
2015.
I. Cianchetta, K.Trentelman, J. Maish, D. Saunders, B. Foran, M. Walton, Ph. Sciau, T. Wang, E.
Pouyet, M. Cotte, F. Meirer, Y. Liu, P. Pianetta and A. Mehta, Evidence for an Unorthodox Firing
Sequence Employed by the Berlin Painter: Deciphering Ancient Ceramic Firing Conditions through
High-Resolution Material Characterization and Replication, Journal of Analytical Atomic
Spectrometry, 2015.

184
B. Fayard, E. Pouyet, G. Berruyer, D. Bugnazet, C. Cornu, M. Cotte,V. De Andrade, F. Di Chiaro, O.
Hignette, J. Kieffer, T. Martin, E.Papillon, M.Salomé, A. V. Solé, The new ID21 XANES full-field end-
station at ESRF, Journal of Physics: Conference Series, 25i, 2013.
M. Salomé, M. Cotte, R. Baker, R. Barrett, N. Benseny-Cases, G. Berruyer, D. Bugnazet, H. Castillo-
Michel, C. Cornu, B. Fayard, E. Gagliardini, R. Hino, J. Morse, E. Papillon, E. Pouyet, C. Rivard, V. A.
Solé, J. Susini and G. Veronesi, The ID21 Scanning X-ray Microscope at ESRF, Journal of Physics:
Conference Series, 425, 182004, 2013.
OTHER PUBLICATIONS
E. Pouyet, M. Cotte, Combined synchrotron-based X-Ray and FTIR micro-spectroscopies for studying
Cultural Heritage artefacts, ALMA conference proceeding, 2014.
E. Pouyet, M. Cotte, A. Nevin, D. Saviello, Insight into artistic materials: the importance of an
appropriate sample preparation exemplified by the micro-FTIR study of the polymer degradation in
design objects. ESRF Highlight, 2014.
I. Commandré, F. Martin, P. Bascou, B. Gratuze, E. Pouyet, A. Riols, Entre tradition et modernité :
l’atelier verrier des Salines au coeur des hautes Corbieres (Aude) fin XVIIe- début XVIIIe s., Bulletin
AFAV, 2013.
M. Cotte, M. Radepont, E. Pouyet, M. Salomé, J. Susini., Synchrotron based X-Ray and FTIR
microspectroscopy for the Cultural Heritage at the ID21 beamline, ESRF, IAEA technical report, 2011.
COMMUNICATIONS
INVITED COMMUNICATIONS
Artistic materials watched under synchrotron micro-beam, E. Pouyet, M. Cotte, ALMA, Prague, Czech
Republic, 20-21 November 2014.
Cultural Heritage applications at the European Synchrotron Radiation Facility, E. Pouyet, M. Cotte, B.
Fayard, WIRMS, Lorne, Australia, 10-14 November 2013.
NON-INVITED COMMUNICATIONS
2015
Characterization of applied brocades from Savoie duchy, France, by means of combined micro-
analytical techniques, E. Pouyet, T. Guiblain, S. Cersoy, S. Champdavoine, M. Cotte, F. Lelong, P.
Martinetto, P. Walter, i) TECHNART, Catania, Italy, and ii) GMPCA, Besançon, France, 27-30 April
2015.

185
Synchrotron-based micro-analytical techniques for the studies of paintings, E. Pouyet, M. Cotte, 4th
Course of the International School of structural and molecular archaeology « Hubert Curien », Erice,
Italy, 7-13 April 2015.
2014
Synchrotron-based Micro-analytical Techniques in the Studies of Art and Historical Artifacts, M.
Cotte, E. Pouyet, K. Janssens, AIC-SILS, 15-18 September 2014.
Combined synchrotron-based micro-spectroscopic analyses of painting thin-sections, E. Pouyet, M.
Cotte, B. Fayard, A. Lluveras-Tenorio, J. Mass, D. Saviello, A. Nevin, P. Sciau, SR2A, Paris, France, 9-12
September 2014.
The use of synchrotron radiation for the analysis of the distribution of additives in ABS design
objects and model samples, D. Saviello, E. Pouyet, D. Comelli, S. Goidanich, M. Cotte, A. Nevin, L.
Toniolo, SR2A, Paris, France, 9-12 September 2014.
The combination of FTIR and X-Ray micro-spectroscopies for the analysis of thin sections of artistic
materials at the ID21 beamline, E. Pouyet, M. Cotte, B. Fayard, A. Lluveras-Tenorio, F. Meirer, A.
Nevin, D. Saviello, Ph. Sciau, M. Salomé, CHEMCH14, Vienna, Austria, 1-4 July 2014.
Full-field X-ray spectroscopy offers new possibilities for the study of paintings, E. Pouyet, M. Cotte,
B. Fayard, L. Monico, J. Mass, G. Nuyts, M. Radepont, P. Sciau, ISA, Los Angeles, United States, 19-23
May 2014.
2013
Chemical imaging applied to artistic materials using full-field X-ray spectroscopy, E. Pouyet, M. Cotte,
B. Fayard, L. Monico, J.Mass, G. Nuyts, M. Radepont, P.Sciau, ICXOM, Hamburg, Germany, 2-6
September 2013.
Combined synchrotron-based micro-spectroscopic analyses of painting thin-sections, E. Pouyet, M.
Cotte, B. Fayard, A. Lluveras-Tenorio, J. Mass, D. Saviello, A. Nevin, SSD2013, Val Cenis, France, 21-23
October 2013.
Synchrotron radiation-based microscopy and spectroscopy applied to the material science of art
objects, M. Cotte, E. Pouyet, B. Fayard, Analytical Spectroscopy in Art and Archaeology,
Technart2013, Rijksmuseum Amsterdam, Netherlands, 23-26 September 2013.
Synchrotron FTIR micro-spectroscopy analysis of ABS design objects after solar photo-oxidation, D.
Saviello, E. Pouyet, D. Comelli, S. Goidanich, M. Cotte, A. Nevin, L. Toniolo, Analytical Spectroscopy in
Art and Archaeology, Technart2013, Rijksmuseum Amsterdam, Netherlands, 23- 26 September 2013.
Investigation of potassium distribution and speciation in agricultural soils by combination of micro X-
ray fluorescence and micro X-ray absorption spectroscopy, C. Rivard, B. Lanson, B. Fayard, E. Pouyet
and M. Cotte, 50th Anniversary Annual Meeting of The Clay Minerals Society, Illinois, USA, 6–10
October, 2013.

186
2012
Analysis of artistic paintings by FTIR and X-ray microspectroscopy at the ID21 beamline, E. Pouyet,
M. Cotte, M. Salome, D. Bugnazet, B. Fayard, M. Radepont, Francesco Sette, European Synchrotron
Radiation Facility , YOCOCU, Antwerpen, Belgium, 18-20 June 2012.
Pushing the limits of X-ray absorption spectroscopy for the analysis of artistic materials, M. Cotte, E.
Pouyet, M. Radepont, B. Fayard, M. Salomé, V. De Andrade, Synchrotron Radiation in Art and
Archaeology, SR2A 2012, New York, USA, 6-8 June 2012.
2011
Synchrotron-based X-ray and FTIR micro-spectroscopy for the cultural heritage science at the ID21
beamline, ESRF, M. Cotte, M. Radepont, E. Pouyet, M. Salomé, J. Susini, International Atomic Energy
Agency Technical Meeting on Applications of synchrotron radiation sources for compositional and
structural characterization of objects in cultural heritage, forensics and materials science (TM40771),
IAEA Headquarters, Vienna, Austria, 17-21 October 2011.
POSTERS
The combination of FTIR and X-ray micro-spectroscopies for the analysis of thin sections of paintings
at the ID21 beamline, European Synchrotron Radiation Facility, E. Pouyet, M. Cotte, A. Burnstock, B.
Fayard, J. Kieffer, A. Lluveras, J. Mass, D. Saviello, A. Nevin, M. Salomé, K. Jan van den Berg., Poster,
Technart, Amsterdam, Netherlands, 23-26 September 2013.
Analysis of artistic materials by FTIR and X-ray microspectroscopy at the ID21 beamline, E. Pouyet,
M.Cotte, V. A. Solé, European Synchrotron Radiation Facility, IRUG, Barcela, Spain, 28-31 March
2012.
The combination of FTIR and X-ray microscopes for the analysis of artistic materials at the ID21
beamline, European Synchrotron Radiation Facility, E. Pouyet, M. Cotte, M. Salome, D. Bugnazet, B.
Fayard, M. Radepont, F. Sette, EMC, Manchester, United Kingdom, 16-21 September 2012.

187

Abstract Painting analyses necessitate micrometer approach in order to probe materials entering in the composition of these complex samples. In this context, analyses using synchrotron radiation allow revealing their complex and stratified structure at fine scale. In order to improve the quality and relevance of extracted information from painting fragment analyses, this PhD project aims at developing a new methodological approach, providing a more efficient and synergetic use of μFTIR and μX-ray microscopies. Usually, painting fragments are prepared as polished sections and analyses are carried out on the cross-section surface. This sample preparation is easy to handle, however ends into critical constraints regarding feasibility and efficiency of micro-analyses. We propose to explore a different strategy: the preparation and the analysis of thin-sections. These preparation procedures were first optimized and validated with µFTIR, µXRF, µXRD and µXANES. Besides, new methodological capabilities based on full-field/µXANES were assessed. Consequently, innovative strategies were carried out allowing a deeper characterization of sampled fragments presenting question on their history (manufacturing process, raw materials provenance, etc., as well as on their future (degradation, restoration treatments, etc.). Paintings were ideal candidates for estimating pros and cons of this new strategy for CH materials in general.
Résumé L’analyse de peintures necessite une approche micrometrique permettant de sonder les différents matériaux entrant dans la composition de ces échantillons complexes. Dans ce contexte, l’analyse de peinture par rayonnement synchrotron permet de reveler les compositions complexes et stratifiées de ces matériaux à très petite échelle. Dans le but d’ameliorer la qualite et la quantite d’informations extraites lors de l’analyse des fragments de peintures, ce projet de thèse vise à développer une nouvelle approche méthodologique dans le but d’ameliorer l’utilisation combinee de plusieurs techniques de microscopies infrarouge et X lors de l’analyse de fragments de peintures. Historiquement et ordinairement, les fragments de peintures sont préparés en coupes épaisses polies et les analyses sont réalisées à la surface de ces dernières. Bien que cette préparation d’echantillon facilite sa manipulation ainsi que son orientation lors des analyses, elle limite aussi l’efficacite et la faisabilite de certaines techniques de microscopie. Par conséquent, ce travail propose d’explorer une nouvelle strategie analytique : la preparation et l’analyse de coupes fines. Ces deux etapes ont ete optimisees et validees dans le cadre d’analyses par µFTIR, µXRD, µXRF et µXANES. En parallèle, de nouvelles possibilités analytiques ont été testees dans le cadre de l’analyse des peintures, basees sur la technique XANES plein champ. De nouvelles strategies ont donc ete mises en œuvre de maniere à caracteriser plus en détail les fragments prélevés présentant des questionnements sur leur histoire (techniques de fabrication, origine des matières premières, etc.) ou sur leur futur en devenir (dégradation, traitement de restaurations etc.). Les échantillons de peintures se sont révélés être d’excellents candidats pour évaluer les avantages et inconvénients de cette technique pour les matériaux du Patrimoine Culturel en général.