new mexico employment projections 2012-2022
TRANSCRIPT
New Mexico Department of Workforce Solutions • Economic Research & Analysis Bureau
New Mexico Employment Projections 2012-2022Growth Trends of New Mexico’s Industries and Occupations
ii 2012-2022 NEW MEXICO EMPLOYMENT PROJECTIONS REPORT
New MexicoEmployment Projections
2012-2022
NEW MEXICO DEPARTMENT OF WORKFORCE SOLUTIONS
Celina Bussey, Cabinet Secretary
Prepared byBUREAU OF ECONOMIC RESEARCH AND ANALYSIS
Rachel Moskowitz, Bureau Chief
November 2014
FOR FURTHER INFORMATION CONTACT:New Mexico Department of Workforce Solutions
Economic Research and Analysis BureauPO Box 1928
Albuquerque, NM 87103TELEPHONE: (505) 383-2729

NEW MEXICO DEPARTMENT OF WORKFORCE SOLUTIONS III
Introduction, Definitions & Methodology 1
Introduction 1
Definitions 4
Methodology 6
Data Limitations and Assumptions 7
New Mexico and Substate Area Industry Projections 9
New Mexico 10
Albuquerque MSA/Central Region 19
Farmington MSA 28
Las Cruces MSA 37
Santa Fe MSA 46
Eastern Region 55
Northern Region 65
Southwestern Region 75
New Mexico Occupational Projections 84
MSA and Region Detailed Occupation Employment Projections 112
Appendix A: MSA Detailed Occupation Employment Projections 112
Appendix B: Region Detailed Occupation Employment Projections 112
Appendices can be viewed at www dws state nm us/LMI
Table of Contents

1 2012-2022 NEW MEXICO EMPLOYMENT PROJECTIONS REPORT
Introduction, Definitions & Methodology
The New Mexico Department of Workforce Solutions (NMDWS) Economic Research and Analysis Bureau (ER&A) has completed and finalized long-term projections for the 2012 to 2022 period. New Mexico’s employment projections are produced in conjunction with the U.S. Department of Labor (US DOL), Bureau of Labor Statistics (BLS). Long-term projections have been prepared for New Mexico, its four metropolitan statistical areas (Albuquerque, Farmington, Las Cruces, and Santa Fe), and four Workforce Investment Act (WIA) regions (Central, Northern, Eastern, and Southwestern)
The data presented in this report are designed to assist students, job seekers, educators, employers, and public and private groups in their individual planning and reporting purposes. Employment growth and occupational job openings provide insight into key growth sectors and potential areas of decline in New Mexico’s labor market. Projections are presented for over 100 industries and just over 800 detailed occupations at the state and substate levels.
New Mexico Substate Areas
Introduction
NEW MEXICO DEPARTMENT OF WORKFORCE SOLUTIONS 2
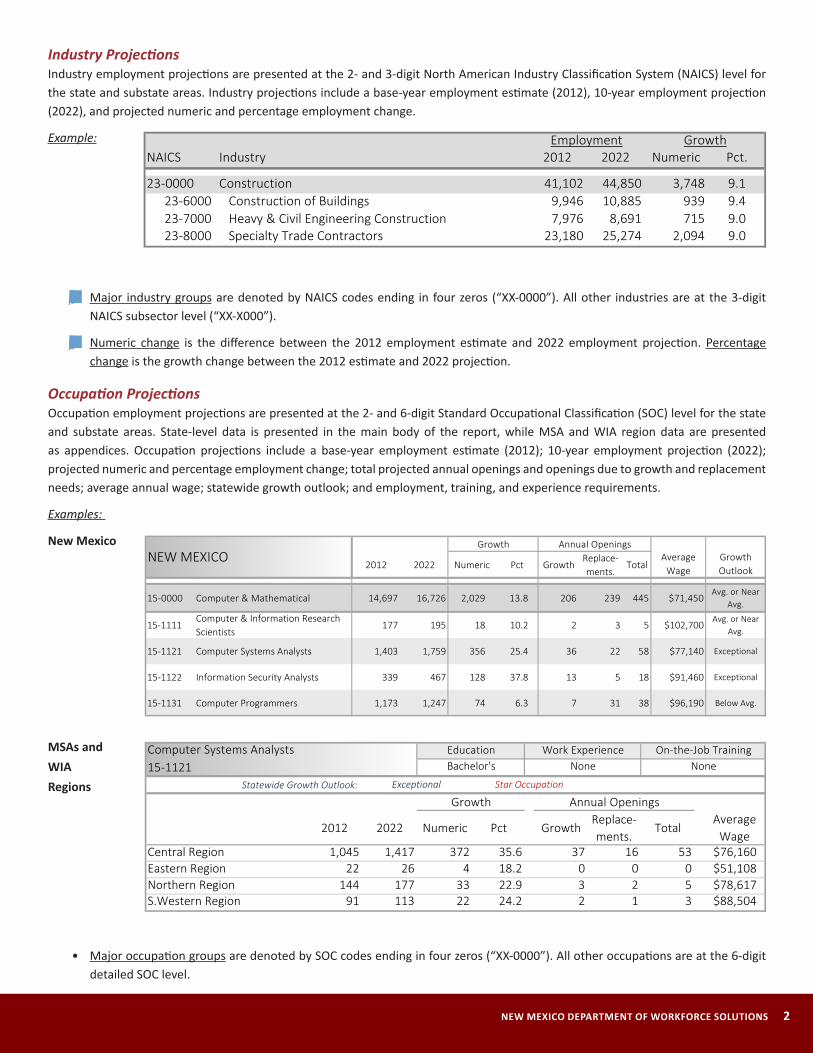
Industry ProjectionsIndustry employment projections are presented at the 2- and 3-digit North American Industry Classification System (NAICS) level for the state and substate areas. Industry projections include a base-year employment estimate (2012), 10-year employment projection (2022), and projected numeric and percentage employment change.
Example:
• Major industry groups are denoted by NAICS codes ending in four zeros (“XX-0000”) All other industries are at the 3-digit NAICS subsector level (“XX-X000”)
• Numeric change is the difference between the 2012 employment estimate and 2022 employment projection. Percentage change is the growth change between the 2012 estimate and 2022 projection.
Occupation ProjectionsOccupation employment projections are presented at the 2- and 6-digit Standard Occupational Classification (SOC) level for the state and substate areas State-level data is presented in the main body of the report, while MSA and WIA region data are presented as appendices. Occupation projections include a base-year employment estimate (2012); 10-year employment projection (2022); projected numeric and percentage employment change; total projected annual openings and openings due to growth and replacement needs; average annual wage; statewide growth outlook; and employment, training, and experience requirements.
Examples:
New Mexico
MSAs andWIARegions
• Major occupation groups are denoted by SOC codes ending in four zeros (“XX-0000”). All other occupations are at the 6-digit detailed SOC level
2012 2022 Numeric Pct GrowthReplace-ments.
Total
15-0000 Computer & Mathematical 14,697 16,726 2,029 13.8 206 239 445 $71,450Avg. or Near
Avg.
15-1111Computer & Information Research Scientists
177 195 18 10.2 2 3 5 $102,700Avg. or Near
Avg.
15-1121 Computer Systems Analysts 1,403 1,759 356 25.4 36 22 58 $77,140 Exceptional
15-1122 Information Security Analysts 339 467 128 37.8 13 5 18 $91,460 Exceptional
15-1131 Computer Programmers 1,173 1,247 74 6.3 7 31 38 $96,190 Below Avg.
NEW MEXICOGrowth Annual Openings
AverageWage
Growth Outlook
Statewide Growth Outlook:
2012 2022 Numeric Pct GrowthReplace-ments.
Total
Central Region 1,045 1,417 372 35.6 37 16 53 $76,160Eastern Region 22 26 4 18.2 0 0 0 $51,108Northern Region 144 177 33 22.9 3 2 5 $78,617S.Western Region 91 113 22 24.2 2 1 3 $88,504
15-1121 Bachelor's None NoneComputer Systems Analysts Education Work Experience On-the-Job Training
Exceptional Star Occupation
Growth Annual OpeningsAverage
Wage
NAICS Industry 2012 2022 Numeric Pct.
23-0000 Construction 41,102 44,850 3,748 9.123-6000 Construction of Buildings 9,946 10,885 939 9.423-7000 Heavy & Civil Engineering Construction 7,976 8,691 715 9.023-8000 Specialty Trade Contractors 23,180 25,274 2,094 9.0
Employment GrowthIntroduction, Definitions & Methodology
3 2012-2022 NEW MEXICO EMPLOYMENT PROJECTIONS REPORT
• Education, experience, and training classifications are provided at the 6-digit SOC level. Definitions of the classifications are provided in the Definitions section.
• Numeric change is the difference between the 2012 employment estimate and 2022 employment projection. Percentage change is the growth change between the 2012 estimate and 2022 projection.
• The statewide growth outlook is based on the statewide employment projection only and measures how quickly employment for a detailed occupation is projected to grow compared to the statewide, all-occupation growth rate. A detailed definition of the growth outlook is provided in the Definitions section.
• Annual growth openings represent the number of anticipated openings due to new job growth, while annual replacement openings represent the number of anticipated openings due to workers permanently leaving an occupation (due to promotion, retirement, death, etc.). Growth openings are newly created positions, while replacement openings represent openings from existing jobs, with no new jobs being created. Total annual openings are growth openings plus replacement openings Annual openings are calculated by dividing the total number of openings by 10 (the number of years in the projection period).
• The average annual wage is based on 2013 Occupational Employment Statistics (OES) survey data. For more information on the application of OES to occupation projections, see the Methodology section.
• The “Star Occupation” indicator notes when an occupation meets defined criteria set forth by ER&A regarding rate of growth, annual openings, and average wages. See the Definitions section for more information on how a Star Occupation is identified
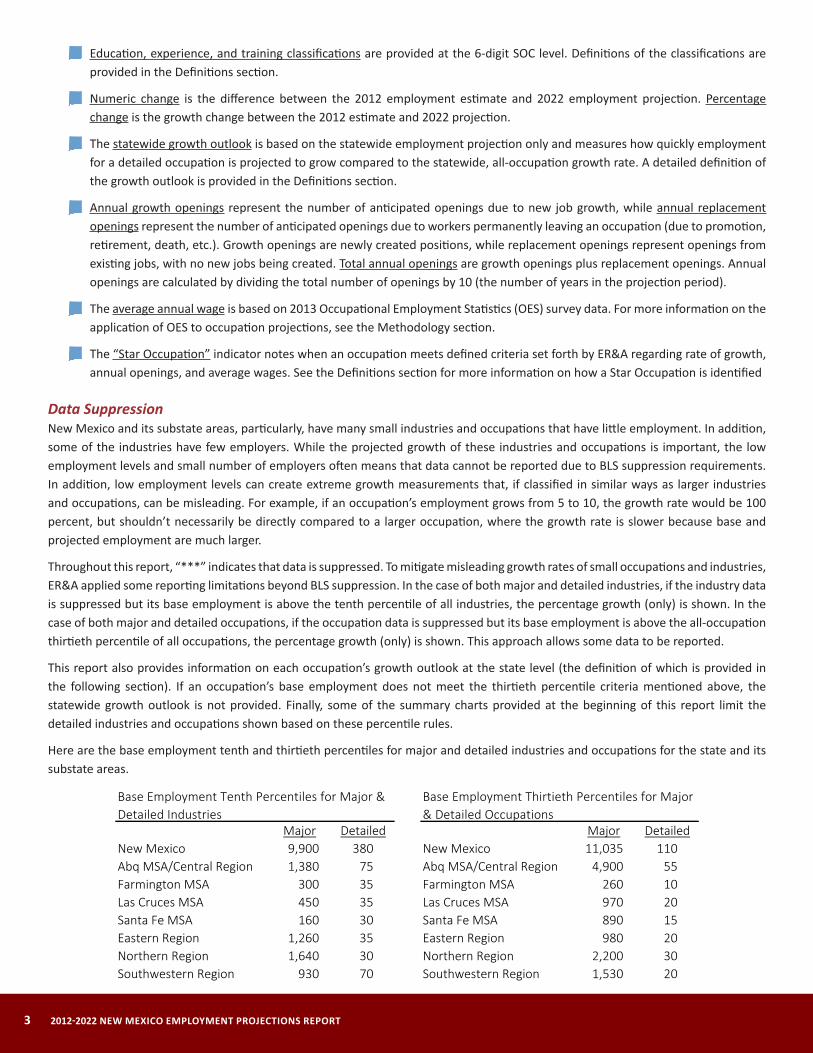
Data SuppressionNew Mexico and its substate areas, particularly, have many small industries and occupations that have little employment. In addition, some of the industries have few employers. While the projected growth of these industries and occupations is important, the low employment levels and small number of employers often means that data cannot be reported due to BLS suppression requirements. In addition, low employment levels can create extreme growth measurements that, if classified in similar ways as larger industries and occupations, can be misleading. For example, if an occupation’s employment grows from 5 to 10, the growth rate would be 100 percent, but shouldn’t necessarily be directly compared to a larger occupation, where the growth rate is slower because base and projected employment are much larger.
Throughout this report, “***” indicates that data is suppressed. To mitigate misleading growth rates of small occupations and industries, ER&A applied some reporting limitations beyond BLS suppression. In the case of both major and detailed industries, if the industry data is suppressed but its base employment is above the tenth percentile of all industries, the percentage growth (only) is shown. In the case of both major and detailed occupations, if the occupation data is suppressed but its base employment is above the all-occupation thirtieth percentile of all occupations, the percentage growth (only) is shown. This approach allows some data to be reported.
This report also provides information on each occupation’s growth outlook at the state level (the definition of which is provided in the following section). If an occupation’s base employment does not meet the thirtieth percentile criteria mentioned above, the statewide growth outlook is not provided Finally, some of the summary charts provided at the beginning of this report limit the detailed industries and occupations shown based on these percentile rules.
Here are the base employment tenth and thirtieth percentiles for major and detailed industries and occupations for the state and its substate areas
Major Detailed Major DetailedNew Mexico 9,900 380 New Mexico 11,035 110Abq MSA/Central Region 1,380 75 Abq MSA/Central Region 4,900 55Farmington MSA 300 35 Farmington MSA 260 10Las Cruces MSA 450 35 Las Cruces MSA 970 20Santa Fe MSA 160 30 Santa Fe MSA 890 15Eastern Region 1,260 35 Eastern Region 980 20Northern Region 1,640 30 Northern Region 2,200 30Southwestern Region 930 70 Southwestern Region 1,530 20
Base Employment Thirtieth Percentiles for Major & Detailed Occupations
Base Employment Tenth Percentiles for Major & Detailed Industries
NEW MEXICO DEPARTMENT OF WORKFORCE SOLUTIONS 4
Education and Training ClassificationsBLS uses a system to assign categories for entry-level education, work experience in a related occupation, and typical on-the-job training to each occupation for which BLS publishes projections data. The assignments allow occupations to be grouped to create estimates of the education and training needs for the labor force as a whole and estimates of the outlook for occupations with various types of education and training needs. New Mexico applies this information to its statewide and substate occupation projections. For more information on education and training classifications visit http://www.bls.gov/emp/ep_education_tech.htm
• Education: The level of education typically required for entry into the occupation. Categories are as follows:
Doctoral or professional degree: degree awarded usually for at least 3 years of full-time academic work beyond a bachelor’s degree; e.g., lawyers, physicians and surgeons, and dentists
Master’s degree: degree awarded usually for 1 or 2 years of full-time academic study beyond a bachelor’s degree
Bachelor’s degree: degree awarded usually for at least 4 years of full-time academic study beyond high school
Associate’s degree: degree awarded usually for at least 2 years of full-time academic study beyond high school
Postsecondary non-degree award: usually a certificate or other award that is not a degree. Certifications issued by professional organizations or certifying bodies are not included in this category. Programs may last only a few weeks to 2 years. e.g., nursing assistants, emergency medical technicians (EMTs) and paramedics, and hairstylists
Some college, no degree: a high school diploma or the equivalent, plus the completion of one or more postsecondary courses that did not result in any degree or award
High school diploma or equivalent: the completion of high school or the equivalent resulting in the award of a high school diploma or the equivalent, such as the General Education Development (GED) credential
Less than high school: the completion of any level of primary or secondary education that did not result in the awarding of a high school diploma or the equivalent
• Work experience in a related occupation (“Work Experience”): the level of work experience in an occupation related to a given occupation; the work experience captures work experience that is commonly considered necessary by employers or is a commonly accepted substitute for other, more formal types of training or education. Categories are as follows:
Five years or more: the number of years of experience in a related occupation typically needed for entry into a given occupation is more than 5 years
Less than 5 years: the number of years of experience in a related occupation typically needed for entry into a given occupation is less than 5 years
None: No work experience in a related occupation is typically needed for entry.
• On-the-job training: training or preparation that is typically needed, once employed in an occupation, to attain competency in the occupation. Training is occupation-specific rather than job-specific; skills learned can be transferred to another job in the same occupation. Categories are as follows:
Internship/Residency: training that involves preparation in a field such as medicine or teaching, generally under supervision in a professional setting, such as a hospital or classroom. This type of training may occur before one is employed. Completion of an internship or residency program is commonly required for state licensure or certification in fields including medicine, counseling, architecture, and teaching This category does not include internships that are suggested for advancement
Apprenticeship: a formal relationship between a worker and sponsor that consists of a combination of on-the-job training and related occupation-specific instruction in which the workers learns the practical and theoretical aspects of an occupation.
Definitions
5 2012-2022 NEW MEXICO EMPLOYMENT PROJECTIONS REPORT
Apprenticeship programs are sponsored by individual employers, joint employer-and-labor groups, and employee associations. Apprenticeship programs usually provide at least 144 hours of occupation-specific technical instruction and 2,000 hours of on-the-job training per year over a 3- to-5-year period. Examples of occupations that utilize apprenticeships include electricians and structural iron and steel workers
Long-term on-the-job training: more than 12 months of on-the-job training or, alternatively, combined work experience and formal classroom instruction, are needed for workers to develop the skills to attain competency. This on-the-job training category also includes employer-sponsored training programs. Such programs include those offered by fire academies and schools for air traffic controllers. In other occupations—nuclear power reactor operators, for example—trainees take formal courses, often provided at the jobsite, to prepare for the required licensing exams. This category also includes occupations in which workers typically need to possess a natural ability or talent—including musicians and singers, athletes, dancers, photographers, and actors—and that ability or talent must be cultivated over several years, sometimes in a non-work setting. This category excludes apprenticeships.
Moderate-term on-the-job training: more than 1 month and up to 12 months of combined on-the-job experience and informal training is needed for the worker to develop the skills to attain competency; this on-the-job training category also includes employer-sponsored training programs
Short-term on-the-job training: 1 month or less of combined on-the-job experience and informal training is needed for the worker to develop the skills to attain competency; this on-the-job training category also includes employer-sponsored training programs
None: no additional occupation-specific training or preparation is typically required to attain competency in the occupation.
Statewide Growth OutlookThe statewide growth outlook is used to express the relative rate of growth of a particular industry or occupation based on how that industry or occupation’s growth rate compares to the all-industry or all-occupation average. The projected all-industry/all-occupation growth rate for New Mexico is 12.0 percent. Note that this is an indicator of employment growth and not projected openings. Small employment growth in a large occupation can result in far more openings than faster growth in a small occupation.
Exceptional Growth: Employment is projected to increase by 24.1 percent or more.
High Growth: Employment is projected to increase between 15.1 and 24.0 percent.
Average to Near Average Growth: Employment is projected to increase between 9.1 and 15.0 percent.
Below Average Growth: Employment is projected to increase between 0.1 and 9.0 percent.
Zero to Declining Growth: Employment is projected to not grow or decline.
Note that for industries where base employment is below the tenth percentile for all industries, and for occupations where base employment is below the thirtieth percentile, a statewide growth outlook is not identified. This is implemented to recognize extreme growth rates in small industries and occupations that may give a misleading perception of growth.
Growth and Replacement OpeningsProjections of job growth provide valuable insight into future employment opportunities because each new job created is an opening for a worker entering an occupation. However, opportunities also arise when workers leave their occupations (not just their job) and need to be replaced. In most occupations, replacement needs provide many more job openings than employment growth does.
Replacement openings estimate the difference between the movement of workers who change jobs to enter other occupations, retire, or leave the workforce for other reasons and the movement of workers filling the openings, resulting in a net replacement number. Because workers entering an occupation often need training, these replacement needs, added to job openings due to growth, may be used to assess the minimum number of workers who will need to be trained for the occupation. This estimate of replacement needs does not count workers who change jobs but remain in the same occupation, and, therefore, should not be used as a measurement of turnover
States apply replacement rates based on those calculated at the national level. BLS uses occupational employment data from the Current Population Survey (CPS), a household survey that collects demographic and employment information about individuals and
NEW MEXICO DEPARTMENT OF WORKFORCE SOLUTIONS 6
measures the net change in occupational employment for 13 different age cohorts over a 5-year period. After calculating net change by age cohort, BLS estimates historical replacement needs. For more information on the methodology of calculating replacement needs, visit http://www.bls.gov/emp/ep_replacements.htm
Note that the demand for new workers in an occupation is underestimated when looking at projected openings because openings are based on net changes and do not capture the gross flows into and out of an occupation. If employment in an occupation is projected to decline, the number of openings resulting from growth is zero, and replacement openings are the only source of employment opportunities.
Star OccupationsThe information provided on industry and occupational growth is vast and detailed. ER&A applies a specific methodology to detailed occupation projections in order to identify “Star Occupations,” or those that meet multiple positive criteria related to employment growth. The purpose of this identification process is to assist users in easily noting key occupational opportunities for students, job seekers, and educators. These occupations are some of the fastest growing, with the most annual openings and the highest median wages
This report identifies Star Occupations at the state level. Occupations are ranked based on three criteria: (1) employment growth rate (must be above 12.0, the all-occupation average); (2) number of annual job openings (must be above 50); and (3) median annual wage (must be above the all-occupation median of $31,490 as of 2013). A combined ranking is calculated for each occupation based on these three criteria, and occupations that rank among the highest are identified as Star Occupations.
The projections in this report are based on methodologies developed by US DOL for forecasting state and area occupational needs using both national information and procedures specifically adapted to each state’s industrial and occupational patterns. ER&A utilizes the Projections Suite software system, which is a national standard product of the Projections Workgroup, under the direction of the Projections Managing Partnership (PMP). The PMP works in cooperation with the Employment and Training Administration of US DOL. The Projections Suite is developed by the Utah Department of Workforce Services, Workforce Information Division, Systems Research & Analysis. Industry employment projections are developed through simple time-share, shift-share, extrapolation, and regression model analysis using state-specific inputs. Occupational projections are prepared by applying occupational staffing patterns for each industry to industry employment projections. The staffing patterns used are derived from information collected by the OES survey.
Industry employment measured in the projection process is primarily derived from employment reported at the establishment level through the Quarterly Census of Employment and Wages (QCEW) program, at the 2- and 3-digit NAICS level Because QCEW data captures only those workers covered by unemployment insurance, QCEW data is supplemented with employment data from the Current Employment Statistics (CES) program, the U.S. Census Bureau, Bureau of Economic Analysis (BEA), and the Census of Agriculture. Employment projection inputs measure wage and salary workers, as well as self-employed and unpaid family workers, farmers and farm workers, private household workers, and other residual employment. Therefore, base employment estimates used for projections will likely differ from those reported by other sources, including QCEW. In addition, some industries incorporate both private- and public-sector employment in order to comply with the methods used to collect occupational staffing patterns. For example, state and local government educational services employment is included in the educational services sector in the projections process, but is actually included in the government sector in QCEW
Occupation employment and projections are derived by applying staffing patterns (the distribution of occupations by industry) developed through the OES survey. In cases where OES survey responses are low or missing in a particular industry, national staffing patterns or patterns from earlier OES surveys are substituted. Staffing patterns for industries not covered by the OES survey are derived from other sources, such as the U.S. Census Bureau. Occupational estimates for self-employed and unpaid family workers are not industry-specific, and are reported as one sector, as opposed to being distributed across industries.
When industry and occupational staffing patterns are merged to project occupational employment, BLS national occupational change factors (the projected change in the distribution of occupations within an industry) are applied to produce new occupational staffing
Methodology

7 2012-2022 NEW MEXICO EMPLOYMENT PROJECTIONS REPORT
patterns. The new patterns are adjusted to equal the projected employment by industry. The projected employment of an occupation, therefore, is based on changes in the proportion of workers in the occupation in each industry and the growth rates of the industries in which employment in that occupation is found.
For more detailed information on projections methodology visit http://www.bls.gov/emp/ep_projections_methods.htm and https://support.projectionscentral.com/
Projections produced by ER&A necessarily have some limitations that should be acknowledged any time the data is used. Long-term projections report what is likely to happen if historical and state-level employment patterns continue on their historical growth trends; this includes trends in population, labor force, productivity, and economic growth. These projections do not take into consideration major shocks to the economy, and assume that employment will ultimately return to levels that fit long-term growth trends. The projections process assumes the (1) institutional framework of the economy will not radically change; (2) current technological, scientific, and social trends will continue; and (3) major events (e.g. natural disasters, terrorist attacks, conventional wars) will not be significant enough to alter the industrial structure of the economy or its growth. New developments will undoubtedly, however, impact the labor market in unexpected ways. Certain industries are also particularly sensitive to business cycles, and their employment can be more difficult to project. Because of these assumptions, projections are designed to provide general magnitudes and probable directional changes in employment rather than precise predictions of actual employment developments.
Other assumptions and limitations include the following:
• Projections measure occupational demand only, not supply of labor. Projections, therefore, should be utilized as a starting point in evaluating occupational surpluses and shortages in the labor market and should be coupled with other data measurements for such purposes
• Employment projections are based on place-of-work and count the number of jobs (including full and part-time) as opposed to the number of workers. The total number of projected jobs will exceed the number of employed workers in the labor force due to persons holding more than one job or commuting from other states for work.
• Projected employment growth or decline will not be consistent over the 10-year projection period. At the same time, growth rates could be interpreted as either recovery growth or post-recovery growth, depending on how each industry or occupation is impacted by a recession or depression
• Projections are more reliable at the major industry and occupation groups.
• National assumptions include the following: • the labor force will grow at the same rate as during
the past 10-year period;
• productivity will grow faster than before;
• the unemployment rate will remain constant;
• trade deficits will increase;
• a Federal budget surplus will exist;
• Federal spending programs will grow moderately;
• consumer spending on durable goods will grow faster than average;
• spending on food and beverages will grow more slowly than the average for all consumer expenditures;
• health care and other services spending will grow faster than average;
• investment in production equipment will grow quickly; and
• residential construction will grow with the population, while nonresidential construction will make a comeback from depressed levels seen during the previous 10 years
Data Limitations and Assumptions
NEW MEXICO DEPARTMENT OF WORKFORCE SOLUTIONS 8
• State assumptions include the following:
• New Mexico population growth will closely track the national average;
• personal incomes will continue to grow moderately;
• tourism will increase due to promotion, special events, and the state’s unique appeal;
• federal government spending for both defense and non-defense purposes will remain at roughly the current level;
• natural resources will play a larger role in the New Mexico economy than in the recent past
due to higher prices, demand, and other factors such as technology improvements;
• employment in the manufacturing sector will maintain its share of between 4 and 5 percent of non-farm employment; and
• manufacturing employment will grow in absolute terms as manufacturing and other companies relocate to New Mexico and existing businesses expand their operations due to extensive recruitment campaigns, an ample supply of labor at relatively low wage scales, favorable living conditions, and other considerations.
9 2012-2022 NEW MEXICO EMPLOYMENT PROJECTIONS REPORT
New Mexico and Substate Area Industry Projections
NEW MEXICO DEPARTMENT OF WORKFORCE SOLUTIONS 10
New Mexico Industry Projections
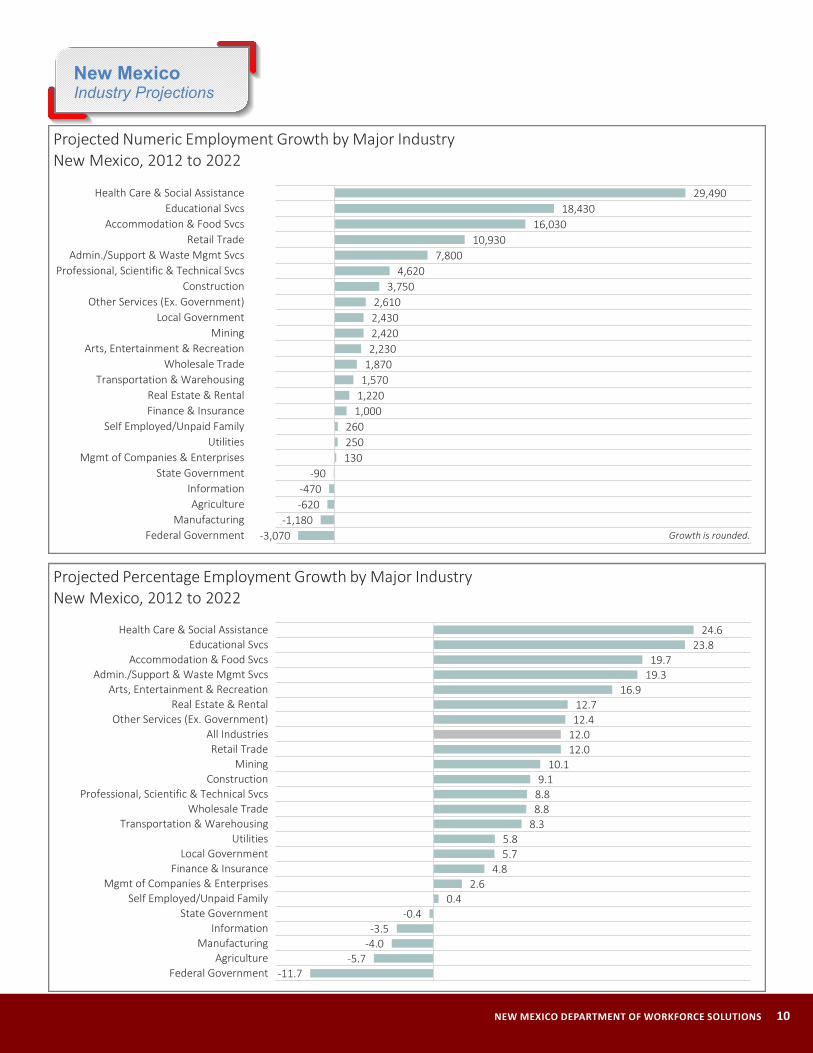
-3,070-1,180
-620-470
-90130250260
1,0001,2201,5701,8702,2302,4202,4302,610
3,7504,620
7,80010,930
16,03018,430
29,490
Federal GovernmentManufacturing
AgricultureInformation
State GovernmentMgmt of Companies & Enterprises
UtilitiesSelf Employed/Unpaid Family
Finance & InsuranceReal Estate & Rental
Transportation & WarehousingWholesale Trade
Arts, Entertainment & RecreationMining
Local GovernmentOther Services (Ex. Government)
ConstructionProfessional, Scientific & Technical Svcs
Admin./Support & Waste Mgmt SvcsRetail Trade
Accommodation & Food SvcsEducational Svcs
Health Care & Social Assistance
Projected Numeric Employment Growth by Major IndustryNew Mexico, 2012 to 2022
Growth is rounded.
-11.7-5.7
-4.0-3.5
-0.40.4
2.64.8
5.75.8
8.38.88.89.1
10.112.012.012.412.7
16.919.319.7
23.824.6
Federal GovernmentAgriculture
ManufacturingInformation
State GovernmentSelf Employed/Unpaid Family
Mgmt of Companies & EnterprisesFinance & Insurance
Local GovernmentUtilities
Transportation & WarehousingWholesale Trade
Professional, Scientific & Technical SvcsConstruction
MiningRetail Trade
All IndustriesOther Services (Ex. Government)
Real Estate & RentalArts, Entertainment & Recreation
Admin./Support & Waste Mgmt SvcsAccommodation & Food Svcs
Educational SvcsHealth Care & Social Assistance
Projected Percentage Employment Growth by Major IndustryNew Mexico, 2012 to 2022
11 2012-2022 NEW MEXICO EMPLOYMENT PROJECTIONS REPORT
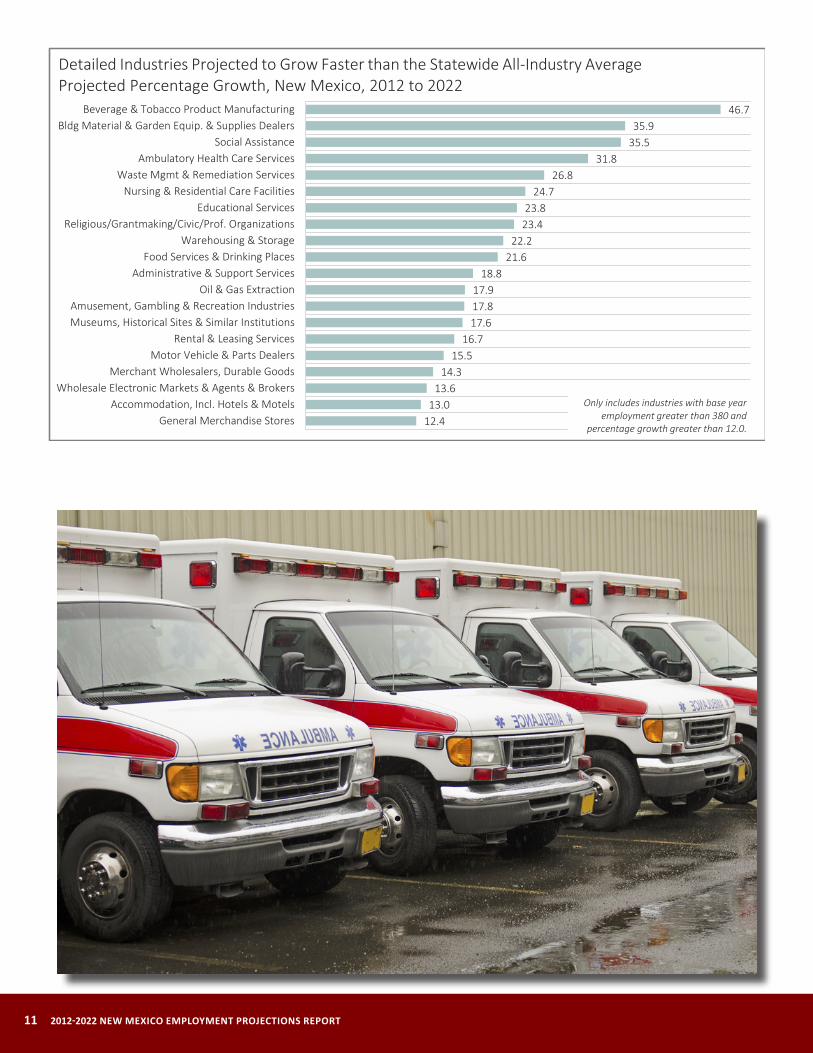
12.413.0
13.614.3
15.516.7
17.617.817.9
18.821.6
22.223.423.8
24.726.8
31.835.535.9
46.7
General Merchandise StoresAccommodation, Incl. Hotels & Motels
Wholesale Electronic Markets & Agents & BrokersMerchant Wholesalers, Durable Goods
Motor Vehicle & Parts DealersRental & Leasing Services
Museums, Historical Sites & Similar InstitutionsAmusement, Gambling & Recreation Industries
Oil & Gas ExtractionAdministrative & Support Services
Food Services & Drinking PlacesWarehousing & Storage
Religious/Grantmaking/Civic/Prof. OrganizationsEducational Services
Nursing & Residential Care FacilitiesWaste Mgmt & Remediation Services
Ambulatory Health Care ServicesSocial Assistance
Bldg Material & Garden Equip. & Supplies DealersBeverage & Tobacco Product Manufacturing
Only includes industries with base year employment greater than 380 and
percentage growth greater than 12.0.
Detailed Industries Projected to Grow Faster than the Statewide All-Industry AverageProjected Percentage Growth, New Mexico, 2012 to 2022

NEW MEXICO DEPARTMENT OF WORKFORCE SOLUTIONS 12
NAICS Industry 2012 2022 Numeric Pct.
All Industries 845,376 946,988 101,612 12.0
11-0000 Agriculture 10,901 10,283 -618 -5.7
11-1000 Crop Production 2,940 2,567 -373 -12.7
11-2000 Animal Production 5,541 5,410 -131 -2.4
11-3000 Forestry & Logging *** *** *** ***
11-5000 Support Activities for Agriculture & Forestry 2,366 2,256 -110 -4.6
21-0000 Mining 23,988 26,403 2,415 10.1
21-1000 Oil & Gas Extraction 5,036 5,938 902 17.9
21-2000 Mining (Ex. Oil & Gas) 5,109 5,265 156 3.1
21-3000 Support Activities for Mining 13,843 15,200 1,357 9.8
22-0000 Utilities 4,383 4,636 253 5.8
22-1000 Utilities 4,383 4,636 253 5.8
23-0000 Construction 41,102 44,850 3,748 9.1
23-6000 Construction of Buildings 9,946 10,885 939 9.4
23-7000 Heavy & Civil Engineering Construction 7,976 8,691 715 9.0
23-8000 Specialty Trade Contractors 23,180 25,274 2,094 9.0
31-0000 Manufacturing 29,650 28,470 -1,180 -4.0
31-1000 Food Manufacturing 5,560 5,778 218 3.9
31-2000 Beverage & Tobacco Product Manufacturing 555 814 259 46.7
31-3000 Textile Mills 62 50 -12 -19.4
31-4000 Textile Product Mills 103 81 -22 -21.4
31-5000 Apparel Manufacturing 72 31 -41 -56.9
31-6000 Leather & Allied Product Manufacturing 30 19 -11 -36.7
32-1000 Wood Product Manufacturing 856 892 36 4.2
32-2000 Paper Manufacturing 531 483 -48 -9.0
32-3000 Printing & Related Support Activities 794 612 -182 -22.9
32-4000 Petroleum & Coal Products Manufacturing 760 749 -11 -1.4
32-5000 Chemical Manufacturing 1,295 1,407 112 8.6
32-6000 Plastics & Rubber Products Manufacturing 832 803 -29 -3.5
32-7000 Nonmetallic Mineral Product Manufacturing 1,709 1,510 -199 -11.6
33-1000 Primary Metal Manufacturing 404 358 -46 -11.4
33-2000 Fabricated Metal Product Manufacturing 2,698 2,961 263 9.7
33-3000 Machinery Manufacturing 1,171 1,083 -88 -7.5
33-4000 Computer & Electronic Product Manufacturing 7,702 6,701 -1,001 -13.0
33-5000 Electrical Equip., Appliance & Component Mfg 506 436 -70 -13.8
33-6000 Transportation Equip. Manufacturing 1,379 1,382 3 0.2
33-7000 Furniture & Related Product Manufacturing 664 548 -116 -17.5
33-9000 Miscellaneous Manufacturing 1,967 1,772 -195 -9.9
42-0000 Wholesale Trade 21,416 23,290 1,874 8.8
42-3000 Merchant Wholesalers, Durable Goods 11,330 12,953 1,623 14.3
42-4000 Merchant Wholesalers, Nondurable Goods 8,176 8,167 -9 -0.1
42-5000 Wholesale Electronic Markets & Agents & Brokers 1,910 2,170 260 13.6
44-0000 Retail Trade 90,983 101,917 10,934 12.0
44-1000 Motor Vehicle & Parts Dealers 12,290 14,197 1,907 15.5
45-2000 Furniture & Home Furnishings Stores 2,084 2,268 184 8.8
44-3000 Electronics & Appliance Stores 2,743 2,897 154 5.6
44-4000 Bldg Material & Garden Equip. & Supplies Dealers 7,689 10,452 2,763 35.9
2012-2022New Mexico Industry Employment Projections
Employment Growth

13 2012-2022 NEW MEXICO EMPLOYMENT PROJECTIONS REPORT
NAICS Industry 2012 2022 Numeric Pct.
44-5000 Food & Beverage Stores 14,165 15,422 1,257 8.9
44-6000 Health & Personal Care Stores 4,660 5,136 476 10.2
44-7000 Gasoline Stations 7,504 8,172 668 8.9
44-8000 Clothing & Clothing Accessories Stores 6,256 6,809 553 8.8
45-1000 Sporting Goods, Hobby, Book & Music Stores 3,262 3,547 285 8.7
45-2000 General Merchandise Stores 22,605 25,417 2,812 12.4
45-3000 Miscellaneous Store Retailers 5,924 6,071 147 2.5
45-4000 Nonstore Retailers 1,801 1,529 -272 -15.1
48-0000 Transportation & Warehousing 18,862 20,427 1,565 8.3
48-1000 Air Transportation 1,189 1,194 5 0.4
48-2000 Rail Transportation *** *** *** 0.8
48-4000 Truck Transportation 7,459 8,122 663 8.9
48-5000 Transit & Ground Passenger Transportion 2,603 2,831 228 8.8
48-6000 Pipeline Transportation 203 104 -99 -48.8
48-7000 Scenic & Sightseeing Transportation 142 123 -19 -13.4
48-8000 Support Activities for Transportation 2,030 2,260 230 11.3
49-1100 Postal Service 3,252 2,670 -582 -17.9
49-2000 Couriers & Messengers 2,042 2,264 222 10.9
49-3000 Warehousing & Storage 1,444 1,765 321 22.2
51-0000 Information 13,513 13,040 -473 -3.5
51-1000 Publishing Industries (Ex. Internet) 2,024 1,774 -250 -12.4
51-2000 Motion Picture & Sound Recording Industries 3,247 3,086 -161 -5.0
51-5000 Broadcasting (Ex. Internet) 1,296 1,138 -158 -12.2
51-7000 Telecommunications 6,289 6,342 53 0.8
51-8000 Data Processing, Hosting & Related Services 393 392 -1 -0.3
51-9000 Other Information Services 264 308 44 16.7
52-0000 Finance & Insurance 20,893 21,892 999 4.8
52-2000 Credit Intermediation & Related Activities 12,224 12,800 576 4.7
52-3000 Securities/Commodity Contracts/Other Investments 1,551 1,619 68 4.4
52-4000 Insurance Carriers & Related Activities 6,925 7,233 308 4.4
52-5000 Funds, Trusts & Other Financial Vehicles 193 240 47 24.4
53-0000 Real Estate & Rental 9,648 10,870 1,222 12.7
53-1000 Real Estate 6,178 6,820 642 10.4
53-2000 Rental & Leasing Services 3,470 4,050 580 16.7
54-0000 Professional, Scientific & Technical Svcs 52,422 57,042 4,620 8.8
54-1000 Professional, Scientific & Technical Services 52,422 57,042 4,620 8.8
55-0000 Management of Companies & Enterprises 4,984 5,116 132 2.6
55-1000 Management of Companies & Enterprises 4,984 5,116 132 2.6
56-0000 Admin./Support & Waste Mgmt Svcs 40,485 48,286 7,801 19.3
56-1000 Administrative & Support Services 38,192 45,378 7,186 18.8
56-2000 Waste Mgmt & Remediation Services 2,293 2,908 615 26.8
61-0000 Educational Svcs 77,564 95,989 18,425 23.8
61-1000 Educational Services 77,564 95,989 18,425 23.8
62-0000 Health Care & Social Assistance 120,000 149,487 29,487 24.6
62-1000 Ambulatory Health Care Services 45,632 60,123 14,491 31.8
62-2000 Hospitals 35,576 38,290 2,714 7.6
62-3000 Nursing & Residential Care Facilities 13,684 17,064 3,380 24.7
62-4000 Social Assistance 25,108 34,010 8,902 35.5
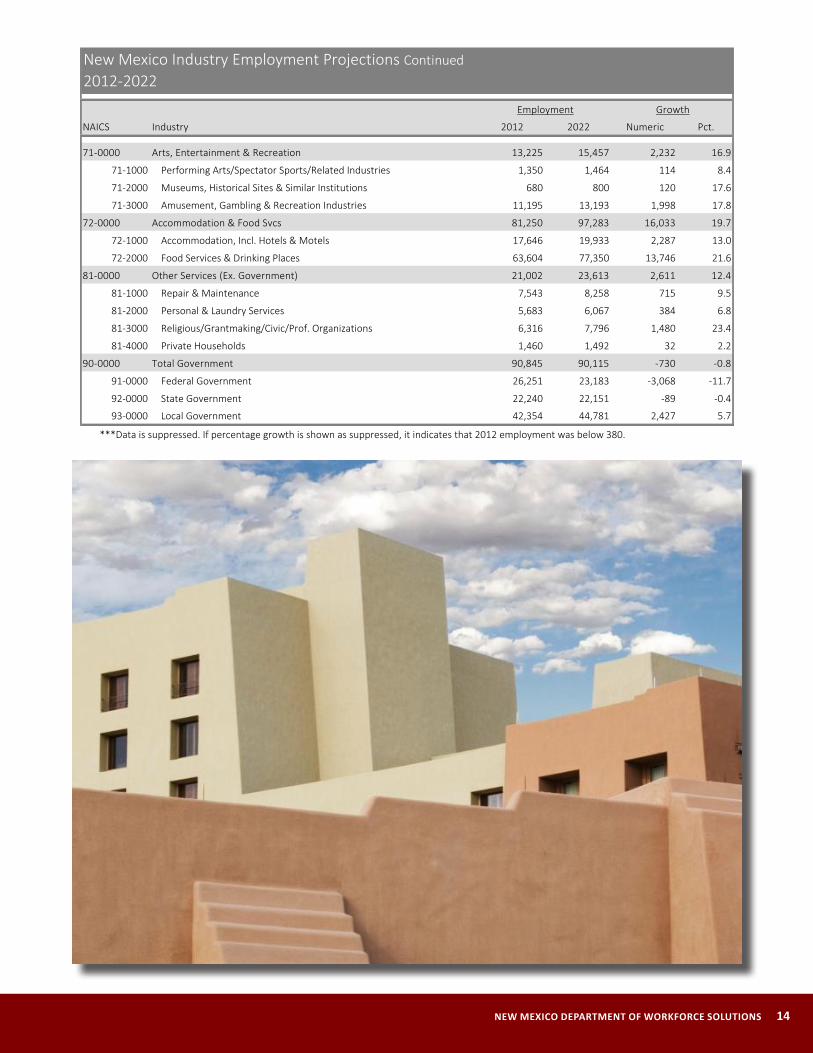
New Mexico Industry Employment Projections Continued 2012-2022
Employment Growth
NEW MEXICO DEPARTMENT OF WORKFORCE SOLUTIONS 14
NAICS Industry 2012 2022 Numeric Pct.
71-0000 Arts, Entertainment & Recreation 13,225 15,457 2,232 16.9
71-1000 Performing Arts/Spectator Sports/Related Industries 1,350 1,464 114 8.4
71-2000 Museums, Historical Sites & Similar Institutions 680 800 120 17.6
71-3000 Amusement, Gambling & Recreation Industries 11,195 13,193 1,998 17.8
72-0000 Accommodation & Food Svcs 81,250 97,283 16,033 19.7
72-1000 Accommodation, Incl. Hotels & Motels 17,646 19,933 2,287 13.0
72-2000 Food Services & Drinking Places 63,604 77,350 13,746 21.6
81-0000 Other Services (Ex. Government) 21,002 23,613 2,611 12.4
81-1000 Repair & Maintenance 7,543 8,258 715 9.5
81-2000 Personal & Laundry Services 5,683 6,067 384 6.8
81-3000 Religious/Grantmaking/Civic/Prof. Organizations 6,316 7,796 1,480 23.4
81-4000 Private Households 1,460 1,492 32 2.2
90-0000 Total Government 90,845 90,115 -730 -0.8
91-0000 Federal Government 26,251 23,183 -3,068 -11.7
92-0000 State Government 22,240 22,151 -89 -0.4
93-0000 Local Government 42,354 44,781 2,427 5.7
***Data is suppressed. If percentage growth is shown as suppressed, it indicates that 2012 employment was below 380.
New Mexico Industry Employment Projections Continued2012-2022
Employment Growth
15 2012-2022 NEW MEXICO EMPLOYMENT PROJECTIONS REPORT
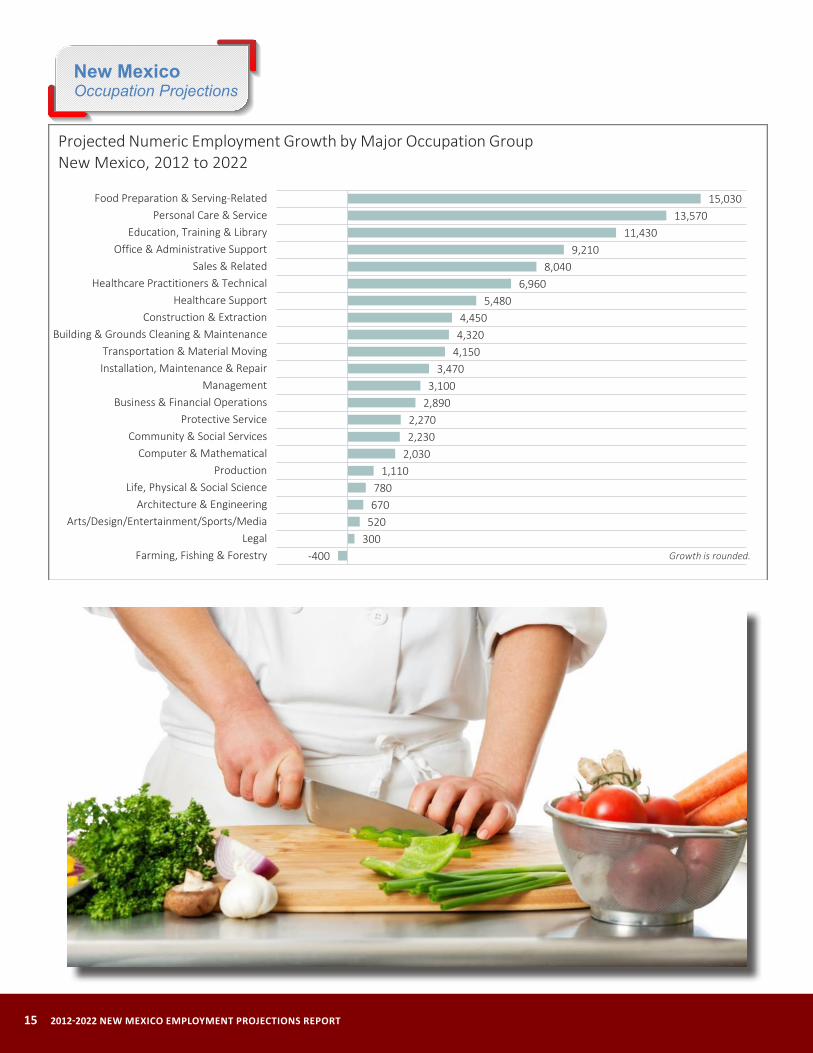
New Mexico Occupation Projections
-400300520670780
1,1102,0302,2302,270
2,8903,100
3,4704,1504,3204,450
5,4806,960
8,0409,210
11,43013,570
15,030
Farming, Fishing & ForestryLegal
Arts/Design/Entertainment/Sports/MediaArchitecture & Engineering
Life, Physical & Social ScienceProduction
Computer & MathematicalCommunity & Social Services
Protective ServiceBusiness & Financial Operations
ManagementInstallation, Maintenance & RepairTransportation & Material Moving
Building & Grounds Cleaning & MaintenanceConstruction & Extraction
Healthcare SupportHealthcare Practitioners & Technical
Sales & RelatedOffice & Administrative Support
Education, Training & LibraryPersonal Care & Service
Food Preparation & Serving-Related
Growth is rounded.
Projected Numeric Employment Growth by Major Occupation GroupNew Mexico, 2012 to 2022
NEW MEXICO DEPARTMENT OF WORKFORCE SOLUTIONS 16
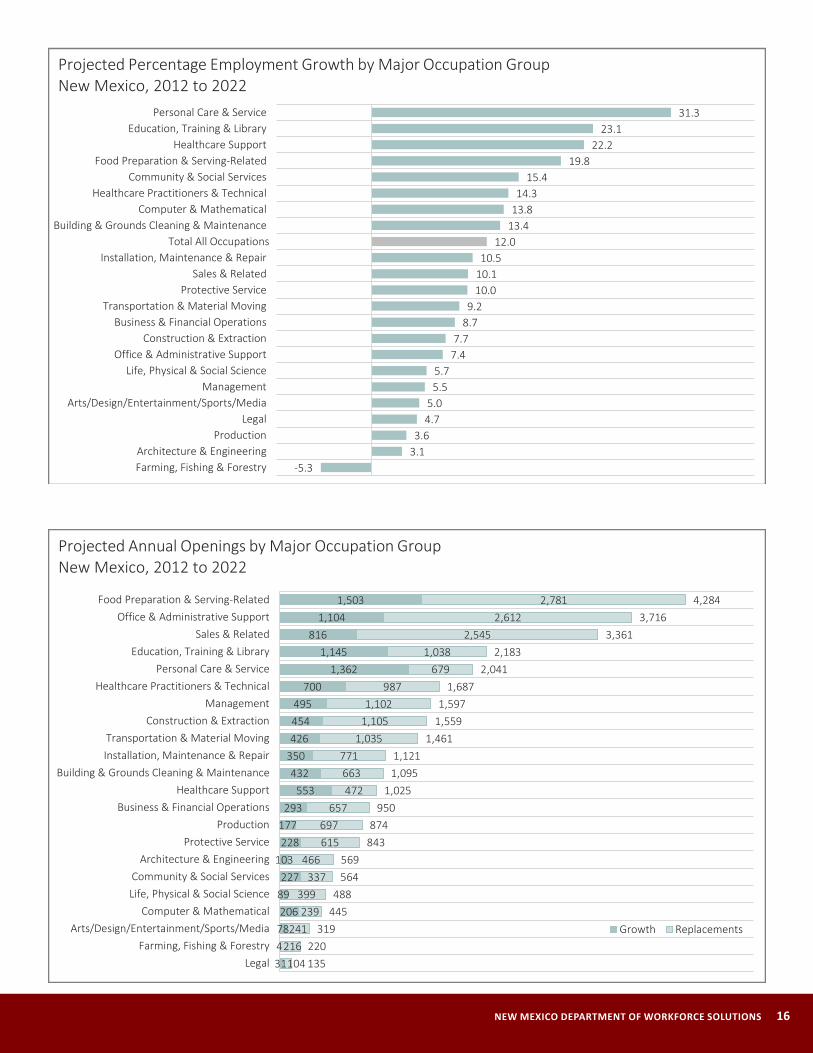
-5.33.13.6
4.75.0
5.55.7
7.47.7
8.79.2
10.010.110.5
12.013.413.814.3
15.419.8
22.223.1
31.3
Farming, Fishing & ForestryArchitecture & Engineering
ProductionLegal
Arts/Design/Entertainment/Sports/MediaManagement
Life, Physical & Social ScienceOffice & Administrative Support
Construction & ExtractionBusiness & Financial Operations
Transportation & Material MovingProtective Service
Sales & RelatedInstallation, Maintenance & Repair
Total All OccupationsBuilding & Grounds Cleaning & Maintenance
Computer & MathematicalHealthcare Practitioners & Technical
Community & Social ServicesFood Preparation & Serving-Related
Healthcare SupportEducation, Training & Library
Personal Care & Service
Projected Percentage Employment Growth by Major Occupation GroupNew Mexico, 2012 to 2022
3147820689227
103228177
293553
432350426454495
7001,362
1,145816
1,1041,503
104216
241239
399337
466615697
657472663771
1,0351,1051,102
987679
1,0382,545
2,6122,781
135220
319445488
564569
843874
9501,025
1,0951,121
1,4611,5591,597
1,6872,041
2,1833,361
3,7164,284
LegalFarming, Fishing & Forestry
Arts/Design/Entertainment/Sports/MediaComputer & Mathematical
Life, Physical & Social ScienceCommunity & Social Services
Architecture & EngineeringProtective Service
ProductionBusiness & Financial Operations
Healthcare SupportBuilding & Grounds Cleaning & Maintenance
Installation, Maintenance & RepairTransportation & Material Moving
Construction & ExtractionManagement
Healthcare Practitioners & TechnicalPersonal Care & Service
Education, Training & LibrarySales & Related
Office & Administrative SupportFood Preparation & Serving-Related
Growth Replacements
Projected Annual Openings by Major Occupation GroupNew Mexico, 2012 to 2022

17 2012-2022 NEW MEXICO EMPLOYMENT PROJECTIONS REPORT
7207307808209009801,0101,0101,1201,1701,3201,4101,5801,6601,7901,8201,990
2,2302,4202,430
2,6302,800
3,7804,370
10,450
DishwashersMedical Secretaries
Correctional Officers & JailersLandscaping & Groundskeeping Workers
Childcare WorkersMiddle School Teachers, Ex. Special & Career/Tech. Education
Medical AssistantsNursing Assistants
Secondary School Teachers, Ex. Special & Career/Tech. EducationSupervisors of Office & Administrative Support Workers
Maids & Housekeeping CleanersSupervisors of Food Preparation & Serving Workers
Teacher AssistantsJanitors & Cleaners, Ex. Maids & House Cleaners
Cooks, RestaurantCustomer Service Reps
General & Operations ManagersRegistered Nurses
Home Health AidesElementary School Teachers, Ex. Special Education
Secretaries & Administrative Assistants, Ex. Legal, Medical & Exec.Waiters & Waitresses
Retail SalespersonsCombined Food Preparation & Serving Workers, Incl. Fast Food
Personal Care Aides
Top 25 Occupations with the Most Projected Employment GrowthNew Mexico, 2012 to 2022
Growth is rounded.Only includes occupations with rates of growth that
exceed the state's all-occupation average of 12 percent.
27.827.828.028.128.2
30.030.130.2
31.331.831.932.633.133.233.6
34.537.8
39.739.8
42.343.0
45.451.0
54.054.4
English Language & Literature Teachers, PostsecondaryCoaches & Scouts
Industrial Machinery MechanicsPostsecondary Teachers, All Other
Physical TherapistsEducation Teachers, Postsecondary
Business Teachers, PostsecondaryEducation Administrators Postsecondary
Physical Therapist AssistantsMarket Research Analysts & Marketing Specialists
Art, Drama & Music Teachers, PostsecondaryPhysical Therapist Aides
Health Technologists & Technicians, All OtherSkincare Specialists
Occupational Therapy AidesBiological Science Teachers, Postsecondary
Information Security AnalystsDiagnostic Medical Sonographers
Meeting, Convention & Event PlannersInterpreters & Translators
Occupational Therapy AssistantsHome Health Aides
Personal Care AidesNursing Instructors & Teachers, Postsecondary
Health Specialties Teachers, Postsecondary
Only includes occupations with 2012 employment greater than 110.
Top 25 Occupations with the Fastest Projected Employment GrowthProjected Percentage Growth, New Mexico, 2012 to 2022
NEW MEXICO DEPARTMENT OF WORKFORCE SOLUTIONS 18
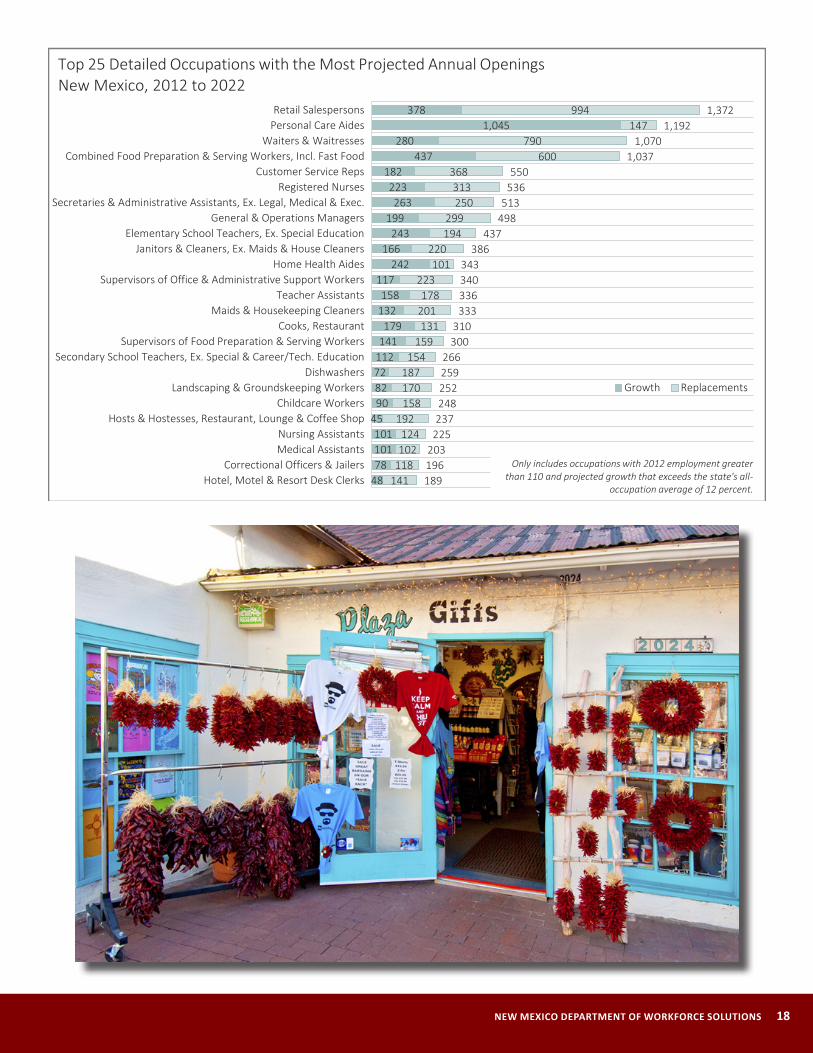
4878101101
45908272112141179
132158
117242
166243
199263
223182
437280
1,045378
141118102124
192158170187
154159
131201178
223101
220194299
250313
368600
790147
994
189196203225237248252259266
300310
333336340343
386437
498513
536550
1,0371,070
1,1921,372
Hotel, Motel & Resort Desk ClerksCorrectional Officers & Jailers
Medical AssistantsNursing Assistants
Hosts & Hostesses, Restaurant, Lounge & Coffee ShopChildcare Workers
Landscaping & Groundskeeping WorkersDishwashers
Secondary School Teachers, Ex. Special & Career/Tech. EducationSupervisors of Food Preparation & Serving Workers
Cooks, RestaurantMaids & Housekeeping Cleaners
Teacher AssistantsSupervisors of Office & Administrative Support Workers
Home Health AidesJanitors & Cleaners, Ex. Maids & House Cleaners
Elementary School Teachers, Ex. Special EducationGeneral & Operations Managers
Secretaries & Administrative Assistants, Ex. Legal, Medical & Exec.Registered Nurses
Customer Service RepsCombined Food Preparation & Serving Workers, Incl. Fast Food
Waiters & WaitressesPersonal Care AidesRetail Salespersons
Growth Replacements
Top 25 Detailed Occupations with the Most Projected Annual OpeningsNew Mexico, 2012 to 2022
Only includes occupations with 2012 employment greater than 110 and projected growth that exceeds the state's all-
occupation average of 12 percent.
19 2012-2022 NEW MEXICO EMPLOYMENT PROJECTIONS REPORT
Albuquerque MSA/ Central Region Industry Projections
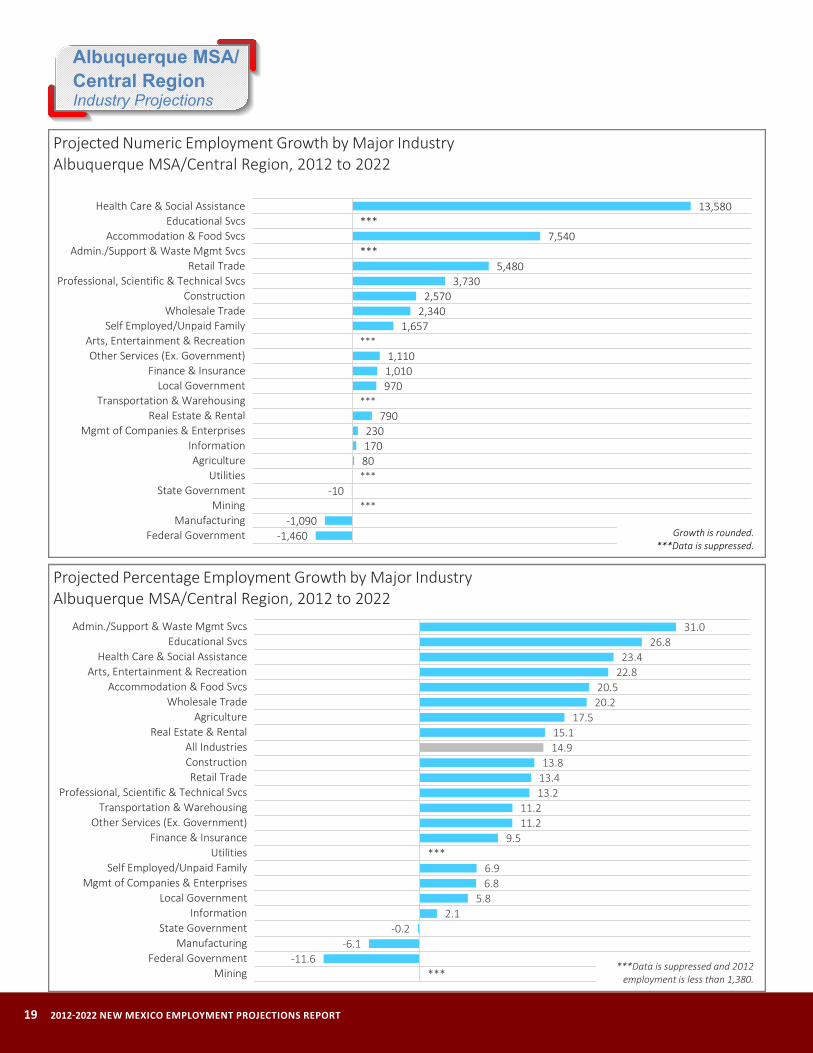
-1,460-1,090
***-10
***80170230
790***
9701,0101,110
***1,657
2,3402,570
3,7305,480
***7,540
***13,580
Federal GovernmentManufacturing
MiningState Government
UtilitiesAgriculture
InformationMgmt of Companies & Enterprises
Real Estate & RentalTransportation & Warehousing
Local GovernmentFinance & Insurance
Other Services (Ex. Government)Arts, Entertainment & Recreation
Self Employed/Unpaid FamilyWholesale Trade
ConstructionProfessional, Scientific & Technical Svcs
Retail TradeAdmin./Support & Waste Mgmt Svcs
Accommodation & Food SvcsEducational Svcs
Health Care & Social Assistance
Projected Numeric Employment Growth by Major IndustryAlbuquerque MSA/Central Region, 2012 to 2022
Growth is rounded.***Data is suppressed.
***-11.6
-6.1-0.2
2.15.8
6.86.9
***9.5
11.211.2
13.213.413.8
14.915.1
17.520.220.5
22.823.4
26.831.0
MiningFederal Government
ManufacturingState Government
InformationLocal Government
Mgmt of Companies & EnterprisesSelf Employed/Unpaid Family
UtilitiesFinance & Insurance
Other Services (Ex. Government)Transportation & Warehousing
Professional, Scientific & Technical SvcsRetail Trade
ConstructionAll Industries
Real Estate & RentalAgriculture
Wholesale TradeAccommodation & Food Svcs
Arts, Entertainment & RecreationHealth Care & Social Assistance
Educational SvcsAdmin./Support & Waste Mgmt Svcs
Projected Percentage Employment Growth by Major IndustryAlbuquerque MSA/Central Region, 2012 to 2022
***Data is suppressed and 2012 employment is less than 1,380.

NEW MEXICO DEPARTMENT OF WORKFORCE SOLUTIONS 20
12.312.613.013.213.213.313.5
15.815.916.416.917.918.119.619.720.921.121.821.922.122.2
25.026.726.827.1
30.931.532.333.334.4
36.238.6
53.762.1
105.3
Specialty Trade ContractorsGeneral Merchandise Stores
Merchant Wholesalers, Nondurable GoodsRepair & Maintenance
Professional, Scientific & Technical ServicesTruck Transportation
Construction of BuildingsMuseums, Historical Sites & Similar Institutions
Support Activities for TransportationElectronics & Appliance Stores
Religious/Grantmaking/Civic/Prof. OrganizationsAccommodation, Incl. Hotels & MotelsMerchant Wholesalers, Durable Goods
Motor Vehicle & Parts DealersTransit & Ground Passenger Transportion
Heavy & Civil Engineering ConstructionFood Services & Drinking Places
Gasoline StationsRental & Leasing ServicesChemical ManufacturingWarehousing & Storage
Amusement, Gambling & Recreation IndustriesNursing & Residential Care Facilities
Educational ServicesOther Information Services
Administrative & Support ServicesBldg Material & Garden Equip. & Supplies Dealers
Waste Mgmt & Remediation ServicesFunds, Trusts & Other Financial Vehicles
Crop ProductionAmbulatory Health Care Services
Social AssistanceBeverage & Tobacco Product Manufacturing
Wholesale Electronic Markets & Agents & BrokersSupport Activities for Mining
Detailed Industries Projected to Grow Faster than the Statewide All-Industry AverageProjected Percentage Growth, Albuquerque MSA/Central Region, 2012 to 2022
Only includes industries with base year employment greater than 75 and
percentage growth greater than 12.0.

21 2012-2022 NEW MEXICO EMPLOYMENT PROJECTIONS REPORT
NAICS Industry 2012 2022 Numeric Pct.
All Industries 379,742 436,466 56,724 14.9
11-0000 Agriculture 452 531 79 17.5
11-1000 Crop Production *** *** *** 34.4
11-2000 Animal Production *** *** *** -8.8
11-3000 Forestry & Logging *** *** *** ***
11-5000 Support Activities for Agriculture & Forestry *** *** *** ***
21-0000 Mining *** *** *** -27.5
21-1000 Oil & Gas Extraction 43 49 6 14.0
21-2000 Mining (Ex. Oil & Gas) 183 63 -120 -65.6
21-3000 Support Activities for Mining *** *** *** 105.3
22-0000 Utilities *** *** *** 7.2
22-1000 Utilities *** *** *** 7.2
23-0000 Construction 18,592 21,165 2,573 13.8
23-6000 Construction of Buildings 4,416 5,011 595 13.5
23-7000 Heavy & Civil Engineering Construction 2,738 3,310 572 20.9
23-8000 Specialty Trade Contractors 11,438 12,844 1,406 12.3
31-0000 Manufacturing 17,705 16,619 -1,086 -6.1
31-1000 Food Manufacturing 1,688 1,652 -36 -2.1
31-2000 Beverage & Tobacco Product Manufacturing *** *** *** 53.7
31-3000 Textile Mills *** *** *** ***
31-4000 Textile Product Mills *** *** *** ***
31-5000 Apparel Manufacturing 34 15 -19 -55.9
31-6000 Leather & Allied Product Manufacturing *** *** *** ***
32-1000 Wood Product Manufacturing 453 378 -75 -16.6
32-2000 Paper Manufacturing 306 321 15 4.9
32-3000 Printing & Related Support Activities *** *** *** -23.0
32-4000 Petroleum & Coal Products Manufacturing 44 146 102 231.8
32-5000 Chemical Manufacturing 737 900 163 22.1
32-6000 Plastics & Rubber Products Manufacturing 568 555 -13 -2.3
32-7000 Nonmetallic Mineral Product Manufacturing *** *** *** -4.9
33-1000 Primary Metal Manufacturing *** *** *** -11.5
33-2000 Fabricated Metal Product Manufacturing *** *** *** 9.9
33-3000 Machinery Manufacturing *** *** *** -7.3
33-4000 Computer & Electronic Product Manufacturing 7,284 6,228 -1,056 -14.5
33-5000 Electrical Equip., Appliance & Component Mfg 142 124 -18 -12.7
33-6000 Transportation Equip. Manufacturing 753 773 20 2.7
33-7000 Furniture & Related Product Manufacturing *** *** *** -17.5
33-9000 Miscellaneous Manufacturing 1,338 1,211 -127 -9.5
42-0000 Wholesale Trade 11,600 13,938 2,338 20.2
42-3000 Merchant Wholesalers, Durable Goods *** *** *** 18.1
42-4000 Merchant Wholesalers, Nondurable Goods 4,137 4,675 538 13.0
42-5000 Wholesale Electronic Markets & Agents & Brokers *** *** *** 62.1
44-0000 Retail Trade 40,793 46,271 5,478 13.4
44-1000 Motor Vehicle & Parts Dealers 5,887 7,042 1,155 19.6
44-2000 Furniture & Home Furnishings Stores *** *** *** 9.1
44-3000 Electronics & Appliance Stores *** *** *** 16.4
44-4000 Bldg Material & Garden Equip. & Supplies Dealers 3,176 4,175 999 31.5
Albuquerque MSA/Central Region Industry Employment Projections2012-2022
Employment Growth

NEW MEXICO DEPARTMENT OF WORKFORCE SOLUTIONS 22
NAICS Industry 2012 2022 Numeric Pct.
44-5000 Food & Beverage Stores 5,711 6,228 517 9.1
44-6000 Health & Personal Care Stores *** *** *** 9.6
44-7000 Gasoline Stations 2,238 2,725 487 21.8
44-8000 Clothing & Clothing Accessories Stores 3,348 3,644 296 8.8
45-1000 Sporting Goods, Hobby, Book & Music Stores 2,254 2,424 170 7.5
45-2000 General Merchandise Stores *** *** *** 12.6
45-3000 Miscellaneous Store Retailers 2,586 2,806 220 8.5
45-4000 Nonstore Retailers *** *** *** -13.7
48-0000 Transportation & Warehousing *** *** *** 11.2
48-1000 Air Transportation *** *** *** 1.9
48-2000 Rail Transportation *** *** *** 1.4
48-4000 Truck Transportation 2,396 2,714 318 13.3
48-5000 Transit & Ground Passenger Transportion *** *** *** 19.7
48-6000 Pipeline Transportation *** *** *** ***
48-7000 Scenic & Sightseeing Transportation 101 87 -14 -13.9
48-8000 Support Activities for Transportation 861 998 137 15.9
49-1100 Postal Service *** *** *** -17.4
49-2000 Couriers & Messengers *** *** *** 3.7
49-3000 Warehousing & Storage 1,025 1,253 228 22.2
51-0000 Information 8,218 8,389 171 2.1
51-1000 Publishing Industries (Ex. Internet) 910 812 -98 -10.8
51-2000 Motion Picture & Sound Recording Industries *** *** *** 11.7
51-5000 Broadcasting (Ex. Internet) *** *** *** -6.8
51-7000 Telecommunications 4,616 4,694 78 1.7
51-8000 Data Processing, Hosting & Related Services *** *** *** 6.5
51-9000 Other Information Services 166 211 45 27.1
52-0000 Finance & Insurance 10,623 11,628 1,005 9.5
52-2000 Credit Intermediation & Related Activities 5,229 5,612 383 7.3
52-3000 Securities/Commodity Contracts/Other Investments 639 711 72 11.3
52-4000 Insurance Carriers & Related Activities 4,620 5,125 505 10.9
52-5000 Funds, Trusts & Other Financial Vehicles 135 180 45 33.3
53-0000 Real Estate & Rental 5,194 5,980 786 15.1
53-1000 Real Estate *** *** *** 11.6
53-2000 Rental & Leasing Services *** *** *** 21.9
54-0000 Professional, Scientific & Technical Svcs 28,180 31,912 3,732 13.2
54-1000 Professional, Scientific & Technical Services 28,180 31,912 3,732 13.2
55-0000 Management of Companies & Enterprises 3,308 3,533 225 6.8
55-1000 Management of Companies & Enterprises 3,308 3,533 225 6.8
56-0000 Admin./Support & Waste Mgmt Svcs *** *** *** 31.0
56-1000 Administrative & Support Services *** *** *** 30.9
56-2000 Waste Mgmt & Remediation Services *** *** *** 32.3
61-0000 Educational Svcs *** *** *** 26.8
61-1000 Educational Services *** *** *** 26.8
62-0000 Health Care & Social Assistance 58,025 71,608 13,583 23.4
62-1000 Ambulatory Health Care Services *** *** *** 36.2
62-2000 Hospitals *** *** *** -2.1
62-3000 Nursing & Residential Care Facilities *** *** *** 26.7
62-4000 Social Assistance 10,420 14,443 4,023 38.6
2012-2022Employment Growth
Albuquerque MSA/Central Region Industry Employment Projections Continued

23 2012-2022 NEW MEXICO EMPLOYMENT PROJECTIONS REPORT
NAICS Industry 2012 2022 Numeric Pct.
71-0000 Arts, Entertainment & Recreation *** *** *** 22.8
71-1000 Performing Arts/Spectator Sports/Related Industries 753 833 80 10.6
71-2000 Museums, Historical Sites & Similar Institutions 323 374 51 15.8
71-3000 Amusement, Gambling & Recreation Industries *** *** *** 25.0
72-0000 Accommodation & Food Svcs 36,826 44,363 7,537 20.5
72-1000 Accommodation, Incl. Hotels & Motels 7,038 8,295 1,257 17.9
72-2000 Food Services & Drinking Places 29,788 36,068 6,280 21.1
81-0000 Other Services (Ex. Government) 9,960 11,074 1,114 11.2
81-1000 Repair & Maintenance 3,517 3,982 465 13.2
81-2000 Personal & Laundry Services *** *** *** 6.1
81-3000 Religious/Grantmaking/Civic/Prof. Organizations 2,912 3,405 493 16.9
81-4000 Private Households *** *** *** -6.1
90-0000 Total Government 35,348 34,847 -501 -1.4
91-0000 Federal Government 12,546 11,088 -1,458 -11.6
92-0000 State Government 6,113 6,099 -14 -0.2
93-0000 Local Government 16,689 17,660 971 5.8
***Data is suppressed. If percentage growth is shown as suppressed, it indicates that 2012 employment was below 75.
Employment Growth
Albuquerque MSA/Central Region Industry Employment Projections Continued
2012-2022
NEW MEXICO DEPARTMENT OF WORKFORCE SOLUTIONS 24
Albuquerque MSA/ Central Region Occupation Projections
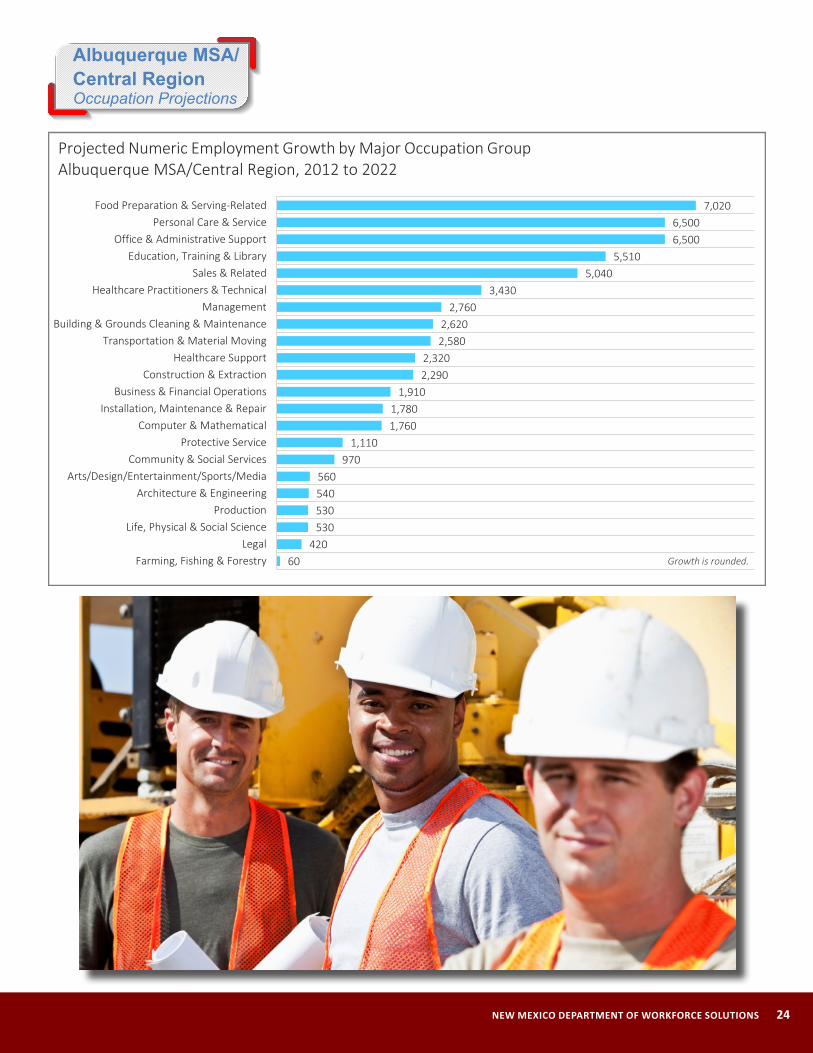
60420
530530540560
9701,110
1,7601,780
1,9102,2902,320
2,5802,620
2,7603,430
5,0405,510
6,5006,500
7,020
Farming, Fishing & ForestryLegal
Life, Physical & Social ScienceProduction
Architecture & EngineeringArts/Design/Entertainment/Sports/Media
Community & Social ServicesProtective Service
Computer & MathematicalInstallation, Maintenance & Repair
Business & Financial OperationsConstruction & Extraction
Healthcare SupportTransportation & Material Moving
Building & Grounds Cleaning & MaintenanceManagement
Healthcare Practitioners & TechnicalSales & Related
Education, Training & LibraryOffice & Administrative Support
Personal Care & ServiceFood Preparation & Serving-Related
Growth is rounded.
Projected Numeric Employment Growth by Major Occupation GroupAlbuquerque MSA/Central Region, 2012 to 2022
25 2012-2022 NEW MEXICO EMPLOYMENT PROJECTIONS REPORT
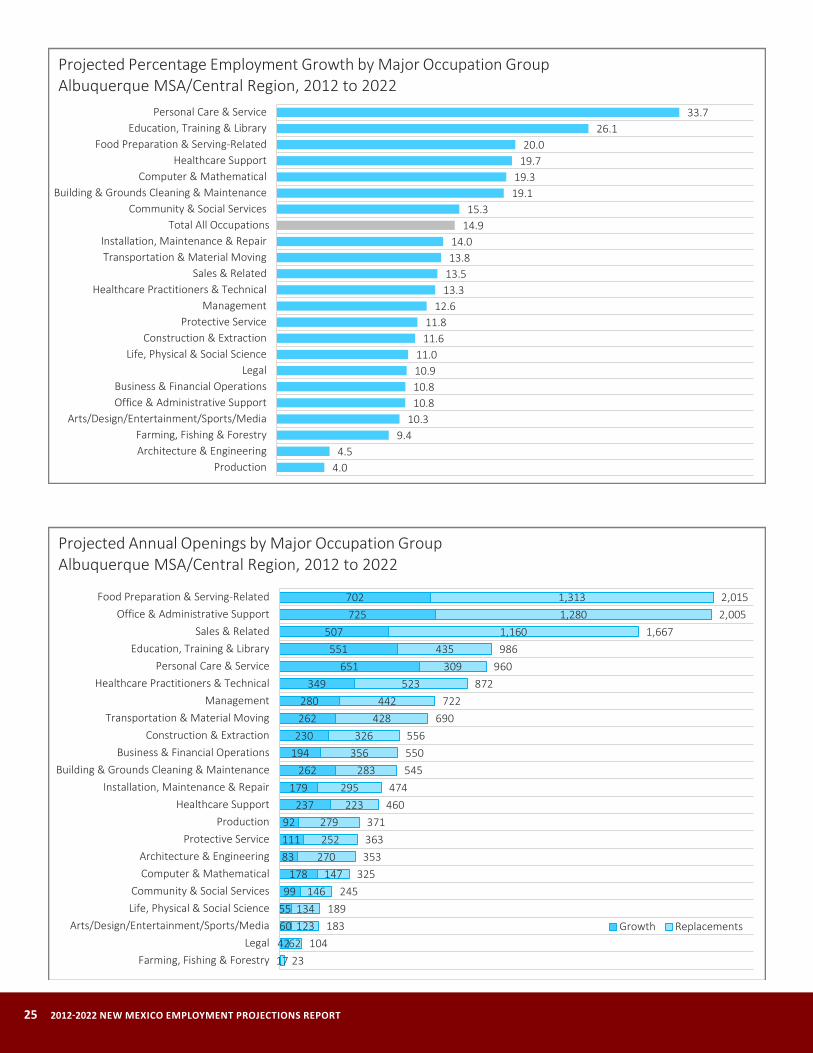
4.04.5
9.410.3
10.810.810.911.0
11.611.8
12.613.313.513.814.0
14.915.3
19.119.3
19.720.0
26.133.7
ProductionArchitecture & EngineeringFarming, Fishing & Forestry
Arts/Design/Entertainment/Sports/MediaOffice & Administrative SupportBusiness & Financial Operations
LegalLife, Physical & Social Science
Construction & ExtractionProtective Service
ManagementHealthcare Practitioners & Technical
Sales & RelatedTransportation & Material MovingInstallation, Maintenance & Repair
Total All OccupationsCommunity & Social Services
Building & Grounds Cleaning & MaintenanceComputer & Mathematical
Healthcare SupportFood Preparation & Serving-Related
Education, Training & LibraryPersonal Care & Service
Projected Percentage Employment Growth by Major Occupation GroupAlbuquerque MSA/Central Region, 2012 to 2022
42605599
1788311192
237179
262194230262280
349651
551507
725702
1762
123134
146147
270252279
223295
283356326
428442
523309
4351,160
1,2801,313
23104
183189
245325
353363371
460474
545550556
690722
872960
9861,667
2,0052,015
Farming, Fishing & ForestryLegal
Arts/Design/Entertainment/Sports/MediaLife, Physical & Social ScienceCommunity & Social Services
Computer & MathematicalArchitecture & Engineering
Protective ServiceProduction
Healthcare SupportInstallation, Maintenance & Repair
Building & Grounds Cleaning & MaintenanceBusiness & Financial Operations
Construction & ExtractionTransportation & Material Moving
ManagementHealthcare Practitioners & Technical
Personal Care & ServiceEducation, Training & Library
Sales & RelatedOffice & Administrative Support
Food Preparation & Serving-Related
Growth Replacements
Projected Annual Openings by Major Occupation GroupAlbuquerque MSA/Central Region, 2012 to 2022
NEW MEXICO DEPARTMENT OF WORKFORCE SOLUTIONS 26
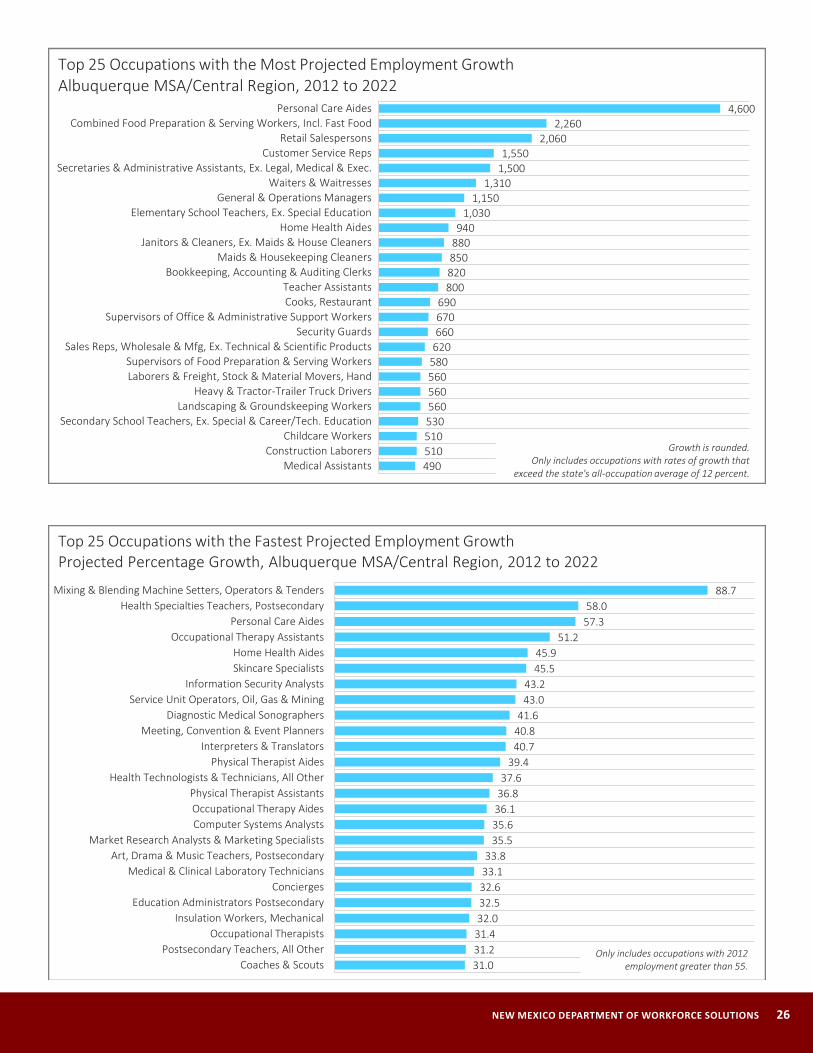
490510510530560560560580620660670690
800820850880940
1,0301,150
1,3101,5001,550
2,0602,260
4,600
Medical AssistantsConstruction Laborers
Childcare WorkersSecondary School Teachers, Ex. Special & Career/Tech. Education
Landscaping & Groundskeeping WorkersHeavy & Tractor-Trailer Truck Drivers
Laborers & Freight, Stock & Material Movers, HandSupervisors of Food Preparation & Serving Workers
Sales Reps, Wholesale & Mfg, Ex. Technical & Scientific ProductsSecurity Guards
Supervisors of Office & Administrative Support WorkersCooks, RestaurantTeacher Assistants
Bookkeeping, Accounting & Auditing ClerksMaids & Housekeeping Cleaners
Janitors & Cleaners, Ex. Maids & House CleanersHome Health Aides
Elementary School Teachers, Ex. Special EducationGeneral & Operations Managers
Waiters & WaitressesSecretaries & Administrative Assistants, Ex. Legal, Medical & Exec.
Customer Service RepsRetail Salespersons
Combined Food Preparation & Serving Workers, Incl. Fast FoodPersonal Care Aides
Top 25 Occupations with the Most Projected Employment GrowthAlbuquerque MSA/Central Region, 2012 to 2022
Growth is rounded.Only includes occupations with rates of growth that
exceed the state's all-occupation average of 12 percent.
31.031.231.432.032.532.633.133.8
35.535.636.136.837.6
39.440.740.841.6
43.043.2
45.545.9
51.257.358.0
88.7
Coaches & ScoutsPostsecondary Teachers, All Other
Occupational TherapistsInsulation Workers, Mechanical
Education Administrators PostsecondaryConcierges
Medical & Clinical Laboratory TechniciansArt, Drama & Music Teachers, Postsecondary
Market Research Analysts & Marketing SpecialistsComputer Systems AnalystsOccupational Therapy AidesPhysical Therapist Assistants
Health Technologists & Technicians, All OtherPhysical Therapist Aides
Interpreters & TranslatorsMeeting, Convention & Event Planners
Diagnostic Medical SonographersService Unit Operators, Oil, Gas & Mining
Information Security AnalystsSkincare SpecialistsHome Health Aides
Occupational Therapy AssistantsPersonal Care Aides
Health Specialties Teachers, PostsecondaryMixing & Blending Machine Setters, Operators & Tenders
Only includes occupations with 2012 employment greater than 55.
Top 25 Occupations with the Fastest Projected Employment GrowthProjected Percentage Growth, Albuquerque MSA/Central Region, 2012 to 2022

27 2012-2022 NEW MEXICO EMPLOYMENT PROJECTIONS REPORT
6633
6923
6258565141
9451
8280
5667
1038885115
150154
131460
226206
5285
5197
6066697486
3982
5280
111108
748993
135111
246366
58315
466
118118120120122124125125127133133134
160167175177177178
250261
400497
518541
672
Security GuardsDishwashers
Cooks, RestaurantHosts & Hostesses, Restaurant, Lounge & Coffee Shop
Sales Reps, Wholesale & Mfg, Ex. Technical & Scientific ProductsSupervisors of Food Preparation & Serving Workers
Landscaping & Groundskeeping WorkersChildcare Workers
Receptionists & Information ClerksHome Health Aides
Construction LaborersBookkeeping, Accounting & Auditing Clerks
Teacher AssistantsLaborers & Freight, Stock & Material Movers, Hand
Supervisors of Office & Administrative Support WorkersElementary School Teachers, Ex. Special Education
Janitors & Cleaners, Ex. Maids & House CleanersMaids & Housekeeping CleanersGeneral & Operations Managers
Secretaries & Administrative Assistants, Ex. Legal, Medical & Exec.Customer Service Reps
Waiters & WaitressesPersonal Care Aides
Combined Food Preparation & Serving Workers, Incl. Fast FoodRetail Salespersons
Growth Replacements
Top 25 Detailed Occupations with the Most Projected Annual OpeningsAlbuquerque MSA/Central Region, 2012 to 2022
Only includes occupations with 2012 employment greater than 55 and projected growth that exceeds the state's all-
occupation average of 12 percent.
NEW MEXICO DEPARTMENT OF WORKFORCE SOLUTIONS 28
Farmington MSA Industry Projections
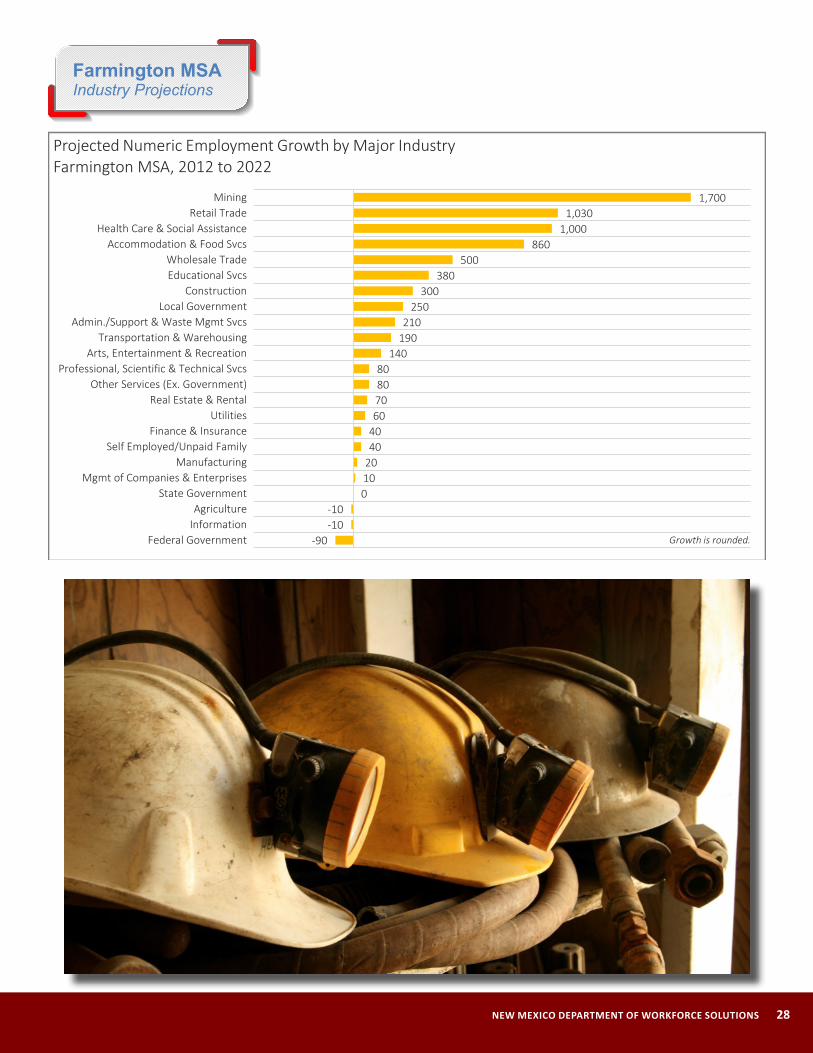
-90-10-10
01020404060708080
140190210
250300
380500
8601,000
1,0301,700
Federal GovernmentInformationAgriculture
State GovernmentMgmt of Companies & Enterprises
ManufacturingSelf Employed/Unpaid Family
Finance & InsuranceUtilities
Real Estate & RentalOther Services (Ex. Government)
Professional, Scientific & Technical SvcsArts, Entertainment & Recreation
Transportation & WarehousingAdmin./Support & Waste Mgmt Svcs
Local GovernmentConstruction
Educational SvcsWholesale Trade
Accommodation & Food SvcsHealth Care & Social Assistance
Retail TradeMining
Projected Numeric Employment Growth by Major IndustryFarmington MSA, 2012 to 2022
Growth is rounded.

29 2012-2022 NEW MEXICO EMPLOYMENT PROJECTIONS REPORT
-11.9-4.9
-3.8-0.5
1.21.3
2.64.6
5.45.75.8
7.98.58.8
13.013.814.214.7
16.617.918.5
21.726.5
29.1
Federal GovernmentInformationAgriculture
State GovernmentSelf Employed/Unpaid Family
ManufacturingMgmt of Companies & Enterprises
Finance & InsuranceOther Services (Ex. Government)
Local GovernmentUtilities
Educational SvcsConstruction
Professional, Scientific & Technical SvcsAll Industries
Real Estate & RentalHealth Care & Social AssistanceTransportation & Warehousing
Retail TradeArts, Entertainment & Recreation
Admin./Support & Waste Mgmt SvcsAccommodation & Food Svcs
MiningWholesale Trade
Projected Percentage Employment Growth by Major IndustryFarmington MSA, 2012 to 2022
12.0
12.5
13.1
16.2
16.7
17.4
17.9
18.7
18.8
19.1
19.8
20.3
21.6
22.2
23.4
23.7
27.9
36.0
37.0
37.7
Nursing & Residential Care Facilities
Couriers & Messengers
Wholesale Electronic Markets & Agents & Brokers
Truck Transportation
Rental & Leasing Services
Waste Mgmt & Remediation Services
Amusement, Gambling & Recreation Industries
Health & Personal Care Stores
Administrative & Support Services
Ambulatory Health Care Services
Motor Vehicle & Parts Dealers
Social Assistance
Food Services & Drinking Places
Accommodation, Incl. Hotels & Motels
Religious/Grantmaking/Civic/Prof. Organizations
Oil & Gas Extraction
General Merchandise Stores
Bldg Material & Garden Equip. & Supplies Dealers
Merchant Wholesalers, Durable Goods
Support Activities for Mining
Detailed Industries Projected to Grow Faster than the Statewide All-Industry AverageProjected Percentage Growth, Farmington MSA, 2012 to 2022
Only includes industries with base year employment greater than 35 and
percentage growth greater than 12.0.

NEW MEXICO DEPARTMENT OF WORKFORCE SOLUTIONS 30
NAICS Industry 2012 2022 Numeric Pct.
All Industries 52,483 59,325 6,842 13.0
11-0000 Agriculture 264 254 -10 -3.8
11-1000 Crop Production 169 163 -6 -3.6
11-2000 Animal Production *** *** *** -2.8
11-3000 Forestry & Logging 0 0 0 0.0
11-5000 Support Activities for Agriculture & Forestry *** *** *** -5.1
21-0000 Mining 6,438 8,142 1,704 26.5
21-1000 Oil & Gas Extraction *** *** *** 23.7
21-2000 Mining (Ex. Oil & Gas) *** *** *** -0.5
21-3000 Support Activities for Mining 3,170 4,365 1,195 37.7
22-0000 Utilities 1,006 1,064 58 5.8
22-1000 Utilities 1,006 1,064 58 5.8
23-0000 Construction 3,519 3,817 298 8.5
23-6000 Construction of Buildings 402 440 38 9.5
23-7000 Heavy & Civil Engineering Construction 1,213 1,322 109 9.0
23-8000 Specialty Trade Contractors 1,904 2,055 151 7.9
31-0000 Manufacturing 1,356 1,373 17 1.3
31-1000 Food Manufacturing 36 37 1 2.8
31-2000 Beverage & Tobacco Product Manufacturing *** *** *** ***
31-3000 Textile Mills 0 0 0 0.0
31-4000 Textile Product Mills 0 0 0 0.0
31-5000 Apparel Manufacturing 0 0 0 0.0
31-6000 Leather & Allied Product Manufacturing 0 0 0 0.0
32-1000 Wood Product Manufacturing 0 0 0 0.0
32-2000 Paper Manufacturing 0 0 0 0.0
32-3000 Printing & Related Support Activities 49 38 -11 -22.4
32-4000 Petroleum & Coal Products Manufacturing *** *** *** ***
32-5000 Chemical Manufacturing 11 12 1 9.1
32-6000 Plastics & Rubber Products Manufacturing 27 26 -1 -3.7
32-7000 Nonmetallic Mineral Product Manufacturing 92 81 -11 -12.0
33-1000 Primary Metal Manufacturing 0 0 0 0.0
33-2000 Fabricated Metal Product Manufacturing 472 518 46 9.7
33-3000 Machinery Manufacturing 296 274 -22 -7.4
33-4000 Computer & Electronic Product Manufacturing *** *** *** ***
33-5000 Electrical Equip., Appliance & Component Mfg *** *** *** 7.8
33-6000 Transportation Equip. Manufacturing 51 52 1 2.0
33-7000 Furniture & Related Product Manufacturing 35 29 -6 -17.1
33-9000 Miscellaneous Manufacturing 62 56 -6 -9.7
42-0000 Wholesale Trade 1,726 2,229 503 29.1
42-3000 Merchant Wholesalers, Durable Goods 1,250 1,712 462 37.0
42-4000 Merchant Wholesalers, Nondurable Goods 415 448 33 8.0
42-5000 Wholesale Electronic Markets & Agents & Brokers 61 69 8 13.1
44-0000 Retail Trade 6,176 7,201 1,025 16.6
44-1000 Motor Vehicle & Parts Dealers 1,052 1,260 208 19.8
44-2000 Furniture & Home Furnishings Stores 152 164 12 7.9
44-3000 Electronics & Appliance Stores 252 266 14 5.6
44-4000 Bldg Material & Garden Equip. & Supplies Dealers 531 722 191 36.0
44-5000 Food & Beverage Stores 787 788 1 0.1
Farmington MSA Industry Employment Projections2012-2022
Employment Growth
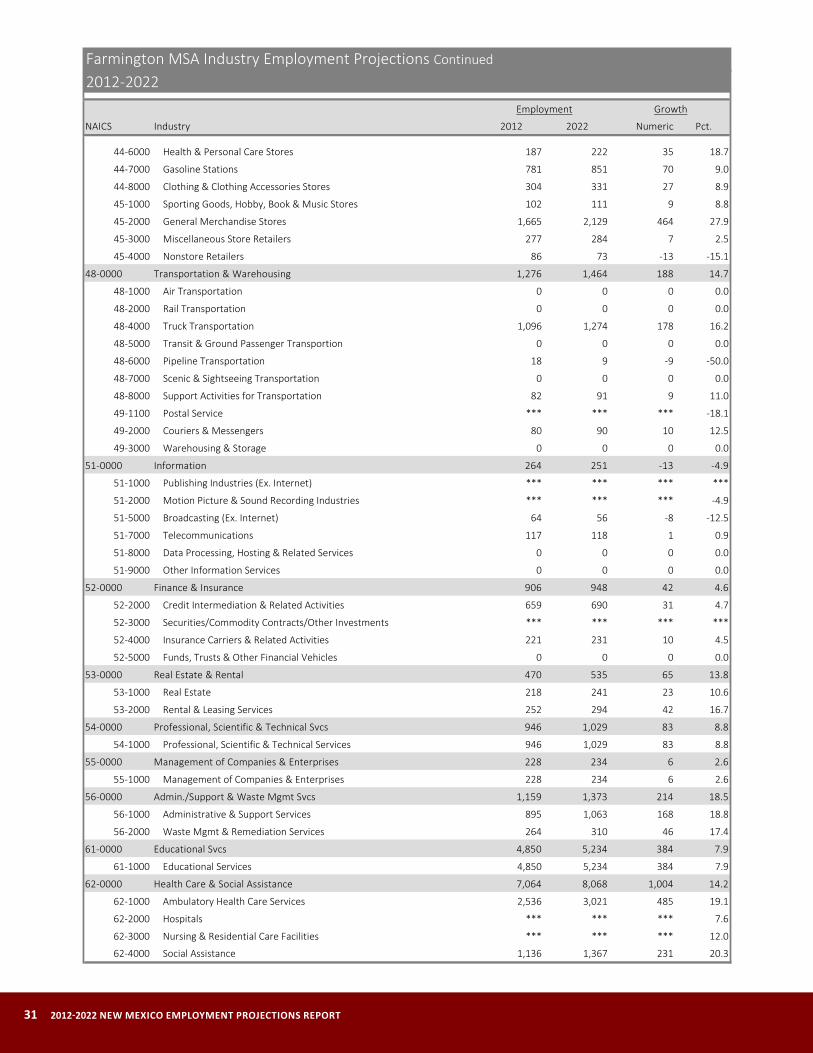
31 2012-2022 NEW MEXICO EMPLOYMENT PROJECTIONS REPORT
NAICS Industry 2012 2022 Numeric Pct.
44-6000 Health & Personal Care Stores 187 222 35 18.7
44-7000 Gasoline Stations 781 851 70 9.0
44-8000 Clothing & Clothing Accessories Stores 304 331 27 8.9
45-1000 Sporting Goods, Hobby, Book & Music Stores 102 111 9 8.8
45-2000 General Merchandise Stores 1,665 2,129 464 27.9
45-3000 Miscellaneous Store Retailers 277 284 7 2.5
45-4000 Nonstore Retailers 86 73 -13 -15.1
48-0000 Transportation & Warehousing 1,276 1,464 188 14.7
48-1000 Air Transportation 0 0 0 0.0
48-2000 Rail Transportation 0 0 0 0.0
48-4000 Truck Transportation 1,096 1,274 178 16.2
48-5000 Transit & Ground Passenger Transportion 0 0 0 0.0
48-6000 Pipeline Transportation 18 9 -9 -50.0
48-7000 Scenic & Sightseeing Transportation 0 0 0 0.0
48-8000 Support Activities for Transportation 82 91 9 11.0
49-1100 Postal Service *** *** *** -18.1
49-2000 Couriers & Messengers 80 90 10 12.5
49-3000 Warehousing & Storage 0 0 0 0.0
51-0000 Information 264 251 -13 -4.9
51-1000 Publishing Industries (Ex. Internet) *** *** *** ***
51-2000 Motion Picture & Sound Recording Industries *** *** *** -4.9
51-5000 Broadcasting (Ex. Internet) 64 56 -8 -12.5
51-7000 Telecommunications 117 118 1 0.9
51-8000 Data Processing, Hosting & Related Services 0 0 0 0.0
51-9000 Other Information Services 0 0 0 0.0
52-0000 Finance & Insurance 906 948 42 4.6
52-2000 Credit Intermediation & Related Activities 659 690 31 4.7
52-3000 Securities/Commodity Contracts/Other Investments *** *** *** ***
52-4000 Insurance Carriers & Related Activities 221 231 10 4.5
52-5000 Funds, Trusts & Other Financial Vehicles 0 0 0 0.0
53-0000 Real Estate & Rental 470 535 65 13.8
53-1000 Real Estate 218 241 23 10.6
53-2000 Rental & Leasing Services 252 294 42 16.7
54-0000 Professional, Scientific & Technical Svcs 946 1,029 83 8.8
54-1000 Professional, Scientific & Technical Services 946 1,029 83 8.8
55-0000 Management of Companies & Enterprises 228 234 6 2.6
55-1000 Management of Companies & Enterprises 228 234 6 2.6
56-0000 Admin./Support & Waste Mgmt Svcs 1,159 1,373 214 18.5
56-1000 Administrative & Support Services 895 1,063 168 18.8
56-2000 Waste Mgmt & Remediation Services 264 310 46 17.4
61-0000 Educational Svcs 4,850 5,234 384 7.9
61-1000 Educational Services 4,850 5,234 384 7.9
62-0000 Health Care & Social Assistance 7,064 8,068 1,004 14.2
62-1000 Ambulatory Health Care Services 2,536 3,021 485 19.1
62-2000 Hospitals *** *** *** 7.6
62-3000 Nursing & Residential Care Facilities *** *** *** 12.0
62-4000 Social Assistance 1,136 1,367 231 20.3
2012-2022Employment Growth
Farmington MSA Industry Employment Projections Continued
NEW MEXICO DEPARTMENT OF WORKFORCE SOLUTIONS 32
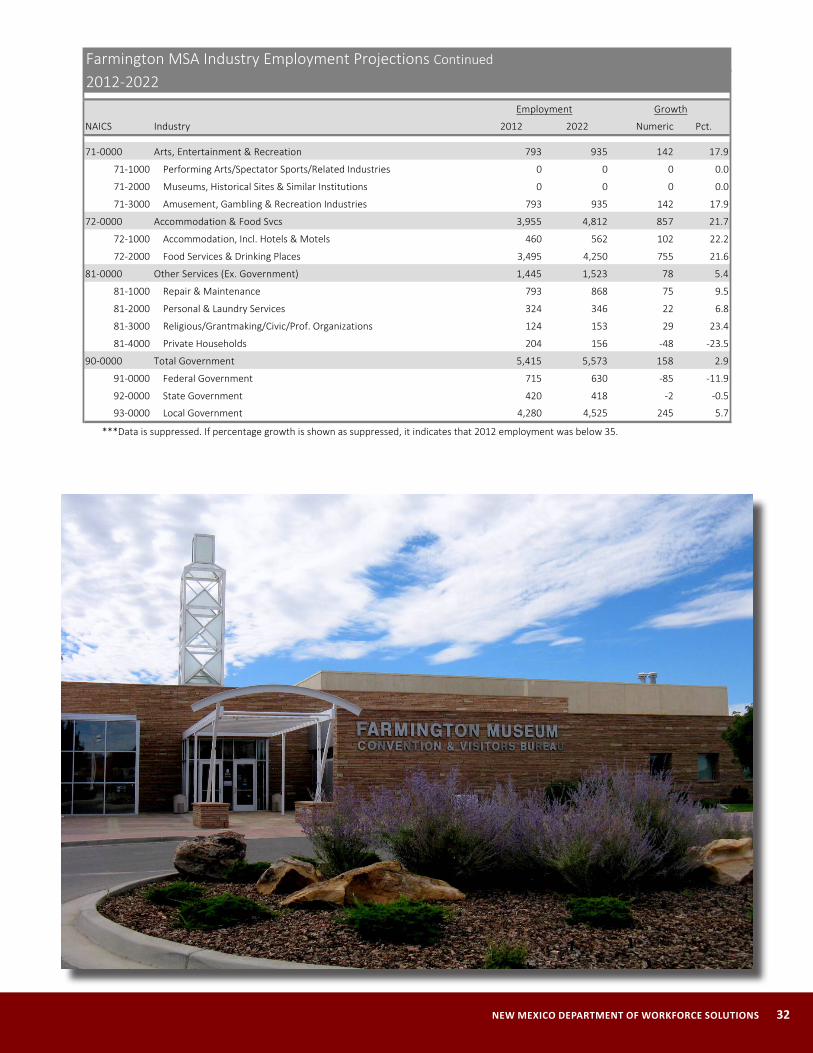
NAICS Industry 2012 2022 Numeric Pct.
71-0000 Arts, Entertainment & Recreation 793 935 142 17.9
71-1000 Performing Arts/Spectator Sports/Related Industries 0 0 0 0.0
71-2000 Museums, Historical Sites & Similar Institutions 0 0 0 0.0
71-3000 Amusement, Gambling & Recreation Industries 793 935 142 17.9
72-0000 Accommodation & Food Svcs 3,955 4,812 857 21.7
72-1000 Accommodation, Incl. Hotels & Motels 460 562 102 22.2
72-2000 Food Services & Drinking Places 3,495 4,250 755 21.6
81-0000 Other Services (Ex. Government) 1,445 1,523 78 5.4
81-1000 Repair & Maintenance 793 868 75 9.5
81-2000 Personal & Laundry Services 324 346 22 6.8
81-3000 Religious/Grantmaking/Civic/Prof. Organizations 124 153 29 23.4
81-4000 Private Households 204 156 -48 -23.5
90-0000 Total Government 5,415 5,573 158 2.9
91-0000 Federal Government 715 630 -85 -11.9
92-0000 State Government 420 418 -2 -0.5
93-0000 Local Government 4,280 4,525 245 5.7
***Data is suppressed. If percentage growth is shown as suppressed, it indicates that 2012 employment was below 35.
Employment Growth
Farmington MSA Industry Employment Projections Continued
2012-2022
33 2012-2022 NEW MEXICO EMPLOYMENT PROJECTIONS REPORT
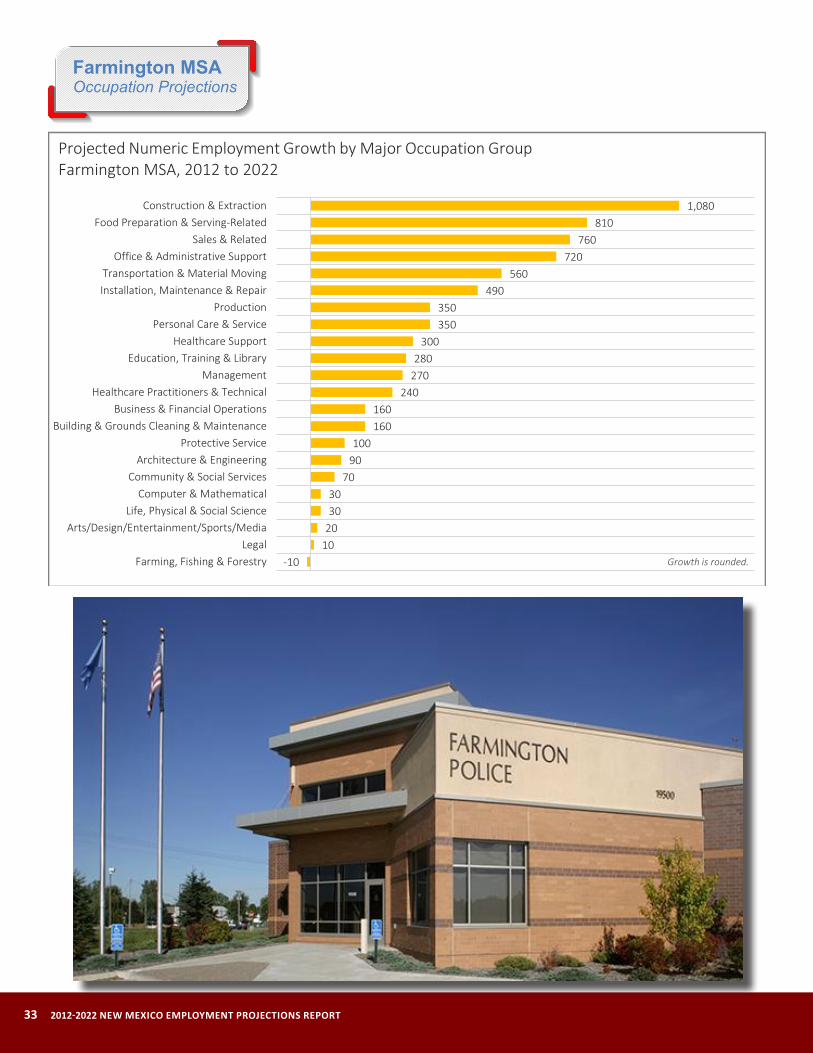
-1010203030
7090100
160160
240270280
300350350
490560
720760
8101,080
Farming, Fishing & ForestryLegal
Arts/Design/Entertainment/Sports/MediaLife, Physical & Social Science
Computer & MathematicalCommunity & Social Services
Architecture & EngineeringProtective Service
Building & Grounds Cleaning & MaintenanceBusiness & Financial Operations
Healthcare Practitioners & TechnicalManagement
Education, Training & LibraryHealthcare Support
Personal Care & ServiceProduction
Installation, Maintenance & RepairTransportation & Material Moving
Office & Administrative SupportSales & Related
Food Preparation & Serving-RelatedConstruction & Extraction
Growth is rounded.
Projected Numeric Employment Growth by Major Occupation GroupFarmington MSA, 2012 to 2022
Farmington MSA Occupation Projections

NEW MEXICO DEPARTMENT OF WORKFORCE SOLUTIONS 34
-5.23.6
5.17.8
8.49.1
9.59.89.810.0
11.411.912.0
13.013.013.113.4
14.715.2
16.017.5
17.919.2
Farming, Fishing & ForestryLegal
Arts/Design/Entertainment/Sports/MediaProtective Service
Community & Social ServicesHealthcare Practitioners & Technical
Education, Training & LibraryManagement
Office & Administrative SupportBuilding & Grounds Cleaning & Maintenance
ProductionLife, Physical & Social Science
Architecture & EngineeringComputer & Mathematical
Total All OccupationsBusiness & Financial Operations
Installation, Maintenance & RepairTransportation & Material Moving
Sales & RelatedConstruction & Extraction
Healthcare SupportPersonal Care & Service
Food Preparation & Serving-Related
Projected Percentage Employment Growth by Major Occupation GroupFarmington MSA, 2012 to 2022
43371016
1016
3035
243128
3749
577881
76110
25
488
2017
2235
3233
3355
5464
7589
87148147
164154
2581111
2727
384548
6368
7985
92112
138144
226228
240264
LegalFarming, Fishing & ForestryComputer & Mathematical
Arts/Design/Entertainment/Sports/MediaLife, Physical & Social ScienceCommunity & Social Services
Architecture & EngineeringBusiness & Financial Operations
Protective ServiceBuilding & Grounds Cleaning & Maintenance
Healthcare SupportPersonal Care & Service
Healthcare Practitioners & TechnicalManagement
Education, Training & LibraryProduction
Installation, Maintenance & RepairTransportation & Material Moving
Office & Administrative SupportFood Preparation & Serving-Related
Sales & RelatedConstruction & Extraction
Growth Replacements
Projected Annual Openings by Major Occupation GroupFarmington MSA, 2012 to 2022
35 2012-2022 NEW MEXICO EMPLOYMENT PROJECTIONS REPORT
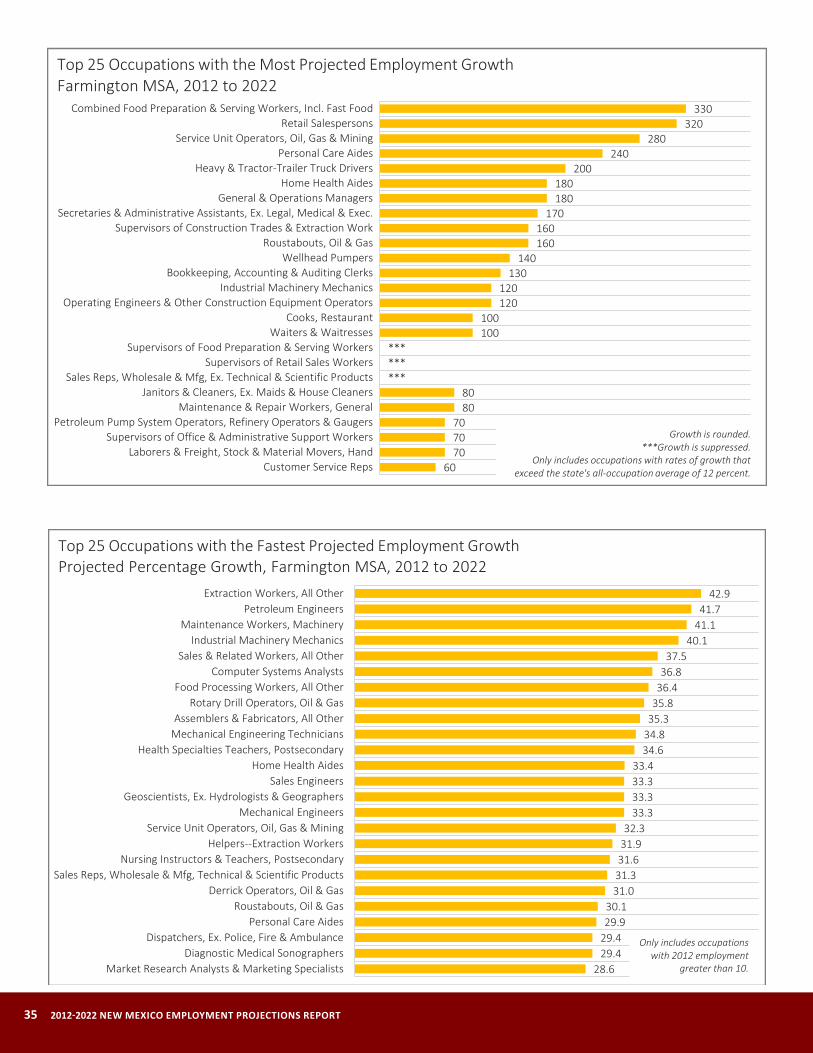
60707070
8080
*********
100100
120120
130140
160160
170180180
200240
280320
330
Customer Service RepsLaborers & Freight, Stock & Material Movers, Hand
Supervisors of Office & Administrative Support WorkersPetroleum Pump System Operators, Refinery Operators & Gaugers
Maintenance & Repair Workers, GeneralJanitors & Cleaners, Ex. Maids & House Cleaners
Sales Reps, Wholesale & Mfg, Ex. Technical & Scientific ProductsSupervisors of Retail Sales Workers
Supervisors of Food Preparation & Serving WorkersWaiters & Waitresses
Cooks, RestaurantOperating Engineers & Other Construction Equipment Operators
Industrial Machinery MechanicsBookkeeping, Accounting & Auditing Clerks
Wellhead PumpersRoustabouts, Oil & Gas
Supervisors of Construction Trades & Extraction WorkSecretaries & Administrative Assistants, Ex. Legal, Medical & Exec.
General & Operations ManagersHome Health Aides
Heavy & Tractor-Trailer Truck DriversPersonal Care Aides
Service Unit Operators, Oil, Gas & MiningRetail Salespersons
Combined Food Preparation & Serving Workers, Incl. Fast Food
Top 25 Occupations with the Most Projected Employment GrowthFarmington MSA, 2012 to 2022
Growth is rounded.***Growth is suppressed.
Only includes occupations with rates of growth that exceed the state's all-occupation average of 12 percent.
28.629.429.429.930.1
31.031.331.631.932.3
33.333.333.333.4
34.634.835.335.836.436.837.5
40.141.141.7
42.9
Market Research Analysts & Marketing SpecialistsDiagnostic Medical Sonographers
Dispatchers, Ex. Police, Fire & AmbulancePersonal Care Aides
Roustabouts, Oil & GasDerrick Operators, Oil & Gas
Sales Reps, Wholesale & Mfg, Technical & Scientific ProductsNursing Instructors & Teachers, Postsecondary
Helpers--Extraction WorkersService Unit Operators, Oil, Gas & Mining
Mechanical EngineersGeoscientists, Ex. Hydrologists & Geographers
Sales EngineersHome Health Aides
Health Specialties Teachers, PostsecondaryMechanical Engineering TechniciansAssemblers & Fabricators, All Other
Rotary Drill Operators, Oil & GasFood Processing Workers, All Other
Computer Systems AnalystsSales & Related Workers, All Other
Industrial Machinery MechanicsMaintenance Workers, Machinery
Petroleum EngineersExtraction Workers, All Other
Only includes occupationswith 2012 employment
greater than 10.
Top 25 Occupations with the Fastest Projected Employment GrowthProjected Percentage Growth, Farmington MSA, 2012 to 2022
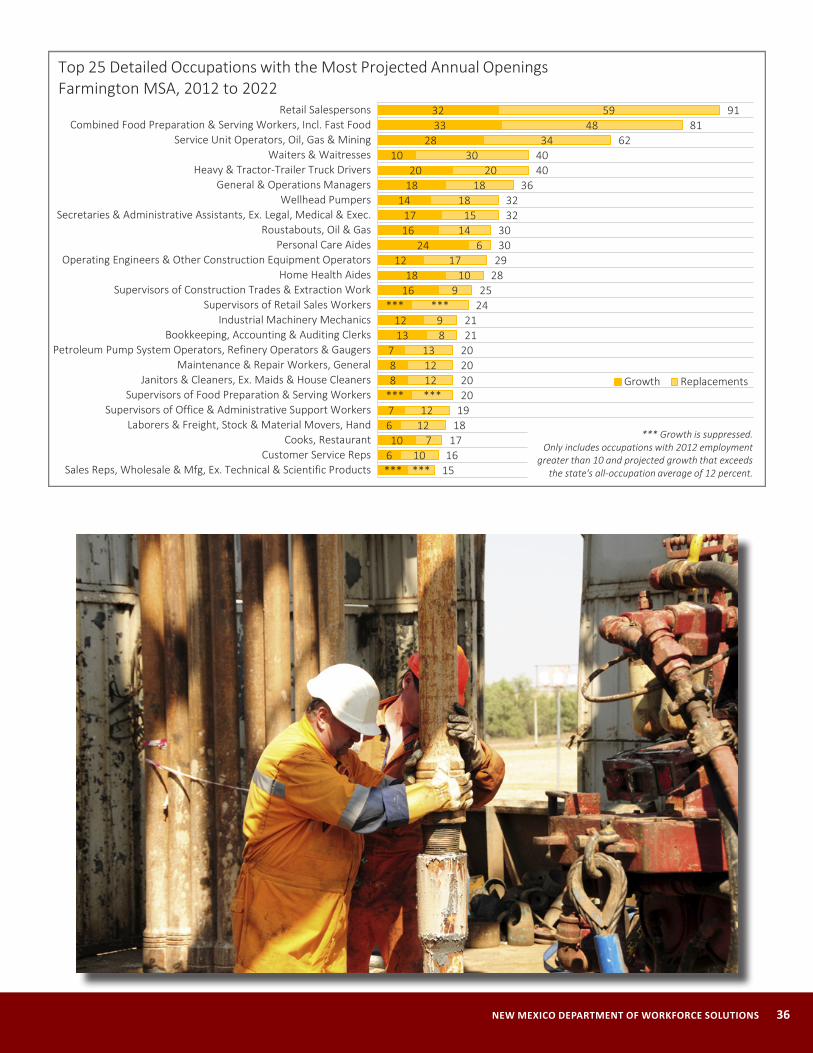
NEW MEXICO DEPARTMENT OF WORKFORCE SOLUTIONS 36
***610
67***887
1312
***1618
1224
1617
141820
1028
3332
***10
71212***121213
89
***9
1017
614
1518
1820
3034
4859
1516171819202020202121
2425
28293030
3232
364040
6281
91
Sales Reps, Wholesale & Mfg, Ex. Technical & Scientific ProductsCustomer Service Reps
Cooks, RestaurantLaborers & Freight, Stock & Material Movers, Hand
Supervisors of Office & Administrative Support WorkersSupervisors of Food Preparation & Serving Workers
Janitors & Cleaners, Ex. Maids & House CleanersMaintenance & Repair Workers, General
Petroleum Pump System Operators, Refinery Operators & GaugersBookkeeping, Accounting & Auditing Clerks
Industrial Machinery MechanicsSupervisors of Retail Sales Workers
Supervisors of Construction Trades & Extraction WorkHome Health Aides
Operating Engineers & Other Construction Equipment OperatorsPersonal Care Aides
Roustabouts, Oil & GasSecretaries & Administrative Assistants, Ex. Legal, Medical & Exec.
Wellhead PumpersGeneral & Operations Managers
Heavy & Tractor-Trailer Truck DriversWaiters & Waitresses
Service Unit Operators, Oil, Gas & MiningCombined Food Preparation & Serving Workers, Incl. Fast Food
Retail Salespersons
Growth Replacements
Top 25 Detailed Occupations with the Most Projected Annual OpeningsFarmington MSA, 2012 to 2022
*** Growth is suppressed.Only includes occupations with 2012 employment
greater than 10 and projected growth that exceeds the state's all-occupation average of 12 percent.

37 2012-2022 NEW MEXICO EMPLOYMENT PROJECTIONS REPORT
Las Cruces MSA Industry Projections
-430-130
-30-30-10
0020303060100120160160
270570580
9101,130
1,3101,680
2,890
Federal GovernmentSelf Employed/Unpaid Family
AgricultureInformation
State GovernmentMgmt of Companies & Enterprises
MiningUtilities
Real Estate & RentalManufacturing
Other Services (Ex. Government)Arts, Entertainment & Recreation
Transportation & WarehousingFinance & Insurance
Local GovernmentWholesale Trade
ConstructionAdmin./Support & Waste Mgmt Svcs
Professional, Scientific & Technical SvcsRetail Trade
Accommodation & Food SvcsEducational Svcs
Health Care & Social Assistance
Projected Numeric Employment Growth by Major IndustryLas Cruces MSA, 2012 to 2022
Growth is rounded.

NEW MEXICO DEPARTMENT OF WORKFORCE SOLUTIONS 38
-11.2-3.6
-2.1-0.9
-0.41.2
2.04.1
4.65.75.8
7.98.3
9.49.4
12.415.2
15.716.5
19.020.9
23.724.7
26.6
Federal GovernmentInformation
Self Employed/Unpaid FamilyAgriculture
State GovernmentManufacturing
Mgmt of Companies & EnterprisesReal Estate & Rental
Other Services (Ex. Government)Local Government
UtilitiesTransportation & Warehousing
MiningArts, Entertainment & Recreation
Finance & InsuranceAll IndustriesRetail Trade
Educational SvcsConstruction
Admin./Support & Waste Mgmt SvcsAccommodation & Food Svcs
Health Care & Social AssistanceWholesale Trade
Professional, Scientific & Technical Svcs
Projected Percentage Employment Growth by Major IndustryLas Cruces MSA, 2012 to 2022
13.013.714.114.5
15.715.7
17.117.4
18.819.6
21.021.721.8
24.225.2
26.627.327.5
29.630.7
33.246.3
Accommodation, Incl. Hotels & MotelsWholesale Electronic Markets & Agents & Brokers
Primary Metal ManufacturingReligious/Grantmaking/Civic/Prof. Organizations
Support Activities for Agriculture & ForestryEducational Services
HospitalsMerchant Wholesalers, Nondurable Goods
Administrative & Support ServicesMotor Vehicle & Parts DealersHealth & Personal Care Stores
Food Services & Drinking PlacesSpecialty Trade Contractors
Waste Mgmt & Remediation ServicesInsurance Carriers & Related Activities
Professional, Scientific & Technical ServicesAmbulatory Health Care Services
Social AssistanceGeneral Merchandise Stores
Computer & Electronic Product ManufacturingMerchant Wholesalers, Durable Goods
Beverage & Tobacco Product Manufacturing
Detailed Industries Projected to Grow Faster than the Statewide All-Industry AverageProjected Percentage Growth, Las Cruces MSA, 2012 to 2022
Only includes industries with base year employment greater than 35 and
percentage growth greater than 12.0.
Only includes industries with base year employment greater than 35 and
percentage growth greater than 12.0.
39 2012-2022 NEW MEXICO EMPLOYMENT PROJECTIONS REPORT
NAICS Industry 2012 2022 Numeric Pct.
All Industries 75,446 84,833 9,387 12.4
11-0000 Agriculture 3,372 3,340 -32 -0.9
11-1000 Crop Production 1,529 1,335 -194 -12.7
11-2000 Animal Production 703 686 -17 -2.4
11-3000 Forestry & Logging 0 0 0 0.0
11-5000 Support Activities for Agriculture & Forestry 1,140 1,319 179 15.7
21-0000 Mining 24 26 2 8.3
21-1000 Oil & Gas Extraction 0 0 0 0.0
21-2000 Mining (Ex. Oil & Gas) *** *** *** ***
21-3000 Support Activities for Mining 10 11 1 10.0
22-0000 Utilities 395 418 23 5.8
22-1000 Utilities 395 418 23 5.8
23-0000 Construction 3,431 3,997 566 16.5
23-6000 Construction of Buildings 886 970 84 9.5
23-7000 Heavy & Civil Engineering Construction 366 373 7 1.9
23-8000 Specialty Trade Contractors 2,179 2,654 475 21.8
31-0000 Manufacturing 2,850 2,883 33 1.2
31-1000 Food Manufacturing 928 964 36 3.9
31-2000 Beverage & Tobacco Product Manufacturing 41 60 19 46.3
31-3000 Textile Mills 0 0 0 0.0
31-4000 Textile Product Mills 0 0 0 0.0
31-5000 Apparel Manufacturing 0 0 0 0.0
31-6000 Leather & Allied Product Manufacturing 0 0 0 0.0
32-1000 Wood Product Manufacturing *** *** *** ***
32-2000 Paper Manufacturing *** *** *** -8.6
32-3000 Printing & Related Support Activities 81 62 -19 -23.5
32-4000 Petroleum & Coal Products Manufacturing 0 0 0 0.0
32-5000 Chemical Manufacturing *** *** *** ***
32-6000 Plastics & Rubber Products Manufacturing 77 74 -3 -3.9
32-7000 Nonmetallic Mineral Product Manufacturing 117 116 -1 -0.9
33-1000 Primary Metal Manufacturing 64 73 9 14.1
33-2000 Fabricated Metal Product Manufacturing 487 405 -82 -16.8
33-3000 Machinery Manufacturing 82 71 -11 -13.4
33-4000 Computer & Electronic Product Manufacturing 329 430 101 30.7
33-5000 Electrical Equip., Appliance & Component Mfg *** *** *** ***
33-6000 Transportation Equip. Manufacturing 428 429 1 0.2
33-7000 Furniture & Related Product Manufacturing 31 26 -5 -16.1
33-9000 Miscellaneous Manufacturing 50 45 -5 -10.0
42-0000 Wholesale Trade 1,077 1,343 266 24.7
42-3000 Merchant Wholesalers, Durable Goods 509 678 169 33.2
42-4000 Merchant Wholesalers, Nondurable Goods 517 607 90 17.4
42-5000 Wholesale Electronic Markets & Agents & Brokers 51 58 7 13.7
44-0000 Retail Trade 7,462 8,595 1,133 15.2
44-1000 Motor Vehicle & Parts Dealers 1,012 1,210 198 19.6
44-2000 Furniture & Home Furnishings Stores 156 170 14 9.0
44-3000 Electronics & Appliance Stores 230 243 13 5.7
44-4000 Bldg Material & Garden Equip. & Supplies Dealers 667 743 76 11.4
Las Cruces MSA Industry Employment Projections2012-2022
Employment Growth
NEW MEXICO DEPARTMENT OF WORKFORCE SOLUTIONS 40
NAICS Industry 2012 2022 Numeric Pct.
44-5000 Food & Beverage Stores 1,043 1,058 15 1.4
44-6000 Health & Personal Care Stores 376 455 79 21.0
44-7000 Gasoline Stations 751 818 67 8.9
44-8000 Clothing & Clothing Accessories Stores 406 442 36 8.9
45-1000 Sporting Goods, Hobby, Book & Music Stores 245 253 8 3.3
45-2000 General Merchandise Stores 2,101 2,722 621 29.6
45-3000 Miscellaneous Store Retailers 439 450 11 2.5
45-4000 Nonstore Retailers 36 31 -5 -13.9
48-0000 Transportation & Warehousing 1,489 1,606 117 7.9
48-1000 Air Transportation 0 0 0 0.0
48-2000 Rail Transportation 0 0 0 0.0
48-4000 Truck Transportation 381 415 34 8.9
48-5000 Transit & Ground Passenger Transportion 450 489 39 8.7
48-6000 Pipeline Transportation 0 0 0 0.0
48-7000 Scenic & Sightseeing Transportation 0 0 0 0.0
48-8000 Support Activities for Transportation 212 236 24 11.3
49-1100 Postal Service 212 174 -38 -17.9
49-2000 Couriers & Messengers 105 116 11 10.5
49-3000 Warehousing & Storage 341 350 9 2.6
51-0000 Information 890 858 -32 -3.6
51-1000 Publishing Industries (Ex. Internet) 245 215 -30 -12.2
51-2000 Motion Picture & Sound Recording Industries *** *** *** -4.4
51-5000 Broadcasting (Ex. Internet) 57 55 -2 -3.5
51-7000 Telecommunications 311 314 3 1.0
51-8000 Data Processing, Hosting & Related Services *** *** *** -0.6
51-9000 Other Information Services 12 14 2 16.7
52-0000 Finance & Insurance 1,651 1,807 156 9.4
52-2000 Credit Intermediation & Related Activities 1,114 1,150 36 3.2
52-3000 Securities/Commodity Contracts/Other Investments 73 76 3 4.1
52-4000 Insurance Carriers & Related Activities 464 581 117 25.2
52-5000 Funds, Trusts & Other Financial Vehicles 0 0 0 0.0
53-0000 Real Estate & Rental 684 712 28 4.1
53-1000 Real Estate 547 604 57 10.4
53-2000 Rental & Leasing Services 137 108 -29 -21.2
54-0000 Professional, Scientific & Technical Svcs 3,430 4,342 912 26.6
54-1000 Professional, Scientific & Technical Services 3,430 4,342 912 26.6
55-0000 Management of Companies & Enterprises 51 52 1 2.0
55-1000 Management of Companies & Enterprises 51 52 1 2.0
56-0000 Admin./Support & Waste Mgmt Svcs 3,057 3,639 582 19.0
56-1000 Administrative & Support Services 2,933 3,485 552 18.8
56-2000 Waste Mgmt & Remediation Services 124 154 30 24.2
61-0000 Educational Svcs 10,689 12,372 1,683 15.7
61-1000 Educational Services 10,689 12,372 1,683 15.7
62-0000 Health Care & Social Assistance 12,197 15,083 2,886 23.7
62-1000 Ambulatory Health Care Services 5,656 7,202 1,546 27.3
62-2000 Hospitals 2,650 3,104 454 17.1
62-3000 Nursing & Residential Care Facilities 1,001 1,092 91 9.1
62-4000 Social Assistance 2,890 3,685 795 27.5
Las Cruces MSA Industry Employment Projections Continued
2012-2022Employment Growth
41 2012-2022 NEW MEXICO EMPLOYMENT PROJECTIONS REPORT
NAICS Industry 2012 2022 Numeric Pct.
71-0000 Arts, Entertainment & Recreation 1,048 1,146 98 9.4
71-1000 Performing Arts/Spectator Sports/Related Industries *** *** *** 7.5
71-2000 Museums, Historical Sites & Similar Institutions *** *** *** ***
71-3000 Amusement, Gambling & Recreation Industries 986 1,078 92 9.3
72-0000 Accommodation & Food Svcs 6,266 7,577 1,311 20.9
72-1000 Accommodation, Incl. Hotels & Motels 583 659 76 13.0
72-2000 Food Services & Drinking Places 5,683 6,918 1,235 21.7
81-0000 Other Services (Ex. Government) 1,313 1,374 61 4.6
81-1000 Repair & Maintenance 500 547 47 9.4
81-2000 Personal & Laundry Services 457 488 31 6.8
81-3000 Religious/Grantmaking/Civic/Prof. Organizations 200 229 29 14.5
81-4000 Private Households 156 110 -46 -29.5
90-0000 Total Government 7,854 7,575 -279 -3.6
91-0000 Federal Government 3,858 3,426 -432 -11.2
92-0000 State Government 1,232 1,227 -5 -0.4
93-0000 Local Government 2,764 2,922 158 5.7
***Data is suppressed. If percentage growth is shown as suppressed, it indicates that 2012 employment was below 35.
Las Cruces MSA Industry Employment Projections Continued
2012-2022Employment Growth
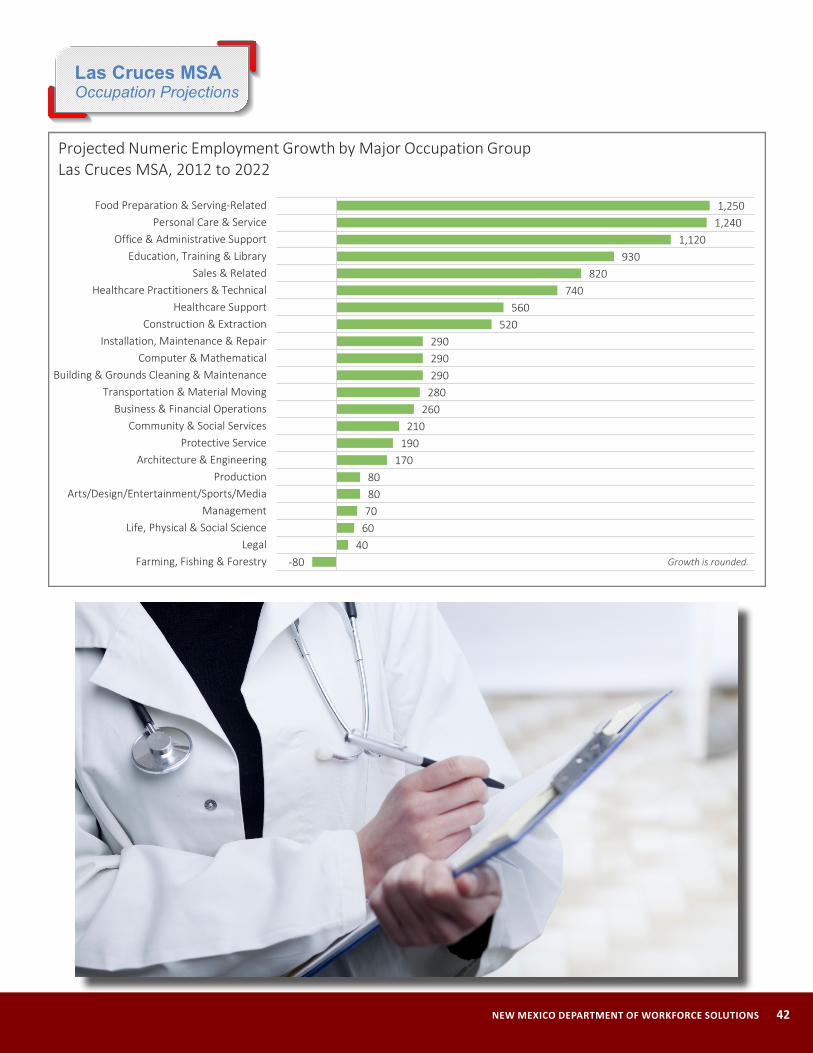
NEW MEXICO DEPARTMENT OF WORKFORCE SOLUTIONS 42
Las Cruces MSA Occupation Projections
-8040
60708080
170190
210260
280290290290
520560
740820
9301,120
1,2401,250
Farming, Fishing & ForestryLegal
Life, Physical & Social ScienceManagement
Arts/Design/Entertainment/Sports/MediaProduction
Architecture & EngineeringProtective Service
Community & Social ServicesBusiness & Financial Operations
Transportation & Material MovingBuilding & Grounds Cleaning & Maintenance
Computer & MathematicalInstallation, Maintenance & Repair
Construction & ExtractionHealthcare Support
Healthcare Practitioners & TechnicalSales & Related
Education, Training & LibraryOffice & Administrative Support
Personal Care & ServiceFood Preparation & Serving-Related
Growth is rounded.
Projected Numeric Employment Growth by Major Occupation GroupLas Cruces MSA, 2012 to 2022
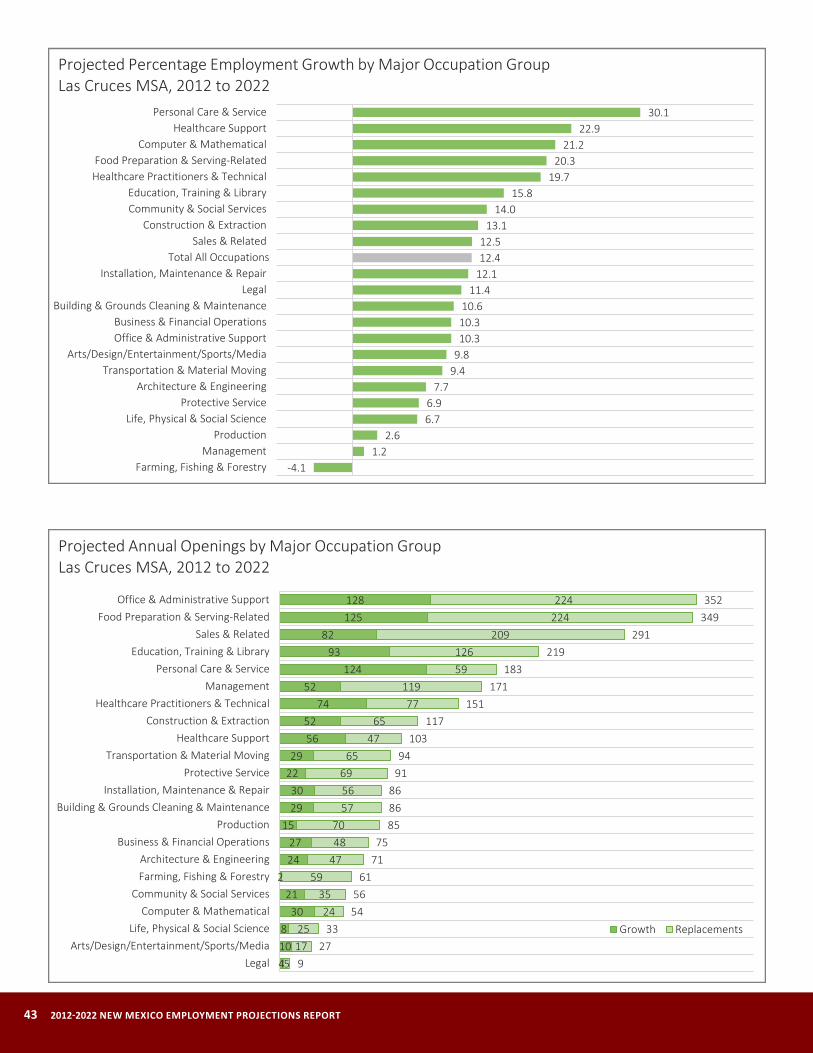
43 2012-2022 NEW MEXICO EMPLOYMENT PROJECTIONS REPORT
-4.11.2
2.66.76.9
7.79.49.810.310.310.6
11.412.112.412.5
13.114.0
15.819.7
20.321.2
22.930.1
Farming, Fishing & ForestryManagement
ProductionLife, Physical & Social Science
Protective ServiceArchitecture & Engineering
Transportation & Material MovingArts/Design/Entertainment/Sports/Media
Office & Administrative SupportBusiness & Financial Operations
Building & Grounds Cleaning & MaintenanceLegal
Installation, Maintenance & RepairTotal All Occupations
Sales & RelatedConstruction & Extraction
Community & Social ServicesEducation, Training & Library
Healthcare Practitioners & TechnicalFood Preparation & Serving-Related
Computer & MathematicalHealthcare Support
Personal Care & Service
Projected Percentage Employment Growth by Major Occupation GroupLas Cruces MSA, 2012 to 2022
4108
3021
22427
152930
2229
5652
7452
12493
82125128
51725
2435
59474870
575669
6547
6577
11959126
209224224
927
335456
617175
858686
9194
103117
151171
183219
291349352
LegalArts/Design/Entertainment/Sports/Media
Life, Physical & Social ScienceComputer & Mathematical
Community & Social ServicesFarming, Fishing & ForestryArchitecture & Engineering
Business & Financial OperationsProduction
Building & Grounds Cleaning & MaintenanceInstallation, Maintenance & Repair
Protective ServiceTransportation & Material Moving
Healthcare SupportConstruction & Extraction
Healthcare Practitioners & TechnicalManagement
Personal Care & ServiceEducation, Training & Library
Sales & RelatedFood Preparation & Serving-Related
Office & Administrative Support
Growth Replacements
Projected Annual Openings by Major Occupation GroupLas Cruces MSA, 2012 to 2022
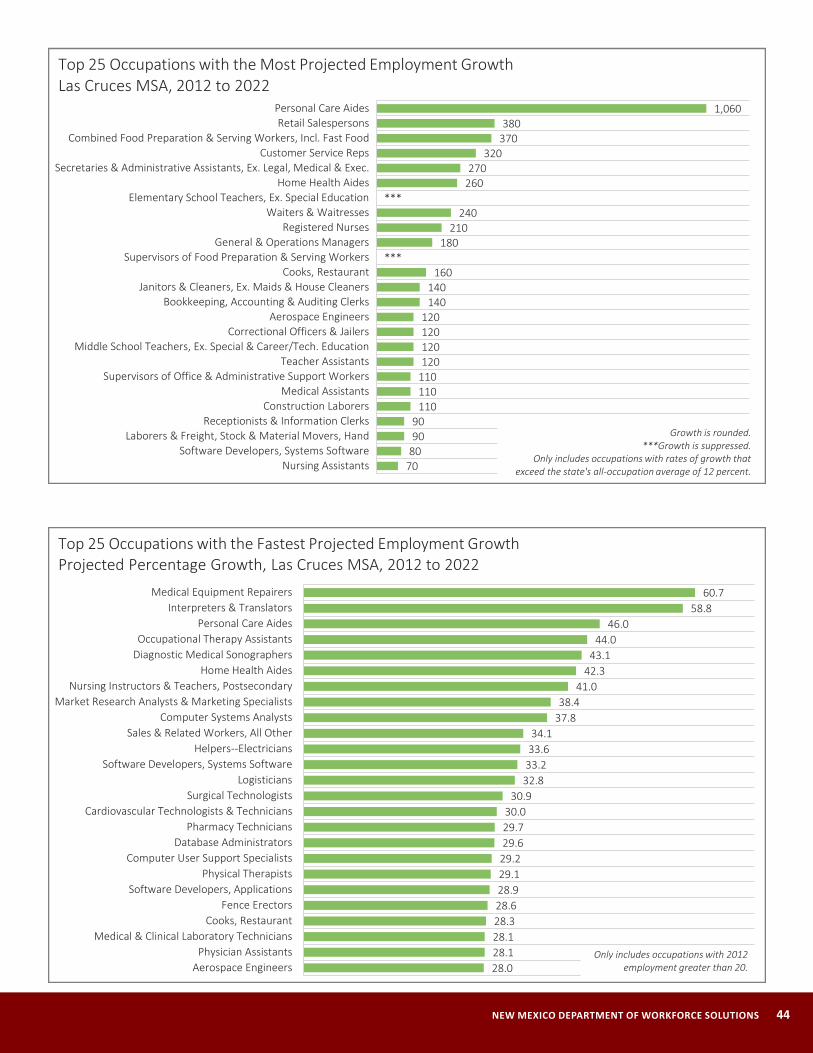
NEW MEXICO DEPARTMENT OF WORKFORCE SOLUTIONS 44
70809090
110110110120120120120
140140
160***
180210
240***
260270
320370380
1,060
Nursing AssistantsSoftware Developers, Systems Software
Laborers & Freight, Stock & Material Movers, HandReceptionists & Information Clerks
Construction LaborersMedical Assistants
Supervisors of Office & Administrative Support WorkersTeacher Assistants
Middle School Teachers, Ex. Special & Career/Tech. EducationCorrectional Officers & Jailers
Aerospace EngineersBookkeeping, Accounting & Auditing Clerks
Janitors & Cleaners, Ex. Maids & House CleanersCooks, Restaurant
Supervisors of Food Preparation & Serving WorkersGeneral & Operations Managers
Registered NursesWaiters & Waitresses
Elementary School Teachers, Ex. Special EducationHome Health Aides
Secretaries & Administrative Assistants, Ex. Legal, Medical & Exec.Customer Service Reps
Combined Food Preparation & Serving Workers, Incl. Fast FoodRetail Salespersons
Personal Care Aides
Top 25 Occupations with the Most Projected Employment GrowthLas Cruces MSA, 2012 to 2022
Growth is rounded.***Growth is suppressed.
Only includes occupations with rates of growth that exceed the state's all-occupation average of 12 percent.
28.028.128.128.328.628.929.129.229.629.730.0
30.932.833.233.634.1
37.838.4
41.042.3
43.144.0
46.058.8
60.7
Aerospace EngineersPhysician Assistants
Medical & Clinical Laboratory TechniciansCooks, Restaurant
Fence ErectorsSoftware Developers, Applications
Physical TherapistsComputer User Support Specialists
Database AdministratorsPharmacy Technicians
Cardiovascular Technologists & TechniciansSurgical Technologists
LogisticiansSoftware Developers, Systems Software
Helpers--ElectriciansSales & Related Workers, All Other
Computer Systems AnalystsMarket Research Analysts & Marketing Specialists
Nursing Instructors & Teachers, PostsecondaryHome Health Aides
Diagnostic Medical SonographersOccupational Therapy Assistants
Personal Care AidesInterpreters & Translators
Medical Equipment Repairers
Only includes occupations with 2012 employment greater than 20.
Top 25 Occupations with the Fastest Projected Employment GrowthProjected Percentage Growth, Las Cruces MSA, 2012 to 2022

45 2012-2022 NEW MEXICO EMPLOYMENT PROJECTIONS REPORT
***7121114
1216
98121111***14
1226
1821
27***
3236
2438
106
***13
1011
914
111819
161818
***20
2212
2220
25***
3651
6676
16
1920
222223
26272727282929
343434
384041
5252
6887
90114
122
Hosts & Hostesses, Restaurant, Lounge & Coffee ShopAccountants & Auditors
Aerospace EngineersMedical Assistants
Bookkeeping, Accounting & Auditing ClerksMiddle School Teachers, Ex. Special & Career/Tech. Education
Cooks, RestaurantReceptionists & Information Clerks
Laborers & Freight, Stock & Material Movers, HandCorrectional Officers & Jailers
Supervisors of Office & Administrative Support WorkersConstruction Laborers
Supervisors of Food Preparation & Serving WorkersJanitors & Cleaners, Ex. Maids & House Cleaners
Teacher AssistantsHome Health Aides
General & Operations ManagersRegistered Nurses
Secretaries & Administrative Assistants, Ex. Legal, Medical & Exec.Elementary School Teachers, Ex. Special Education
Customer Service RepsCombined Food Preparation & Serving Workers, Incl. Fast Food
Waiters & WaitressesRetail Salespersons
Personal Care Aides
Growth Replacements
Top 25 Detailed Occupations with the Most Projected Annual OpeningsLas Cruces MSA, 2012 to 2022
*** Growth is suppressed.Only includes occupations with 2012 employment
greater than 20 and projected growth that exceeds the state's all-occupation average of 12 percent.
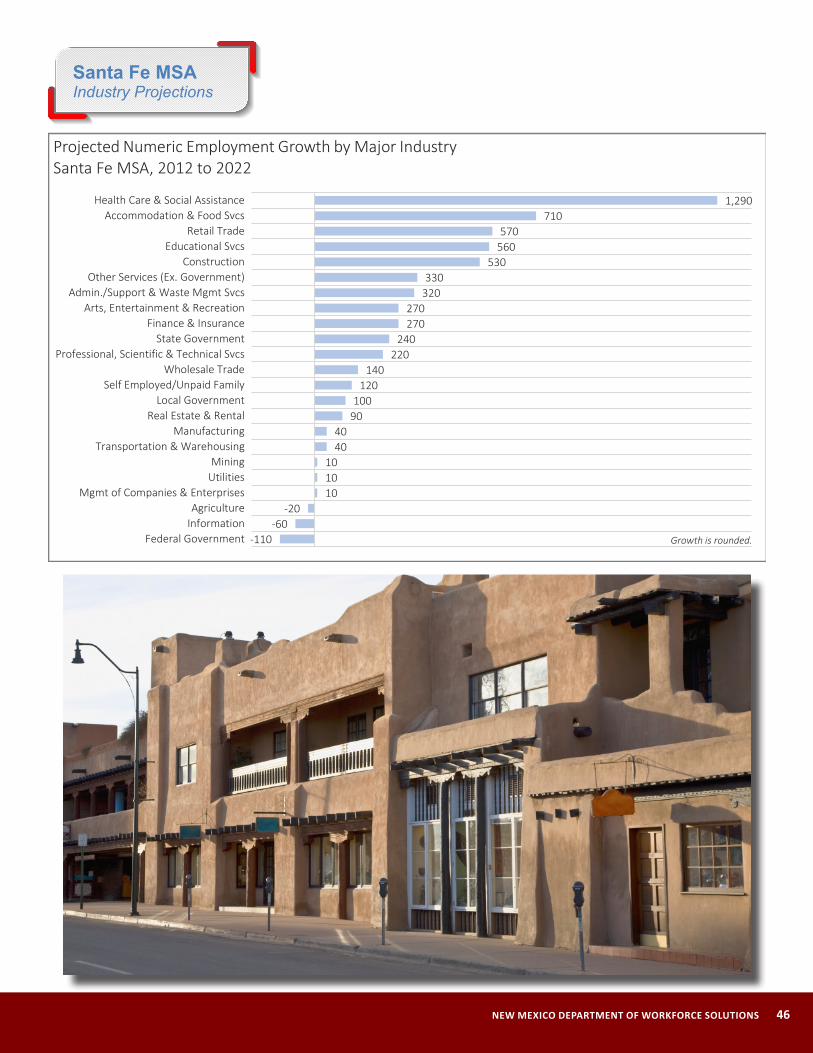
NEW MEXICO DEPARTMENT OF WORKFORCE SOLUTIONS 46
Santa Fe MSA Industry Projections
-110-60
-20101010
4040
90100
120140
220240
270270
320330
530560570
7101,290
Federal GovernmentInformationAgriculture
Mgmt of Companies & EnterprisesUtilitiesMining
Transportation & WarehousingManufacturing
Real Estate & RentalLocal Government
Self Employed/Unpaid FamilyWholesale Trade
Professional, Scientific & Technical SvcsState Government
Finance & InsuranceArts, Entertainment & Recreation
Admin./Support & Waste Mgmt SvcsOther Services (Ex. Government)
ConstructionEducational Svcs
Retail TradeAccommodation & Food Svcs
Health Care & Social Assistance
Projected Numeric Employment Growth by Major IndustrySanta Fe MSA, 2012 to 2022
Growth is rounded.
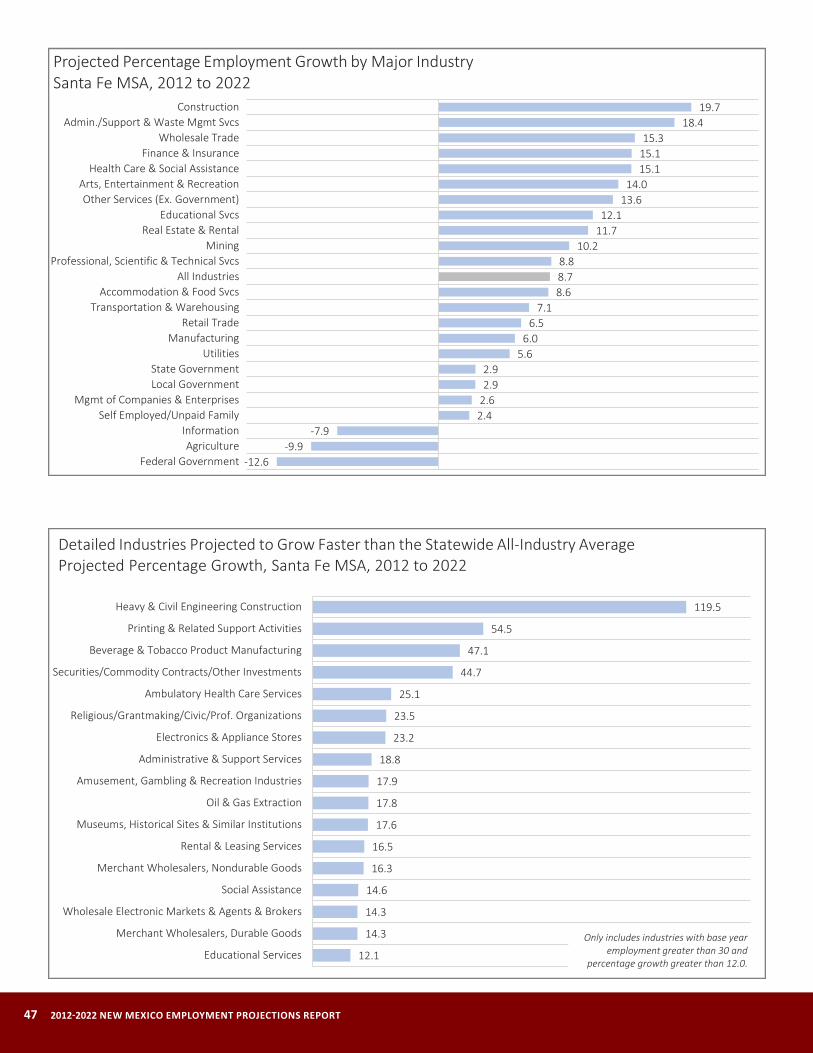
47 2012-2022 NEW MEXICO EMPLOYMENT PROJECTIONS REPORT
-12.6-9.9
-7.92.42.62.92.9
5.66.0
6.57.1
8.68.78.8
10.211.712.1
13.614.0
15.115.115.3
18.419.7
Federal GovernmentAgriculture
InformationSelf Employed/Unpaid Family
Mgmt of Companies & EnterprisesLocal GovernmentState Government
UtilitiesManufacturing
Retail TradeTransportation & Warehousing
Accommodation & Food SvcsAll Industries
Professional, Scientific & Technical SvcsMining
Real Estate & RentalEducational Svcs
Other Services (Ex. Government)Arts, Entertainment & Recreation
Health Care & Social AssistanceFinance & Insurance
Wholesale TradeAdmin./Support & Waste Mgmt Svcs
Construction
Projected Percentage Employment Growth by Major IndustrySanta Fe MSA, 2012 to 2022
12.1
14.3
14.3
14.6
16.3
16.5
17.6
17.8
17.9
18.8
23.2
23.5
25.1
44.7
47.1
54.5
119.5
Educational Services
Merchant Wholesalers, Durable Goods
Wholesale Electronic Markets & Agents & Brokers
Social Assistance
Merchant Wholesalers, Nondurable Goods
Rental & Leasing Services
Museums, Historical Sites & Similar Institutions
Oil & Gas Extraction
Amusement, Gambling & Recreation Industries
Administrative & Support Services
Electronics & Appliance Stores
Religious/Grantmaking/Civic/Prof. Organizations
Ambulatory Health Care Services
Securities/Commodity Contracts/Other Investments
Beverage & Tobacco Product Manufacturing
Printing & Related Support Activities
Heavy & Civil Engineering Construction
Detailed Industries Projected to Grow Faster than the Statewide All-Industry AverageProjected Percentage Growth, Santa Fe MSA, 2012 to 2022
Only includes industries with base year employment greater than 30 and
percentage growth greater than 12.0.
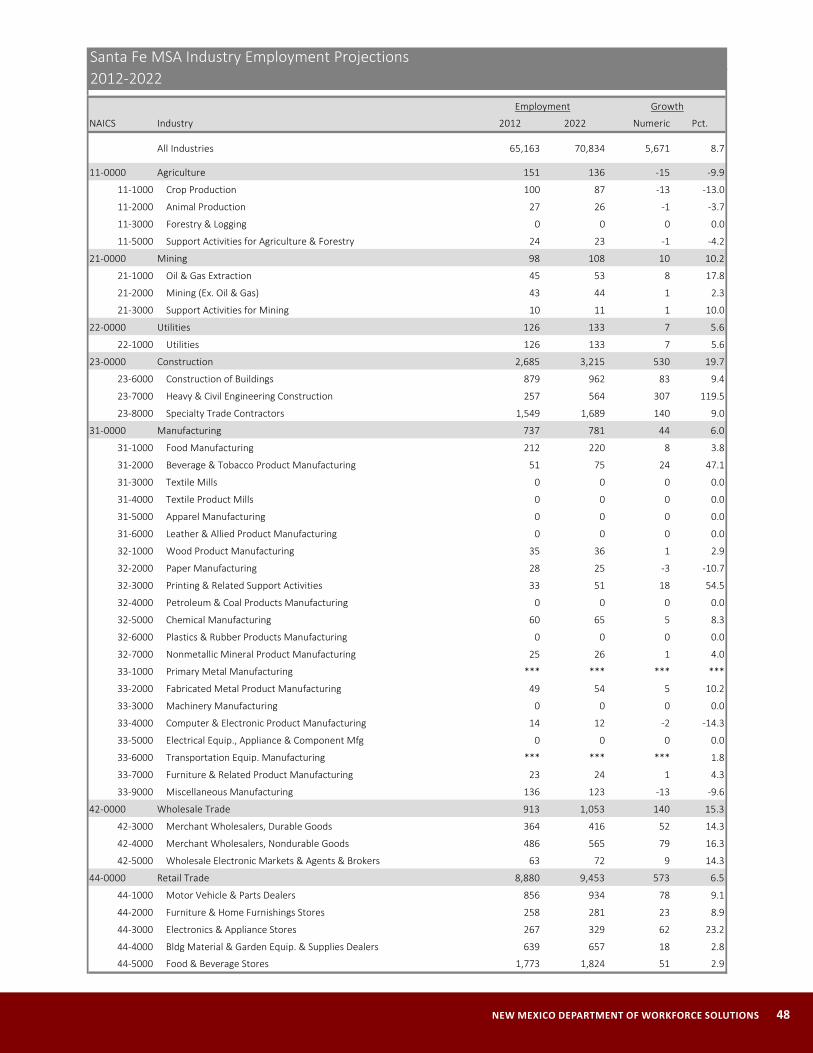
NEW MEXICO DEPARTMENT OF WORKFORCE SOLUTIONS 48
NAICS Industry 2012 2022 Numeric Pct.
All Industries 65,163 70,834 5,671 8.7
11-0000 Agriculture 151 136 -15 -9.9
11-1000 Crop Production 100 87 -13 -13.0
11-2000 Animal Production 27 26 -1 -3.7
11-3000 Forestry & Logging 0 0 0 0.0
11-5000 Support Activities for Agriculture & Forestry 24 23 -1 -4.2
21-0000 Mining 98 108 10 10.2
21-1000 Oil & Gas Extraction 45 53 8 17.8
21-2000 Mining (Ex. Oil & Gas) 43 44 1 2.3
21-3000 Support Activities for Mining 10 11 1 10.0
22-0000 Utilities 126 133 7 5.6
22-1000 Utilities 126 133 7 5.6
23-0000 Construction 2,685 3,215 530 19.7
23-6000 Construction of Buildings 879 962 83 9.4
23-7000 Heavy & Civil Engineering Construction 257 564 307 119.5
23-8000 Specialty Trade Contractors 1,549 1,689 140 9.0
31-0000 Manufacturing 737 781 44 6.0
31-1000 Food Manufacturing 212 220 8 3.8
31-2000 Beverage & Tobacco Product Manufacturing 51 75 24 47.1
31-3000 Textile Mills 0 0 0 0.0
31-4000 Textile Product Mills 0 0 0 0.0
31-5000 Apparel Manufacturing 0 0 0 0.0
31-6000 Leather & Allied Product Manufacturing 0 0 0 0.0
32-1000 Wood Product Manufacturing 35 36 1 2.9
32-2000 Paper Manufacturing 28 25 -3 -10.7
32-3000 Printing & Related Support Activities 33 51 18 54.5
32-4000 Petroleum & Coal Products Manufacturing 0 0 0 0.0
32-5000 Chemical Manufacturing 60 65 5 8.3
32-6000 Plastics & Rubber Products Manufacturing 0 0 0 0.0
32-7000 Nonmetallic Mineral Product Manufacturing 25 26 1 4.0
33-1000 Primary Metal Manufacturing *** *** *** ***
33-2000 Fabricated Metal Product Manufacturing 49 54 5 10.2
33-3000 Machinery Manufacturing 0 0 0 0.0
33-4000 Computer & Electronic Product Manufacturing 14 12 -2 -14.3
33-5000 Electrical Equip., Appliance & Component Mfg 0 0 0 0.0
33-6000 Transportation Equip. Manufacturing *** *** *** 1.8
33-7000 Furniture & Related Product Manufacturing 23 24 1 4.3
33-9000 Miscellaneous Manufacturing 136 123 -13 -9.6
42-0000 Wholesale Trade 913 1,053 140 15.3
42-3000 Merchant Wholesalers, Durable Goods 364 416 52 14.3
42-4000 Merchant Wholesalers, Nondurable Goods 486 565 79 16.3
42-5000 Wholesale Electronic Markets & Agents & Brokers 63 72 9 14.3
44-0000 Retail Trade 8,880 9,453 573 6.5
44-1000 Motor Vehicle & Parts Dealers 856 934 78 9.1
44-2000 Furniture & Home Furnishings Stores 258 281 23 8.9
44-3000 Electronics & Appliance Stores 267 329 62 23.2
44-4000 Bldg Material & Garden Equip. & Supplies Dealers 639 657 18 2.8
44-5000 Food & Beverage Stores 1,773 1,824 51 2.9
Santa Fe MSA Industry Employment Projections2012-2022
Employment Growth
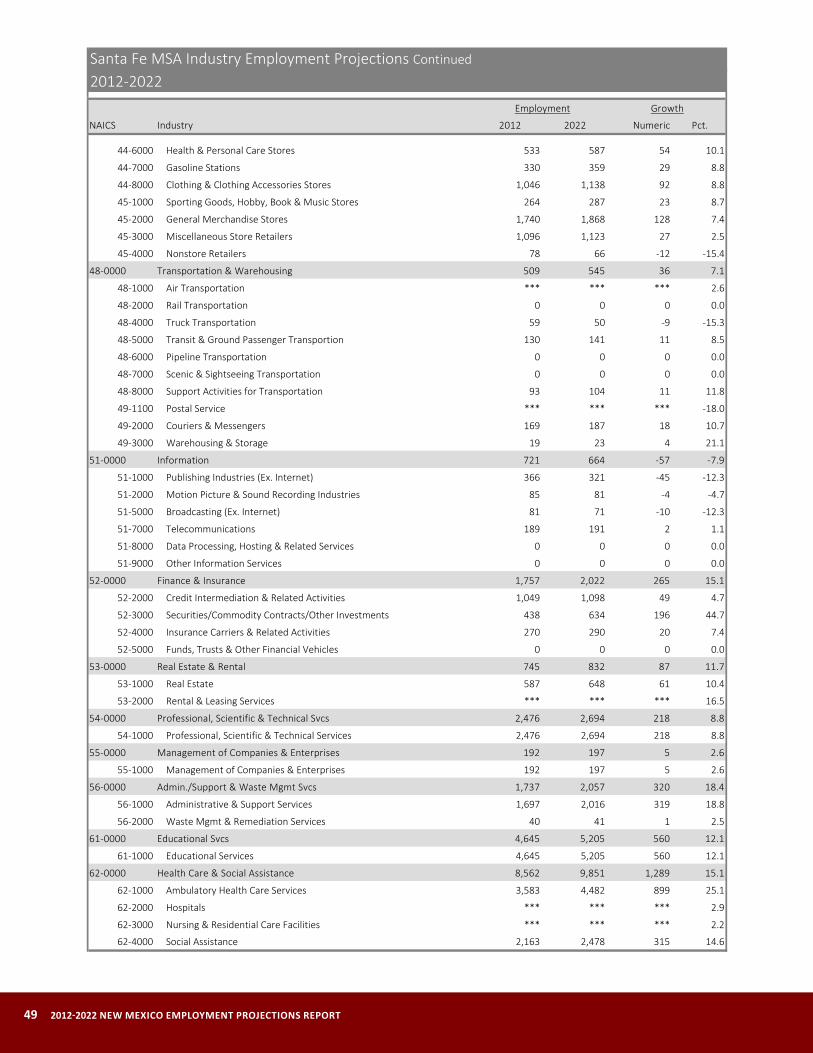
49 2012-2022 NEW MEXICO EMPLOYMENT PROJECTIONS REPORT
NAICS Industry 2012 2022 Numeric Pct.
44-6000 Health & Personal Care Stores 533 587 54 10.1
44-7000 Gasoline Stations 330 359 29 8.8
44-8000 Clothing & Clothing Accessories Stores 1,046 1,138 92 8.8
45-1000 Sporting Goods, Hobby, Book & Music Stores 264 287 23 8.7
45-2000 General Merchandise Stores 1,740 1,868 128 7.4
45-3000 Miscellaneous Store Retailers 1,096 1,123 27 2.5
45-4000 Nonstore Retailers 78 66 -12 -15.4
48-0000 Transportation & Warehousing 509 545 36 7.1
48-1000 Air Transportation *** *** *** 2.6
48-2000 Rail Transportation 0 0 0 0.0
48-4000 Truck Transportation 59 50 -9 -15.3
48-5000 Transit & Ground Passenger Transportion 130 141 11 8.5
48-6000 Pipeline Transportation 0 0 0 0.0
48-7000 Scenic & Sightseeing Transportation 0 0 0 0.0
48-8000 Support Activities for Transportation 93 104 11 11.8
49-1100 Postal Service *** *** *** -18.0
49-2000 Couriers & Messengers 169 187 18 10.7
49-3000 Warehousing & Storage 19 23 4 21.1
51-0000 Information 721 664 -57 -7.9
51-1000 Publishing Industries (Ex. Internet) 366 321 -45 -12.3
51-2000 Motion Picture & Sound Recording Industries 85 81 -4 -4.7
51-5000 Broadcasting (Ex. Internet) 81 71 -10 -12.3
51-7000 Telecommunications 189 191 2 1.1
51-8000 Data Processing, Hosting & Related Services 0 0 0 0.0
51-9000 Other Information Services 0 0 0 0.0
52-0000 Finance & Insurance 1,757 2,022 265 15.1
52-2000 Credit Intermediation & Related Activities 1,049 1,098 49 4.7
52-3000 Securities/Commodity Contracts/Other Investments 438 634 196 44.7
52-4000 Insurance Carriers & Related Activities 270 290 20 7.4
52-5000 Funds, Trusts & Other Financial Vehicles 0 0 0 0.0
53-0000 Real Estate & Rental 745 832 87 11.7
53-1000 Real Estate 587 648 61 10.4
53-2000 Rental & Leasing Services *** *** *** 16.5
54-0000 Professional, Scientific & Technical Svcs 2,476 2,694 218 8.8
54-1000 Professional, Scientific & Technical Services 2,476 2,694 218 8.8
55-0000 Management of Companies & Enterprises 192 197 5 2.6
55-1000 Management of Companies & Enterprises 192 197 5 2.6
56-0000 Admin./Support & Waste Mgmt Svcs 1,737 2,057 320 18.4
56-1000 Administrative & Support Services 1,697 2,016 319 18.8
56-2000 Waste Mgmt & Remediation Services 40 41 1 2.5
61-0000 Educational Svcs 4,645 5,205 560 12.1
61-1000 Educational Services 4,645 5,205 560 12.1
62-0000 Health Care & Social Assistance 8,562 9,851 1,289 15.1
62-1000 Ambulatory Health Care Services 3,583 4,482 899 25.1
62-2000 Hospitals *** *** *** 2.9
62-3000 Nursing & Residential Care Facilities *** *** *** 2.2
62-4000 Social Assistance 2,163 2,478 315 14.6
2012-2022Employment Growth
Santa Fe MSA Industry Employment Projections Continued
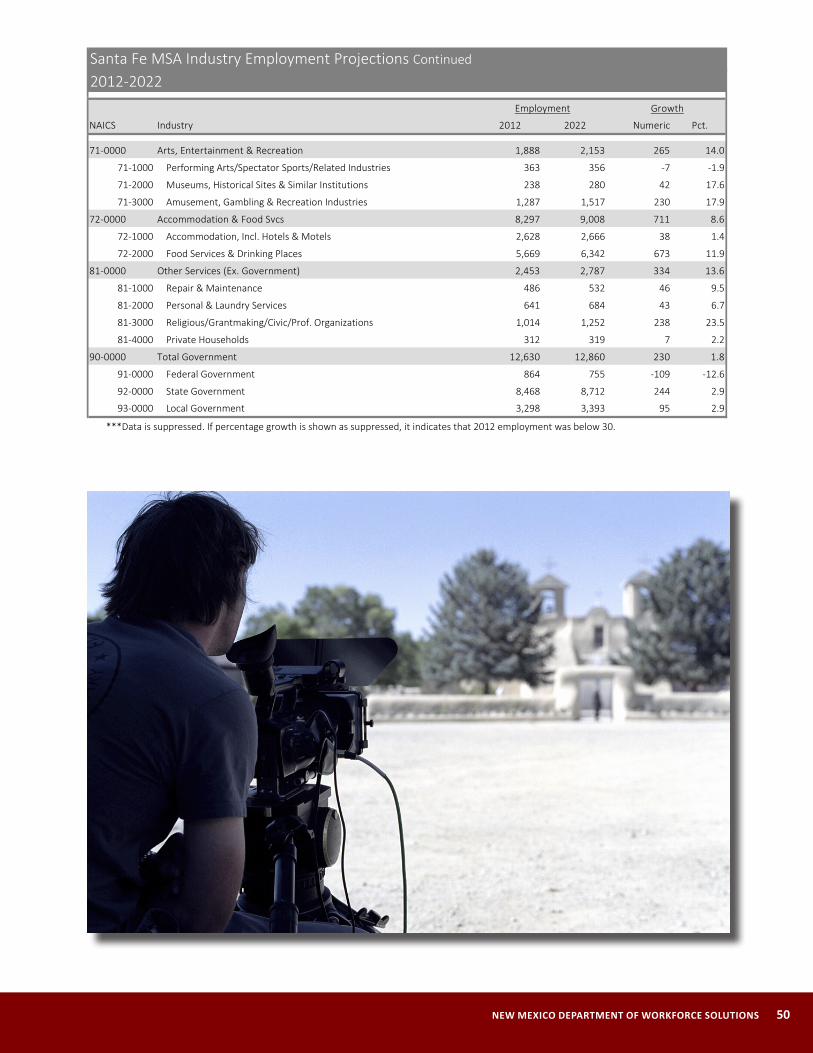
NEW MEXICO DEPARTMENT OF WORKFORCE SOLUTIONS 50
NAICS Industry 2012 2022 Numeric Pct.
71-0000 Arts, Entertainment & Recreation 1,888 2,153 265 14.0
71-1000 Performing Arts/Spectator Sports/Related Industries 363 356 -7 -1.9
71-2000 Museums, Historical Sites & Similar Institutions 238 280 42 17.6
71-3000 Amusement, Gambling & Recreation Industries 1,287 1,517 230 17.9
72-0000 Accommodation & Food Svcs 8,297 9,008 711 8.6
72-1000 Accommodation, Incl. Hotels & Motels 2,628 2,666 38 1.4
72-2000 Food Services & Drinking Places 5,669 6,342 673 11.9
81-0000 Other Services (Ex. Government) 2,453 2,787 334 13.6
81-1000 Repair & Maintenance 486 532 46 9.5
81-2000 Personal & Laundry Services 641 684 43 6.7
81-3000 Religious/Grantmaking/Civic/Prof. Organizations 1,014 1,252 238 23.5
81-4000 Private Households 312 319 7 2.2
90-0000 Total Government 12,630 12,860 230 1.8
91-0000 Federal Government 864 755 -109 -12.6
92-0000 State Government 8,468 8,712 244 2.9
93-0000 Local Government 3,298 3,393 95 2.9
***Data is suppressed. If percentage growth is shown as suppressed, it indicates that 2012 employment was below 30.
Employment Growth
Santa Fe MSA Industry Employment Projections Continued
2012-2022
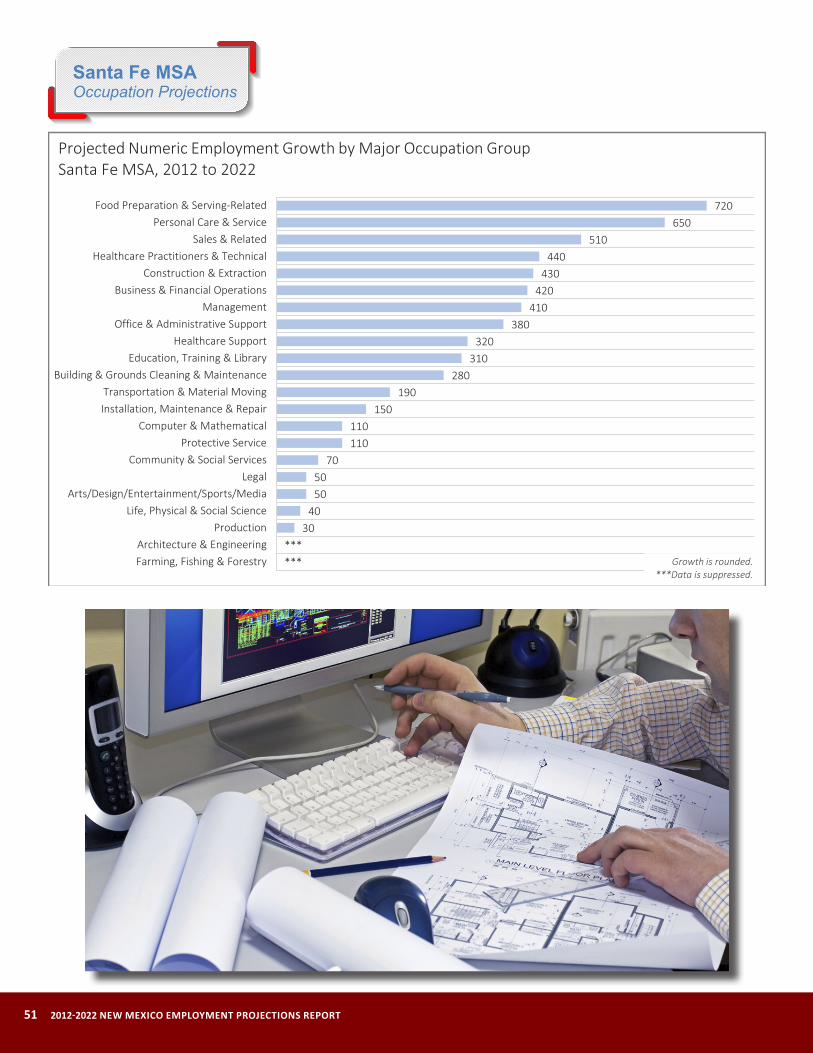
51 2012-2022 NEW MEXICO EMPLOYMENT PROJECTIONS REPORT
Santa Fe MSA Occupation Projections
******
3040
5050
70110110
150190
280310
320380
410420
430440
510650
720
Farming, Fishing & ForestryArchitecture & Engineering
ProductionLife, Physical & Social Science
Arts/Design/Entertainment/Sports/MediaLegal
Community & Social ServicesProtective Service
Computer & MathematicalInstallation, Maintenance & RepairTransportation & Material Moving
Building & Grounds Cleaning & MaintenanceEducation, Training & Library
Healthcare SupportOffice & Administrative Support
ManagementBusiness & Financial Operations
Construction & ExtractionHealthcare Practitioners & Technical
Sales & RelatedPersonal Care & Service
Food Preparation & Serving-Related
Growth is rounded.***Data is suppressed.
Projected Numeric Employment Growth by Major Occupation GroupSanta Fe MSA, 2012 to 2022
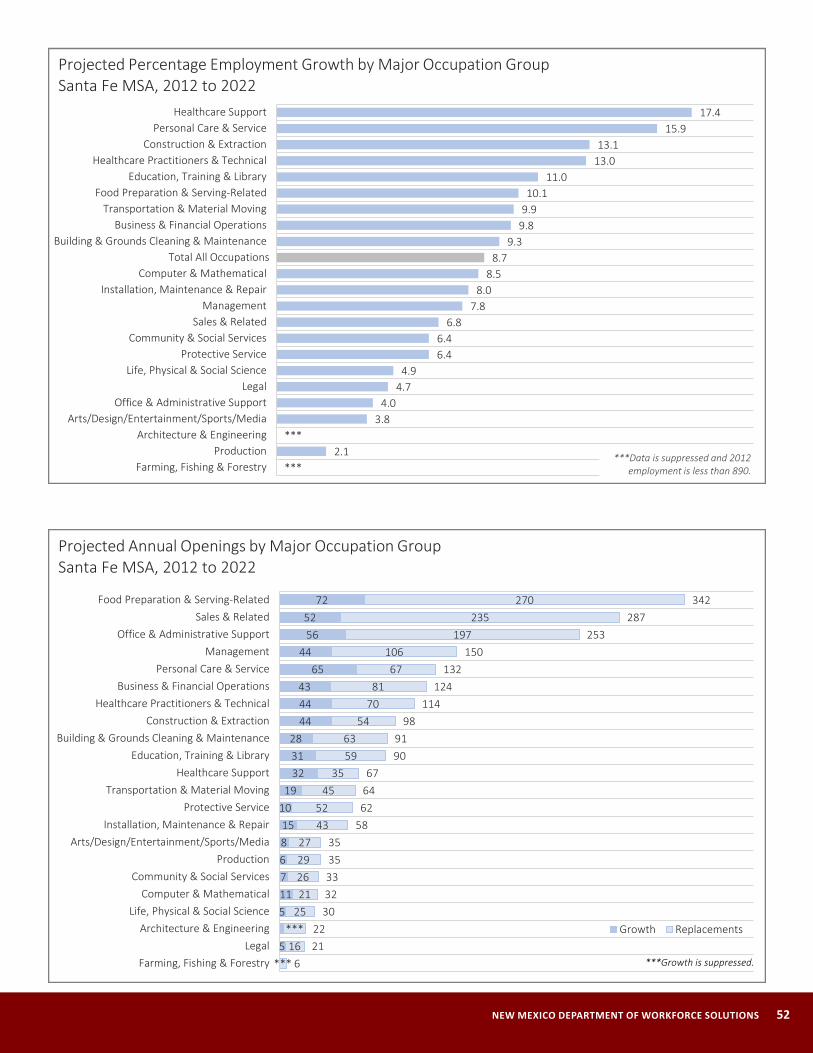
NEW MEXICO DEPARTMENT OF WORKFORCE SOLUTIONS 52
***2.1
***3.8
4.04.74.9
6.46.4
6.87.8
8.08.5
8.79.3
9.89.910.1
11.013.013.1
15.917.4
Farming, Fishing & ForestryProduction
Architecture & EngineeringArts/Design/Entertainment/Sports/Media
Office & Administrative SupportLegal
Life, Physical & Social ScienceProtective Service
Community & Social ServicesSales & Related
ManagementInstallation, Maintenance & Repair
Computer & MathematicalTotal All Occupations
Building & Grounds Cleaning & MaintenanceBusiness & Financial Operations
Transportation & Material MovingFood Preparation & Serving-Related
Education, Training & LibraryHealthcare Practitioners & Technical
Construction & ExtractionPersonal Care & Service
Healthcare Support
Projected Percentage Employment Growth by Major Occupation GroupSanta Fe MSA, 2012 to 2022
***Data is suppressed and 2012 employment is less than 890.
5
51176815
1019
323128
444443
6544
5652
72
***16
***2521262927
4352
4535
5963
547081
67106
197235
270
62122
3032333535
58626467
9091
98114
124132
150253
287342
Farming, Fishing & ForestryLegal
Architecture & EngineeringLife, Physical & Social Science
Computer & MathematicalCommunity & Social Services
ProductionArts/Design/Entertainment/Sports/Media
Installation, Maintenance & RepairProtective Service
Transportation & Material MovingHealthcare Support
Education, Training & LibraryBuilding & Grounds Cleaning & Maintenance
Construction & ExtractionHealthcare Practitioners & Technical
Business & Financial OperationsPersonal Care & Service
ManagementOffice & Administrative Support
Sales & RelatedFood Preparation & Serving-Related
Growth Replacements
Projected Annual Openings by Major Occupation GroupSanta Fe MSA, 2012 to 2022
***Growth is suppressed.

53 2012-2022 NEW MEXICO EMPLOYMENT PROJECTIONS REPORT
303030
***30
***404040
***404040
50606060
7070
130140
170190
***460
Physical TherapistsDriver/Sales Workers
Lifeguards, Ski Patrol & Other Recreational Protective Service WorkersCoaches & Scouts
Market Research Analysts & Marketing SpecialistsHealth Technologists & Technicians, All Other
Securities, Commodities & Financial Services Sales AgentsSales Reps, Wholesale & Mfg, Ex. Technical & Scientific Products
Financial AnalystsAmusement & Recreation Attendants
Light Truck or Delivery Services DriversCounter & Rental Clerks
Medical AssistantsSupervisors of Construction Trades & Extraction Work
Operating Engineers & Other Construction Equipment OperatorsPersonal Financial Advisors
BartendersElementary School Teachers, Ex. Special Education
Supervisors of Food Preparation & Serving WorkersLandscaping & Groundskeeping Workers
Combined Food Preparation & Serving Workers, Incl. Fast FoodCooks, Restaurant
Construction LaborersHome Health Aides
Personal Care Aides
Top 25 Occupations with the Most Projected Employment GrowthSanta Fe MSA, 2012 to 2022
Growth is rounded.***Growth is suppressed.
Only includes occupations with rates of growth that exceed the state's all-occupation average of 12 percent.
20.820.821.021.421.421.722.222.923.324.024.424.6
25.825.8
27.027.628.1
29.030.2
32.234.034.1
36.439.3
41.5
Medical Scientists, Ex. EpidemiologistsMedical Secretaries
Securities, Commodities & Financial Services Sales AgentsConstruction Laborers
PhlebotomistsHelpers--Electricians
Skincare SpecialistsSoftware Developers, Systems Software
Medical & Clinical Laboratory TechniciansOccupational Therapists
Personal Care AidesNurse PractitionersPhysical Therapists
Cement Masons & Concrete FinishersMeeting, Convention & Event Planners
Cost EstimatorsFinancial Analysts
Physician AssistantsHealth Technologists & Technicians, All Other
Operating Engineers & Other Construction Equipment OperatorsMarket Research Analysts & Marketing Specialists
Physical Therapist AssistantsDiagnostic Medical Sonographers
Home Health AidesPersonal Financial Advisors
Only includes occupations with 2012 employment greater than 15.
Top 25 Occupations with the Fastest Projected Employment GrowthProjected Percentage Growth, Santa Fe MSA, 2012 to 2022
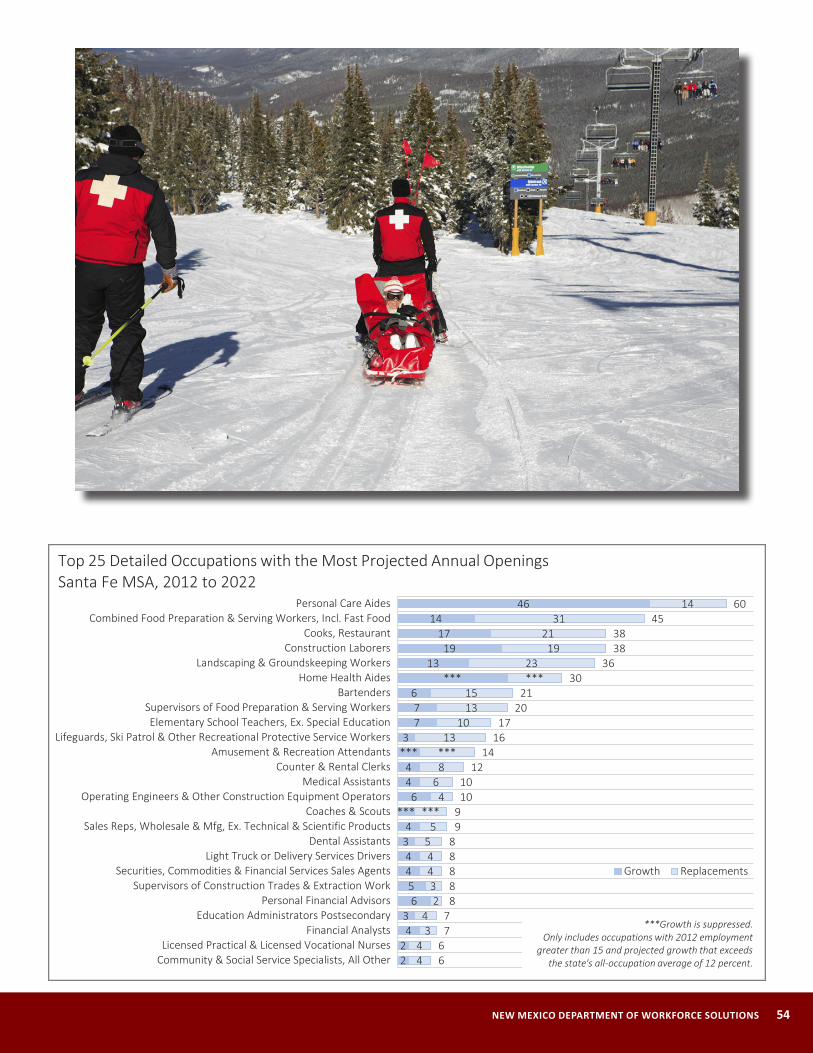
NEW MEXICO DEPARTMENT OF WORKFORCE SOLUTIONS 54
22
43
65
44
34
***6
44
***3
77
6***
1319
1714
46
44
34
23
44
55
***4
68***
1310
1315
***23
1921
3114
66
77
88888
991010
1214
1617
2021
3036
3838
4560
Community & Social Service Specialists, All OtherLicensed Practical & Licensed Vocational Nurses
Financial AnalystsEducation Administrators Postsecondary
Personal Financial AdvisorsSupervisors of Construction Trades & Extraction Work
Securities, Commodities & Financial Services Sales AgentsLight Truck or Delivery Services Drivers
Dental AssistantsSales Reps, Wholesale & Mfg, Ex. Technical & Scientific Products
Coaches & ScoutsOperating Engineers & Other Construction Equipment Operators
Medical AssistantsCounter & Rental Clerks
Amusement & Recreation AttendantsLifeguards, Ski Patrol & Other Recreational Protective Service Workers
Elementary School Teachers, Ex. Special EducationSupervisors of Food Preparation & Serving Workers
BartendersHome Health Aides
Landscaping & Groundskeeping WorkersConstruction Laborers
Cooks, RestaurantCombined Food Preparation & Serving Workers, Incl. Fast Food
Personal Care Aides
Growth Replacements
Top 25 Detailed Occupations with the Most Projected Annual OpeningsSanta Fe MSA, 2012 to 2022
***Growth is suppressed.Only includes occupations with 2012 employment
greater than 15 and projected growth that exceeds the state's all-occupation average of 12 percent.
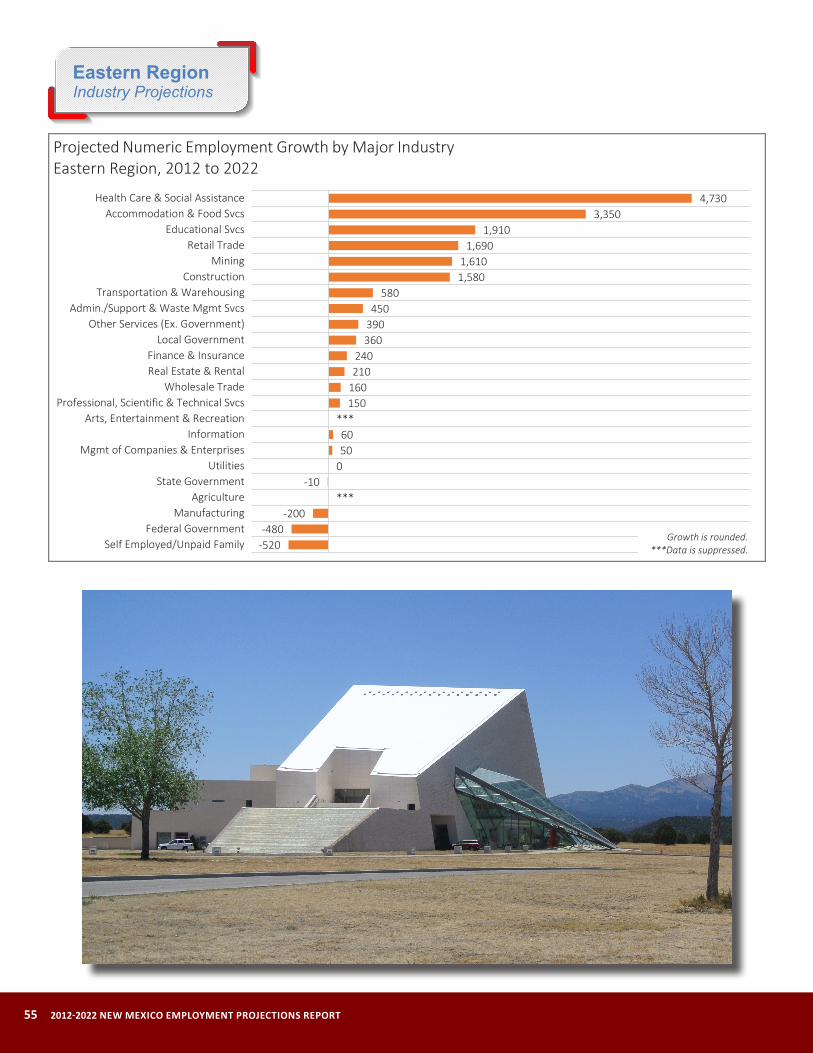
55 2012-2022 NEW MEXICO EMPLOYMENT PROJECTIONS REPORT
Eastern Region Industry Projections
-520-480
-200***
-1005060
***150160210240
360390450
5801,5801,610
1,6901,910
3,3504,730
Self Employed/Unpaid FamilyFederal Government
ManufacturingAgriculture
State GovernmentUtilities
Mgmt of Companies & EnterprisesInformation
Arts, Entertainment & RecreationProfessional, Scientific & Technical Svcs
Wholesale TradeReal Estate & RentalFinance & Insurance
Local GovernmentOther Services (Ex. Government)
Admin./Support & Waste Mgmt SvcsTransportation & Warehousing
ConstructionMining
Retail TradeEducational Svcs
Accommodation & Food SvcsHealth Care & Social Assistance
Projected Numeric Employment Growth by Major IndustryEastern Region, 2012 to 2022
Growth is rounded.***Data is suppressed.

NEW MEXICO DEPARTMENT OF WORKFORCE SOLUTIONS 56
-11.6-5.5
-4.7-0.5-0.2-0.2
4.54.84.9
5.86.8
7.7***
8.310.9
11.711.711.8
13.413.9
15.619.9
24.230.2
Federal GovernmentManufacturing
Self Employed/Unpaid FamilyAgriculture
State GovernmentUtilities
InformationProfessional, Scientific & Technical Svcs
Wholesale TradeLocal Government
Mgmt of Companies & EnterprisesFinance & Insurance
Arts, Entertainment & RecreationAdmin./Support & Waste Mgmt Svcs
Retail TradeOther Services (Ex. Government)
All IndustriesMining
Transportation & WarehousingReal Estate & Rental
Educational SvcsConstruction
Accommodation & Food SvcsHealth Care & Social Assistance
Projected Percentage Employment Growth by Major IndustryEastern Region, 2012 to 2022
***Data is suppressed and 2012 employment is less than 1,260.

57 2012-2022 NEW MEXICO EMPLOYMENT PROJECTIONS REPORT
12.312.5
13.415.616.016.116.216.5
18.118.418.5
20.322.322.7
24.025.926.6
32.132.3
34.034.435.235.736.1
38.640.6
42.748.2
59.3
Specialty Trade ContractorsGeneral Merchandise Stores
Truck TransportationEducational Services
Support Activities for TransportationMuseums, Historical Sites & Similar Institutions
Rental & Leasing ServicesHealth & Personal Care Stores
Merchant Wholesalers, Durable GoodsTransit & Ground Passenger Transportion
Accommodation, Incl. Hotels & MotelsPrivate Households
HospitalsWarehousing & Storage
Heavy & Civil Engineering ConstructionFood Services & Drinking Places
Nursing & Residential Care FacilitiesWaste Mgmt & Remediation Services
Ambulatory Health Care ServicesConstruction of Buildings
Religious/Grantmaking/Civic/Prof. OrganizationsSporting Goods, Hobby, Book & Music Stores
Bldg Material & Garden Equip. & Supplies DealersCouriers & Messengers
Social AssistanceBeverage & Tobacco Product Manufacturing
Oil & Gas ExtractionWholesale Electronic Markets & Agents & Brokers
Motion Picture & Sound Recording Industries
Detailed Industries Projected to Grow Faster than the Statewide All-Industry AverageProjected Percentage Growth, Eastern Region, 2012 to 2022
Only includes industries with base year employment greater than 35 and
percentage growth greater than 12.0.
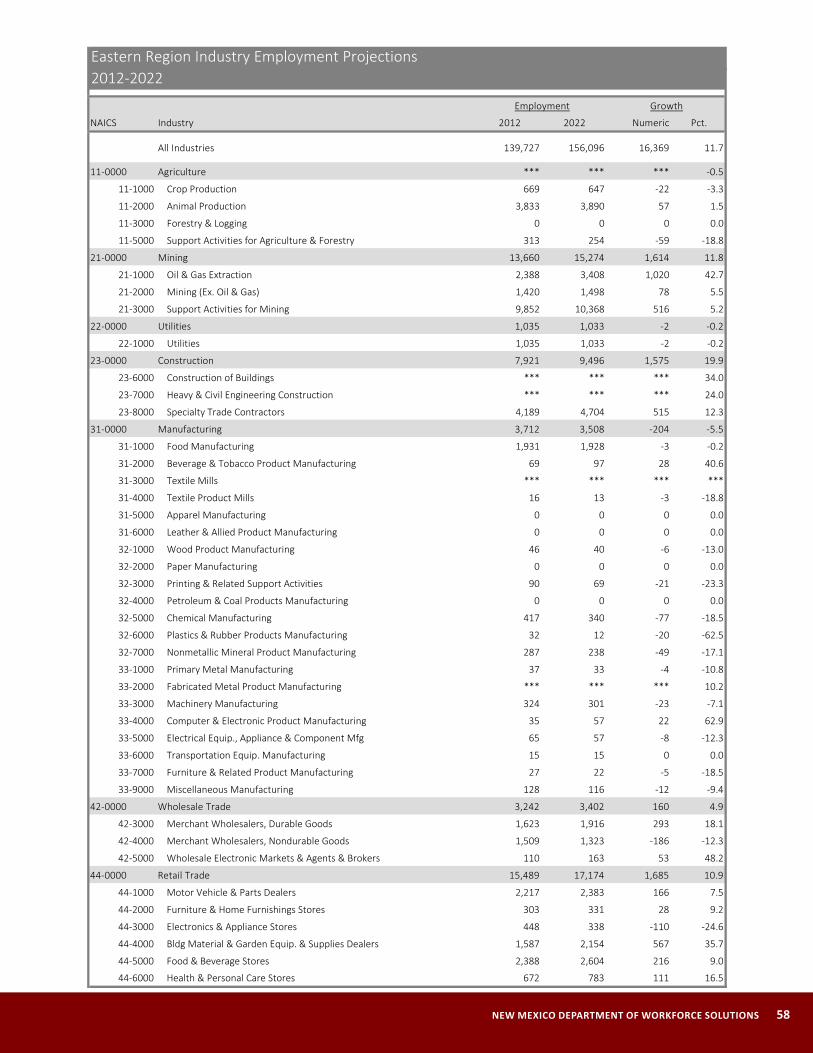
NEW MEXICO DEPARTMENT OF WORKFORCE SOLUTIONS 58
NAICS Industry 2012 2022 Numeric Pct.
All Industries 139,727 156,096 16,369 11.7
11-0000 Agriculture *** *** *** -0.5
11-1000 Crop Production 669 647 -22 -3.3
11-2000 Animal Production 3,833 3,890 57 1.5
11-3000 Forestry & Logging 0 0 0 0.0
11-5000 Support Activities for Agriculture & Forestry 313 254 -59 -18.8
21-0000 Mining 13,660 15,274 1,614 11.8
21-1000 Oil & Gas Extraction 2,388 3,408 1,020 42.7
21-2000 Mining (Ex. Oil & Gas) 1,420 1,498 78 5.5
21-3000 Support Activities for Mining 9,852 10,368 516 5.2
22-0000 Utilities 1,035 1,033 -2 -0.2
22-1000 Utilities 1,035 1,033 -2 -0.2
23-0000 Construction 7,921 9,496 1,575 19.9
23-6000 Construction of Buildings *** *** *** 34.0
23-7000 Heavy & Civil Engineering Construction *** *** *** 24.0
23-8000 Specialty Trade Contractors 4,189 4,704 515 12.3
31-0000 Manufacturing 3,712 3,508 -204 -5.5
31-1000 Food Manufacturing 1,931 1,928 -3 -0.2
31-2000 Beverage & Tobacco Product Manufacturing 69 97 28 40.6
31-3000 Textile Mills *** *** *** ***
31-4000 Textile Product Mills 16 13 -3 -18.8
31-5000 Apparel Manufacturing 0 0 0 0.0
31-6000 Leather & Allied Product Manufacturing 0 0 0 0.0
32-1000 Wood Product Manufacturing 46 40 -6 -13.0
32-2000 Paper Manufacturing 0 0 0 0.0
32-3000 Printing & Related Support Activities 90 69 -21 -23.3
32-4000 Petroleum & Coal Products Manufacturing 0 0 0 0.0
32-5000 Chemical Manufacturing 417 340 -77 -18.5
32-6000 Plastics & Rubber Products Manufacturing 32 12 -20 -62.5
32-7000 Nonmetallic Mineral Product Manufacturing 287 238 -49 -17.1
33-1000 Primary Metal Manufacturing 37 33 -4 -10.8
33-2000 Fabricated Metal Product Manufacturing *** *** *** 10.2
33-3000 Machinery Manufacturing 324 301 -23 -7.1
33-4000 Computer & Electronic Product Manufacturing 35 57 22 62.9
33-5000 Electrical Equip., Appliance & Component Mfg 65 57 -8 -12.3
33-6000 Transportation Equip. Manufacturing 15 15 0 0.0
33-7000 Furniture & Related Product Manufacturing 27 22 -5 -18.5
33-9000 Miscellaneous Manufacturing 128 116 -12 -9.4
42-0000 Wholesale Trade 3,242 3,402 160 4.9
42-3000 Merchant Wholesalers, Durable Goods 1,623 1,916 293 18.1
42-4000 Merchant Wholesalers, Nondurable Goods 1,509 1,323 -186 -12.3
42-5000 Wholesale Electronic Markets & Agents & Brokers 110 163 53 48.2
44-0000 Retail Trade 15,489 17,174 1,685 10.9
44-1000 Motor Vehicle & Parts Dealers 2,217 2,383 166 7.5
44-2000 Furniture & Home Furnishings Stores 303 331 28 9.2
44-3000 Electronics & Appliance Stores 448 338 -110 -24.6
44-4000 Bldg Material & Garden Equip. & Supplies Dealers 1,587 2,154 567 35.7
44-5000 Food & Beverage Stores 2,388 2,604 216 9.0
44-6000 Health & Personal Care Stores 672 783 111 16.5
Eastern Region Industry Employment Projections2012-2022
Employment Growth
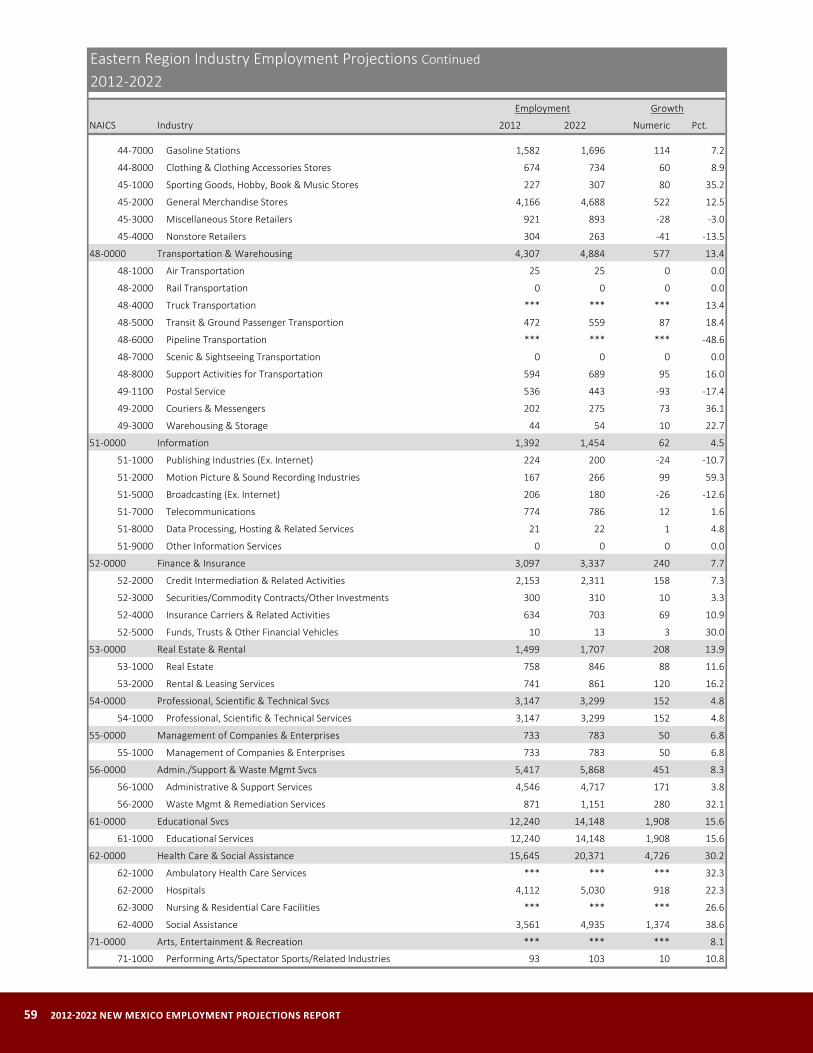
59 2012-2022 NEW MEXICO EMPLOYMENT PROJECTIONS REPORT
NAICS Industry 2012 2022 Numeric Pct.
44-7000 Gasoline Stations 1,582 1,696 114 7.2
44-8000 Clothing & Clothing Accessories Stores 674 734 60 8.9
45-1000 Sporting Goods, Hobby, Book & Music Stores 227 307 80 35.2
45-2000 General Merchandise Stores 4,166 4,688 522 12.5
45-3000 Miscellaneous Store Retailers 921 893 -28 -3.0
45-4000 Nonstore Retailers 304 263 -41 -13.5
48-0000 Transportation & Warehousing 4,307 4,884 577 13.4
48-1000 Air Transportation 25 25 0 0.0
48-2000 Rail Transportation 0 0 0 0.0
48-4000 Truck Transportation *** *** *** 13.4
48-5000 Transit & Ground Passenger Transportion 472 559 87 18.4
48-6000 Pipeline Transportation *** *** *** -48.6
48-7000 Scenic & Sightseeing Transportation 0 0 0 0.0
48-8000 Support Activities for Transportation 594 689 95 16.0
49-1100 Postal Service 536 443 -93 -17.4
49-2000 Couriers & Messengers 202 275 73 36.1
49-3000 Warehousing & Storage 44 54 10 22.7
51-0000 Information 1,392 1,454 62 4.5
51-1000 Publishing Industries (Ex. Internet) 224 200 -24 -10.7
51-2000 Motion Picture & Sound Recording Industries 167 266 99 59.3
51-5000 Broadcasting (Ex. Internet) 206 180 -26 -12.6
51-7000 Telecommunications 774 786 12 1.6
51-8000 Data Processing, Hosting & Related Services 21 22 1 4.8
51-9000 Other Information Services 0 0 0 0.0
52-0000 Finance & Insurance 3,097 3,337 240 7.7
52-2000 Credit Intermediation & Related Activities 2,153 2,311 158 7.3
52-3000 Securities/Commodity Contracts/Other Investments 300 310 10 3.3
52-4000 Insurance Carriers & Related Activities 634 703 69 10.9
52-5000 Funds, Trusts & Other Financial Vehicles 10 13 3 30.0
53-0000 Real Estate & Rental 1,499 1,707 208 13.9
53-1000 Real Estate 758 846 88 11.6
53-2000 Rental & Leasing Services 741 861 120 16.2
54-0000 Professional, Scientific & Technical Svcs 3,147 3,299 152 4.8
54-1000 Professional, Scientific & Technical Services 3,147 3,299 152 4.8
55-0000 Management of Companies & Enterprises 733 783 50 6.8
55-1000 Management of Companies & Enterprises 733 783 50 6.8
56-0000 Admin./Support & Waste Mgmt Svcs 5,417 5,868 451 8.3
56-1000 Administrative & Support Services 4,546 4,717 171 3.8
56-2000 Waste Mgmt & Remediation Services 871 1,151 280 32.1
61-0000 Educational Svcs 12,240 14,148 1,908 15.6
61-1000 Educational Services 12,240 14,148 1,908 15.6
62-0000 Health Care & Social Assistance 15,645 20,371 4,726 30.2
62-1000 Ambulatory Health Care Services *** *** *** 32.3
62-2000 Hospitals 4,112 5,030 918 22.3
62-3000 Nursing & Residential Care Facilities *** *** *** 26.6
62-4000 Social Assistance 3,561 4,935 1,374 38.6
71-0000 Arts, Entertainment & Recreation *** *** *** 8.1
71-1000 Performing Arts/Spectator Sports/Related Industries 93 103 10 10.8
2012-2022Employment Growth
Eastern Region Industry Employment Projections Continued
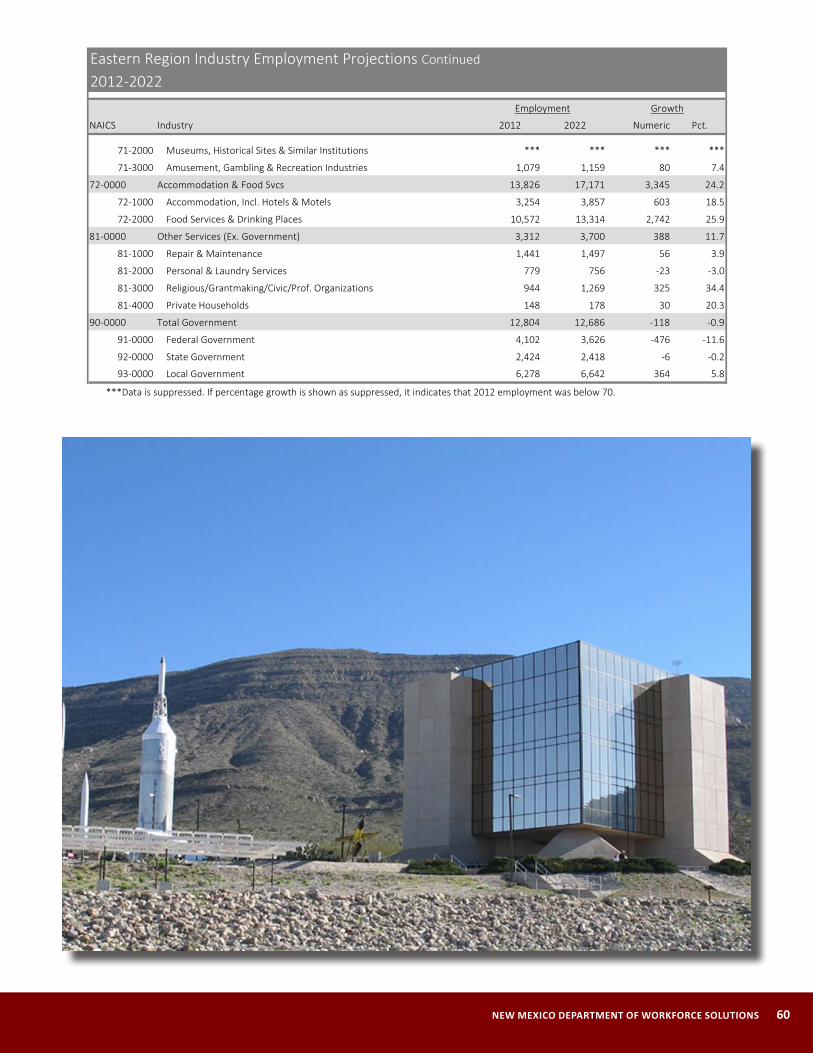
NEW MEXICO DEPARTMENT OF WORKFORCE SOLUTIONS 60
NAICS Industry 2012 2022 Numeric Pct.
71-2000 Museums, Historical Sites & Similar Institutions *** *** *** ***
71-3000 Amusement, Gambling & Recreation Industries 1,079 1,159 80 7.4
72-0000 Accommodation & Food Svcs 13,826 17,171 3,345 24.2
72-1000 Accommodation, Incl. Hotels & Motels 3,254 3,857 603 18.5
72-2000 Food Services & Drinking Places 10,572 13,314 2,742 25.9
81-0000 Other Services (Ex. Government) 3,312 3,700 388 11.7
81-1000 Repair & Maintenance 1,441 1,497 56 3.9
81-2000 Personal & Laundry Services 779 756 -23 -3.0
81-3000 Religious/Grantmaking/Civic/Prof. Organizations 944 1,269 325 34.4
81-4000 Private Households 148 178 30 20.3
90-0000 Total Government 12,804 12,686 -118 -0.9
91-0000 Federal Government 4,102 3,626 -476 -11.6
92-0000 State Government 2,424 2,418 -6 -0.2
93-0000 Local Government 6,278 6,642 364 5.8
***Data is suppressed. If percentage growth is shown as suppressed, it indicates that 2012 employment was below 70.
Employment Growth
Eastern Region Industry Employment Projections Continued
2012-2022
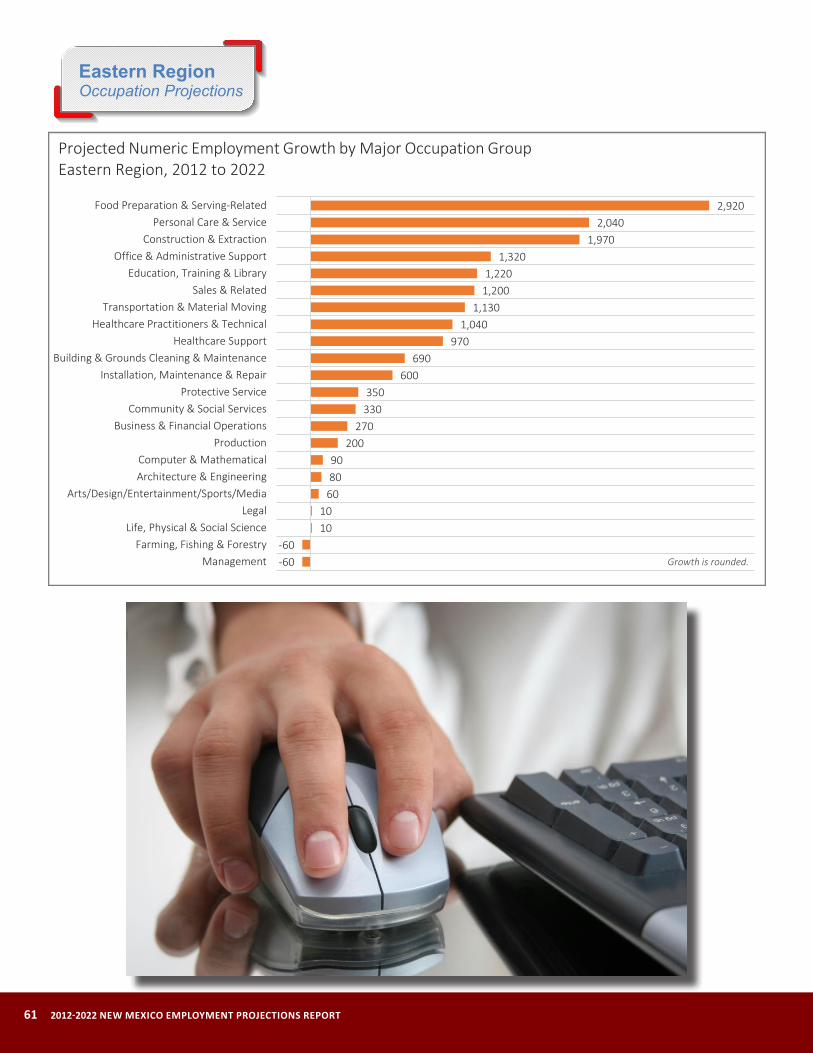
61 2012-2022 NEW MEXICO EMPLOYMENT PROJECTIONS REPORT
Eastern Region Occupation Projections
-60-60
1010
608090
200270
330350
600690
9701,040
1,1301,2001,220
1,3201,970
2,0402,920
ManagementFarming, Fishing & Forestry
Life, Physical & Social ScienceLegal
Arts/Design/Entertainment/Sports/MediaArchitecture & EngineeringComputer & Mathematical
ProductionBusiness & Financial Operations
Community & Social ServicesProtective Service
Installation, Maintenance & RepairBuilding & Grounds Cleaning & Maintenance
Healthcare SupportHealthcare Practitioners & Technical
Transportation & Material MovingSales & Related
Education, Training & LibraryOffice & Administrative Support
Construction & ExtractionPersonal Care & Service
Food Preparation & Serving-Related
Growth is rounded.
Projected Numeric Employment Growth by Major Occupation GroupEastern Region, 2012 to 2022

NEW MEXICO DEPARTMENT OF WORKFORCE SOLUTIONS 62
-1.9-0.5
0.81.8
3.84.4
7.27.2
7.98.7
9.59.59.8
10.911.712.012.5
15.516.8
19.423.7
28.433.7
Farming, Fishing & ForestryManagement
Life, Physical & Social ScienceLegal
ProductionArchitecture & Engineering
Arts/Design/Entertainment/Sports/MediaOffice & Administrative SupportBusiness & Financial Operations
Installation, Maintenance & RepairSales & Related
Computer & MathematicalProtective Service
Transportation & Material MovingTotal All Occupations
Construction & ExtractionBuilding & Grounds Cleaning & Maintenance
Education, Training & LibraryCommunity & Social Services
Healthcare Practitioners & TechnicalFood Preparation & Serving-Related
Healthcare SupportPersonal Care & Service
Projected Percentage Employment Growth by Major Occupation GroupEastern Region, 2012 to 2022
19
10511
331283529
9869
10463
12372
205114123
161198
292
1015
214041
4693
6899128
66112
109165
169221
91237
412378
371444
112431
4552
799496
134157164
181213
228292293296
351535539
569736
LegalComputer & Mathematical
Arts/Design/Entertainment/Sports/MediaLife, Physical & Social Science
Architecture & EngineeringCommunity & Social Services
Farming, Fishing & ForestryBusiness & Financial Operations
Protective ServiceProduction
Healthcare SupportBuilding & Grounds Cleaning & Maintenance
Healthcare Practitioners & TechnicalInstallation, Maintenance & Repair
Education, Training & LibraryManagement
Personal Care & ServiceTransportation & Material Moving
Sales & RelatedOffice & Administrative Support
Construction & ExtractionFood Preparation & Serving-Related
Growth Replacements
Projected Annual Openings by Major Occupation GroupEastern Region, 2012 to 2022
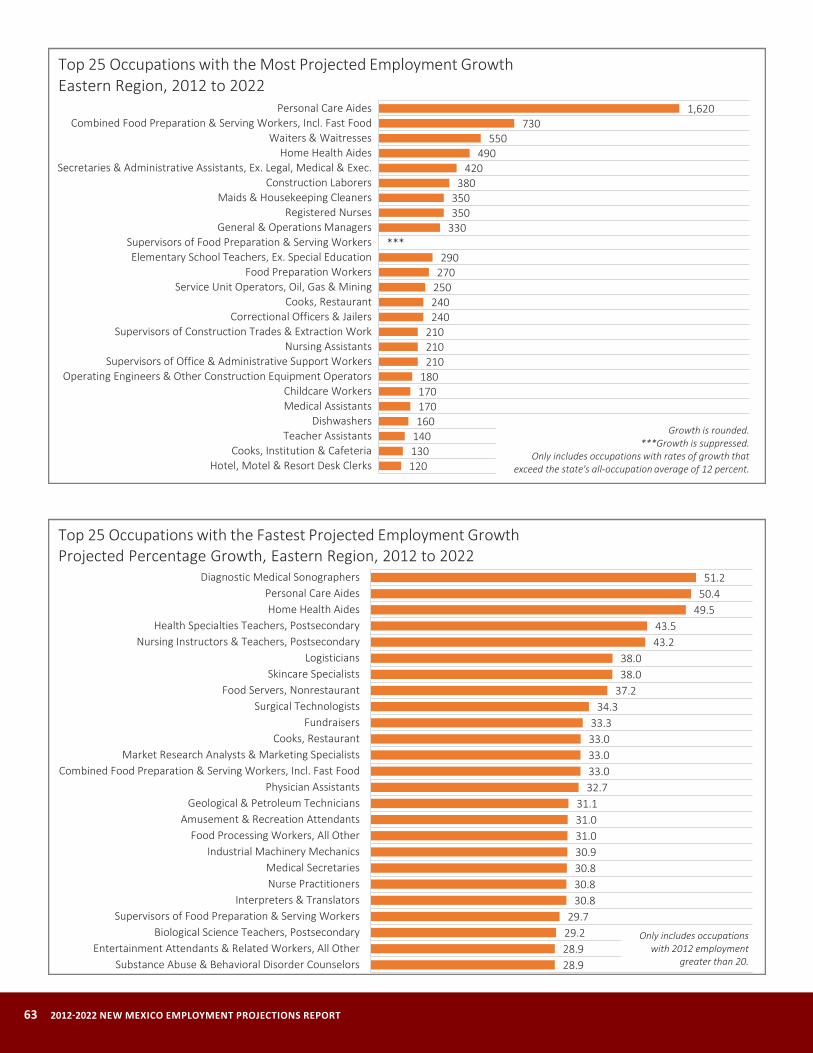
63 2012-2022 NEW MEXICO EMPLOYMENT PROJECTIONS REPORT
120130140160170170180
210210210
240240250270290
***330350350
380420
490550
7301,620
Hotel, Motel & Resort Desk ClerksCooks, Institution & Cafeteria
Teacher AssistantsDishwashers
Medical AssistantsChildcare Workers
Operating Engineers & Other Construction Equipment OperatorsSupervisors of Office & Administrative Support Workers
Nursing AssistantsSupervisors of Construction Trades & Extraction Work
Correctional Officers & JailersCooks, Restaurant
Service Unit Operators, Oil, Gas & MiningFood Preparation Workers
Elementary School Teachers, Ex. Special EducationSupervisors of Food Preparation & Serving Workers
General & Operations ManagersRegistered Nurses
Maids & Housekeeping CleanersConstruction Laborers
Secretaries & Administrative Assistants, Ex. Legal, Medical & Exec.Home Health Aides
Waiters & WaitressesCombined Food Preparation & Serving Workers, Incl. Fast Food
Personal Care Aides
Top 25 Occupations with the Most Projected Employment GrowthEastern Region, 2012 to 2022
Growth is rounded.***Growth is suppressed.
Only includes occupations with rates of growth that exceed the state's all-occupation average of 12 percent.
28.928.929.229.7
30.830.830.830.931.031.031.1
32.733.033.033.033.3
34.337.238.038.0
43.243.5
49.550.451.2
Substance Abuse & Behavioral Disorder CounselorsEntertainment Attendants & Related Workers, All Other
Biological Science Teachers, PostsecondarySupervisors of Food Preparation & Serving Workers
Interpreters & TranslatorsNurse PractitionersMedical Secretaries
Industrial Machinery MechanicsFood Processing Workers, All Other
Amusement & Recreation AttendantsGeological & Petroleum Technicians
Physician AssistantsCombined Food Preparation & Serving Workers, Incl. Fast Food
Market Research Analysts & Marketing SpecialistsCooks, Restaurant
FundraisersSurgical Technologists
Food Servers, NonrestaurantSkincare Specialists
LogisticiansNursing Instructors & Teachers, Postsecondary
Health Specialties Teachers, PostsecondaryHome Health Aides
Personal Care AidesDiagnostic Medical Sonographers
Only includes occupationswith 2012 employment
greater than 20.
Top 25 Occupations with the Fastest Projected Employment GrowthProjected Percentage Growth, Eastern Region, 2012 to 2022
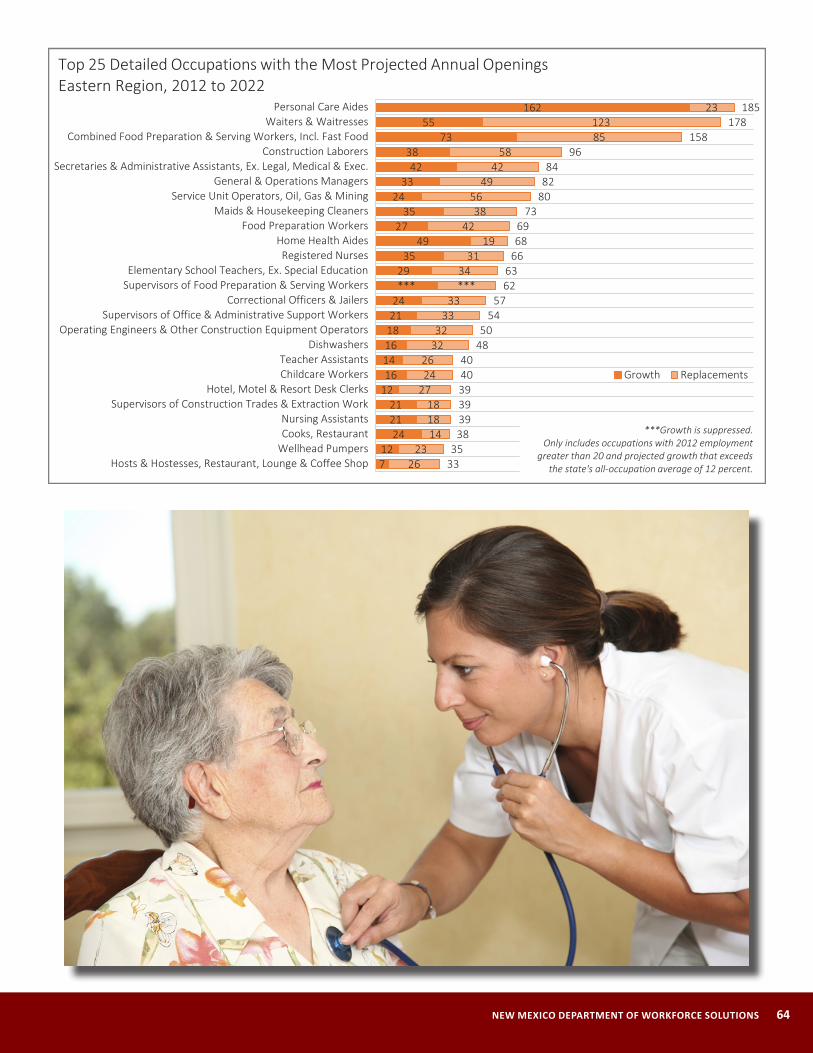
NEW MEXICO DEPARTMENT OF WORKFORCE SOLUTIONS 64
712
242121
12161416182124***29
3549
2735
2433
4238
7355
162
2623
141818
272426
3232
3333
***34
3119
4238
5649
4258
85123
23
3335
383939394040
4850
5457
6263
666869
73808284
96158
178185
Hosts & Hostesses, Restaurant, Lounge & Coffee ShopWellhead PumpersCooks, RestaurantNursing Assistants
Supervisors of Construction Trades & Extraction WorkHotel, Motel & Resort Desk Clerks
Childcare WorkersTeacher Assistants
DishwashersOperating Engineers & Other Construction Equipment Operators
Supervisors of Office & Administrative Support WorkersCorrectional Officers & Jailers
Supervisors of Food Preparation & Serving WorkersElementary School Teachers, Ex. Special Education
Registered NursesHome Health Aides
Food Preparation WorkersMaids & Housekeeping Cleaners
Service Unit Operators, Oil, Gas & MiningGeneral & Operations Managers
Secretaries & Administrative Assistants, Ex. Legal, Medical & Exec.Construction Laborers
Combined Food Preparation & Serving Workers, Incl. Fast FoodWaiters & Waitresses
Personal Care Aides
Growth Replacements
Top 25 Detailed Occupations with the Most Projected Annual OpeningsEastern Region, 2012 to 2022
***Growth is suppressed.Only includes occupations with 2012 employment
greater than 20 and projected growth that exceeds the state's all-occupation average of 12 percent.
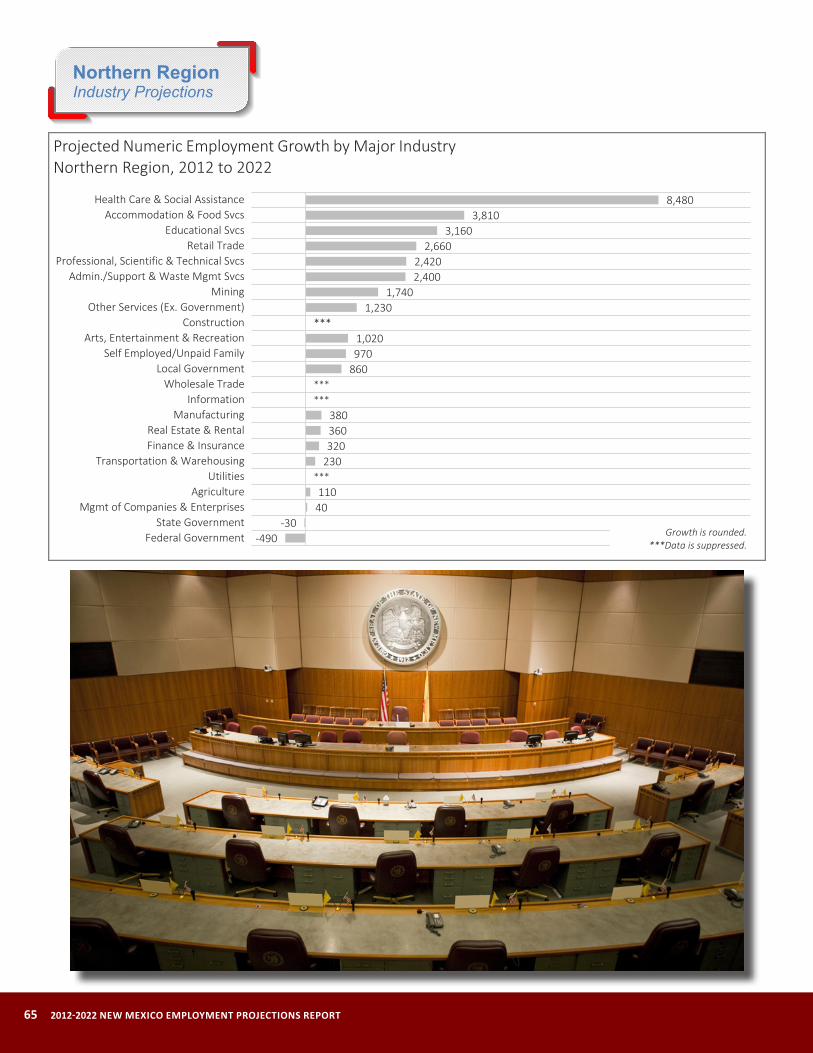
65 2012-2022 NEW MEXICO EMPLOYMENT PROJECTIONS REPORT
Northern Region Industry Projections
-490-30
40110
***230320360380
******
8609701,020
***1,230
1,7402,4002,420
2,6603,160
3,8108,480
Federal GovernmentState Government
Mgmt of Companies & EnterprisesAgriculture
UtilitiesTransportation & Warehousing
Finance & InsuranceReal Estate & Rental
ManufacturingInformation
Wholesale TradeLocal Government
Self Employed/Unpaid FamilyArts, Entertainment & Recreation
ConstructionOther Services (Ex. Government)
MiningAdmin./Support & Waste Mgmt Svcs
Professional, Scientific & Technical SvcsRetail Trade
Educational SvcsAccommodation & Food Svcs
Health Care & Social Assistance
Projected Numeric Employment Growth by Major IndustryNorthern Region, 2012 to 2022
Growth is rounded.***Data is suppressed.
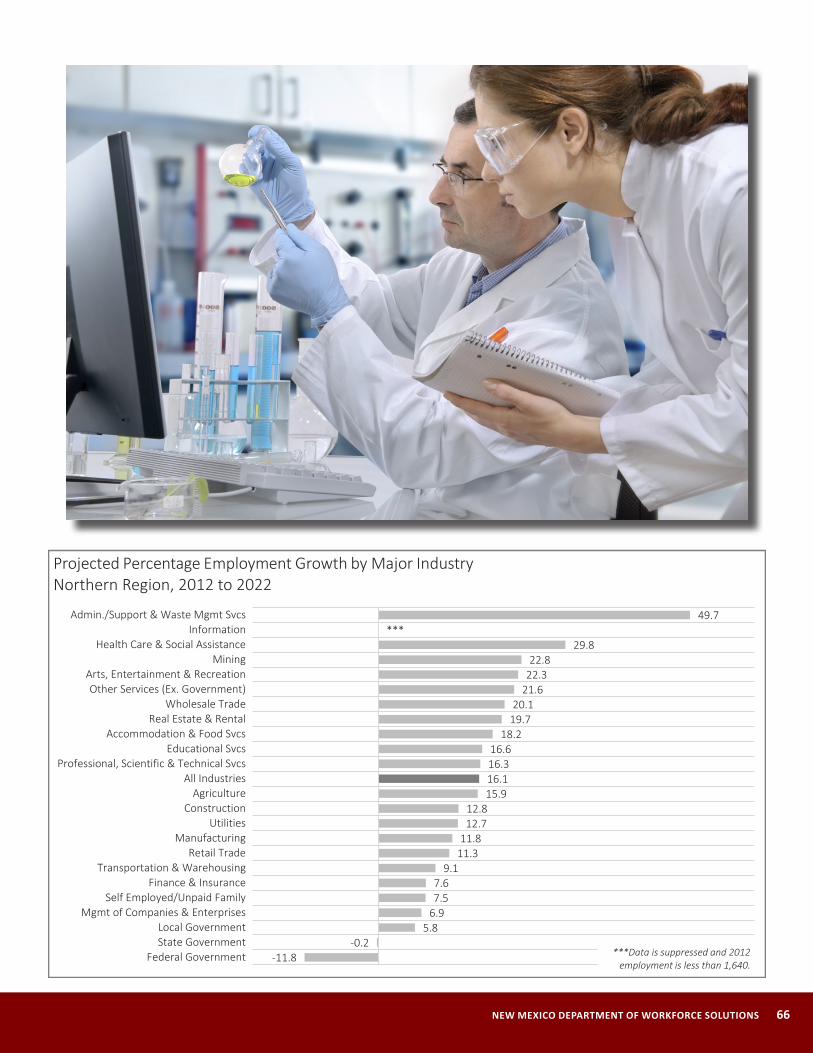
NEW MEXICO DEPARTMENT OF WORKFORCE SOLUTIONS 66
-11.8-0.2
5.86.97.57.6
9.111.311.8
12.712.8
15.916.116.316.6
18.219.720.1
21.622.322.8
29.8***
49.7
Federal GovernmentState GovernmentLocal Government
Mgmt of Companies & EnterprisesSelf Employed/Unpaid Family
Finance & InsuranceTransportation & Warehousing
Retail TradeManufacturing
UtilitiesConstruction
AgricultureAll Industries
Professional, Scientific & Technical SvcsEducational Svcs
Accommodation & Food SvcsReal Estate & Rental
Wholesale TradeOther Services (Ex. Government)
Arts, Entertainment & RecreationMining
Health Care & Social AssistanceInformation
Admin./Support & Waste Mgmt Svcs
Projected Percentage Employment Growth by Major IndustryNorthern Region, 2012 to 2022
***Data is suppressed and 2012 employment is less than 1,640.
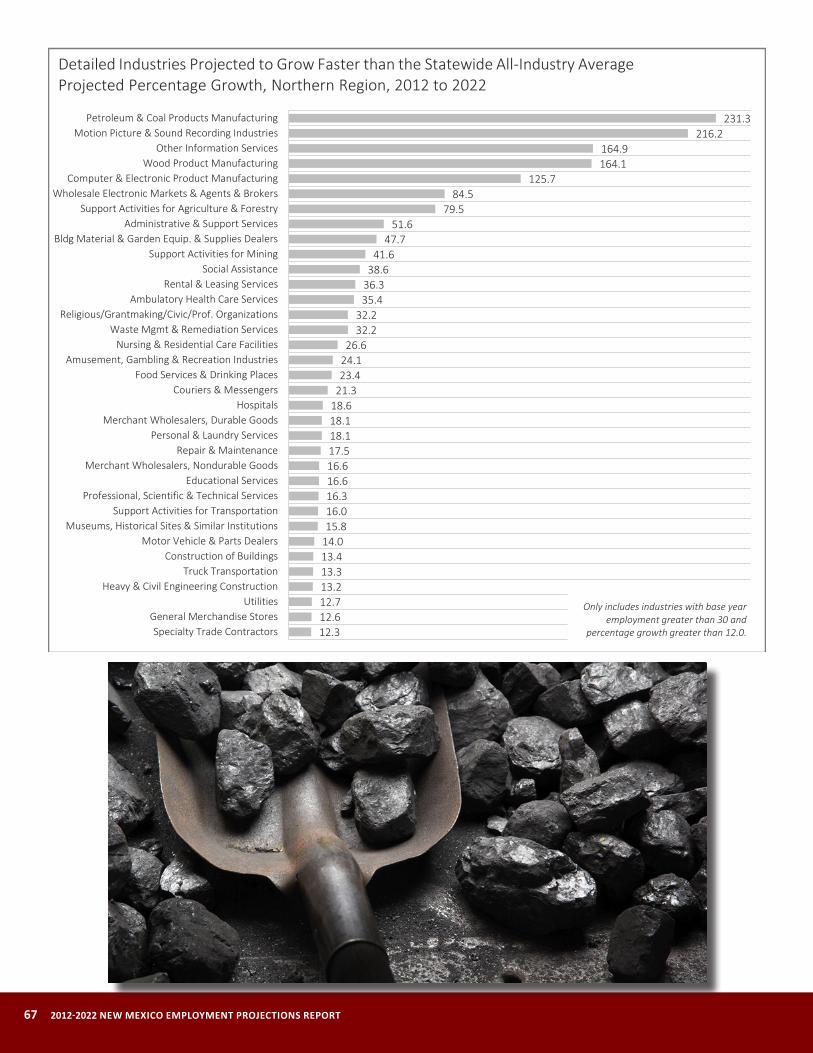
67 2012-2022 NEW MEXICO EMPLOYMENT PROJECTIONS REPORT
12.312.612.713.213.313.414.015.816.016.316.616.617.518.118.118.621.323.424.126.6
32.232.2
35.436.338.6
41.647.7
51.679.5
84.5125.7
164.1164.9
216.2231.3
Specialty Trade ContractorsGeneral Merchandise Stores
UtilitiesHeavy & Civil Engineering Construction
Truck TransportationConstruction of Buildings
Motor Vehicle & Parts DealersMuseums, Historical Sites & Similar Institutions
Support Activities for TransportationProfessional, Scientific & Technical Services
Educational ServicesMerchant Wholesalers, Nondurable Goods
Repair & MaintenancePersonal & Laundry Services
Merchant Wholesalers, Durable GoodsHospitals
Couriers & MessengersFood Services & Drinking Places
Amusement, Gambling & Recreation IndustriesNursing & Residential Care Facilities
Waste Mgmt & Remediation ServicesReligious/Grantmaking/Civic/Prof. Organizations
Ambulatory Health Care ServicesRental & Leasing Services
Social AssistanceSupport Activities for Mining
Bldg Material & Garden Equip. & Supplies DealersAdministrative & Support Services
Support Activities for Agriculture & ForestryWholesale Electronic Markets & Agents & Brokers
Computer & Electronic Product ManufacturingWood Product Manufacturing
Other Information ServicesMotion Picture & Sound Recording Industries
Petroleum & Coal Products Manufacturing
Detailed Industries Projected to Grow Faster than the Statewide All-Industry AverageProjected Percentage Growth, Northern Region, 2012 to 2022
Only includes industries with base year employment greater than 30 and
percentage growth greater than 12.0.

NEW MEXICO DEPARTMENT OF WORKFORCE SOLUTIONS 68
NAICS Industry 2012 2022 Numeric Pct.
All Industries 200,835 233,092 32,257 16.1
11-0000 Agriculture 675 782 107 15.9
11-1000 Crop Production 290 295 5 1.7
11-2000 Animal Production 239 227 -12 -5.0
11-3000 Forestry & Logging 29 50 21 72.4
11-5000 Support Activities for Agriculture & Forestry 117 210 93 79.5
21-0000 Mining 7,623 9,362 1,739 22.8
21-1000 Oil & Gas Extraction 2,307 2,515 208 9.0
21-2000 Mining (Ex. Oil & Gas) 1,897 2,004 107 5.6
21-3000 Support Activities for Mining 3,419 4,843 1,424 41.6
22-0000 Utilities *** *** *** 12.7
22-1000 Utilities *** *** *** 12.7
23-0000 Construction *** *** *** 12.8
23-6000 Construction of Buildings 2,068 2,346 278 13.4
23-7000 Heavy & Civil Engineering Construction 1,877 2,124 247 13.2
23-8000 Specialty Trade Contractors *** *** *** 12.3
31-0000 Manufacturing 3,226 3,606 380 11.8
31-1000 Food Manufacturing 293 247 -46 -15.7
31-2000 Beverage & Tobacco Product Manufacturing 107 77 -30 -28.0
31-3000 Textile Mills 31 15 -16 -51.6
31-4000 Textile Product Mills 26 21 -5 -19.2
31-5000 Apparel Manufacturing 35 16 -19 -54.3
31-6000 Leather & Allied Product Manufacturing 3 5 2 66.7
32-1000 Wood Product Manufacturing 103 272 169 164.1
32-2000 Paper Manufacturing *** *** *** 5.2
32-3000 Printing & Related Support Activities 105 81 -24 -22.9
32-4000 Petroleum & Coal Products Manufacturing 182 603 421 231.3
32-5000 Chemical Manufacturing *** *** *** -9.5
32-6000 Plastics & Rubber Products Manufacturing 29 40 11 37.9
32-7000 Nonmetallic Mineral Product Manufacturing 278 187 -91 -32.7
33-1000 Primary Metal Manufacturing 21 19 -2 -9.5
33-2000 Fabricated Metal Product Manufacturing 642 706 64 10.0
33-3000 Machinery Manufacturing 300 278 -22 -7.3
33-4000 Computer & Electronic Product Manufacturing 35 79 44 125.7
33-5000 Electrical Equip., Appliance & Component Mfg 168 146 -22 -13.1
33-6000 Transportation Equip. Manufacturing 111 114 3 2.7
33-7000 Furniture & Related Product Manufacturing *** *** *** -17.3
33-9000 Miscellaneous Manufacturing 400 362 -38 -9.5
42-0000 Wholesale Trade *** *** *** 20.1
42-3000 Merchant Wholesalers, Durable Goods 2,307 2,724 417 18.1
42-4000 Merchant Wholesalers, Nondurable Goods 1,256 1,465 209 16.6
42-5000 Wholesale Electronic Markets & Agents & Brokers *** *** *** 84.5
44-0000 Retail Trade 23,521 26,181 2,660 11.3
44-1000 Motor Vehicle & Parts Dealers *** *** *** 14.0
44-2000 Furniture & Home Furnishings Stores 548 599 51 9.3
44-3000 Electronics & Appliance Stores 634 675 41 6.5
44-4000 Bldg Material & Garden Equip. & Supplies Dealers 1,954 2,886 932 47.7
44-5000 Food & Beverage Stores 4,265 4,651 386 9.1
44-6000 Health & Personal Care Stores 1,045 1,117 72 6.9
Northern Region Industry Employment Projections2012-2022
Employment Growth
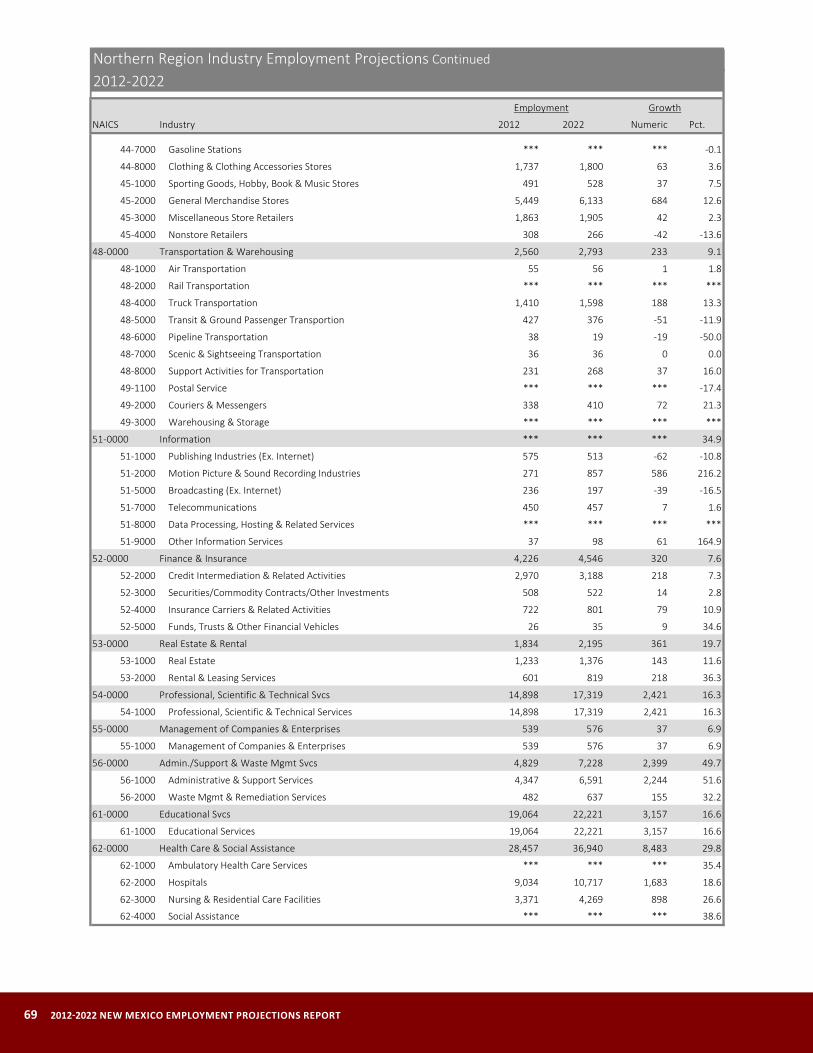
69 2012-2022 NEW MEXICO EMPLOYMENT PROJECTIONS REPORT
NAICS Industry 2012 2022 Numeric Pct.
44-7000 Gasoline Stations *** *** *** -0.1
44-8000 Clothing & Clothing Accessories Stores 1,737 1,800 63 3.6
45-1000 Sporting Goods, Hobby, Book & Music Stores 491 528 37 7.5
45-2000 General Merchandise Stores 5,449 6,133 684 12.6
45-3000 Miscellaneous Store Retailers 1,863 1,905 42 2.3
45-4000 Nonstore Retailers 308 266 -42 -13.6
48-0000 Transportation & Warehousing 2,560 2,793 233 9.1
48-1000 Air Transportation 55 56 1 1.8
48-2000 Rail Transportation *** *** *** ***
48-4000 Truck Transportation 1,410 1,598 188 13.3
48-5000 Transit & Ground Passenger Transportion 427 376 -51 -11.9
48-6000 Pipeline Transportation 38 19 -19 -50.0
48-7000 Scenic & Sightseeing Transportation 36 36 0 0.0
48-8000 Support Activities for Transportation 231 268 37 16.0
49-1100 Postal Service *** *** *** -17.4
49-2000 Couriers & Messengers 338 410 72 21.3
49-3000 Warehousing & Storage *** *** *** ***
51-0000 Information *** *** *** 34.9
51-1000 Publishing Industries (Ex. Internet) 575 513 -62 -10.8
51-2000 Motion Picture & Sound Recording Industries 271 857 586 216.2
51-5000 Broadcasting (Ex. Internet) 236 197 -39 -16.5
51-7000 Telecommunications 450 457 7 1.6
51-8000 Data Processing, Hosting & Related Services *** *** *** ***
51-9000 Other Information Services 37 98 61 164.9
52-0000 Finance & Insurance 4,226 4,546 320 7.6
52-2000 Credit Intermediation & Related Activities 2,970 3,188 218 7.3
52-3000 Securities/Commodity Contracts/Other Investments 508 522 14 2.8
52-4000 Insurance Carriers & Related Activities 722 801 79 10.9
52-5000 Funds, Trusts & Other Financial Vehicles 26 35 9 34.6
53-0000 Real Estate & Rental 1,834 2,195 361 19.7
53-1000 Real Estate 1,233 1,376 143 11.6
53-2000 Rental & Leasing Services 601 819 218 36.3
54-0000 Professional, Scientific & Technical Svcs 14,898 17,319 2,421 16.3
54-1000 Professional, Scientific & Technical Services 14,898 17,319 2,421 16.3
55-0000 Management of Companies & Enterprises 539 576 37 6.9
55-1000 Management of Companies & Enterprises 539 576 37 6.9
56-0000 Admin./Support & Waste Mgmt Svcs 4,829 7,228 2,399 49.7
56-1000 Administrative & Support Services 4,347 6,591 2,244 51.6
56-2000 Waste Mgmt & Remediation Services 482 637 155 32.2
61-0000 Educational Svcs 19,064 22,221 3,157 16.6
61-1000 Educational Services 19,064 22,221 3,157 16.6
62-0000 Health Care & Social Assistance 28,457 36,940 8,483 29.8
62-1000 Ambulatory Health Care Services *** *** *** 35.4
62-2000 Hospitals 9,034 10,717 1,683 18.6
62-3000 Nursing & Residential Care Facilities 3,371 4,269 898 26.6
62-4000 Social Assistance *** *** *** 38.6
2012-2022Employment Growth
Northern Region Industry Employment Projections Continued
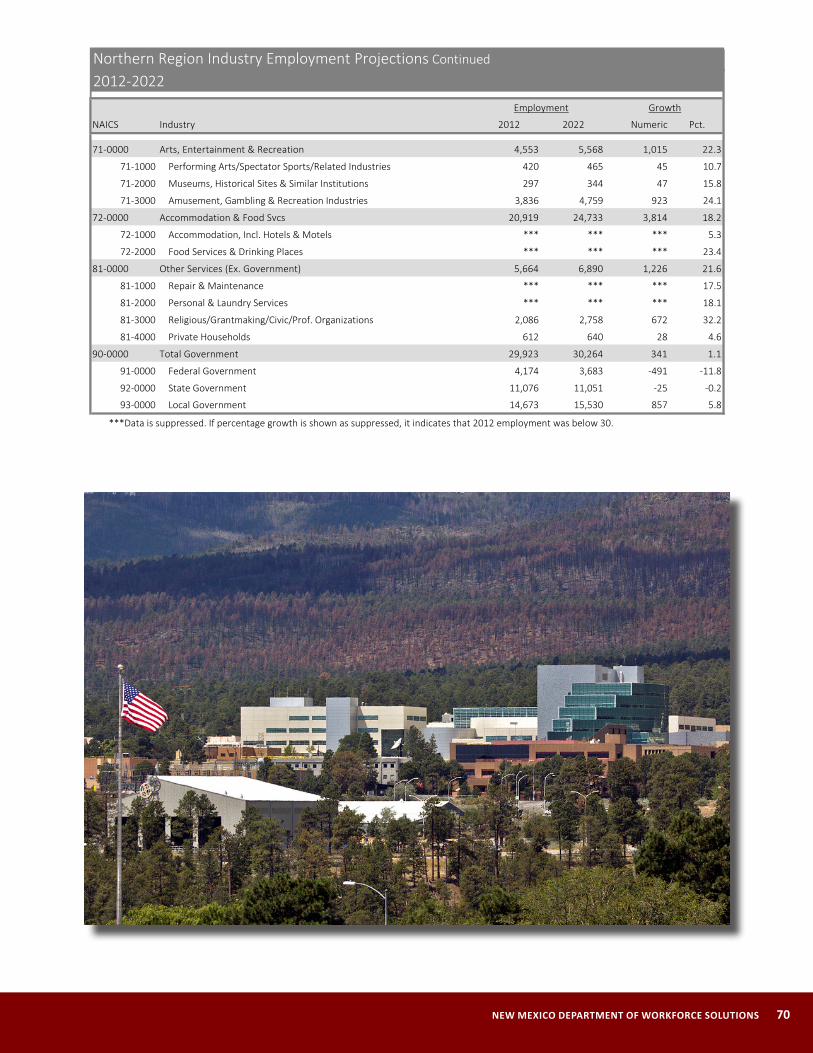
NEW MEXICO DEPARTMENT OF WORKFORCE SOLUTIONS 70
NAICS Industry 2012 2022 Numeric Pct.
71-0000 Arts, Entertainment & Recreation 4,553 5,568 1,015 22.3
71-1000 Performing Arts/Spectator Sports/Related Industries 420 465 45 10.7
71-2000 Museums, Historical Sites & Similar Institutions 297 344 47 15.8
71-3000 Amusement, Gambling & Recreation Industries 3,836 4,759 923 24.1
72-0000 Accommodation & Food Svcs 20,919 24,733 3,814 18.2
72-1000 Accommodation, Incl. Hotels & Motels *** *** *** 5.3
72-2000 Food Services & Drinking Places *** *** *** 23.4
81-0000 Other Services (Ex. Government) 5,664 6,890 1,226 21.6
81-1000 Repair & Maintenance *** *** *** 17.5
81-2000 Personal & Laundry Services *** *** *** 18.1
81-3000 Religious/Grantmaking/Civic/Prof. Organizations 2,086 2,758 672 32.2
81-4000 Private Households 612 640 28 4.6
90-0000 Total Government 29,923 30,264 341 1.1
91-0000 Federal Government 4,174 3,683 -491 -11.8
92-0000 State Government 11,076 11,051 -25 -0.2
93-0000 Local Government 14,673 15,530 857 5.8
***Data is suppressed. If percentage growth is shown as suppressed, it indicates that 2012 employment was below 30.
Employment Growth
Northern Region Industry Employment Projections Continued
2012-2022

71 2012-2022 NEW MEXICO EMPLOYMENT PROJECTIONS REPORT
Northern Region Occupation Projections
***80
180390
530640
***910
1,0301,090
1,2201,370
1,5101,5501,600
1,9802,0602,090
2,1502,940
4,0604,110
Farming, Fishing & ForestryLegal
Arts/Design/Entertainment/Sports/MediaComputer & MathematicalArchitecture & Engineering
Community & Social ServicesLife, Physical & Social Science
Protective ServiceProduction
Business & Financial OperationsInstallation, Maintenance & RepairTransportation & Material Moving
ManagementHealthcare Support
Building & Grounds Cleaning & MaintenanceEducation, Training & Library
Construction & ExtractionHealthcare Practitioners & Technical
Sales & RelatedOffice & Administrative Support
Personal Care & ServiceFood Preparation & Serving-Related
Projected Numeric Employment Growth by Major Occupation GroupNorthern Region, 2012 to 2022
Growth is rounded.***Data is suppressed.
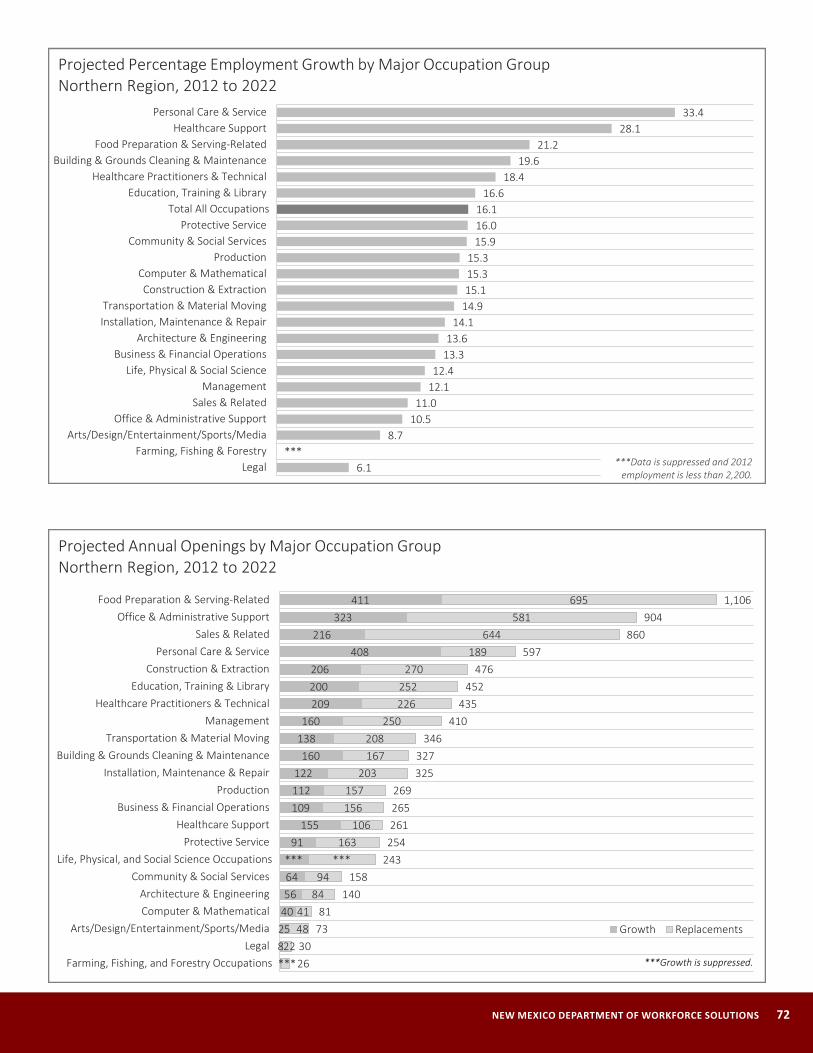
NEW MEXICO DEPARTMENT OF WORKFORCE SOLUTIONS 72
6.1***
8.710.511.0
12.112.4
13.313.6
14.114.915.115.315.3
15.916.016.1
16.618.4
19.621.2
28.133.4
LegalFarming, Fishing & Forestry
Arts/Design/Entertainment/Sports/MediaOffice & Administrative Support
Sales & RelatedManagement
Life, Physical & Social ScienceBusiness & Financial Operations
Architecture & EngineeringInstallation, Maintenance & RepairTransportation & Material Moving
Construction & ExtractionComputer & Mathematical
ProductionCommunity & Social Services
Protective ServiceTotal All Occupations
Education, Training & LibraryHealthcare Practitioners & Technical
Building & Grounds Cleaning & MaintenanceFood Preparation & Serving-Related
Healthcare SupportPersonal Care & Service
Projected Percentage Employment Growth by Major Occupation GroupNorthern Region, 2012 to 2022
***Data is suppressed and 2012 employment is less than 2,200.
***825405664***
91155
109112122
160138160
209200206
408216
323411
224841
8494
***163
106156157
203167208
250226252
270189
644581
695
2630
7381
140158
243254261265269
325327
346410
435452
476597
860904
1,106
Farming, Fishing, and Forestry OccupationsLegal
Arts/Design/Entertainment/Sports/MediaComputer & MathematicalArchitecture & Engineering
Community & Social ServicesLife, Physical, and Social Science Occupations
Protective ServiceHealthcare Support
Business & Financial OperationsProduction
Installation, Maintenance & RepairBuilding & Grounds Cleaning & Maintenance
Transportation & Material MovingManagement
Healthcare Practitioners & TechnicalEducation, Training & Library
Construction & ExtractionPersonal Care & Service
Sales & RelatedOffice & Administrative Support
Food Preparation & Serving-Related
Growth Replacements
Projected Annual Openings by Major Occupation GroupNorthern Region, 2012 to 2022
***Growth is suppressed.
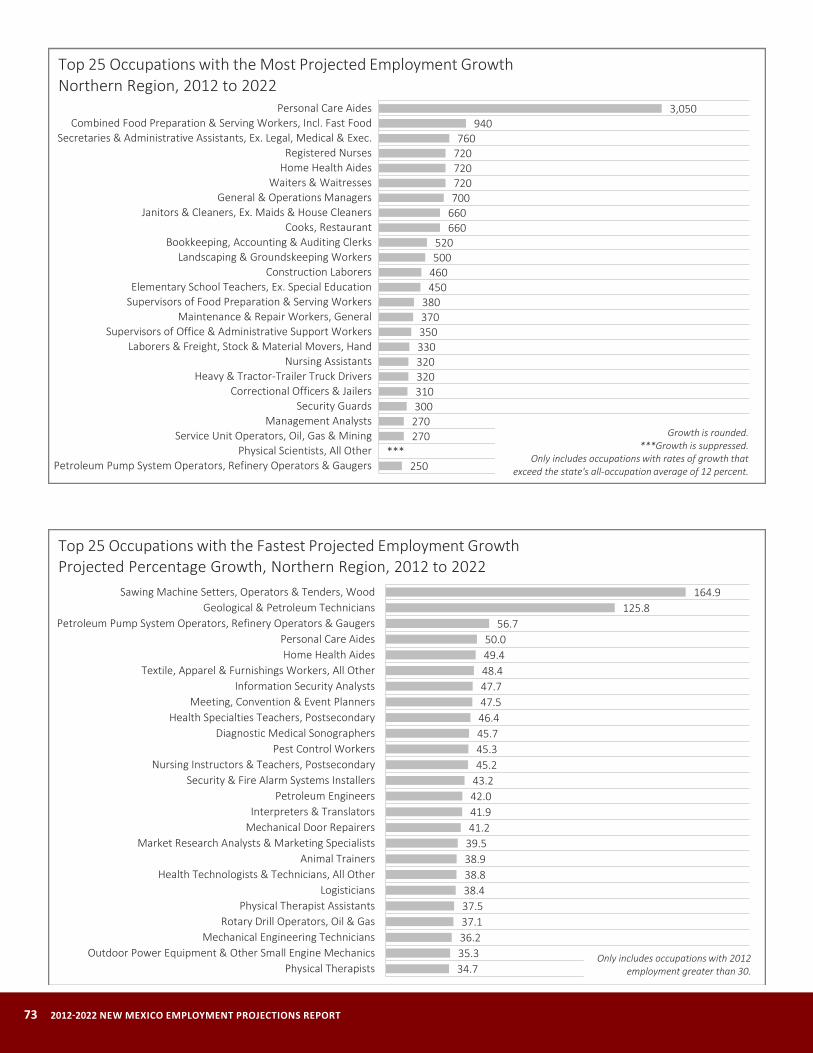
73 2012-2022 NEW MEXICO EMPLOYMENT PROJECTIONS REPORT
250***
270270300310320320330350370380
450460500520
660660700720720720760
9403,050
Petroleum Pump System Operators, Refinery Operators & GaugersPhysical Scientists, All Other
Service Unit Operators, Oil, Gas & MiningManagement Analysts
Security GuardsCorrectional Officers & Jailers
Heavy & Tractor-Trailer Truck DriversNursing Assistants
Laborers & Freight, Stock & Material Movers, HandSupervisors of Office & Administrative Support Workers
Maintenance & Repair Workers, GeneralSupervisors of Food Preparation & Serving WorkersElementary School Teachers, Ex. Special Education
Construction LaborersLandscaping & Groundskeeping Workers
Bookkeeping, Accounting & Auditing ClerksCooks, Restaurant
Janitors & Cleaners, Ex. Maids & House CleanersGeneral & Operations Managers
Waiters & WaitressesHome Health AidesRegistered Nurses
Secretaries & Administrative Assistants, Ex. Legal, Medical & Exec.Combined Food Preparation & Serving Workers, Incl. Fast Food
Personal Care Aides
Top 25 Occupations with the Most Projected Employment GrowthNorthern Region, 2012 to 2022
Growth is rounded.***Growth is suppressed.
Only includes occupations with rates of growth that exceed the state's all-occupation average of 12 percent.
34.735.336.237.137.538.438.838.939.541.241.942.043.245.245.345.746.447.547.748.449.450.0
56.7125.8
164.9
Physical TherapistsOutdoor Power Equipment & Other Small Engine Mechanics
Mechanical Engineering TechniciansRotary Drill Operators, Oil & Gas
Physical Therapist AssistantsLogisticians
Health Technologists & Technicians, All OtherAnimal Trainers
Market Research Analysts & Marketing SpecialistsMechanical Door RepairersInterpreters & Translators
Petroleum EngineersSecurity & Fire Alarm Systems Installers
Nursing Instructors & Teachers, PostsecondaryPest Control Workers
Diagnostic Medical SonographersHealth Specialties Teachers, Postsecondary
Meeting, Convention & Event PlannersInformation Security Analysts
Textile, Apparel & Furnishings Workers, All OtherHome Health Aides
Personal Care AidesPetroleum Pump System Operators, Refinery Operators & Gaugers
Geological & Petroleum TechniciansSawing Machine Setters, Operators & Tenders, Wood
Only includes occupations with 2012 employment greater than 30.
Top 25 Occupations with the Fastest Projected Employment GrowthProjected Percentage Growth, Northern Region, 2012 to 2022
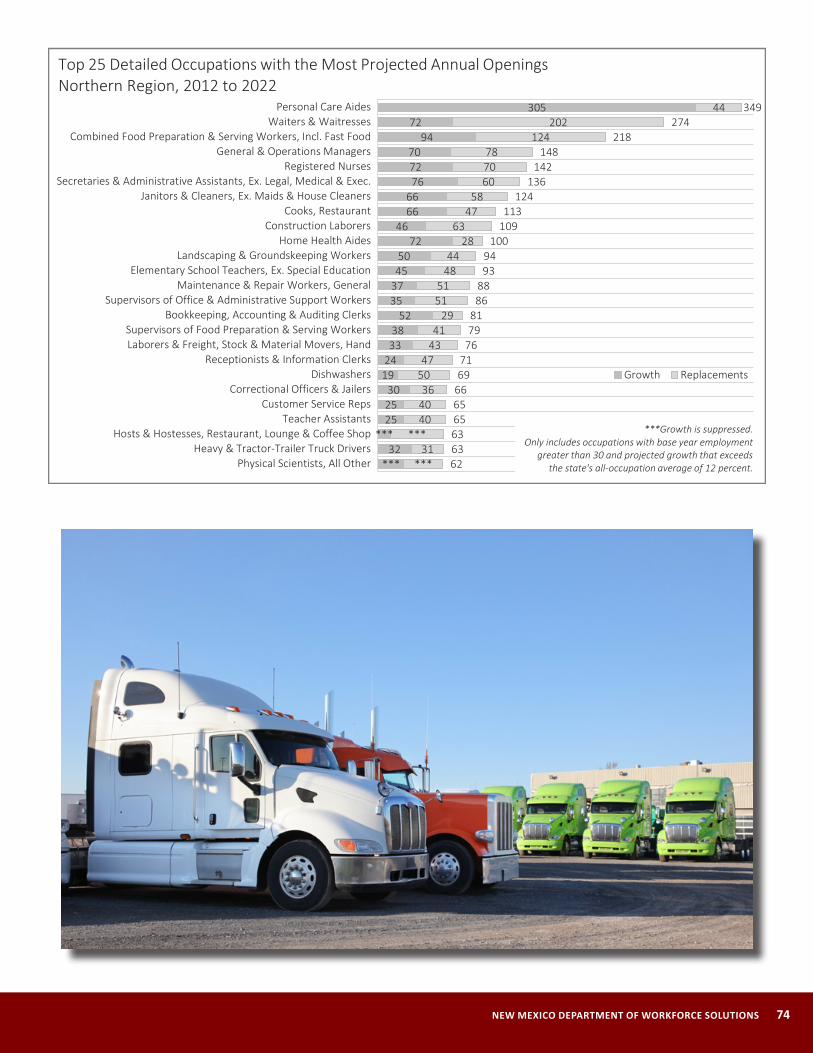
NEW MEXICO DEPARTMENT OF WORKFORCE SOLUTIONS 74
***32
***252530
19243338
5235374550
7246
6666767270
9472
305
***31
***404036
5047
4341
295151
4844
2863
4758
607078
124202
44
626363656566697176798186889394
100109113
124136
142148
218274
349
Physical Scientists, All OtherHeavy & Tractor-Trailer Truck Drivers
Hosts & Hostesses, Restaurant, Lounge & Coffee ShopTeacher Assistants
Customer Service RepsCorrectional Officers & Jailers
DishwashersReceptionists & Information Clerks
Laborers & Freight, Stock & Material Movers, HandSupervisors of Food Preparation & Serving Workers
Bookkeeping, Accounting & Auditing ClerksSupervisors of Office & Administrative Support Workers
Maintenance & Repair Workers, GeneralElementary School Teachers, Ex. Special Education
Landscaping & Groundskeeping WorkersHome Health Aides
Construction LaborersCooks, Restaurant
Janitors & Cleaners, Ex. Maids & House CleanersSecretaries & Administrative Assistants, Ex. Legal, Medical & Exec.
Registered NursesGeneral & Operations Managers
Combined Food Preparation & Serving Workers, Incl. Fast FoodWaiters & Waitresses
Personal Care Aides
Growth Replacements
Top 25 Detailed Occupations with the Most Projected Annual OpeningsNorthern Region, 2012 to 2022
***Growth is suppressed.Only includes occupations with base year employment
greater than 30 and projected growth that exceeds the state's all-occupation average of 12 percent.
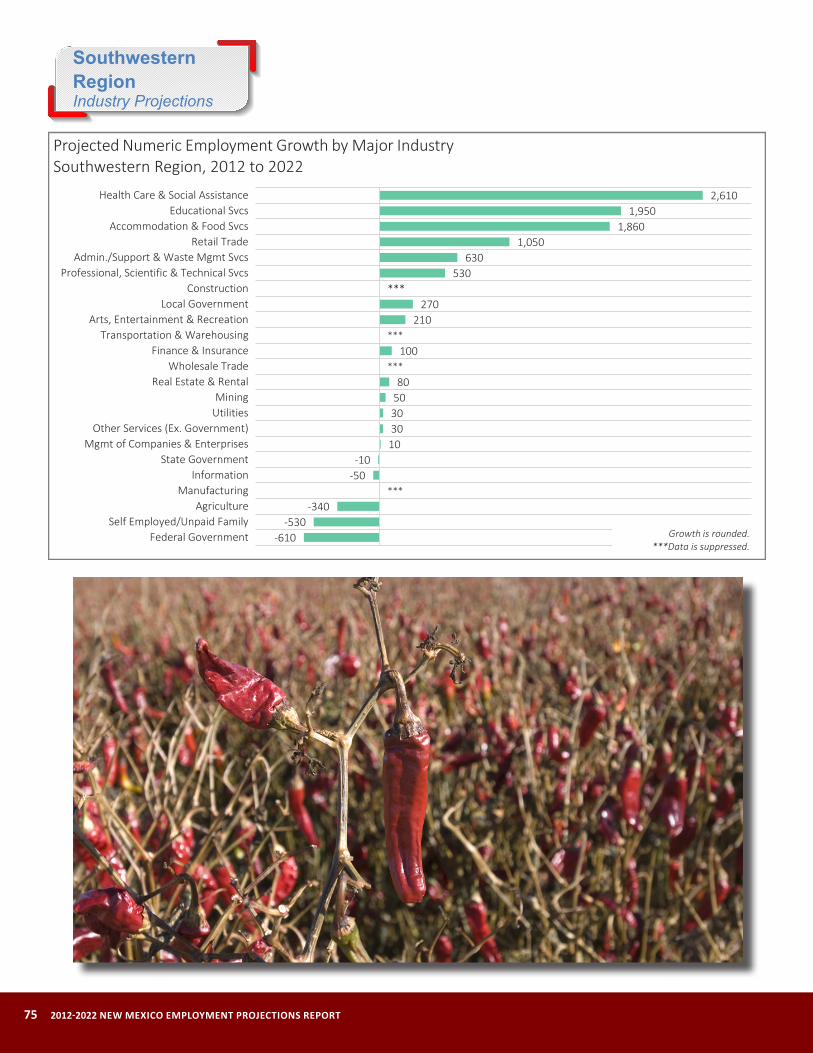
75 2012-2022 NEW MEXICO EMPLOYMENT PROJECTIONS REPORT
Southwestern Region Industry Projections
-610-530
-340***
-50-10
1030305080
***100
***210
270***
530630
1,0501,860
1,9502,610
Federal GovernmentSelf Employed/Unpaid Family
AgricultureManufacturing
InformationState Government
Mgmt of Companies & EnterprisesOther Services (Ex. Government)
UtilitiesMining
Real Estate & RentalWholesale Trade
Finance & InsuranceTransportation & Warehousing
Arts, Entertainment & RecreationLocal Government
ConstructionProfessional, Scientific & Technical Svcs
Admin./Support & Waste Mgmt SvcsRetail Trade
Accommodation & Food SvcsEducational Svcs
Health Care & Social Assistance
Projected Numeric Employment Growth by Major IndustrySouthwestern Region, 2012 to 2022
Growth is rounded.***Data is suppressed.
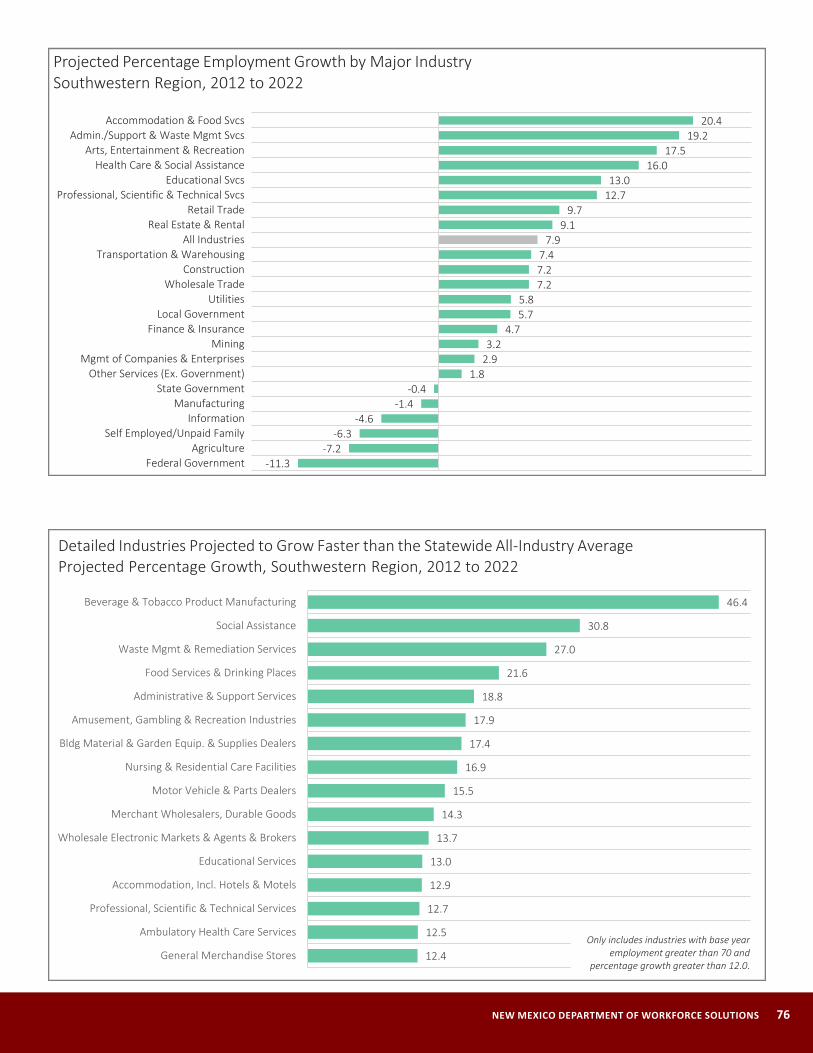
NEW MEXICO DEPARTMENT OF WORKFORCE SOLUTIONS 76
-11.3-7.2
-6.3-4.6
-1.4-0.4
1.82.93.2
4.75.75.8
7.27.27.4
7.99.1
9.712.713.0
16.017.5
19.220.4
Federal GovernmentAgriculture
Self Employed/Unpaid FamilyInformation
ManufacturingState Government
Other Services (Ex. Government)Mgmt of Companies & Enterprises
MiningFinance & Insurance
Local GovernmentUtilities
Wholesale TradeConstruction
Transportation & WarehousingAll Industries
Real Estate & RentalRetail Trade
Professional, Scientific & Technical SvcsEducational Svcs
Health Care & Social AssistanceArts, Entertainment & Recreation
Admin./Support & Waste Mgmt SvcsAccommodation & Food Svcs
Projected Percentage Employment Growth by Major IndustrySouthwestern Region, 2012 to 2022
12.4
12.5
12.7
12.9
13.0
13.7
14.3
15.5
16.9
17.4
17.9
18.8
21.6
27.0
30.8
46.4
General Merchandise Stores
Ambulatory Health Care Services
Professional, Scientific & Technical Services
Accommodation, Incl. Hotels & Motels
Educational Services
Wholesale Electronic Markets & Agents & Brokers
Merchant Wholesalers, Durable Goods
Motor Vehicle & Parts Dealers
Nursing & Residential Care Facilities
Bldg Material & Garden Equip. & Supplies Dealers
Amusement, Gambling & Recreation Industries
Administrative & Support Services
Food Services & Drinking Places
Waste Mgmt & Remediation Services
Social Assistance
Beverage & Tobacco Product Manufacturing
Detailed Industries Projected to Grow Faster than the Statewide All-Industry AverageProjected Percentage Growth, Southwestern Region, 2012 to 2022
Only includes industries with base year employment greater than 70 and
percentage growth greater than 12.0.
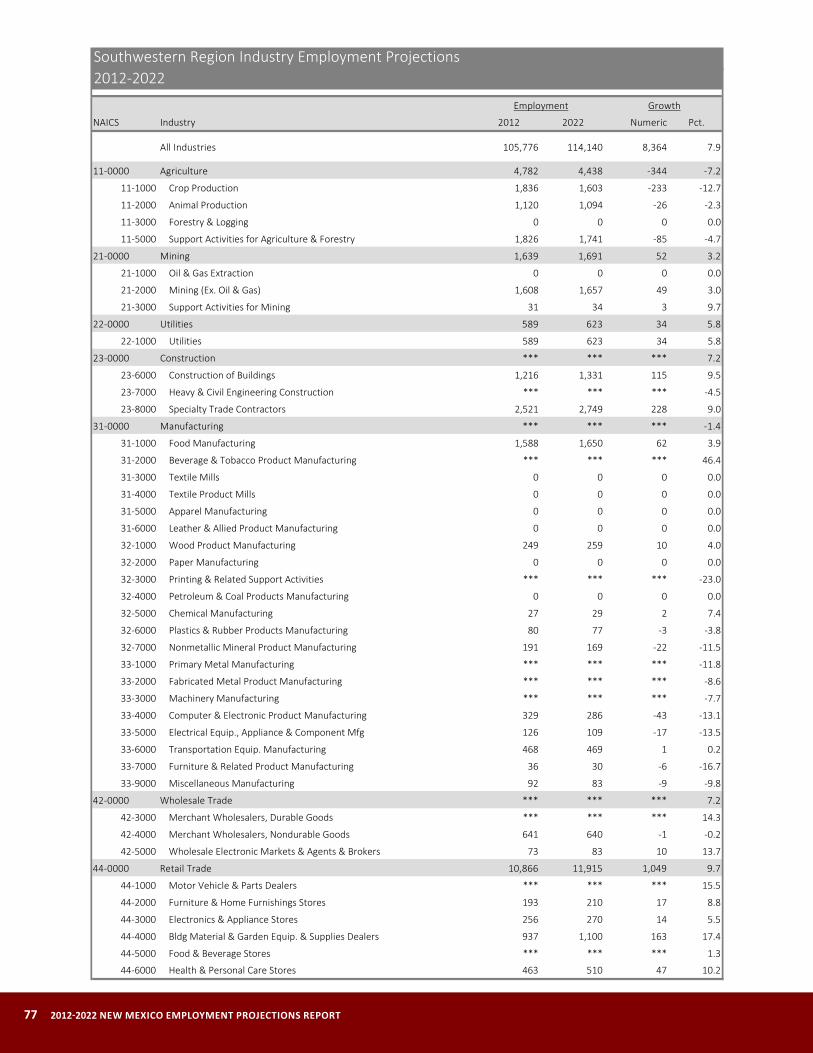
77 2012-2022 NEW MEXICO EMPLOYMENT PROJECTIONS REPORT
NAICS Industry 2012 2022 Numeric Pct.
All Industries 105,776 114,140 8,364 7.9
11-0000 Agriculture 4,782 4,438 -344 -7.2
11-1000 Crop Production 1,836 1,603 -233 -12.7
11-2000 Animal Production 1,120 1,094 -26 -2.3
11-3000 Forestry & Logging 0 0 0 0.0
11-5000 Support Activities for Agriculture & Forestry 1,826 1,741 -85 -4.7
21-0000 Mining 1,639 1,691 52 3.2
21-1000 Oil & Gas Extraction 0 0 0 0.0
21-2000 Mining (Ex. Oil & Gas) 1,608 1,657 49 3.0
21-3000 Support Activities for Mining 31 34 3 9.7
22-0000 Utilities 589 623 34 5.8
22-1000 Utilities 589 623 34 5.8
23-0000 Construction *** *** *** 7.2
23-6000 Construction of Buildings 1,216 1,331 115 9.5
23-7000 Heavy & Civil Engineering Construction *** *** *** -4.5
23-8000 Specialty Trade Contractors 2,521 2,749 228 9.0
31-0000 Manufacturing *** *** *** -1.4
31-1000 Food Manufacturing 1,588 1,650 62 3.9
31-2000 Beverage & Tobacco Product Manufacturing *** *** *** 46.4
31-3000 Textile Mills 0 0 0 0.0
31-4000 Textile Product Mills 0 0 0 0.0
31-5000 Apparel Manufacturing 0 0 0 0.0
31-6000 Leather & Allied Product Manufacturing 0 0 0 0.0
32-1000 Wood Product Manufacturing 249 259 10 4.0
32-2000 Paper Manufacturing 0 0 0 0.0
32-3000 Printing & Related Support Activities *** *** *** -23.0
32-4000 Petroleum & Coal Products Manufacturing 0 0 0 0.0
32-5000 Chemical Manufacturing 27 29 2 7.4
32-6000 Plastics & Rubber Products Manufacturing 80 77 -3 -3.8
32-7000 Nonmetallic Mineral Product Manufacturing 191 169 -22 -11.5
33-1000 Primary Metal Manufacturing *** *** *** -11.8
33-2000 Fabricated Metal Product Manufacturing *** *** *** -8.6
33-3000 Machinery Manufacturing *** *** *** -7.7
33-4000 Computer & Electronic Product Manufacturing 329 286 -43 -13.1
33-5000 Electrical Equip., Appliance & Component Mfg 126 109 -17 -13.5
33-6000 Transportation Equip. Manufacturing 468 469 1 0.2
33-7000 Furniture & Related Product Manufacturing 36 30 -6 -16.7
33-9000 Miscellaneous Manufacturing 92 83 -9 -9.8
42-0000 Wholesale Trade *** *** *** 7.2
42-3000 Merchant Wholesalers, Durable Goods *** *** *** 14.3
42-4000 Merchant Wholesalers, Nondurable Goods 641 640 -1 -0.2
42-5000 Wholesale Electronic Markets & Agents & Brokers 73 83 10 13.7
44-0000 Retail Trade 10,866 11,915 1,049 9.7
44-1000 Motor Vehicle & Parts Dealers *** *** *** 15.5
44-2000 Furniture & Home Furnishings Stores 193 210 17 8.8
44-3000 Electronics & Appliance Stores 256 270 14 5.5
44-4000 Bldg Material & Garden Equip. & Supplies Dealers 937 1,100 163 17.4
44-5000 Food & Beverage Stores *** *** *** 1.3
44-6000 Health & Personal Care Stores 463 510 47 10.2
Southwestern Region Industry Employment Projections2012-2022
Employment Growth
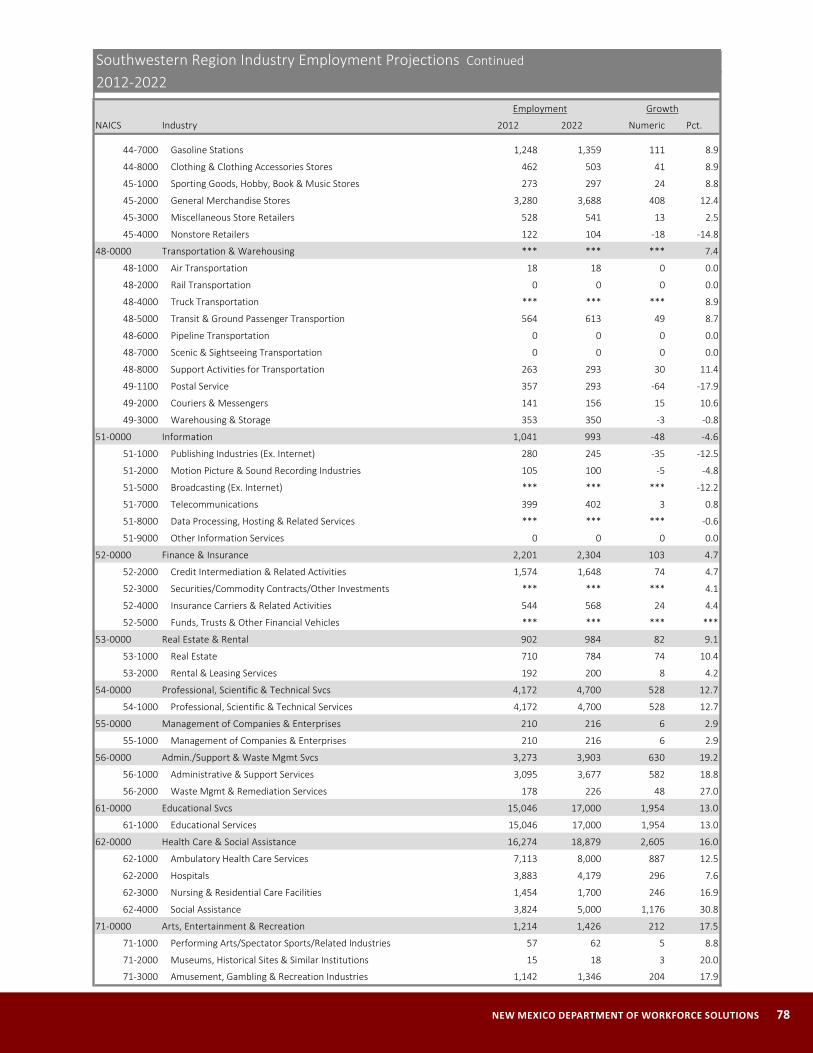
NEW MEXICO DEPARTMENT OF WORKFORCE SOLUTIONS 78
NAICS Industry 2012 2022 Numeric Pct.
44-7000 Gasoline Stations 1,248 1,359 111 8.9
44-8000 Clothing & Clothing Accessories Stores 462 503 41 8.9
45-1000 Sporting Goods, Hobby, Book & Music Stores 273 297 24 8.8
45-2000 General Merchandise Stores 3,280 3,688 408 12.4
45-3000 Miscellaneous Store Retailers 528 541 13 2.5
45-4000 Nonstore Retailers 122 104 -18 -14.8
48-0000 Transportation & Warehousing *** *** *** 7.4
48-1000 Air Transportation 18 18 0 0.0
48-2000 Rail Transportation 0 0 0 0.0
48-4000 Truck Transportation *** *** *** 8.9
48-5000 Transit & Ground Passenger Transportion 564 613 49 8.7
48-6000 Pipeline Transportation 0 0 0 0.0
48-7000 Scenic & Sightseeing Transportation 0 0 0 0.0
48-8000 Support Activities for Transportation 263 293 30 11.4
49-1100 Postal Service 357 293 -64 -17.9
49-2000 Couriers & Messengers 141 156 15 10.6
49-3000 Warehousing & Storage 353 350 -3 -0.8
51-0000 Information 1,041 993 -48 -4.6
51-1000 Publishing Industries (Ex. Internet) 280 245 -35 -12.5
51-2000 Motion Picture & Sound Recording Industries 105 100 -5 -4.8
51-5000 Broadcasting (Ex. Internet) *** *** *** -12.2
51-7000 Telecommunications 399 402 3 0.8
51-8000 Data Processing, Hosting & Related Services *** *** *** -0.6
51-9000 Other Information Services 0 0 0 0.0
52-0000 Finance & Insurance 2,201 2,304 103 4.7
52-2000 Credit Intermediation & Related Activities 1,574 1,648 74 4.7
52-3000 Securities/Commodity Contracts/Other Investments *** *** *** 4.1
52-4000 Insurance Carriers & Related Activities 544 568 24 4.4
52-5000 Funds, Trusts & Other Financial Vehicles *** *** *** ***
53-0000 Real Estate & Rental 902 984 82 9.1
53-1000 Real Estate 710 784 74 10.4
53-2000 Rental & Leasing Services 192 200 8 4.2
54-0000 Professional, Scientific & Technical Svcs 4,172 4,700 528 12.7
54-1000 Professional, Scientific & Technical Services 4,172 4,700 528 12.7
55-0000 Management of Companies & Enterprises 210 216 6 2.9
55-1000 Management of Companies & Enterprises 210 216 6 2.9
56-0000 Admin./Support & Waste Mgmt Svcs 3,273 3,903 630 19.2
56-1000 Administrative & Support Services 3,095 3,677 582 18.8
56-2000 Waste Mgmt & Remediation Services 178 226 48 27.0
61-0000 Educational Svcs 15,046 17,000 1,954 13.0
61-1000 Educational Services 15,046 17,000 1,954 13.0
62-0000 Health Care & Social Assistance 16,274 18,879 2,605 16.0
62-1000 Ambulatory Health Care Services 7,113 8,000 887 12.5
62-2000 Hospitals 3,883 4,179 296 7.6
62-3000 Nursing & Residential Care Facilities 1,454 1,700 246 16.9
62-4000 Social Assistance 3,824 5,000 1,176 30.8
71-0000 Arts, Entertainment & Recreation 1,214 1,426 212 17.5
71-1000 Performing Arts/Spectator Sports/Related Industries 57 62 5 8.8
71-2000 Museums, Historical Sites & Similar Institutions 15 18 3 20.0
71-3000 Amusement, Gambling & Recreation Industries 1,142 1,346 204 17.9
2012-2022Employment Growth
Southwestern Region Industry Employment Projections Continued
79 2012-2022 NEW MEXICO EMPLOYMENT PROJECTIONS REPORT
NAICS Industry 2012 2022 Numeric Pct.
72-0000 Accommodation & Food Svcs 9,132 10,992 1,860 20.4
72-1000 Accommodation, Incl. Hotels & Motels 1,308 1,477 169 12.9
72-2000 Food Services & Drinking Places 7,824 9,515 1,691 21.6
81-0000 Other Services (Ex. Government) 1,752 1,784 32 1.8
81-1000 Repair & Maintenance 674 738 64 9.5
81-2000 Personal & Laundry Services *** *** *** 6.7
81-3000 Religious/Grantmaking/Civic/Prof. Organizations *** *** *** 9.0
81-4000 Private Households 198 100 -98 -49.5
90-0000 Total Government 12,656 12,306 -350 -2.8
91-0000 Federal Government 5,388 4,780 -608 -11.3
92-0000 State Government 2,590 2,580 -10 -0.4
93-0000 Local Government 4,678 4,946 268 5.7
***Data is suppressed. If percentage growth is shown as suppressed, it indicates that 2012 employment was below 35.
Employment Growth
Southwestern Region Industry Employment Projections Continued
2012-2022

NEW MEXICO DEPARTMENT OF WORKFORCE SOLUTIONS 80
Southwestern Region Industry Projections
-230-220
-201030
6090
150180200200
290300310
350460
510710730
1,1301,390
1,720
ManagementFarming, Fishing & Forestry
Life, Physical & Social ScienceLegal
Architecture & EngineeringArts/Design/Entertainment/Sports/Media
ProductionComputer & Mathematical
Protective ServiceBusiness & Financial Operations
Community & Social ServicesTransportation & Material Moving
Construction & ExtractionInstallation, Maintenance & Repair
Building & Grounds Cleaning & MaintenanceHealthcare Practitioners & Technical
Healthcare SupportOffice & Administrative Support
Sales & RelatedEducation, Training & Library
Personal Care & ServiceFood Preparation & Serving-Related
Growth is rounded.
Projected Numeric Employment Growth by Major Occupation GroupSouthwestern Region, 2012 to 2022
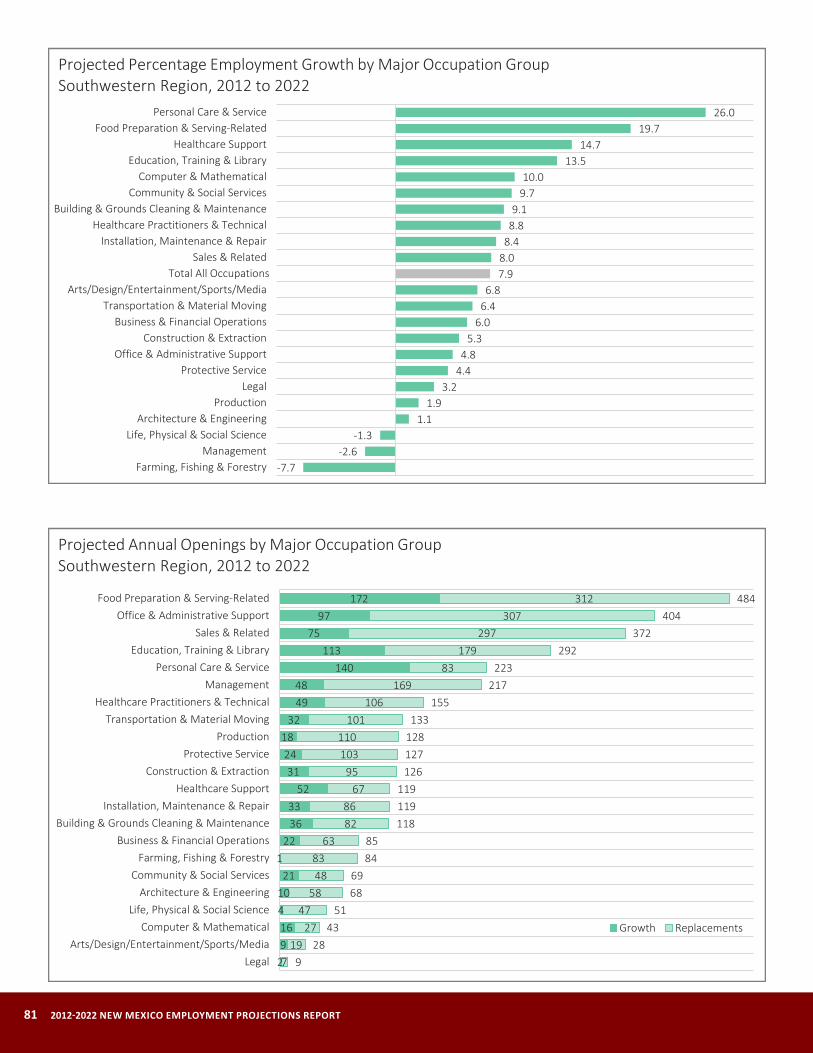
81 2012-2022 NEW MEXICO EMPLOYMENT PROJECTIONS REPORT
-7.7-2.6
-1.31.1
1.93.2
4.44.8
5.36.0
6.46.8
7.98.08.48.89.1
9.710.0
13.514.7
19.726.0
Farming, Fishing & ForestryManagement
Life, Physical & Social ScienceArchitecture & Engineering
ProductionLegal
Protective ServiceOffice & Administrative Support
Construction & ExtractionBusiness & Financial Operations
Transportation & Material MovingArts/Design/Entertainment/Sports/Media
Total All OccupationsSales & Related
Installation, Maintenance & RepairHealthcare Practitioners & Technical
Building & Grounds Cleaning & MaintenanceCommunity & Social Services
Computer & MathematicalEducation, Training & Library
Healthcare SupportFood Preparation & Serving-Related
Personal Care & Service
Projected Percentage Employment Growth by Major Occupation GroupSouthwestern Region, 2012 to 2022
291641021
122
3633
5231
2418
324948
140113
7597
172
719
2747
584883
638286
6795
103110
101106
16983
179297
307312
928
4351
6869
8485
118119119
126127128133
155217
223292
372404
484
LegalArts/Design/Entertainment/Sports/Media
Computer & MathematicalLife, Physical & Social Science
Architecture & EngineeringCommunity & Social Services
Farming, Fishing & ForestryBusiness & Financial Operations
Building & Grounds Cleaning & MaintenanceInstallation, Maintenance & Repair
Healthcare SupportConstruction & Extraction
Protective ServiceProduction
Transportation & Material MovingHealthcare Practitioners & Technical
ManagementPersonal Care & Service
Education, Training & LibrarySales & Related
Office & Administrative SupportFood Preparation & Serving-Related
Growth Replacements
Projected Annual Openings by Major Occupation GroupSouthwestern Region, 2012 to 2022

NEW MEXICO DEPARTMENT OF WORKFORCE SOLUTIONS 82
404040404040
***505060606060
80120130130
200260270280280
310530
1,160
Pharmacy TechniciansSupervisors of Personal Service Workers
Child, Family & School Social WorkersKindergarten Teachers, Ex. Special Education
Hosts & Hostesses, Restaurant, Lounge & Coffee ShopEducational, Guidance, School & Vocational Counselors
Interpreters & TranslatorsHotel, Motel & Resort Desk Clerks
Computer User Support SpecialistsDriver/Sales Workers
BartendersMedical Secretaries
Management AnalystsDishwashers
Nursing AssistantsCorrectional Officers & Jailers
Middle School Teachers, Ex. Special & Career/Tech. EducationSupervisors of Food Preparation & Serving Workers
Cooks, RestaurantHome Health Aides
Customer Service RepsElementary School Teachers, Ex. Special Education
Waiters & WaitressesCombined Food Preparation & Serving Workers, Incl. Fast Food
Personal Care Aides
Top 25 Occupations with the Most Projected Employment GrowthSouthwestern Region, 2012 to 2022
Growth is rounded.***Growth is suppressed.
Only includes occupations with rates of growth that exceed the state's all-occupation average of 12 percent.
19.119.520.020.020.1
20.922.923.123.1
24.224.6
25.325.9
27.727.828.3
29.432.1
34.534.6
38.638.6
40.541.7
46.7
Education Administrators PostsecondaryCustomer Service Reps
Psychology Teachers, PostsecondaryAutomotive & Watercraft Service Attendants
Computer User Support SpecialistsArt, Drama & Music Teachers, Postsecondary
Biological Science Teachers, PostsecondarySupervisors of Correctional Officers
BartendersComputer Systems Analysts
LogisticiansSupervisors of Food Preparation & Serving Workers
Septic Tank Servicers & Sewer Pipe CleanersCombined Food Preparation & Serving Workers, Incl. Fast Food
Cooks, RestaurantDiagnostic Medical SonographersOccupational Therapy Assistants
Market Research Analysts & Marketing SpecialistsMedical Equipment Repairers
Demonstrators & Product PromotersHome Health Aides
Nursing Instructors & Teachers, PostsecondaryPersonal Care Aides
Health Specialties Teachers, PostsecondaryInterpreters & Translators
Only includes occupations with 2012 employment greater than 20.
Top 25 Occupations with the Fastest Projected Employment GrowthProjected Percentage Growth, Southwestern Region, 2012 to 2022
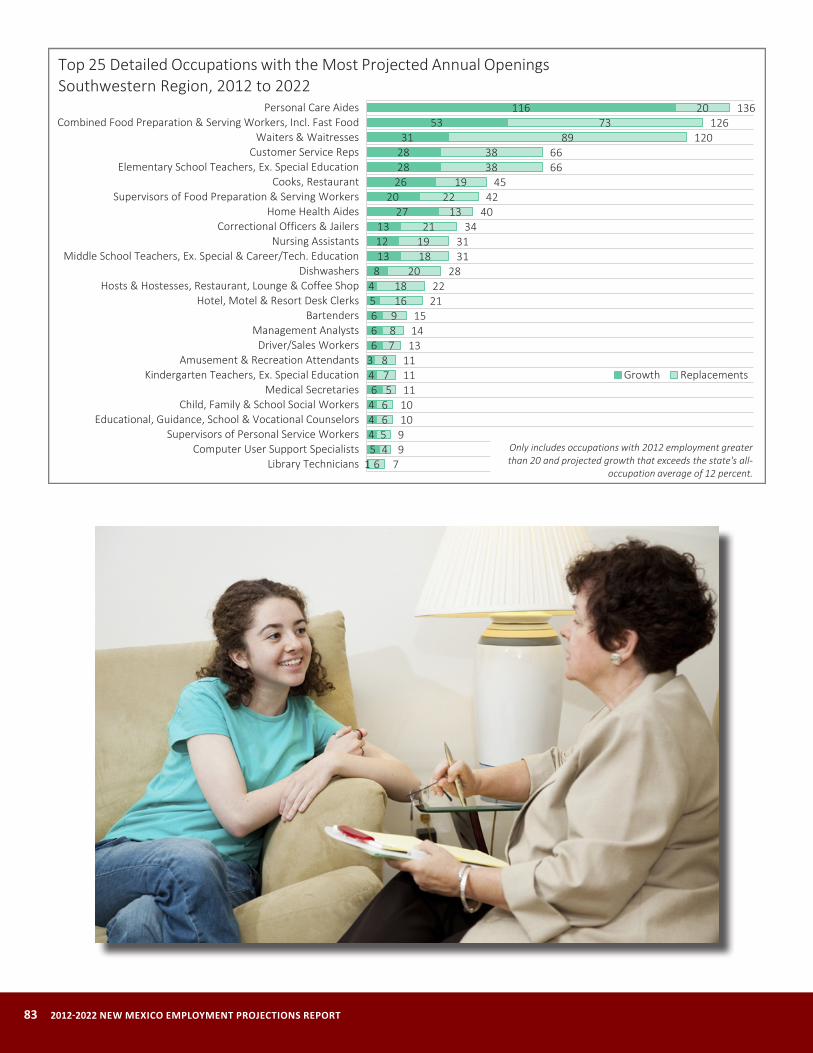
83 2012-2022 NEW MEXICO EMPLOYMENT PROJECTIONS REPORT
15444643666548131213
2720
26282831
53116
64566578
7891618
20181921
1322
193838
8973
20
7991010111111131415
2122
283131
344042
456666
120126
136
Library TechniciansComputer User Support Specialists
Supervisors of Personal Service WorkersEducational, Guidance, School & Vocational Counselors
Child, Family & School Social WorkersMedical Secretaries
Kindergarten Teachers, Ex. Special EducationAmusement & Recreation Attendants
Driver/Sales WorkersManagement Analysts
BartendersHotel, Motel & Resort Desk Clerks
Hosts & Hostesses, Restaurant, Lounge & Coffee ShopDishwashers
Middle School Teachers, Ex. Special & Career/Tech. EducationNursing Assistants
Correctional Officers & JailersHome Health Aides
Supervisors of Food Preparation & Serving WorkersCooks, Restaurant
Elementary School Teachers, Ex. Special EducationCustomer Service Reps
Waiters & WaitressesCombined Food Preparation & Serving Workers, Incl. Fast Food
Personal Care Aides
Growth Replacements
Top 25 Detailed Occupations with the Most Projected Annual OpeningsSouthwestern Region, 2012 to 2022
Only includes occupations with 2012 employment greater than 20 and projected growth that exceeds the state's all-
occupation average of 12 percent.

NEW MEXICO DEPARTMENT OF WORKFORCE SOLUTIONS 84
New Mexico Occupation Projections
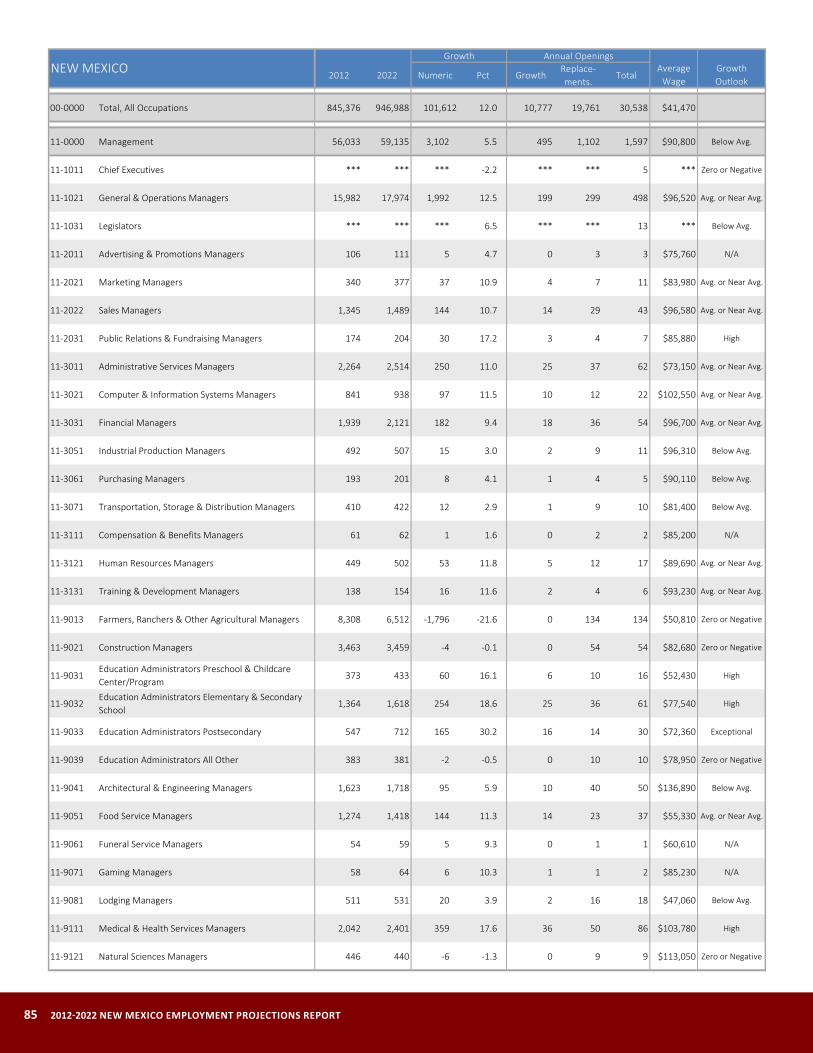
85 2012-2022 NEW MEXICO EMPLOYMENT PROJECTIONS REPORT
2012 2022 Numeric Pct GrowthReplace-ments.
Total
00-0000 Total, All Occupations 845,376 946,988 101,612 12.0 10,777 19,761 30,538 $41,470
11-0000 Management 56,033 59,135 3,102 5.5 495 1,102 1,597 $90,800 Below Avg.
11-1011 Chief Executives *** *** *** -2.2 *** *** 5 *** Zero or Negative
11-1021 General & Operations Managers 15,982 17,974 1,992 12.5 199 299 498 $96,520 Avg. or Near Avg.
11-1031 Legislators *** *** *** 6.5 *** *** 13 *** Below Avg.
11-2011 Advertising & Promotions Managers 106 111 5 4.7 0 3 3 $75,760 N/A
11-2021 Marketing Managers 340 377 37 10.9 4 7 11 $83,980 Avg. or Near Avg.
11-2022 Sales Managers 1,345 1,489 144 10.7 14 29 43 $96,580 Avg. or Near Avg.
11-2031 Public Relations & Fundraising Managers 174 204 30 17.2 3 4 7 $85,880 High
11-3011 Administrative Services Managers 2,264 2,514 250 11.0 25 37 62 $73,150 Avg. or Near Avg.
11-3021 Computer & Information Systems Managers 841 938 97 11.5 10 12 22 $102,550 Avg. or Near Avg.
11-3031 Financial Managers 1,939 2,121 182 9.4 18 36 54 $96,700 Avg. or Near Avg.
11-3051 Industrial Production Managers 492 507 15 3.0 2 9 11 $96,310 Below Avg.
11-3061 Purchasing Managers 193 201 8 4.1 1 4 5 $90,110 Below Avg.
11-3071 Transportation, Storage & Distribution Managers 410 422 12 2.9 1 9 10 $81,400 Below Avg.
11-3111 Compensation & Benefits Managers 61 62 1 1.6 0 2 2 $85,200 N/A
11-3121 Human Resources Managers 449 502 53 11.8 5 12 17 $89,690 Avg. or Near Avg.
11-3131 Training & Development Managers 138 154 16 11.6 2 4 6 $93,230 Avg. or Near Avg.
11-9013 Farmers, Ranchers & Other Agricultural Managers 8,308 6,512 -1,796 -21.6 0 134 134 $50,810 Zero or Negative
11-9021 Construction Managers 3,463 3,459 -4 -0.1 0 54 54 $82,680 Zero or Negative
11-9031Education Administrators Preschool & Childcare Center/Program
373 433 60 16.1 6 10 16 $52,430 High
11-9032Education Administrators Elementary & Secondary School
1,364 1,618 254 18.6 25 36 61 $77,540 High
11-9033 Education Administrators Postsecondary 547 712 165 30.2 16 14 30 $72,360 Exceptional
11-9039 Education Administrators All Other 383 381 -2 -0.5 0 10 10 $78,950 Zero or Negative
11-9041 Architectural & Engineering Managers 1,623 1,718 95 5.9 10 40 50 $136,890 Below Avg.
11-9051 Food Service Managers 1,274 1,418 144 11.3 14 23 37 $55,330 Avg. or Near Avg.
11-9061 Funeral Service Managers 54 59 5 9.3 0 1 1 $60,610 N/A
11-9071 Gaming Managers 58 64 6 10.3 1 1 2 $85,230 N/A
11-9081 Lodging Managers 511 531 20 3.9 2 16 18 $47,060 Below Avg.
11-9111 Medical & Health Services Managers 2,042 2,401 359 17.6 36 50 86 $103,780 High
11-9121 Natural Sciences Managers 446 440 -6 -1.3 0 9 9 $113,050 Zero or Negative
Growth Annual OpeningsAverage
WageGrowth Outlook
NEW MEXICO
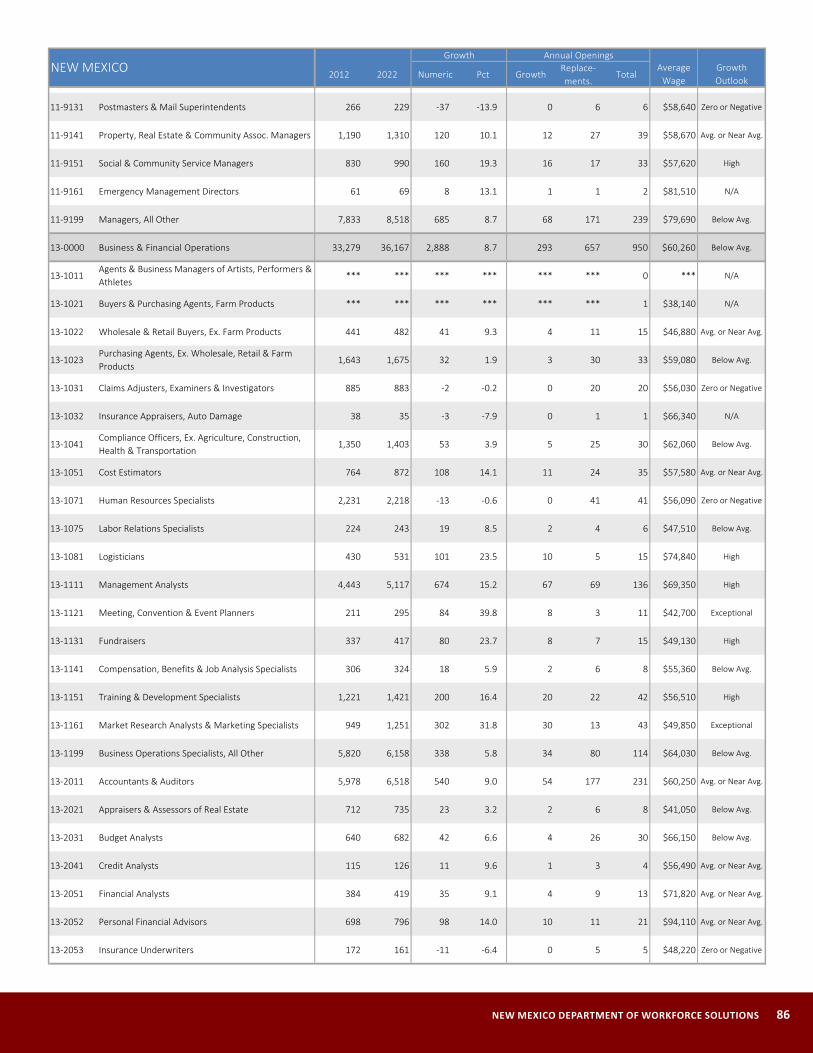
NEW MEXICO DEPARTMENT OF WORKFORCE SOLUTIONS 86
2012 2022 Numeric Pct GrowthReplace-ments.
Total
11-9131 Postmasters & Mail Superintendents 266 229 -37 -13.9 0 6 6 $58,640 Zero or Negative
11-9141 Property, Real Estate & Community Assoc. Managers 1,190 1,310 120 10.1 12 27 39 $58,670 Avg. or Near Avg.
11-9151 Social & Community Service Managers 830 990 160 19.3 16 17 33 $57,620 High
11-9161 Emergency Management Directors 61 69 8 13.1 1 1 2 $81,510 N/A
11-9199 Managers, All Other 7,833 8,518 685 8.7 68 171 239 $79,690 Below Avg.
13-0000 Business & Financial Operations 33,279 36,167 2,888 8.7 293 657 950 $60,260 Below Avg.
13-1011Agents & Business Managers of Artists, Performers & Athletes
*** *** *** *** *** *** 0 *** N/A
13-1021 Buyers & Purchasing Agents, Farm Products *** *** *** *** *** *** 1 $38,140 N/A
13-1022 Wholesale & Retail Buyers, Ex. Farm Products 441 482 41 9.3 4 11 15 $46,880 Avg. or Near Avg.
13-1023Purchasing Agents, Ex. Wholesale, Retail & Farm Products
1,643 1,675 32 1.9 3 30 33 $59,080 Below Avg.
13-1031 Claims Adjusters, Examiners & Investigators 885 883 -2 -0.2 0 20 20 $56,030 Zero or Negative
13-1032 Insurance Appraisers, Auto Damage 38 35 -3 -7.9 0 1 1 $66,340 N/A
13-1041Compliance Officers, Ex. Agriculture, Construction, Health & Transportation
1,350 1,403 53 3.9 5 25 30 $62,060 Below Avg.
13-1051 Cost Estimators 764 872 108 14.1 11 24 35 $57,580 Avg. or Near Avg.
13-1071 Human Resources Specialists 2,231 2,218 -13 -0.6 0 41 41 $56,090 Zero or Negative
13-1075 Labor Relations Specialists 224 243 19 8.5 2 4 6 $47,510 Below Avg.
13-1081 Logisticians 430 531 101 23.5 10 5 15 $74,840 High
13-1111 Management Analysts 4,443 5,117 674 15.2 67 69 136 $69,350 High
13-1121 Meeting, Convention & Event Planners 211 295 84 39.8 8 3 11 $42,700 Exceptional
13-1131 Fundraisers 337 417 80 23.7 8 7 15 $49,130 High
13-1141 Compensation, Benefits & Job Analysis Specialists 306 324 18 5.9 2 6 8 $55,360 Below Avg.
13-1151 Training & Development Specialists 1,221 1,421 200 16.4 20 22 42 $56,510 High
13-1161 Market Research Analysts & Marketing Specialists 949 1,251 302 31.8 30 13 43 $49,850 Exceptional
13-1199 Business Operations Specialists, All Other 5,820 6,158 338 5.8 34 80 114 $64,030 Below Avg.
13-2011 Accountants & Auditors 5,978 6,518 540 9.0 54 177 231 $60,250 Avg. or Near Avg.
13-2021 Appraisers & Assessors of Real Estate 712 735 23 3.2 2 6 8 $41,050 Below Avg.
13-2031 Budget Analysts 640 682 42 6.6 4 26 30 $66,150 Below Avg.
13-2041 Credit Analysts 115 126 11 9.6 1 3 4 $56,490 Avg. or Near Avg.
13-2051 Financial Analysts 384 419 35 9.1 4 9 13 $71,820 Avg. or Near Avg.
13-2052 Personal Financial Advisors 698 796 98 14.0 10 11 21 $94,110 Avg. or Near Avg.
13-2053 Insurance Underwriters 172 161 -11 -6.4 0 5 5 $48,220 Zero or Negative
NEW MEXICOGrowth Annual Openings
AverageWage
Growth Outlook

87 2012-2022 NEW MEXICO EMPLOYMENT PROJECTIONS REPORT
2012 2022 Numeric Pct GrowthReplace-ments.
Total
13-2061 Financial Examiners 55 54 -1 -1.8 0 1 1 $79,540 N/A
13-2071 Credit Counselors 38 44 6 15.8 1 1 2 $39,850 N/A
13-2072 Loan Officers 1,518 1,641 123 8.1 12 28 40 $57,920 Below Avg.
13-2081 Tax Examiners & Collectors & Revenue Agents 346 344 -2 -0.6 0 12 12 $43,570 Zero or Negative
13-2082 Tax Preparers 342 333 -9 -2.6 0 7 7 $36,370 Zero or Negative
13-2099 Financial Specialists, All Other 946 943 -3 -0.3 0 10 10 $46,920 Zero or Negative
15-0000 Computer & Mathematical 14,697 16,726 2,029 13.8 206 239 445 $71,450 Avg. or Near Avg.
15-1111 Computer & Information Research Scientists 177 195 18 10.2 2 3 5 $102,700 Avg. or Near Avg.
15-1121 Computer Systems Analysts 1,403 1,759 356 25.4 36 22 58 $77,140 Exceptional
15-1122 Information Security Analysts 339 467 128 37.8 13 5 18 $91,460 Exceptional
15-1131 Computer Programmers 1,173 1,247 74 6.3 7 31 38 $96,190 Below Avg.
15-1132 Software Developers, Applications 1,056 1,155 99 9.4 10 14 24 $78,430 Avg. or Near Avg.
15-1133 Software Developers, Systems Software 2,203 2,526 323 14.7 32 28 60 $90,870 Avg. or Near Avg.
15-1134 Web Developers 381 455 74 19.4 7 6 13 $57,170 High
15-1141 Database Administrators 437 495 58 13.3 6 8 14 $69,070 Avg. or Near Avg.
15-1142 Network & Computer Systems Administrators 1,390 1,545 155 11.2 16 22 38 $68,520 Avg. or Near Avg.
15-1143 Computer Network Architects 536 623 87 16.2 9 8 17 $87,870 High
15-1151 Computer User Support Specialists 3,266 3,804 538 16.5 54 51 105 $44,120 High
15-1152 Computer Network Support Specialists 1,088 1,142 54 5.0 5 17 22 $59,990 Below Avg.
15-1199 Computer Occupations, All Other 786 753 -33 -4.2 0 12 12 $79,210 Zero or Negative
15-2011 Actuaries 31 38 7 22.6 1 1 2 $106,610 N/A
15-2021 Mathematicians 40 46 6 15.0 1 1 2 *** N/A
15-2031 Operations Research Analysts 295 354 59 20.0 6 7 13 $90,290 High
15-2041 Statisticians 71 93 22 31.0 2 2 4 $61,400 N/A
15-2091 Mathematical Technicians *** *** *** *** *** *** 0 *** N/A
15-2099 Mathematical Science Occupations, All Other *** *** *** *** *** *** 1 *** N/A
17-0000 Architecture & Engineering 21,146 21,812 666 3.1 103 466 569 $81,010 Below Avg.
17-1011 Architects, Ex. Landscape & Naval 621 648 27 4.3 3 15 18 $73,670 Below Avg.
17-1012 Landscape Architects 72 74 2 2.8 0 2 2 $68,470 N/A
17-1021 Cartographers & Photogrammetrists 268 307 39 14.6 4 6 10 $50,280 Avg. or Near Avg.
17-1022 Surveyors 422 418 -4 -0.9 0 9 9 $56,990 Zero or Negative
NEW MEXICOGrowth Annual Openings
AverageWage
Growth Outlook
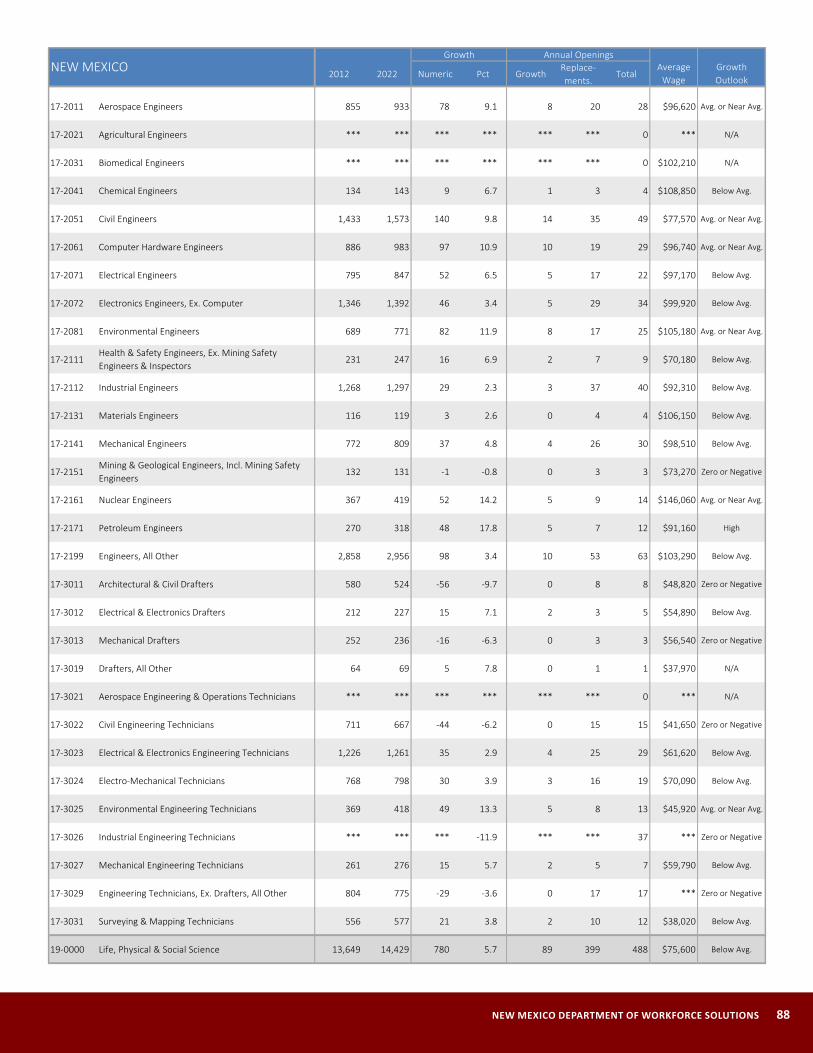
NEW MEXICO DEPARTMENT OF WORKFORCE SOLUTIONS 88
2012 2022 Numeric Pct GrowthReplace-ments.
Total
17-2011 Aerospace Engineers 855 933 78 9.1 8 20 28 $96,620 Avg. or Near Avg.
17-2021 Agricultural Engineers *** *** *** *** *** *** 0 *** N/A
17-2031 Biomedical Engineers *** *** *** *** *** *** 0 $102,210 N/A
17-2041 Chemical Engineers 134 143 9 6.7 1 3 4 $108,850 Below Avg.
17-2051 Civil Engineers 1,433 1,573 140 9.8 14 35 49 $77,570 Avg. or Near Avg.
17-2061 Computer Hardware Engineers 886 983 97 10.9 10 19 29 $96,740 Avg. or Near Avg.
17-2071 Electrical Engineers 795 847 52 6.5 5 17 22 $97,170 Below Avg.
17-2072 Electronics Engineers, Ex. Computer 1,346 1,392 46 3.4 5 29 34 $99,920 Below Avg.
17-2081 Environmental Engineers 689 771 82 11.9 8 17 25 $105,180 Avg. or Near Avg.
17-2111Health & Safety Engineers, Ex. Mining Safety Engineers & Inspectors
231 247 16 6.9 2 7 9 $70,180 Below Avg.
17-2112 Industrial Engineers 1,268 1,297 29 2.3 3 37 40 $92,310 Below Avg.
17-2131 Materials Engineers 116 119 3 2.6 0 4 4 $106,150 Below Avg.
17-2141 Mechanical Engineers 772 809 37 4.8 4 26 30 $98,510 Below Avg.
17-2151Mining & Geological Engineers, Incl. Mining Safety Engineers
132 131 -1 -0.8 0 3 3 $73,270 Zero or Negative
17-2161 Nuclear Engineers 367 419 52 14.2 5 9 14 $146,060 Avg. or Near Avg.
17-2171 Petroleum Engineers 270 318 48 17.8 5 7 12 $91,160 High
17-2199 Engineers, All Other 2,858 2,956 98 3.4 10 53 63 $103,290 Below Avg.
17-3011 Architectural & Civil Drafters 580 524 -56 -9.7 0 8 8 $48,820 Zero or Negative
17-3012 Electrical & Electronics Drafters 212 227 15 7.1 2 3 5 $54,890 Below Avg.
17-3013 Mechanical Drafters 252 236 -16 -6.3 0 3 3 $56,540 Zero or Negative
17-3019 Drafters, All Other 64 69 5 7.8 0 1 1 $37,970 N/A
17-3021 Aerospace Engineering & Operations Technicians *** *** *** *** *** *** 0 *** N/A
17-3022 Civil Engineering Technicians 711 667 -44 -6.2 0 15 15 $41,650 Zero or Negative
17-3023 Electrical & Electronics Engineering Technicians 1,226 1,261 35 2.9 4 25 29 $61,620 Below Avg.
17-3024 Electro-Mechanical Technicians 768 798 30 3.9 3 16 19 $70,090 Below Avg.
17-3025 Environmental Engineering Technicians 369 418 49 13.3 5 8 13 $45,920 Avg. or Near Avg.
17-3026 Industrial Engineering Technicians *** *** *** -11.9 *** *** 37 *** Zero or Negative
17-3027 Mechanical Engineering Technicians 261 276 15 5.7 2 5 7 $59,790 Below Avg.
17-3029 Engineering Technicians, Ex. Drafters, All Other 804 775 -29 -3.6 0 17 17 *** Zero or Negative
17-3031 Surveying & Mapping Technicians 556 577 21 3.8 2 10 12 $38,020 Below Avg.
19-0000 Life, Physical & Social Science 13,649 14,429 780 5.7 89 399 488 $75,600 Below Avg.
NEW MEXICOGrowth Annual Openings
AverageWage
Growth Outlook
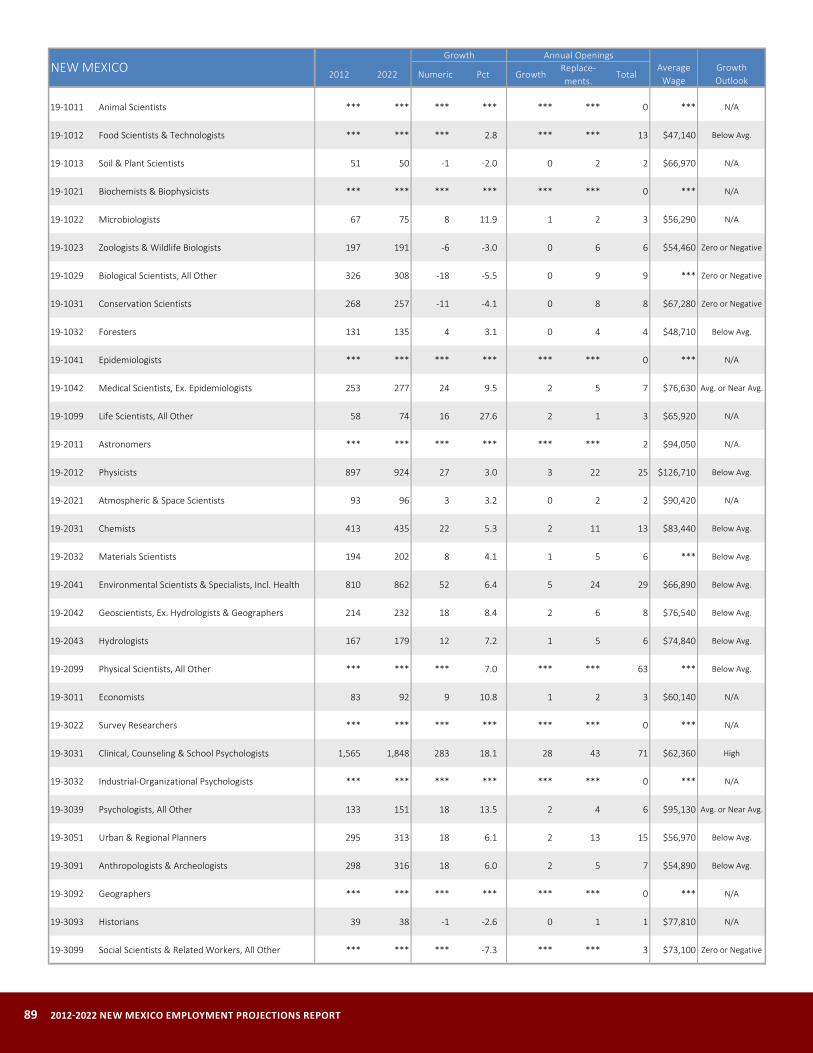
89 2012-2022 NEW MEXICO EMPLOYMENT PROJECTIONS REPORT
2012 2022 Numeric Pct GrowthReplace-ments.
Total
19-1011 Animal Scientists *** *** *** *** *** *** 0 *** N/A
19-1012 Food Scientists & Technologists *** *** *** 2.8 *** *** 13 $47,140 Below Avg.
19-1013 Soil & Plant Scientists 51 50 -1 -2.0 0 2 2 $66,970 N/A
19-1021 Biochemists & Biophysicists *** *** *** *** *** *** 0 *** N/A
19-1022 Microbiologists 67 75 8 11.9 1 2 3 $56,290 N/A
19-1023 Zoologists & Wildlife Biologists 197 191 -6 -3.0 0 6 6 $54,460 Zero or Negative
19-1029 Biological Scientists, All Other 326 308 -18 -5.5 0 9 9 *** Zero or Negative
19-1031 Conservation Scientists 268 257 -11 -4.1 0 8 8 $67,280 Zero or Negative
19-1032 Foresters 131 135 4 3.1 0 4 4 $48,710 Below Avg.
19-1041 Epidemiologists *** *** *** *** *** *** 0 *** N/A
19-1042 Medical Scientists, Ex. Epidemiologists 253 277 24 9.5 2 5 7 $76,630 Avg. or Near Avg.
19-1099 Life Scientists, All Other 58 74 16 27.6 2 1 3 $65,920 N/A
19-2011 Astronomers *** *** *** *** *** *** 2 $94,050 N/A
19-2012 Physicists 897 924 27 3.0 3 22 25 $126,710 Below Avg.
19-2021 Atmospheric & Space Scientists 93 96 3 3.2 0 2 2 $90,420 N/A
19-2031 Chemists 413 435 22 5.3 2 11 13 $83,440 Below Avg.
19-2032 Materials Scientists 194 202 8 4.1 1 5 6 *** Below Avg.
19-2041 Environmental Scientists & Specialists, Incl. Health 810 862 52 6.4 5 24 29 $66,890 Below Avg.
19-2042 Geoscientists, Ex. Hydrologists & Geographers 214 232 18 8.4 2 6 8 $76,540 Below Avg.
19-2043 Hydrologists 167 179 12 7.2 1 5 6 $74,840 Below Avg.
19-2099 Physical Scientists, All Other *** *** *** 7.0 *** *** 63 *** Below Avg.
19-3011 Economists 83 92 9 10.8 1 2 3 $60,140 N/A
19-3022 Survey Researchers *** *** *** *** *** *** 0 *** N/A
19-3031 Clinical, Counseling & School Psychologists 1,565 1,848 283 18.1 28 43 71 $62,360 High
19-3032 Industrial-Organizational Psychologists *** *** *** *** *** *** 0 *** N/A
19-3039 Psychologists, All Other 133 151 18 13.5 2 4 6 $95,130 Avg. or Near Avg.
19-3051 Urban & Regional Planners 295 313 18 6.1 2 13 15 $56,970 Below Avg.
19-3091 Anthropologists & Archeologists 298 316 18 6.0 2 5 7 $54,890 Below Avg.
19-3092 Geographers *** *** *** *** *** *** 0 *** N/A
19-3093 Historians 39 38 -1 -2.6 0 1 1 $77,810 N/A
19-3099 Social Scientists & Related Workers, All Other *** *** *** -7.3 *** *** 3 $73,100 Zero or Negative
NEW MEXICOGrowth Annual Openings
AverageWage
Growth Outlook
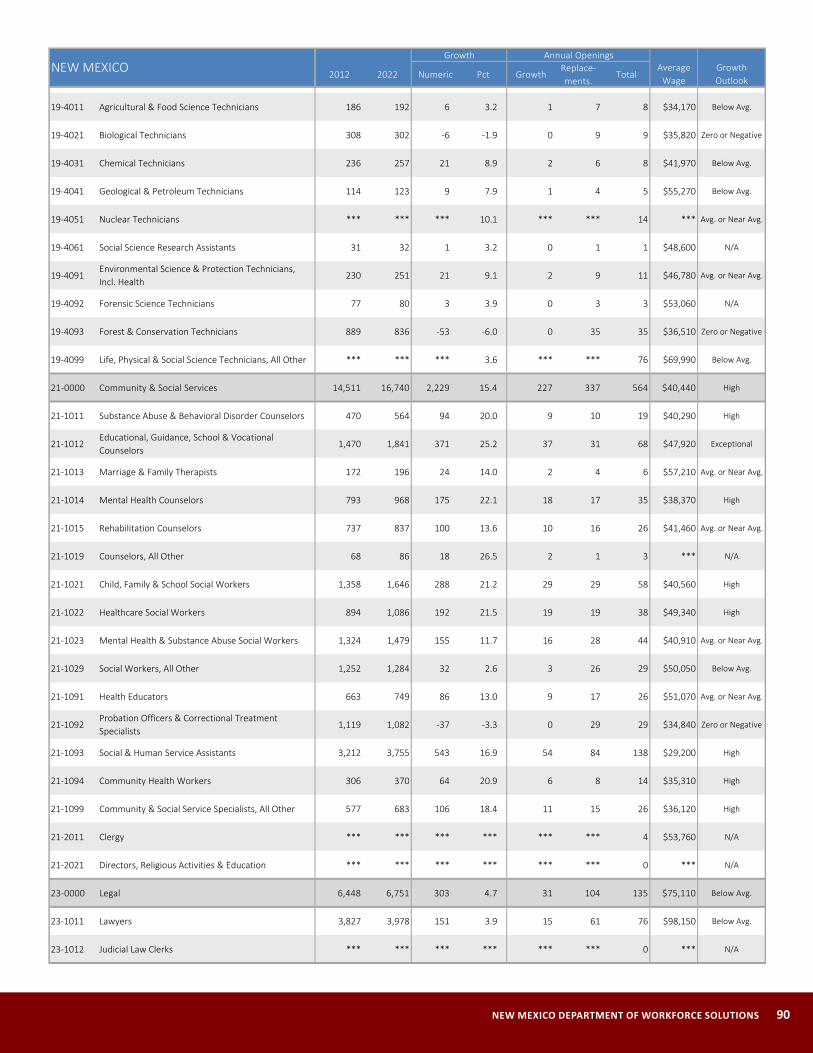
NEW MEXICO DEPARTMENT OF WORKFORCE SOLUTIONS 90
2012 2022 Numeric Pct GrowthReplace-ments.
Total
19-4011 Agricultural & Food Science Technicians 186 192 6 3.2 1 7 8 $34,170 Below Avg.
19-4021 Biological Technicians 308 302 -6 -1.9 0 9 9 $35,820 Zero or Negative
19-4031 Chemical Technicians 236 257 21 8.9 2 6 8 $41,970 Below Avg.
19-4041 Geological & Petroleum Technicians 114 123 9 7.9 1 4 5 $55,270 Below Avg.
19-4051 Nuclear Technicians *** *** *** 10.1 *** *** 14 *** Avg. or Near Avg.
19-4061 Social Science Research Assistants 31 32 1 3.2 0 1 1 $48,600 N/A
19-4091Environmental Science & Protection Technicians, Incl. Health
230 251 21 9.1 2 9 11 $46,780 Avg. or Near Avg.
19-4092 Forensic Science Technicians 77 80 3 3.9 0 3 3 $53,060 N/A
19-4093 Forest & Conservation Technicians 889 836 -53 -6.0 0 35 35 $36,510 Zero or Negative
19-4099 Life, Physical & Social Science Technicians, All Other *** *** *** 3.6 *** *** 76 $69,990 Below Avg.
21-0000 Community & Social Services 14,511 16,740 2,229 15.4 227 337 564 $40,440 High
21-1011 Substance Abuse & Behavioral Disorder Counselors 470 564 94 20.0 9 10 19 $40,290 High
21-1012Educational, Guidance, School & Vocational Counselors
1,470 1,841 371 25.2 37 31 68 $47,920 Exceptional
21-1013 Marriage & Family Therapists 172 196 24 14.0 2 4 6 $57,210 Avg. or Near Avg.
21-1014 Mental Health Counselors 793 968 175 22.1 18 17 35 $38,370 High
21-1015 Rehabilitation Counselors 737 837 100 13.6 10 16 26 $41,460 Avg. or Near Avg.
21-1019 Counselors, All Other 68 86 18 26.5 2 1 3 *** N/A
21-1021 Child, Family & School Social Workers 1,358 1,646 288 21.2 29 29 58 $40,560 High
21-1022 Healthcare Social Workers 894 1,086 192 21.5 19 19 38 $49,340 High
21-1023 Mental Health & Substance Abuse Social Workers 1,324 1,479 155 11.7 16 28 44 $40,910 Avg. or Near Avg.
21-1029 Social Workers, All Other 1,252 1,284 32 2.6 3 26 29 $50,050 Below Avg.
21-1091 Health Educators 663 749 86 13.0 9 17 26 $51,070 Avg. or Near Avg.
21-1092Probation Officers & Correctional Treatment Specialists
1,119 1,082 -37 -3.3 0 29 29 $34,840 Zero or Negative
21-1093 Social & Human Service Assistants 3,212 3,755 543 16.9 54 84 138 $29,200 High
21-1094 Community Health Workers 306 370 64 20.9 6 8 14 $35,310 High
21-1099 Community & Social Service Specialists, All Other 577 683 106 18.4 11 15 26 $36,120 High
21-2011 Clergy *** *** *** *** *** *** 4 $53,760 N/A
21-2021 Directors, Religious Activities & Education *** *** *** *** *** *** 0 *** N/A
23-0000 Legal 6,448 6,751 303 4.7 31 104 135 $75,110 Below Avg.
23-1011 Lawyers 3,827 3,978 151 3.9 15 61 76 $98,150 Below Avg.
23-1012 Judicial Law Clerks *** *** *** *** *** *** 0 *** N/A
NEW MEXICOGrowth Annual Openings
AverageWage
Growth Outlook

91 2012-2022 NEW MEXICO EMPLOYMENT PROJECTIONS REPORT
2012 2022 Numeric Pct GrowthReplace-ments.
Total
23-1021Administrative Law Judges, Adjudicators & Hearing Officers
143 142 -1 -0.7 0 2 2 $63,690 Zero or Negative
23-1022 Arbitrators, Mediators & Conciliators *** *** *** *** *** *** 1 $89,760 N/A
23-1023 Judges, Magistrate Judges & Magistrates 109 113 4 3.7 0 2 2 $48,810 N/A
23-2011 Paralegals & Legal Assistants 1,663 1,808 145 8.7 14 27 41 $43,780 Below Avg.
23-2091 Court Reporters *** *** *** *** *** *** 2 *** N/A
23-2093 Title Examiners, Abstractors & Searchers 481 481 0 0.0 0 8 8 $38,940 Zero or Negative
23-2099 Legal Support Workers, All Other *** *** *** *** *** *** 2 $42,440 N/A
25-0000 Education, Training & Library 49,418 60,852 11,434 23.1 1,145 1,038 2,183 $43,710 High
25-1011 Business Teachers, Postsecondary *** *** *** 30.1 *** *** 11 $82,130 Exceptional
25-1021 Computer Science Teachers, Postsecondary *** *** *** *** *** *** 3 $84,590 N/A
25-1022 Mathematical Science Teachers, Postsecondary *** *** *** 26.7 *** *** 6 $58,630 Exceptional
25-1031 Architecture Teachers, Postsecondary *** *** *** *** *** *** 1 *** N/A
25-1032 Engineering Teachers, Postsecondary *** *** *** 27.3 *** *** 8 $91,700 Exceptional
25-1041 Agricultural Sciences Teachers, Postsecondary *** *** *** *** *** *** 2 *** N/A
25-1042 Biological Science Teachers, Postsecondary *** *** *** 34.5 *** *** 7 *** Exceptional
25-1043Forestry & Conservation Science Teachers, Postsecondary
*** *** *** *** *** *** 0 *** N/A
25-1051Atmospheric, Earth, Marine & Space Sciences Teachers, Postsecondary
*** *** *** *** *** *** 3 $69,480 N/A
25-1052 Chemistry Teachers, Postsecondary *** *** *** *** *** *** 3 $70,200 N/A
25-1053 Environmental Science Teachers, Postsecondary *** *** *** *** *** *** 1 $79,460 N/A
25-1054 Physics Teachers, Postsecondary *** *** *** *** *** *** 5 $88,070 N/A
25-1061 Anthropology & Archeology Teachers, Postsecondary *** *** *** *** *** *** 1 $69,000 N/A
25-1062Area, Ethnic & Cultural Studies Teachers, Postsecondary
*** *** *** *** *** *** 1 $72,860 N/A
25-1063 Economics Teachers, Postsecondary *** *** *** *** *** *** 2 $77,780 N/A
25-1064 Geography Teachers, Postsecondary *** *** *** *** *** *** 0 *** N/A
25-1065 Political Science Teachers, Postsecondary *** *** *** *** *** *** 2 $83,030 N/A
25-1066 Psychology Teachers, Postsecondary *** *** *** *** *** *** 3 $75,640 N/A
25-1067 Sociology Teachers, Postsecondary *** *** *** *** *** *** 3 $67,680 N/A
25-1069 Social Sciences Teachers, Postsecondary, All Other *** *** *** *** *** *** 0 *** N/A
25-1071 Health Specialties Teachers, Postsecondary *** *** *** 54.4 *** *** 47 $135,690 Exceptional
25-1072 Nursing Instructors & Teachers, Postsecondary *** *** *** 54.0 *** *** 14 $67,050 Exceptional
25-1081 Education Teachers, Postsecondary *** *** *** 30.0 *** *** 11 $64,910 Exceptional
NEW MEXICOGrowth Annual Openings
AverageWage
Growth Outlook
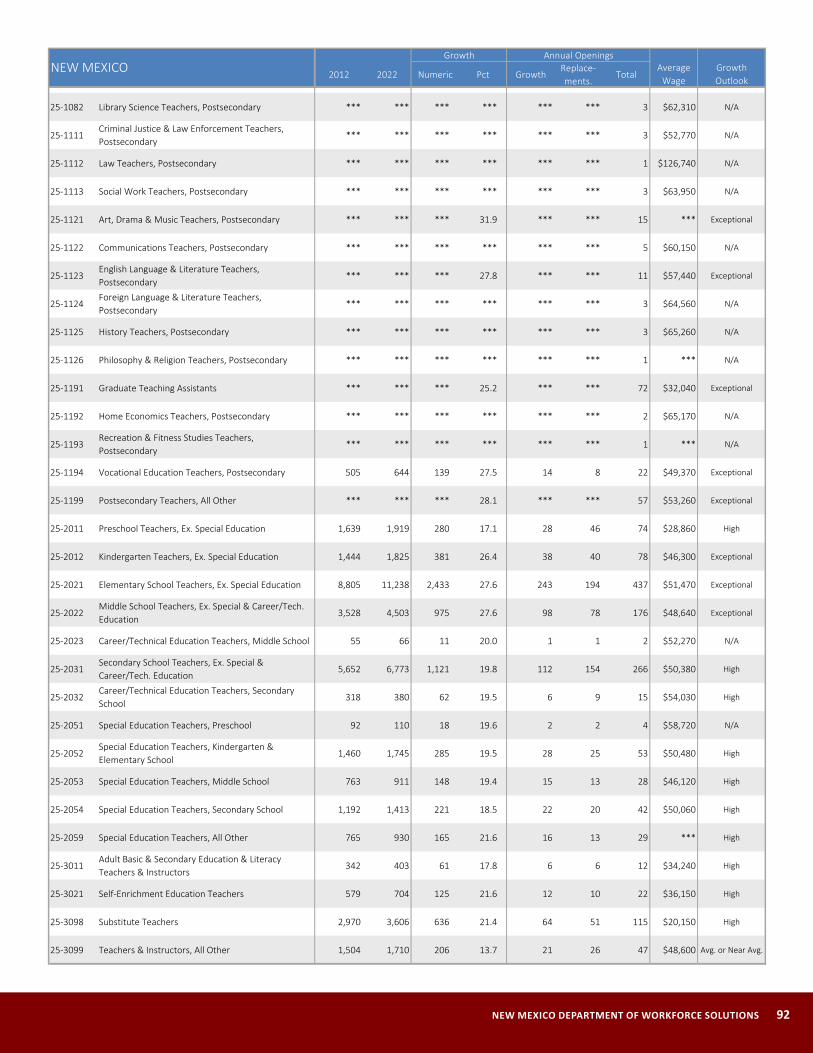
NEW MEXICO DEPARTMENT OF WORKFORCE SOLUTIONS 92
2012 2022 Numeric Pct GrowthReplace-ments.
Total
25-1082 Library Science Teachers, Postsecondary *** *** *** *** *** *** 3 $62,310 N/A
25-1111Criminal Justice & Law Enforcement Teachers, Postsecondary
*** *** *** *** *** *** 3 $52,770 N/A
25-1112 Law Teachers, Postsecondary *** *** *** *** *** *** 1 $126,740 N/A
25-1113 Social Work Teachers, Postsecondary *** *** *** *** *** *** 3 $63,950 N/A
25-1121 Art, Drama & Music Teachers, Postsecondary *** *** *** 31.9 *** *** 15 *** Exceptional
25-1122 Communications Teachers, Postsecondary *** *** *** *** *** *** 5 $60,150 N/A
25-1123English Language & Literature Teachers, Postsecondary
*** *** *** 27.8 *** *** 11 $57,440 Exceptional
25-1124Foreign Language & Literature Teachers, Postsecondary
*** *** *** *** *** *** 3 $64,560 N/A
25-1125 History Teachers, Postsecondary *** *** *** *** *** *** 3 $65,260 N/A
25-1126 Philosophy & Religion Teachers, Postsecondary *** *** *** *** *** *** 1 *** N/A
25-1191 Graduate Teaching Assistants *** *** *** 25.2 *** *** 72 $32,040 Exceptional
25-1192 Home Economics Teachers, Postsecondary *** *** *** *** *** *** 2 $65,170 N/A
25-1193Recreation & Fitness Studies Teachers, Postsecondary
*** *** *** *** *** *** 1 *** N/A
25-1194 Vocational Education Teachers, Postsecondary 505 644 139 27.5 14 8 22 $49,370 Exceptional
25-1199 Postsecondary Teachers, All Other *** *** *** 28.1 *** *** 57 $53,260 Exceptional
25-2011 Preschool Teachers, Ex. Special Education 1,639 1,919 280 17.1 28 46 74 $28,860 High
25-2012 Kindergarten Teachers, Ex. Special Education 1,444 1,825 381 26.4 38 40 78 $46,300 Exceptional
25-2021 Elementary School Teachers, Ex. Special Education 8,805 11,238 2,433 27.6 243 194 437 $51,470 Exceptional
25-2022Middle School Teachers, Ex. Special & Career/Tech. Education
3,528 4,503 975 27.6 98 78 176 $48,640 Exceptional
25-2023 Career/Technical Education Teachers, Middle School 55 66 11 20.0 1 1 2 $52,270 N/A
25-2031Secondary School Teachers, Ex. Special & Career/Tech. Education
5,652 6,773 1,121 19.8 112 154 266 $50,380 High
25-2032Career/Technical Education Teachers, Secondary School
318 380 62 19.5 6 9 15 $54,030 High
25-2051 Special Education Teachers, Preschool 92 110 18 19.6 2 2 4 $58,720 N/A
25-2052Special Education Teachers, Kindergarten & Elementary School
1,460 1,745 285 19.5 28 25 53 $50,480 High
25-2053 Special Education Teachers, Middle School 763 911 148 19.4 15 13 28 $46,120 High
25-2054 Special Education Teachers, Secondary School 1,192 1,413 221 18.5 22 20 42 $50,060 High
25-2059 Special Education Teachers, All Other 765 930 165 21.6 16 13 29 *** High
25-3011Adult Basic & Secondary Education & Literacy Teachers & Instructors
342 403 61 17.8 6 6 12 $34,240 High
25-3021 Self-Enrichment Education Teachers 579 704 125 21.6 12 10 22 $36,150 High
25-3098 Substitute Teachers 2,970 3,606 636 21.4 64 51 115 $20,150 High
25-3099 Teachers & Instructors, All Other 1,504 1,710 206 13.7 21 26 47 $48,600 Avg. or Near Avg.
NEW MEXICOGrowth Annual Openings
AverageWage
Growth Outlook
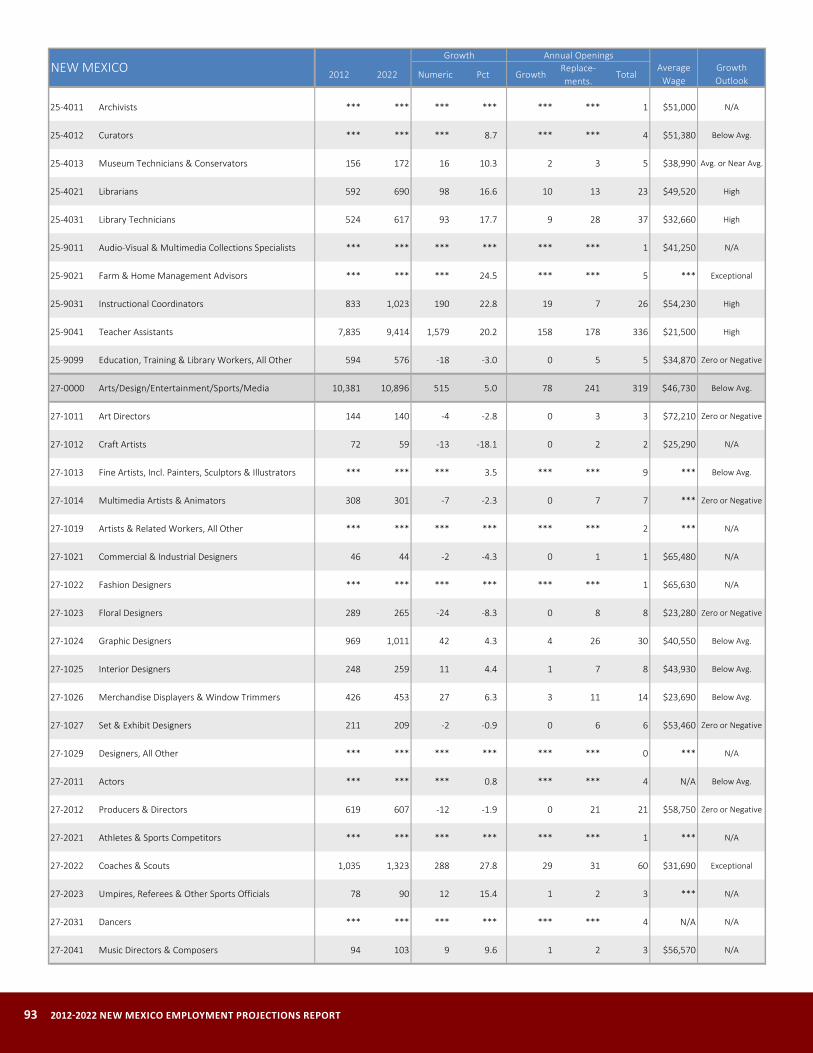
93 2012-2022 NEW MEXICO EMPLOYMENT PROJECTIONS REPORT
2012 2022 Numeric Pct GrowthReplace-ments.
Total
25-4011 Archivists *** *** *** *** *** *** 1 $51,000 N/A
25-4012 Curators *** *** *** 8.7 *** *** 4 $51,380 Below Avg.
25-4013 Museum Technicians & Conservators 156 172 16 10.3 2 3 5 $38,990 Avg. or Near Avg.
25-4021 Librarians 592 690 98 16.6 10 13 23 $49,520 High
25-4031 Library Technicians 524 617 93 17.7 9 28 37 $32,660 High
25-9011 Audio-Visual & Multimedia Collections Specialists *** *** *** *** *** *** 1 $41,250 N/A
25-9021 Farm & Home Management Advisors *** *** *** 24.5 *** *** 5 *** Exceptional
25-9031 Instructional Coordinators 833 1,023 190 22.8 19 7 26 $54,230 High
25-9041 Teacher Assistants 7,835 9,414 1,579 20.2 158 178 336 $21,500 High
25-9099 Education, Training & Library Workers, All Other 594 576 -18 -3.0 0 5 5 $34,870 Zero or Negative
27-0000 Arts/Design/Entertainment/Sports/Media 10,381 10,896 515 5.0 78 241 319 $46,730 Below Avg.
27-1011 Art Directors 144 140 -4 -2.8 0 3 3 $72,210 Zero or Negative
27-1012 Craft Artists 72 59 -13 -18.1 0 2 2 $25,290 N/A
27-1013 Fine Artists, Incl. Painters, Sculptors & Illustrators *** *** *** 3.5 *** *** 9 *** Below Avg.
27-1014 Multimedia Artists & Animators 308 301 -7 -2.3 0 7 7 *** Zero or Negative
27-1019 Artists & Related Workers, All Other *** *** *** *** *** *** 2 *** N/A
27-1021 Commercial & Industrial Designers 46 44 -2 -4.3 0 1 1 $65,480 N/A
27-1022 Fashion Designers *** *** *** *** *** *** 1 $65,630 N/A
27-1023 Floral Designers 289 265 -24 -8.3 0 8 8 $23,280 Zero or Negative
27-1024 Graphic Designers 969 1,011 42 4.3 4 26 30 $40,550 Below Avg.
27-1025 Interior Designers 248 259 11 4.4 1 7 8 $43,930 Below Avg.
27-1026 Merchandise Displayers & Window Trimmers 426 453 27 6.3 3 11 14 $23,690 Below Avg.
27-1027 Set & Exhibit Designers 211 209 -2 -0.9 0 6 6 $53,460 Zero or Negative
27-1029 Designers, All Other *** *** *** *** *** *** 0 *** N/A
27-2011 Actors *** *** *** 0.8 *** *** 4 N/A Below Avg.
27-2012 Producers & Directors 619 607 -12 -1.9 0 21 21 $58,750 Zero or Negative
27-2021 Athletes & Sports Competitors *** *** *** *** *** *** 1 *** N/A
27-2022 Coaches & Scouts 1,035 1,323 288 27.8 29 31 60 $31,690 Exceptional
27-2023 Umpires, Referees & Other Sports Officials 78 90 12 15.4 1 2 3 *** N/A
27-2031 Dancers *** *** *** *** *** *** 4 N/A N/A
27-2041 Music Directors & Composers 94 103 9 9.6 1 2 3 $56,570 N/A
NEW MEXICOGrowth Annual Openings
AverageWage
Growth Outlook
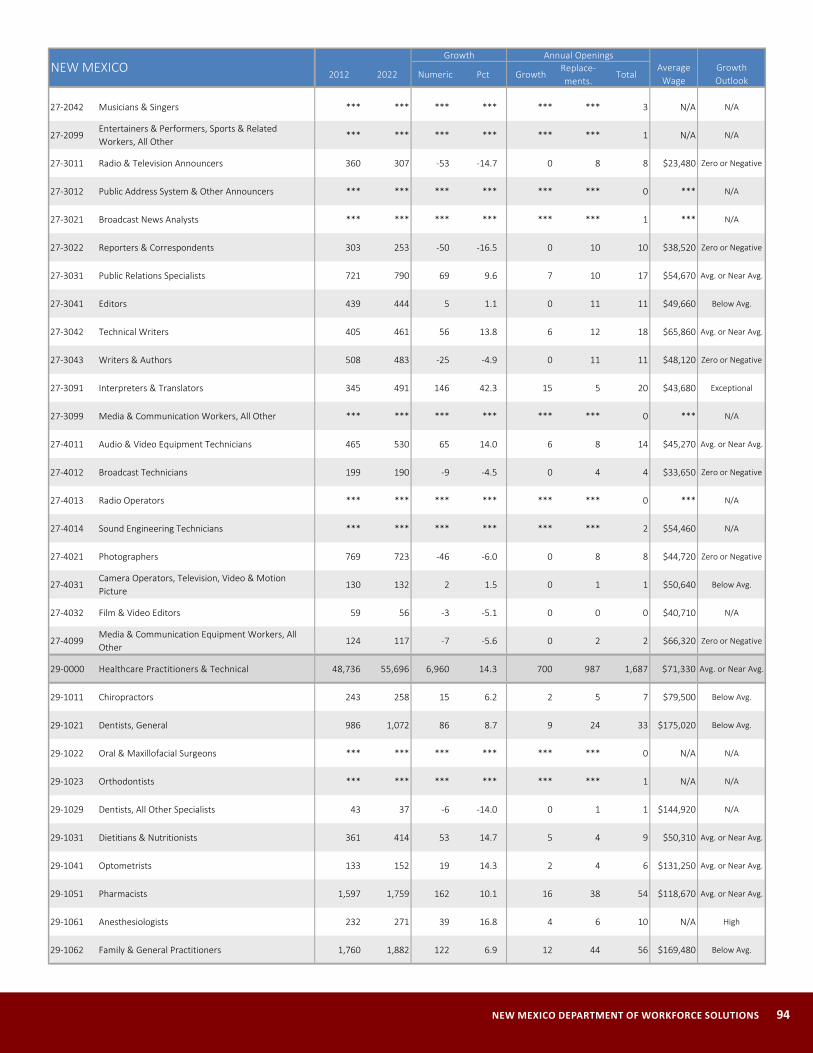
NEW MEXICO DEPARTMENT OF WORKFORCE SOLUTIONS 94
2012 2022 Numeric Pct GrowthReplace-ments.
Total
27-2042 Musicians & Singers *** *** *** *** *** *** 3 N/A N/A
27-2099Entertainers & Performers, Sports & Related Workers, All Other
*** *** *** *** *** *** 1 N/A N/A
27-3011 Radio & Television Announcers 360 307 -53 -14.7 0 8 8 $23,480 Zero or Negative
27-3012 Public Address System & Other Announcers *** *** *** *** *** *** 0 *** N/A
27-3021 Broadcast News Analysts *** *** *** *** *** *** 1 *** N/A
27-3022 Reporters & Correspondents 303 253 -50 -16.5 0 10 10 $38,520 Zero or Negative
27-3031 Public Relations Specialists 721 790 69 9.6 7 10 17 $54,670 Avg. or Near Avg.
27-3041 Editors 439 444 5 1.1 0 11 11 $49,660 Below Avg.
27-3042 Technical Writers 405 461 56 13.8 6 12 18 $65,860 Avg. or Near Avg.
27-3043 Writers & Authors 508 483 -25 -4.9 0 11 11 $48,120 Zero or Negative
27-3091 Interpreters & Translators 345 491 146 42.3 15 5 20 $43,680 Exceptional
27-3099 Media & Communication Workers, All Other *** *** *** *** *** *** 0 *** N/A
27-4011 Audio & Video Equipment Technicians 465 530 65 14.0 6 8 14 $45,270 Avg. or Near Avg.
27-4012 Broadcast Technicians 199 190 -9 -4.5 0 4 4 $33,650 Zero or Negative
27-4013 Radio Operators *** *** *** *** *** *** 0 *** N/A
27-4014 Sound Engineering Technicians *** *** *** *** *** *** 2 $54,460 N/A
27-4021 Photographers 769 723 -46 -6.0 0 8 8 $44,720 Zero or Negative
27-4031Camera Operators, Television, Video & Motion Picture
130 132 2 1.5 0 1 1 $50,640 Below Avg.
27-4032 Film & Video Editors 59 56 -3 -5.1 0 0 0 $40,710 N/A
27-4099Media & Communication Equipment Workers, All Other
124 117 -7 -5.6 0 2 2 $66,320 Zero or Negative
29-0000 Healthcare Practitioners & Technical 48,736 55,696 6,960 14.3 700 987 1,687 $71,330 Avg. or Near Avg.
29-1011 Chiropractors 243 258 15 6.2 2 5 7 $79,500 Below Avg.
29-1021 Dentists, General 986 1,072 86 8.7 9 24 33 $175,020 Below Avg.
29-1022 Oral & Maxillofacial Surgeons *** *** *** *** *** *** 0 N/A N/A
29-1023 Orthodontists *** *** *** *** *** *** 1 N/A N/A
29-1029 Dentists, All Other Specialists 43 37 -6 -14.0 0 1 1 $144,920 N/A
29-1031 Dietitians & Nutritionists 361 414 53 14.7 5 4 9 $50,310 Avg. or Near Avg.
29-1041 Optometrists 133 152 19 14.3 2 4 6 $131,250 Avg. or Near Avg.
29-1051 Pharmacists 1,597 1,759 162 10.1 16 38 54 $118,670 Avg. or Near Avg.
29-1061 Anesthesiologists 232 271 39 16.8 4 6 10 N/A High
29-1062 Family & General Practitioners 1,760 1,882 122 6.9 12 44 56 $169,480 Below Avg.
NEW MEXICOGrowth Annual Openings
AverageWage
Growth Outlook

95 2012-2022 NEW MEXICO EMPLOYMENT PROJECTIONS REPORT
2012 2022 Numeric Pct GrowthReplace-ments.
Total
29-1063 Internists, General 371 358 -13 -3.5 0 9 9 $176,730 Zero or Negative
29-1064 Obstetricians & Gynecologists 76 78 2 2.6 0 2 2 $192,770 N/A
29-1065 Pediatricians, General 217 230 13 6.0 1 5 6 $185,140 Below Avg.
29-1066 Psychiatrists 162 190 28 17.3 3 4 7 $124,000 High
29-1067 Surgeons 192 208 16 8.3 2 5 7 N/A Below Avg.
29-1069 Physicians & Surgeons, All Other 974 1,006 32 3.3 3 24 27 $213,830 Below Avg.
29-1071 Physician Assistants 554 706 152 27.4 15 10 25 $92,810 Exceptional
29-1081 Podiatrists 86 95 9 10.5 1 2 3 $116,350 N/A
29-1122 Occupational Therapists 779 994 215 27.6 22 11 33 $73,170 Exceptional
29-1123 Physical Therapists 1,129 1,447 318 28.2 32 28 60 $84,710 Exceptional
29-1124 Radiation Therapists 87 99 12 13.8 1 2 3 $80,810 N/A
29-1125 Recreational Therapists 113 120 7 6.2 1 2 3 $38,030 Below Avg.
29-1126 Respiratory Therapists 717 840 123 17.2 12 10 22 $53,360 High
29-1127 Speech-Language Pathologists 1,058 1,305 247 23.3 25 16 41 $73,200 High
29-1128 Exercise Physiologists *** *** *** *** *** *** 0 *** N/A
29-1129 Therapists, All Other *** *** *** *** *** *** 0 $62,970 N/A
29-1131 Veterinarians 490 494 4 0.8 0 16 16 $76,360 Below Avg.
29-1141 Registered Nurses 16,138 18,371 2,233 13.8 223 313 536 $64,900 Avg. or Near Avg.
29-1151 Nurse Anesthetists 45 50 5 11.1 0 1 1 $120,640 N/A
29-1161 Nurse Midwives 63 77 14 22.2 1 1 2 $95,660 N/A
29-1171 Nurse Practitioners 594 748 154 25.9 15 12 27 $100,500 Exceptional
29-1181 Audiologists 221 260 39 17.6 4 5 9 $80,040 High
29-1199 Health Diagnosing & Treating Practitioners, All Other *** *** *** 11.7 *** *** 9 $64,000 Avg. or Near Avg.
29-2011 Medical & Clinical Laboratory Technologists 1,103 1,259 156 14.1 16 29 45 $48,340 Avg. or Near Avg.
29-2012 Medical & Clinical Laboratory Technicians 1,477 1,862 385 26.1 38 39 77 $36,740 Exceptional
29-2021 Dental Hygienists 966 1,192 226 23.4 23 25 48 $70,600 High
29-2031 Cardiovascular Technologists & Technicians 237 293 56 23.6 6 3 9 $63,570 High
29-2032 Diagnostic Medical Sonographers 305 426 121 39.7 12 4 16 $66,170 Exceptional
29-2033 Nuclear Medicine Technologists 115 131 16 13.9 2 2 4 $74,050 Avg. or Near Avg.
29-2034 Radiologic Technologists & Technicians 1,174 1,329 155 13.2 16 16 32 $56,940 Avg. or Near Avg.
29-2035 Magnetic Resonance Imaging Technologists 71 84 13 18.3 1 1 2 $64,430 N/A
NEW MEXICOGrowth Annual Openings
AverageWage
Growth Outlook
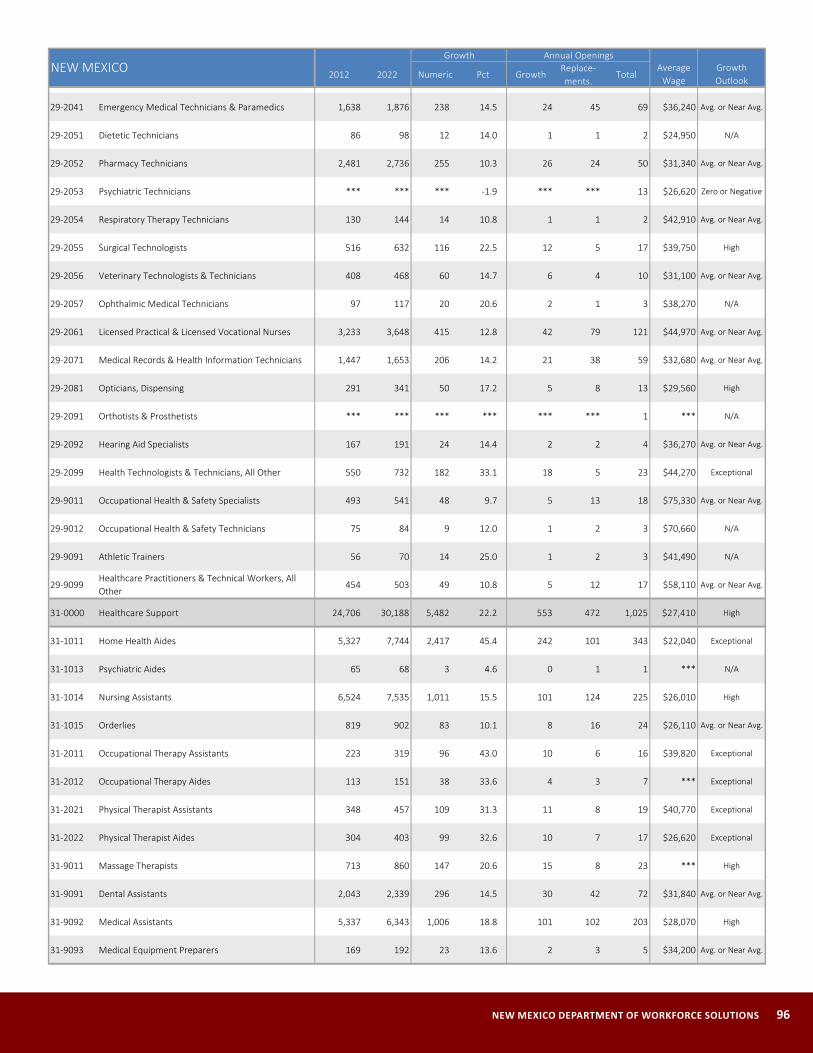
NEW MEXICO DEPARTMENT OF WORKFORCE SOLUTIONS 96
2012 2022 Numeric Pct GrowthReplace-ments.
Total
29-2041 Emergency Medical Technicians & Paramedics 1,638 1,876 238 14.5 24 45 69 $36,240 Avg. or Near Avg.
29-2051 Dietetic Technicians 86 98 12 14.0 1 1 2 $24,950 N/A
29-2052 Pharmacy Technicians 2,481 2,736 255 10.3 26 24 50 $31,340 Avg. or Near Avg.
29-2053 Psychiatric Technicians *** *** *** -1.9 *** *** 13 $26,620 Zero or Negative
29-2054 Respiratory Therapy Technicians 130 144 14 10.8 1 1 2 $42,910 Avg. or Near Avg.
29-2055 Surgical Technologists 516 632 116 22.5 12 5 17 $39,750 High
29-2056 Veterinary Technologists & Technicians 408 468 60 14.7 6 4 10 $31,100 Avg. or Near Avg.
29-2057 Ophthalmic Medical Technicians 97 117 20 20.6 2 1 3 $38,270 N/A
29-2061 Licensed Practical & Licensed Vocational Nurses 3,233 3,648 415 12.8 42 79 121 $44,970 Avg. or Near Avg.
29-2071 Medical Records & Health Information Technicians 1,447 1,653 206 14.2 21 38 59 $32,680 Avg. or Near Avg.
29-2081 Opticians, Dispensing 291 341 50 17.2 5 8 13 $29,560 High
29-2091 Orthotists & Prosthetists *** *** *** *** *** *** 1 *** N/A
29-2092 Hearing Aid Specialists 167 191 24 14.4 2 2 4 $36,270 Avg. or Near Avg.
29-2099 Health Technologists & Technicians, All Other 550 732 182 33.1 18 5 23 $44,270 Exceptional
29-9011 Occupational Health & Safety Specialists 493 541 48 9.7 5 13 18 $75,330 Avg. or Near Avg.
29-9012 Occupational Health & Safety Technicians 75 84 9 12.0 1 2 3 $70,660 N/A
29-9091 Athletic Trainers 56 70 14 25.0 1 2 3 $41,490 N/A
29-9099Healthcare Practitioners & Technical Workers, All Other
454 503 49 10.8 5 12 17 $58,110 Avg. or Near Avg.
31-0000 Healthcare Support 24,706 30,188 5,482 22.2 553 472 1,025 $27,410 High
31-1011 Home Health Aides 5,327 7,744 2,417 45.4 242 101 343 $22,040 Exceptional
31-1013 Psychiatric Aides 65 68 3 4.6 0 1 1 *** N/A
31-1014 Nursing Assistants 6,524 7,535 1,011 15.5 101 124 225 $26,010 High
31-1015 Orderlies 819 902 83 10.1 8 16 24 $26,110 Avg. or Near Avg.
31-2011 Occupational Therapy Assistants 223 319 96 43.0 10 6 16 $39,820 Exceptional
31-2012 Occupational Therapy Aides 113 151 38 33.6 4 3 7 *** Exceptional
31-2021 Physical Therapist Assistants 348 457 109 31.3 11 8 19 $40,770 Exceptional
31-2022 Physical Therapist Aides 304 403 99 32.6 10 7 17 $26,620 Exceptional
31-9011 Massage Therapists 713 860 147 20.6 15 8 23 *** High
31-9091 Dental Assistants 2,043 2,339 296 14.5 30 42 72 $31,840 Avg. or Near Avg.
31-9092 Medical Assistants 5,337 6,343 1,006 18.8 101 102 203 $28,070 High
31-9093 Medical Equipment Preparers 169 192 23 13.6 2 3 5 $34,200 Avg. or Near Avg.
NEW MEXICOGrowth Annual Openings
AverageWage
Growth Outlook
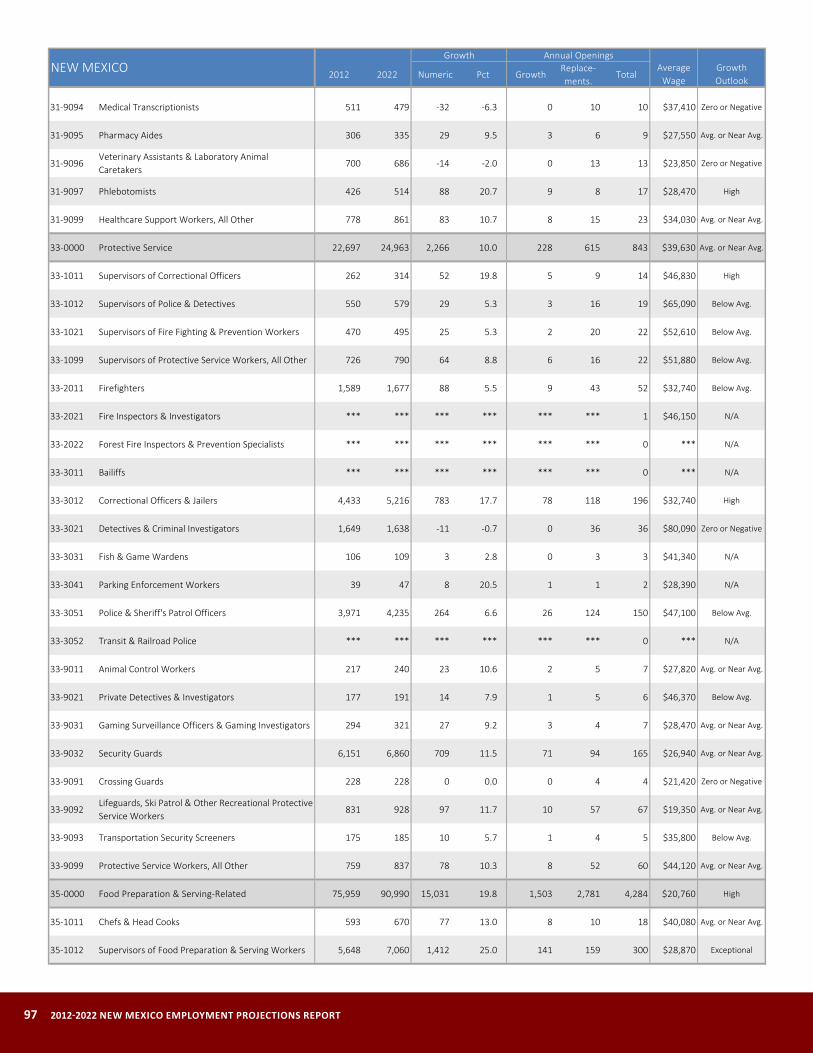
97 2012-2022 NEW MEXICO EMPLOYMENT PROJECTIONS REPORT
2012 2022 Numeric Pct GrowthReplace-ments.
Total
31-9094 Medical Transcriptionists 511 479 -32 -6.3 0 10 10 $37,410 Zero or Negative
31-9095 Pharmacy Aides 306 335 29 9.5 3 6 9 $27,550 Avg. or Near Avg.
31-9096Veterinary Assistants & Laboratory Animal Caretakers
700 686 -14 -2.0 0 13 13 $23,850 Zero or Negative
31-9097 Phlebotomists 426 514 88 20.7 9 8 17 $28,470 High
31-9099 Healthcare Support Workers, All Other 778 861 83 10.7 8 15 23 $34,030 Avg. or Near Avg.
33-0000 Protective Service 22,697 24,963 2,266 10.0 228 615 843 $39,630 Avg. or Near Avg.
33-1011 Supervisors of Correctional Officers 262 314 52 19.8 5 9 14 $46,830 High
33-1012 Supervisors of Police & Detectives 550 579 29 5.3 3 16 19 $65,090 Below Avg.
33-1021 Supervisors of Fire Fighting & Prevention Workers 470 495 25 5.3 2 20 22 $52,610 Below Avg.
33-1099 Supervisors of Protective Service Workers, All Other 726 790 64 8.8 6 16 22 $51,880 Below Avg.
33-2011 Firefighters 1,589 1,677 88 5.5 9 43 52 $32,740 Below Avg.
33-2021 Fire Inspectors & Investigators *** *** *** *** *** *** 1 $46,150 N/A
33-2022 Forest Fire Inspectors & Prevention Specialists *** *** *** *** *** *** 0 *** N/A
33-3011 Bailiffs *** *** *** *** *** *** 0 *** N/A
33-3012 Correctional Officers & Jailers 4,433 5,216 783 17.7 78 118 196 $32,740 High
33-3021 Detectives & Criminal Investigators 1,649 1,638 -11 -0.7 0 36 36 $80,090 Zero or Negative
33-3031 Fish & Game Wardens 106 109 3 2.8 0 3 3 $41,340 N/A
33-3041 Parking Enforcement Workers 39 47 8 20.5 1 1 2 $28,390 N/A
33-3051 Police & Sheriff's Patrol Officers 3,971 4,235 264 6.6 26 124 150 $47,100 Below Avg.
33-3052 Transit & Railroad Police *** *** *** *** *** *** 0 *** N/A
33-9011 Animal Control Workers 217 240 23 10.6 2 5 7 $27,820 Avg. or Near Avg.
33-9021 Private Detectives & Investigators 177 191 14 7.9 1 5 6 $46,370 Below Avg.
33-9031 Gaming Surveillance Officers & Gaming Investigators 294 321 27 9.2 3 4 7 $28,470 Avg. or Near Avg.
33-9032 Security Guards 6,151 6,860 709 11.5 71 94 165 $26,940 Avg. or Near Avg.
33-9091 Crossing Guards 228 228 0 0.0 0 4 4 $21,420 Zero or Negative
33-9092Lifeguards, Ski Patrol & Other Recreational Protective Service Workers
831 928 97 11.7 10 57 67 $19,350 Avg. or Near Avg.
33-9093 Transportation Security Screeners 175 185 10 5.7 1 4 5 $35,800 Below Avg.
33-9099 Protective Service Workers, All Other 759 837 78 10.3 8 52 60 $44,120 Avg. or Near Avg.
35-0000 Food Preparation & Serving-Related 75,959 90,990 15,031 19.8 1,503 2,781 4,284 $20,760 High
35-1011 Chefs & Head Cooks 593 670 77 13.0 8 10 18 $40,080 Avg. or Near Avg.
35-1012 Supervisors of Food Preparation & Serving Workers 5,648 7,060 1,412 25.0 141 159 300 $28,870 Exceptional
NEW MEXICOGrowth Annual Openings
AverageWage
Growth Outlook
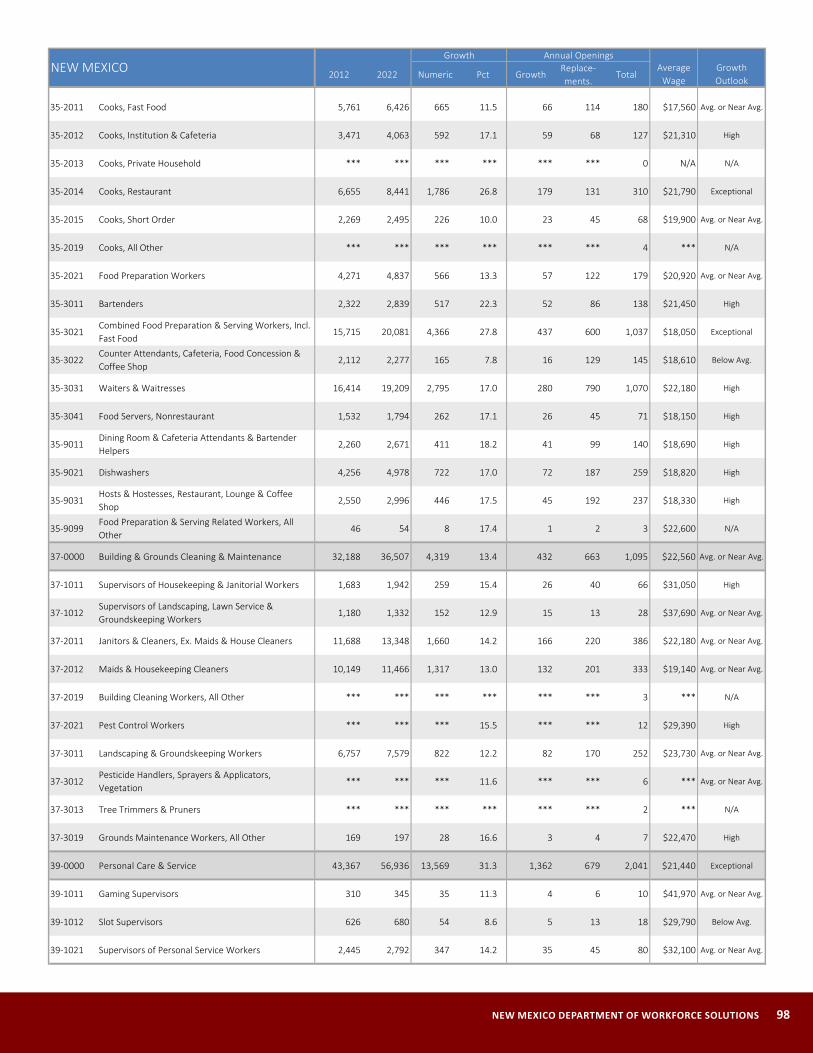
NEW MEXICO DEPARTMENT OF WORKFORCE SOLUTIONS 98
2012 2022 Numeric Pct GrowthReplace-ments.
Total
35-2011 Cooks, Fast Food 5,761 6,426 665 11.5 66 114 180 $17,560 Avg. or Near Avg.
35-2012 Cooks, Institution & Cafeteria 3,471 4,063 592 17.1 59 68 127 $21,310 High
35-2013 Cooks, Private Household *** *** *** *** *** *** 0 N/A N/A
35-2014 Cooks, Restaurant 6,655 8,441 1,786 26.8 179 131 310 $21,790 Exceptional
35-2015 Cooks, Short Order 2,269 2,495 226 10.0 23 45 68 $19,900 Avg. or Near Avg.
35-2019 Cooks, All Other *** *** *** *** *** *** 4 *** N/A
35-2021 Food Preparation Workers 4,271 4,837 566 13.3 57 122 179 $20,920 Avg. or Near Avg.
35-3011 Bartenders 2,322 2,839 517 22.3 52 86 138 $21,450 High
35-3021Combined Food Preparation & Serving Workers, Incl. Fast Food
15,715 20,081 4,366 27.8 437 600 1,037 $18,050 Exceptional
35-3022Counter Attendants, Cafeteria, Food Concession & Coffee Shop
2,112 2,277 165 7.8 16 129 145 $18,610 Below Avg.
35-3031 Waiters & Waitresses 16,414 19,209 2,795 17.0 280 790 1,070 $22,180 High
35-3041 Food Servers, Nonrestaurant 1,532 1,794 262 17.1 26 45 71 $18,150 High
35-9011Dining Room & Cafeteria Attendants & Bartender Helpers
2,260 2,671 411 18.2 41 99 140 $18,690 High
35-9021 Dishwashers 4,256 4,978 722 17.0 72 187 259 $18,820 High
35-9031Hosts & Hostesses, Restaurant, Lounge & Coffee Shop
2,550 2,996 446 17.5 45 192 237 $18,330 High
35-9099Food Preparation & Serving Related Workers, All Other
46 54 8 17.4 1 2 3 $22,600 N/A
37-0000 Building & Grounds Cleaning & Maintenance 32,188 36,507 4,319 13.4 432 663 1,095 $22,560 Avg. or Near Avg.
37-1011 Supervisors of Housekeeping & Janitorial Workers 1,683 1,942 259 15.4 26 40 66 $31,050 High
37-1012Supervisors of Landscaping, Lawn Service & Groundskeeping Workers
1,180 1,332 152 12.9 15 13 28 $37,690 Avg. or Near Avg.
37-2011 Janitors & Cleaners, Ex. Maids & House Cleaners 11,688 13,348 1,660 14.2 166 220 386 $22,180 Avg. or Near Avg.
37-2012 Maids & Housekeeping Cleaners 10,149 11,466 1,317 13.0 132 201 333 $19,140 Avg. or Near Avg.
37-2019 Building Cleaning Workers, All Other *** *** *** *** *** *** 3 *** N/A
37-2021 Pest Control Workers *** *** *** 15.5 *** *** 12 $29,390 High
37-3011 Landscaping & Groundskeeping Workers 6,757 7,579 822 12.2 82 170 252 $23,730 Avg. or Near Avg.
37-3012Pesticide Handlers, Sprayers & Applicators, Vegetation
*** *** *** 11.6 *** *** 6 *** Avg. or Near Avg.
37-3013 Tree Trimmers & Pruners *** *** *** *** *** *** 2 *** N/A
37-3019 Grounds Maintenance Workers, All Other 169 197 28 16.6 3 4 7 $22,470 High
39-0000 Personal Care & Service 43,367 56,936 13,569 31.3 1,362 679 2,041 $21,440 Exceptional
39-1011 Gaming Supervisors 310 345 35 11.3 4 6 10 $41,970 Avg. or Near Avg.
39-1012 Slot Supervisors 626 680 54 8.6 5 13 18 $29,790 Below Avg.
39-1021 Supervisors of Personal Service Workers 2,445 2,792 347 14.2 35 45 80 $32,100 Avg. or Near Avg.
NEW MEXICOGrowth Annual Openings
AverageWage
Growth Outlook

99 2012-2022 NEW MEXICO EMPLOYMENT PROJECTIONS REPORT
2012 2022 Numeric Pct GrowthReplace-ments.
Total
39-2011 Animal Trainers *** *** *** 3.5 *** *** 16 $41,530 Below Avg.
39-2021 Nonfarm Animal Caretakers *** *** *** 11.1 *** *** 30 $22,530 Avg. or Near Avg.
39-3011 Gaming Dealers 486 537 51 10.5 5 8 13 $18,140 Avg. or Near Avg.
39-3012 Gaming & Sports Book Writers & Runners *** *** *** *** *** *** 2 $19,070 N/A
39-3019 Gaming Service Workers, All Other *** *** *** *** *** *** 0 $22,300 N/A
39-3021 Motion Picture Projectionists 97 69 -28 -28.9 0 4 4 *** N/A
39-3031 Ushers, Lobby Attendants & Ticket Takers 206 201 -5 -2.4 0 11 11 $19,210 Zero or Negative
39-3091 Amusement & Recreation Attendants 865 1,018 153 17.7 15 43 58 $19,590 High
39-3092 Costume Attendants 81 81 0 0.0 0 4 4 *** N/A
39-3093Locker Room, Coatroom & Dressing Room Attendants
*** *** *** *** *** *** 1 *** N/A
39-3099Entertainment Attendants & Related Workers, All Other
68 81 13 19.1 1 3 4 $23,250 N/A
39-4011 Embalmers *** *** *** *** *** *** 0 *** N/A
39-4021 Funeral Attendants 219 214 -5 -2.3 0 5 5 $26,650 Zero or Negative
39-4031 Morticians, Undertakers & Funeral Directors *** *** *** *** *** *** 3 $46,640 N/A
39-5011 Barbers *** *** *** 7.6 *** *** 31 *** Below Avg.
39-5012 Hairdressers, Hairstylists & Cosmetologists 2,136 2,322 186 8.7 19 50 69 $26,570 Below Avg.
39-5091 Makeup Artists, Theatrical & Performance *** *** *** *** *** *** 1 *** N/A
39-5092 Manicurists & Pedicurists *** *** *** 11.4 *** *** 5 *** Avg. or Near Avg.
39-5093 Shampooers *** *** *** *** *** *** 0 *** N/A
39-5094 Skincare Specialists *** *** *** 33.2 *** *** 8 *** Exceptional
39-6011 Baggage Porters & Bellhops 225 251 26 11.6 3 6 9 $21,350 Avg. or Near Avg.
39-6012 Concierges 141 179 38 27.0 4 4 8 $27,560 Exceptional
39-7011 Tour Guides & Escorts *** *** *** 8.4 *** *** 19 $28,430 Below Avg.
39-7012 Travel Guides *** *** *** *** *** *** 1 *** N/A
39-9011 Childcare Workers 5,362 6,257 895 16.7 90 158 248 $18,980 High
39-9021 Personal Care Aides 20,500 30,952 10,452 51.0 1,045 147 1,192 $18,740 Exceptional
39-9031 Fitness Trainers & Aerobics Instructors 2,383 2,876 493 20.7 49 28 77 $32,240 High
39-9032 Recreation Workers 2,413 2,769 356 14.8 36 28 64 $23,060 Avg. or Near Avg.
39-9041 Residential Advisors 309 378 69 22.3 7 13 20 $23,820 High
39-9099 Personal Care & Service Workers, All Other 785 867 82 10.4 8 22 30 $21,110 Avg. or Near Avg.
41-0000 Sales & Related 79,915 87,959 8,044 10.1 816 2,545 3,361 $30,130 Avg. or Near Avg.
NEW MEXICOGrowth Annual Openings
AverageWage
Growth Outlook
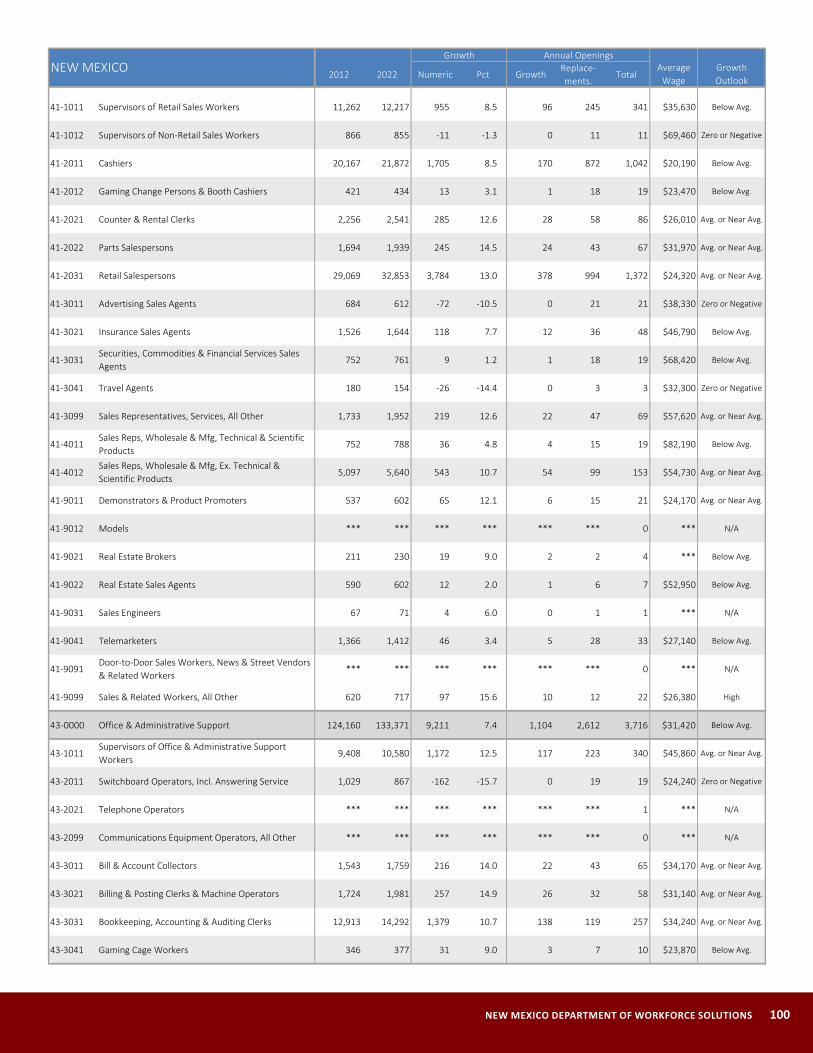
NEW MEXICO DEPARTMENT OF WORKFORCE SOLUTIONS 100
2012 2022 Numeric Pct GrowthReplace-ments.
Total
41-1011 Supervisors of Retail Sales Workers 11,262 12,217 955 8.5 96 245 341 $35,630 Below Avg.
41-1012 Supervisors of Non-Retail Sales Workers 866 855 -11 -1.3 0 11 11 $69,460 Zero or Negative
41-2011 Cashiers 20,167 21,872 1,705 8.5 170 872 1,042 $20,190 Below Avg.
41-2012 Gaming Change Persons & Booth Cashiers 421 434 13 3.1 1 18 19 $23,470 Below Avg.
41-2021 Counter & Rental Clerks 2,256 2,541 285 12.6 28 58 86 $26,010 Avg. or Near Avg.
41-2022 Parts Salespersons 1,694 1,939 245 14.5 24 43 67 $31,970 Avg. or Near Avg.
41-2031 Retail Salespersons 29,069 32,853 3,784 13.0 378 994 1,372 $24,320 Avg. or Near Avg.
41-3011 Advertising Sales Agents 684 612 -72 -10.5 0 21 21 $38,330 Zero or Negative
41-3021 Insurance Sales Agents 1,526 1,644 118 7.7 12 36 48 $46,790 Below Avg.
41-3031Securities, Commodities & Financial Services Sales Agents
752 761 9 1.2 1 18 19 $68,420 Below Avg.
41-3041 Travel Agents 180 154 -26 -14.4 0 3 3 $32,300 Zero or Negative
41-3099 Sales Representatives, Services, All Other 1,733 1,952 219 12.6 22 47 69 $57,620 Avg. or Near Avg.
41-4011Sales Reps, Wholesale & Mfg, Technical & Scientific Products
752 788 36 4.8 4 15 19 $82,190 Below Avg.
41-4012Sales Reps, Wholesale & Mfg, Ex. Technical & Scientific Products
5,097 5,640 543 10.7 54 99 153 $54,730 Avg. or Near Avg.
41-9011 Demonstrators & Product Promoters 537 602 65 12.1 6 15 21 $24,170 Avg. or Near Avg.
41-9012 Models *** *** *** *** *** *** 0 *** N/A
41-9021 Real Estate Brokers 211 230 19 9.0 2 2 4 *** Below Avg.
41-9022 Real Estate Sales Agents 590 602 12 2.0 1 6 7 $52,950 Below Avg.
41-9031 Sales Engineers 67 71 4 6.0 0 1 1 *** N/A
41-9041 Telemarketers 1,366 1,412 46 3.4 5 28 33 $27,140 Below Avg.
41-9091Door-to-Door Sales Workers, News & Street Vendors & Related Workers
*** *** *** *** *** *** 0 *** N/A
41-9099 Sales & Related Workers, All Other 620 717 97 15.6 10 12 22 $26,380 High
43-0000 Office & Administrative Support 124,160 133,371 9,211 7.4 1,104 2,612 3,716 $31,420 Below Avg.
43-1011Supervisors of Office & Administrative Support Workers
9,408 10,580 1,172 12.5 117 223 340 $45,860 Avg. or Near Avg.
43-2011 Switchboard Operators, Incl. Answering Service 1,029 867 -162 -15.7 0 19 19 $24,240 Zero or Negative
43-2021 Telephone Operators *** *** *** *** *** *** 1 *** N/A
43-2099 Communications Equipment Operators, All Other *** *** *** *** *** *** 0 *** N/A
43-3011 Bill & Account Collectors 1,543 1,759 216 14.0 22 43 65 $34,170 Avg. or Near Avg.
43-3021 Billing & Posting Clerks & Machine Operators 1,724 1,981 257 14.9 26 32 58 $31,140 Avg. or Near Avg.
43-3031 Bookkeeping, Accounting & Auditing Clerks 12,913 14,292 1,379 10.7 138 119 257 $34,240 Avg. or Near Avg.
43-3041 Gaming Cage Workers 346 377 31 9.0 3 7 10 $23,870 Below Avg.
NEW MEXICOGrowth Annual Openings
AverageWage
Growth Outlook

101 2012-2022 NEW MEXICO EMPLOYMENT PROJECTIONS REPORT
2012 2022 Numeric Pct GrowthReplace-ments.
Total
43-3051 Payroll & Timekeeping Clerks 897 1,009 112 12.5 11 20 31 $33,400 Avg. or Near Avg.
43-3061 Procurement Clerks 367 383 16 4.4 2 13 15 $36,520 Below Avg.
43-3071 Tellers 2,992 3,034 42 1.4 4 140 144 $24,520 Below Avg.
43-3099 Financial Clerks, All Other 76 82 6 7.9 1 2 3 $31,700 N/A
43-4011 Brokerage Clerks 142 129 -13 -9.2 0 4 4 $36,550 Zero or Negative
43-4021 Correspondence Clerks *** *** *** *** *** *** 0 *** N/A
43-4031 Court, Municipal & License Clerks 665 724 59 8.9 6 10 16 $31,440 Below Avg.
43-4041 Credit Authorizers, Checkers & Clerks *** *** *** *** *** *** 1 $28,030 N/A
43-4051 Customer Service Reps 13,540 15,356 1,816 13.4 182 368 550 $29,610 Avg. or Near Avg.
43-4061 Eligibility Interviewers, Government Programs 974 1,059 85 8.7 8 20 28 $41,380 Below Avg.
43-4071 File Clerks 659 618 -41 -6.2 0 15 15 $26,160 Zero or Negative
43-4081 Hotel, Motel & Resort Desk Clerks 2,970 3,452 482 16.2 48 141 189 $19,760 High
43-4111 Interviewers, Ex. Eligibility & Loan 552 574 22 4.0 2 10 12 $30,260 Below Avg.
43-4121 Library Assistants, Clerical 415 499 84 20.2 8 18 26 $23,180 High
43-4131 Loan Interviewers & Clerks 1,433 1,547 114 8.0 11 10 21 $28,380 Below Avg.
43-4141 New Accounts Clerks 558 527 -31 -5.6 0 14 14 $31,190 Zero or Negative
43-4151 Order Clerks 321 311 -10 -3.1 0 8 8 $27,870 Zero or Negative
43-4161Human Resources Assistants, Ex. Payroll & Timekeeping
996 965 -31 -3.1 0 25 25 $35,560 Zero or Negative
43-4171 Receptionists & Information Clerks 6,992 7,646 654 9.4 65 188 253 $24,830 Avg. or Near Avg.
43-4181Reservation & Transportation Ticket Agents & Travel Clerks
450 418 -32 -7.1 0 6 6 $36,610 Zero or Negative
43-4199 Information & Record Clerks, All Other 965 807 -158 -16.4 0 21 21 $37,880 Zero or Negative
43-5011 Cargo & Freight Agents 188 192 4 2.1 0 5 5 $34,350 Below Avg.
43-5021 Couriers & Messengers 566 493 -73 -12.9 0 7 7 $23,650 Zero or Negative
43-5031 Police, Fire & Ambulance Dispatchers 756 814 58 7.7 6 22 28 $33,010 Below Avg.
43-5032 Dispatchers, Ex. Police, Fire & Ambulance 657 722 65 9.9 6 19 25 $37,470 Avg. or Near Avg.
43-5041 Meter Readers, Utilities 372 314 -58 -15.6 0 9 9 $32,800 Zero or Negative
43-5051 Postal Service Clerks 453 351 -102 -22.5 0 7 7 $46,010 Zero or Negative
43-5052 Postal Service Mail Carriers 1,427 1,182 -245 -17.2 0 50 50 $50,790 Zero or Negative
43-5053Postal Service Mail Sorters, Processors & Processing Machine Operators
701 558 -143 -20.4 0 5 5 $43,610 Zero or Negative
43-5061 Production, Planning & Expediting Clerks 959 1,021 62 6.5 6 24 30 $53,360 Below Avg.
43-5071 Shipping, Receiving & Traffic Clerks 2,253 2,328 75 3.3 8 59 67 $27,890 Below Avg.
NEW MEXICOGrowth Annual Openings
AverageWage
Growth Outlook

NEW MEXICO DEPARTMENT OF WORKFORCE SOLUTIONS 102
2012 2022 Numeric Pct GrowthReplace-ments.
Total
43-5081 Stock Clerks & Order Fillers 8,809 9,053 244 2.8 24 266 290 $24,540 Below Avg.
43-5111Weighers, Measurers, Checkers & Samplers, Recordkeeping
239 262 23 9.6 2 5 7 $25,880 Avg. or Near Avg.
43-6011Executive Secretaries & Executive Administrative Assistants
3,788 3,650 -138 -3.6 0 46 46 $50,050 Zero or Negative
43-6012 Legal Secretaries 1,313 1,185 -128 -9.7 0 16 16 $34,850 Zero or Negative
43-6013 Medical Secretaries 3,024 3,758 734 24.3 73 36 109 $29,730 Exceptional
43-6014Secretaries & Administrative Assistants, Ex. Legal, Medical & Exec.
20,753 23,383 2,630 12.7 263 250 513 $28,900 Avg. or Near Avg.
43-9011 Computer Operators 390 339 -51 -13.1 0 4 4 $34,400 Zero or Negative
43-9021 Data Entry Keyers 924 694 -230 -24.9 0 11 11 $27,940 Zero or Negative
43-9022 Word Processors & Typists 351 245 -106 -30.2 0 1 1 $32,900 Zero or Negative
43-9031 Desktop Publishers *** *** *** *** *** *** 1 *** N/A
43-9041 Insurance Claims & Policy Processing Clerks 740 796 56 7.6 6 20 26 $34,150 Below Avg.
43-9051Mail Clerks & Mail Machine Operators, Ex. Postal Service
300 272 -28 -9.3 0 7 7 $29,250 Zero or Negative
43-9061 Office Clerks, General 10,527 10,988 461 4.4 46 221 267 $24,990 Below Avg.
43-9071 Office Machine Operators, Ex. Computer 376 343 -33 -8.8 0 9 9 $32,620 Zero or Negative
43-9081 Proofreaders & Copy Markers 45 35 -10 -22.2 0 1 1 $32,270 N/A
43-9111 Statistical Assistants *** *** *** *** *** *** 1 *** N/A
43-9199 Office & Administrative Support Workers, All Other 1,154 1,235 81 7.0 8 32 40 $37,400 Below Avg.
45-0000 Farming, Fishing & Forestry 7,445 7,047 -398 -5.3 4 216 220 $22,220 Zero or Negative
45-1011 Supervisors of Farming, Fishing & Forestry Workers 366 356 -10 -2.7 0 8 8 $35,540 Zero or Negative
45-2011 Agricultural Inspectors 195 208 13 6.7 1 6 7 $38,000 Below Avg.
45-2021 Animal Breeders *** *** *** *** *** *** 0 N/A N/A
45-2041 Graders & Sorters, Agricultural Products 316 297 -19 -6.0 0 6 6 $18,850 Zero or Negative
45-2091 Agricultural Equipment Operators 439 438 -1 -0.2 0 13 13 $20,020 Zero or Negative
45-2092Farmworkers & Laborers, Crop, Nursery & Greenhouse
4,941 4,540 -401 -8.1 0 150 150 $19,100 Zero or Negative
45-2093 Farmworkers, Farm, Ranch & Aquacultural Animals 936 955 19 2.0 2 28 30 $29,000 Below Avg.
45-2099 Agricultural Workers, All Other *** *** *** *** *** *** 3 *** N/A
45-4011 Forest & Conservation Workers 98 101 3 3.1 0 2 2 *** N/A
45-4021 Fallers 7 3 -4 -57.1 0 0 0 *** N/A
45-4022 Logging Equipment Operators *** *** *** *** *** *** 0 N/A N/A
45-4023 Log Graders & Scalers 0 0 0 0.0 0 0 0 N/A N/A
45-4029 Logging Workers, All Other *** *** *** *** *** *** 0 N/A N/A
NEW MEXICOGrowth Annual Openings
AverageWage
Growth Outlook
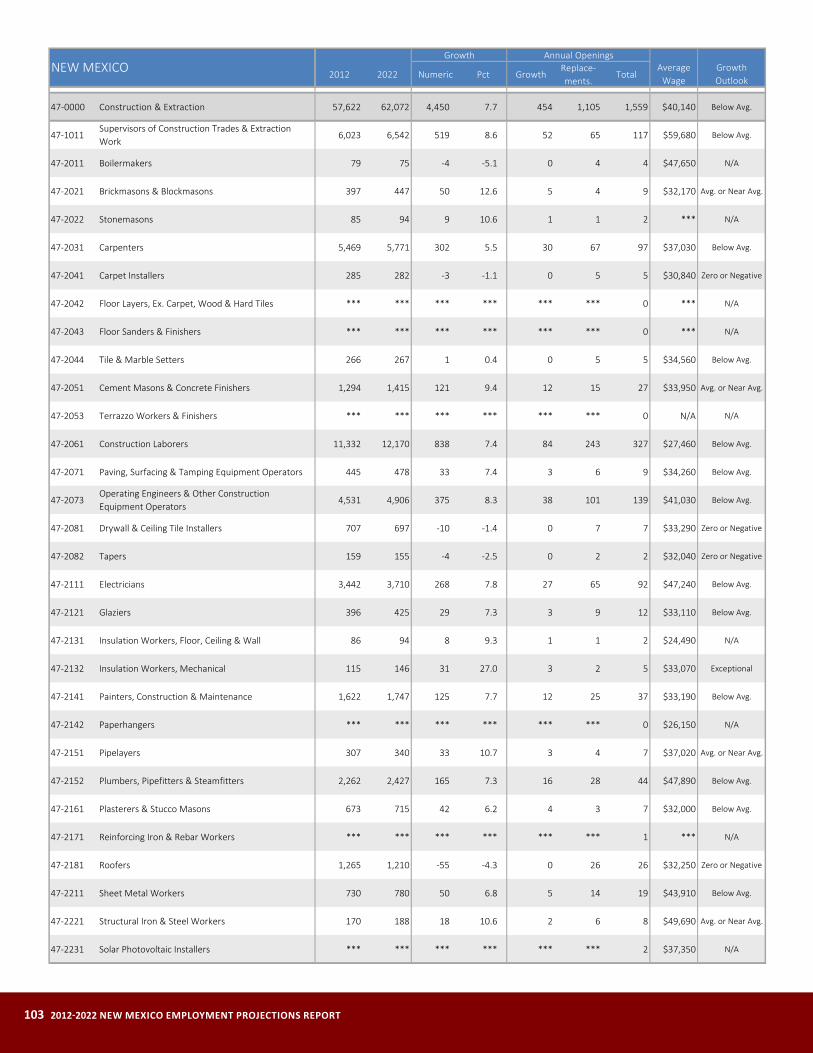
103 2012-2022 NEW MEXICO EMPLOYMENT PROJECTIONS REPORT
2012 2022 Numeric Pct GrowthReplace-ments.
Total
47-0000 Construction & Extraction 57,622 62,072 4,450 7.7 454 1,105 1,559 $40,140 Below Avg.
47-1011Supervisors of Construction Trades & Extraction Work
6,023 6,542 519 8.6 52 65 117 $59,680 Below Avg.
47-2011 Boilermakers 79 75 -4 -5.1 0 4 4 $47,650 N/A
47-2021 Brickmasons & Blockmasons 397 447 50 12.6 5 4 9 $32,170 Avg. or Near Avg.
47-2022 Stonemasons 85 94 9 10.6 1 1 2 *** N/A
47-2031 Carpenters 5,469 5,771 302 5.5 30 67 97 $37,030 Below Avg.
47-2041 Carpet Installers 285 282 -3 -1.1 0 5 5 $30,840 Zero or Negative
47-2042 Floor Layers, Ex. Carpet, Wood & Hard Tiles *** *** *** *** *** *** 0 *** N/A
47-2043 Floor Sanders & Finishers *** *** *** *** *** *** 0 *** N/A
47-2044 Tile & Marble Setters 266 267 1 0.4 0 5 5 $34,560 Below Avg.
47-2051 Cement Masons & Concrete Finishers 1,294 1,415 121 9.4 12 15 27 $33,950 Avg. or Near Avg.
47-2053 Terrazzo Workers & Finishers *** *** *** *** *** *** 0 N/A N/A
47-2061 Construction Laborers 11,332 12,170 838 7.4 84 243 327 $27,460 Below Avg.
47-2071 Paving, Surfacing & Tamping Equipment Operators 445 478 33 7.4 3 6 9 $34,260 Below Avg.
47-2073Operating Engineers & Other Construction Equipment Operators
4,531 4,906 375 8.3 38 101 139 $41,030 Below Avg.
47-2081 Drywall & Ceiling Tile Installers 707 697 -10 -1.4 0 7 7 $33,290 Zero or Negative
47-2082 Tapers 159 155 -4 -2.5 0 2 2 $32,040 Zero or Negative
47-2111 Electricians 3,442 3,710 268 7.8 27 65 92 $47,240 Below Avg.
47-2121 Glaziers 396 425 29 7.3 3 9 12 $33,110 Below Avg.
47-2131 Insulation Workers, Floor, Ceiling & Wall 86 94 8 9.3 1 1 2 $24,490 N/A
47-2132 Insulation Workers, Mechanical 115 146 31 27.0 3 2 5 $33,070 Exceptional
47-2141 Painters, Construction & Maintenance 1,622 1,747 125 7.7 12 25 37 $33,190 Below Avg.
47-2142 Paperhangers *** *** *** *** *** *** 0 $26,150 N/A
47-2151 Pipelayers 307 340 33 10.7 3 4 7 $37,020 Avg. or Near Avg.
47-2152 Plumbers, Pipefitters & Steamfitters 2,262 2,427 165 7.3 16 28 44 $47,890 Below Avg.
47-2161 Plasterers & Stucco Masons 673 715 42 6.2 4 3 7 $32,000 Below Avg.
47-2171 Reinforcing Iron & Rebar Workers *** *** *** *** *** *** 1 *** N/A
47-2181 Roofers 1,265 1,210 -55 -4.3 0 26 26 $32,250 Zero or Negative
47-2211 Sheet Metal Workers 730 780 50 6.8 5 14 19 $43,910 Below Avg.
47-2221 Structural Iron & Steel Workers 170 188 18 10.6 2 6 8 $49,690 Avg. or Near Avg.
47-2231 Solar Photovoltaic Installers *** *** *** *** *** *** 2 $37,350 N/A
NEW MEXICOGrowth Annual Openings
AverageWage
Growth Outlook
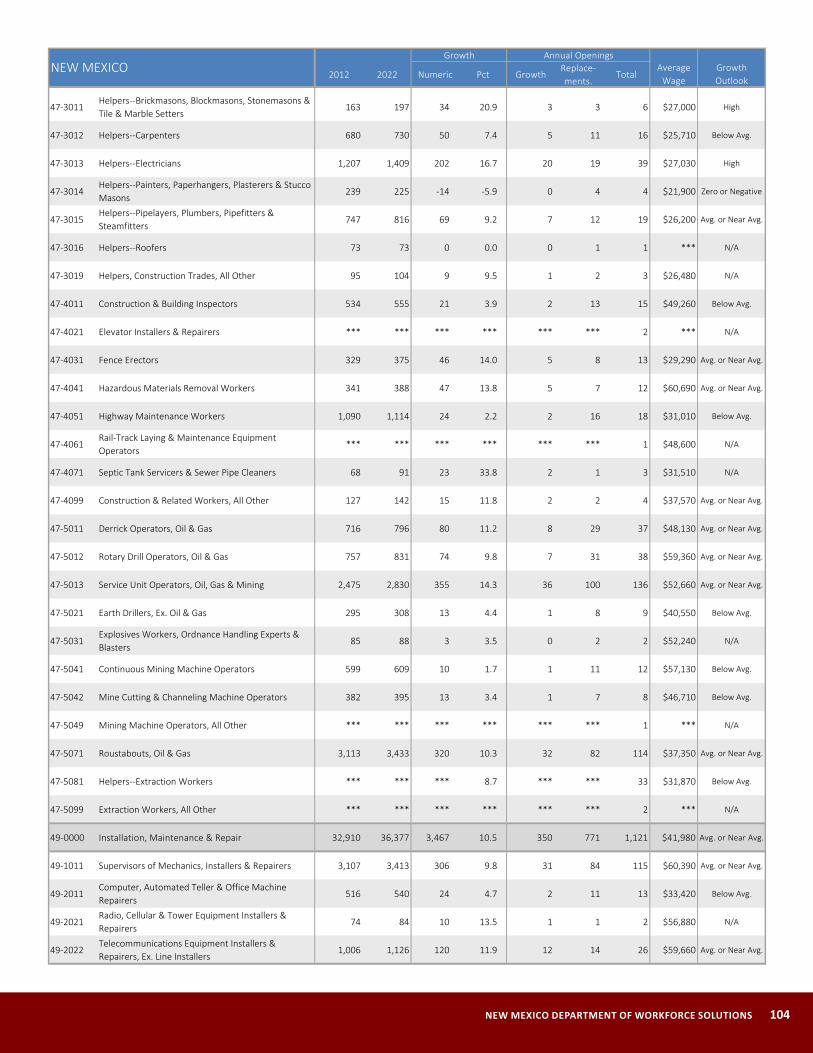
NEW MEXICO DEPARTMENT OF WORKFORCE SOLUTIONS 104
2012 2022 Numeric Pct GrowthReplace-ments.
Total
47-3011Helpers--Brickmasons, Blockmasons, Stonemasons & Tile & Marble Setters
163 197 34 20.9 3 3 6 $27,000 High
47-3012 Helpers--Carpenters 680 730 50 7.4 5 11 16 $25,710 Below Avg.
47-3013 Helpers--Electricians 1,207 1,409 202 16.7 20 19 39 $27,030 High
47-3014Helpers--Painters, Paperhangers, Plasterers & Stucco Masons
239 225 -14 -5.9 0 4 4 $21,900 Zero or Negative
47-3015Helpers--Pipelayers, Plumbers, Pipefitters & Steamfitters
747 816 69 9.2 7 12 19 $26,200 Avg. or Near Avg.
47-3016 Helpers--Roofers 73 73 0 0.0 0 1 1 *** N/A
47-3019 Helpers, Construction Trades, All Other 95 104 9 9.5 1 2 3 $26,480 N/A
47-4011 Construction & Building Inspectors 534 555 21 3.9 2 13 15 $49,260 Below Avg.
47-4021 Elevator Installers & Repairers *** *** *** *** *** *** 2 *** N/A
47-4031 Fence Erectors 329 375 46 14.0 5 8 13 $29,290 Avg. or Near Avg.
47-4041 Hazardous Materials Removal Workers 341 388 47 13.8 5 7 12 $60,690 Avg. or Near Avg.
47-4051 Highway Maintenance Workers 1,090 1,114 24 2.2 2 16 18 $31,010 Below Avg.
47-4061Rail-Track Laying & Maintenance Equipment Operators
*** *** *** *** *** *** 1 $48,600 N/A
47-4071 Septic Tank Servicers & Sewer Pipe Cleaners 68 91 23 33.8 2 1 3 $31,510 N/A
47-4099 Construction & Related Workers, All Other 127 142 15 11.8 2 2 4 $37,570 Avg. or Near Avg.
47-5011 Derrick Operators, Oil & Gas 716 796 80 11.2 8 29 37 $48,130 Avg. or Near Avg.
47-5012 Rotary Drill Operators, Oil & Gas 757 831 74 9.8 7 31 38 $59,360 Avg. or Near Avg.
47-5013 Service Unit Operators, Oil, Gas & Mining 2,475 2,830 355 14.3 36 100 136 $52,660 Avg. or Near Avg.
47-5021 Earth Drillers, Ex. Oil & Gas 295 308 13 4.4 1 8 9 $40,550 Below Avg.
47-5031Explosives Workers, Ordnance Handling Experts & Blasters
85 88 3 3.5 0 2 2 $52,240 N/A
47-5041 Continuous Mining Machine Operators 599 609 10 1.7 1 11 12 $57,130 Below Avg.
47-5042 Mine Cutting & Channeling Machine Operators 382 395 13 3.4 1 7 8 $46,710 Below Avg.
47-5049 Mining Machine Operators, All Other *** *** *** *** *** *** 1 *** N/A
47-5071 Roustabouts, Oil & Gas 3,113 3,433 320 10.3 32 82 114 $37,350 Avg. or Near Avg.
47-5081 Helpers--Extraction Workers *** *** *** 8.7 *** *** 33 $31,870 Below Avg.
47-5099 Extraction Workers, All Other *** *** *** *** *** *** 2 *** N/A
49-0000 Installation, Maintenance & Repair 32,910 36,377 3,467 10.5 350 771 1,121 $41,980 Avg. or Near Avg.
49-1011 Supervisors of Mechanics, Installers & Repairers 3,107 3,413 306 9.8 31 84 115 $60,390 Avg. or Near Avg.
49-2011Computer, Automated Teller & Office Machine Repairers
516 540 24 4.7 2 11 13 $33,420 Below Avg.
49-2021Radio, Cellular & Tower Equipment Installers & Repairers
74 84 10 13.5 1 1 2 $56,880 N/A
49-2022Telecommunications Equipment Installers & Repairers, Ex. Line Installers
1,006 1,126 120 11.9 12 14 26 $59,660 Avg. or Near Avg.
NEW MEXICOGrowth Annual Openings
AverageWage
Growth Outlook
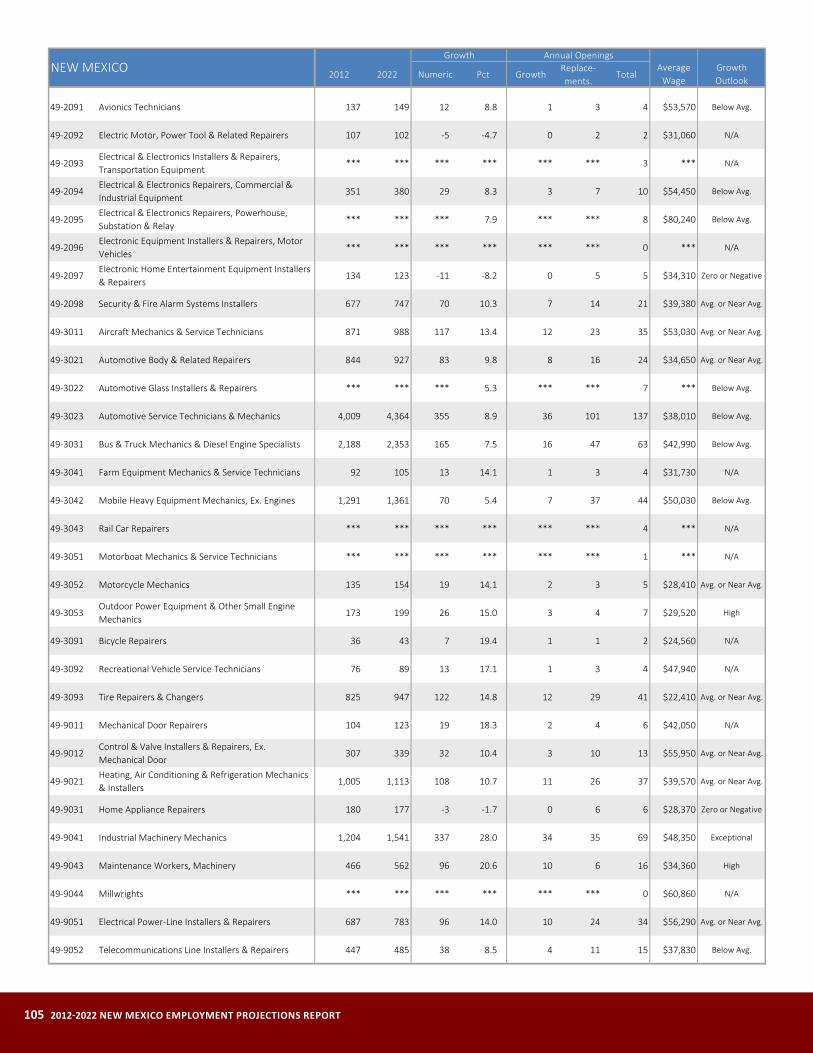
105 2012-2022 NEW MEXICO EMPLOYMENT PROJECTIONS REPORT
2012 2022 Numeric Pct GrowthReplace-ments.
Total
49-2091 Avionics Technicians 137 149 12 8.8 1 3 4 $53,570 Below Avg.
49-2092 Electric Motor, Power Tool & Related Repairers 107 102 -5 -4.7 0 2 2 $31,060 N/A
49-2093Electrical & Electronics Installers & Repairers, Transportation Equipment
*** *** *** *** *** *** 3 *** N/A
49-2094Electrical & Electronics Repairers, Commercial & Industrial Equipment
351 380 29 8.3 3 7 10 $54,450 Below Avg.
49-2095Electrical & Electronics Repairers, Powerhouse, Substation & Relay
*** *** *** 7.9 *** *** 8 $80,240 Below Avg.
49-2096Electronic Equipment Installers & Repairers, Motor Vehicles
*** *** *** *** *** *** 0 *** N/A
49-2097Electronic Home Entertainment Equipment Installers & Repairers
134 123 -11 -8.2 0 5 5 $34,310 Zero or Negative
49-2098 Security & Fire Alarm Systems Installers 677 747 70 10.3 7 14 21 $39,380 Avg. or Near Avg.
49-3011 Aircraft Mechanics & Service Technicians 871 988 117 13.4 12 23 35 $53,030 Avg. or Near Avg.
49-3021 Automotive Body & Related Repairers 844 927 83 9.8 8 16 24 $34,650 Avg. or Near Avg.
49-3022 Automotive Glass Installers & Repairers *** *** *** 5.3 *** *** 7 *** Below Avg.
49-3023 Automotive Service Technicians & Mechanics 4,009 4,364 355 8.9 36 101 137 $38,010 Below Avg.
49-3031 Bus & Truck Mechanics & Diesel Engine Specialists 2,188 2,353 165 7.5 16 47 63 $42,990 Below Avg.
49-3041 Farm Equipment Mechanics & Service Technicians 92 105 13 14.1 1 3 4 $31,730 N/A
49-3042 Mobile Heavy Equipment Mechanics, Ex. Engines 1,291 1,361 70 5.4 7 37 44 $50,030 Below Avg.
49-3043 Rail Car Repairers *** *** *** *** *** *** 4 *** N/A
49-3051 Motorboat Mechanics & Service Technicians *** *** *** *** *** *** 1 *** N/A
49-3052 Motorcycle Mechanics 135 154 19 14.1 2 3 5 $28,410 Avg. or Near Avg.
49-3053Outdoor Power Equipment & Other Small Engine Mechanics
173 199 26 15.0 3 4 7 $29,520 High
49-3091 Bicycle Repairers 36 43 7 19.4 1 1 2 $24,560 N/A
49-3092 Recreational Vehicle Service Technicians 76 89 13 17.1 1 3 4 $47,940 N/A
49-3093 Tire Repairers & Changers 825 947 122 14.8 12 29 41 $22,410 Avg. or Near Avg.
49-9011 Mechanical Door Repairers 104 123 19 18.3 2 4 6 $42,050 N/A
49-9012Control & Valve Installers & Repairers, Ex. Mechanical Door
307 339 32 10.4 3 10 13 $55,950 Avg. or Near Avg.
49-9021Heating, Air Conditioning & Refrigeration Mechanics & Installers
1,005 1,113 108 10.7 11 26 37 $39,570 Avg. or Near Avg.
49-9031 Home Appliance Repairers 180 177 -3 -1.7 0 6 6 $28,370 Zero or Negative
49-9041 Industrial Machinery Mechanics 1,204 1,541 337 28.0 34 35 69 $48,350 Exceptional
49-9043 Maintenance Workers, Machinery 466 562 96 20.6 10 6 16 $34,360 High
49-9044 Millwrights *** *** *** *** *** *** 0 $60,860 N/A
49-9051 Electrical Power-Line Installers & Repairers 687 783 96 14.0 10 24 34 $56,290 Avg. or Near Avg.
49-9052 Telecommunications Line Installers & Repairers 447 485 38 8.5 4 11 15 $37,830 Below Avg.
NEW MEXICOGrowth Annual Openings
AverageWage
Growth Outlook
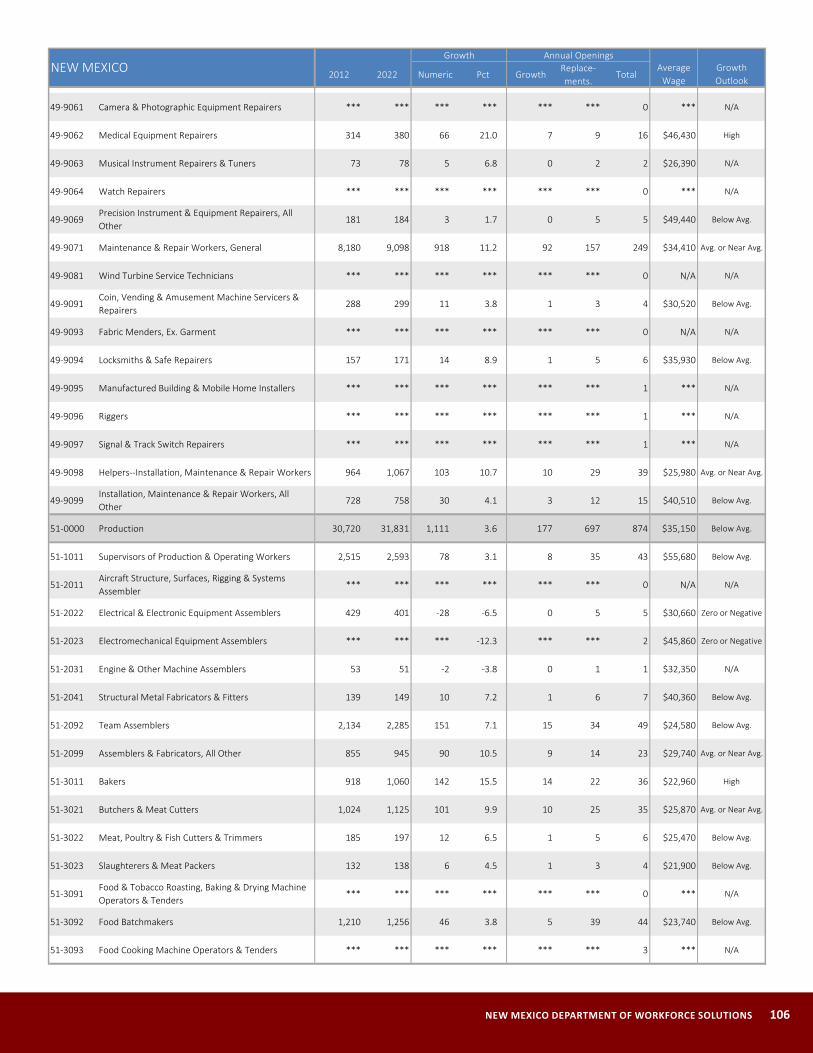
NEW MEXICO DEPARTMENT OF WORKFORCE SOLUTIONS 106
2012 2022 Numeric Pct GrowthReplace-ments.
Total
49-9061 Camera & Photographic Equipment Repairers *** *** *** *** *** *** 0 *** N/A
49-9062 Medical Equipment Repairers 314 380 66 21.0 7 9 16 $46,430 High
49-9063 Musical Instrument Repairers & Tuners 73 78 5 6.8 0 2 2 $26,390 N/A
49-9064 Watch Repairers *** *** *** *** *** *** 0 *** N/A
49-9069Precision Instrument & Equipment Repairers, All Other
181 184 3 1.7 0 5 5 $49,440 Below Avg.
49-9071 Maintenance & Repair Workers, General 8,180 9,098 918 11.2 92 157 249 $34,410 Avg. or Near Avg.
49-9081 Wind Turbine Service Technicians *** *** *** *** *** *** 0 N/A N/A
49-9091Coin, Vending & Amusement Machine Servicers & Repairers
288 299 11 3.8 1 3 4 $30,520 Below Avg.
49-9093 Fabric Menders, Ex. Garment *** *** *** *** *** *** 0 N/A N/A
49-9094 Locksmiths & Safe Repairers 157 171 14 8.9 1 5 6 $35,930 Below Avg.
49-9095 Manufactured Building & Mobile Home Installers *** *** *** *** *** *** 1 *** N/A
49-9096 Riggers *** *** *** *** *** *** 1 *** N/A
49-9097 Signal & Track Switch Repairers *** *** *** *** *** *** 1 *** N/A
49-9098 Helpers--Installation, Maintenance & Repair Workers 964 1,067 103 10.7 10 29 39 $25,980 Avg. or Near Avg.
49-9099Installation, Maintenance & Repair Workers, All Other
728 758 30 4.1 3 12 15 $40,510 Below Avg.
51-0000 Production 30,720 31,831 1,111 3.6 177 697 874 $35,150 Below Avg.
51-1011 Supervisors of Production & Operating Workers 2,515 2,593 78 3.1 8 35 43 $55,680 Below Avg.
51-2011Aircraft Structure, Surfaces, Rigging & Systems Assembler
*** *** *** *** *** *** 0 N/A N/A
51-2022 Electrical & Electronic Equipment Assemblers 429 401 -28 -6.5 0 5 5 $30,660 Zero or Negative
51-2023 Electromechanical Equipment Assemblers *** *** *** -12.3 *** *** 2 $45,860 Zero or Negative
51-2031 Engine & Other Machine Assemblers 53 51 -2 -3.8 0 1 1 $32,350 N/A
51-2041 Structural Metal Fabricators & Fitters 139 149 10 7.2 1 6 7 $40,360 Below Avg.
51-2092 Team Assemblers 2,134 2,285 151 7.1 15 34 49 $24,580 Below Avg.
51-2099 Assemblers & Fabricators, All Other 855 945 90 10.5 9 14 23 $29,740 Avg. or Near Avg.
51-3011 Bakers 918 1,060 142 15.5 14 22 36 $22,960 High
51-3021 Butchers & Meat Cutters 1,024 1,125 101 9.9 10 25 35 $25,870 Avg. or Near Avg.
51-3022 Meat, Poultry & Fish Cutters & Trimmers 185 197 12 6.5 1 5 6 $25,470 Below Avg.
51-3023 Slaughterers & Meat Packers 132 138 6 4.5 1 3 4 $21,900 Below Avg.
51-3091Food & Tobacco Roasting, Baking & Drying Machine Operators & Tenders
*** *** *** *** *** *** 0 *** N/A
51-3092 Food Batchmakers 1,210 1,256 46 3.8 5 39 44 $23,740 Below Avg.
51-3093 Food Cooking Machine Operators & Tenders *** *** *** *** *** *** 3 *** N/A
NEW MEXICOGrowth Annual Openings
AverageWage
Growth Outlook
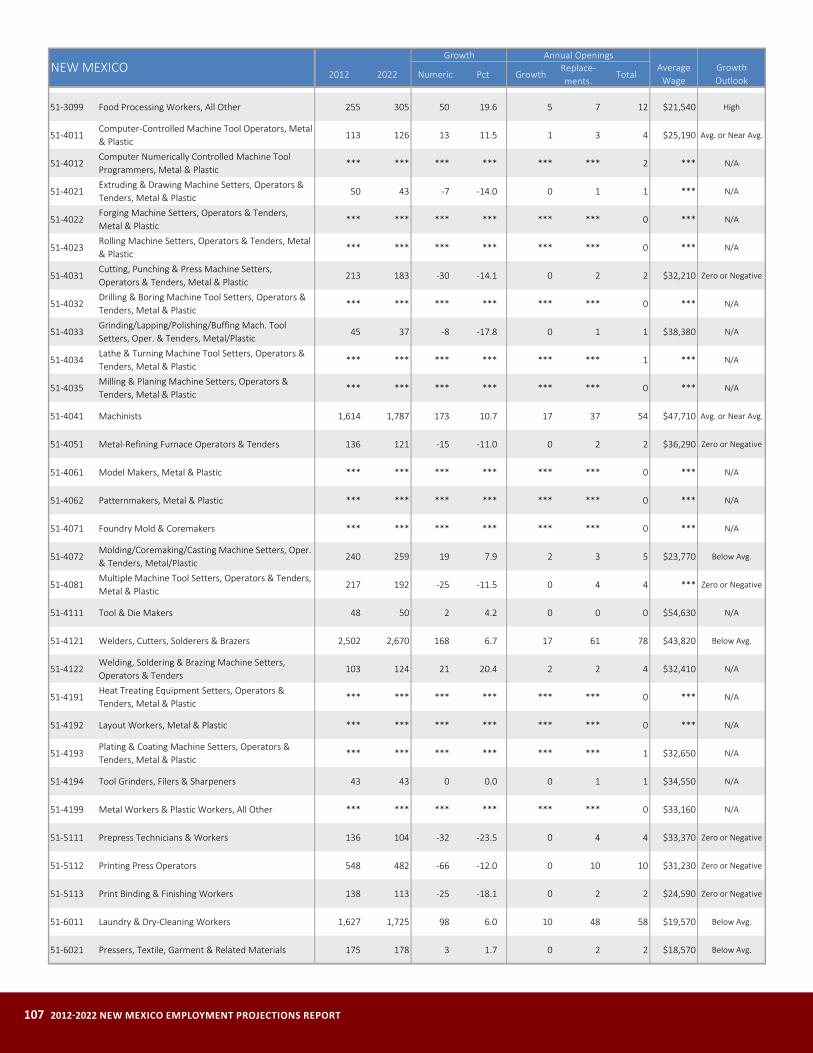
107 2012-2022 NEW MEXICO EMPLOYMENT PROJECTIONS REPORT
2012 2022 Numeric Pct GrowthReplace-ments.
Total
51-3099 Food Processing Workers, All Other 255 305 50 19.6 5 7 12 $21,540 High
51-4011Computer-Controlled Machine Tool Operators, Metal & Plastic
113 126 13 11.5 1 3 4 $25,190 Avg. or Near Avg.
51-4012Computer Numerically Controlled Machine Tool Programmers, Metal & Plastic
*** *** *** *** *** *** 2 *** N/A
51-4021Extruding & Drawing Machine Setters, Operators & Tenders, Metal & Plastic
50 43 -7 -14.0 0 1 1 *** N/A
51-4022Forging Machine Setters, Operators & Tenders, Metal & Plastic
*** *** *** *** *** *** 0 *** N/A
51-4023Rolling Machine Setters, Operators & Tenders, Metal & Plastic
*** *** *** *** *** *** 0 *** N/A
51-4031Cutting, Punching & Press Machine Setters, Operators & Tenders, Metal & Plastic
213 183 -30 -14.1 0 2 2 $32,210 Zero or Negative
51-4032Drilling & Boring Machine Tool Setters, Operators & Tenders, Metal & Plastic
*** *** *** *** *** *** 0 *** N/A
51-4033Grinding/Lapping/Polishing/Buffing Mach. Tool Setters, Oper. & Tenders, Metal/Plastic
45 37 -8 -17.8 0 1 1 $38,380 N/A
51-4034Lathe & Turning Machine Tool Setters, Operators & Tenders, Metal & Plastic
*** *** *** *** *** *** 1 *** N/A
51-4035Milling & Planing Machine Setters, Operators & Tenders, Metal & Plastic
*** *** *** *** *** *** 0 *** N/A
51-4041 Machinists 1,614 1,787 173 10.7 17 37 54 $47,710 Avg. or Near Avg.
51-4051 Metal-Refining Furnace Operators & Tenders 136 121 -15 -11.0 0 2 2 $36,290 Zero or Negative
51-4061 Model Makers, Metal & Plastic *** *** *** *** *** *** 0 *** N/A
51-4062 Patternmakers, Metal & Plastic *** *** *** *** *** *** 0 *** N/A
51-4071 Foundry Mold & Coremakers *** *** *** *** *** *** 0 *** N/A
51-4072Molding/Coremaking/Casting Machine Setters, Oper. & Tenders, Metal/Plastic
240 259 19 7.9 2 3 5 $23,770 Below Avg.
51-4081Multiple Machine Tool Setters, Operators & Tenders, Metal & Plastic
217 192 -25 -11.5 0 4 4 *** Zero or Negative
51-4111 Tool & Die Makers 48 50 2 4.2 0 0 0 $54,630 N/A
51-4121 Welders, Cutters, Solderers & Brazers 2,502 2,670 168 6.7 17 61 78 $43,820 Below Avg.
51-4122Welding, Soldering & Brazing Machine Setters, Operators & Tenders
103 124 21 20.4 2 2 4 $32,410 N/A
51-4191Heat Treating Equipment Setters, Operators & Tenders, Metal & Plastic
*** *** *** *** *** *** 0 *** N/A
51-4192 Layout Workers, Metal & Plastic *** *** *** *** *** *** 0 *** N/A
51-4193Plating & Coating Machine Setters, Operators & Tenders, Metal & Plastic
*** *** *** *** *** *** 1 $32,650 N/A
51-4194 Tool Grinders, Filers & Sharpeners 43 43 0 0.0 0 1 1 $34,550 N/A
51-4199 Metal Workers & Plastic Workers, All Other *** *** *** *** *** *** 0 $33,160 N/A
51-5111 Prepress Technicians & Workers 136 104 -32 -23.5 0 4 4 $33,370 Zero or Negative
51-5112 Printing Press Operators 548 482 -66 -12.0 0 10 10 $31,230 Zero or Negative
51-5113 Print Binding & Finishing Workers 138 113 -25 -18.1 0 2 2 $24,590 Zero or Negative
51-6011 Laundry & Dry-Cleaning Workers 1,627 1,725 98 6.0 10 48 58 $19,570 Below Avg.
51-6021 Pressers, Textile, Garment & Related Materials 175 178 3 1.7 0 2 2 $18,570 Below Avg.
NEW MEXICOGrowth Annual Openings
AverageWage
Growth Outlook
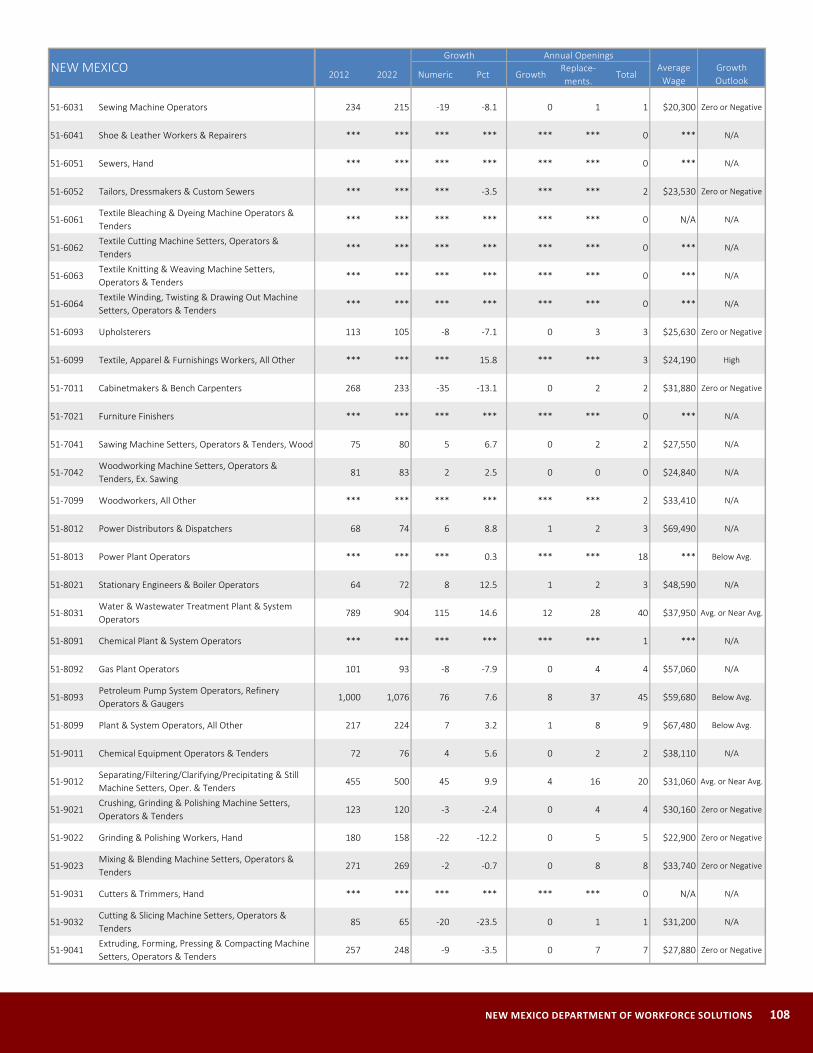
NEW MEXICO DEPARTMENT OF WORKFORCE SOLUTIONS 108
2012 2022 Numeric Pct GrowthReplace-ments.
Total
51-6031 Sewing Machine Operators 234 215 -19 -8.1 0 1 1 $20,300 Zero or Negative
51-6041 Shoe & Leather Workers & Repairers *** *** *** *** *** *** 0 *** N/A
51-6051 Sewers, Hand *** *** *** *** *** *** 0 *** N/A
51-6052 Tailors, Dressmakers & Custom Sewers *** *** *** -3.5 *** *** 2 $23,530 Zero or Negative
51-6061Textile Bleaching & Dyeing Machine Operators & Tenders
*** *** *** *** *** *** 0 N/A N/A
51-6062Textile Cutting Machine Setters, Operators & Tenders
*** *** *** *** *** *** 0 *** N/A
51-6063Textile Knitting & Weaving Machine Setters, Operators & Tenders
*** *** *** *** *** *** 0 *** N/A
51-6064Textile Winding, Twisting & Drawing Out Machine Setters, Operators & Tenders
*** *** *** *** *** *** 0 *** N/A
51-6093 Upholsterers 113 105 -8 -7.1 0 3 3 $25,630 Zero or Negative
51-6099 Textile, Apparel & Furnishings Workers, All Other *** *** *** 15.8 *** *** 3 $24,190 High
51-7011 Cabinetmakers & Bench Carpenters 268 233 -35 -13.1 0 2 2 $31,880 Zero or Negative
51-7021 Furniture Finishers *** *** *** *** *** *** 0 *** N/A
51-7041 Sawing Machine Setters, Operators & Tenders, Wood 75 80 5 6.7 0 2 2 $27,550 N/A
51-7042Woodworking Machine Setters, Operators & Tenders, Ex. Sawing
81 83 2 2.5 0 0 0 $24,840 N/A
51-7099 Woodworkers, All Other *** *** *** *** *** *** 2 $33,410 N/A
51-8012 Power Distributors & Dispatchers 68 74 6 8.8 1 2 3 $69,490 N/A
51-8013 Power Plant Operators *** *** *** 0.3 *** *** 18 *** Below Avg.
51-8021 Stationary Engineers & Boiler Operators 64 72 8 12.5 1 2 3 $48,590 N/A
51-8031Water & Wastewater Treatment Plant & System Operators
789 904 115 14.6 12 28 40 $37,950 Avg. or Near Avg.
51-8091 Chemical Plant & System Operators *** *** *** *** *** *** 1 *** N/A
51-8092 Gas Plant Operators 101 93 -8 -7.9 0 4 4 $57,060 N/A
51-8093Petroleum Pump System Operators, Refinery Operators & Gaugers
1,000 1,076 76 7.6 8 37 45 $59,680 Below Avg.
51-8099 Plant & System Operators, All Other 217 224 7 3.2 1 8 9 $67,480 Below Avg.
51-9011 Chemical Equipment Operators & Tenders 72 76 4 5.6 0 2 2 $38,110 N/A
51-9012Separating/Filtering/Clarifying/Precipitating & Still Machine Setters, Oper. & Tenders
455 500 45 9.9 4 16 20 $31,060 Avg. or Near Avg.
51-9021Crushing, Grinding & Polishing Machine Setters, Operators & Tenders
123 120 -3 -2.4 0 4 4 $30,160 Zero or Negative
51-9022 Grinding & Polishing Workers, Hand 180 158 -22 -12.2 0 5 5 $22,900 Zero or Negative
51-9023Mixing & Blending Machine Setters, Operators & Tenders
271 269 -2 -0.7 0 8 8 $33,740 Zero or Negative
51-9031 Cutters & Trimmers, Hand *** *** *** *** *** *** 0 N/A N/A
51-9032Cutting & Slicing Machine Setters, Operators & Tenders
85 65 -20 -23.5 0 1 1 $31,200 N/A
51-9041Extruding, Forming, Pressing & Compacting Machine Setters, Operators & Tenders
257 248 -9 -3.5 0 7 7 $27,880 Zero or Negative
NEW MEXICOGrowth Annual Openings
AverageWage
Growth Outlook
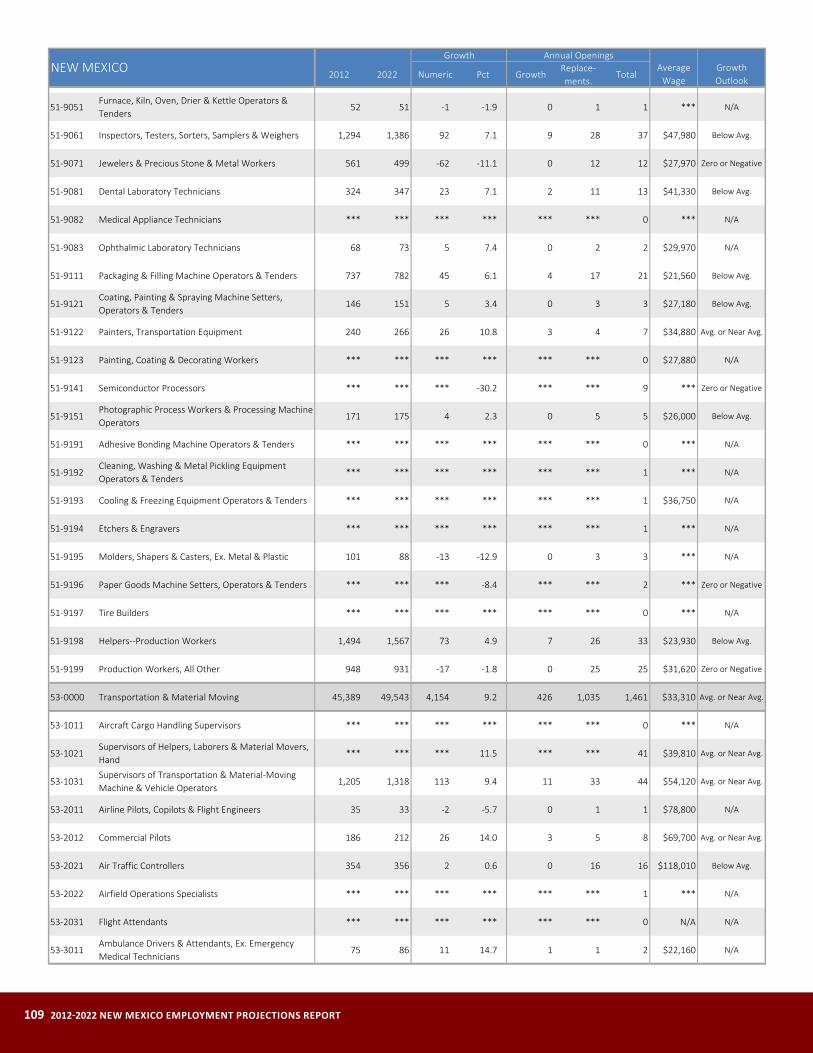
109 2012-2022 NEW MEXICO EMPLOYMENT PROJECTIONS REPORT
2012 2022 Numeric Pct GrowthReplace-ments.
Total
51-9051Furnace, Kiln, Oven, Drier & Kettle Operators & Tenders
52 51 -1 -1.9 0 1 1 *** N/A
51-9061 Inspectors, Testers, Sorters, Samplers & Weighers 1,294 1,386 92 7.1 9 28 37 $47,980 Below Avg.
51-9071 Jewelers & Precious Stone & Metal Workers 561 499 -62 -11.1 0 12 12 $27,970 Zero or Negative
51-9081 Dental Laboratory Technicians 324 347 23 7.1 2 11 13 $41,330 Below Avg.
51-9082 Medical Appliance Technicians *** *** *** *** *** *** 0 *** N/A
51-9083 Ophthalmic Laboratory Technicians 68 73 5 7.4 0 2 2 $29,970 N/A
51-9111 Packaging & Filling Machine Operators & Tenders 737 782 45 6.1 4 17 21 $21,560 Below Avg.
51-9121Coating, Painting & Spraying Machine Setters, Operators & Tenders
146 151 5 3.4 0 3 3 $27,180 Below Avg.
51-9122 Painters, Transportation Equipment 240 266 26 10.8 3 4 7 $34,880 Avg. or Near Avg.
51-9123 Painting, Coating & Decorating Workers *** *** *** *** *** *** 0 $27,880 N/A
51-9141 Semiconductor Processors *** *** *** -30.2 *** *** 9 *** Zero or Negative
51-9151Photographic Process Workers & Processing Machine Operators
171 175 4 2.3 0 5 5 $26,000 Below Avg.
51-9191 Adhesive Bonding Machine Operators & Tenders *** *** *** *** *** *** 0 *** N/A
51-9192Cleaning, Washing & Metal Pickling Equipment Operators & Tenders
*** *** *** *** *** *** 1 *** N/A
51-9193 Cooling & Freezing Equipment Operators & Tenders *** *** *** *** *** *** 1 $36,750 N/A
51-9194 Etchers & Engravers *** *** *** *** *** *** 1 *** N/A
51-9195 Molders, Shapers & Casters, Ex. Metal & Plastic 101 88 -13 -12.9 0 3 3 *** N/A
51-9196 Paper Goods Machine Setters, Operators & Tenders *** *** *** -8.4 *** *** 2 *** Zero or Negative
51-9197 Tire Builders *** *** *** *** *** *** 0 *** N/A
51-9198 Helpers--Production Workers 1,494 1,567 73 4.9 7 26 33 $23,930 Below Avg.
51-9199 Production Workers, All Other 948 931 -17 -1.8 0 25 25 $31,620 Zero or Negative
53-0000 Transportation & Material Moving 45,389 49,543 4,154 9.2 426 1,035 1,461 $33,310 Avg. or Near Avg.
53-1011 Aircraft Cargo Handling Supervisors *** *** *** *** *** *** 0 *** N/A
53-1021Supervisors of Helpers, Laborers & Material Movers, Hand
*** *** *** 11.5 *** *** 41 $39,810 Avg. or Near Avg.
53-1031Supervisors of Transportation & Material-Moving Machine & Vehicle Operators
1,205 1,318 113 9.4 11 33 44 $54,120 Avg. or Near Avg.
53-2011 Airline Pilots, Copilots & Flight Engineers 35 33 -2 -5.7 0 1 1 $78,800 N/A
53-2012 Commercial Pilots 186 212 26 14.0 3 5 8 $69,700 Avg. or Near Avg.
53-2021 Air Traffic Controllers 354 356 2 0.6 0 16 16 $118,010 Below Avg.
53-2022 Airfield Operations Specialists *** *** *** *** *** *** 1 *** N/A
53-2031 Flight Attendants *** *** *** *** *** *** 0 N/A N/A
53-3011Ambulance Drivers & Attendants, Ex. Emergency Medical Technicians
75 86 11 14.7 1 1 2 $22,160 N/A
NEW MEXICOGrowth Annual Openings
AverageWage
Growth Outlook
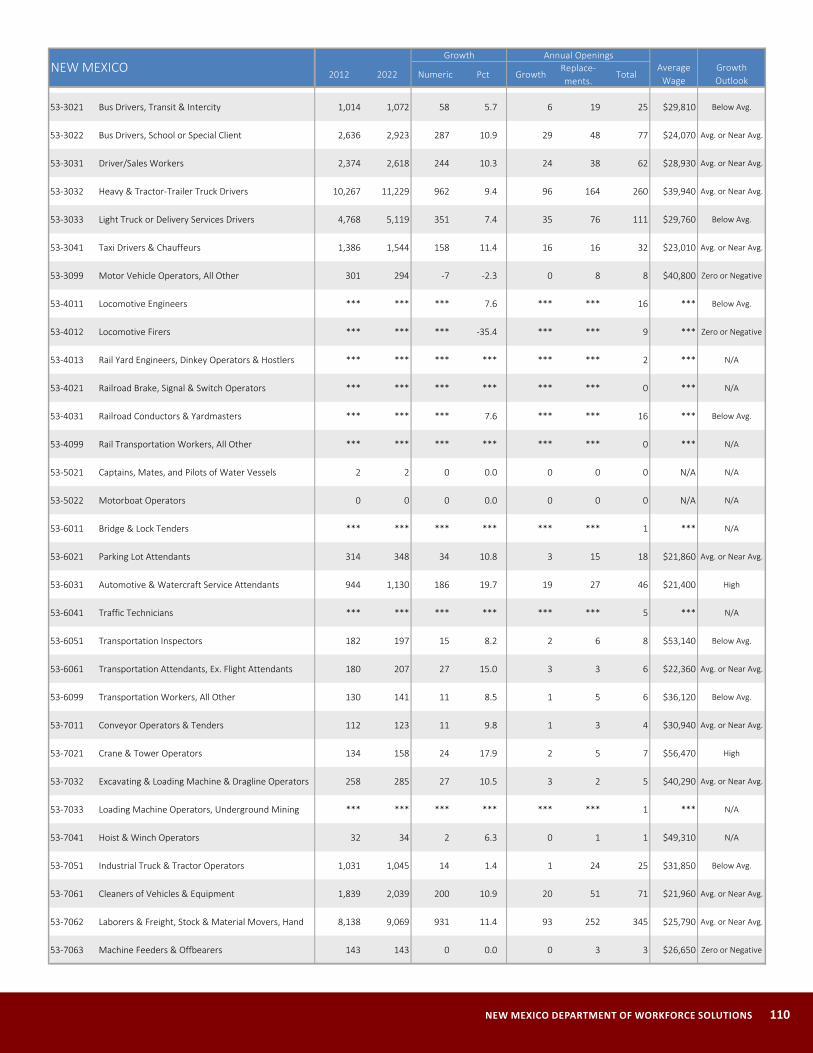
NEW MEXICO DEPARTMENT OF WORKFORCE SOLUTIONS 110
2012 2022 Numeric Pct GrowthReplace-ments.
Total
53-3021 Bus Drivers, Transit & Intercity 1,014 1,072 58 5.7 6 19 25 $29,810 Below Avg.
53-3022 Bus Drivers, School or Special Client 2,636 2,923 287 10.9 29 48 77 $24,070 Avg. or Near Avg.
53-3031 Driver/Sales Workers 2,374 2,618 244 10.3 24 38 62 $28,930 Avg. or Near Avg.
53-3032 Heavy & Tractor-Trailer Truck Drivers 10,267 11,229 962 9.4 96 164 260 $39,940 Avg. or Near Avg.
53-3033 Light Truck or Delivery Services Drivers 4,768 5,119 351 7.4 35 76 111 $29,760 Below Avg.
53-3041 Taxi Drivers & Chauffeurs 1,386 1,544 158 11.4 16 16 32 $23,010 Avg. or Near Avg.
53-3099 Motor Vehicle Operators, All Other 301 294 -7 -2.3 0 8 8 $40,800 Zero or Negative
53-4011 Locomotive Engineers *** *** *** 7.6 *** *** 16 *** Below Avg.
53-4012 Locomotive Firers *** *** *** -35.4 *** *** 9 *** Zero or Negative
53-4013 Rail Yard Engineers, Dinkey Operators & Hostlers *** *** *** *** *** *** 2 *** N/A
53-4021 Railroad Brake, Signal & Switch Operators *** *** *** *** *** *** 0 *** N/A
53-4031 Railroad Conductors & Yardmasters *** *** *** 7.6 *** *** 16 *** Below Avg.
53-4099 Rail Transportation Workers, All Other *** *** *** *** *** *** 0 *** N/A
53-5021 Captains, Mates, and Pilots of Water Vessels 2 2 0 0.0 0 0 0 N/A N/A
53-5022 Motorboat Operators 0 0 0 0.0 0 0 0 N/A N/A
53-6011 Bridge & Lock Tenders *** *** *** *** *** *** 1 *** N/A
53-6021 Parking Lot Attendants 314 348 34 10.8 3 15 18 $21,860 Avg. or Near Avg.
53-6031 Automotive & Watercraft Service Attendants 944 1,130 186 19.7 19 27 46 $21,400 High
53-6041 Traffic Technicians *** *** *** *** *** *** 5 *** N/A
53-6051 Transportation Inspectors 182 197 15 8.2 2 6 8 $53,140 Below Avg.
53-6061 Transportation Attendants, Ex. Flight Attendants 180 207 27 15.0 3 3 6 $22,360 Avg. or Near Avg.
53-6099 Transportation Workers, All Other 130 141 11 8.5 1 5 6 $36,120 Below Avg.
53-7011 Conveyor Operators & Tenders 112 123 11 9.8 1 3 4 $30,940 Avg. or Near Avg.
53-7021 Crane & Tower Operators 134 158 24 17.9 2 5 7 $56,470 High
53-7032 Excavating & Loading Machine & Dragline Operators 258 285 27 10.5 3 2 5 $40,290 Avg. or Near Avg.
53-7033 Loading Machine Operators, Underground Mining *** *** *** *** *** *** 1 *** N/A
53-7041 Hoist & Winch Operators 32 34 2 6.3 0 1 1 $49,310 N/A
53-7051 Industrial Truck & Tractor Operators 1,031 1,045 14 1.4 1 24 25 $31,850 Below Avg.
53-7061 Cleaners of Vehicles & Equipment 1,839 2,039 200 10.9 20 51 71 $21,960 Avg. or Near Avg.
53-7062 Laborers & Freight, Stock & Material Movers, Hand 8,138 9,069 931 11.4 93 252 345 $25,790 Avg. or Near Avg.
53-7063 Machine Feeders & Offbearers 143 143 0 0.0 0 3 3 $26,650 Zero or Negative
NEW MEXICOGrowth Annual Openings
AverageWage
Growth Outlook
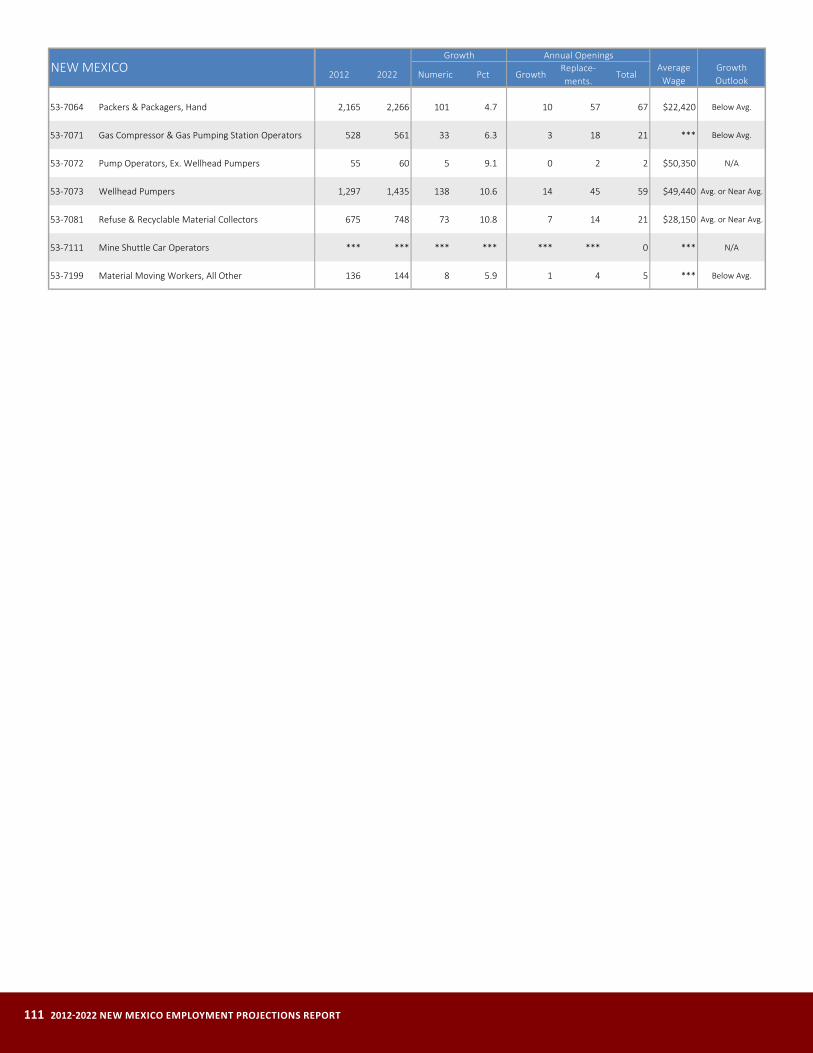
111 2012-2022 NEW MEXICO EMPLOYMENT PROJECTIONS REPORT
2012 2022 Numeric Pct GrowthReplace-ments.
Total
53-7064 Packers & Packagers, Hand 2,165 2,266 101 4.7 10 57 67 $22,420 Below Avg.
53-7071 Gas Compressor & Gas Pumping Station Operators 528 561 33 6.3 3 18 21 *** Below Avg.
53-7072 Pump Operators, Ex. Wellhead Pumpers 55 60 5 9.1 0 2 2 $50,350 N/A
53-7073 Wellhead Pumpers 1,297 1,435 138 10.6 14 45 59 $49,440 Avg. or Near Avg.
53-7081 Refuse & Recyclable Material Collectors 675 748 73 10.8 7 14 21 $28,150 Avg. or Near Avg.
53-7111 Mine Shuttle Car Operators *** *** *** *** *** *** 0 *** N/A
53-7199 Material Moving Workers, All Other 136 144 8 5.9 1 4 5 *** Below Avg.
NEW MEXICOGrowth Annual Openings
AverageWage
Growth Outlook

NEW MEXICO DEPARTMENT OF WORKFORCE SOLUTIONS 112
Appendices Substate Area Detaiiled Occupation Employment Projections
Appendix A: MSA Detailed Occupation Employment Projections
Appendix B: Region Detailed Occupation Employment Projections
Appendix A and B can be found at www dws state nm us/LMI

New Mexico Department of Workforce Solutions, Economic Research & Analysis Bureau
P O Box 1928
Albuquerque, NM 87103
(505) 383-2729
www.dws.state.nm.us