new mexico - national council on compensation insurance · guest speaker: darin hilders, new mexico...
TRANSCRIPT

© Copyright 2017 National Council on Compensation Insurance, Inc. All Rights Reserved.
New MexicoNovember 2, 2017
© Copyright 2017 National Council on Compensation Insurance, Inc. All Rights Reserved.
New Mexico State Advisory Forum
▪ Annual Issues Symposium (AIS): Bill Donnell Video Excerpt
▪ Countrywide Workers Compensation System
▪ New Mexico’s Workers Compensation System
▪ Countrywide and New Mexico Labor Markets
▪ Legislative Issues: Countrywide and New Mexico
▪ Guest Speaker: Darin Childers, New Mexico Workers’ Compensation Administration
▪ Emerging Issue: 2017 Medical Marijuana Update
▪ Residual Market: Countrywide and New Mexico
▪ Q & A
2
© Copyright 2017 National Council on Compensation Insurance, Inc. All Rights Reserved.
AIS State of the LineVideo Excerpt
Bill Donnell NCCI President and CEO
© Copyright 2017 National Council on Compensation Insurance, Inc. All Rights Reserved.
CountrywideWorkers Compensation System
© Copyright 2017 National Council on Compensation Insurance, Inc. All Rights Reserved.
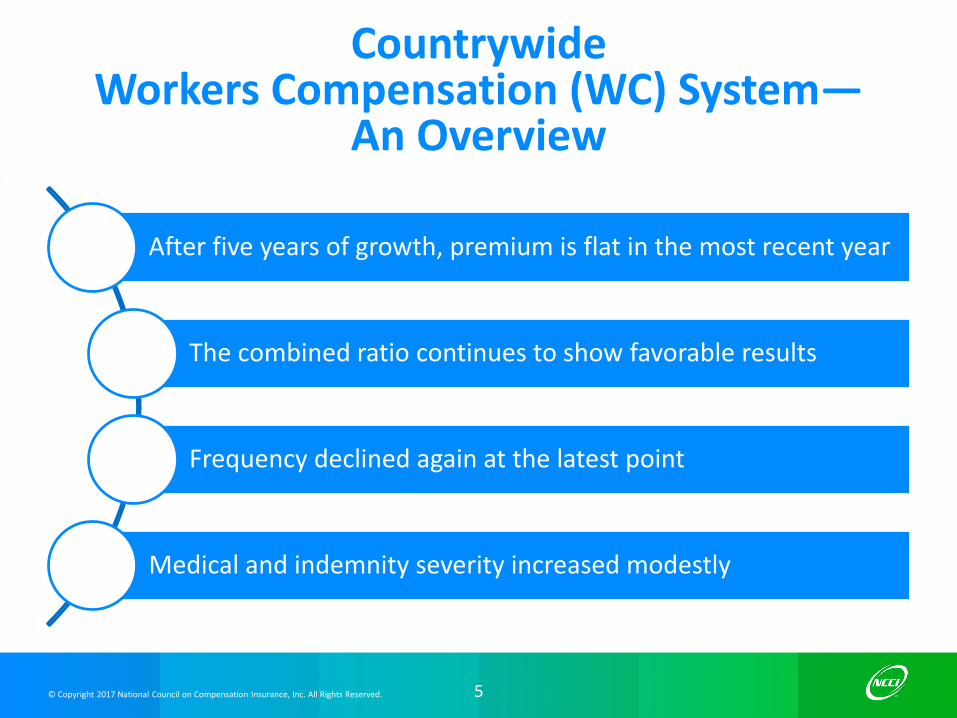
After five years of growth, premium is flat in the most recent year
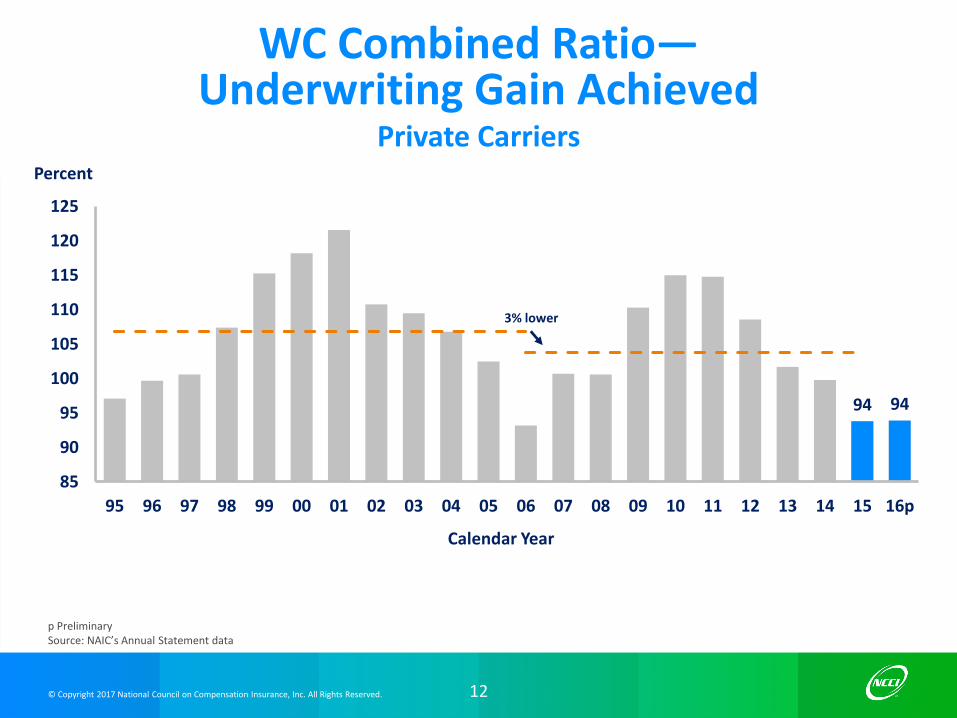
The combined ratio continues to show favorable results
Frequency declined again at the latest point
Medical and indemnity severity increased modestly
CountrywideWorkers Compensation (WC) System—
An Overview
5

© Copyright 2017 National Council on Compensation Insurance, Inc. All Rights Reserved.
WC Net Written PremiumPrivate Carriers and State Funds
6
p PreliminarySource: NAIC’s Annual Statement data; includes state insurance fund data for the following states: AZ, CA, CO, HI, ID, KY, LA, MD, MO, MT, NM, OK, OR, RI, TX, and UTEach calendar year total for state funds includes all funds operating as a state fund in that year
37.8 39.7 40.1
47.845.5 45.5
0
10
20
30
40
50
95 96 97 98 99 00 01 02 03 04 05 06 07 08 09 10 11 12 13 14 15 16p
$ Billions
Calendar Year
State Funds ($B)
Private Carriers ($B)

© Copyright 2017 National Council on Compensation Insurance, Inc. All Rights Reserved.
WC Direct Written Premium (DWP)Change by Component
Private Carriers—NCCI States
7
Sources: DWP Change: NAIC’s Annual Statement Statutory Page 14 for all states where NCCI provides ratemaking services Components: NCCI’s Policy data
2016 vs. 2015
-0.8%
+1.0%
-1.4%
-2.7%
+4.0%
State Fund Conversion to Private Carrier
Payroll
Loss Cost and Mix
Carrier Discounting
Other Factors
Change in Direct Written Premium: 0.0%

© Copyright 2017 National Council on Compensation Insurance, Inc. All Rights Reserved.
Increases in Payroll Continue to Drive Premium Growth
Forecast Change 2015–2016
8
Sources: Moody’s Analytics and NCCI
+2.5%
WageRate
+4.5%
Payroll
-1%
0%
1%
2%
3%
4%
Prof. &BusinessServices
Trade,Transport.,& Utilities
Education& HealthServices
Manufac-turing
FinancialActivities
Construc-tion
Leisure & Hospitality
All Other-1%
0%
1%
2%
3%
4%
Prof. &BusinessServices
Trade,Transport.,& Utilities
Education& HealthServices
Manufac-turing
FinancialActivities
Construc-tion
Leisure & Hospitality
All Other
+1.9%
Employment

© Copyright 2017 National Council on Compensation Insurance, Inc. All Rights Reserved.
WC Approved Changes inBureau Premium LevelBy Effective Year for NCCI States
9
p PreliminarySource: NAIC’s Annual Statement Statutory Page 14Bureau premium level changes reflect approved changes in advisory rates, loss costs, assigned risk rates, and rating values, as of 5/12/2017, relative to those previously approved in NCCI states onlyIN and NC are filed in cooperation with state rating bureaus
-2.5
-6.7
-10
-5
0
5
00 01 02 03 04 05 06 07 08 09 10 11 12 13 14 15 16 17p
Percent
Calendar Year

© Copyright 2017 National Council on Compensation Insurance, Inc. All Rights Reserved.
WC Impact of Discounting on PremiumPrivate Carriers—NCCI States
10
p PreliminarySources: NAIC’s Annual Statement Statutory Page 14 and NCCI’s Financial Call data NCCI benchmark level does not include a profit and contingency provision or expense constantBased on data for all states where NCCI provides ratemaking services, excluding TX
2.60.5
-25
-15
-5
5
95 96 97 98 99 00 01 02 03 04 05 06 07 08 09 10 11 12 13 14 15 16p
Percent
Policy Year

© Copyright 2017 National Council on Compensation Insurance, Inc. All Rights Reserved.
WC Impact of Discounting on PremiumPrivate Carriers—NCCI States
11
p PreliminarySources: NAIC’s Annual Statement Statutory Page 14 and NCCI’s Financial Call data Dividend ratios are based on calendar year statisticsNCCI benchmark level does not include a profit and contingency provision or expense constantBased on data for all states where NCCI provides ratemaking services, excluding TX
Rate/Loss Cost Departure
Schedule Rating
Dividends
95 96 97 98 99 00 01 02 03 04 05 06 07 08 09 10 11 12 13 14 15 16p
Policy Year
© Copyright 2017 National Council on Compensation Insurance, Inc. All Rights Reserved.
WC Combined Ratio—Underwriting Gain Achieved
Private Carriers
12
p PreliminarySource: NAIC’s Annual Statement data
3% lower
94 94
85
90
95
100
105
110
115
120
125
95 96 97 98 99 00 01 02 03 04 05 06 07 08 09 10 11 12 13 14 15 16p
Percent
Calendar Year

© Copyright 2017 National Council on Compensation Insurance, Inc. All Rights Reserved.
WC Combined Ratio ComponentsPrivate Carriers
13
p PreliminarySource: NAIC’s Annual Statement data
Loss Ratio
Loss Adjustment Expense (LAE) Ratio
Underwriting Expense Ratio
Percent
Calendar Year
Dividends
54 53
14 14
25 25
1 1
95 96 97 98 99 00 01 02 03 04 05 06 07 08 09 10 11 12 13 14 15 16p

© Copyright 2017 National Council on Compensation Insurance, Inc. All Rights Reserved.
WC Net Combined RatiosCalendar Year vs. Accident Year As Reported
Private Carriers
14
p PreliminarySource: NAIC’s Annual Statement dataAccident Year information is reported as of 12/31/2016Includes dividends to policyholders
94 9496
98
80
90
100
110
120
2007 2008 2009 2010 2011 2012 2013 2014 2015 2016p
Percent
Calendar Year
Accident Year

© Copyright 2017 National Council on Compensation Insurance, Inc. All Rights Reserved. 15
2010 and 2011 adjusted primarily for significant changes in audit activityp Preliminary based on data valued as of 12/31/2016Source: NCCI’s Financial Call data, developed to ultimate, premium adjusted to current wage and voluntary pure premium level, excludes high-deductible policies; based on data through 12/31/2015Values displayed reflect the methodology underlying the most recent rate/loss cost filingIncludes all states where NCCI provides ratemaking services; WV is excluded through 2011
-4.6-4
-10
-5
0
5
95 96 97 98 99 00 01 02 03 04 05 06 07 08 09 10 11 12 13 14 15 16p
Percent
Accident Year
Average Annual Change: –3.6%(1995–2015)
WC Lost-Time Claim FrequencyChange in Lost-Time Claims per $1M Pure Premium
Private Carriers and State Funds—NCCI States

© Copyright 2017 National Council on Compensation Insurance, Inc. All Rights Reserved.
WC Average Indemnity Claim SeverityPrivate Carriers and State Funds—NCCI States
16
p Preliminary based on data valued as of 12/31/2016Source: NCCI’s Financial Call data, developed to ultimate, excludes high-deductible policies; based on data through 12/31/2015Values displayed reflect the methodology underlying the most recent rate/loss cost filingIncludes all states where NCCI provides ratemaking services; WV is excluded through 2007
$2
3.2
$2
3.9
+0.9%+3%
5
10
15
20
25
95 96 97 98 99 00 01 02 03 04 05 06 07 08 09 10 11 12 13 14 15 16p
Severity ($ Thousands)
Accident Year

© Copyright 2017 National Council on Compensation Insurance, Inc. All Rights Reserved.
Relative Growth Rates—Indemnity Severity vs. Wage Inflation
Private Carriers and State Funds—NCCI States
17
p Preliminary based on data valued as of 12/31/2016Sources: Severity: NCCI’s Financial Call data, developed to ultimate, excludes high-deductible policies; based on data through 12/31/2015Values displayed reflect the methodology underlying the most recent rate/loss cost filingIncludes all states where NCCI provides ratemaking services; WV is excluded through 2007US Average Weekly Wage: 1995–2007 and 2012–2015, Quarterly Census of Employment and Wages; 2008–2011, NCCI; 2016p, NCCI and Moody’s Analytics
Change inIndemnity Severity in Excess of Wage Inflation
Change in Wage Inflation
Change in OverallIndemnity Severity
1995 to 2001 2009 to 2016p2002 to 2008
+32%
+33%
+25%
+9%
+19%
-12%
+65%
+34%
+7%

© Copyright 2017 National Council on Compensation Insurance, Inc. All Rights Reserved.
WC Average Medical Lost-Time Claim SeverityPrivate Carriers and State Funds—NCCI States
18
p Preliminary based on data valued as of 12/31/2016Source: NCCI’s Financial Call data, developed to ultimate, excludes high-deductible policies; based on data through 12/31/2015Values displayed reflect the methodology underlying the most recent rate/loss cost filingIncludes all states where NCCI provides ratemaking services; WV is excluded through 2007
$2
7.7
$2
9.1
-1.4%+5%
5
10
15
20
25
30
35
95 96 97 98 99 00 01 02 03 04 05 06 07 08 09 10 11 12 13 14 15 16p
Severity ($ Thousands)
Accident Year
© Copyright 2017 National Council on Compensation Insurance, Inc. All Rights Reserved.
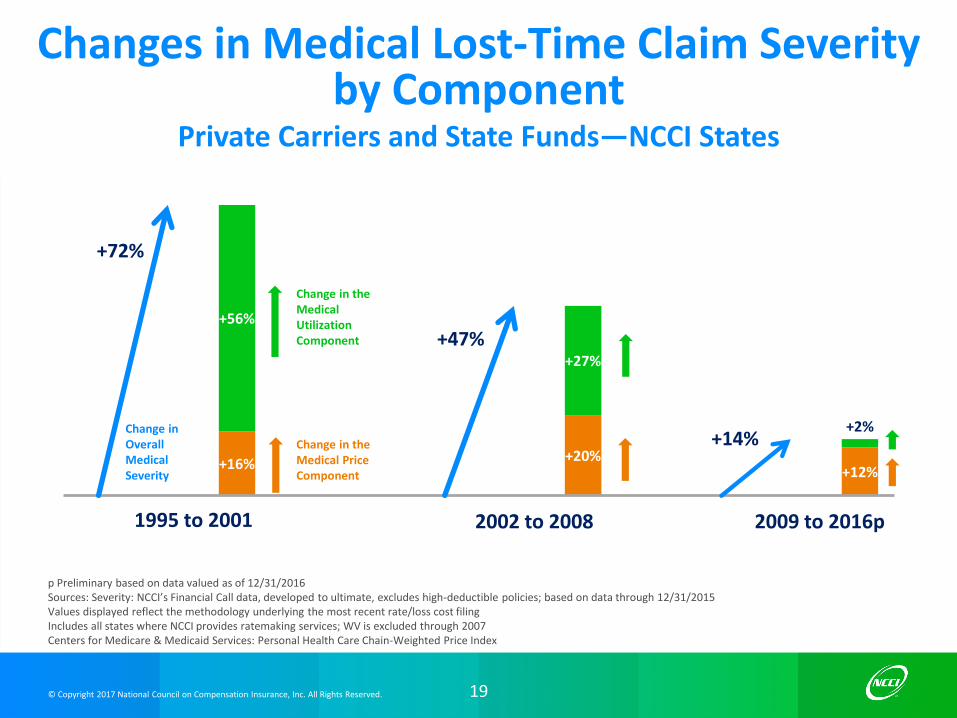
Changes in Medical Lost-Time Claim Severity by Component
Private Carriers and State Funds—NCCI States
19
p Preliminary based on data valued as of 12/31/2016Sources: Severity: NCCI’s Financial Call data, developed to ultimate, excludes high-deductible policies; based on data through 12/31/2015Values displayed reflect the methodology underlying the most recent rate/loss cost filingIncludes all states where NCCI provides ratemaking services; WV is excluded through 2007Centers for Medicare & Medicaid Services: Personal Health Care Chain-Weighted Price Index
Change in theMedical UtilizationComponent
Change in the Medical Price Component
Change in OverallMedical Severity
1995 to 2001 2009 to 2016p2002 to 2008
+16%
+56%
+20%
+27%
+12%
+2%
+72%
+47%
+14%
© Copyright 2017 National Council on Compensation Insurance, Inc. All Rights Reserved.
New Mexico’s Workers Compensation System

© Copyright 2017 National Council on Compensation Insurance, Inc. All Rights Reserved.
New Mexico’sWorkers Compensation System—
An Overview
Premium volume declined for the
first time in several years
Combined ratios have been
stable in the recent past
Lost-time claim frequency
decreased again
Indemnity and medical severity decreased in the
latest year
21

22© Copyright 2017 National Council on Compensation Insurance, Inc. All Rights Reserved.
280.4261.5
231.9217.6
230.7
251.7
272.8291.4 296.1
269.1
2007 2008 2009 2010 2011 2012 2013 2014 2015 2016
Source: NAIC’s Annual Statement data
Calendar Year
New Mexico Workers CompensationPremium Volume
Direct Written Premium in $ Millions

© Copyright 2017 National Council on Compensation Insurance, Inc. All Rights Reserved.
New Mexico Accident Year Combined Ratios by Component
Sources: NCCI’s financial data through 12/31/2016 and NAIC’s Annual Statement data
73%
55% 53% 49% 49%
39%
37% 36%35% 36%
0%
0% 0%0% 0%
113%
92% 89%84% 85%
2012 2013 2014 2015 2016
Loss Ratio Expense Ratio Dividend Ratio
Accident Year
23
24© Copyright 2017 National Council on Compensation Insurance, Inc. All Rights Reserved.
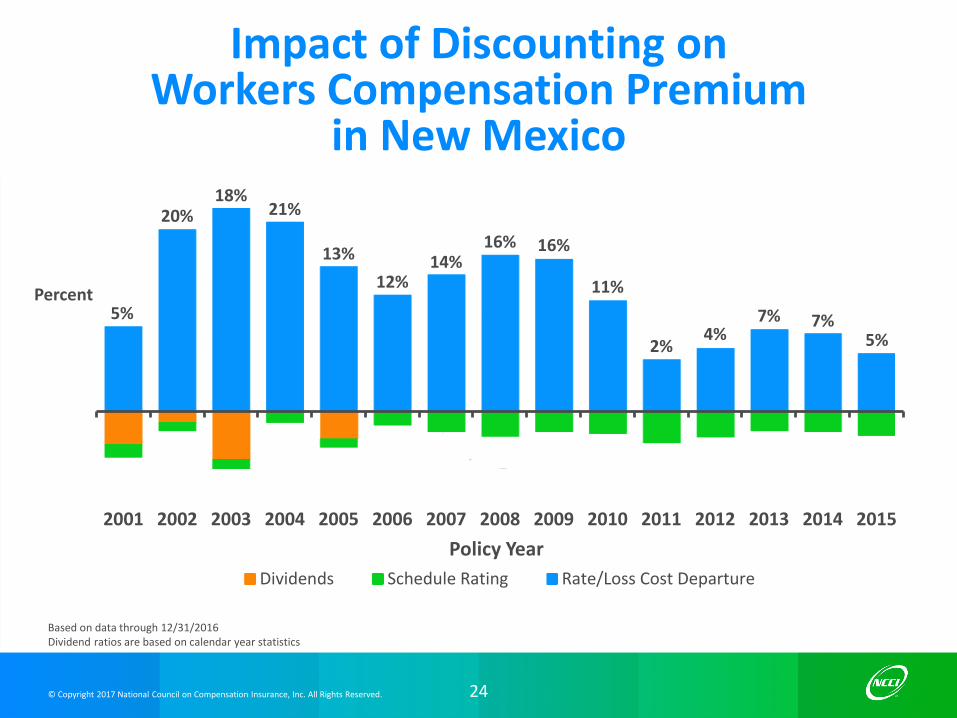
Impact of Discounting onWorkers Compensation Premium
in New Mexico
5%
20%18%
21%
13%
12%14%
16% 16%
11%
2%4%
7% 7%5%
2001 2002 2003 2004 2005 2006 2007 2008 2009 2010 2011 2012 2013 2014 2015
Policy Year
Dividends Schedule Rating Rate/Loss Cost Departure
Based on data through 12/31/2016Dividend ratios are based on calendar year statistics
Percent
© Copyright 2017 National Council on Compensation Insurance, Inc. All Rights Reserved.
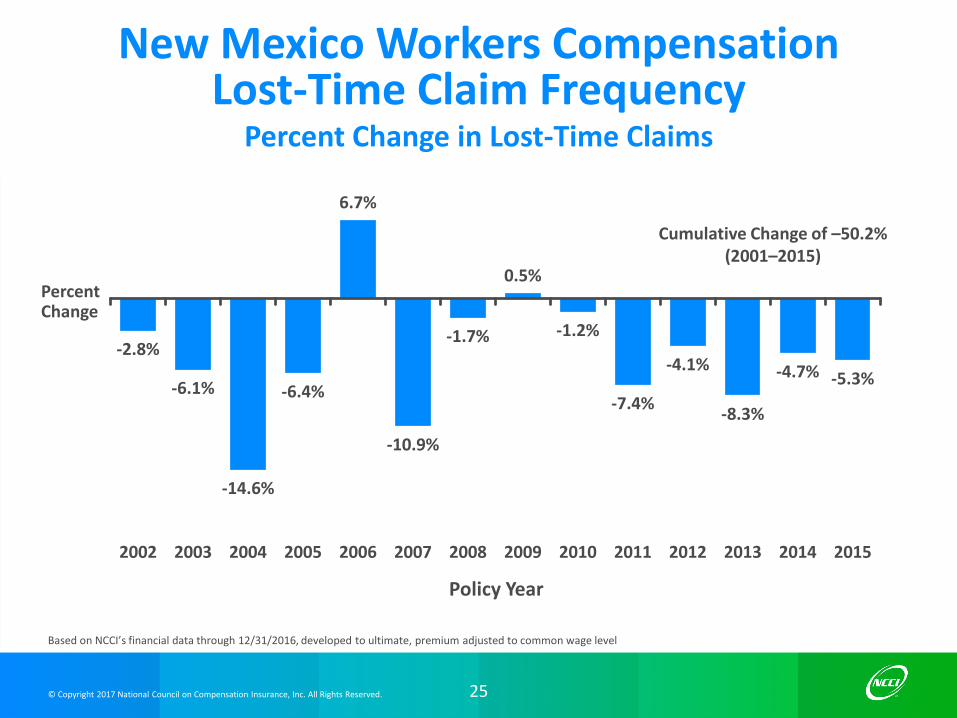
New Mexico Workers Compensation Lost-Time Claim Frequency
Percent Change in Lost-Time Claims
Based on NCCI’s financial data through 12/31/2016, developed to ultimate, premium adjusted to common wage level
-2.8%
-6.1%
-14.6%
-6.4%
6.7%
-10.9%
-1.7%
0.5%
-1.2%
-7.4%
-4.1%
-8.3%
-4.7% -5.3%
2002 2003 2004 2005 2006 2007 2008 2009 2010 2011 2012 2013 2014 2015
Cumulative Change of –50.2%(2001–2015)
PercentChange
Policy Year
25
26© Copyright 2017 National Council on Compensation Insurance, Inc. All Rights Reserved.
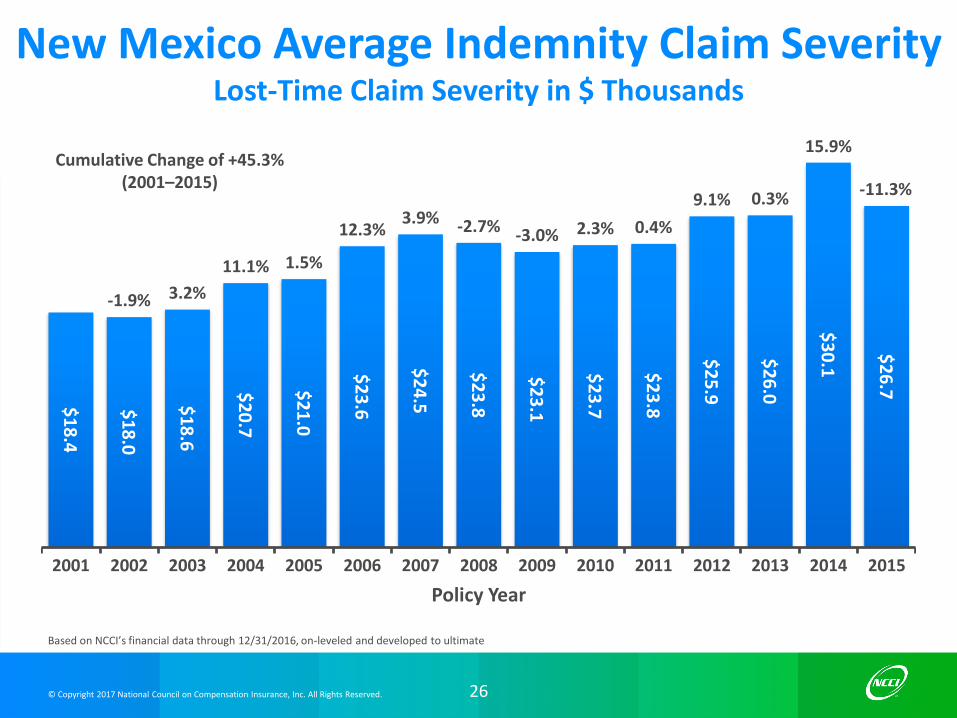
$1
8.4
$1
8.0
$1
8.6
$2
0.7
$2
1.0
$2
3.6
$2
4.5
$2
3.8
$2
3.1
$2
3.7
$2
3.8
$2
5.9
$2
6.0
$3
0.1
$2
6.7
-1.9% 3.2%
11.1% 1.5%
12.3%3.9% -2.7% -3.0% 2.3% 0.4%
9.1% 0.3%
15.9%
-11.3%
2001 2002 2003 2004 2005 2006 2007 2008 2009 2010 2011 2012 2013 2014 2015
Policy Year
New Mexico Average Indemnity Claim SeverityLost-Time Claim Severity in $ Thousands
Based on NCCI’s financial data through 12/31/2016, on-leveled and developed to ultimate
Cumulative Change of +45.3%(2001–2015)

27© Copyright 2017 National Council on Compensation Insurance, Inc. All Rights Reserved.
$2
6.1
$2
3.7
$2
9.0
$3
0.4
$3
2.4
$3
3.4
$3
6.6
$3
6.5
$3
7.5
$3
7.9
$3
7.4
$4
0.8
$3
6.7
$4
1.3
$3
7.9
-9.1%
22.2%4.9%
6.5%3.2%
9.6% -0.3% 2.7% 1.2% -1.4%
9.1%
-10.0%
12.3%
-8.2%
2001 2002 2003 2004 2005 2006 2007 2008 2009 2010 2011 2012 2013 2014 2015
Policy Year
New Mexico Average Medical Claim SeverityLost-Time Claim Severity in $ Thousands
Based on NCCI’s financial data through 12/31/2016, on-leveled and developed to ultimate
Cumulative Change of +45.2%(2001–2015)
28© Copyright 2017 National Council on Compensation Insurance, Inc. All Rights Reserved.
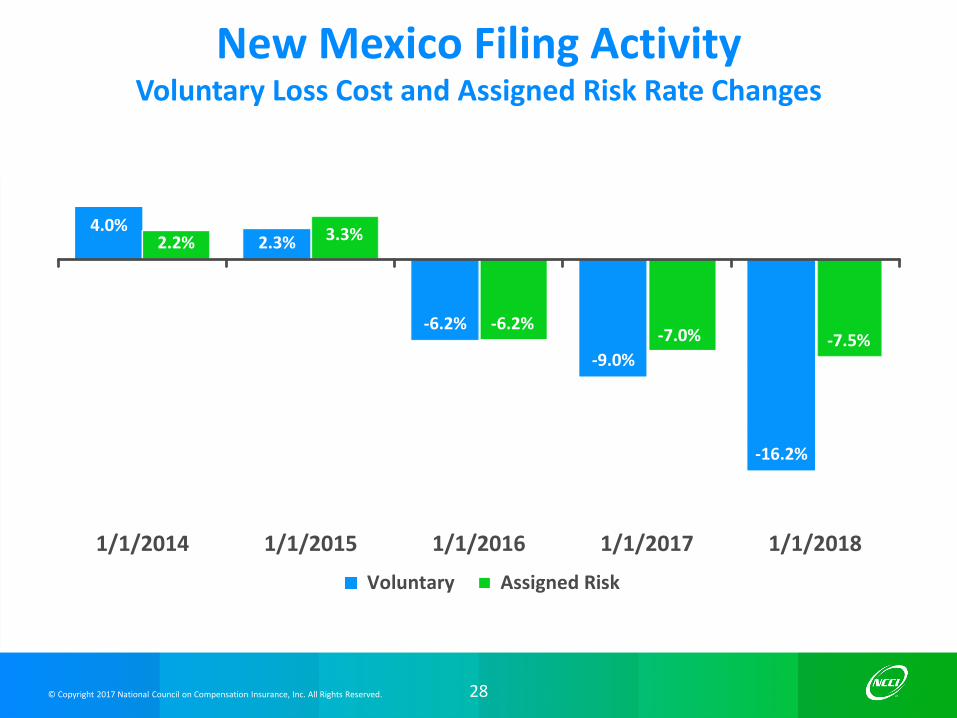
4.0%2.3%
-6.2%
-9.0%
-16.2%
2.2% 3.3%
-6.2%-7.0% -7.5%
1/1/2014 1/1/2015 1/1/2016 1/1/2017 1/1/2018
Voluntary Assigned Risk
New Mexico Filing Activity Voluntary Loss Cost and Assigned Risk Rate Changes
© Copyright 2017 National Council on Compensation Insurance, Inc. All Rights Reserved.
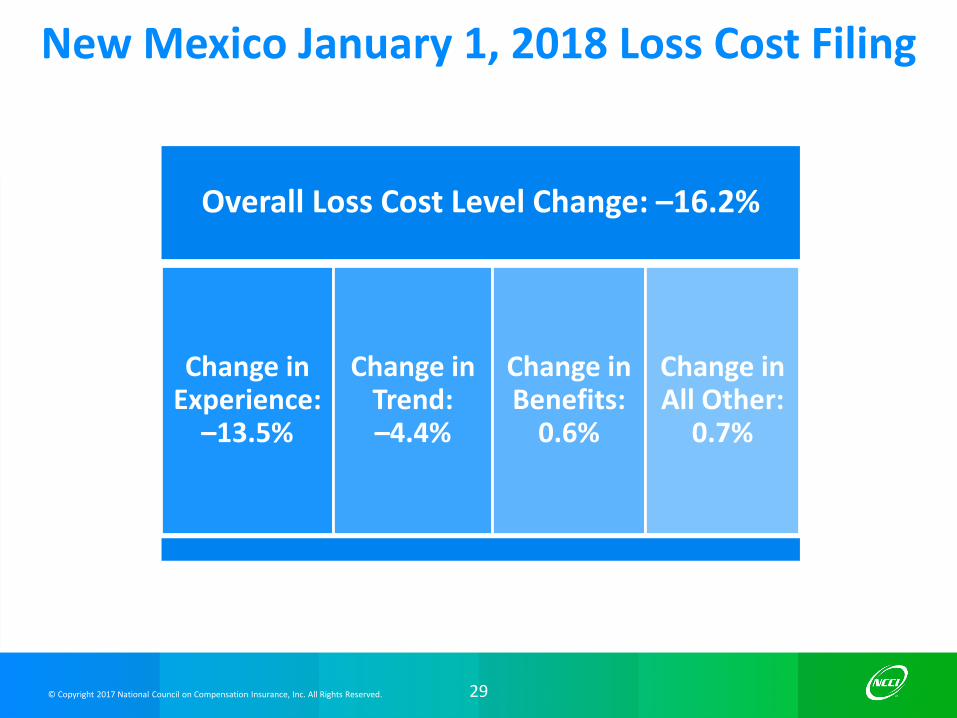
New Mexico January 1, 2018 Loss Cost Filing
Overall Loss Cost Level Change: –16.2%
Change in Experience:
–13.5%
Change in Trend: –4.4%
Change in Benefits:
0.6%
Change in All Other:
0.7%
29
© Copyright 2017 National Council on Compensation Insurance, Inc. All Rights Reserved.
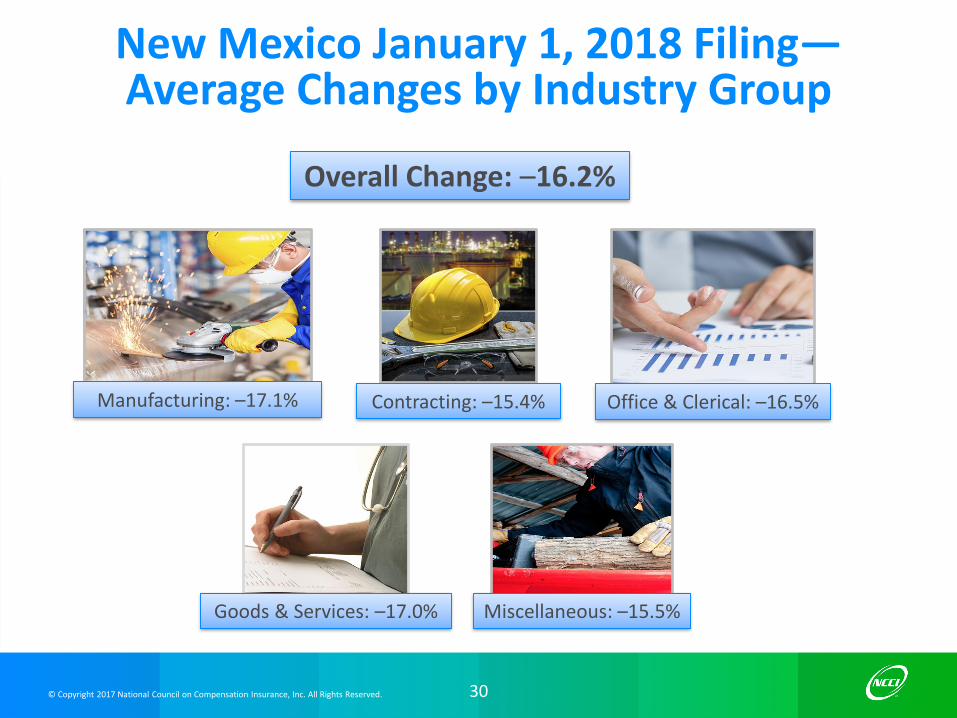
New Mexico January 1, 2018 Filing—Average Changes by Industry Group
Manufacturing: –17.1%
Miscellaneous: –15.5%
Office & Clerical: –16.5%Contracting: –15.4%
Overall Change: –16.2%
Goods & Services: –17.0%
30
31© Copyright 2017 National Council on Compensation Insurance, Inc. All Rights Reserved.
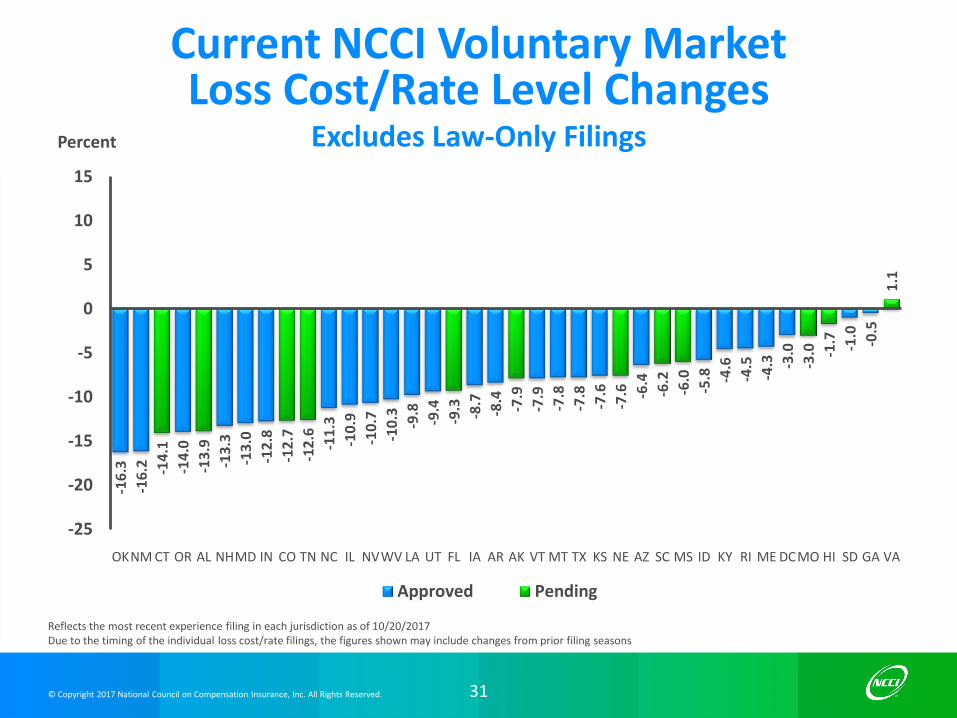
Current NCCI Voluntary Market Loss Cost/Rate Level Changes
Excludes Law-Only Filings-1
6.3
-16
.2 -14
.0
-13
.3
-13
.0
-12
.8
-11
.3
-10
.9
-10
.7
-10
.3
-9.8
-9.4 -8.7
-8.4
-7.9
-7.8
-7.8
-7.6 -6
.4 -5.8 -4
.6
-4.5
-4.3 -3
.0 -1.0
-0.5
-14
.1
-13
.9
-12
.7
-12
.6
-9.3 -7
.9
-7.6 -6
.2
-6.0
-3.0 -1
.7
1.1
-25
-20
-15
-10
-5
0
5
10
15
OKNM CT OR AL NHMD IN CO TN NC IL NVWV LA UT FL IA AR AK VT MT TX KS NE AZ SC MS ID KY RI ME DCMO HI SD GA VA
Approved Pending
Reflects the most recent experience filing in each jurisdiction as of 10/20/2017 Due to the timing of the individual loss cost/rate filings, the figures shown may include changes from prior filing seasons
Percent

© Copyright 2017 National Council on Compensation Insurance, Inc. All Rights Reserved.
Current Voluntary Market Rates/Loss CostsWestern NAIC Zone
Hawaii* 1/1/18 –1.7%
Idaho 1/1/18 –5.8%
Arizona 1/1/18 –6.4%
Montana 7/1/17 –7.8%
Texas 7/1/17 –7.8%
Alaska* 1/1/18 –7.9%
Utah 12/1/17 –9.4%
Nevada 3/1/17 –10.7%
Colorado* 1/1/18 –12.7%
Oregon 1/1/18 –14.0%
New Mexico 1/1/18 –16.2%
32
*Pending
33© Copyright 2017 National Council on Compensation Insurance, Inc. All Rights Reserved.
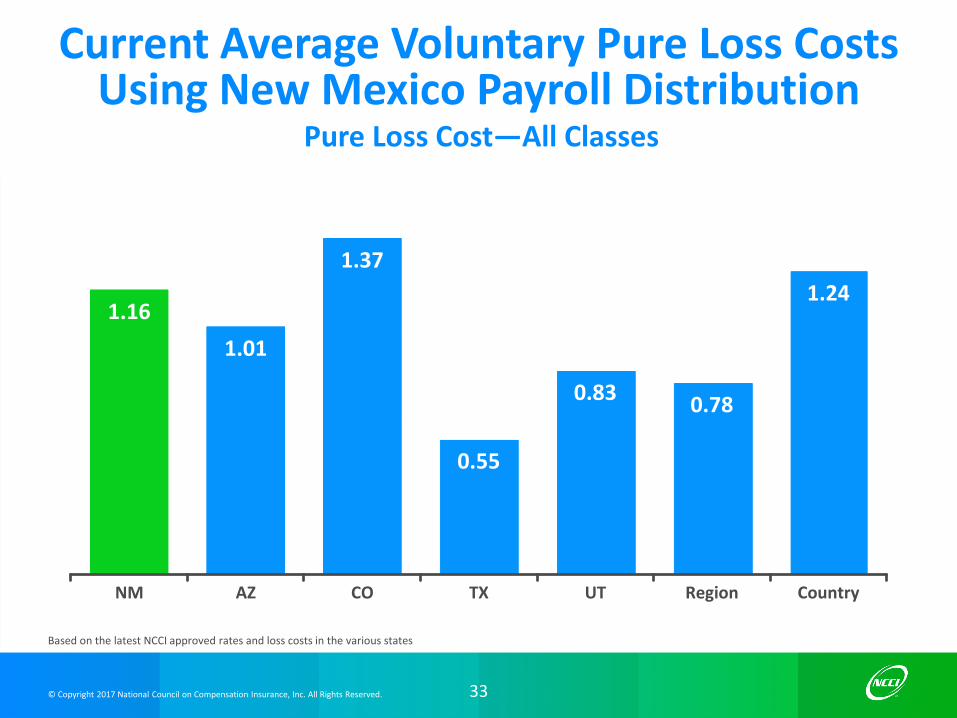
1.16
1.01
1.37
0.55
0.830.78
1.24
NM AZ CO TX UT Region Country
Current Average Voluntary Pure Loss Costs Using New Mexico Payroll Distribution
Pure Loss Cost—All Classes
Based on the latest NCCI approved rates and loss costs in the various states

© Copyright 2017 National Council on Compensation Insurance, Inc. All Rights Reserved.
A Cautionary Tale:The Danger of Comparing Average Loss Costs Across States
© Copyright 2017 National Council on Compensation Insurance, Inc. All Rights Reserved.
Countrywide and New Mexico Labor Markets

© Copyright 2017 National Council on Compensation Insurance, Inc. All Rights Reserved.
National Economic Highlights and Their Impacton Workers Compensation
36
National Economic IndicatorPotential Impact on the Workers Compensation Market
Private employment growth is expected to continue to slow
The impact on payroll and premium will also slow
Wage growth is poised to accelerate Upward pressure on payroll and premium as well as indemnity severity
Medical inflation is forecasted to slowand then reaccelerate
Increases in medical costs per claim
Interest rates are still low but expectedto increase
Investment income will likely remain muted this year but increase as interest rates rise

© Copyright 2017 National Council on Compensation Insurance, Inc. All Rights Reserved.
Change in Private EmploymentPrivate Employment Growth Is Below Average
Year-on-year percentage change; employment is for Total Private IndustryFrequency of observation: quarterly; latest available data point: 2017 Q1 Sources: US Bureau of Labor Statistics, Moody’s Analytics, and NCCI
2.0
0.5
1.0
2.5
2.1
1.7
0
1
2
3
2015Q1 2016Q1 2017Q1
New Mexico United States
Percent
37

© Copyright 2017 National Council on Compensation Insurance, Inc. All Rights Reserved.
Change in Average Weekly WagesWage Growth Is Below the Rest of the Nation
Year-on-year percentage change; wages are for Total Private IndustryFrequency of observation: quarterly; latest available data point: 2017 Q1Sources: US Bureau of Labor Statistics, Bureau of Economic Analysis, Moody’s Analytics, and NCCI
1.2
0.3
1.1
2.42.3
2.1
0
1
2
3
2015Q1 2016Q1 2017Q1
New Mexico United States
Percent
38
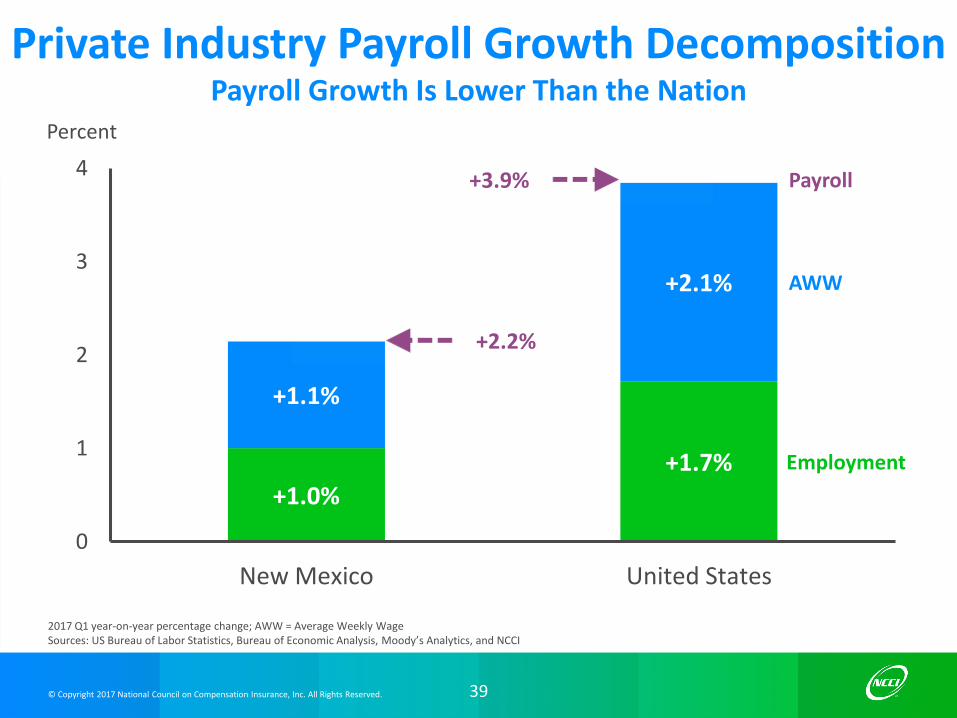
© Copyright 2017 National Council on Compensation Insurance, Inc. All Rights Reserved. 39
2017 Q1 year-on-year percentage change; AWW = Average Weekly WageSources: US Bureau of Labor Statistics, Bureau of Economic Analysis, Moody’s Analytics, and NCCI
+1.0%
+1.7%
+1.1%
+2.1%
+2.2%
+3.9%
Employment
AWW
Payroll
0
1
2
3
4
New Mexico United States
Percent
Private Industry Payroll Growth DecompositionPayroll Growth Is Lower Than the Nation

© Copyright 2017 National Council on Compensation Insurance, Inc. All Rights Reserved. 40
Employment numbers are rounded to the nearest hundredYear-on-year percentage change; frequency of observation: quarterly; latest available data point: 2017 Q1 Sources: US Bureau of Labor Statistics, Moody’s Analytics, and NCCI
NM +2.5 140,600 17 +3,400US +2.4
NM +3.4 98,100 12 +3,200US +1.9
NM +1.4 101,600 12 +1,300US +3.1
NM +2.6 30,000 4 +800US +1.0
NM +1.6 45,000 5 +700US +2.8
NM +4.4 12,700 2 +500US –0.9
NM +0.1 33,500 4 +0US +2.2
NM –0.1 138,800 17 –200US +1.0
NM –0.4 190,800 23 –800US +0.8
NM –3.5 26,400 3 –900US +0.0
NM –9.9 21,900 3 –2,400US –2.1
Natural resources and mining
Industrial Sector
Education and health services
Leisure and hospitality
Professional and business services
Other services
Manufacturing
Financial activities
Trade, transportation, and utilities
Government
Construction
Information
1-Year
ChangeYear-Over-Year Percent Change, 2017Q1
Sector
Size
%
Share
Change in Employment by IndustryEmployment in Several Industries Has Increased in the Past Year

© Copyright 2017 National Council on Compensation Insurance, Inc. All Rights Reserved.
–10% 0 +10%
Payroll Growth
–10% 0 +10%
AWW Growth
New Mexico’s Payroll Growth Decomposition by Sector
–10% 0 +10%
Government
Professional and business services
Education and health services
Trade, transportation, and utilities
Construction
Leisure and hospitality
Financial activities
Natural resources and mining
Manufacturing
Other services
Information
Employment Growth
41
2017 Q1 year-on-year percentage change; AWW = Average Weekly Wage; sectors are in descending order by the volume of state payroll amountsSources: US Bureau of Labor Statistics, Bureau of Economic Analysis, Moody’s Analytics, and NCCI
≈+
© Copyright 2017 National Council on Compensation Insurance, Inc. All Rights Reserved.
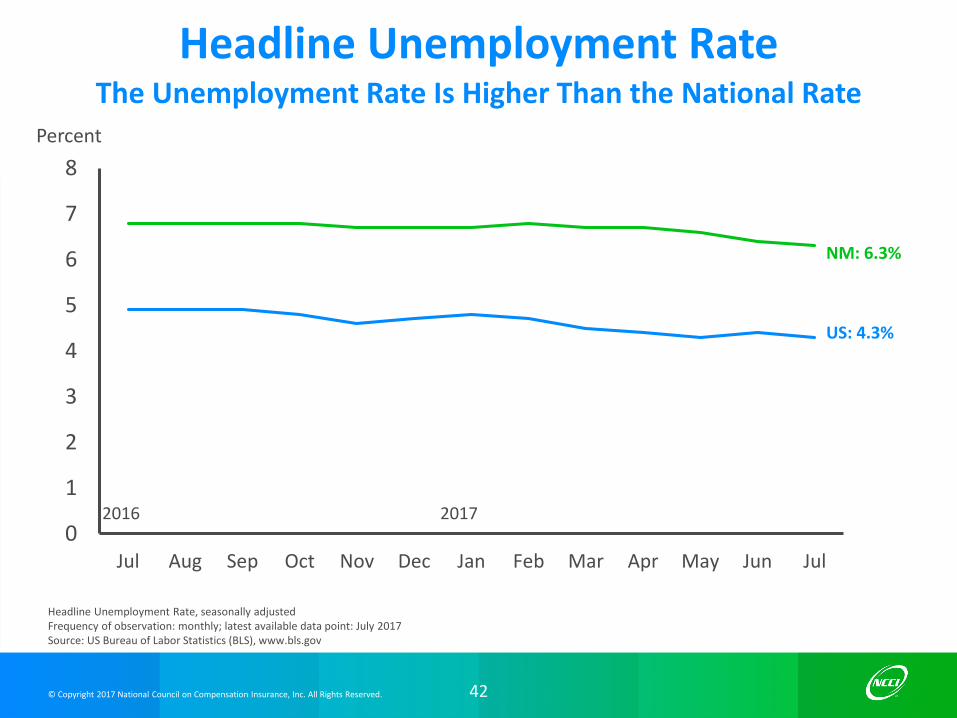
Headline Unemployment RateThe Unemployment Rate Is Higher Than the National Rate
42
Headline Unemployment Rate, seasonally adjusted Frequency of observation: monthly; latest available data point: July 2017Source: US Bureau of Labor Statistics (BLS), www.bls.gov
US: 4.3%
NM: 6.3%
0
1
2
3
4
5
6
7
8
Jul Aug Sep Oct Nov Dec Jan Feb Mar Apr May Jun Jul
2016 2017
Percent
© Copyright 2017 National Council on Compensation Insurance, Inc. All Rights Reserved.
New Mexico’s Labor Market
▪ New Mexico’s unemployment rate is above the US rate
▪ Payroll growth in New Mexico is lower than the nation, driven by below-average growth in both employment and average weekly wages
▪ Payroll has grown in all but two sectors
▪ The Information sector posted the fastest growth, driven by strong gains in both average weekly wages and employment
▪ Average weekly wages have declined in four sectors
▪ Employment growth is below the US rate
▪ Both the Education and Health Services and the Leisure and Hospitality sectors added a large number of jobs
▪ Natural Resources and Mining experienced a severe decline
▪ Three other sectors also experienced declines in employment
43

© Copyright 2017 National Council on Compensation Insurance, Inc. All Rights Reserved.
Legislative Issues: Countrywide and New Mexico

© Copyright 2017 National Council on Compensation Insurance, Inc. All Rights Reserved.
2017 Countrywide Overview
Countrywide, legislative activity has increased over prior years both in volume and content.
Regulation changes so far concern medical cost management, claim handling, and effectuating enacted legislation.
Year to date, there has been about the same number of workers compensation-related cases at the state supreme court level as there were in 2016.
The 2016 general election resulted in a net gain for Republicans in state government, where they now control both chambers of the legislature and the governor’s office in 26 states.
45

© Copyright 2017 National Council on Compensation Insurance, Inc. All Rights Reserved.
2017 Workers Compensation Legislative Activity
46
As of 7/1/2017
0–10 Bills Introduced 11–20 Bills Introduced 21–30 Bills IntroducedMore Than 30 Bills
Introduced
CA
ORID
WA
MT
NV
AK
UT
AZ
CO
NM
WY
TX
OK
KS
NE
SD
ND
MN
IA
MO
AR
LA
IL
WI
MI
IN OH
MS AL GA
FL
TN
KY
SC
NC
VA
WV
PA
NY
NJ
ME
VT
NH
MD
DE
CTRI
DC
MA
HI
© Copyright 2017 National Council on Compensation Insurance, Inc. All Rights Reserved.
Key Workers Compensation-Related Themes in Introduced Legislation
▪ First Responder Presumptions
▪ Indemnity Benefits
▪ Medical Cost Management
▪ Definitions
47

© Copyright 2017 National Council on Compensation Insurance, Inc. All Rights Reserved.
Federal Emerging Issues
Regulation of Air Ambulance
Services
Sen. Jon Tester (MT) introduced legislation
to provide state authority
Federal Aviation Administration Reauthorization
Social Security Disability
Insurance (SSDI) Reform
SSDI Solutions Initiative
recommendations
Trump Administration SSDI
Reverse Offset Proposal
MedicareSet-Aside (MSA)
Reform
Legislation to be introduced to bring greater efficiency to
MSA Process
CongressionalBudget Office
scoring
48

© Copyright 2017 National Council on Compensation Insurance, Inc. All Rights Reserved.
Guest Speaker:Darin Childers, WCA Director
© Copyright 2017 National Council on Compensation Insurance, Inc. All Rights Reserved.
Emerging Issue:
The Legalization ofMarijuana and ItsImpact on Workers Compensation
© Copyright 2017 National Council on Compensation Insurance, Inc. All Rights Reserved.

© Copyright 2017 National Council on Compensation Insurance, Inc. All Rights Reserved.
State Activity
51
29 8Plus Washington, DC
have legalized medical marijuana
Plus Washington, DC have legalized recreational marijuana
Medical Marijuana Recreational Marijuana

© Copyright 2017 National Council on Compensation Insurance, Inc. All Rights Reserved. 52

© Copyright 2017 National Council on Compensation Insurance, Inc. All Rights Reserved.
Federal Activity
Marijuana is an illegal Schedule I drug
August 2016 Currently
Controlled Substances Act
Current Administration
Unclear as to what will happen
2017 and Beyond
Federal funds will not be used to prevent state implementation of medical marijuana laws
House Resolution 244
May 2017
Will not reclassify marijuana
US Drug Enforcement Administration
53
© Copyright 2017 National Council on Compensation Insurance, Inc. All Rights Reserved.
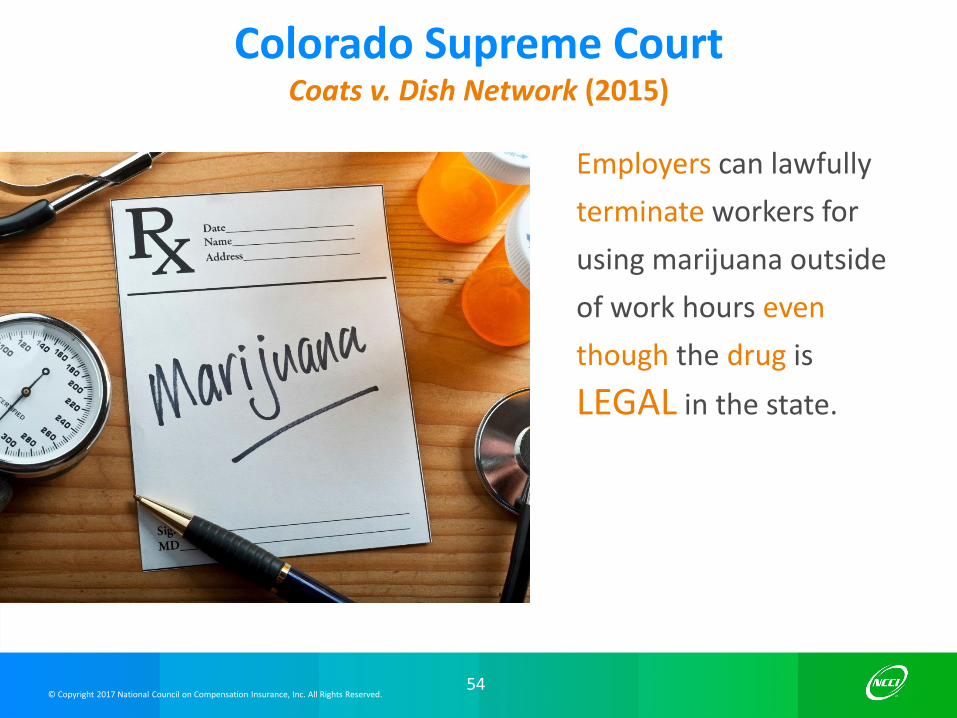
Employers can lawfully
terminate workers for
using marijuana outside
of work hours even
though the drug is
LEGAL in the state.
Colorado Supreme CourtCoats v. Dish Network (2015)
54
© Copyright 2017 National Council on Compensation Insurance, Inc. All Rights Reserved.
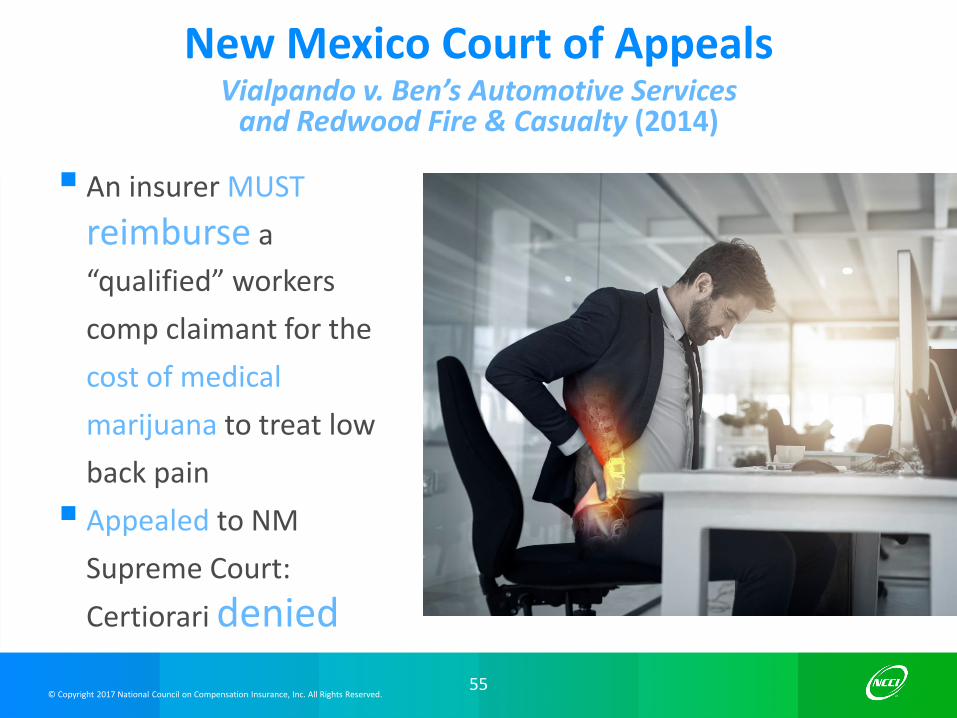
▪ An insurer MUST
reimburse a
“qualified” workers
comp claimant for the
cost of medical
marijuana to treat low
back pain
▪ Appealed to NM
Supreme Court:
Certiorari denied
New Mexico Court of AppealsVialpando v. Ben’s Automotive Services
and Redwood Fire & Casualty (2014)
55
© Copyright 2017 National Council on Compensation Insurance, Inc. All Rights Reserved.
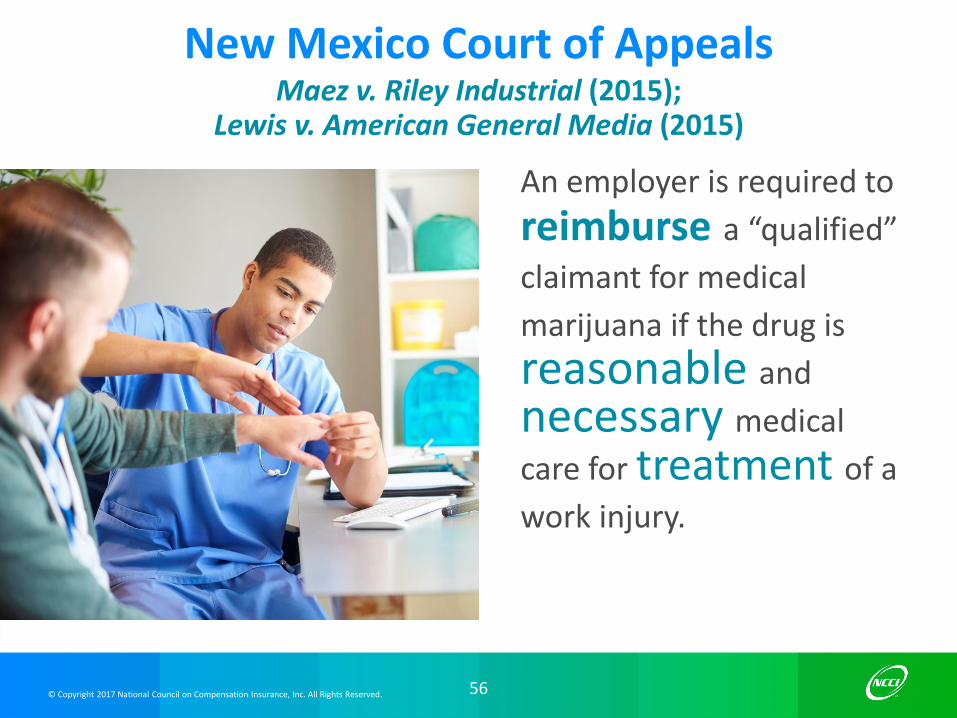
An employer is required to
reimburse a “qualified”
claimant for medical
marijuana if the drug is
reasonable and
necessary medical
care for treatment of a
work injury.
New Mexico Court of AppealsMaez v. Riley Industrial (2015);
Lewis v. American General Media (2015)
56

© Copyright 2017 National Council on Compensation Insurance, Inc. All Rights Reserved.
Upheld decision that the
claimant’s use of medical
marijuana for pain
management of his
“debilitating condition”
constitutes reasonable
and necessary medical
treatment
Connecticut Workers’ CompensationCommission Decision
Petrini v. Marcus Dairy, Inc. and Gallagher Bassett Service (2016)
57
© Copyright 2017 National Council on Compensation Insurance, Inc. All Rights Reserved.
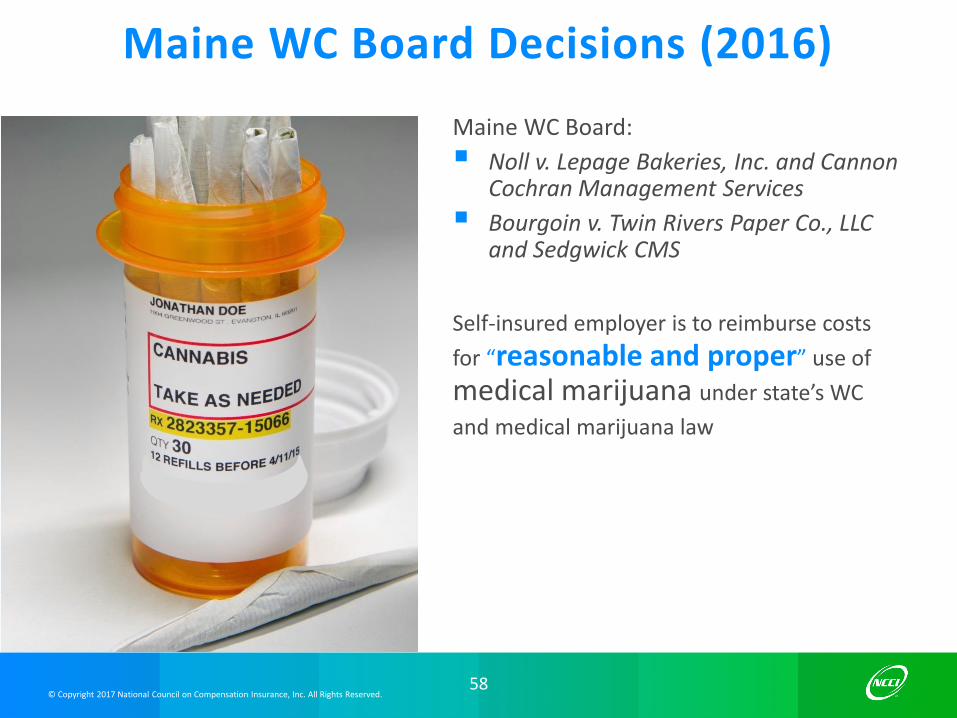
Maine WC Board:
▪ Noll v. Lepage Bakeries, Inc. and Cannon Cochran Management Services
▪ Bourgoin v. Twin Rivers Paper Co., LLC and Sedgwick CMS
Self-insured employer is to reimburse costs
for “reasonable and proper” use of
medical marijuana under state’s WC
and medical marijuana law
Maine WC Board Decisions (2016)58
58
© Copyright 2017 National Council on Compensation Insurance, Inc. All Rights Reserved.
Other Activity
▪ At least five states (Connecticut, Maine, Minnesota, New Jersey, and New Mexico) have allowed reimbursement for WC under certain circumstances
▪ Florida and North Dakota passed legislation in 2017 prohibiting payment of WC benefits for medical marijuana
▪ New Mexico
▪ Adopted a fee schedule to provide for reimbursement of medical marijuana to injured workers—effective January 1, 2016
▪ Introduced legislation (SB 371/HB 527) in 2017 requiring employers/carriers to pay for medical marijuana for injured workers—did not pass
59

© Copyright 2017 National Council on Compensation Insurance, Inc. All Rights Reserved.
▪ Is marijuana a safer alternative to opioids for pain management? Is it a less expensive alternative to other drugs?
▪When a state legalizes marijuana, what is the potential impact on neighboring states?
▪ Should states consider fee schedules for marijuana (like New Mexico)?
▪ How are appropriate dosage levels determined?
▪What is the impact on Medicare Set-Aside Allocations since marijuana is still illegal under federal law?
Questions Raised byWC Stakeholders
60

© Copyright 2017 National Council on Compensation Insurance, Inc. All Rights Reserved.
States are increasingly legalizing marijuana in some form for medical use.
Courts are increasingly dealing with contested cases of medical marijuana in the work environment.
Marijuana is still illegal under federal law and remains a Schedule I drug.
Legalization of Marijuana—Summary
61

© Copyright 2017 National Council on Compensation Insurance, Inc. All Rights Reserved.
62
62
© Copyright 2017 National Council on Compensation Insurance, Inc. All Rights Reserved.
Residual Market: Countrywide and New MexicoMary Fowler, NCCI

© Copyright 2017 National Council on Compensation Insurance, Inc. All Rights Reserved.
Where Does NCCI Provide Residual Market Services?
▪ As of January 2017, NCCI provides Plan Administration services in the following states:
▪ AK, AL, AR, AZ, CT, DC, GA, IA, ID, IL, KS, MS, NH, NM, NV, OR, SC, SD, TN, VA, VT, and WV
▪ Other Plan Services: DE, IN, and NC
▪ As of January 2017, NCCI provides Pool Administration services in the following states:
▪ National Pool: AK, AL, AR, AZ, CT, DC, DE, GA, IA, ID, IL, KS, NC, NH, NJ, NV, OR, SC, SD, TN, VA, VT, and WV
▪ New Mexico Pool
▪ Tennessee Reinsurance Mechanism
▪ Financial and Actuarial Services: MA and MI
64
© Copyright 2017 National Council on Compensation Insurance, Inc. All Rights Reserved.
Residual MarketVideo Excerpt
Jim Nau, General ManagerNCCI Residual Markets

© Copyright 2017 National Council on Compensation Insurance, Inc. All Rights Reserved.
New Mexico Total Residual Market Plan Estimated Premium Volume
Premium in $ Millions as of 12/31/2016
66
$13M
$8M
$6M $5M $6M
$9M
$16M $16M
$13M
$9M
$0M
$2M
$4M
$6M
$8M
$10M
$12M
$14M
$16M
$18M
2007 2008 2009 2010 2011 2012 2013 2014 2015 2016
Policy Year
$ Millions
© Copyright 2017 National Council on Compensation Insurance, Inc. All Rights Reserved.
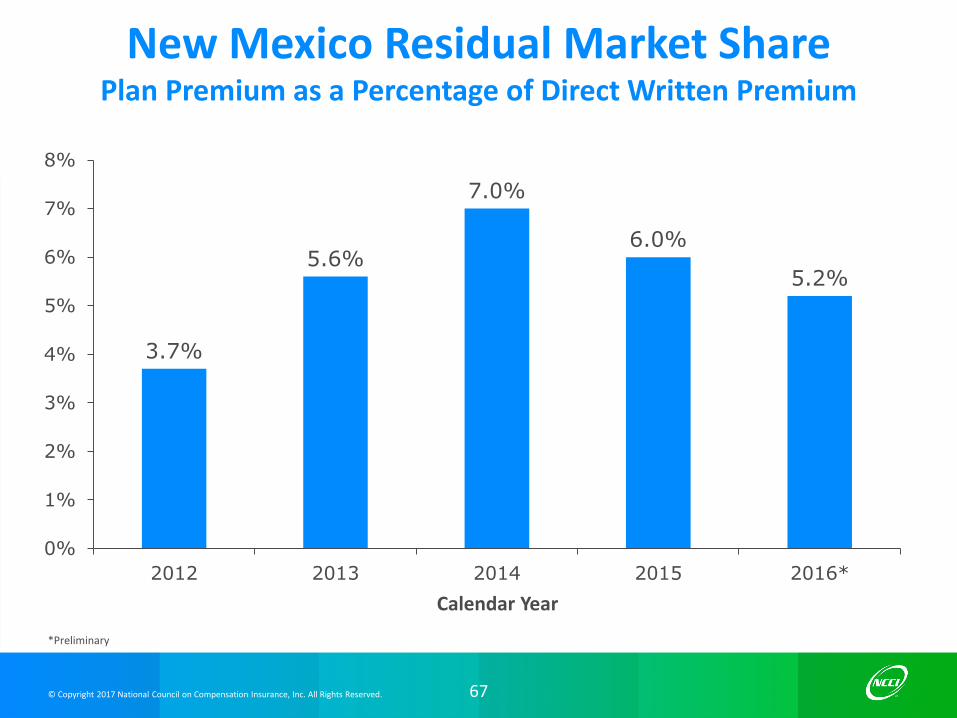
3.7%
5.6%
7.0%
6.0%
5.2%
0%
1%
2%
3%
4%
5%
6%
7%
8%
2012 2013 2014 2015 2016*
Calendar Year
New Mexico Residual Market SharePlan Premium as a Percentage of Direct Written Premium
67
*Preliminary

© Copyright 2017 National Council on Compensation Insurance, Inc. All Rights Reserved.
New Mexico Total Residual Market PlanPolicy Counts
As of 12/31/2016
68
3,521
2,818
2,392 2,221 2,135 2,210
2,657
3,018 2,923
2,558
-
500
1,000
1,500
2,000
2,500
3,000
3,500
4,000
2007 2008 2009 2010 2011 2012 2013 2014 2015 2016
Policy Year
© Copyright 2017 National Council on Compensation Insurance, Inc. All Rights Reserved.
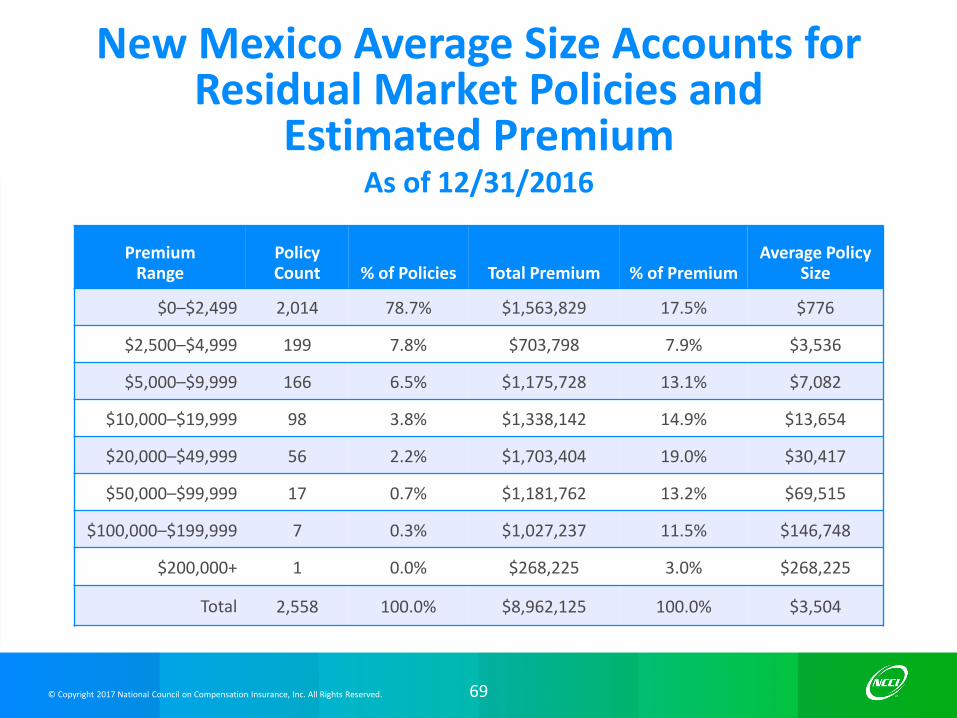
New Mexico Average Size Accounts forResidual Market Policies and
Estimated PremiumAs of 12/31/2016
69
PremiumRange
Policy Count % of Policies Total Premium % of Premium
Average Policy Size
$0–$2,499 2,014 78.7% $1,563,829 17.5% $776
$2,500–$4,999 199 7.8% $703,798 7.9% $3,536
$5,000–$9,999 166 6.5% $1,175,728 13.1% $7,082
$10,000–$19,999 98 3.8% $1,338,142 14.9% $13,654
$20,000–$49,999 56 2.2% $1,703,404 19.0% $30,417
$50,000–$99,999 17 0.7% $1,181,762 13.2% $69,515
$100,000–$199,999 7 0.3% $1,027,237 11.5% $146,748
$200,000+ 1 0.0% $268,225 3.0% $268,225
Total 2,558 100.0% $8,962,125 100.0% $3,504
© Copyright 2017 National Council on Compensation Insurance, Inc. All Rights Reserved.
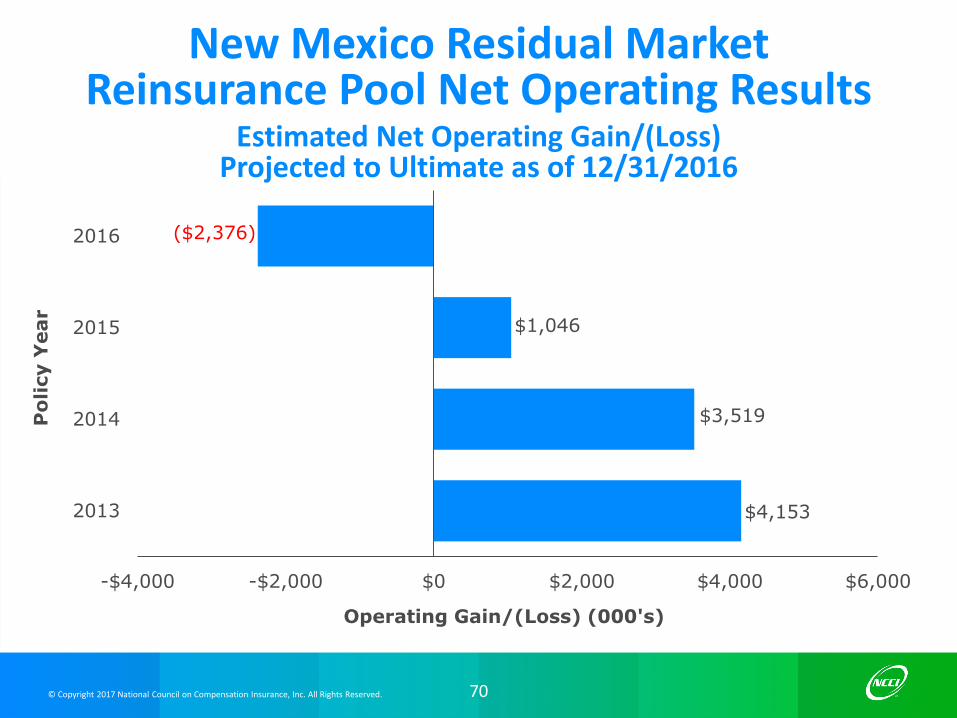
New Mexico Residual Market Reinsurance Pool Net Operating Results
Estimated Net Operating Gain/(Loss)Projected to Ultimate as of 12/31/2016
70
$4,153
$3,519
$1,046
($2,376)
-$4,000 -$2,000 $0 $2,000 $4,000 $6,000
2013
2014
2015
2016
Operating Gain/(Loss) (000's)
Po
licy Y
ear
© Copyright 2017 National Council on Compensation Insurance, Inc. All Rights Reserved.
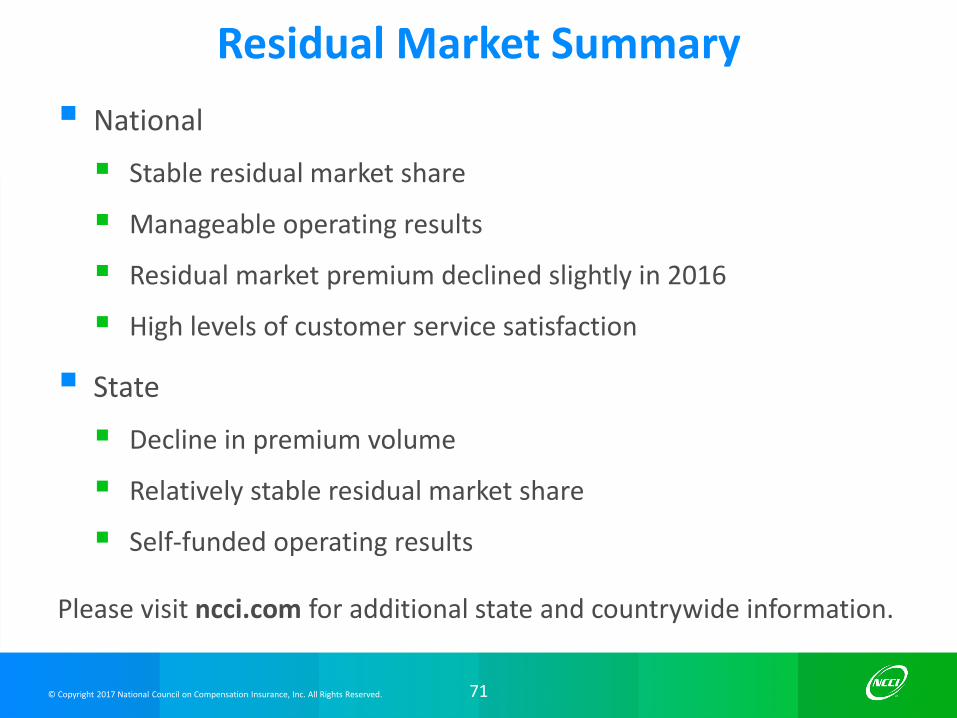
Residual Market Summary
▪ National
▪ Stable residual market share
▪ Manageable operating results
▪ Residual market premium declined slightly in 2016
▪ High levels of customer service satisfaction
▪ State
▪ Decline in premium volume
▪ Relatively stable residual market share
▪ Self-funded operating results
Please visit ncci.com for additional state and countrywide information.
71
© Copyright 2017 National Council on Compensation Insurance, Inc. All Rights Reserved.
Closing Remarks

© Copyright 2017 National Council on Compensation Insurance, Inc. All Rights Reserved.
Supplemental Information

© Copyright 2017 National Council on Compensation Insurance, Inc. All Rights Reserved.
Medical Benefits Constitute the Majority of Total Benefit Costs in New Mexico
Regional states are AZ, CO, TX, and UTBased on NCCI’s financial data
42%
38%
41%
58%
62%
59%
Indemnity Medical
74

75© Copyright 2017 National Council on Compensation Insurance, Inc. All Rights Reserved.
New Mexico Indemnity and MedicalLoss Ratios
0.48
0.35
0.73
0.50
0.10
0.20
0.30
0.40
0.50
0.60
0.70
0.80
0.90
1.00
2008 2009 2010 2011 2012 2013 2014 2015
Loss
Rat
io
Policy Year
Indemnity Medical
Based on NCCI’s financial data through 12/31/2016 at current benefit level and developed to ultimate
76© Copyright 2017 National Council on Compensation Insurance, Inc. All Rights Reserved.
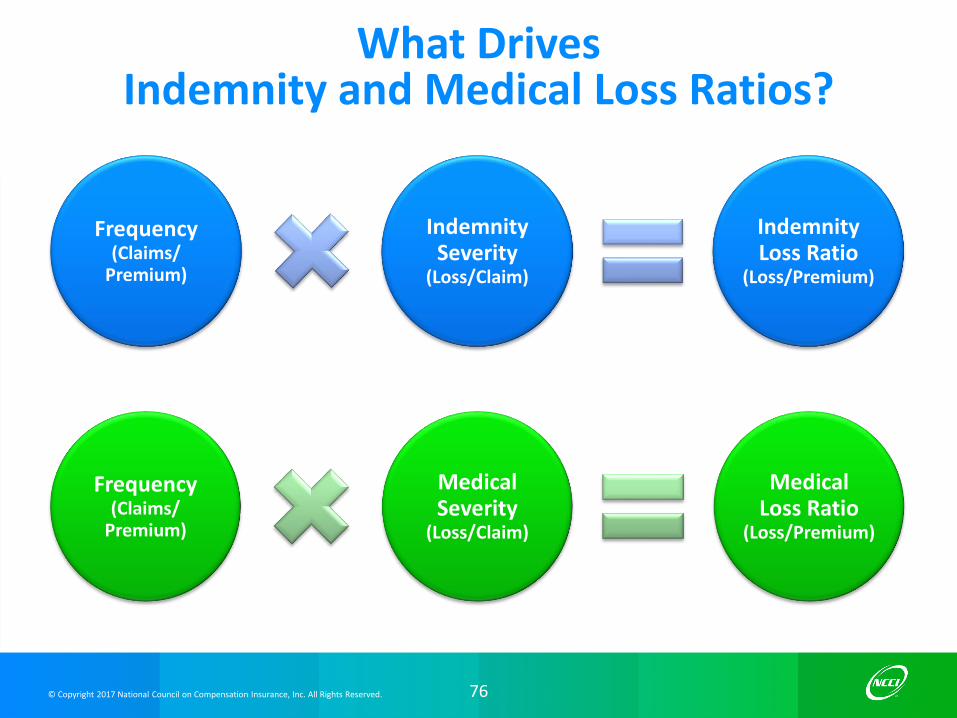
Frequency (Claims/
Premium)
Medical Severity
(Loss/Claim)
MedicalLoss Ratio
(Loss/Premium)
Frequency (Claims/
Premium)
Indemnity Severity
(Loss/Claim)
Indemnity Loss Ratio
(Loss/Premium)
What Drives Indemnity and Medical Loss Ratios?
77© Copyright 2017 National Council on Compensation Insurance, Inc. All Rights Reserved.
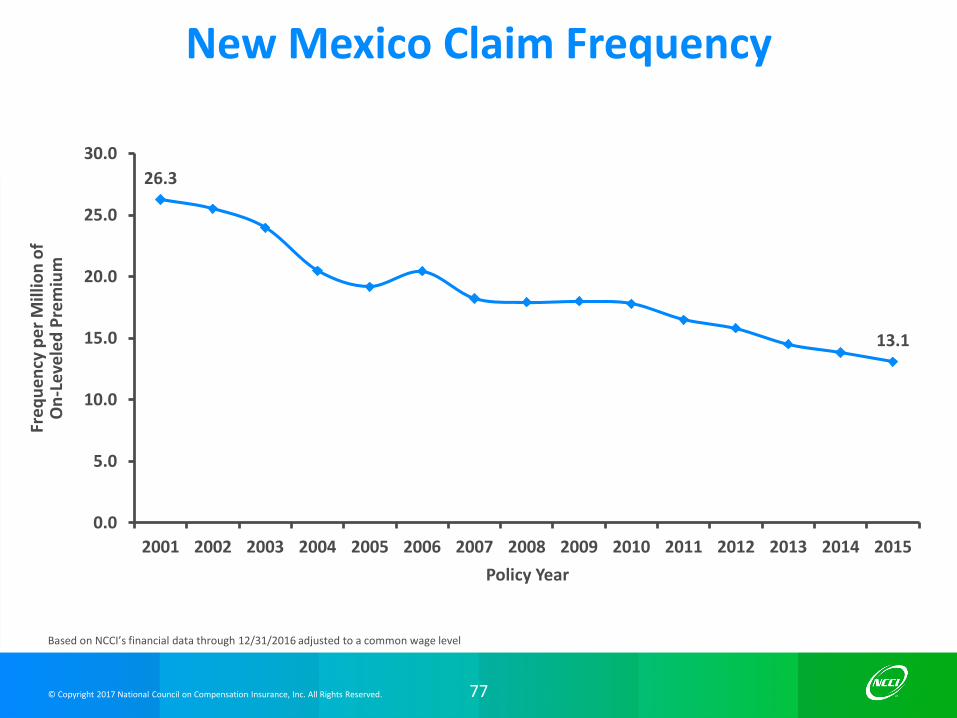
New Mexico Claim Frequency
Based on NCCI’s financial data through 12/31/2016 adjusted to a common wage level
26.3
13.1
0.0
5.0
10.0
15.0
20.0
25.0
30.0
2001 2002 2003 2004 2005 2006 2007 2008 2009 2010 2011 2012 2013 2014 2015
Fre
qu
en
cy p
er
Mill
ion
of
On
-Lev
ele
d P
rem
ium
Policy Year

© Copyright 2017 National Council on Compensation Insurance, Inc. All Rights Reserved.
New Mexico Average Indemnity Claim Severity
Based on NCCI’s financial data through 12/31/2016 for lost-time claims at current benefit level and developed to ultimate
27.2
18.4
26.7
0.0
5.0
10.0
15.0
20.0
25.0
30.0
35.0
2001 2002 2003 2004 2005 2006 2007 2008 2009 2010 2011 2012 2013 2014 2015
Ave
rage
Ind
em
nit
yC
laim
Sev
eri
ty (
$ '0
00
s)
Policy Year
Adjusted to Common Wage Level Actual
78

© Copyright 2017 National Council on Compensation Insurance, Inc. All Rights Reserved.
New Mexico Average Medical Claim Severity
Based on NCCI’s financial data through 12/31/2016 for lost-time claims at current benefit level and developed to ultimate
38.6
26.1
37.9
15.0
20.0
25.0
30.0
35.0
40.0
45.0
50.0
2001 2002 2003 2004 2005 2006 2007 2008 2009 2010 2011 2012 2013 2014 2015
Ave
rage
Me
dic
alC
laim
Sev
eri
ty (
$ '0
00
s)
Policy Year
Adjusted to Common Wage Level Actual
79

80© Copyright 2017 National Council on Compensation Insurance, Inc. All Rights Reserved.
Current Average Voluntary Pure Loss Costs Using New Mexico’s Payroll Distribution
Based on the latest NCCI approved rates and loss costs in the various states
1.16
0.00
1.00
2.00
3.00
TX AR
WV
UT IN KS
OR
DC
AZ
NV
TN MS
NM SD OK
MD
NC
VA
MO HI
ID NE
NH AL
CO KY
LA IA FL RI
SC ME
GA
MT
AK IL VT
CT
CW
Pu
re L
oss
Co
sts—
All
Cla
sse
s
State

81© Copyright 2017 National Council on Compensation Insurance, Inc. All Rights Reserved.
New Mexico Average Claim FrequencyFrequency per 100,000 Workers—All Claims
Based on NCCI’s Statistical Plan data
Total 3,347
Total 3,499
Total 4,183
Total 2,338
Total 3,764
770
593
945
604
630
2,577
2,906
3,238
1,734
3,134
0 500 1000 1500 2000 2500 3000 3500 4000 4500
NM
AZ
CO
TX
UT
Lost Time Medical Only

82© Copyright 2017 National Council on Compensation Insurance, Inc. All Rights Reserved.
30.4
19.1
24.4
20.6
14.5
26.7
19.221.0
19.8
14.3
NM AZ CO TX UT
PY 2014 PY 2015
Average Indemnity Claim Severityin the Region
Lost-Time Claim Severity in $ Thousands
Based on NCCI’s financial data for lost-time claims at current benefit level and developed to ultimate
83© Copyright 2017 National Council on Compensation Insurance, Inc. All Rights Reserved.
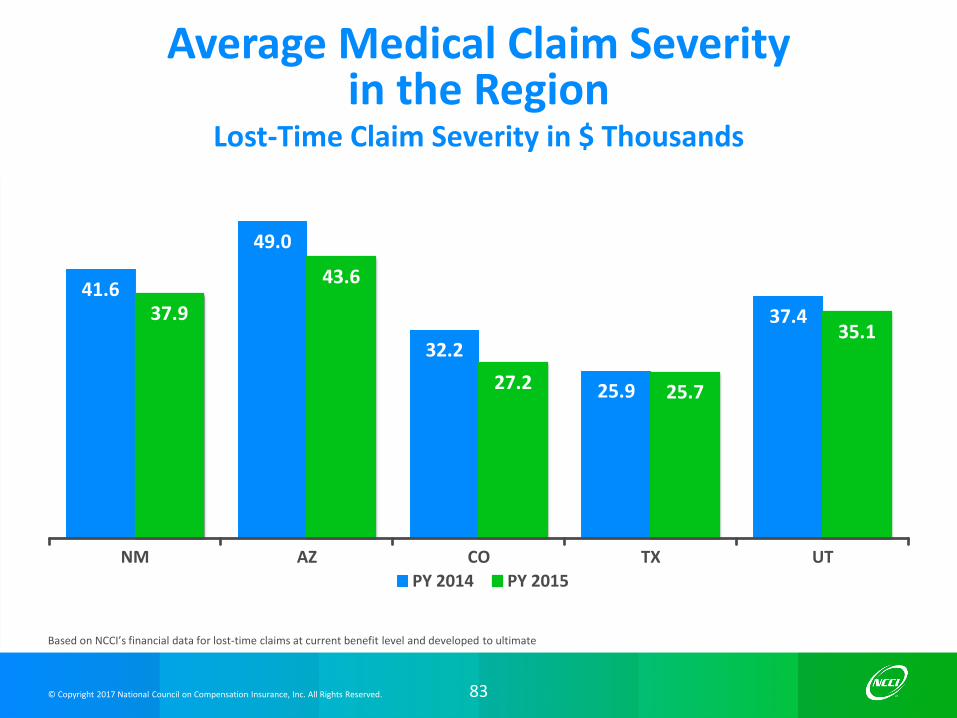
41.6
49.0
32.2
25.9
37.437.9
43.6
27.2 25.7
35.1
NM AZ CO TX UT
PY 2014 PY 2015
Average Medical Claim Severityin the Region
Lost-Time Claim Severity in $ Thousands
Based on NCCI’s financial data for lost-time claims at current benefit level and developed to ultimate

84© Copyright 2017 National Council on Compensation Insurance, Inc. All Rights Reserved.
New Mexico Distribution of Claimsby Injury Type
Regional states are AZ, CO, TX, and UTBased on NCCI’s Statistical Plan data for jurisdiction/claim type combinations for which three or more cases exist
75%
78%
78%
15%
14%
13%
10%
8%
9%
0%
0%
0%
0% 10% 20% 30% 40% 50% 60% 70% 80% 90% 100%
Medical Only Temporary Total Permanent Partial Fatal & Permanent Total

85© Copyright 2017 National Council on Compensation Insurance, Inc. All Rights Reserved.
New Mexico Indemnity Loss Distributionby Injury Type
Regional states are AZ, CO, TX, and UTBased on NCCI’s Statistical Plan data for jurisdiction/claim type combinations for which three or more cases exist
33%
27%
28%
57%
52%
54%
4%
4%
2%
6%
17%
16%
0% 10% 20% 30% 40% 50% 60% 70% 80% 90% 100%
Temporary Total Permanent Partial Permanent Total Fatal
86© Copyright 2017 National Council on Compensation Insurance, Inc. All Rights Reserved.
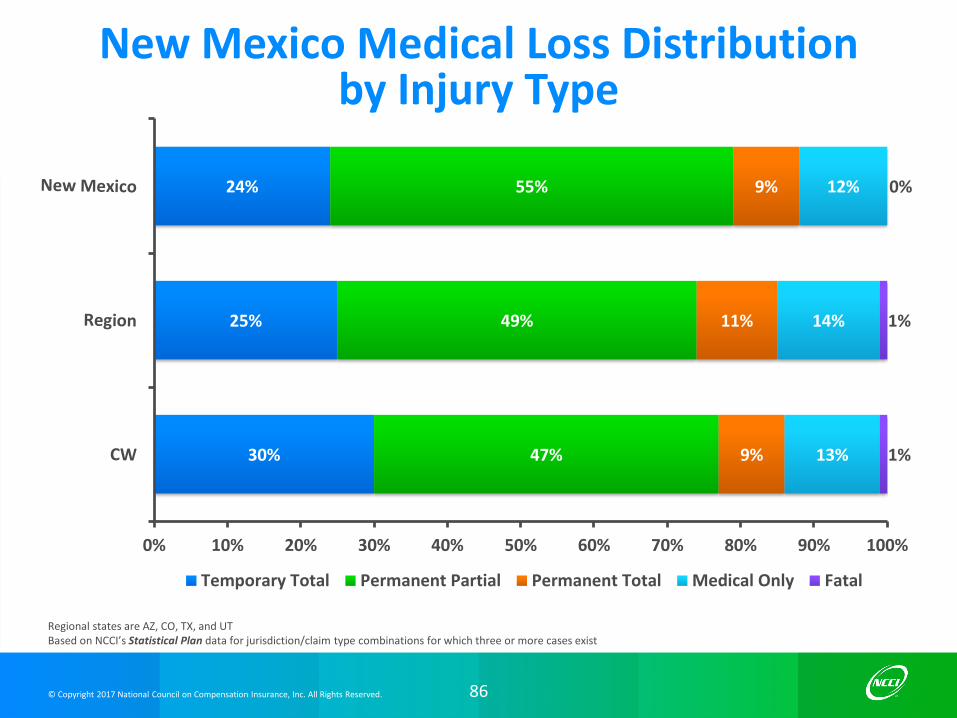
New Mexico Medical Loss Distributionby Injury Type
Regional states are AZ, CO, TX, and UTBased on NCCI’s Statistical Plan data for jurisdiction/claim type combinations for which three or more cases exist
30%
25%
24%
47%
49%
55%
9%
11%
9%
13%
14%
12%
1%
1%
0%
0% 10% 20% 30% 40% 50% 60% 70% 80% 90% 100%
Temporary Total Permanent Partial Permanent Total Medical Only Fatal
© Copyright 2017 National Council on Compensation Insurance, Inc. All Rights Reserved.
Glossary

© Copyright 2017 National Council on Compensation Insurance, Inc. All Rights Reserved.
▪ Assigned Risk Adjustment Program (ARAP)—An assigned risk market program that surcharges residual market risks based on the magnitude of their experience rating modification.
▪ Calendar Year (CY)—Experience of earned premium and loss transactions occurring within the calendar year beginning January 1, irrespective of the contractual dates of the policies to which the transactions relate and the dates of the accidents.
▪ Calendar-Accident Year (AY)—The accumulation of loss data on all accidents with the date of occurrence falling within a given calendar year. The premium figure is the same as that used in calendar year experience.
▪ Claim Frequency—The number of claims per unit of exposure; for example, the number of claims per million dollars of premium or per 100 workers.
88
Glossary

© Copyright 2017 National Council on Compensation Insurance, Inc. All Rights Reserved.
▪ Claim Severity—The average cost of a claim. Severity is calculated by dividing total losses by the total number of claims.
▪ Combined Ratio—The sum of the (1) loss ratio, (2) expense ratio, and (3) dividend ratio for a given time period.
▪ Detailed Claim Information (DCI)—An NCCI Call that collects detailed information on an individual workers compensation lost-time claim basis, such as type of injury, whether or not an attorney was involved, timing of the claim’s report to the carrier, etc.
▪ Direct Written Premium (DWP)—The gross premium income adjusted for additional or return premiums, but excluding any reinsurance premiums.
89
Glossary

© Copyright 2017 National Council on Compensation Insurance, Inc. All Rights Reserved.
▪ Indemnity Benefits—Payments by an insurance company to cover an injured worker’s time lost from work. These benefits are also referred to as “wage replacement” benefits.
▪ Loss Ratio—The ratio of losses to premium for a given time period.
▪ Lost-Time (LT) Claims—Claims resulting in indemnity benefits (and usually medical benefits) being paid to or on behalf of the injured worker for time lost from work.
▪ Medical-Only Claims—Claims resulting in only medical benefits being paid on behalf of an injured worker.
▪ Net Written Premium (NWP)—The gross premium income adjusted for additional or return premiums and including any additions for reinsurance assumed and any deductions for reinsurance ceded.
90
Glossary
© Copyright 2017 National Council on Compensation Insurance, Inc. All Rights Reserved.
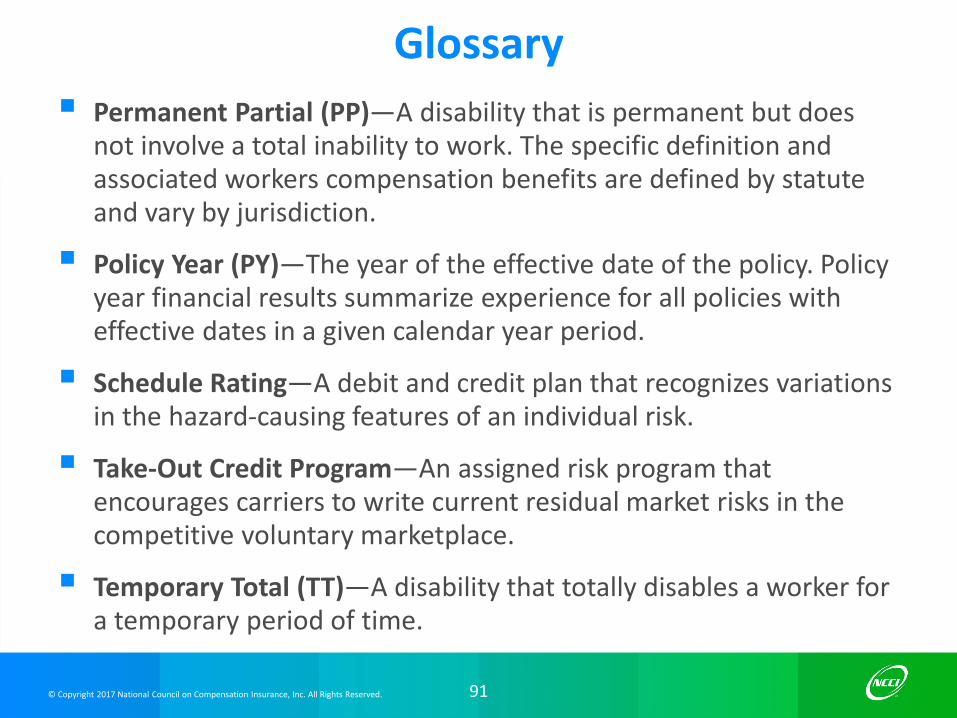
▪ Permanent Partial (PP)—A disability that is permanent but does not involve a total inability to work. The specific definition and associated workers compensation benefits are defined by statute and vary by jurisdiction.
▪ Policy Year (PY)—The year of the effective date of the policy. Policy year financial results summarize experience for all policies with effective dates in a given calendar year period.
▪ Schedule Rating—A debit and credit plan that recognizes variations in the hazard-causing features of an individual risk.
▪ Take-Out Credit Program—An assigned risk program that encourages carriers to write current residual market risks in the competitive voluntary marketplace.
▪ Temporary Total (TT)—A disability that totally disables a worker for a temporary period of time.
91
Glossary

© Copyright 2017 National Council on Compensation Insurance, Inc. All Rights Reserved.
Appendix
© Copyright 2017 National Council on Compensation Insurance, Inc. All Rights Reserved.
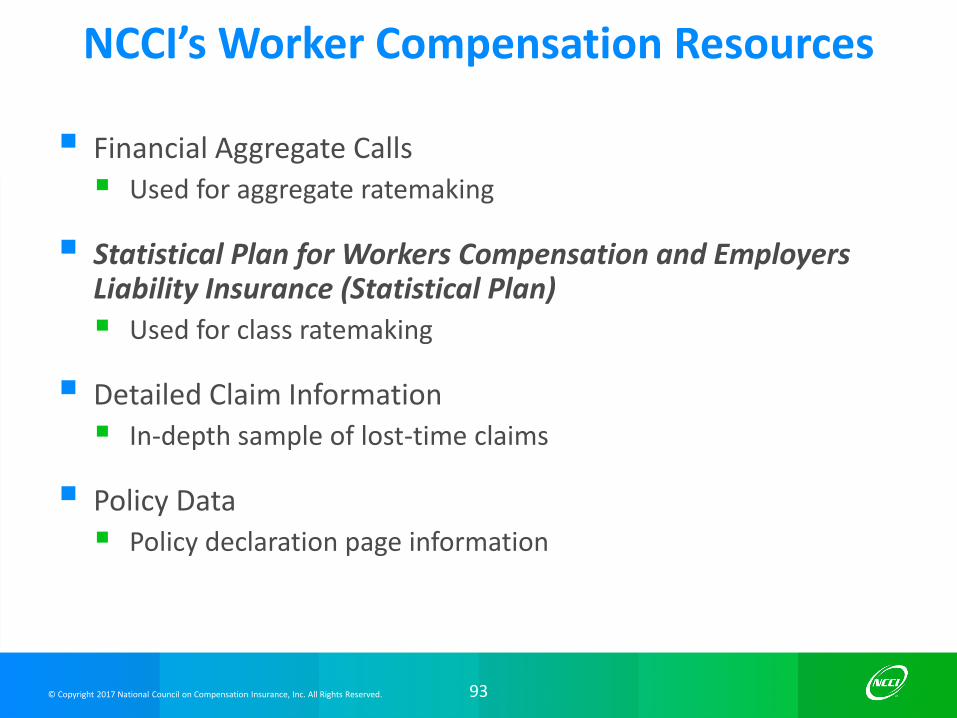
NCCI’s Worker Compensation Resources
▪ Financial Aggregate Calls
▪ Used for aggregate ratemaking
▪ Statistical Plan for Workers Compensation and Employers Liability Insurance (Statistical Plan)
▪ Used for class ratemaking
▪ Detailed Claim Information
▪ In-depth sample of lost-time claims
▪ Policy Data
▪ Policy declaration page information
93

© Copyright 2017 National Council on Compensation Insurance, Inc. All Rights Reserved.
Financial Aggregate Calls
▪ Collected Annually
▪ Policy and calendar-accident year basis
▪ Statewide and assigned risk data
▪ Premiums, Losses, and Claim Counts
▪ Evaluated as of December 31
▪ Purpose
▪ Basis for overall aggregate rate indication
▪ Research
94

95© Copyright 2017 National Council on Compensation Insurance, Inc. All Rights Reserved.
Policy Year Financial Aggregate Data
1/1/2013 12/31/20131/1/2012 1/1/2016 12/31/2016
Policy Expiration Date
Policy Effective Date
Policy Year2012
Policy Year2013
Policy Year2016

96© Copyright 2017 National Council on Compensation Insurance, Inc. All Rights Reserved.
Calendar-Accident Year Financial Aggregate Data
1/1/2014 12/31/20141/1/2013 1/1/2017 12/31/2017
Policy Expiration Date
Policy Effective Date
Calendar-Accident
Year2013
Calendar-Accident
Year2014
Calendar-Accident
Year2017
© Copyright 2017 National Council on Compensation Insurance, Inc. All Rights Reserved.
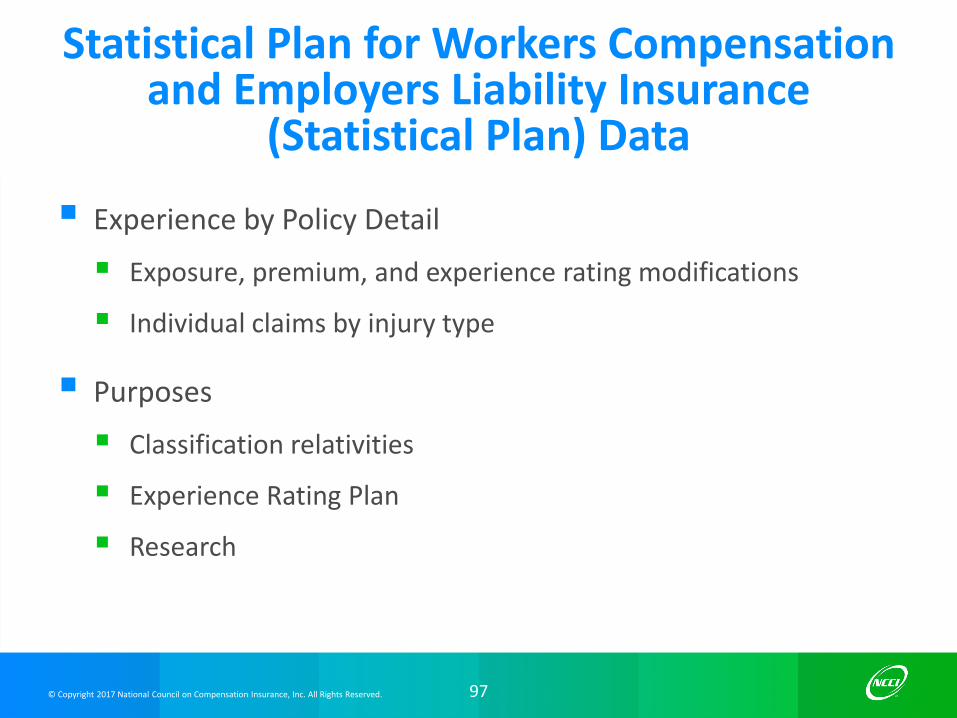
Statistical Plan for Workers Compensationand Employers Liability Insurance
(Statistical Plan) Data
▪ Experience by Policy Detail
▪ Exposure, premium, and experience rating modifications
▪ Individual claims by injury type
▪ Purposes
▪ Classification relativities
▪ Experience Rating Plan
▪ Research
97
© Copyright 2017 National Council on Compensation Insurance, Inc. All Rights Reserved.
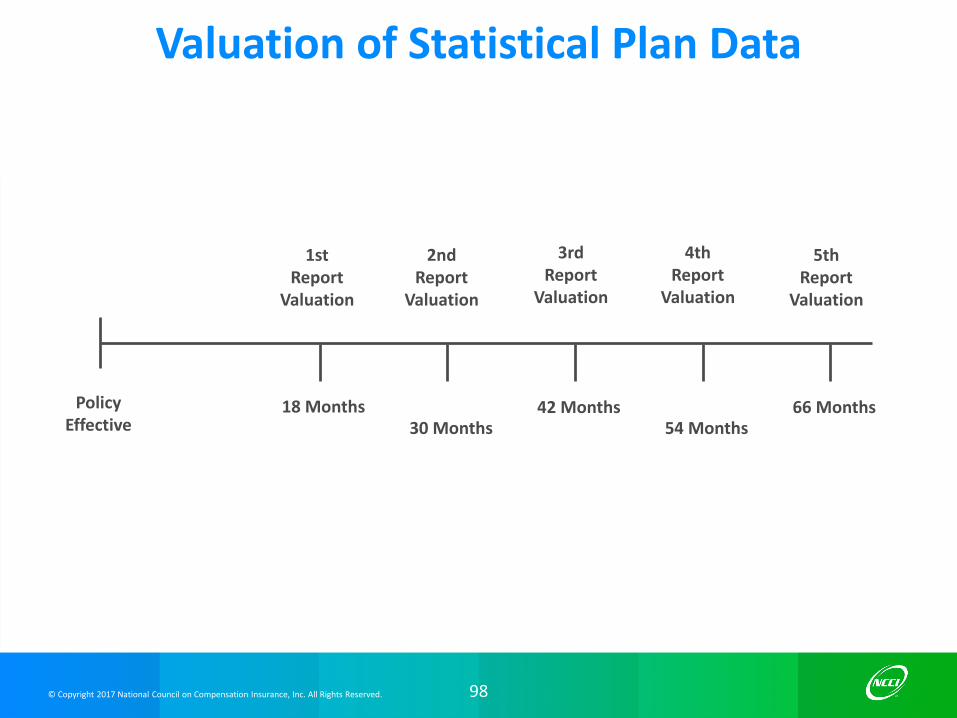
Valuation of Statistical Plan Data
98
PolicyEffective
18 Months
1stReport
Valuation
2ndReport
Valuation
3rdReport
Valuation
4thReport
Valuation
5thReport
Valuation
30 Months42 Months
54 Months66 Months