new mexico volume 43 no. 3 published april 25, 2014 labor ... · new mexico labor market review...
TRANSCRIPT

New Mexico
Labor Market ReviewHighlights: March 2014
Labor Market Data
Current Regional Nonfarm Employment Growth
• New Mexico’s rate of over-the-year job growth, comparing March 2014 with March 2013, was negative 0.1 percent, representing a loss of 1,000 jobs.
• The Albuquerque MSA total nonfarm employment contracted by 0.8 percent over the year, with a loss of 3,100 jobs.
• Over the year, total nonfarm employment in the Las Cruces MSA increased by 0.7 percent, adding 500 jobs.
• Total nonfarm employment in the Santa Fe MSA grew by 0.7 percent, representing a gain of 400 jobs.
• Over the year, total nonfarm employment decreased by 1.8 percent, or 900 jobs, in the Farmington MSA.
What’s Inside
Economic Research and Analysis Bureau P.O. Box 1928 Albuquerque, N.M. 87102 505.383.2729 www.dws.state.nm.us
Susana MartinezGovernor
Celina Bussey
Cabinet Secretary
Volume 43 No. 3 Published April 25, 2014
4.1%
2.8% 2.7% 2.6%2.3%
1.9%1.6%
1.4%1.2%
-0.1%-0.5%
0.0%
0.5%
1.0%
1.5%
2.0%
2.5%
3.0%
3.5%
4.0%
4.5%
NV UT TX CO CA AZ US OK WY NM
March 2014 over March 2013-Not Seasonally Adjusted
2
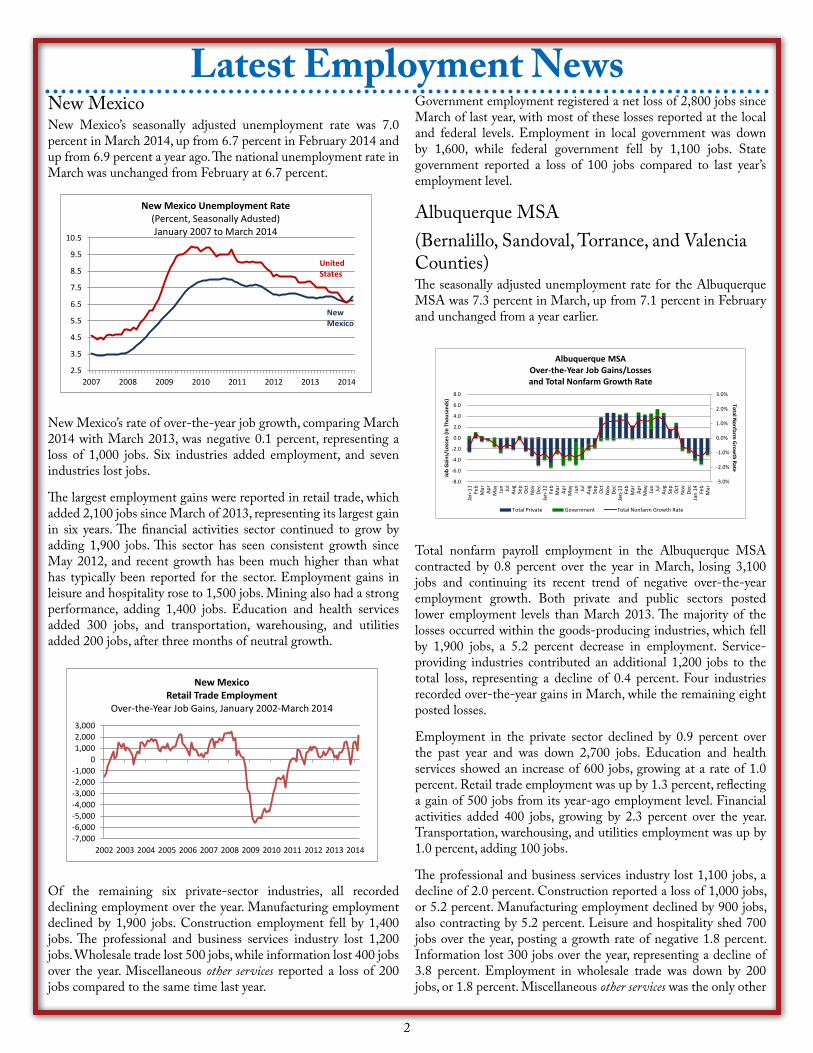
New MexicoNew Mexico’s seasonally adjusted unemployment rate was 7.0 percent in March 2014, up from 6.7 percent in February 2014 and up from 6.9 percent a year ago. The national unemployment rate in March was unchanged from February at 6.7 percent.
New Mexico’s rate of over-the-year job growth, comparing March 2014 with March 2013, was negative 0.1 percent, representing a loss of 1,000 jobs. Six industries added employment, and seven industries lost jobs.
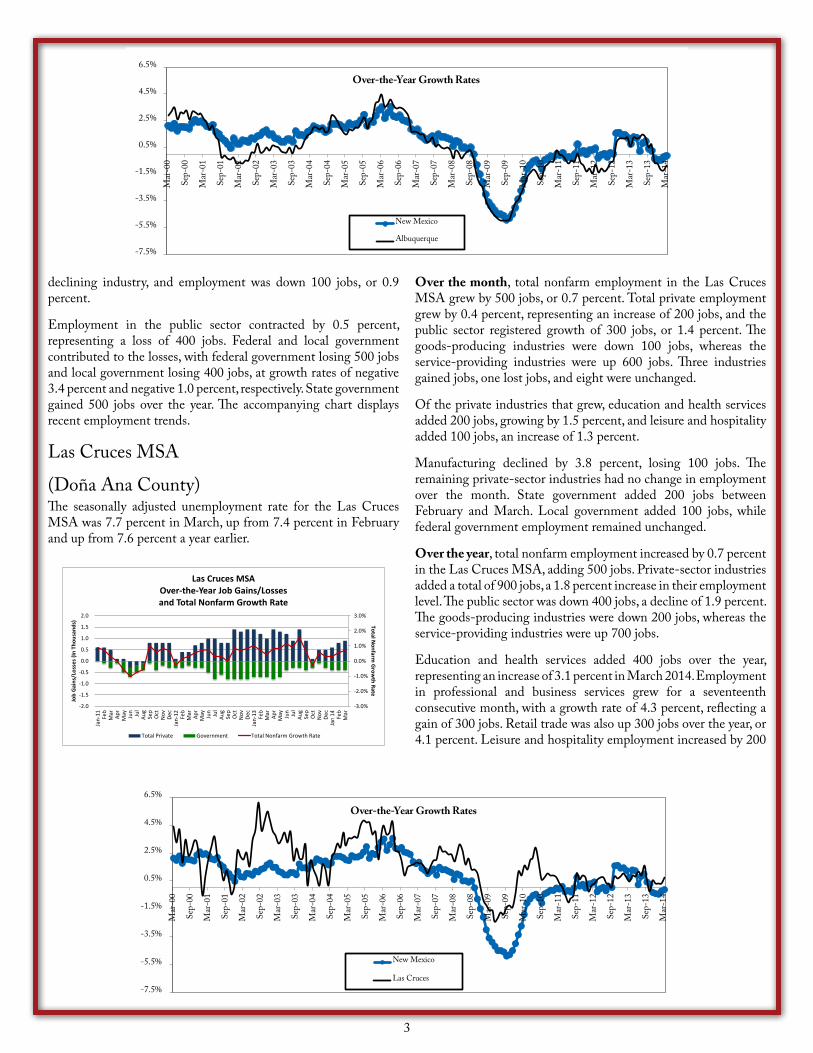
The largest employment gains were reported in retail trade, which added 2,100 jobs since March of 2013, representing its largest gain in six years. The financial activities sector continued to grow by adding 1,900 jobs. This sector has seen consistent growth since May 2012, and recent growth has been much higher than what has typically been reported for the sector. Employment gains in leisure and hospitality rose to 1,500 jobs. Mining also had a strong performance, adding 1,400 jobs. Education and health services added 300 jobs, and transportation, warehousing, and utilities added 200 jobs, after three months of neutral growth.
Of the remaining six private-sector industries, all recorded declining employment over the year. Manufacturing employment declined by 1,900 jobs. Construction employment fell by 1,400 jobs. The professional and business services industry lost 1,200 jobs. Wholesale trade lost 500 jobs, while information lost 400 jobs over the year. Miscellaneous other services reported a loss of 200 jobs compared to the same time last year.
Latest Employment NewsGovernment employment registered a net loss of 2,800 jobs since March of last year, with most of these losses reported at the local and federal levels. Employment in local government was down by 1,600, while federal government fell by 1,100 jobs. State government reported a loss of 100 jobs compared to last year’s employment level.
Albuquerque MSA(Bernalillo, Sandoval, Torrance, and Valencia Counties)The seasonally adjusted unemployment rate for the Albuquerque MSA was 7.3 percent in March, up from 7.1 percent in February and unchanged from a year earlier.
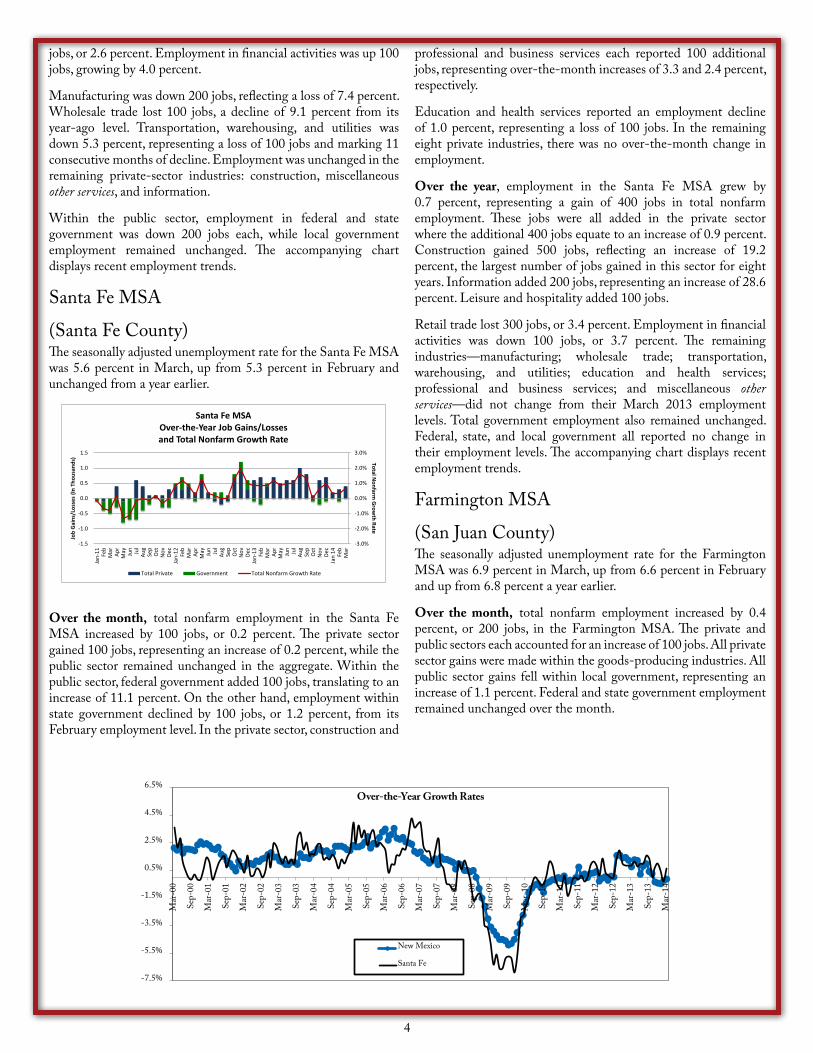
Total nonfarm payroll employment in the Albuquerque MSA contracted by 0.8 percent over the year in March, losing 3,100 jobs and continuing its recent trend of negative over-the-year employment growth. Both private and public sectors posted lower employment levels than March 2013. The majority of the losses occurred within the goods-producing industries, which fell by 1,900 jobs, a 5.2 percent decrease in employment. Service-providing industries contributed an additional 1,200 jobs to the total loss, representing a decline of 0.4 percent. Four industries recorded over-the-year gains in March, while the remaining eight posted losses.
Employment in the private sector declined by 0.9 percent over the past year and was down 2,700 jobs. Education and health services showed an increase of 600 jobs, growing at a rate of 1.0 percent. Retail trade employment was up by 1.3 percent, reflecting a gain of 500 jobs from its year-ago employment level. Financial activities added 400 jobs, growing by 2.3 percent over the year. Transportation, warehousing, and utilities employment was up by 1.0 percent, adding 100 jobs.
The professional and business services industry lost 1,100 jobs, a decline of 2.0 percent. Construction reported a loss of 1,000 jobs, or 5.2 percent. Manufacturing employment declined by 900 jobs, also contracting by 5.2 percent. Leisure and hospitality shed 700 jobs over the year, posting a growth rate of negative 1.8 percent. Information lost 300 jobs over the year, representing a decline of 3.8 percent. Employment in wholesale trade was down by 200 jobs, or 1.8 percent. Miscellaneous other services was the only other
2.5
3.5
4.5
5.5
6.5
7.5
8.5
9.5
10.5
2007 2008 2009 2010 2011 2012 2013 2014
New Mexico Unemployment Rate(Percent, Seasonally Adusted) January 2007 to March 2014
New Mexico
UnitedStates
-7,000-6,000-5,000-4,000-3,000-2,000-1,000
01,0002,0003,000
2002 2003 2004 2005 2006 2007 2008 2009 2010 2011 2012 2013 2014
New MexicoRetail Trade Employment
Over-the-Year Job Gains, January 2002-March 2014
-3.0%
-2.0%
-1.0%
0.0%
1.0%
2.0%
3.0%
-8.0
-6.0
-4.0
-2.0
0.0
2.0
4.0
6.0
8.0
Jan-
11 Feb
Mar Ap
rM
ay Jun Jul
Aug
Sep
Oct
Nov De
cJa
n-12 Fe
bM
ar Apr
May Jun Jul
Aug
Sep
Oct
Nov De
cJa
n-13 Fe
bM
ar Apr
May Jun Jul
Aug
Sep
Oct
Nov De
cJa
n 14 Fe
bM
ar
Total Nonfarm
Grow
th Rate
Job
Gai
ns/L
osse
s (In
Tho
usan
ds)
Albuquerque MSAOver-the-Year Job Gains/Losses and Total Nonfarm Growth Rate
Total Private Government Total Nonfarm Growth Rate
3
declining industry, and employment was down 100 jobs, or 0.9 percent.
Employment in the public sector contracted by 0.5 percent, representing a loss of 400 jobs. Federal and local government contributed to the losses, with federal government losing 500 jobs and local government losing 400 jobs, at growth rates of negative 3.4 percent and negative 1.0 percent, respectively. State government gained 500 jobs over the year. The accompanying chart displays recent employment trends.
Las Cruces MSA
(Doña Ana County) The seasonally adjusted unemployment rate for the Las Cruces MSA was 7.7 percent in March, up from 7.4 percent in February and up from 7.6 percent a year earlier.
Over the month, total nonfarm employment in the Las Cruces MSA grew by 500 jobs, or 0.7 percent. Total private employment grew by 0.4 percent, representing an increase of 200 jobs, and the public sector registered growth of 300 jobs, or 1.4 percent. The goods-producing industries were down 100 jobs, whereas the service-providing industries were up 600 jobs. Three industries gained jobs, one lost jobs, and eight were unchanged.
Of the private industries that grew, education and health services added 200 jobs, growing by 1.5 percent, and leisure and hospitality added 100 jobs, an increase of 1.3 percent.
Manufacturing declined by 3.8 percent, losing 100 jobs. The remaining private-sector industries had no change in employment over the month. State government added 200 jobs between February and March. Local government added 100 jobs, while federal government employment remained unchanged.
Over the year, total nonfarm employment increased by 0.7 percent in the Las Cruces MSA, adding 500 jobs. Private-sector industries added a total of 900 jobs, a 1.8 percent increase in their employment level. The public sector was down 400 jobs, a decline of 1.9 percent. The goods-producing industries were down 200 jobs, whereas the service-providing industries were up 700 jobs.
Education and health services added 400 jobs over the year, representing an increase of 3.1 percent in March 2014. Employment in professional and business services grew for a seventeenth consecutive month, with a growth rate of 4.3 percent, reflecting a gain of 300 jobs. Retail trade was also up 300 jobs over the year, or 4.1 percent. Leisure and hospitality employment increased by 200
-7.5%
-5.5%
-3.5%
-1.5%
0.5%
2.5%
4.5%
6.5%
Mar
-00
Sep-
00
Mar
-01
Sep-
01
Mar
-02
Sep-
02
Mar
-03
Sep-
03
Mar
-04
Sep-
04
Mar
-05
Sep-
05
Mar
-06
Sep-
06
Mar
-07
Sep-
07
Mar
-08
Sep-
08
Mar
-09
Sep-
09
Mar
-10
Sep-
10
Mar
-11
Sep-
11
Mar
-12
Sep-
12
Mar
-13
Sep-
13
Mar
-14
Over-the-Year Growth Rates
New Mexico
Las Cruces
-7.5%
-5.5%
-3.5%
-1.5%
0.5%
2.5%
4.5%
6.5%
Mar
-00
Sep-
00
Mar
-01
Sep-
01
Mar
-02
Sep-
02
Mar
-03
Sep-
03
Mar
-04
Sep-
04
Mar
-05
Sep-
05
Mar
-06
Sep-
06
Mar
-07
Sep-
07
Mar
-08
Sep-
08
Mar
-09
Sep-
09
Mar
-10
Sep-
10
Mar
-11
Sep-
11
Mar
-12
Sep-
12
Mar
-13
Sep-
13
Mar
-14
Over-the-Year Growth Rates
New Mexico
Albuquerque
-3.0%
-2.0%
-1.0%
0.0%
1.0%
2.0%
3.0%
-2.0
-1.5
-1.0
-0.5
0.0
0.5
1.0
1.5
2.0
Jan-
11 Feb
Mar Ap
rM
ay Jun Jul
Aug
Sep
Oct
Nov De
cJa
n-12 Fe
bM
ar Apr
May Jun Jul
Aug
Sep
Oct
Nov De
cJa
n-13 Fe
bM
ar Apr
May Jun Jul
Aug
Sep
Oct
Nov De
cJa
n 14 Fe
bM
ar
Total Nonfarm
Grow
th Rate
Job
Gai
ns/L
osse
s (In
Tho
usan
ds)
Las Cruces MSAOver-the-Year Job Gains/Losses and Total Nonfarm Growth Rate
Total Private Government Total Nonfarm Growth Rate
4
jobs, or 2.6 percent. Employment in financial activities was up 100 jobs, growing by 4.0 percent.
Manufacturing was down 200 jobs, reflecting a loss of 7.4 percent. Wholesale trade lost 100 jobs, a decline of 9.1 percent from its year-ago level. Transportation, warehousing, and utilities was down 5.3 percent, representing a loss of 100 jobs and marking 11 consecutive months of decline. Employment was unchanged in the remaining private-sector industries: construction, miscellaneous other services, and information.
Within the public sector, employment in federal and state government was down 200 jobs each, while local government employment remained unchanged. The accompanying chart displays recent employment trends.
Santa Fe MSA
(Santa Fe County)The seasonally adjusted unemployment rate for the Santa Fe MSA was 5.6 percent in March, up from 5.3 percent in February and unchanged from a year earlier.
Over the month, total nonfarm employment in the Santa Fe MSA increased by 100 jobs, or 0.2 percent. The private sector gained 100 jobs, representing an increase of 0.2 percent, while the public sector remained unchanged in the aggregate. Within the public sector, federal government added 100 jobs, translating to an increase of 11.1 percent. On the other hand, employment within state government declined by 100 jobs, or 1.2 percent, from its February employment level. In the private sector, construction and
professional and business services each reported 100 additional jobs, representing over-the-month increases of 3.3 and 2.4 percent, respectively.
Education and health services reported an employment decline of 1.0 percent, representing a loss of 100 jobs. In the remaining eight private industries, there was no over-the-month change in employment.
Over the year, employment in the Santa Fe MSA grew by 0.7 percent, representing a gain of 400 jobs in total nonfarm employment. These jobs were all added in the private sector where the additional 400 jobs equate to an increase of 0.9 percent. Construction gained 500 jobs, reflecting an increase of 19.2 percent, the largest number of jobs gained in this sector for eight years. Information added 200 jobs, representing an increase of 28.6 percent. Leisure and hospitality added 100 jobs.
Retail trade lost 300 jobs, or 3.4 percent. Employment in financial activities was down 100 jobs, or 3.7 percent. The remaining industries—manufacturing; wholesale trade; transportation, warehousing, and utilities; education and health services; professional and business services; and miscellaneous other services—did not change from their March 2013 employment levels. Total government employment also remained unchanged. Federal, state, and local government all reported no change in their employment levels. The accompanying chart displays recent employment trends.
Farmington MSA
(San Juan County)The seasonally adjusted unemployment rate for the Farmington MSA was 6.9 percent in March, up from 6.6 percent in February and up from 6.8 percent a year earlier.
Over the month, total nonfarm employment increased by 0.4 percent, or 200 jobs, in the Farmington MSA. The private and public sectors each accounted for an increase of 100 jobs. All private sector gains were made within the goods-producing industries. All public sector gains fell within local government, representing an increase of 1.1 percent. Federal and state government employment remained unchanged over the month.
-7.5%
-5.5%
-3.5%
-1.5%
0.5%
2.5%
4.5%
6.5%
Mar
-00
Sep-
00
Mar
-01
Sep-
01
Mar
-02
Sep-
02
Mar
-03
Sep-
03
Mar
-04
Sep-
04
Mar
-05
Sep-
05
Mar
-06
Sep-
06
Mar
-07
Sep-
07
Mar
-08
Sep-
08
Mar
-09
Sep-
09
Mar
-10
Sep-
10
Mar
-11
Sep-
11
Mar
-12
Sep-
12
Mar
-13
Sep-
13
Mar
-14
Over-the-Year Growth Rates
New Mexico
Santa Fe
-3.0%
-2.0%
-1.0%
0.0%
1.0%
2.0%
3.0%
-1.5
-1.0
-0.5
0.0
0.5
1.0
1.5
Jan-
11 Feb
Mar Ap
rM
ay Jun Jul
Aug
Sep
Oct
Nov De
cJa
n-12 Fe
bM
ar Apr
May Jun Jul
Aug
Sep
Oct
Nov De
cJa
n-13 Fe
bM
ar Apr
May Jun Jul
Aug
Sep
Oct
Nov De
cJa
n 14 Fe
bM
ar
Total Nonfarm
Grow
th Rate
Job
Gai
ns/L
osse
s (In
Tho
usan
ds)
Santa Fe MSAOver-the-Year Job Gains/Losses and Total Nonfarm Growth Rate
Total Private Government Total Nonfarm Growth Rate

5
Over the year, the Farmington MSA reported a decline of 900 jobs, or 1.8 percent, in its total nonfarm employment level. Private-sector industries accounted for a loss of 700 jobs. Goods-producing industries continued on a downward trend, with a loss of 700 jobs, or 6.4 percent. Employment in the private service-providing industries remained unchanged compared to March 2013. Total government employment was down 200 jobs. Federal and local government each posted losses of 100 jobs. State government reported no over-the-year change. The accompanying chart displays recent employment trends.
-10.5%
-8.5%
-6.5%
-4.5%
-2.5%
-0.5%
1.5%
3.5%
5.5%
7.5%
Mar
-00
Sep-
00
Mar
-01
Sep-
01
Mar
-02
Sep-
02
Mar
-03
Sep-
03
Mar
-04
Sep-
04
Mar
-05
Sep-
05
Mar
-06
Sep-
06
Mar
-07
Sep-
07
Mar
-08
Sep-
08
Mar
-09
Sep-
09
Mar
-10
Sep-
10
Mar
-11
Sep-
11
Mar
-12
Sep-
12
Mar
-13
Sep-
13
Mar
-14
Over-the-Year Growth Rates
New Mexico
Farmington
-4.0%
-3.0%
-2.0%
-1.0%
0.0%
1.0%
2.0%
3.0%
4.0%
-2.0
-1.5
-1.0
-0.5
0.0
0.5
1.0
1.5
2.0Ja
n-11 Fe
bM
ar Apr
May Jun Jul
Aug
Sep
Oct
Nov De
cJa
n-12 Fe
bM
ar Apr
May Jun Jul
Aug
Sep
Oct
Nov De
cJa
n-13 Fe
bM
ar Apr
May Jun Jul
Aug
Sep
Oct
Nov De
cJa
n 14 Fe
bM
ar
Total Nonfarm
Grow
th Rate
Job
Gai
ns/L
osse
s (In
Tho
usan
ds)
Farmington MSAOver-the-Year Job Gains/Losses and Total Nonfarm Growth Rate
Total Private Government Total Nonfarm Growth Rate
6
New Mexico Area Economic ActivityThis section presents the latest economic news gathered from published articles, government documents, private- and public-sector news releases, and reports from local New Mexico Workforce Connection Centers. In most cases, information is not verified for accuracy.
StatewideAt its March meeting, the New Mexico Economic Development Department’s Job Training Incentive Program ( JTIP) board approved $911,927 in funding to support 36 new jobs with two New Mexico companies. Award details are as follows: xF Technologies, Albuquerque, a developer of a patented process that produces a low-cost oxygenated biofuel additive for gasoline that reduces engine emissions, $113,521 for seven jobs; and Bendix King, Albuquerque, part of Honeywell and a developer and manufacturer of flight instruments and avionics systems for general aviators, $788,712 for 28 jobs.
Verizon Wireless announced that it is looking to recruit 225 workers by mid-2014 for its stores and call centers in Albuquerque and Santa Fe. The positions will be both full- and part-time and offer healthcare coverage and participation in the company’s 401(k) program with company matching. Positions at the call center will all be full-time.
The Zuni and Jemez Pueblos have reached out to Governor Martinez about gambling compacts that would allow them to open casinos in the future. This is the first action taken by the Zuni Pueblo to initiate talks on a gambling compact. The pueblo’s governor stated that the downturn in the economy and shrinking federal and state funds have spurred the pueblo’s interest in opening a casino. Jemez Pueblo does not have an existing casino, but had previously attempted, unsuccessfully, to develop an off-reservation casino in southern New Mexico. Five tribes are currently in negotiations regarding new compacts, including the Navajo Nation and Pojoaque Pueblo. Fourteen tribes currently operate casinos in the state.
Central Workforce Investment Area
Albuquerque Area, Bernalillo County:Canon ITS will be opening a support center in northeast Albuquerque at the Jefferson Plaza. The center will service Canon products. The Albuquerque City Council approved $200,000 in Local Economic Development Act (LEDA) funds to be provided to Cannon ITS. The City’s $200,000 will be matched by the state and Bernalillo County. Funds will go to building improvements and reimbursing Canon ITS for rent. The company anticipates hiring about 150 workers over the next couple of years, with a net payroll of $4.7 million and annual average wage of $38,000 with benefits.
Del Webb, a division of PulteGroup Inc., is planning the development of an age-restricted gated community in Albuquerque called Mirehaven. The company is a developer of senior housing and communities and is planning for 538 homes on 284 acres of land north of 98th Street and Interstate 40. PulteGroup Inc. is also planning to build another 348 homes adjacent to the senior community. The community is set to have on-site walking, biking,
and running trails and a clubhouse. Construction is anticipated to create 3,500 jobs, with site work currently under way.
CNM announced plans to open its 40,000-square-foot STEMulus Center in the First Plaza Galeria this fall. The center will offer targeted, accelerated, and short-term programs that seek to provide students with the skills their employers are demanding.
Rio Rancho and Bernalillo Areas, Sandoval County:Alliance Data Retail Services plans to hire 200 workers at its Rio Rancho customer service center. The positions will include customer care associates, customer retention associates, trainers, and customer care managers. Alliance received $738,788 in JTIP funds in February to hire and train 181 new employees, so the announcement of 200 positions exceeds the number for which the company received funds. The new employees will bring the company close to a workforce of 700, which is 100 more than the total number of workers the company anticipated reaching by the end of this year. The customer service center is currently located at the 75,000-square-foot complex at Zenith Court in Rio Rancho.
MCT Industries announced that it plans to double the size of its manufacturing facility in Bernalillo. MCT Industries manufactures customer trailers and aircraft ground-support equipment for commercial, military, and government use. The company plans to build an 80,000-square-foot facility on its existing site, and the Town of Bernalillo has approved $5 million in industrial revenue bonds to assist with the development. The new facility also brings new jobs; the company anticipates hiring an additional 40

7
workers, including laborers, welders, machinists, quality control administrators, and contract administrators. Construction should commence by mid- to late-June and be completed by 2015. The building will add to the existing 55,000 square feet of space the company has in Bernalillo.
Eastern Workforce Investment Area
Carlsbad Area, Eddy County:Several business openings are on the horizon in Carlsbad. Three hotels are set to open, including a La Quinta, Comfort Suites, and Marriott Suites. Construction has begun on all three hotels. The future hotels are joined by the city’s first McAlister’s Deli. A national restaurant chain, McAlister’s is scheduled to open in May.
Alamogordo Area, Otero County:Albertsons broke ground on a new grocery store in March. The store, which will be the first in Alamogordo in 10 years, is anticipated to be about 50,000 square feet in size and employ about 150 people once it is operating. The store will also have a Starbucks, which will be the first official store for Alamogordo. A current building that housed a variety of retail tenants is being demolished to make way for the Albertsons. Construction is anticipated to be completed in October.
Alamogordo will be receiving $6 million for flood control projects. U.S. Senator Udall and Heinrich announced that the Army Corps of Engineers will fund eight water projects in New Mexico, for a total of $28 million in funding, of which $6 million will go towards paving portions of the McKinley Channel in Alamogordo. The city will have to provide $1.5 million for the projects as well.
Tatum Area, Lea County:Around 20 workers were hired for the brand new Tatum Family Dollar store, with additional hiring anticipated in the near future, including the hire of a store manager. The Family Dollar is the first for Tatum, and will be joined by others currently being developed in Lovington, Hobbs, and Roswell by the end of 2014.
Hobbs and Lovington Areas, Lea County:Several new retail stores are in the works in the Hobbs and Lovington areas. Starbucks broke ground in March at 1824 W. Joe Harvey between the Walmart and the Chili’s. The 1,752-square-foot store is the first in Hobbs and is estimated to cost $625,000. Hobbs will also be getting a new Dickey’s Barbecue Pit. Also located on Joe Harvey Boulevard, the franchise is anticipated to be open this summer. A typical Dickey’s is 2,000 square feet and employs about 10 people. Finally, Lovington will be getting a new Hibbett Sports store. The store currently has 11 other locations in New Mexico, many of which are in the eastern and southeastern areas of the state (Alamogordo, Artesia, Hobbs, Clovis, Carlsbad, and Portales). The store is anticipated to employ eight workers.
Northern Workforce Investment Area
Gallup and Grants Areas, McKinley and Cibola Counties:U.S. Highway 491 will be expanded into a four-lane road. Patricia Lundstrom, with the Greater Gallup Economic Development Corporation, stated that the completion of the expansion is anticipated to complement the proposed Gallup Rail and Industrial Park, and that the two projects, coupled with the existing Interstate 40 and the transcontinental line of the Burlington Northern and Santa Fe Railway “represent the highest potential for job-creation.” TRIP, a private nonprofit organization that researches, evaluates, and distributes economic and technical data on surface transportation issues, reported in January that the completion of U.S. 491 is the number one transportation project to support economic development in New Mexico.
The Bureau of Land Management (BLM) issued a 640-acre coal lease to develop about 9.2 million tons of recoverable coal adjacent to the El Segundo Mine in McKinley County. The lease, which was sold to Peabody Natural Resources Co. for $2.3 million, was originally requested in 2011. The BLM required that additional environmental impact analysis be completed in 2013. Peabody Natural Resources Co. currently operates the 15,000-acre El Segundo Mine, which produces about 8 million tons of coal per year and employs 340 workers.
PNM announced the planned development of a new Solar Energy Center in Cibola County. The center, which should be fully operational by December, will be located in the northeast part of the county near the old Marquez Village. The project, a 7.6 megawatt

8
tracking solar facility, will be developed on approximately 100 acres and is estimated to cost $14 million. The contractor for the project is First Solar, and construction is anticipated to create 150 to 200 jobs. Energy generated by the solar facility will be distributed through an existing abandoned power line. PNM stated that the center will generate $150,000 in tax revenue for the county, with one half of the revenue going to the Grants/Cibola County School District.
Farmington Area, San Juan County:Raytheon came one step closer to turning its planned $3.3 million warehouse on Navajo Nation land into a reality. The San Juan County commissioners approved a notice of intent to serve as the fiscal agent for a $200,000 New Mexico Economic Development Department grant that will fund the design of the warehouse. The Navajo Nation secured the $3.3 million needed to construct the 28,000-square-foot facility. Raytheon assembles missile and munitions parts at its current facility near Farmington and has been in operation for 24 years. It has announced that it will retain the existing 42 manufacturing jobs and will create two new jobs that will exist for at least three years. Negotiations are still under way, however, between Raytheon and the Navajo Nation for the extension of the company’s lease. The county is watching to see if the company’s lease is extended; the $200,000 must be spent by June 30, and the county would like to see negotiations settled to ensure the money doesn’t expire. County officials have stated that if Raytheon continues to operate for the next three years, operations will generate $8.5 million for the local economy.
Aztec Area, San Juan County:The New Mexico Youth Conservation Corps has provided $91,029 in grant funds to the City of Aztec to employ 23 youth workers for summer projects at Hartman Park. Workers will be tasked with landscaping the ball field, installing a retaining wall and post-and-cable fencing, and painting dugouts, concession stands, a storage house, and the pavilion, as well as installing an irrigation system. The city has received New Mexico Youth Conservation Corps funds for 11 years. Workers start at $7.50 an hour and can receive high school and college credits as well.
Southwestern Workforce Investment Area
Santa Teresa Area, Doña Ana County:Union Pacific Corp. has scheduled to open its new freight facility in Santa Teresa in late May, a year ahead of schedule. The company launched its operations with a “soft” opening. Union Pacific has
invested more than $400 million since 2011 in the 2,200-acre facility, of which half is being used. The facility will serve to refuel locomotives, change oil, complete inspections, change crews, and shift goods from truck to rail and vice versa. The company has already begun to relocate much of its El Paso operations to the new site. It is anticipated that the facility could employ up to 600 people by 2025. The anticipated Union Pacific operations have already begun to spur business development; a new 56-room hotel and diner is currently under construction nearby. A hotel and diner are just the tip of the iceberg, however. Local business owners and officials are anticipating that the operating facility will increase business traffic substantially in the coming years.
Las Cruces Area, Doña Ana County:Comcast opened its Xfinity Customer Center in Las Cruces in March. The center is 3,600 square feet and provides customers with the ability to learn about and try many of Comcast’s products, including the Xfinity Home security system, Xfinity TV, popular apps, and business class products and services.
Several retail businesses are in development or have recently opened in Las Cruces. K-Bob’s Steakhouse opened its Las Cruces location in March at 1660 S. Valley Drive. A new running store, Run Culture, that sells shoes and running equipment also opened in Downtown Las Cruces in March. Progress continues at the Shoppes at Rinconada. The 10-acre development is reported to include a major national retail and regional retail tenants, although specific tenants have not been announced.
Deming Area, Luna County:Compass Components Manufacturing Services has been growing in recent months and is looking to add additional workers to its existing workforce of 102 employees. The company, which manufactures wiring harness assemblies for public transportation buses, has recently added new equipment to its 80,000-square-foot facility. The company is also looking to expand into different areas in the coming years, such as the aerospace, boat/marina, and medical industries.
Mizkan Border Products, the largest green chile pepper processor in the world, was looking to hire 60 employees in March in an effort to reach approximately 700 seasonal employees by the end of June. Mizkan Border Products bought the Border Foods Inc. plant in 2011 and has been in operation ever since. It is one of Luna County’s largest employers. In 2013, the company processed 70 million pounds of chile in its Deming plant, with about 60 million pounds coming from New Mexico crops and 10 million pounds coming from Mexico.
9
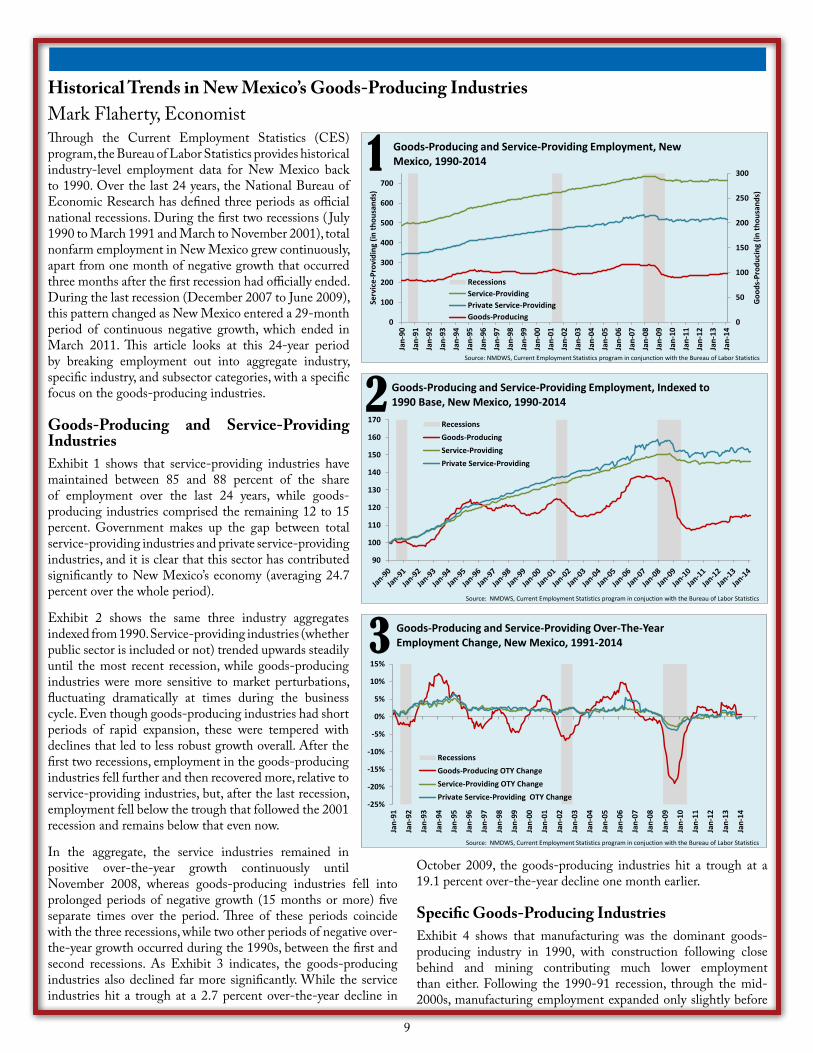
Historical Trends in New Mexico’s Goods-Producing Industries Mark Flaherty, EconomistThrough the Current Employment Statistics (CES) program, the Bureau of Labor Statistics provides historical industry-level employment data for New Mexico back to 1990. Over the last 24 years, the National Bureau of Economic Research has defined three periods as official national recessions. During the first two recessions ( July 1990 to March 1991 and March to November 2001), total nonfarm employment in New Mexico grew continuously, apart from one month of negative growth that occurred three months after the first recession had officially ended. During the last recession (December 2007 to June 2009), this pattern changed as New Mexico entered a 29-month period of continuous negative growth, which ended in March 2011. This article looks at this 24-year period by breaking employment out into aggregate industry, specific industry, and subsector categories, with a specific focus on the goods-producing industries.
Goods-Producing and Service-Providing Industries Exhibit 1 shows that service-providing industries have maintained between 85 and 88 percent of the share of employment over the last 24 years, while goods-producing industries comprised the remaining 12 to 15 percent. Government makes up the gap between total service-providing industries and private service-providing industries, and it is clear that this sector has contributed significantly to New Mexico’s economy (averaging 24.7 percent over the whole period).
Exhibit 2 shows the same three industry aggregates indexed from 1990. Service-providing industries (whether public sector is included or not) trended upwards steadily until the most recent recession, while goods-producing industries were more sensitive to market perturbations, fluctuating dramatically at times during the business cycle. Even though goods-producing industries had short periods of rapid expansion, these were tempered with declines that led to less robust growth overall. After the first two recessions, employment in the goods-producing industries fell further and then recovered more, relative to service-providing industries, but, after the last recession, employment fell below the trough that followed the 2001 recession and remains below that even now.
In the aggregate, the service industries remained in positive over-the-year growth continuously until November 2008, whereas goods-producing industries fell into prolonged periods of negative growth (15 months or more) five separate times over the period. Three of these periods coincide with the three recessions, while two other periods of negative over-the-year growth occurred during the 1990s, between the first and second recessions. As Exhibit 3 indicates, the goods-producing industries also declined far more significantly. While the service industries hit a trough at a 2.7 percent over-the-year decline in
October 2009, the goods-producing industries hit a trough at a 19.1 percent over-the-year decline one month earlier.
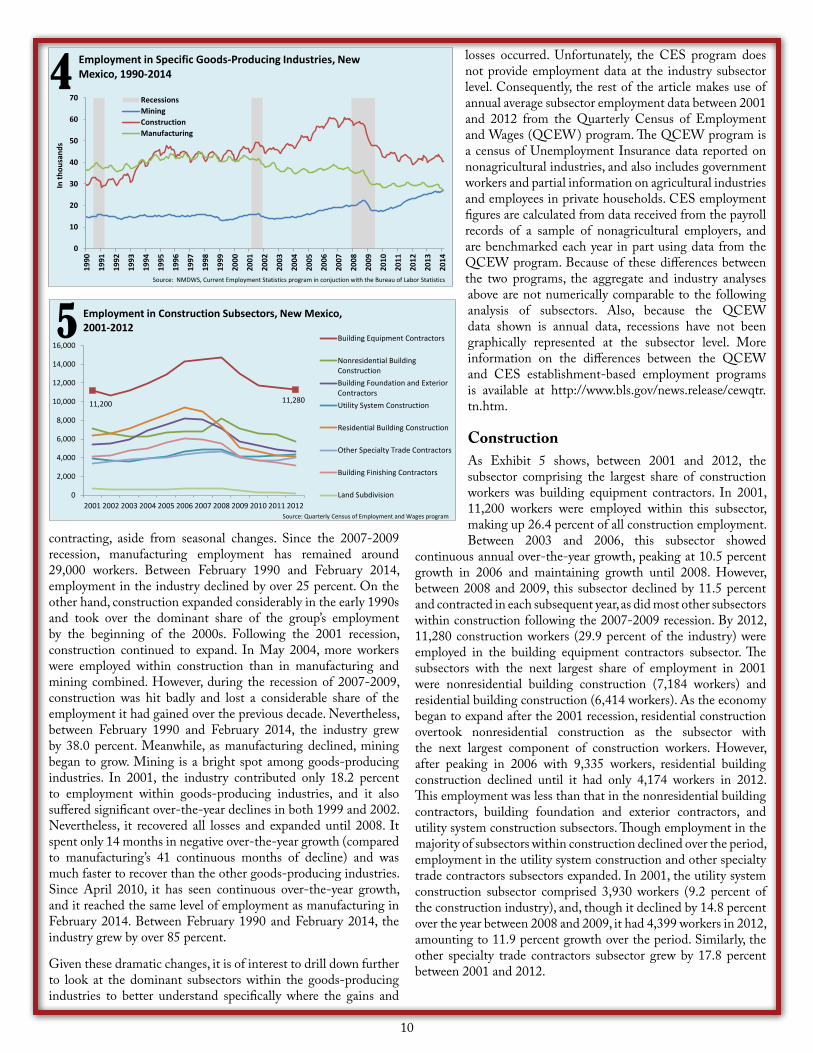
Specific Goods-Producing IndustriesExhibit 4 shows that manufacturing was the dominant goods-producing industry in 1990, with construction following close behind and mining contributing much lower employment than either. Following the 1990-91 recession, through the mid-2000s, manufacturing employment expanded only slightly before
90
100
110
120
130
140
150
160
170
Goods-Producing and Service-Providing Employment, Indexed to 1990 Base, New Mexico, 1990-2014
RecessionsGoods-ProducingService-ProvidingPrivate Service-Providing
Source: NMDWS, Current Employment Statistics program in conjuction with the Bureau of Labor Statistics
2
0
50
100
150
200
250
300
0
100
200
300
400
500
600
700
Jan-
90
Jan-
91
Jan-
92
Jan-
93
Jan-
94
Jan-
95
Jan-
96
Jan-
97
Jan-
98
Jan-
99
Jan-
00
Jan-
01
Jan-
02
Jan-
03
Jan-
04
Jan-
05
Jan-
06
Jan-
07
Jan-
08
Jan-
09
Jan-
10
Jan-
11
Jan-
12
Jan-
13
Jan-
14
Goo
ds-P
rodu
cing
(in
thou
sand
s)
Serv
ice-
Prov
idin
g (in
thou
sand
s)
Goods-Producing and Service-Providing Employment, New Mexico, 1990-2014
RecessionsService-ProvidingPrivate Service-ProvidingGoods-Producing
1
Source: NMDWS, Current Employment Statistics program in conjunction with the Bureau of Labor Statistics
-25%
-20%
-15%
-10%
-5%
0%
5%
10%
15%
Jan-
91
Jan-
92
Jan-
93
Jan-
94
Jan-
95
Jan-
96
Jan-
97
Jan-
98
Jan-
99
Jan-
00
Jan-
01
Jan-
02
Jan-
03
Jan-
04
Jan-
05
Jan-
06
Jan-
07
Jan-
08
Jan-
09
Jan-
10
Jan-
11
Jan-
12
Jan-
13
Jan-
14
Goods-Producing and Service-Providing Over-The-Year Employment Change, New Mexico, 1991-2014
RecessionsGoods-Producing OTY ChangeService-Providing OTY ChangePrivate Service-Providing OTY Change
3
Source: NMDWS, Current Employment Statistics program in conjuction with the Bureau of Labor Statistics
10
contracting, aside from seasonal changes. Since the 2007-2009 recession, manufacturing employment has remained around 29,000 workers. Between February 1990 and February 2014, employment in the industry declined by over 25 percent. On the other hand, construction expanded considerably in the early 1990s and took over the dominant share of the group’s employment by the beginning of the 2000s. Following the 2001 recession, construction continued to expand. In May 2004, more workers were employed within construction than in manufacturing and mining combined. However, during the recession of 2007-2009, construction was hit badly and lost a considerable share of the employment it had gained over the previous decade. Nevertheless, between February 1990 and February 2014, the industry grew by 38.0 percent. Meanwhile, as manufacturing declined, mining began to grow. Mining is a bright spot among goods-producing industries. In 2001, the industry contributed only 18.2 percent to employment within goods-producing industries, and it also suffered significant over-the-year declines in both 1999 and 2002. Nevertheless, it recovered all losses and expanded until 2008. It spent only 14 months in negative over-the-year growth (compared to manufacturing’s 41 continuous months of decline) and was much faster to recover than the other goods-producing industries. Since April 2010, it has seen continuous over-the-year growth, and it reached the same level of employment as manufacturing in February 2014. Between February 1990 and February 2014, the industry grew by over 85 percent.
Given these dramatic changes, it is of interest to drill down further to look at the dominant subsectors within the goods-producing industries to better understand specifically where the gains and
losses occurred. Unfortunately, the CES program does not provide employment data at the industry subsector level. Consequently, the rest of the article makes use of annual average subsector employment data between 2001 and 2012 from the Quarterly Census of Employment and Wages (QCEW) program. The QCEW program is a census of Unemployment Insurance data reported on nonagricultural industries, and also includes government workers and partial information on agricultural industries and employees in private households. CES employment figures are calculated from data received from the payroll records of a sample of nonagricultural employers, and are benchmarked each year in part using data from the QCEW program. Because of these differences between the two programs, the aggregate and industry analyses above are not numerically comparable to the following analysis of subsectors. Also, because the QCEW data shown is annual data, recessions have not been graphically represented at the subsector level. More information on the differences between the QCEW and CES establishment-based employment programs is available at http://www.bls.gov/news.release/cewqtr.tn.htm.
ConstructionAs Exhibit 5 shows, between 2001 and 2012, the subsector comprising the largest share of construction workers was building equipment contractors. In 2001, 11,200 workers were employed within this subsector, making up 26.4 percent of all construction employment. Between 2003 and 2006, this subsector showed
continuous annual over-the-year growth, peaking at 10.5 percent growth in 2006 and maintaining growth until 2008. However, between 2008 and 2009, this subsector declined by 11.5 percent and contracted in each subsequent year, as did most other subsectors within construction following the 2007-2009 recession. By 2012, 11,280 construction workers (29.9 percent of the industry) were employed in the building equipment contractors subsector. The subsectors with the next largest share of employment in 2001 were nonresidential building construction (7,184 workers) and residential building construction (6,414 workers). As the economy began to expand after the 2001 recession, residential construction overtook nonresidential construction as the subsector with the next largest component of construction workers. However, after peaking in 2006 with 9,335 workers, residential building construction declined until it had only 4,174 workers in 2012. This employment was less than that in the nonresidential building contractors, building foundation and exterior contractors, and utility system construction subsectors. Though employment in the majority of subsectors within construction declined over the period, employment in the utility system construction and other specialty trade contractors subsectors expanded. In 2001, the utility system construction subsector comprised 3,930 workers (9.2 percent of the construction industry), and, though it declined by 14.8 percent over the year between 2008 and 2009, it had 4,399 workers in 2012, amounting to 11.9 percent growth over the period. Similarly, the other specialty trade contractors subsector grew by 17.8 percent between 2001 and 2012.
11,200 11,280
0
2,000
4,000
6,000
8,000
10,000
12,000
14,000
16,000
2001 2002 2003 2004 2005 2006 2007 2008 2009 2010 2011 2012
Employment in Construction Subsectors, New Mexico, 2001-2012
Building Equipment Contractors
Nonresidential BuildingConstructionBuilding Foundation and ExteriorContractorsUtility System Construction
Residential Building Construction
Other Specialty Trade Contractors
Building Finishing Contractors
Land Subdivision
5
Source: Quarterly Census of Employment and Wages program
0
10
20
30
40
50
60
7019
90
1991
1992
1993
1994
1995
1996
1997
1998
1999
2000
2001
2002
2003
2004
2005
2006
2007
2008
2009
2010
2011
2012
2013
2014
In th
ousa
nds
Employment in Specific Goods-Producing Industries, New Mexico, 1990-2014
RecessionsMiningConstructionManufacturing
4
Source: NMDWS, Current Employment Statistics program in conjuction with the Bureau of Labor Statistics
11
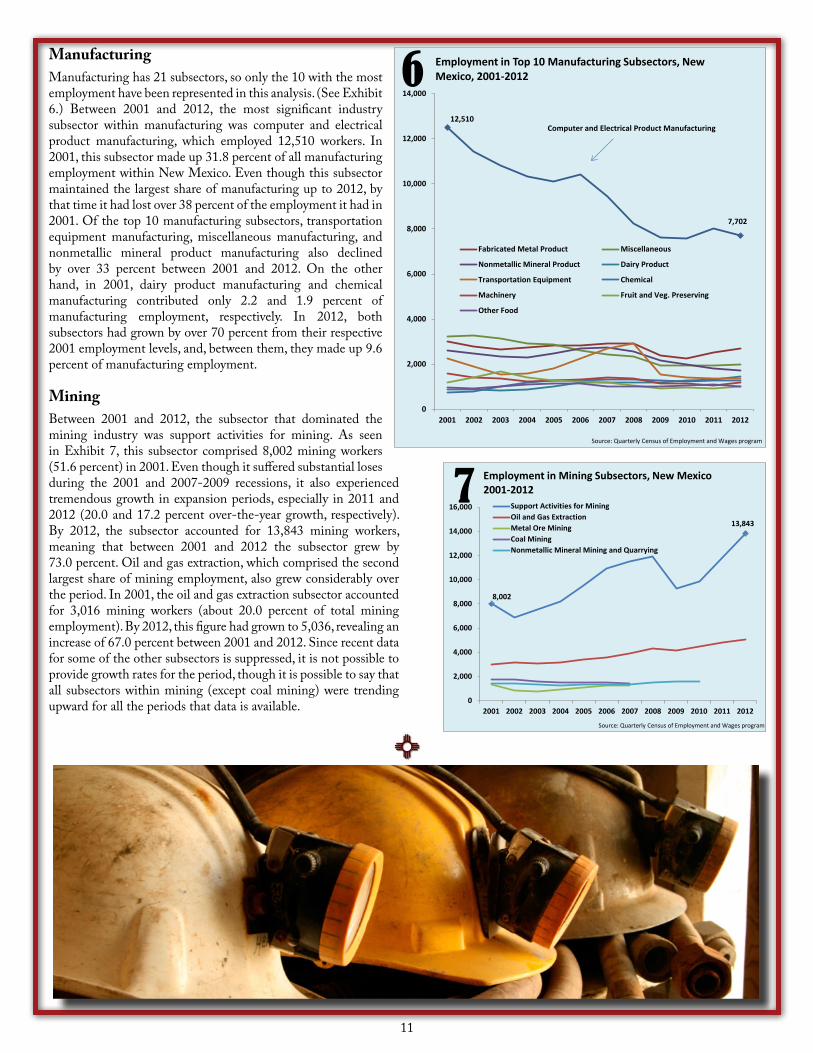
Manufacturing Manufacturing has 21 subsectors, so only the 10 with the most employment have been represented in this analysis. (See Exhibit 6.) Between 2001 and 2012, the most significant industry subsector within manufacturing was computer and electrical product manufacturing, which employed 12,510 workers. In 2001, this subsector made up 31.8 percent of all manufacturing employment within New Mexico. Even though this subsector maintained the largest share of manufacturing up to 2012, by that time it had lost over 38 percent of the employment it had in 2001. Of the top 10 manufacturing subsectors, transportation equipment manufacturing, miscellaneous manufacturing, and nonmetallic mineral product manufacturing also declined by over 33 percent between 2001 and 2012. On the other hand, in 2001, dairy product manufacturing and chemical manufacturing contributed only 2.2 and 1.9 percent of manufacturing employment, respectively. In 2012, both subsectors had grown by over 70 percent from their respective 2001 employment levels, and, between them, they made up 9.6 percent of manufacturing employment.
MiningBetween 2001 and 2012, the subsector that dominated the mining industry was support activities for mining. As seen in Exhibit 7, this subsector comprised 8,002 mining workers (51.6 percent) in 2001. Even though it suffered substantial loses during the 2001 and 2007-2009 recessions, it also experienced tremendous growth in expansion periods, especially in 2011 and 2012 (20.0 and 17.2 percent over-the-year growth, respectively). By 2012, the subsector accounted for 13,843 mining workers, meaning that between 2001 and 2012 the subsector grew by 73.0 percent. Oil and gas extraction, which comprised the second largest share of mining employment, also grew considerably over the period. In 2001, the oil and gas extraction subsector accounted for 3,016 mining workers (about 20.0 percent of total mining employment). By 2012, this figure had grown to 5,036, revealing an increase of 67.0 percent between 2001 and 2012. Since recent data for some of the other subsectors is suppressed, it is not possible to provide growth rates for the period, though it is possible to say that all subsectors within mining (except coal mining) were trending upward for all the periods that data is available.
12,510
7,702
0
2,000
4,000
6,000
8,000
10,000
12,000
14,000
2001 2002 2003 2004 2005 2006 2007 2008 2009 2010 2011 2012
Employment in Top 10 Manufacturing Subsectors, New Mexico, 2001-2012
Fabricated Metal Product Miscellaneous
Nonmetallic Mineral Product Dairy Product
Transportation Equipment Chemical
Machinery Fruit and Veg. Preserving
Other Food
Computer and Electrical Product Manufacturing
Source: Quarterly Census of Employment and Wages program
6
8,002
13,843
0
2,000
4,000
6,000
8,000
10,000
12,000
14,000
16,000
2001 2002 2003 2004 2005 2006 2007 2008 2009 2010 2011 2012
Employment in Mining Subsectors, New Mexico 2001-2012
Support Activities for MiningOil and Gas ExtractionMetal Ore MiningCoal MiningNonmetallic Mineral Mining and Quarrying
7
Source: Quarterly Census of Employment and Wages program

12
Income Characteristics of Out-of-State Movers Migrating to and from Albuquerque-Rio Rancho and Other Surrounding Substate AreasAshley Leach, EconomistThe U.S. Census Bureau produces a range of data on migration and geographic mobility of the population within the United States, its states, and substate areas. The Census Bureau collects data on geographic mobility through the Annual Social and Economic Supplement (ASEC) of the Current Population Survey (CPS) and collects data on state-to-state and county-to-county migration flows through the American Community Survey (ACS). Information on the flows of population and the characteristics of the migrating population are important for government entities and the private sector. Migrating populations can impact a region’s demographic base and economy by changing not just the count of the population, but the dynamic make-up of that population. This can impact the need of and demand for public services as well as the overall purchasing power of a population, which directly impacts business and economic development. Migration patterns can also provide insights on an area’s draw and ability to attract new families and workers from other counties and states. Also, they often serve as a starting point for looking more deeply into the composition of a region and its population and the impacts of certain population variables on the economy.
This article’s main focus is the income characteristics of what are referred to as “out-of-state” movers. Out-of-state movers are persons that either recently lived in a defined substate area and moved to another state or currently live in a substate area and moved to that area from another state. The article does not focus on intrastate movers (persons moving within a state). The analysis evaluates out-of-state movers for a select set of major population areas within and around New Mexico. State-to-state migration flows are introduced first. Data is from the 2012 ACS one-year estimates and represents movement of the population that is one-year old or older. In-migration, for the purposes of this article, is defined as the count of persons who had recently moved to the substate area from another state or abroad at the time of the survey. In-migration data by income level is for 2012 and is from the 2008-2012 ACS five-year estimates, Table B07010, Geographical Mobility in the Past Year by Individual Income in the Past 12 Months (in 2012 Inflation-Adjusted Dollars) for the Current Residence in the United States. Out-migration, for the purposes of this article, is defined as persons who were identified as living in the substate area one year ago, but had since moved out of the state. Out-migration data also comes from the 2008-2012 ACS five-year estimates, but data is from Table B07410, Geographical Mobility in the Past Year by Individual Income
in the Past 12 Months (in 2012 Inflation-Adjusted Dollars) for Residence 1 Year Ago in the United States. Both in-migration and out-migration data at the substate and income characteristics level count the movement of the population 15 years and older. Net migration is presented at the statewide levels, but net migration at the city/metropolitan level is not presented, as out-migration data does not include persons moving out of the U.S. due to data limitations. For more information on the data sources and related methodologies for migration and geographic mobility of the population, visit the Census Bureau website at http://www.census.gov/hhes/migration.
2012 Net Migration for New MexicoExhibit 1 shows the net migration of population between New Mexico and all other states and the District of Columbia (D.C.). Approximately 9,228 more persons moved from New Mexico than moved to New Mexico in 2012. Florida had the largest net number of persons moving to New Mexico (1,854), while Texas had the largest net number of persons moving to the state from New Mexico (4,807). Colorado had the second largest net number of persons moving from New Mexico (1,740), followed by California. About 555 more New Mexican residents moved to Arizona than Arizona residents moved to New Mexico in 2012. Oklahoma also had a net in-migration of persons moving from New Mexico. Utah was the only state that borders New Mexico that experienced a net out-migration, with more people moving to New Mexico in 2012. Interestingly, the states with the fourth and fifth greatest net number of persons migrating from New Mexico were North Carolina and South Carolina. The states with the largest amount of migration, overall, or, in other words, the states with the most movement to and from New Mexico, were Texas (28,717 movers), Arizona (13,337 movers), Colorado (11,300 movers), California (10,457 movers), Florida (7,560 movers), Ohio (2,539 movers),
1,85
476
569
664
061
346
544
137
936
533
432
827
020
757 45 36 15 12 7
-36
-38
-81
-91
-116
-120
-120
-133
-137
-164
-168
-179
-183
-205
-215
-218
-320
-357
-395
-413
-509
-534
-555
-569
-716
-723
-727
-803
-1,3
85-1
,740
-4,8
07
1. New Mexico's Net Migration by StatePersons Moving to and from New Mexico, 2012
Flor
ida
Mis
sour
iU
tah*
Loui
sian
aV
irgin
iaN
ew Y
ork
Indi
ana
Was
hing
ton
Mis
siss
ippi
Sou
th D
akot
aA
laba
ma
Iow
aN
ew J
erse
yA
lask
aN
ew H
amps
hire
Neb
rask
aD
elaw
are
Ore
gon
Ver
mon
tR
hode
Isla
ndM
inne
sota
Wes
t Virg
inia
D.C
.H
awai
iM
onta
naN
orth
Dak
ota
Mar
ylan
dA
rkan
sas
Con
nect
icut
Okl
ahom
aP
enns
ylva
nia
Ohi
oW
isco
nsin
Mai
neM
assa
chus
etts
Idah
oK
ansa
sK
entu
cky
Tenn
esse
eW
yom
ing
Nev
ada
Ariz
ona
Illin
ois
Mic
higa
nG
eorg
iaS
outh
Car
olin
aN
orth
Car
olin
aC
alifo
rnia
Col
orad
oTe
xas
Rho
de Is
land
Min
neso
taW
est V
irgin
iaD
.C.
Haw
aii
Mon
tana
Nor
th D
akot
aM
aryl
and
Ark
ansa
sC
onne
ctic
utO
klah
oma*
Pen
nsyl
vani
aO
hio
Wis
cons
inM
aine
Mas
sach
uset
tsId
aho
Kan
sas
Ken
tuck
yTe
nnes
see
Wyo
min
gN
evad
aA
rizon
a*Ill
inoi
sM
ichi
gan
Geo
rgia
Sou
th C
arol
ina
Nor
th C
arol
ina
Cal
iforn
iaC
olor
ado*
Texa
s*
* Denotes neighboring state of New Mexico.
13
and Virginia (2,507 movers).
Exhibit 2 provides New Mexico’s migration distribution by state, showing the percentage of movers that moved to and moved from New Mexico in 2012. While the exhibit doesn’t provide information on the number of movers, it gives an idea of the states where in-migration or out-migration dominates. New Jersey had the largest concentration of persons moving from the state to New Mexico (84.8 percent of all movers), although the number of overall movers was fairly small (297). New Jersey was followed closely by two southern states—Louisiana and Mississippi. On the other end of the spectrum, Rhode Island and West Virginia had the largest concentration of persons moving from New Mexico into the state; neither of the states had a measurable number of persons moving to New Mexico. These two states were followed by Maine and Wyoming, with about 82 to 87 percent of movers relocating from New Mexico.
Out-of-State Movers in Albuquerque and Other Substate AreasExhibit 3 provides information on the number of persons that migrated into and out of select substate areas in and around New Mexico and to and from other states. The selected areas represent those with large population bases. The exhibit only presents movers that changed states, not those that moved to a different city or county within the same state. Note that, because out-migration data does not measure persons moving from the area to another country, a true net migration amount cannot be evaluated. When looking strictly at persons moving into and out of the areas shown to and from other states, most of the areas shown experienced a net in-migration of persons from other states in the U.S. The Austin-Round Rock area had the largest concentration of persons moving into the area from outside of Texas (approximately 60 percent of all movers, not including those moving from abroad). The Denver-Lakewood-Aurora area followed, with close to 9,000 more persons moving into the area from outside of Colorado than residents moving away to other states. The Albuquerque-Rio Rancho area had nearly net neutral migration. The number of persons moving into the area from outside New Mexico was extremely close to the number of residents that moved to another state. Tucson and El Paso were similar to Albuquerque-Rio Rancho in that net migration was nearly zero. Salt Lake City was the only area of those shown that experienced a measurable net out-migration, with more people
moving away from Utah; about 53 percent of all movers left the area to live in another state.
The Dallas-Fort Worth-Arlington area had the largest number of movers coming into the area from abroad (13,423), followed by Phoenix-Mesa-Scottsdale (11,965). El Paso, however, had the largest concentration of movers coming from abroad; just over 21 percent of all movers, including those moving into the area from abroad, were emigrating from another country. San Antonio-New Braunfels and Austin-Round Rock had the second and third largest concentrations of movers emigrating from abroad.
Income Characteristics of Movers Migrating Into the Substate Area Exhibit 4 shows the percentage of intrastate, interstate, and abroad movers for all of the substate areas of focus. The sample includes only those persons that were currently living in the substate area at the time of the survey and had either moved within the state or from another state or from abroad (in-migration). Persons migrating into the substate area are a combination of those moving from another state and those moving from abroad in order
53,2
22
15,3
79
17,2
30
24,5
99
16,1
79
10,7
76
8,24
5 17,2
38
34,1
72
14,1
47 20,1
01
8,73
2
54,2
72
15,3
11 20,4
52
33,5
84
16,2
62
14,5
60
10,3
52
25,9
11
37,9
48
14,0
77
22,2
24
7,69
4
11,9
65
3,61
1
4,04
6 7,45
7
2,98
0
3,11
9
1,73
9 8,03
9 13,4
23
7,45
0
8,52
2
2,11
9
Phoenix-Mesa-
Scottsdale
Tucson ColoradoSprings
Denver-Aurora-
Lakewood
Albuq.-Rio
Rancho
OklahomaCity
Tulsa Austin-RoundRock
Dallas-Fort Worth-Arlington
El Paso SanAntonio-
NewBraunfels
Salt LakeCity
Moved to different state Moved from different state Moved from abroad
Note: Data does not include residents one year ago that moved abroad; therefore, a direct net migration measurement is not calculated.
3. Out-of-State MoversInmigration and Outmigration
New
Jer
sey
Loui
siana
Miss
issip
piIo
wa
Indi
ana
Sout
h Da
kota
Miss
ouri
Utah
*N
ew Y
ork
Ala
bam
aFl
orid
aVi
rgin
iaW
ashi
ngto
nN
ebra
ska
Ala
ska
New
Ham
pshi
reDe
law
are
Verm
ont
Ore
gon
Ariz
ona*
Min
neso
taO
hio
Okl
ahom
a*To
tal
Penn
sylv
ania
Mar
ylan
dC
alifo
rnia
Ark
ansa
sC
olor
ado*
Texa
s*Ka
nsas
Con
nect
icut
Wisc
onsin
Haw
aii
Mas
sach
uset
tsIll
inoi
sM
onta
naN
evad
aId
aho
Mic
higa
nTe
nnes
see
Sout
h C
arol
ina
Nor
th C
arol
ina
Kent
ucky
Nor
th D
akot
aD.
C.
Geo
rgia
Mai
neW
yom
ing
Wes
t Virg
inia
Rhod
e Is
land
15.2
%16
.0%
16.0
%22
.9%
24.9
%25
.6%
27.1
%33
.2%
36.8
%36
.8%
37.7
%37
.8%
41.1
%44
.9%
45.1
%45
.4%
45.9
%47
.7%
49.7
%52
.1%
53.1
%53
.6%
53.6
%53
.9%
54.9
%55
.8%
56.6
%57
.2%
57.7
%58
.4%
60.5
%61
.3%
62.1
%62
.8%
63.2
%63
.2%
65.1
%65
.3%
65.5
%68
.6%
69.0
%76
.4%
77.3
%77
.7%
79.7
%82
.3%
82.7
%82
.7%
86.4
%10
0.0%
100.
0%
2. New Mexico's Migration Distribution by StatePercentage of Movers by Inmigration & Outmigration, 2012
Inmigration Outmigration
* Denotes neighboring state of New Mexico.
14
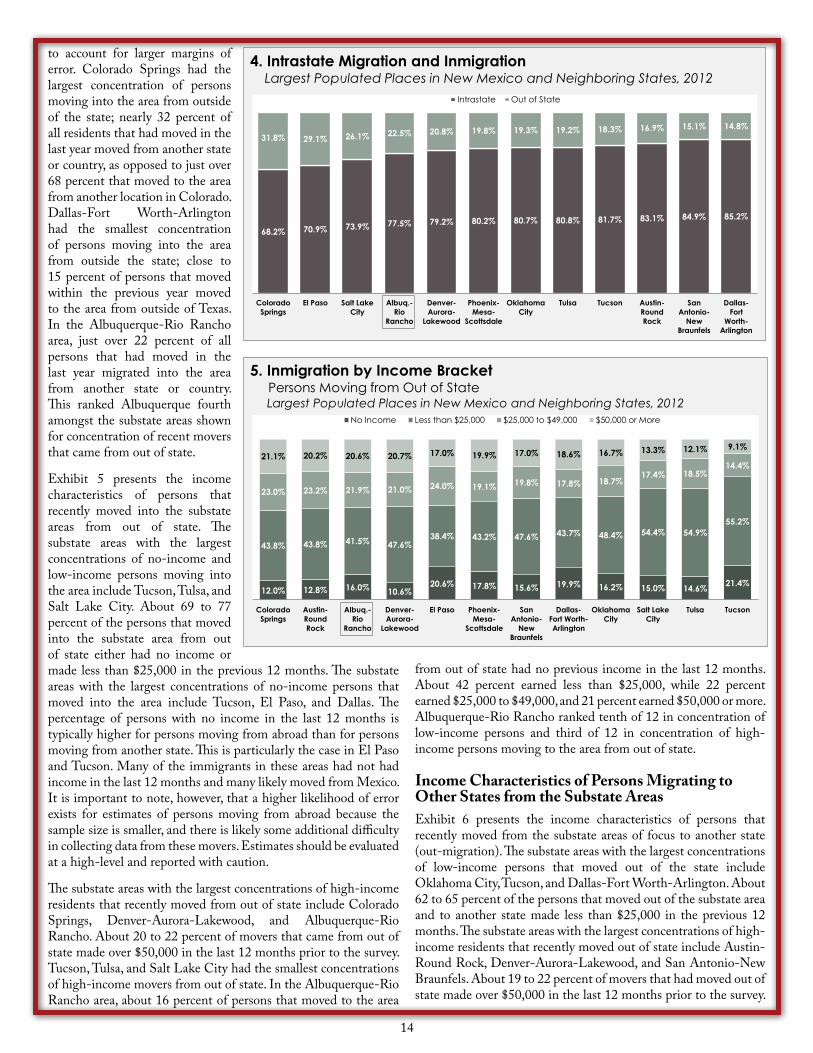
to account for larger margins of error. Colorado Springs had the largest concentration of persons moving into the area from outside of the state; nearly 32 percent of all residents that had moved in the last year moved from another state or country, as opposed to just over 68 percent that moved to the area from another location in Colorado. Dallas-Fort Worth-Arlington had the smallest concentration of persons moving into the area from outside the state; close to 15 percent of persons that moved within the previous year moved to the area from outside of Texas. In the Albuquerque-Rio Rancho area, just over 22 percent of all persons that had moved in the last year migrated into the area from another state or country. This ranked Albuquerque fourth amongst the substate areas shown for concentration of recent movers that came from out of state.
Exhibit 5 presents the income characteristics of persons that recently moved into the substate areas from out of state. The substate areas with the largest concentrations of no-income and low-income persons moving into the area include Tucson, Tulsa, and Salt Lake City. About 69 to 77 percent of the persons that moved into the substate area from out of state either had no income or made less than $25,000 in the previous 12 months. The substate areas with the largest concentrations of no-income persons that moved into the area include Tucson, El Paso, and Dallas. The percentage of persons with no income in the last 12 months is typically higher for persons moving from abroad than for persons moving from another state. This is particularly the case in El Paso and Tucson. Many of the immigrants in these areas had not had income in the last 12 months and many likely moved from Mexico. It is important to note, however, that a higher likelihood of error exists for estimates of persons moving from abroad because the sample size is smaller, and there is likely some additional difficulty in collecting data from these movers. Estimates should be evaluated at a high-level and reported with caution.
The substate areas with the largest concentrations of high-income residents that recently moved from out of state include Colorado Springs, Denver-Aurora-Lakewood, and Albuquerque-Rio Rancho. About 20 to 22 percent of movers that came from out of state made over $50,000 in the last 12 months prior to the survey. Tucson, Tulsa, and Salt Lake City had the smallest concentrations of high-income movers from out of state. In the Albuquerque-Rio Rancho area, about 16 percent of persons that moved to the area
from out of state had no previous income in the last 12 months. About 42 percent earned less than $25,000, while 22 percent earned $25,000 to $49,000, and 21 percent earned $50,000 or more. Albuquerque-Rio Rancho ranked tenth of 12 in concentration of low-income persons and third of 12 in concentration of high-income persons moving to the area from out of state.
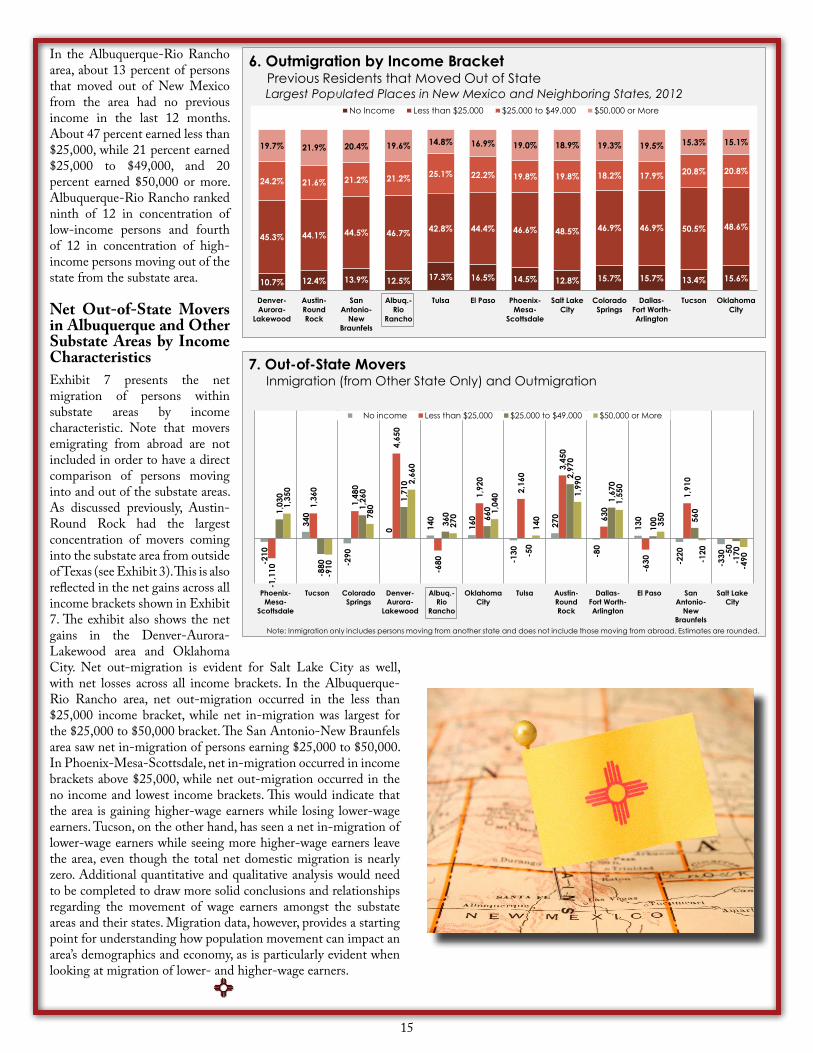
Income Characteristics of Persons Migrating to Other States from the Substate AreasExhibit 6 presents the income characteristics of persons that recently moved from the substate areas of focus to another state (out-migration). The substate areas with the largest concentrations of low-income persons that moved out of the state include Oklahoma City, Tucson, and Dallas-Fort Worth-Arlington. About 62 to 65 percent of the persons that moved out of the substate area and to another state made less than $25,000 in the previous 12 months. The substate areas with the largest concentrations of high-income residents that recently moved out of state include Austin-Round Rock, Denver-Aurora-Lakewood, and San Antonio-New Braunfels. About 19 to 22 percent of movers that had moved out of state made over $50,000 in the last 12 months prior to the survey.
12.0% 12.8% 16.0% 10.6%20.6% 17.8% 15.6% 19.9% 16.2% 15.0% 14.6% 21.4%
43.8% 43.8% 41.5% 47.6%38.4% 43.2% 47.6% 43.7% 48.4% 54.4% 54.9%
55.2%
23.0% 23.2% 21.9% 21.0% 24.0% 19.1% 19.8% 17.8% 18.7%17.4% 18.5%
14.4%21.1% 20.2% 20.6% 20.7% 17.0% 19.9% 17.0% 18.6% 16.7% 13.3% 12.1% 9.1%
ColoradoSprings
Austin-RoundRock
Albuq.-Rio
Rancho
Denver-Aurora-
Lakewood
El Paso Phoenix-Mesa-
Scottsdale
SanAntonio-
NewBraunfels
Dallas-Fort Worth-Arlington
OklahomaCity
Salt LakeCity
Tulsa Tucson
No Income Less than $25,000 $25,000 to $49,000 $50,000 or More
5. Inmigration by Income BracketPersons Moving from Out of StateLargest Populated Places in New Mexico and Neighboring States, 2012
68.2% 70.9% 73.9% 77.5% 79.2% 80.2% 80.7% 80.8% 81.7% 83.1% 84.9% 85.2%
31.8% 29.1% 26.1% 22.5% 20.8% 19.8% 19.3% 19.2% 18.3% 16.9% 15.1% 14.8%
ColoradoSprings
El Paso Salt LakeCity
Albuq.-Rio
Rancho
Denver-Aurora-
Lakewood
Phoenix-Mesa-
Scottsdale
OklahomaCity
Tulsa Tucson Austin-RoundRock
SanAntonio-
NewBraunfels
Dallas-Fort
Worth-Arlington
Intrastate Out of State
4. Intrastate Migration and InmigrationLargest Populated Places in New Mexico and Neighboring States, 2012
15
In the Albuquerque-Rio Rancho area, about 13 percent of persons that moved out of New Mexico from the area had no previous income in the last 12 months. About 47 percent earned less than $25,000, while 21 percent earned $25,000 to $49,000, and 20 percent earned $50,000 or more. Albuquerque-Rio Rancho ranked ninth of 12 in concentration of low-income persons and fourth of 12 in concentration of high-income persons moving out of the state from the substate area.
Net Out-of-State Movers in Albuquerque and Other Substate Areas by Income CharacteristicsExhibit 7 presents the net migration of persons within substate areas by income characteristic. Note that movers emigrating from abroad are not included in order to have a direct comparison of persons moving into and out of the substate areas. As discussed previously, Austin-Round Rock had the largest concentration of movers coming into the substate area from outside of Texas (see Exhibit 3). This is also reflected in the net gains across all income brackets shown in Exhibit 7. The exhibit also shows the net gains in the Denver-Aurora-Lakewood area and Oklahoma City. Net out-migration is evident for Salt Lake City as well, with net losses across all income brackets. In the Albuquerque-Rio Rancho area, net out-migration occurred in the less than $25,000 income bracket, while net in-migration was largest for the $25,000 to $50,000 bracket. The San Antonio-New Braunfels area saw net in-migration of persons earning $25,000 to $50,000. In Phoenix-Mesa-Scottsdale, net in-migration occurred in income brackets above $25,000, while net out-migration occurred in the no income and lowest income brackets. This would indicate that the area is gaining higher-wage earners while losing lower-wage earners. Tucson, on the other hand, has seen a net in-migration of lower-wage earners while seeing more higher-wage earners leave the area, even though the total net domestic migration is nearly zero. Additional quantitative and qualitative analysis would need to be completed to draw more solid conclusions and relationships regarding the movement of wage earners amongst the substate areas and their states. Migration data, however, provides a starting point for understanding how population movement can impact an area’s demographics and economy, as is particularly evident when looking at migration of lower- and higher-wage earners.
-210
340
-290
0 140
160
-130
270
-80
130
-220
-330
-1,1
10
1,36
0
1,48
0
4,65
0
-680
1,92
0
2,16
0
3,45
0
630
-630
1,91
0
-50
1,03
0
-880
1,26
0
1,71
0
360 66
0
-50
2,97
0
1,67
0
100 56
0
-170
1,35
0
-910
780
2,66
0
270 1,
040
140
1,99
0
1,55
0
350
-120
-490
Phoenix-Mesa-
Scottsdale
Tucson ColoradoSprings
Denver-Aurora-
Lakewood
Albuq.-Rio
Rancho
OklahomaCity
Tulsa Austin-RoundRock
Dallas-Fort Worth-Arlington
El Paso SanAntonio-
NewBraunfels
Salt LakeCity
No income Less than $25,000 $25,000 to $49,000 $50,000 or More
7. Out-of-State MoversInmigration (from Other State Only) and Outmigration
Note: Inmigration only includes persons moving from another state and does not include those moving from abroad. Estimates are rounded.
10.7% 12.4% 13.9% 12.5% 17.3% 16.5% 14.5% 12.8% 15.7% 15.7% 13.4% 15.6%
45.3% 44.1% 44.5% 46.7% 42.8% 44.4% 46.6% 48.5% 46.9% 46.9% 50.5% 48.6%
24.2% 21.6% 21.2% 21.2% 25.1% 22.2% 19.8% 19.8% 18.2% 17.9% 20.8% 20.8%
19.7% 21.9% 20.4% 19.6% 14.8% 16.9% 19.0% 18.9% 19.3% 19.5% 15.3% 15.1%
Denver-Aurora-
Lakewood
Austin-RoundRock
SanAntonio-
NewBraunfels
Albuq.-Rio
Rancho
Tulsa El Paso Phoenix-Mesa-
Scottsdale
Salt LakeCity
ColoradoSprings
Dallas-Fort Worth-Arlington
Tucson OklahomaCity
No Income Less than $25,000 $25,000 to $49,000 $50,000 or More
6. Outmigration by Income BracketPrevious Residents that Moved Out of StateLargest Populated Places in New Mexico and Neighboring States, 2012

16
NM Occupational Shortages & SurplusesThe following designations are based on posted job orders & resumes entered in the NM Workforce Connection System (www.jobs.state.nm.us) by occupation in the last 30 days (March 2014).
Adult Basic & Secondary Edu. & Literacy Mechanical Engineers Business Operations Spclst, All Other Heavy & Tractor-Trailer Truck DriversTeachers & Instructors Mental Health & Substance Abuse Social Wkrs Cooks, Institution & Cafeteria Receptionists & Info. Clerks
Aerospace Engineering & Operations Techs Middle Sch. Teachers, Ex. Special & Counter & Rental Clerks Secretaries & Admin. Assts., Ex. Legal, Bakers Career/Tech. Edu. Exec. Secretaries & Exec. Admin. Assts. Medical & Exec.Bus & Truck Mechanics & Diesel Engine Spclst Nurse Practitioners Shipping, Receiving & Traffic ClerksCardiovascular Technologists & Techs Occupational Therapists Stock Clerks- Stockroom, Warehouse, or Civil Engineers Office Clerks, General Storage YardCoaches & Scouts Personal Financial AdvisorsComputer Systems Analysts PharmacistsElementary Sch. Teachers, Ex. Special Edu. Physical TherapistsEmergency Medical Techs & Paramedics Recreation WkrsEngineers, All Other Registered NursesHealth Specialties Teachers, Postsecondary Residential AdvisorsHealthcare Practitioners & Respiratory Therapists
Technical Wkrs, All Other Secondary Sch. Teachers, Ex. Special & Insurance Sales Agents Career/Tech. Edu.Internists, General Sheriffs & Deputy SheriffsLicensed Practical & Vocational Nurses Software Developers, ApplicationsLifeguards, Ski Patrol & Other Recreational Speech-Language Pathologists
Protective Service Wkrs Teachers & Instructors, All OtherMaintenance Wkrs, Machinery Therapists, All Other
Adult Basic & Secondary Edu. & Literacy Maintenance Wkrs, Machinery Bookkeeping, Accounting & Auditing Clerks Hosts & Hostesses, Restaurant, Lounge Teachers & Instructors Mechanical Engineers Cashiers & Coffee Shop
Aerospace Engineering & Operations Techs Nurse Practitioners Couriers & Messengers Laborers & Freight/Stock/Material MvrsBakers Occupational Therapists Dishwashers Maintenance & Repair Wkrs, GeneralCardiovascular Technologists & Techs Office Clerks, General Exec. Secretaries & Exec. Admin. Assts. Receptionists & Info. ClerksComputer Systems Analysts Personal Financial Advisors Helpers--Production Wkrs Secretaries & Admin. Assts., Ex. Legal,Emergency Medical Techs & Paramedics Pharmacists Medical & Exec.Engineers, All Other Physical Therapists Stock Clerks- Stockroom, Warehouse, or Health Specialties Teachers, Postsecondary Police Patrol Officers Storage YardHealthcare Practitioners & Recreation Wkrs
Technical Wkrs, All Other Registered NursesInsurance Sales Agents Respiratory TherapistsInternists, General Software Developers, ApplicationsLicensed Practical & Vocational Nurses Speech-Language PathologistsLifeguards, Ski Patrol & Other Recreational Teachers & Instructors, All Other
Protective Service Wkrs Therapists, All Other
Middle Sch. Teachers, Ex. Special & Career/Tech. Edu. Correctional Officers & Jailers
Licensed Practical & Vocational Nurses Janitors/Cleaners, Ex. Maids & House Taxi Drivers & ChauffeursPersonal Care Aides
Coaches & Scouts Recreation WkrsElementary Sch. Teachers, Ex. Special Edu. Secondary Sch. Teachers, Ex. Special & Middle Sch. Teachers, Ex. Special & Career/Tech. Edu.
Career/Tech. Edu.
Waiters & WaitressesNursing Aids, Orderlies & Attendants
*Occupational Rollover is an indicator of occupational activity with numerous job openings & referrals in NM Workforce Connection.
Farmington MSA
Las Cruces MSA
Santa Fe MSA
Occupational Rollover Statistics*
SHORTAGES SURPLUSESStatewide Summary Statewide Summary
Albuquerque MSA
Farmington MSA
Las Cruces MSA
Santa Fe MSA
Albuquerque MSA

17
Public Admin.19%
Retail Trade18%
Health Care & Social Assist.
13%
Admin., Support, Waste Mgmt
8%
Information6%
Accommodation & Food Svcs
5%
Prof., Scientific & Tech Svcs
4%
Transp. & Warehousing
3%
Manufacturing3%
Arts, Entertain.,& Rec.
3%
Finance & Insurance3%
Arts, Entertain., & Rec.3%
Utilities2%
OtherServices
2%
Mgmt ofCompanies
1%EducationServices
1%
OtherServices
1%
Wholesale Trade1%
Government1% Mining
0%
New Mexico Workforce Connection Posted Job Openings by Industry March 2014
18
Labor Market Information Quick Reference and Fast Facts
New Mexico – Seasonally Adjusted Labor Force, Employment, Unemployment &
Unemployment RateTotal Nonfarm Employment Growth
Rankings, New Mexico and United States
March MarchState Rank 2013 2014 Change ChangeNorth Dakota 1 433.5 452.5 19.0 4.4%Nevada 2 1,158.3 1,205.5 47.2 4.1%Florida 3 7,573.4 7,799.2 225.8 3.0%Oregon 4 1,648.4 1,694.8 46.4 2.8%Utah 4 1,274.4 1,310.2 35.8 2.8%Texas 6 11,095.7 11,400.5 304.8 2.7%Colorado 7 2,349.9 2,410.7 60.8 2.6%California 8 15,005.8 15,354.0 348.2 2.3%South Carolina 9 1,877.7 1,917.1 39.4 2.1%Washington 10 2,944.7 3,004.1 59.4 2.0%Delaware 11 419.4 427.4 8.0 1.9%Arizona 11 2,518.3 2,565.7 47.4 1.9%North Carolina 13 4,023.3 4,094.8 71.5 1.8%Georgia 14 3,995.2 4,064.2 69.0 1.7%Missouri 14 2,700.6 2,745.6 45.0 1.7%United States 134,917.0 137,135.0 2,218.0 1.6%Tennessee 16 2,730.4 2,774.9 44.5 1.6%Minnesota 17 2,722.8 2,764.4 41.6 1.5%New Hampshire 17 628.8 638.0 9.2 1.5%Indiana 17 2,901.9 2,944.3 42.4 1.5%Oklahoma 20 1,626.3 1,649.3 23.0 1.4%Iowa 20 1,501.6 1,522.5 20.9 1.4%Maine 20 579.8 587.7 7.9 1.4%Rhode Island 23 461.3 467.5 6.2 1.3%Massachusetts 23 3,299.0 3,341.0 42.0 1.3%Kansas 25 1,358.9 1,375.7 16.8 1.2%Wyoming 25 283.4 286.8 3.4 1.2%New York 25 8,794.4 8,898.0 103.6 1.2%Arkansas 28 1,176.6 1,189.6 13.0 1.1%Ohio 29 5,162.4 5,213.4 51.0 1.0%Wisconsin 29 2,769.3 2,796.6 27.3 1.0%Nebraska 31 965.9 974.0 8.1 0.8%Montana 31 439.1 442.7 3.6 0.8%Hawaii 31 618.7 623.6 4.9 0.8%Alabama 31 1,896.5 1,911.2 14.7 0.8%Louisiana 35 1,944.5 1,958.9 14.4 0.7%Idaho 35 626.1 630.6 4.5 0.7%Connecticut 35 1,629.6 1,640.5 10.9 0.7%Vermont 38 305.6 307.4 1.8 0.6%District of Columbia 39 741.5 745.2 3.7 0.5%Mississippi 39 1,110.1 1,115.6 5.5 0.5%Maryland 39 2,573.2 2,585.5 12.3 0.5%Michigan 39 4,051.0 4,070.2 19.2 0.5%Illinois 39 5,718.0 5,744.2 26.2 0.5%South Dakota 44 408.6 410.2 1.6 0.4%West Virginia 45 758.9 761.4 2.5 0.3%Pennsylvania 46 5,702.0 5,712.7 10.7 0.2%Alaska 46 324.2 324.8 0.6 0.2%Virginia 48 3,740.0 3,741.1 1.1 0.0%Kentucky 48 1,819.6 1,819.9 0.3 0.0%New Mexico 50 809.9 808.9 -1.0 -0.1%New Jersey 51 3,888.2 3,874.5 -13.7 -0.4%Source: U.S. Department of Labor, Bureau of Labor StatisticsEmployment numbers are not seasonally adjusted.Employment numbers are in thousands.
Civilian Un- Unadj.Labor Employ- employ- Rate RateForce ment ment % %
1994 776,827 725,387 51,440 6.6%1995 798,621 744,557 54,064 6.8%1996 812,862 751,826 61,036 7.5%1997 822,627 768,596 54,031 6.6%1998 835,879 783,661 52,218 6.2%1999 839,988 793,052 46,936 5.6%2000 852,293 810,024 42,269 5.0%2001 863,682 821,003 42,679 4.9%2002 871,512 823,191 48,321 5.5%2003 888,468 835,835 52,633 5.9%2004 901,833 849,970 51,863 5.8%2005 913,453 866,349 47,104 5.2%2006 924,516 886,708 37,808 4.1%2007 936,464 903,919 32,545 3.5%2008 947,435 904,735 42,700 4.5%2009 934,396 870,349 64,047 6.9%2010 930,293 856,033 74,260 8.0%2011 923,936 853,987 69,949 7.6%2012 925,360 859,965 65,395 7.1%2013 926,242 862,563 63,679 6.9%
2013 JAN 927,728 863,686 64,042 6.9% 7.3%FEB 927,862 863,962 63,900 6.9% 7.3%MAR 927,960 864,143 63,817 6.9% 6.8%APR 927,982 864,139 63,843 6.9% 6.4%MAY 927,688 863,608 64,080 6.9% 6.6%JUN 927,039 862,631 64,408 6.9% 7.6%JUL 926,212 861,617 64,595 7.0% 7.6%AUG 925,366 861,017 64,349 7.0% 6.9%SEP 924,620 860,920 63,700 6.9% 6.6%OCT 924,106 861,202 62,904 6.8% 6.7%NOV 923,739 861,634 62,105 6.7% 6.3%DEC 923,654 862,287 61,367 6.6% 6.3%
2014 JAN 927,739 866,155 61,584 6.6% 6.9%FEB 932,698 869,961 62,737 6.7% 7.3%MAR 938,119 872,579 65,540 7.0% 7.3%APRMAYJUNJULAUGSEPOCTNOVDEC
# CHANGE FROMMonth Ago 5,421 2,618 2,803 0.3% 0.0%Year Ago 10,159 8,436 1,723 0.1% 0.5%2 Yrs. Ago 12,849 12,486 363 0.0% 0.3%3 Yrs. Ago 12,735 17,686 -4,951 -0.6% -0.3%
% CHANGE FROMMonth Ago 0.6% 0.3% 4.5%Year Ago 1.1% 1.0% 2.7%2 Yrs. Ago 1.4% 1.5% 0.6%3 Yrs. Ago 1.4% 2.1% -7.0%
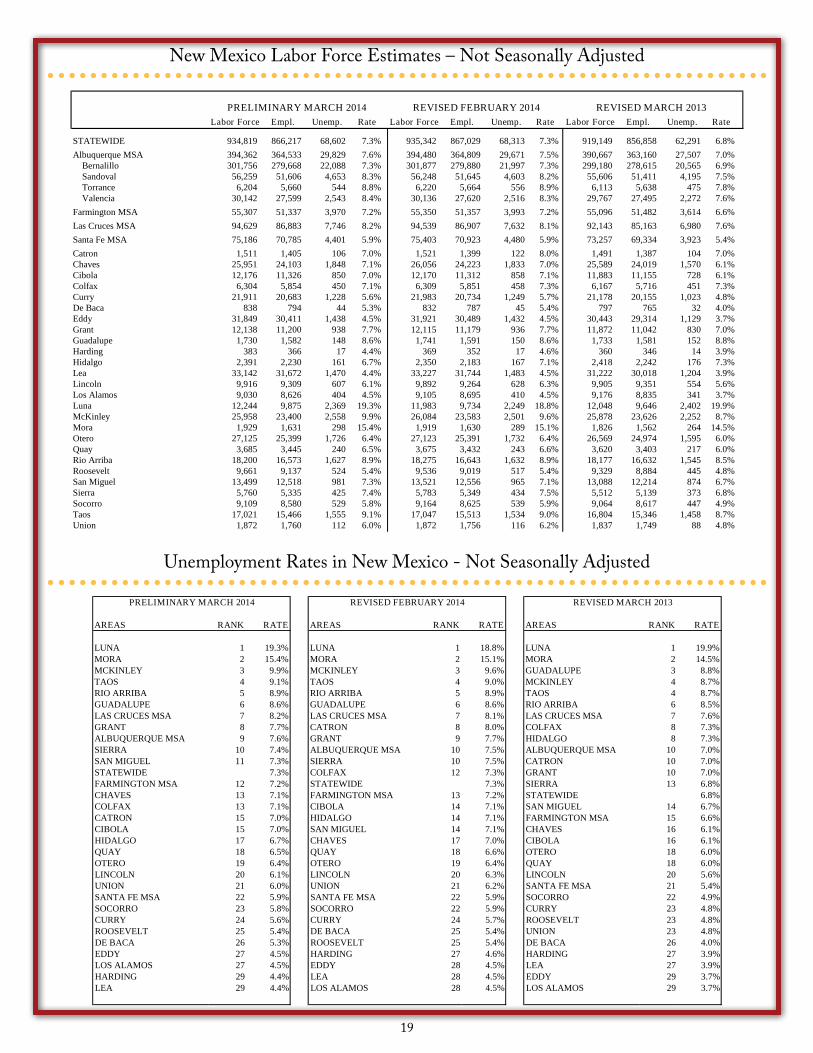
19
New Mexico Labor Force Estimates – Not Seasonally Adjusted
Unemployment Rates in New Mexico - Not Seasonally Adjusted
REVISED FEBRUARY 2014Labor Force Empl. Unemp. Rate Labor Force Empl. Unemp. Rate Labor Force Empl. Unemp. Rate
STATEWIDE 934,819 866,217 68,602 7.3% 935,342 867,029 68,313 7.3% 919,149 856,858 62,291 6.8%Albuquerque MSA 394,362 364,533 29,829 7.6% 394,480 364,809 29,671 7.5% 390,667 363,160 27,507 7.0% Bernalillo 301,756 279,668 22,088 7.3% 301,877 279,880 21,997 7.3% 299,180 278,615 20,565 6.9% Sandoval 56,259 51,606 4,653 8.3% 56,248 51,645 4,603 8.2% 55,606 51,411 4,195 7.5% Torrance 6,204 5,660 544 8.8% 6,220 5,664 556 8.9% 6,113 5,638 475 7.8% Valencia 30,142 27,599 2,543 8.4% 30,136 27,620 2,516 8.3% 29,767 27,495 2,272 7.6%Farmington MSA 55,307 51,337 3,970 7.2% 55,350 51,357 3,993 7.2% 55,096 51,482 3,614 6.6%Las Cruces MSA 94,629 86,883 7,746 8.2% 94,539 86,907 7,632 8.1% 92,143 85,163 6,980 7.6%Santa Fe MSA 75,186 70,785 4,401 5.9% 75,403 70,923 4,480 5.9% 73,257 69,334 3,923 5.4%Catron 1,511 1,405 106 7.0% 1,521 1,399 122 8.0% 1,491 1,387 104 7.0%Chaves 25,951 24,103 1,848 7.1% 26,056 24,223 1,833 7.0% 25,589 24,019 1,570 6.1%Cibola 12,176 11,326 850 7.0% 12,170 11,312 858 7.1% 11,883 11,155 728 6.1%Colfax 6,304 5,854 450 7.1% 6,309 5,851 458 7.3% 6,167 5,716 451 7.3%Curry 21,911 20,683 1,228 5.6% 21,983 20,734 1,249 5.7% 21,178 20,155 1,023 4.8%De Baca 838 794 44 5.3% 832 787 45 5.4% 797 765 32 4.0%Eddy 31,849 30,411 1,438 4.5% 31,921 30,489 1,432 4.5% 30,443 29,314 1,129 3.7%Grant 12,138 11,200 938 7.7% 12,115 11,179 936 7.7% 11,872 11,042 830 7.0%Guadalupe 1,730 1,582 148 8.6% 1,741 1,591 150 8.6% 1,733 1,581 152 8.8%Harding 383 366 17 4.4% 369 352 17 4.6% 360 346 14 3.9%Hidalgo 2,391 2,230 161 6.7% 2,350 2,183 167 7.1% 2,418 2,242 176 7.3%Lea 33,142 31,672 1,470 4.4% 33,227 31,744 1,483 4.5% 31,222 30,018 1,204 3.9%Lincoln 9,916 9,309 607 6.1% 9,892 9,264 628 6.3% 9,905 9,351 554 5.6%Los Alamos 9,030 8,626 404 4.5% 9,105 8,695 410 4.5% 9,176 8,835 341 3.7%Luna 12,244 9,875 2,369 19.3% 11,983 9,734 2,249 18.8% 12,048 9,646 2,402 19.9%McKinley 25,958 23,400 2,558 9.9% 26,084 23,583 2,501 9.6% 25,878 23,626 2,252 8.7%Mora 1,929 1,631 298 15.4% 1,919 1,630 289 15.1% 1,826 1,562 264 14.5%Otero 27,125 25,399 1,726 6.4% 27,123 25,391 1,732 6.4% 26,569 24,974 1,595 6.0%Quay 3,685 3,445 240 6.5% 3,675 3,432 243 6.6% 3,620 3,403 217 6.0%Rio Arriba 18,200 16,573 1,627 8.9% 18,275 16,643 1,632 8.9% 18,177 16,632 1,545 8.5%Roosevelt 9,661 9,137 524 5.4% 9,536 9,019 517 5.4% 9,329 8,884 445 4.8%San Miguel 13,499 12,518 981 7.3% 13,521 12,556 965 7.1% 13,088 12,214 874 6.7%Sierra 5,760 5,335 425 7.4% 5,783 5,349 434 7.5% 5,512 5,139 373 6.8%Socorro 9,109 8,580 529 5.8% 9,164 8,625 539 5.9% 9,064 8,617 447 4.9%Taos 17,021 15,466 1,555 9.1% 17,047 15,513 1,534 9.0% 16,804 15,346 1,458 8.7%Union 1,872 1,760 112 6.0% 1,872 1,756 116 6.2% 1,837 1,749 88 4.8%
PRELIMINARY MARCH 2014 REVISED MARCH 2013
PRELIMINARY MARCH 2014 REVISED FEBRUARY 2014 REVISED MARCH 2013
AREAS RANK RATE AREAS RANK RATE AREAS RANK RATE
LUNA 1 19.3% LUNA 1 18.8% LUNA 1 19.9%MORA 2 15.4% MORA 2 15.1% MORA 2 14.5%MCKINLEY 3 9.9% MCKINLEY 3 9.6% GUADALUPE 3 8.8%TAOS 4 9.1% TAOS 4 9.0% MCKINLEY 4 8.7%RIO ARRIBA 5 8.9% RIO ARRIBA 5 8.9% TAOS 4 8.7%GUADALUPE 6 8.6% GUADALUPE 6 8.6% RIO ARRIBA 6 8.5%LAS CRUCES MSA 7 8.2% LAS CRUCES MSA 7 8.1% LAS CRUCES MSA 7 7.6%GRANT 8 7.7% CATRON 8 8.0% COLFAX 8 7.3%ALBUQUERQUE MSA 9 7.6% GRANT 9 7.7% HIDALGO 8 7.3%SIERRA 10 7.4% ALBUQUERQUE MSA 10 7.5% ALBUQUERQUE MSA 10 7.0%SAN MIGUEL 11 7.3% SIERRA 10 7.5% CATRON 10 7.0%STATEWIDE 7.3% COLFAX 12 7.3% GRANT 10 7.0%FARMINGTON MSA 12 7.2% STATEWIDE 7.3% SIERRA 13 6.8%CHAVES 13 7.1% FARMINGTON MSA 13 7.2% STATEWIDE 6.8%COLFAX 13 7.1% CIBOLA 14 7.1% SAN MIGUEL 14 6.7%CATRON 15 7.0% HIDALGO 14 7.1% FARMINGTON MSA 15 6.6%CIBOLA 15 7.0% SAN MIGUEL 14 7.1% CHAVES 16 6.1%HIDALGO 17 6.7% CHAVES 17 7.0% CIBOLA 16 6.1%QUAY 18 6.5% QUAY 18 6.6% OTERO 18 6.0%OTERO 19 6.4% OTERO 19 6.4% QUAY 18 6.0%LINCOLN 20 6.1% LINCOLN 20 6.3% LINCOLN 20 5.6%UNION 21 6.0% UNION 21 6.2% SANTA FE MSA 21 5.4%SANTA FE MSA 22 5.9% SANTA FE MSA 22 5.9% SOCORRO 22 4.9%SOCORRO 23 5.8% SOCORRO 22 5.9% CURRY 23 4.8%CURRY 24 5.6% CURRY 24 5.7% ROOSEVELT 23 4.8%ROOSEVELT 25 5.4% DE BACA 25 5.4% UNION 23 4.8%DE BACA 26 5.3% ROOSEVELT 25 5.4% DE BACA 26 4.0%EDDY 27 4.5% HARDING 27 4.6% HARDING 27 3.9%LOS ALAMOS 27 4.5% EDDY 28 4.5% LEA 27 3.9%HARDING 29 4.4% LEA 28 4.5% EDDY 29 3.7%LEA 29 4.4% LOS ALAMOS 28 4.5% LOS ALAMOS 29 3.7%
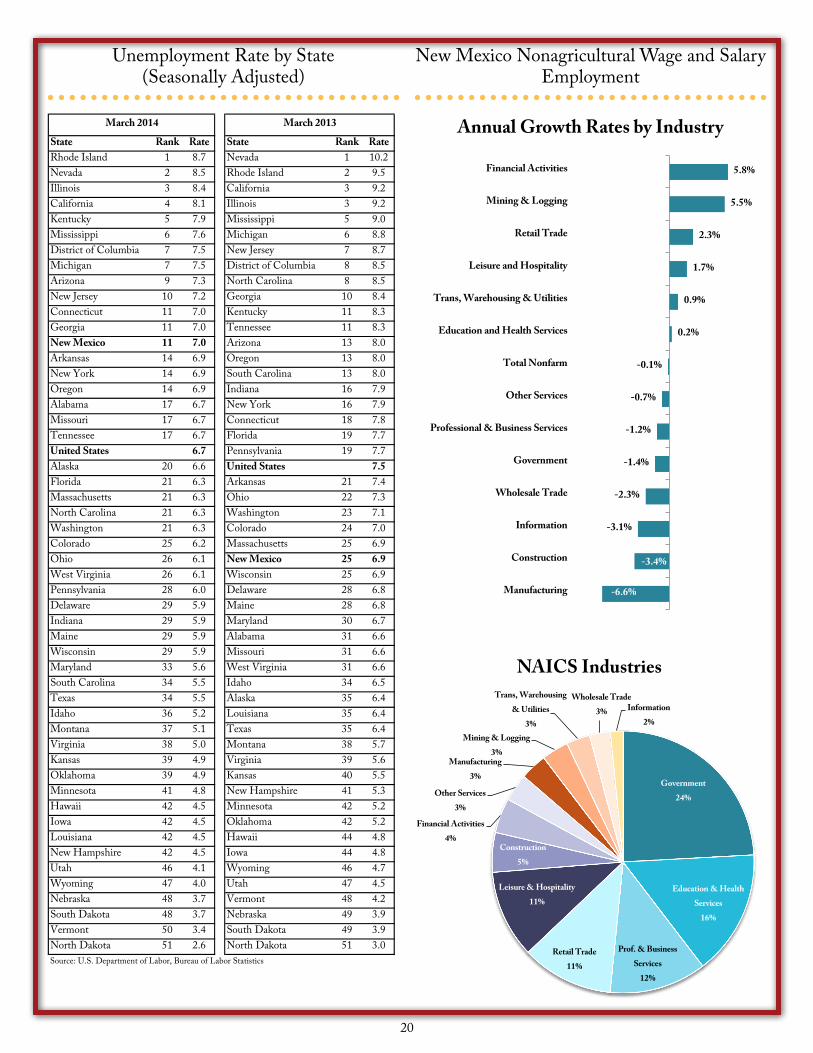
20
Unemployment Rate by State (Seasonally Adjusted)
New Mexico Nonagricultural Wage and Salary Employment
Annual Growth Rates by Industry
NAICS Industries
Government24%
Education & Health Services
16%
Prof. & Business Services
12%
Retail Trade11%
Leisure & Hospitality11%
Construction5%
Financial Activities4%
Other Services3%
Manufacturing3%
Mining & Logging3%
Trans, Warehousing & Utilities
3%
Wholesale Trade3% Information
2%
-6.6%
-3.4%
-3.1%
-2.3%
-1.4%
-1.2%
-0.7%
-0.1%
0.2%
0.9%
1.7%
2.3%
5.5%
5.8%
Manufacturing
Construction
Information
Wholesale Trade
Government
Professional & Business Services
Other Services
Total Nonfarm
Education and Health Services
Trans, Warehousing & Utilities
Leisure and Hospitality
Retail Trade
Mining & Logging
Financial Activities
State Rank Rate State Rank RateRhode Island 1 8.7 Nevada 1 10.2Nevada 2 8.5 Rhode Island 2 9.5Illinois 3 8.4 California 3 9.2California 4 8.1 Illinois 3 9.2Kentucky 5 7.9 Mississippi 5 9.0Mississippi 6 7.6 Michigan 6 8.8District of Columbia 7 7.5 New Jersey 7 8.7Michigan 7 7.5 District of Columbia 8 8.5Arizona 9 7.3 North Carolina 8 8.5New Jersey 10 7.2 Georgia 10 8.4Connecticut 11 7.0 Kentucky 11 8.3Georgia 11 7.0 Tennessee 11 8.3New Mexico 11 7.0 Arizona 13 8.0Arkansas 14 6.9 Oregon 13 8.0New York 14 6.9 South Carolina 13 8.0Oregon 14 6.9 Indiana 16 7.9Alabama 17 6.7 New York 16 7.9Missouri 17 6.7 Connecticut 18 7.8Tennessee 17 6.7 Florida 19 7.7United States 6.7 Pennsylvania 19 7.7Alaska 20 6.6 United States 7.5Florida 21 6.3 Arkansas 21 7.4Massachusetts 21 6.3 Ohio 22 7.3North Carolina 21 6.3 Washington 23 7.1Washington 21 6.3 Colorado 24 7.0Colorado 25 6.2 Massachusetts 25 6.9Ohio 26 6.1 New Mexico 25 6.9West Virginia 26 6.1 Wisconsin 25 6.9Pennsylvania 28 6.0 Delaware 28 6.8Delaware 29 5.9 Maine 28 6.8Indiana 29 5.9 Maryland 30 6.7Maine 29 5.9 Alabama 31 6.6Wisconsin 29 5.9 Missouri 31 6.6Maryland 33 5.6 West Virginia 31 6.6South Carolina 34 5.5 Idaho 34 6.5Texas 34 5.5 Alaska 35 6.4Idaho 36 5.2 Louisiana 35 6.4Montana 37 5.1 Texas 35 6.4Virginia 38 5.0 Montana 38 5.7Kansas 39 4.9 Virginia 39 5.6Oklahoma 39 4.9 Kansas 40 5.5Minnesota 41 4.8 New Hampshire 41 5.3Hawaii 42 4.5 Minnesota 42 5.2Iowa 42 4.5 Oklahoma 42 5.2Louisiana 42 4.5 Hawaii 44 4.8New Hampshire 42 4.5 Iowa 44 4.8Utah 46 4.1 Wyoming 46 4.7Wyoming 47 4.0 Utah 47 4.5Nebraska 48 3.7 Vermont 48 4.2South Dakota 48 3.7 Nebraska 49 3.9Vermont 50 3.4 South Dakota 49 3.9North Dakota 51 2.6 North Dakota 51 3.0Source: U.S. Department of Labor, Bureau of Labor Statistics
March 2014 March 2013
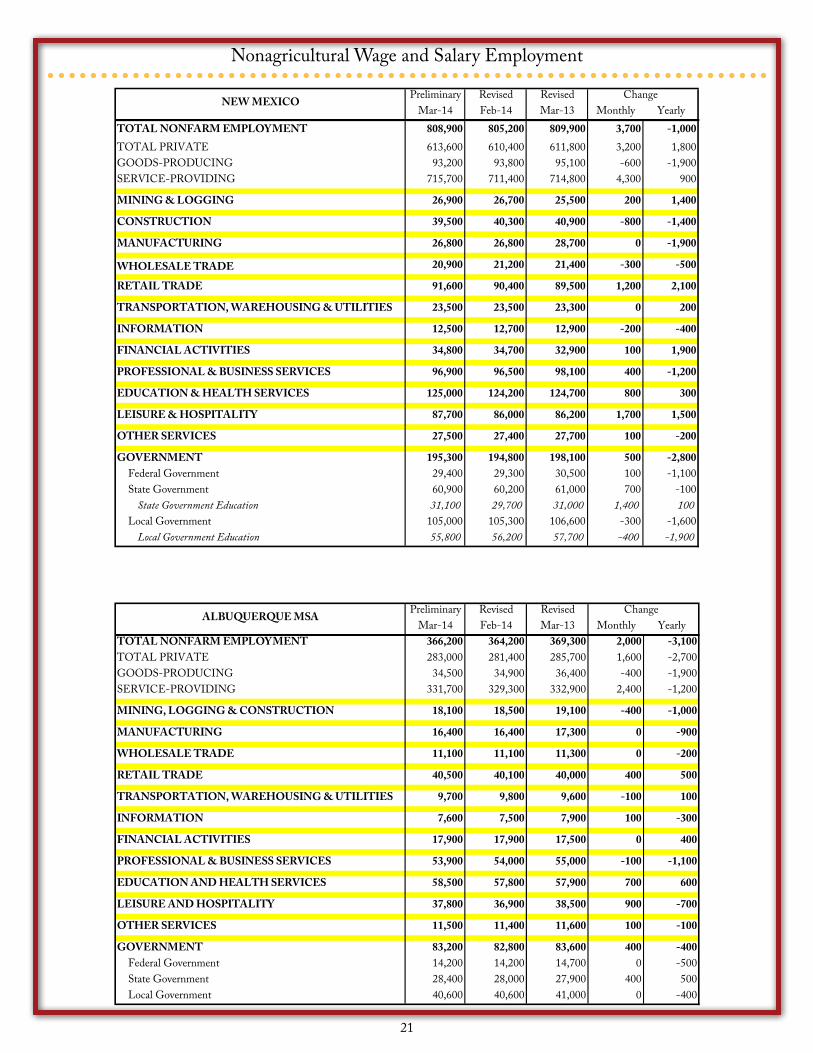
21
Nonagricultural Wage and Salary Employment
Preliminary Revised Revised ChangeMar-14 Feb-14 Mar-13 Monthly Yearly
TOTAL NONFARM EMPLOYMENT 366,200 364,200 369,300 2,000 -3,100TOTAL PRIVATE 283,000 281,400 285,700 1,600 -2,700GOODS-PRODUCING 34,500 34,900 36,400 -400 -1,900SERVICE-PROVIDING 331,700 329,300 332,900 2,400 -1,200
MINING, LOGGING & CONSTRUCTION 18,100 18,500 19,100 -400 -1,000
MANUFACTURING 16,400 16,400 17,300 0 -900
WHOLESALE TRADE 11,100 11,100 11,300 0 -200
RETAIL TRADE 40,500 40,100 40,000 400 500
TRANSPORTATION, WAREHOUSING & UTILITIES 9,700 9,800 9,600 -100 100
INFORMATION 7,600 7,500 7,900 100 -300
FINANCIAL ACTIVITIES 17,900 17,900 17,500 0 400
PROFESSIONAL & BUSINESS SERVICES 53,900 54,000 55,000 -100 -1,100
EDUCATION AND HEALTH SERVICES 58,500 57,800 57,900 700 600
LEISURE AND HOSPITALITY 37,800 36,900 38,500 900 -700
OTHER SERVICES 11,500 11,400 11,600 100 -100
GOVERNMENT 83,200 82,800 83,600 400 -400Federal Government 14,200 14,200 14,700 0 -500State Government 28,400 28,000 27,900 400 500Local Government 40,600 40,600 41,000 0 -400
ALBUQUERQUE MSA
Preliminary Revised Revised ChangeMar-14 Feb-14 Mar-13 Monthly Yearly
TOTAL NONFARM EMPLOYMENT 808,900 805,200 809,900 3,700 -1,000TOTAL PRIVATE 613,600 610,400 611,800 3,200 1,800GOODS-PRODUCING 93,200 93,800 95,100 -600 -1,900SERVICE-PROVIDING 715,700 711,400 714,800 4,300 900
MINING & LOGGING 26,900 26,700 25,500 200 1,400
CONSTRUCTION 39,500 40,300 40,900 -800 -1,400
MANUFACTURING 26,800 26,800 28,700 0 -1,900
WHOLESALE TRADE 20,900 21,200 21,400 -300 -500
RETAIL TRADE 91,600 90,400 89,500 1,200 2,100
TRANSPORTATION, WAREHOUSING & UTILITIES 23,500 23,500 23,300 0 200
INFORMATION 12,500 12,700 12,900 -200 -400
FINANCIAL ACTIVITIES 34,800 34,700 32,900 100 1,900
PROFESSIONAL & BUSINESS SERVICES 96,900 96,500 98,100 400 -1,200
EDUCATION & HEALTH SERVICES 125,000 124,200 124,700 800 300
LEISURE & HOSPITALITY 87,700 86,000 86,200 1,700 1,500
OTHER SERVICES 27,500 27,400 27,700 100 -200
GOVERNMENT 195,300 194,800 198,100 500 -2,800Federal Government 29,400 29,300 30,500 100 -1,100State Government 60,900 60,200 61,000 700 -100
State Government Education 31,100 29,700 31,000 1,400 100Local Government 105,000 105,300 106,600 -300 -1,600
Local Government Education 55,800 56,200 57,700 -400 -1,900
NEW MEXICO

22
Nonagricultural Wage and Salary Employment
Preliminary Revised Revised ChangeMar-14 Feb-14 Mar-13 Monthly Yearly
TOTAL NONFARM EMPLOYMENT 71,100 70,600 70,600 500 500TOTAL PRIVATE 50,000 49,800 49,100 200 900GOODS-PRODUCING 5,900 6,000 6,100 -100 -200SERVICE-PROVIDING 65,200 64,600 64,500 600 700
MINING, LOGGING & CONSTRUCTION 3,400 3,400 3,400 0 0
MANUFACTURING 2,500 2,600 2,700 -100 -200
WHOLESALE TRADE 1,000 1,000 1,100 0 -100
RETAIL TRADE 7,600 7,600 7,300 0 300
TRANSPORTATION, WAREHOUSING & UTILITIES 1,800 1,800 1,900 0 -100
INFORMATION 900 900 900 0 0
FINANCIAL ACTIVITIES 2,600 2,600 2,500 0 100
PROFESSIONAL & BUSINESS SERVICES 7,200 7,200 6,900 0 300
EDUCATION & HEALTH SERVICES 13,500 13,300 13,100 200 400
LEISURE & HOSPITALITY 8,000 7,900 7,800 100 200
OTHER SERVICES 1,500 1,500 1,500 0 0
GOVERNMENT 21,100 20,800 21,500 300 -400 Federal 3,600 3,600 3,800 0 -200 State 8,400 8,200 8,600 200 -200 Local 9,100 9,000 9,100 100 0
Preliminary Revised Revised ChangeMar-14 Feb-14 Mar-13 Monthly Yearly
TOTAL NONFARM EMPLOYMENT 61,000 60,900 60,600 100 400TOTAL PRIVATE 44,200 44,100 43,800 100 400GOODS-PRODUCING 3,900 3,800 3,400 100 500SERVICE-PROVIDING 57,100 57,100 57,200 0 -100
MINING, LOGGING & CONSTRUCTION 3,100 3,000 2,600 100 500
MANUFACTURING 800 800 800 0 0
WHOLESALE TRADE 900 900 900 0 0
RETAIL TRADE 8,500 8,500 8,800 0 -300
TRANSPORTATION, WAREHOUSING & UTILITIES 700 700 700 0 0
INFORMATION 900 900 700 0 200
FINANCIAL ACTIVITIES 2,600 2,600 2,700 0 -100
PROFESSIONAL & BUSINESS SERVICES 4,300 4,200 4,300 100 0
EDUCATION & HEALTH SERVICES 10,300 10,400 10,300 -100 0
LEISURE & HOSPITALITY 9,100 9,100 9,000 0 100
OTHER SERVICES 3,000 3,000 3,000 0 0
GOVERNMENT 16,800 16,800 16,800 0 0 Federal 1,000 900 1,000 100 0 State 8,300 8,400 8,300 -100 0 Local 7,500 7,500 7,500 0 0
Preliminary Revised Revised ChangeMar-14 Feb-14 Mar-13 Monthly Yearly
TOTAL NONFARM EMPLOYMENT 48,800 48,600 49,700 200 -900TOTAL PRIVATE 37,300 37,200 38,000 100 -700GOODS-PRODUCING 10,300 10,200 11,000 100 -700SERVICE-PROVIDING 38,500 38,400 38,700 100 -200PRIVATE SERVICE-PROVIDING 27,000 27,000 27,000 0 0
GOVERNMENT 11,500 11,400 11,700 100 -200 Federal 1,500 1,500 1,600 0 -100 State 500 500 500 0 0 Local 9,500 9,400 9,600 100 -100
LAS CRUCES MSA
SANTA FE MSA
FARMINGTON MSA
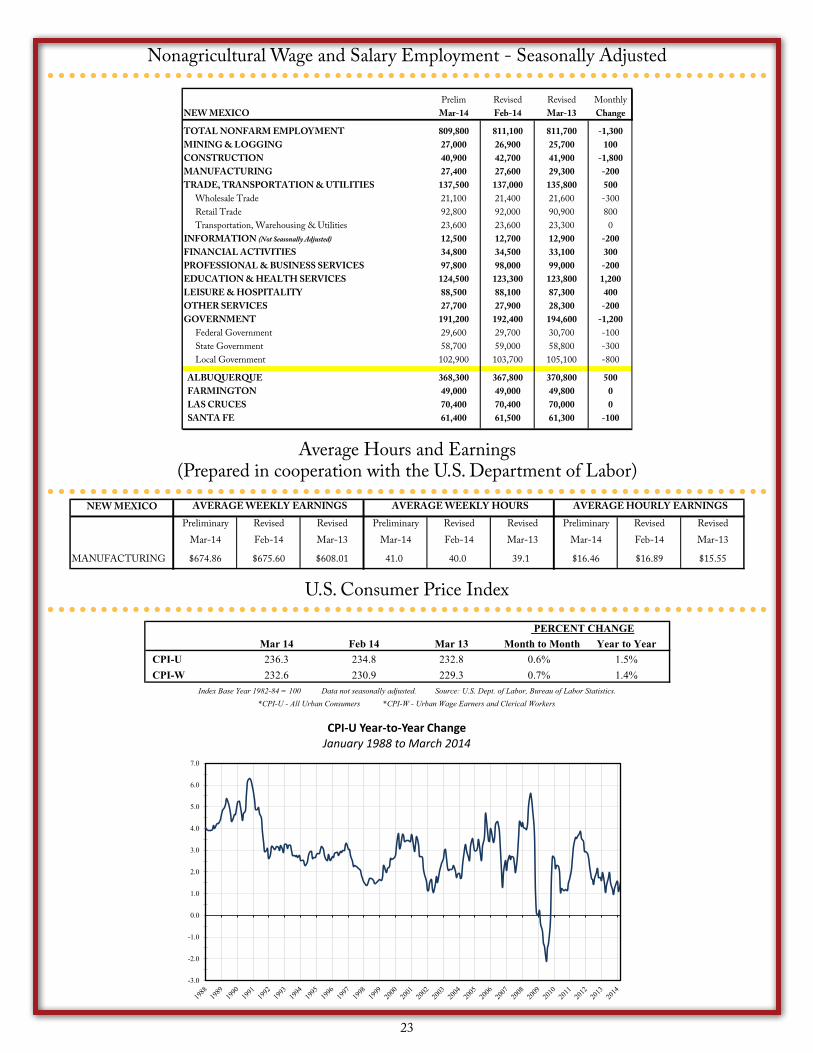
23
Nonagricultural Wage and Salary Employment - Seasonally Adjusted
U.S. Consumer Price Index
Average Hours and Earnings (Prepared in cooperation with the U.S. Department of Labor)
-3.0
-2.0
-1.0
0.0
1.0
2.0
3.0
4.0
5.0
6.0
7.0
CPI-U Year-to-Year ChangeJanuary 1988 to March 2014
Mar 14 Feb 14 Mar 13 Month to Month Year to Year CPI-U 236.3 234.8 232.8 0.6% 1.5% CPI-W 232.6 230.9 229.3 0.7% 1.4%
*CPI-U - All Urban Consumers *CPI-W - Urban Wage Earners and Clerical WorkersIndex Base Year 1982-84 = 100 Data not seasonally adjusted. Source: U.S. Dept. of Labor, Bureau of Labor Statistics.
PERCENT CHANGE
NEW MEXICOPreliminary Revised Revised Preliminary Revised Revised Preliminary Revised Revised
Mar-14 Feb-14 Mar-13 Mar-14 Feb-14 Mar-13 Mar-14 Feb-14 Mar-13
MANUFACTURING $674.86 $675.60 $608.01 41.0 40.0 39.1 $16.46 $16.89 $15.55
AVERAGE WEEKLY EARNINGS AVERAGE HOURLY EARNINGS AVERAGE WEEKLY HOURS
Prelim Revised Revised MonthlyNEW MEXICO Mar-14 Feb-14 Mar-13 Change
TOTAL NONFARM EMPLOYMENT 809,800 811,100 811,700 -1,300MINING & LOGGING 27,000 26,900 25,700 100CONSTRUCTION 40,900 42,700 41,900 -1,800MANUFACTURING 27,400 27,600 29,300 -200TRADE, TRANSPORTATION & UTILITIES 137,500 137,000 135,800 500 Wholesale Trade 21,100 21,400 21,600 -300 Retail Trade 92,800 92,000 90,900 800 Transportation, Warehousing & Utilities 23,600 23,600 23,300 0INFORMATION (Not Seasonally Adjusted) 12,500 12,700 12,900 -200FINANCIAL ACTIVITIES 34,800 34,500 33,100 300PROFESSIONAL & BUSINESS SERVICES 97,800 98,000 99,000 -200EDUCATION & HEALTH SERVICES 124,500 123,300 123,800 1,200LEISURE & HOSPITALITY 88,500 88,100 87,300 400OTHER SERVICES 27,700 27,900 28,300 -200GOVERNMENT 191,200 192,400 194,600 -1,200 Federal Government 29,600 29,700 30,700 -100 State Government 58,700 59,000 58,800 -300 Local Government 102,900 103,700 105,100 -800
ALBUQUERQUE 368,300 367,800 370,800 500 FARMINGTON 49,000 49,000 49,800 0 LAS CRUCES 70,400 70,400 70,000 0 SANTA FE 61,400 61,500 61,300 -100

New Mexico Department of Workforce SolutionsEconomic Research & Analysis Bureau (CC6097)P.O. Box 1928Albuquerque, NM 87103________________________Official BusinessPenalty for Private Use, $300
The New Mexico Labor Market Review is a monthly publication from the New Mexico Department of Workforce Solutions, Economic Research & Analysis Bureau.
Major Contributors:Joy Forehand, Deputy Cabinet Secretary
Stacy Johnston, Public Relations SpecialistAshley Leach, EconomistTracy Shaleen, EconomistMark Flaherty, Economist