new mis 19 epica dome c high resolution deuterium data...
TRANSCRIPT

Earth and Planetary Science Letters 298 (2010) 95–103
Contents lists available at ScienceDirect
Earth and Planetary Science Letters
j ourna l homepage: www.e lsev ie r.com/ locate /eps l
New MIS 19 EPICA Dome C high resolution deuterium data: Hints for a problematicpreservation of climate variability at sub-millennial scale in the “oldest ice”
K. Pol a,⁎, V. Masson-Delmotte a, S. Johnsen c, M. Bigler d, O. Cattani a, G. Durand b, S. Falourd a, J. Jouzel a,B. Minster a, F. Parrenin b, C. Ritz b, H.C. Steen-Larsen c, B. Stenni e
a Laboratoire des Sciences du Climat et de l'Environnement, IPSL, CEA CNRS UVSQ, CEA Saclay, L'Orme-des-Merisiers, 91191 Gif-Sur-Yvette Cedex, Franceb CNRS/Université Joseph Fourier, Grenoble 1, LGGE, 54 Rue Molière, 38410 Saint Martin d'Hères Cedex, Francec Centre for Ice and Climate, Niels Bohr Institute, University of Copenhagen, Juliane Maries Vej 30, DK-2100 Copenhagen, Denmarkd Climate and Environmental Physics, Physics Institute, and Oeschger Centre for Climate Change Research, University of Bern, Sidlerstrasse 5, 3012 Bern, Switzerlande Università di Trieste, Dipartimento di Scienze Geologiche, Ambientali e Marine, Via E. Weiss 2, 34127 Trieste, Italy
⁎ Corresponding author. Tel.: +33 1 69 08 27 02; faxE-mail address: [email protected] (K. Pol).
0012-821X/$ – see front matter © 2010 Elsevier B.V. Adoi:10.1016/j.epsl.2010.07.030
a b s t r a c t
a r t i c l e i n f oArticle history:Received 15 December 2009Received in revised form 6 July 2010Accepted 15 July 2010Available online 21 August 2010
Editor: P. DeMenocal
Keywords:water stable isotopesice coresAntarctica
Marine Isotope Stage 19 (MIS 19) is the oldest interglacial period archived in the EPICA Dome C ice core(~780 ky BP) and the closest “orbital analogue” to the Holocene — albeit with a different obliquity amplitudeand phase with precession. New detailed deuterium measurements have been conducted with a depthresolution of 11 cm (corresponding time resolution of ~130 years). They confirm our earlier low resolutionprofile (55 cm), showing a relatively smooth shape over the MIS 20 to MIS 18 time period with a lack of sub-millennial climate variability, first thought to be due to this low resolution. The MIS 19 high resolution profileactually reveals a strong isotopic diffusion process leading to a diffusion length of at least ~40 cm erasingsub-millennial climate variability. We suggest that this diffusion is caused by water-veins associated withlarge ice crystals at temperatures above −10 °C, temperature conditions in which the MIS 19 ice has spentmore than 200 ky. This result has implications for the selection of the future “oldest ice” drilling site.
: +33 1 69 08 77 16.
ll rights reserved.
© 2010 Elsevier B.V. All rights reserved.
isotopic diffusion
1. Introduction
The EPICA Dome C ice core providing more than 800 thousands ofyears (ky) of climate variability is the longest available climatic recordobtained from ice cores. Thanks to different proxies such as stablewaterisotopes (Jouzel et al., 2007), aerosols (Lambert et al., 2008;Wolff et al.,2010a), CH4 (Loulergue et al., 2008; Spahni et al., 2005) or CO2 (Lüthiet al., 2008; Siengenthaler et al., 2005), local, regional and globalvariations of climate and environment have been characterized overeight glacial–interglacial cycles (Fig. 1). If long term climate variability isconsidered to be driven by variations of incoming insolation due to slowchanges of orbital parameters (Berger and Loutre, 1991; Laskar et al.,1993), the precise role of seasonal and latitudinal insolation distributionremains disputed. The climate system response involves thresholdeffects and internal feedbacks, making the understanding of the Earthclimate complex (Paillard, 1998).
Interglacial periods offer the possibility to compare the climatesystem response under different orbital configurations and without themajor influence of northern hemisphere glacial ice sheets. Thanks toEPICA Dome C ice core strong differences have been revealed between
the nine past and current interglacial periods regarding their duration,trend or intensity (Figs. 1 and 2) (EPICA-community-members, 2004;Jouzel et al., 2007; Masson-Delmotte et al., 2010). The currentinterglacial period has been compared to past interglacials with aspecific focus on Marine Isotope Stage (MIS) 5 and 11 (Loutre andBerger, 2003; Loutre, 2003; Masson-Delmotte et al., 2006; Ruddimann,2005), with implications for the future long term influence of Earth'sorbit and the timing of the next Ice Age.
In this context, the following study focuses on the oldest interglacialarchived in the EPICA Dome C (EDC) ice core: MIS 19, occurring around780 thousands of years (ky) before present (B.P.). The full sequence ofevents, from the end of the previous glacial period (MIS 20) to thebeginning of the following one (MIS 18), is detected between depths of3147 and 3190 m. Corresponding ages range between ~749 and ~801 kywith an absolute uncertainty of 6 ky (2σ) (Fig. 3) as given by the currentEDC3 chronology (Parrenin et al., 2007a). This dating is relatively wellconstrained for MIS 19, thanks to the Matuyama–Bruhnes geomagneticreversal identification from Beryllium 10 measurements (Dreyfus et al.,2008; Raisbeck et al., 2006). The integrity of the climate records in EDC iceis confirmed down to ~801 ky (Jouzel et al., 2007), despite indications ofice flow perturbation in the bottom part of the core (Dreyfus et al., 2007).
MIS 19 is interesting for two reasons: (i) it occurred during anorbital configuration quite similar to the present one; and (ii) theEPICA Dome C low resolution proxy records exhibit comparable

Fig. 1. Insolation forcing and climate variability over 800 thousands of years before present (B.P.=before 1950) recorded in different proxies. From top to bottom: EDC CH4
concentrations (ppb, green) (Loulergue et al., 2008; Spahni et al., 2005); CO2 concentrations from Vostok and EDC ice cores (ppm, grey) (Lüthi et al., 2008; Siengenthaler et al., 2005);EDC low resolution δD signal (‰) (rainbow colours highlighting glacial periods, dark blue, and interglacial periods, yellow-red); reconstructed sea levels (in m relative to present-day, blue) (Bintanja et al., 2005). Changes in orbital parameters are displayed in the bottom panel (Berger and Loutre, 1991): obliquity (°, yellow), inversed precession parameter(orange), eccentricity (dark red). The two periods of interest here, from the past 20 ky to the next 10 ky and the MIS 20 to 18, are highlighted by grey-shaded areas. Horizontal linesrepresent the maximum pre-industrial Holocene levels. All the Marine Isotopic Stages corresponding to the Antarctic interglacials recorded in the EDC core are labelled followingJouzel et al. (2007).
96 K. Pol et al. / Earth and Planetary Science Letters 298 (2010) 95–103
magnitudes for MIS 19 and the Holocene (Figs. 1 and 2). Section 2 isthus dedicated to a detailed comparison of orbital contexts and EPICArecords for these two periods.
During the glacial inception fromMIS 19 toMIS 18, the low resolutionEPICA Dome C water stable isotope record (Jouzel et al., 2007) hasrevealed millennial variability principally marked by the occurrence ofthree consecutive warm events (hereafter called Antarctic IsotopeMaxima — AIM, following EPICA-community-members, 2006, andnoted A, B, C on Fig. 2). These AIM events were also identified in theCH4 andCO2 signals (Loulergue et al., 2008; Lüthi et al., 2008). To improvethe temporal resolution and to document the sub-millennial climatevariability during MIS 19, we have conducted new high resolutionmeasurements of water stable isotope ratios (δD of HDO molecules,hereafter called deuterium) on the EDC ice core fine cuts (Section 3). Thisnew sampling, allowing to increase the temporal resolution from ~650 years (low resolution published data) to ~130 years, confirms therobustness of the previous low resolution isotopic signal (Section 4.1) butreveals at the same time a strong smoothing of the deuterium signal(Section 4.2), which erases potential new information on climatevariability. This result leads to an analysis of the isotopic diffusion in ice,a process commonly studied for its implication in the impairment ofclimatic signals (Section 4.3). Section 4.4 is then dedicated to thecomparison between modelled and data-derived diffusion calculation.This comparison suggests that the deepest EDC ice is affected by physicalprocesses that alter the preservation of the full stable isotope variability.We finally investigate the possible mechanisms at play.
2. Comparison of MIS 19 and Holocene orbital contexts and EPICAproxy records
We compare the orbital configurations around MIS 19 and of thecurrent interglacial, both characterized by a low eccentricity andtherefore small variations of the precession parameter (Fig. 1). Byaligning the respective early interglacial maxima of MIS 1 (~11 ky BP)and MIS 19 (~787 ky BP, according to the EDC3 chronology, Parreninet al., 2007a), Fig. 2 enables a more detailed comparison of orbital
contexts over a 50 ky interval (panels e and f). The EDC3 datingmethod(Parrenin et al., 2007b) is constructed independently from the δDorbitalsignal (it uses information from the δ18O of the di-oxygen in air Dreyfuset al., 2007).
This alignment shows that the interglacial optima occur duringeccentricity maxima, and with exactly comparable values of theprecession parameter. Because the EDC δD record exhibits a strongobliquity component, it was argued that the amplitude modulation ofobliquity could explain interglacial intensities (Jouzel et al., 2007,Supplementary material; Masson-Delmotte et al., 2006). Differences inthe orbital contexts indeed appear regarding the obliquity amplitudeand its phase with the precession parameter. Due to its long termmodulation (Berger and Loutre, 1991), recent obliquity variations havestronger amplitude than during MIS 19. The maximum of obliquityoccurs perfectly in phase with the precession parameter minimum at787.5 ky BP for MIS 19, while it lags by 2.5 ky the same precessionparameter minimum occurring at 11.5 ky BP in the early Holocene(Table 1). In the future, the eccentricity will decrease much morestrongly than at the end of MIS 19, damping the precession parameterfluctuations, but obliquity variationswill keep larger amplitude than forMIS 19. This comparison shows the lack of a perfect orbital analogue buthighlights that, as seen on Fig. 1, the orbital context ofMIS 19 is closer tothe present one than during MIS 5e or 11.
We now compare the climate evolution forMIS 19 and the HoloceneinEDC3proxy records. After a continuouswarmingduring the transitionMIS 20 to MIS 19, the deuterium signal reaches a maximum valueat ~787 ky (Fig. 2b). This pattern differs from the last termination,marked by the Antarctic Cold Reversal (Jouzel et al., 1995; Jouzel et al.,2001) (Fig. 2a). When converted into temperature, after correction ofsea-water isotopic and elevation changes (Jouzel et al., 2007), MIS 19 isthe warmest interglacial period recorded in the EDC temperaturereconstruction between 800 and 400 ky. Its peak warmth is ~0.5 °Ccolder than the present-day and 2 °C colder than the early Holoceneoptimum. Temperature reconstructions can be affected by changes inEDC elevation,with a dry adiabatic lapse-rate of ~10 °C per 1000 meters(m). However ice sheet models (Parrenin et al., 2007b; Pollard and
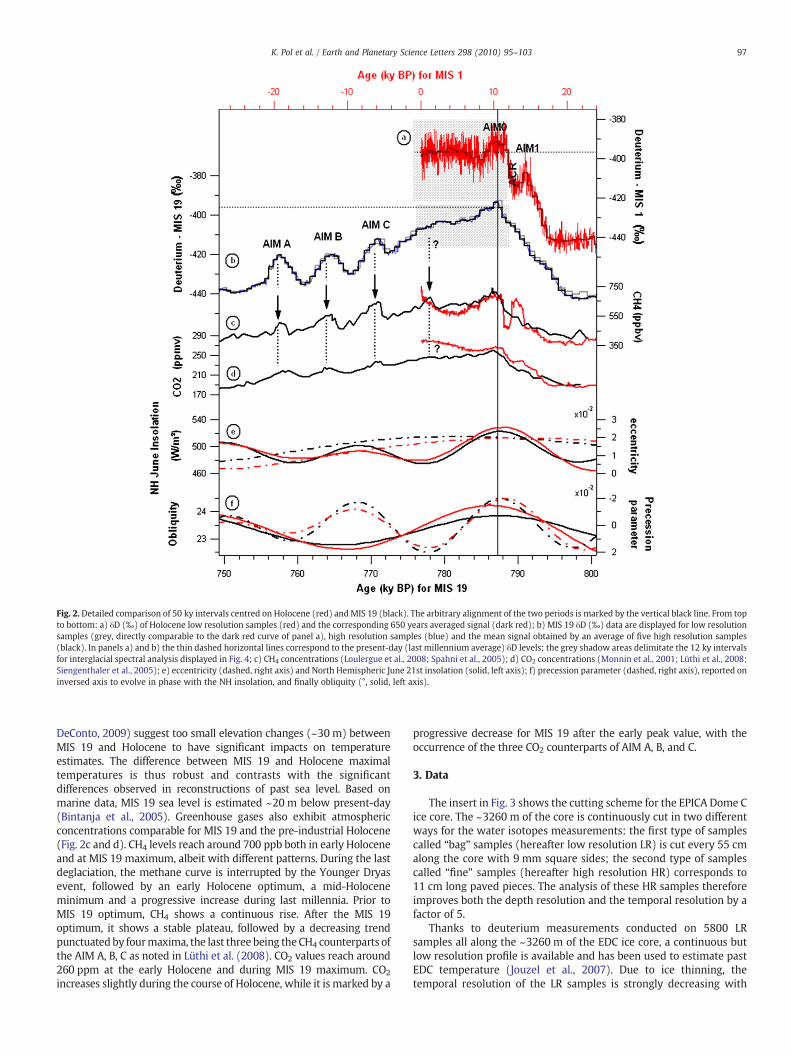
Fig. 2. Detailed comparison of 50 ky intervals centred on Holocene (red) andMIS 19 (black). The arbitrary alignment of the two periods is marked by the vertical black line. From topto bottom: a) δD (‰) of Holocene low resolution samples (red) and the corresponding 650 years averaged signal (dark red); b) MIS 19 δD (‰) data are displayed for low resolutionsamples (grey, directly comparable to the dark red curve of panel a), high resolution samples (blue) and the mean signal obtained by an average of five high resolution samples(black). In panels a) and b) the thin dashed horizontal lines correspond to the present-day (last millennium average) δD levels; the grey shadow areas delimitate the 12 ky intervalsfor interglacial spectral analysis displayed in Fig. 4; c) CH4 concentrations (Loulergue et al., 2008; Spahni et al., 2005); d) CO2 concentrations (Monnin et al., 2001; Lüthi et al., 2008;Siengenthaler et al., 2005); e) eccentricity (dashed, right axis) and North Hemispheric June 21st insolation (solid, left axis); f) precession parameter (dashed, right axis), reported oninversed axis to evolve in phase with the NH insolation, and finally obliquity (°, solid, left axis).
97K. Pol et al. / Earth and Planetary Science Letters 298 (2010) 95–103
DeConto, 2009) suggest too small elevation changes (~30 m) betweenMIS 19 and Holocene to have significant impacts on temperatureestimates. The difference between MIS 19 and Holocene maximaltemperatures is thus robust and contrasts with the significantdifferences observed in reconstructions of past sea level. Based onmarine data, MIS 19 sea level is estimated ~20 m below present-day(Bintanja et al., 2005). Greenhouse gases also exhibit atmosphericconcentrations comparable for MIS 19 and the pre-industrial Holocene(Fig. 2c and d). CH4 levels reach around 700 ppb both in early Holoceneand at MIS 19 maximum, albeit with different patterns. During the lastdeglaciation, the methane curve is interrupted by the Younger Dryasevent, followed by an early Holocene optimum, a mid-Holoceneminimum and a progressive increase during last millennia. Prior toMIS 19 optimum, CH4 shows a continuous rise. After the MIS 19optimum, it shows a stable plateau, followed by a decreasing trendpunctuated by fourmaxima, the last three being the CH4 counterparts ofthe AIM A, B, C as noted in Lüthi et al. (2008). CO2 values reach around260 ppm at the early Holocene and during MIS 19 maximum. CO2
increases slightly during the course of Holocene, while it is marked by a
progressive decrease for MIS 19 after the early peak value, with theoccurrence of the three CO2 counterparts of AIM A, B, and C.
3. Data
The insert in Fig. 3 shows the cutting scheme for the EPICA Dome Cice core. The ~3260 m of the core is continuously cut in two differentways for the water isotopes measurements: the first type of samplescalled “bag” samples (hereafter low resolution LR) is cut every 55 cmalong the core with 9 mm square sides; the second type of samplescalled “fine” samples (hereafter high resolution HR) corresponds to11 cm long paved pieces. The analysis of these HR samples thereforeimproves both the depth resolution and the temporal resolution by afactor of 5.
Thanks to deuterium measurements conducted on 5800 LRsamples all along the ~3260 m of the EDC ice core, a continuous butlow resolution profile is available and has been used to estimate pastEDC temperature (Jouzel et al., 2007). Due to ice thinning, thetemporal resolution of the LR samples is strongly decreasing with
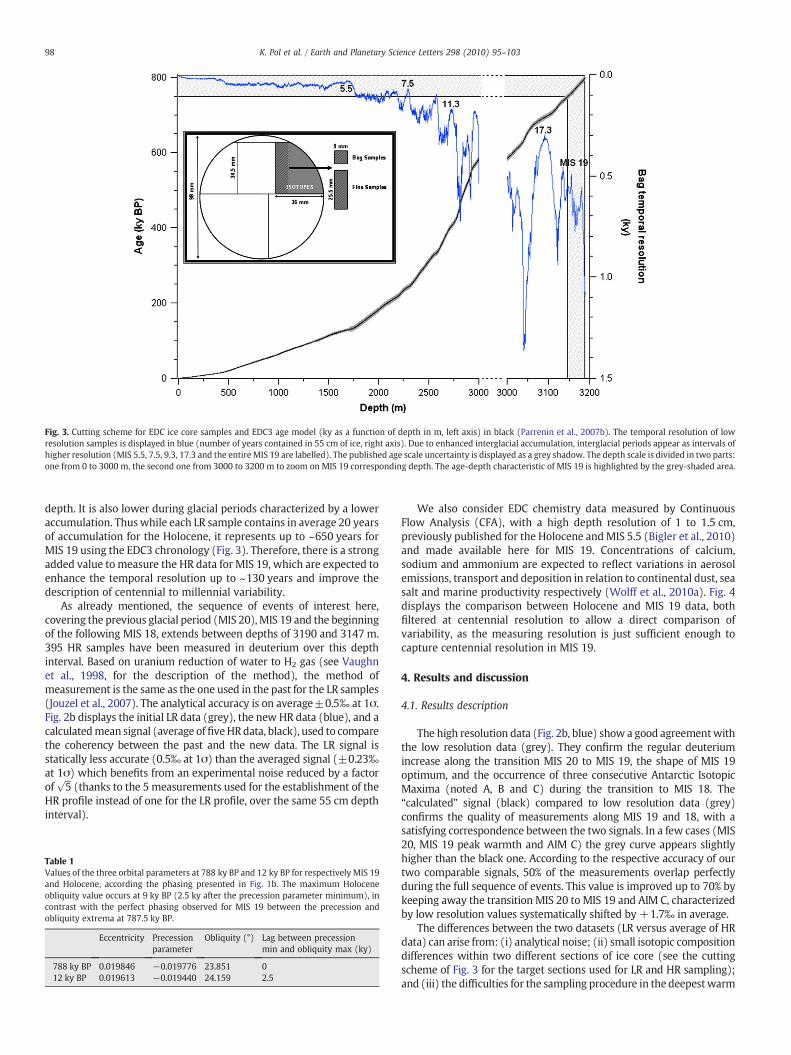
Fig. 3. Cutting scheme for EDC ice core samples and EDC3 age model (ky as a function of depth in m, left axis) in black (Parrenin et al., 2007b). The temporal resolution of lowresolution samples is displayed in blue (number of years contained in 55 cm of ice, right axis). Due to enhanced interglacial accumulation, interglacial periods appear as intervals ofhigher resolution (MIS 5.5, 7.5, 9.3, 17.3 and the entire MIS 19 are labelled). The published age scale uncertainty is displayed as a grey shadow. The depth scale is divided in two parts:one from 0 to 3000 m, the second one from 3000 to 3200 m to zoom on MIS 19 corresponding depth. The age-depth characteristic of MIS 19 is highlighted by the grey-shaded area.
98 K. Pol et al. / Earth and Planetary Science Letters 298 (2010) 95–103
depth. It is also lower during glacial periods characterized by a loweraccumulation. Thuswhile each LR sample contains in average 20 yearsof accumulation for the Holocene, it represents up to ~650 years forMIS 19 using the EDC3 chronology (Fig. 3). Therefore, there is a strongadded value to measure the HR data for MIS 19, which are expected toenhance the temporal resolution up to ~130 years and improve thedescription of centennial to millennial variability.
As already mentioned, the sequence of events of interest here,covering the previous glacial period (MIS 20),MIS 19 and the beginningof the following MIS 18, extends between depths of 3190 and 3147 m.395 HR samples have been measured in deuterium over this depthinterval. Based on uranium reduction of water to H2 gas (see Vaughnet al., 1998, for the description of the method), the method ofmeasurement is the same as the one used in the past for the LR samples(Jouzel et al., 2007). The analytical accuracy is on average±0.5‰ at 1σ.Fig. 2b displays the initial LR data (grey), the new HR data (blue), and acalculatedmean signal (average of fiveHRdata, black), used to comparethe coherency between the past and the new data. The LR signal isstatically less accurate (0.5‰ at 1σ) than the averaged signal (±0.23‰at 1σ) which benefits from an experimental noise reduced by a factorof
ffiffiffi5
p(thanks to the 5 measurements used for the establishment of the
HR profile instead of one for the LR profile, over the same 55 cm depthinterval).
Table 1Values of the three orbital parameters at 788 ky BP and 12 ky BP for respectively MIS 19and Holocene, according the phasing presented in Fig. 1b. The maximum Holoceneobliquity value occurs at 9 ky BP (2.5 ky after the precession parameter minimum), incontrast with the perfect phasing observed for MIS 19 between the precession andobliquity extrema at 787.5 ky BP.
Eccentricity Precessionparameter
Obliquity (°) Lag between precessionmin and obliquity max (ky)
788 ky BP 0.019846 −0.019776 23.851 012 ky BP 0.019613 −0.019440 24.159 2.5
We also consider EDC chemistry data measured by ContinuousFlow Analysis (CFA), with a high depth resolution of 1 to 1.5 cm,previously published for the Holocene andMIS 5.5 (Bigler et al., 2010)and made available here for MIS 19. Concentrations of calcium,sodium and ammonium are expected to reflect variations in aerosolemissions, transport and deposition in relation to continental dust, seasalt and marine productivity respectively (Wolff et al., 2010a). Fig. 4displays the comparison between Holocene and MIS 19 data, bothfiltered at centennial resolution to allow a direct comparison ofvariability, as the measuring resolution is just sufficient enough tocapture centennial resolution in MIS 19.
4. Results and discussion
4.1. Results description
The high resolution data (Fig. 2b, blue) show a good agreementwiththe low resolution data (grey). They confirm the regular deuteriumincrease along the transition MIS 20 to MIS 19, the shape of MIS 19optimum, and the occurrence of three consecutive Antarctic IsotopicMaxima (noted A, B and C) during the transition to MIS 18. The“calculated” signal (black) compared to low resolution data (grey)confirms the quality of measurements along MIS 19 and 18, with asatisfying correspondence between the two signals. In a few cases (MIS20, MIS 19 peak warmth and AIM C) the grey curve appears slightlyhigher than the black one. According to the respective accuracy of ourtwo comparable signals, 50% of the measurements overlap perfectlyduring the full sequence of events. This value is improved up to 70% bykeeping away the transition MIS 20 to MIS 19 and AIM C, characterizedby low resolution values systematically shifted by +1.7‰ in average.
The differences between the two datasets (LR versus average of HRdata) can arise from: (i) analytical noise; (ii) small isotopic compositiondifferences within two different sections of ice core (see the cuttingscheme of Fig. 3 for the target sections used for LR and HR sampling);and (iii) the difficulties for the sampling procedure in the deepestwarm
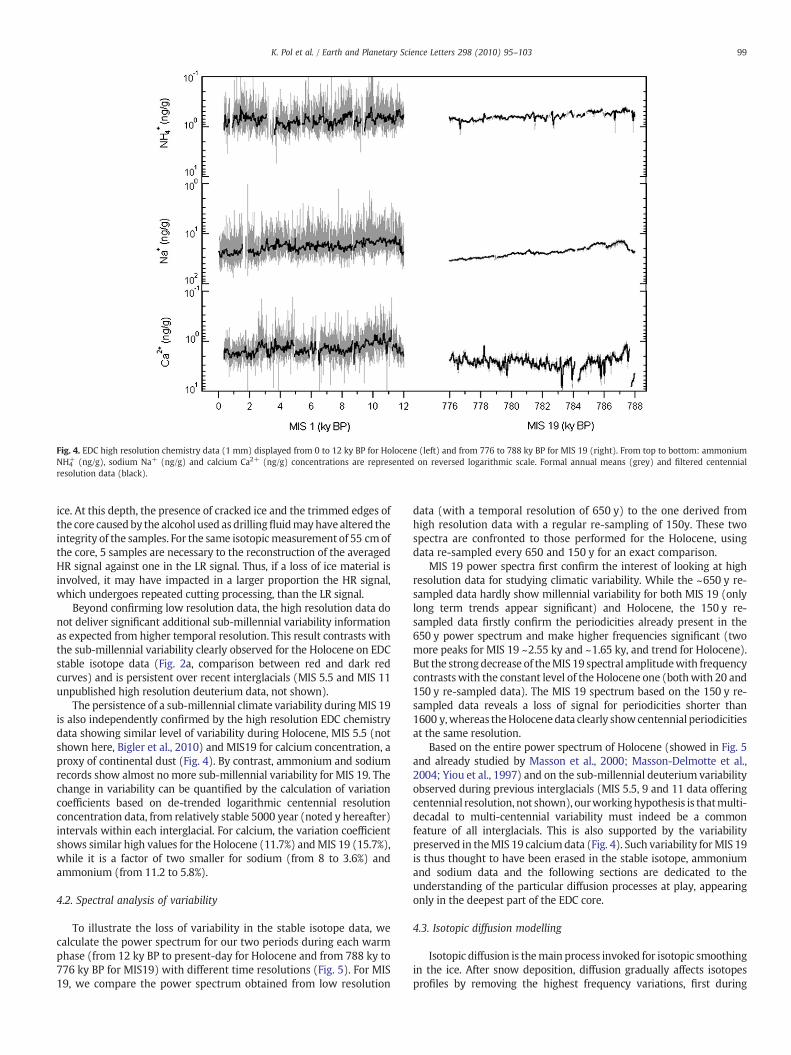
Fig. 4. EDC high resolution chemistry data (1 mm) displayed from 0 to 12 ky BP for Holocene (left) and from 776 to 788 ky BP for MIS 19 (right). From top to bottom: ammoniumNH4
+ (ng/g), sodium Na+ (ng/g) and calcium Ca2+ (ng/g) concentrations are represented on reversed logarithmic scale. Formal annual means (grey) and filtered centennialresolution data (black).
99K. Pol et al. / Earth and Planetary Science Letters 298 (2010) 95–103
ice. At this depth, the presence of cracked ice and the trimmed edges ofthe core causedby the alcohol used as drillingfluidmayhave altered theintegrity of the samples. For the same isotopicmeasurement of 55 cmofthe core, 5 samples are necessary to the reconstruction of the averagedHR signal against one in the LR signal. Thus, if a loss of ice material isinvolved, it may have impacted in a larger proportion the HR signal,which undergoes repeated cutting processing, than the LR signal.
Beyond confirming low resolution data, the high resolution data donot deliver significant additional sub-millennial variability informationas expected from higher temporal resolution. This result contrasts withthe sub-millennial variability clearly observed for the Holocene on EDCstable isotope data (Fig. 2a, comparison between red and dark redcurves) and is persistent over recent interglacials (MIS 5.5 and MIS 11unpublished high resolution deuterium data, not shown).
The persistence of a sub-millennial climate variability duringMIS 19is also independently confirmed by the high resolution EDC chemistrydata showing similar level of variability during Holocene, MIS 5.5 (notshown here, Bigler et al., 2010) and MIS19 for calcium concentration, aproxy of continental dust (Fig. 4). By contrast, ammonium and sodiumrecords show almost no more sub-millennial variability for MIS 19. Thechange in variability can be quantified by the calculation of variationcoefficients based on de-trended logarithmic centennial resolutionconcentration data, from relatively stable 5000 year (noted y hereafter)intervals within each interglacial. For calcium, the variation coefficientshows similar high values for the Holocene (11.7%) andMIS 19 (15.7%),while it is a factor of two smaller for sodium (from 8 to 3.6%) andammonium (from 11.2 to 5.8%).
4.2. Spectral analysis of variability
To illustrate the loss of variability in the stable isotope data, wecalculate the power spectrum for our two periods during each warmphase (from 12 ky BP to present-day for Holocene and from 788 ky to776 ky BP for MIS19) with different time resolutions (Fig. 5). For MIS19, we compare the power spectrum obtained from low resolution
data (with a temporal resolution of 650 y) to the one derived fromhigh resolution data with a regular re-sampling of 150y. These twospectra are confronted to those performed for the Holocene, usingdata re-sampled every 650 and 150 y for an exact comparison.
MIS 19 power spectra first confirm the interest of looking at highresolution data for studying climatic variability. While the ~650 y re-sampled data hardly show millennial variability for both MIS 19 (onlylong term trends appear significant) and Holocene, the 150 y re-sampled data firstly confirm the periodicities already present in the650 y power spectrum and make higher frequencies significant (twomore peaks for MIS 19 ~2.55 ky and ~1.65 ky, and trend for Holocene).But the strongdecrease of theMIS 19 spectral amplitudewith frequencycontrastswith the constant level of the Holocene one (bothwith 20 and150 y re-sampled data). The MIS 19 spectrum based on the 150 y re-sampled data reveals a loss of signal for periodicities shorter than1600 y,whereas theHolocenedata clearly showcentennial periodicitiesat the same resolution.
Based on the entire power spectrum of Holocene (showed in Fig. 5and already studied by Masson et al., 2000; Masson-Delmotte et al.,2004; Yiou et al., 1997) and on the sub-millennial deuterium variabilityobserved during previous interglacials (MIS 5.5, 9 and 11 data offeringcentennial resolution, not shown), ourworkinghypothesis is thatmulti-decadal to multi-centennial variability must indeed be a commonfeature of all interglacials. This is also supported by the variabilitypreserved in theMIS 19 calciumdata (Fig. 4). Such variability forMIS 19is thus thought to have been erased in the stable isotope, ammoniumand sodium data and the following sections are dedicated to theunderstanding of the particular diffusion processes at play, appearingonly in the deepest part of the EDC core.
4.3. Isotopic diffusion modelling
Isotopic diffusion is themain process invoked for isotopic smoothingin the ice. After snow deposition, diffusion gradually affects isotopesprofiles by removing the highest frequency variations, first during

Fig. 5. Spectral analysis of EDC isotope data for the past first 12 ky (bottom) and from 776 to 788 ky for MIS 19 interval (top, intervals corresponding to the grey shadow areas ofFig. 2) using a Multi Taper Method (MTM, Spectra software, Ghil et al., 2002). The spectral amplitude is displayed as a function of the frequencies (in ky−1). The red lines delimit the95% confidence interval estimated from a red noise spectrum and the grey areas delimitate millennial from sub-millenial variability. The low resolution data available for MIS 19 arere-sampled on a time step of 650 years. The high resolution data are re-sampled every 150 years. For comparison Holocene available data (with an initial resolution of ~20y) havebeen re-sampled on the same time-steps of 650 and 150 years. The power spectrum of high resolution (20 years) Holocene data is also displayed. The periodicities of interest for thediscussion are indicated with vertical arrows and labelled.
100 K. Pol et al. / Earth and Planetary Science Letters 298 (2010) 95–103
thefirnification (NeumannandWaddington, 2004) and then in the solidice (Ramseier, 1967). In the upper part of the firn, this impairmentof climatic signal is due to direct exchanges between snow watermolecules and vapour, involving processes such as successive change ofphases (sublimation/condensation). In solid ice, self-diffusion in icesingle crystals, controlled by the temperature-dependent moleculardiffusivity of water stable isotopes, comes in addition to the thinning toincrease the smoothing of the remaining isotope signal. Isotopicdiffusion has extensively been studied and models are available forpredicting the smoothing of an initial stable isotope profile for a givenice core.
Considering the classical diffusion as described in the previous shortintroduction,weuse themethodology described in Johnsen et al. (2000)and applied for the EDC core. Based on the tracking of a layer from thesurface to its actual position in the ice sheet, it requires the estimate oftwo parameters: (1) the vertical strain rate ε̇z tð Þ and (2) the diffusivityof HDO molecules Ω(t), where t is the age and z the depth. Age isestimated as a function of depth thanks to the Dansgaard–Johnsen kinkmodel (Johnsen andDansgaard, 1992)modified for bottommelting anddynamic accumulation rates according the characteristics of the EDC site(Table 2). A new parameter, the diffusion length σ, is introduced to
Table 2Designation of the parameters implemented in the flow/age/thinning model (Johnsen and Det al., 2000) applied to the EPICA Dome C site.
Parameters for the flow/age/thinning model Values or expression P
Ice thickness 3275 (m) Iste
Kink height 1500 (m) SPresent deuterium value δ0=−396.5 (‰)Present accumulation rate ac=0.03 (m/y)Bottom melting 0.0006 (m/y)Bottom sliding factor 0.13Bag values corrected by sea-water isotope values δD (‰)Past accumulation rate ac × exp δD−δ0ð Þ= 70:0ð Þ (m)
describe the diffusion and its effects. It expresses the characteristiclength affected by the isotopic smoothing at a given depth and isdetermined using the following equation:
dσ2
dt−2⋅ε̇z tð Þ⋅σ2 = 2⋅Ω tð Þ; ð1Þ
which attributes the ice diffusion to the thinning of ice layers in the icesheet due to the vertical strain rate and to the diffusivity of stableisotopes within the ice. The solution of Eq. (1) can be expressed as:
σ2 tð Þ = σ2ice tð Þ + σ2
firn tð Þ ð2Þ
where
σ2ice tð Þ = exp 2⋅∫
t
0
ε̇z t′� �
⋅dt′ !
∫t
0
2⋅Ω t′� �
⋅ exp ∫t′
0
−2⋅ε̇z t″� �
⋅dt″Þ ⋅dt′ !
ð3Þ
represents the diffusion occurring in the solid ice,
and σ2firn tð Þ = exp 2⋅ ∫
t
0
ε̇z t′� �
⋅dt′ !
⋅σ2f0
ð4Þ
ansgaard, 1992) and in the temperature/diffusion model (Johnsen et al., 1995; Johnsen
arameters for the temperature/diffusion model Values or expression
otope-temperature slope adjusted to the LGMmperature or best fit to the measured borehole data
α (°C/‰)
urface temperatures −57:0 + α × δD−δ0ð Þ (°C)

101K. Pol et al. / Earth and Planetary Science Letters 298 (2010) 95–103
the diffusion in the firn, with σf0 depending on the past temperatureand accumulation rate of a given period. At the depth of MIS 19, themodel shows that the isotopic diffusion occurring in the firn isnegligible in front of the ice diffusion.
Here the establishment of the time scale and the estimate of thestrain rate ε̇z tð Þ represent the first sources of uncertainty for thediffusion length calculation. The thinning function (ratio of the thicknessof a given layer at its present depth in the ice and its thickness when itwas at the surface), is given by the first part of Eqs. (3) and (4):
exp ∫t
0
ε̇z t′� �
⋅dt′ !
. The coupled deformation and diffusionmodels used
here (Johnsen and Dansgaard, 1992, applied to the EDC site) estimate athinning function of ~0.035 for MIS 19. This calculation is consistentwith the independent initial estimate of Parrenin et al. (2007b) (Fig. 6a)for the establishment of the EDC3 chronology. A second source ofuncertainty lies in the estimate of the deuterium molecular diffusivityΩ tð Þ based on Ramseier formula (Ramseier, 1967) which depends ontemperature. Fig. 6b displays two calculations of the diffusion lengthassociated to two different in situ temperature profiles for the EDC core:the first one derived from a temperature ice flowmodel coupled to thediffusion model (Johnsen et al., 1995, see Table 2), and the second oneforced to fit the temperature profile measured in the EDC borehole(Fig. 6c). These two profiles differ by at most 2 °C. While the resultsshow differences between 400 and 2100 m depths, the two modelleddiffusion lengths reach a common value of ~16 cm at the depth of MIS19 (Fig. 6b).
4.4. Comparison between modelled and data-derived diffusion length
We now consider the diffusion length modelled all along the EPICADome C ice core consistent with the borehole temperature data. Fig. 6b
Fig. 6. a) Depth profiles of the thinning function from two glaciological models: EDC3(Dreyfus et al., 2007) in green and Johnsen et al. (2000) in dark green; b) diffusion lengthscalculated using the Johnsen thinning function (cm); using either the temperature profilederived from the model (light purple) or with the temperature profile fitted to themeasured borehole temperatures (dark purple); c) running average over 5 m of theborehole temperature data (°C, pink) (measured inNov 2008, offset of 5 °C for readability)and the two previously mentioned temperature profiles used for diffusion lengthcalculation (red, model; brown, model tuned to the temperatures data); d) mean grainradius in mm (Durand et al., 2009); e) δD (‰) of EDC low resolution samples. The MIS19interval is highlighted with a grey shading.
shows the slowdecrease of the diffusion lengthwith depth, from ~5 cmnear the surface to a minimum value of ~1.6 cm at ~1900 m, driven bythe vertical thinning which progressively reduces the annual layerthickness. Near bedrock, warmer temperatures (N−30 °C) enhancemolecular diffusivity in the ice which results in a change of slope of themodelled diffusion lengthwith respect to depth. Themodelled diffusionlength therefore increases downwards of 1900 m and reaches thepreviously mentioned maximum value of 16 cm in the deepest part ofthe core, where MIS 19 is located.
This theoretical value can be compared to the one that can beestimated from the high resolution deuterium data. The loss of highfrequency variability thus revealed (see section 4.2) can be also viewedas a loss of spectral amplitude with respect to depth (cycles/m). Thepower spectrum associated to the data can be fitted to different powerspectra of red noise that simulate different values of diffusion lengths,according to the equation A = A0⋅ exp − 1
2σ2⋅k2
� �. This equation links
the amplitude of a given harmonic cycle A recorded in the data andaltered by thediffusionwithin the ice, to the initial amplitudeA0 (withσthe diffusion length and k the wave number associated to the harmoniccycle); the methodology is described in Johnsen et al. (2000). Thismethod allows us to derive an empirical diffusion length forMIS 19. Theloss of spectral amplitude below ~1600 y of periodicity discussed inSection 4.2 can thus be translated as a diffusion length estimated toreach at least 40 cm (values ranging between 40 and 60 cm dependingon the fit between the corresponding red noise and the data powerspectrum), a value more than twice higher than the predicted one. Thestrong smoothing of the deuterium signal atMIS 19 depth has thereforeto be attributed to an enhanced isotopic diffusion, which cannot besimply represented by the usual processes occurring in firn and solid iceand implemented here in the Johnsen et al. (2000) classical diffusionmodel, which fails here to calculate the real diffusion length at the MIS19 depth. Particular strong diffusion (or excess diffusion as called inJohnsen et al., 2000) in basal conditions has already been observed inGreenland ice cores (Johnsen et al., 1997) and models implementingnew processes (Nye, 1998; Rempel and Wettlaufer, 2003a) areavailable. These processes are discussed in the next section.
4.5. Discussion
We now explore the deep ice characteristics in cause for theobservable enhanced diffusion. Fig. 6d shows the depth-profile of thegrain size of ice crystals, which provide information on the ice structure.The measurements of the mean radius (R, from Durand et al., 2009) ofice crystals are displayed until 3133 m. Deeper, in the very bottom partof the core, each analysed sample displays only few grains (makingdifficult the measurements and increasing also the uncertainty) withhigh R values (N10 mm). At the same time, the EDC boreholetemperatures (Fig. 6c) increase up to ~−6 °C at the depth of MIS 19ice. A direct link can be established between the increasing grain growthobserved at thesedepths and ice temperatures (Durandet al., 2009). Theincreasing grain size can indeed be attributed to migration–recrystal-lization processes which extend grain boundaries and are expected totake place at temperatures above −10 °C (Duval and Castelnau, 1995).Such processes can contribute to the impairment of the isotopic signalbyfirstmixing the climatic information contained in close ice crystals. Ina second step, the isotopic smoothing can be enhanced by the presenceof liquid water-veins within the ice (Nye, 1992). The formation of acontinuous network at grain junctions is favoured when ice crystalsbecome large, making possible the circulation of unfrozen water in theice matrix and accelerating the diffusion of isotopes (Nye, 1998).Raisbeck et al. (2006) highlighted the presence of 10Be spikes deeperthan ~3100m in the EDC core which could not be explained byproduction variations. As they suggested, specific horizontal concen-tration processes at play in the EDC deepest ice could provide anexplanation for these spikes and also for the dust aggregates revealed byLambert et al. (2008). This explanation supports our water-veins
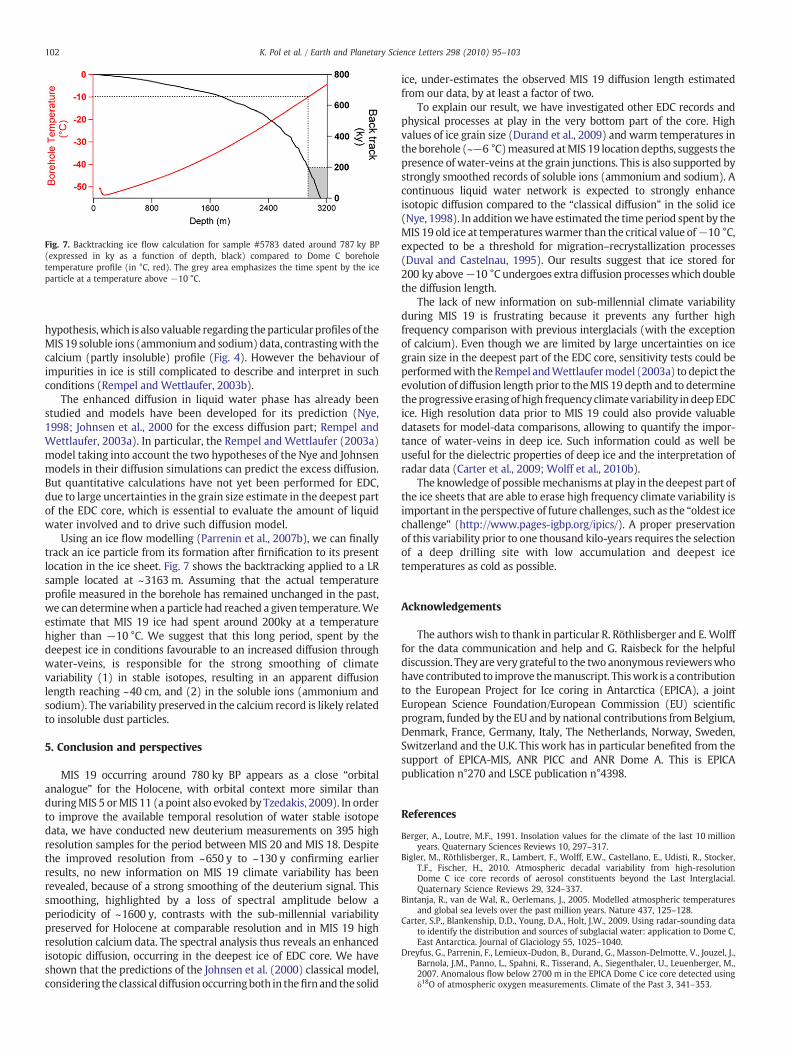
Fig. 7. Backtracking ice flow calculation for sample #5783 dated around 787 ky BP(expressed in ky as a function of depth, black) compared to Dome C boreholetemperature profile (in °C, red). The grey area emphasizes the time spent by the iceparticle at a temperature above −10 °C.
102 K. Pol et al. / Earth and Planetary Science Letters 298 (2010) 95–103
hypothesis,which is also valuable regarding theparticularprofiles of theMIS 19 soluble ions (ammoniumand sodium)data, contrastingwith thecalcium (partly insoluble) profile (Fig. 4). However the behaviour ofimpurities in ice is still complicated to describe and interpret in suchconditions (Rempel and Wettlaufer, 2003b).
The enhanced diffusion in liquid water phase has already beenstudied and models have been developed for its prediction (Nye,1998; Johnsen et al., 2000 for the excess diffusion part; Rempel andWettlaufer, 2003a). In particular, the Rempel and Wettlaufer (2003a)model taking into account the two hypotheses of the Nye and Johnsenmodels in their diffusion simulations can predict the excess diffusion.But quantitative calculations have not yet been performed for EDC,due to large uncertainties in the grain size estimate in the deepest partof the EDC core, which is essential to evaluate the amount of liquidwater involved and to drive such diffusion model.
Using an ice flow modelling (Parrenin et al., 2007b), we can finallytrack an ice particle from its formation after firnification to its presentlocation in the ice sheet. Fig. 7 shows the backtracking applied to a LRsample located at ~3163 m. Assuming that the actual temperatureprofile measured in the borehole has remained unchanged in the past,we can determinewhen a particle had reached a given temperature.Weestimate that MIS 19 ice had spent around 200ky at a temperaturehigher than −10 °C. We suggest that this long period, spent by thedeepest ice in conditions favourable to an increased diffusion throughwater-veins, is responsible for the strong smoothing of climatevariability (1) in stable isotopes, resulting in an apparent diffusionlength reaching ~40 cm, and (2) in the soluble ions (ammonium andsodium). The variability preserved in the calcium record is likely relatedto insoluble dust particles.
5. Conclusion and perspectives
MIS 19 occurring around 780 ky BP appears as a close “orbitalanalogue” for the Holocene, with orbital context more similar thanduringMIS 5 orMIS 11 (a point also evoked by Tzedakis, 2009). In orderto improve the available temporal resolution of water stable isotopedata, we have conducted new deuterium measurements on 395 highresolution samples for the period between MIS 20 and MIS 18. Despitethe improved resolution from ~650 y to ~130 y confirming earlierresults, no new information on MIS 19 climate variability has beenrevealed, because of a strong smoothing of the deuterium signal. Thissmoothing, highlighted by a loss of spectral amplitude below aperiodicity of ~1600 y, contrasts with the sub-millennial variabilitypreserved for Holocene at comparable resolution and in MIS 19 highresolution calcium data. The spectral analysis thus reveals an enhancedisotopic diffusion, occurring in the deepest ice of EDC core. We haveshown that the predictions of the Johnsen et al. (2000) classical model,considering the classical diffusionoccurringboth in thefirnand the solid
ice, under-estimates the observed MIS 19 diffusion length estimatedfrom our data, by at least a factor of two.
To explain our result, we have investigated other EDC records andphysical processes at play in the very bottom part of the core. Highvalues of ice grain size (Durand et al., 2009) and warm temperatures intheborehole (~−6 °C)measured atMIS 19 locationdepths, suggests thepresence of water-veins at the grain junctions. This is also supported bystrongly smoothed records of soluble ions (ammonium and sodium). Acontinuous liquid water network is expected to strongly enhanceisotopic diffusion compared to the “classical diffusion” in the solid ice(Nye, 1998). In additionwe have estimated the timeperiod spent by theMIS 19 old ice at temperatureswarmer than the critical value of−10 °C,expected to be a threshold for migration–recrystallization processes(Duval and Castelnau, 1995). Our results suggest that ice stored for200 ky above−10 °C undergoes extra diffusion processeswhich doublethe diffusion length.
The lack of new information on sub-millennial climate variabilityduring MIS 19 is frustrating because it prevents any further highfrequency comparison with previous interglacials (with the exceptionof calcium). Even though we are limited by large uncertainties on icegrain size in the deepest part of the EDC core, sensitivity tests could beperformedwith theRempel andWettlaufermodel (2003a) to depict theevolution of diffusion length prior to theMIS 19 depth and to determinetheprogressive erasingof high frequency climate variability in deepEDCice. High resolution data prior to MIS 19 could also provide valuabledatasets for model-data comparisons, allowing to quantify the impor-tance of water-veins in deep ice. Such information could as well beuseful for the dielectric properties of deep ice and the interpretation ofradar data (Carter et al., 2009; Wolff et al., 2010b).
The knowledge of possiblemechanisms at play in the deepest part ofthe ice sheets that are able to erase high frequency climate variability isimportant in the perspective of future challenges, such as the “oldest icechallenge” (http://www.pages-igbp.org/ipics/). A proper preservationof this variability prior to one thousand kilo-years requires the selectionof a deep drilling site with low accumulation and deepest icetemperatures as cold as possible.
Acknowledgements
The authors wish to thank in particular R. Röthlisberger and E.Wolfffor the data communication and help and G. Raisbeck for the helpfuldiscussion. They are very grateful to the two anonymous reviewerswhohave contributed to improve themanuscript. Thiswork is a contributionto the European Project for Ice coring in Antarctica (EPICA), a jointEuropean Science Foundation/European Commission (EU) scientificprogram, funded by the EU and by national contributions fromBelgium,Denmark, France, Germany, Italy, The Netherlands, Norway, Sweden,Switzerland and the U.K. This work has in particular benefited from thesupport of EPICA-MIS, ANR PICC and ANR Dome A. This is EPICApublication n°270 and LSCE publication n°4398.
References
Berger, A., Loutre, M.F., 1991. Insolation values for the climate of the last 10 millionyears. Quaternary Sciences Reviews 10, 297–317.
Bigler, M., Röthlisberger, R., Lambert, F., Wolff, E.W., Castellano, E., Udisti, R., Stocker,T.F., Fischer, H., 2010. Atmospheric decadal variability from high-resolutionDome C ice core records of aerosol constituents beyond the Last Interglacial.Quaternary Science Reviews 29, 324–337.
Bintanja, R., van de Wal, R., Oerlemans, J., 2005. Modelled atmospheric temperaturesand global sea levels over the past million years. Nature 437, 125–128.
Carter, S.P., Blankenship, D.D., Young, D.A., Holt, J.W., 2009. Using radar-sounding datato identify the distribution and sources of subglacial water: application to Dome C,East Antarctica. Journal of Glaciology 55, 1025–1040.
Dreyfus, G., Parrenin, F., Lemieux-Dudon, B., Durand, G., Masson-Delmotte, V., Jouzel, J.,Barnola, J.M., Panno, L., Spahni, R., Tisserand, A., Siegenthaler, U., Leuenberger, M.,2007. Anomalous flow below 2700 m in the EPICA Dome C ice core detected usingδ18O of atmospheric oxygen measurements. Climate of the Past 3, 341–353.

103K. Pol et al. / Earth and Planetary Science Letters 298 (2010) 95–103
Dreyfus, G.B., Raisbeck, G.M., Parrenin, F., Jouzel, J., Guyodo, Y., Nomade, S., Mazaud, A.,2008. An ice core perspective on the age of the Matuyama–Brunhes boundary.Earth and Planetary Science Letters 274, 151–156.
Durand, G., Svensson, A., Persson, A., Gagliardini, O., Gillet-Chaulet, F., Sjolte, J.,Montagnat, M., Dahl-Jensen, D., 2009. Evolution of the texture along te EPICA DomeC ice core. Physics of ice core records II 68, 91–105.
Duval, P., Castelnau, O., 1995. Dynamic recrystallization of ice in polar ice sheets. Journalde Physique 5, 197–206.
EPICA-community-members, 2004. Eight glacial cycles from an Antarctic ice core.Nature 429, 623–628.
EPICA-community-members, 2006. One-to-one coupling of glacial climate variability inGreenland and Antarctica. Nature 444, 195–198.
Ghil, M., Allen, M.R., Dettinger, M.D., Ide, K., Kondrashov, D., Mann, M., Robertson, A.W.,Tian, Y., Varadi, F., Yiou, P., 2002. Advanced spectral methods for climatic timeseries. Reviews of Geophysics 40, 1–41.
Johnsen, S.J., Dansgaard, W., 1992. On flow model dating of stable isotope records fromGreenland ice cores. In: Bard, E., Broecker, W.S. (Eds.), The Last Deglaciation:Absolute and Radiocarbon Chronologies. Springer-Verlag, New-York, pp. 13–24.
Johnsen, S.J., Dahl-Jensen, D., Dansgaard, W., Gundestrup, N., 1995. Greenlandpaleotemperatures derived from GRIP bore hole temperature and ice core isotopeprofiles. Tellus 47B, 624–629.
Johnsen, S.J., Clausen, H.B., Dansgaard, W., Gundestrup, N.S., Hammer, C.U., Andersen,U., Andersen, K.K., Hvidberg, C.S., Dahl-Jensen, D., Steffensen, J.P., Shoji, H.,Sveinbjörnsdottir, A.E., White, J.W.C., Jouzel, J., Fisher, D., 1997. The δ18O recordalong the Greenland Ice Core Project deep ice core and the problem of possibleEemian climatic instability. Journal of Geophysical Research 102, 26397–26410.
Johnsen, S.J., Clausen, H.B., Cuffey, K.M., Hoffmann, G., Schwander, J., Creyts, T., 2000.Diffusion of stable isotopes in polar firn and ice: the isotope effect in firn diffusion.In: Hondoch, T. (Ed.), Physics of Ice Core Records. Hokkaido University Press,Sapporo, pp. 121–140.
Jouzel, J., Vaikmae, R., Petit, J.-R., Martin, M., Duclos, Y., Stievenard, M., Lorius, C., Toots,M., Mélières, M.-A., Burckle, L.H., Barkov, N.I., Kotlyakov, V.M., 1995. The two-stepshape and timing of the last deglaciation in Antarctica. Climate Dynamics 11,151–161.
Jouzel, J., Masson, V., Cattani, O., Falourd, S., Stievenard, M., Stenni, B., Longinelli, A.,Johnsen, S.J., Steffenssen, J.P., Petit, J.R., Schwander, J., Souchez, R., Barkov, N.I., 2001.A new 27 ky high resolution East Antarctic climate record. Geophysical ResearchLetters 28, 3199–3202.
Jouzel, J., Masson-Delmotte, V., Cattani, O., Dreyfus, G., Falourd, S., Hoffmann, G.,Minster, B., Nouet, J., Barnola, J.M., Chappellaz, J., Fischer, H., Gallet, J.C., Johnsen, S.,Leuenberger, M., Loulergue, L., Luethi, D., Oerter, H., Parrenin, F., Raisbeck, G.,Raynaud, D., Schilt, A., Schwander, J., Selmo, E., Souchez, R., Spahni, R., Stauffer, B.,Steffensen, J.P., Stenni, B.S., 2007. T.F., Tison, J.L., Werner, M., Wolff, E., Orbital andmillenial Antarctic climate variability over the past 800,000 years. Science 317,793–796.
Lambert, F., Delmonte, B., Petit, J.R., Bigler, M., Kaufman, P.R., Hutterli, M., Stocker, T.F.,Ruth, U., Steffensen, J.P., Maggi, V., 2008. Dust-climate couplings over the past800,000 years from the EPICA Dome C ice core. Nature 452, 616–619.
Laskar, J., Joutel, F., Boudin, F., 1993. Orbital, precessional, and insolation quantities forthe Earth from −20Myr to +10Myr. Astronomy and Astrophysics 270, 522–533.
Loulergue, L., Schilt, A., Spahni, R., Masson-Delmotte, V., Blunier, T., Lemieux, B., Barnola,J.M., Raynaud, D., Stocker, T., Chappelaz, J., 2008. Orbital and millenial-scalefeatures of atmospheric CH4 over the last 800000 years. Nature 453, 383–386.
Loutre, M.F., 2003. Clues from MIS 11 to predict the future climate — a modelling pointof view. Earth and Planetary Science Letters 212, 213–224.
Loutre, M.F., Berger, A., 2003. Marine Isotope Stage 11 as an analogue for the presentinterglacial. Global and Planetary Change 36, 209–217.
Lüthi, D., Floch, M.L., Bereiter, B., Blunier, T., Barnola, J.M., Siegenthaler, U., Raynaud, D.,Jouzel, J., Fischer, H., Kawamura, K., Stocker, T.F., 2008. High resolution carbondioxide concentration record 650,000–800,000 years before present. Nature 453,379–382.
Masson, V., Vimeux, F., Jouzel, J., Morgan, V., Delmotte, M., Ciais, P., Hammer, C.,Johnsen, S., Lipenkov, V.Y., Mosley-Thompson, E., Petit, J.-R., Steig, E., Stievenard,M., Vaikmae, R., 2000. Holocene climate variability in Antarctica based on 11 icecores isotopic records. Quaternary Research 54, 348–358.
Masson-Delmotte, V., Stenni, B., Jouzel, J., 2004. Common millenial scale variability ofAntarctic and Southern Ocean temperatures during the past 5000 years recon-structed from EPICA Dome C ice core. Holocene 14, 145–151.
Masson-Delmotte, V., Dreyfus, G., Braconnot, P., Johnsen, S., Jouzel, J., Kageyama, M.,Landais, A., Loutre, M.F., Nouet, J., Parrenin, F., Raynaud, D., Stenni, B., Tuenter, E.,2006. Past temperature reconstructions from deep ice cores: relevance for futureclimate change. Climate of the Past 2, 145–165.
Masson-Delmotte, V., Stenni, B., Pol, K., Braconnot, P., Cattani, O., Falourd, S., Kageyama,M., Jouzel, J., Landais, A., Minster, B., Barnola, J.M., Chappellaz, J., Krinner, G.,Johnsen, S., Röthlisberger, R., Hansen, J., Mikolajewicz, U., Otto-Bliesner, B., 2010.EPICA Dome C record of glacial and interglacial intensities. Quaternary ScienceReviews 29, 113–128.
Monnin, E., Indermühle, A., Dällenbach, A., Flückiger, J., Stauffer, B., Stocker, T., Raynaud,D., Barnola, J.M., 2001. Atmospheric CO2 concentrations over the last glacialtermination from the Dome Concordia, Antarctica, ice core. Science 291, 112–114.
Neumann, T.A., Waddington, E.D., 2004. Effects of firn ventilation on isotopic exchange.Journal of Glaciology 169, 183–194.
Nye, J.F., 1992. Water veins and lenses in polycrystalline ice, Physics and Chemistry of Ice.In: Maeno, N., Hondoh, T. (Eds.), Hokkaido University Press, Sapporo, pp. 200–206.
Nye, J.F., 1998. Diffusion of isotopes in the annual layers of ice sheets. Journal ofGlaciology 44, 467–468.
Paillard, D., 1998. The timing of Pleistocene glaciations from a simple multiple-stateclimate model. Nature 391, 378–381.
Parrenin, F., Barnola, J.M., Beer, J., Blunier, T., Castellano, E., Chappellaz, J., Dreyfus, G.,Fischer, H., Fujita, S., Jouzel, J., Kawamura, K., Lemieux-Dudon, B., Loulergue, L.,Masson-Delmotte, V., Narcisi, B., Petit, J.R., Raisbeck, G., Raynaud, D., Ruth, U.,Schwander, J., Severi, M., Spahni, R., Steffensen, J.P., Svensson, A.M., Udisti, R.,Waelbroeck, C., Wolff, E., 2007a. The EDC3 chronology for the EPICA Dome C icecore. Climate of the Past 3, 485–497.
Parrenin, F., Dreyfus, G., Durand, G., Fujita, S., Gagliardini, O., Gillet, F., Jouzel, J.,Kawamura, K., Lhomme, N., Masson-Delmotte, V., Ritz, C., Schwander, J., Shoji, H.,Uemura, R., Yoshida, N., Watanabe, O., Wolff, E.W., 2007b. Ice flow modelling atDome C and Dome Fuji, East Antarctica. Climate of the Past 3, 243–259.
Pollard, D., DeConto, R.M., 2009. Modelling West Antarctic ice sheet growth andcollapse through the past five million years. Nature 458, U329–U389.
Raisbeck, G.M., Yiou, F., Cattani, O., Jouzel, J., 2006. Be-10 evidence for the Matuyama–Brunhes geomagnetic reversal in the EPICA Dome C ice core. Nature 444, 82–84.
Ramseier, R.O., 1967. Self-diffusion of tritium in natural and synthetic ice monocrystals.Journal of Applied Physics 38, 2553–2556.
Rempel, A.W., Wettlaufer, J.S., 2003a. Isotopic diffusion in polycrystalline ice. Journal ofGlaciology 49, 397–406.
Rempel, A.W., Wettlaufer, J.S., 2003b. Segregation, transport, and interaction of climateproxies in polycrystalline ice. Canadian Journal of Physics 81, 89–97.
Ruddimann, W., 2005. Cold climate during the closest stage 11 analog to recentmillennia. Quaternary Science Reviews 24, 1111–1121.
Siengenthaler, U., Stocker, T.F., Monnin, E., Lüthi, D., Schwander, J., Stauffer, B., Raynaud,D., Barnola, J.-M., Fischer, H., Masson-Delmotte, V., Jouzel, J., 2005. Stable carboncycle–climate relationship during the last Pleistocene. Science 310, 1313–1317.
Spahni, R., Chappellaz, J., Stocker, T.F., Loulergue, L., Hausammann, G., Kawamura, K.,Flückiger, J., Schwander, J., Raynaud, D., Masson-Delmotte, V., Jouzel, J., 2005.Variations of atmospheric methane and nitrous oxide during the last 650, 000 yearsfrom Antarctic ice cores. Science 310, 1317–1321.
Tzedakis, P.C., 2009. TheMIS 11–MIS 1 analogy, southern European vegetation, atmosphericmethane and the “early anthropogenic hypothesis”. Climate of the Past Discussion 5,1337.
Vaughn, B., White, J.W.C., Delmotte, M., Trolier, M., Cattani, O., Stievenard, M., 1998. Anautomated system for the uranium reduction method of hydrogen isotope analysisof water. Chemical Geology 152, 309–319.
Wolff, E.W., Barbante, C., Becagli, S., Bigler, M., Boutron, C.F., Castellano, E., de Angelis,M., Federer, U., Fischer, H., Fundel, F., Hansson, M., Hutterli, M., Jonsell, U., Karlin, T.,Kaufmann, P., Lambert, F., Littot, G.C., Mulvaney, R., Röthlisberger, R., Ruth, U.,Severi, M., Siggaard-Andersen, M.L., Sime, L.C., Steffensen, J.P., Stocker, T.F., Traversi,R., Twarloh, B., Udisti, R., Wagenbach, D., Wegner, A., 2010a. Changes inenvironment over the last 800,000 years from chemical analysis of the EPICADome C ice core. Quaternary Science Reviews 29, 285–295.
Wolff, E.W., Fischer, H., Wilhelms, F., 2010b. Chemical Control on Electrical Recordsfrom Central Antarctic Ice Cores. International Polar Year—Oslo Science Conference,Oslo—Norway.
Yiou, P., Fuhrer, K., Meeker, L.D., Jouzel, J., Johnsen, S., Mayewski, P.A., 1997.Paleoclimatic variability inferred from the spectral analysis of Greenland andAntarctic ice core data. Journal of Geophysical Research 102, 26441–26454.