new models and distributions of the electrical breakdown time delay
TRANSCRIPT

Journal of Physics Conference Series
OPEN ACCESS
New models and distributions of the electricalbreakdown time delay in neonTo cite this article S N Stamenkovi 2010 J Phys Conf Ser 257 012023
View the article online for updates and enhancements
You may also likeConversion of an atomic to a molecularargon ion and low pressure argonrelaxationM N Stankov A P Jovanovi V Lj Markoviet al
-
Memory effect and time correlations inbreakdown initiation of DC glow dischargein argon and synthetic airV Lj Markovi B Popovi A P Jovanoviet al
-
From binomial distribution of electronoccurrence to Gauss and Gauss-exponential distribution of the statisticaltime delay Analytical transition andsimulationsV Lj Markovi A P Jovanovi S NStamenkovi et al
-
This content was downloaded from IP address 1794212188 on 20122021 at 0247
New models and distributions of the electrical breakdown time delay in neon
S N Stamenković
Department of Physics University of Niš PO BOX 224 18001 Niš Serbia
ssuzanapmfniacrs
Abstract The measurements of the electrical breakdown time delay td for a wide range of working voltages and at different preionization levels are presented The statistical breakdown time delay ts and the discharge formative time tf are experimentally separated and theoretical models of their dependencies on the overvoltage and number densities of residual charges during relaxation are suggested Several empirical and semiempirical models are used to describe the formative time delay dependence on working voltages tf (U) The empirical and theoretical models from the literature are also applied to the experimental data without and with empirical corrections Moreover several new distributions are experimentally obtained Gauss-exponential Gaussian and double Gaussian ones for the statistical time delay as well as Gaussian and double Gaussian distributions for the formative time The measurements of the breakdown time delay at different preionization levels (afterglow periods) td (τ) obtained with a galvanic layer of gold and a sub-layer of nickel on the copper cathode are compared to the measurements with a vacuum deposited gold layer on the cathode surface It was found that the surface charges retaining on a galvanic layer of gold influence the breakdown time delay which leads to double Gaussian distributions of the formative and statistical time delay
1 Introduction It is well known that the electrical breakdown in gases does not occur at the moment of voltage application to the gas tube but with some delay A time interval between the moment of application of voltage greater than the static breakdown voltage and the electrical breakdown is the breakdown
time delay [1] It has a stochastic character which was experimentally proved by Zuber [2] and its exponential statistical distribution was theoretically derived by von Laue [3] The breakdown time delay comprises the statistical and the formative time delay ie
sU
dt
st ft fsd ttt += The time that
elapses from the application of working voltage ( ) to the appearance of free electron(s) initiating breakdown is the statistical time delay and from this moment to the collapse of the applied voltage and occurrence of a self-sustained current is the formative time delay The best understanding of breakdown processes may be obtained by combining breakdown time delay measurements and the appropriate theoretical models
wU sw UU gt
In this paper several empirical models for the formative time delay dependence on working voltages are suggested models based on power functions exponential functions and the
product of power and exponential functions A few semiempirical models are presented such as models without and with singularity at the static breakdown voltage The theoretical models from
)(Ut f
sU
25th Summer School and International Symposium on the Physics of Ionized GasesmdashSPIG 2010 IOP PublishingJournal of Physics Conference Series 257 (2010) 012023 doi1010881742-65962571012023
ccopy 2010 IOP Publishing Ltd 1
the literature are also applied but good agreements with experimental data are found only at low overvoltages and therefore empirical corrections are introduced [4]
The measurements at different preionization level were carried out and Gaussian and double Gaussian distributions for the formative time were obtained while for the statistical time delay three characteristic (Gaussian Gauss-exponential and exponential) distributions were identified The measurements of the breakdown time delay at different afterglow periods )(τdt obtained with a galvanic layer of gold on the copper cathode are compared to the measurements with a vacuum deposited gold layer on the cathode [56] It was found that the surface charges retaining on a galvanic
layer of gold influence the breakdown time delay The surface charges mask the exponential decay in afterglow as well as the conversion maximum due to molecular nitrogen ions production in
collisions with nitrogen impurities The formative and statistical time delay distributions are double Gaussians due to combined effects of surface and gas-phase charges from the preceding glow Presence of surface regions with reduced conductivity on a galvanic layer of gold is confirmed by scanning electron microscopy (SEM) images and energy dispersive X-ray (EDX) spectrum
+2Ne
+2Ne
2 Experimental details The breakdown time delay measurements were carried out on gas tubes made of borosilicate glass
(8245 Shott technical glass) with volume of One group of measurements was performed on the gas tube with copper cathode gold plated by a vacuum sputter deposition ( ) while the other group of measurements was performed on the gas tube whit a
3300cmV asympVUs 271=
mμ50 hard galvanic layer of
gold with mμ7 sub-layer of nickel on the copper cathode ( VUs 197= ) The electrodes were cylindrical with the diameter and the interelectrode distance was mmD 6= mmd 6= The tubes were filled with research purity neon at the pressure of (Matheson Co with a nitrogen impurity below ) The time delay measurements were carried out by applying step pulses to the tubes at
glow current glow time
mbar313ppm1
mAIg 10= stg 1= and at different working voltages and afterglow
periods wU
τ The measurements were performed by using an electronic automatic system which achieved the voltage rise time and resolution limit of sμ180 More details about the experimental procedure and measuring system can be found in [7]
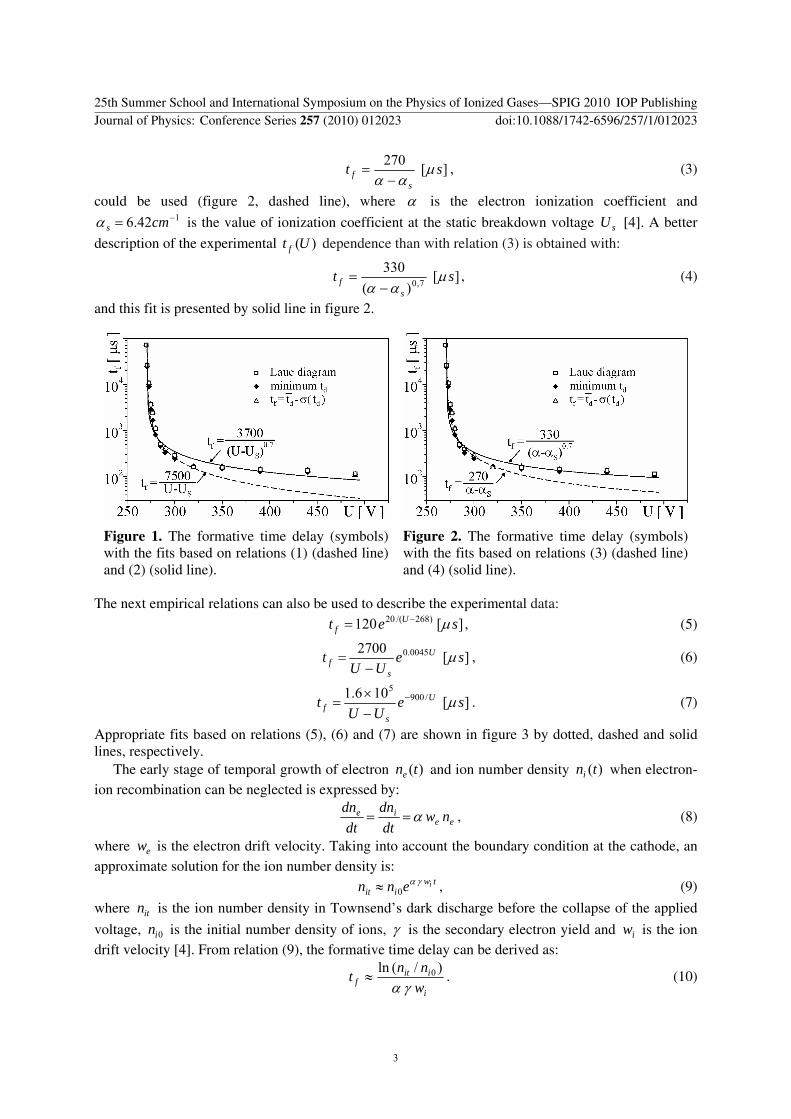
3 Empirical and semiempirical models of tf (U) dependence In this section several empirical and semiempirical models were applied for modelling the experimental formative time delay dependence on overvoltages obtained on the gas tube with a
vacuum deposited gold layer on the cathode The formative time delay was determined in three different ways [8] from the Laue diagrams where linear graph of intersects the time delay
axis from histograms as the minimum value of and from a difference
)(Ut f
)ln( Nn
dt =ft asympminus sd tt ( )dd tt σminus
where standard deviation ( )dtσ is approximately equal to the mean value of statistical time delay st
It is known that decreases when overvoltages increase ie ft Ut f Δprop 1 [9] Applied to our
experimental data it takes the form
][7500 sUU
ts
f μminus
= (1)
where and fit is shown by dashed line in figure 1 The better agreement at higher overvoltages is achieved with relation (figure 1 solid line)
VUs 271=
][)(
370070 s
UUt
sf μ
minus= (2)
as an improvement of relation (1) Also the fitting relation [10]
25th Summer School and International Symposium on the Physics of Ionized GasesmdashSPIG 2010 IOP PublishingJournal of Physics Conference Series 257 (2010) 012023 doi1010881742-65962571012023
2
][270 st μ= s
f αα minus (3)
could be used (figure 2 dashed line) where α is the electron ionization coefficient and 1426 minus= cmsα is the value of ionization coefficient at the static breakdown voltage sU [4] A better
he experimental )(Ut f dependence than with relation (3) is obtained with description of t
][)(
33070 st
sf μ
αα minus= (4)
and this fit is presented by solid line in figure 2
Figure 1 The formative time delay (symbols) Figure 2 The formative time delay (symbols)
he next empirical relations can also be used to describe the experimental data
(5)
with the fits based on relations (1) (dashed line) and (2) (solid line)
with the fits based on relations (3) (dashed line) and (4) (solid line)
T
][120 )268(20 set Uf μminus=
][2700 00450 seUU
t U
sf μ
minus= (6)
][1061 9005
seUU
t U
sf μminus
minustimes
= (7)
Appropriate fits based on relations (5) (6) and (7) are shown in figure 3 by dotted dashed and solid
f temporal growth of electron and ion number density when electron-ion
lines respectively The early stage o )(tne )(tni
recombination can be neglected is expressed by
eeie dndn
== nwdtdt
α (8)
where is the electron drift velocity Taking into account the boundary condition at the cathode an
ie γα (9)
where is the ion number density in Townsendrsquos dark
n
ewapproximate solution for the ion number density is
iit nn 0asymp tw
itn discharge before the collapse of the applied
voltage 0i is the initial number density of ions γ is the secondary electron yield and iw is the ion drift velocity [4] From relation (9) the formative time delay can be derived as
i
iit nnt )(ln 0asymp f wγα (10)
25th Summer School and International Symposium on the Physics of Ionized GasesmdashSPIG 2010 IOP PublishingJournal of Physics Conference Series 257 (2010) 012023 doi1010881742-65962571012023
3
The best fit of experimental data is shown by dashed line in figure 4 but as could be seen from the figure this semiempirical model is applicable at relatively high overvoltages far from the singularity at sU The singularity ( infinrarrft ) at sUU rarr could be introduced into the previous model if we define
an approximate preionization level at the static breakdown voltage isn Then the relation (10) takes the following form
is
isitf
nnt )(lnasymp (11)
wγαα )( minus
and the best fit is presented in figure 4 by solid line
Figure 3 The formative time delay (symbols) with the fits based on relations (5) (dotted line)
Figure 4 The formative time delay (symbols) with the fits based on relations (10) (dashed
(6) (dashed line) and (7) (solid line)
In the figure 5 the fit based on the model fromorrections The Schadersquos model
line) and (11) (solid line)
Schade [11] is shown together with our empiricalc
Ubf e
UUUat )(
minus= (12)
s
whit parameters ⎥⎥⎤
⎟⎟⎞
⎜⎜⎛
⎟⎞
⎜⎛minusp ipdB
and pdBb = describes ⎦⎢
⎢⎣
⎡
⎠⎝⎠⎝
minus+=
02
2
2
2
ex)(1ln)(iUU
UUpABwdpAB
UUas
s
i
s
e only at low overvoltages (dotted line in figure 5) Theref with corresponding dependencies are shown in the
the formative tim ore w empirical corrections and the suggested fits of
figure 5 The best agreement is obtained with empirical )(Ua dependence that decreases exponentially at low overvoltages and increases linearly at high overvoltages (solid lines in figure 5) [4] Another model from the literature [12-14] is applied to experimental data and appropriate fit together with our correction are shown in the figure 6 We have used the expression for the temporal growth of ion current and derived the formative time in our conditions [4]
e made )(Ut f )(Ua
⎥⎤
⎢⎣
⎡minusminusminusminustimes
minus= minusminus+ 1)( ]1[)]()1(1[ln1 dwdi
fieiqewt λαα
αλα
λ (13)
⎦0iwhere and are ion and initial ion currents while +i 0i λ is the growth parameter which is determinedfrom the characteristic equation
[ ]11 )( minus= dwie λααγ (14) minus
minus
iwλαDavidsonrsquos model with linear growth parameter is a good representation of experimental data only at low overvoltages (dashed lines in figure 6) and we made empiricathe exponential growth parameter (solid lines in figure 6) that describes the experimental data for all
l correction again ie we introduced
25th Summer School and International Symposium on the Physics of Ionized GasesmdashSPIG 2010 IOP PublishingJournal of Physics Conference Series 257 (2010) 012023 doi1010881742-65962571012023
4
overvoltages In general the good agreement of models from the literature with experimental data was found at low overvoltages while at high overvoltages the empirical corrections are necessary
Figure 5 The formative time delay (symbols) with the fits based on model from [11] inset a(U) dependences
Figure 6 The formative time delay (symbols) with the fits based on model from [12-14] inset λ(U) dependences
4T
Distributions of formative and statistical time he
delay )(τdt dependences (the memory curves) as we viationsll as the standard de )(τσ td are shown in
with a galvanic gold layer on the cathode the gas tube with a vacuum deposited gold
(nabla
figure 7 The measurements carried out on the gas tube ( times lowast) were compared to the measurements performed onlayer ) In the case of the cathode with galvanic layer of gold and sub-layer of nickel nickel atoms from sub-layer diffuse into the gold layer causing defects ie surface regions with reduced conductivity Presence of these regions on a galvanic gold layer that retain the surface charges is confirmed by scanning electron microscopy (SEM) images and energy dispersive X-ray (EDX) spectrum (Figure 8)
Figure 7 The breakdown time delay td and the standard deviations σtd in neon
Figure 8 SEM images and energy dispersive X-ray (EDX) spectrum
In st tions
the region Ia experimental distributions of theatistical time delay and its fluctua
formative time are obtained providing that the tsσ are red s [56] It was found for
acuum deposited gold layer that the formative time delay in the ionic region Ia increases linearly with uced to a negligible value
v
the afterglow period ( τpropft ) (figure 7 ) consistent with an exponential +2Ne decay The standard
deviation of the formative time also increases linearly with τ but faster than ft (figure 7 nabla) [6] The
25th Summer School and International Symposium on the Physics of Ionized GasesmdashSPIG 2010 IOP PublishingJournal of Physics Conference Series 257 (2010) 012023 doi1010881742-65962571012023
5
experimental distributi the formative time delay for a vacuum deposited gold layer in this region are Gaussian (shaded histograms figure 9) and they are fitted by Gaussian distribution functions [6]
ons of
Figure 9 The double-Gaussian density distribution functions of tf measured at the gas tube with a galvanic gold layer on the cathode surface compared to those of the gas tube with a vacuum gold layer (shaded distributions) in the region Ia at U=320V
T
n ies The appearance
he charged particle decay is followed by the simultaneous conversion (Ib) of molecular neon ions to
itrogen ions originating from nitrogen present as impurit NeNNNe 2222 +rarr+ ++
of nitrogen ions is manifested by double-Gaussian distributions (shaded histograms figure 10) and the experimental distributions are fitted by double-Gaussian distribution function [6]
]2
)(exp[2
]2
)(exp[2
)( 22
22
2
221
21
1
1
σσπσσπiiii
iGGttattatf minusminus
+minusminus
= (15)
Figure 10 The double-Gaussian density distribution of tf measured at the gas tube with a galvanic gold layer on the cathode compared to those of the gas tube with a vacuum gold layer (shaded distributions) in the region Ib at U=320V
In the case of a galvanic gold layer on the copper cathode the situation is different (figure 7 times lowast)
he formative time delays and their standaT rd deviations in the early afterglow region of the memory urve are almost flat and lengthened to about The exponential decay inc ms60 +
2Ne afterglow (confirmed experimentally and theoretically for a vacuum deposited gold layer [6]) is masked by the surface charges on the cathode surface Also the conversion maximum obtained in the region Ib for
25th Summer School and International Symposium on the Physics of Ionized GasesmdashSPIG 2010 IOP PublishingJournal of Physics Conference Series 257 (2010) 012023 doi1010881742-65962571012023
6
the gas tube with vacuum deposited gold layer is significantly reduced and shifted to greater afterglow times In the case of galvanic gold layer the formative time distributions are double-Gaussian due to combined effect of surface and gas-phase charges (figures 9 and 10) The first Gaussians correspond to surface charges involved in discharge formation while the second Gaussian distributions (shifted to greater formative times) correspond to gas-phase charges remained from the preceding glow The experimental distributions of the formative time are fitted by double-Gaussian distribution functions (15) and appropriate parameters are shown in figures 9 and 10
With regard to the statistical time delay its experimental distributions are obtained in region II of the memory curves (figure 7) where the time delay distributions are dominated by the fluctuations of the statistical time ie tstd σσ asymp The shapes of st distributions depend on electron yields Y ori
y double-Gaussian dis
ginating from residual ionization and nitrogen atoms The analysis shows that distributions of the statistical time delay st for a vacuum deposited gold layer change from Gaussian and Gauss-exponential to exponential distribution due to influence of residual ionization [6]
In the case of a galvanic gold layer on the cathode surface charges affect the statistical time delay distributions The influence of the surface charges on the experimental st distributions is shown in the figure 11 The appearance of the surface charge initiation is manifested b
tributions obtained in the first part of the region II The experimental distributions of the statistical time delay are fitted by double-Gaussian distribution function (15) (solid lines in figure 11) and appropriate parameters are shown in the figure 11 The first Gaussians in the figure are related to the surface charge initiation while the second ones to the gas-phase charge initiation because the ions from the gas-phase take a time drifting to the cathode after the application of voltage Based on the distributions of the statistical time delay shown in the figure 11 it can be concluded that influence of the surface charge initiation decreasing After the exhausting of surface charges the breakdown initiation is dominated by the decay of gas-phase charges (region IIb) ie by +
2N ions present as
impurities in neon From the slope of the )(τst dependence in region IIb the loss frequency of
dominant species ( 130 minuscong sν ) and the diffusion coefficient 1235 minusasymp scmD could be determined [7] The last value is in a good agreement with the value from the literature obtained for the ambipolar diffusion coefficient of +
2N ions in neon [15] is part of the memory curve the three characteristic distributions of the statistical time delay are obtained when th eriod increases Gaussian Gauss-exponential and exponential distribution (figure 12) The analytic forms of the density distribution functions used for the fitting of the corresponding experimental distributions are also shown in the figure 12
In the afterglow p
Figure 11 The double-Gaussian density distribution functions of ts in the region IIa for the gas tube with a galvanic gold layer on the cathode
25th Summer School and International Symposium on the Physics of Ionized GasesmdashSPIG 2010 IOP PublishingJournal of Physics Conference Series 257 (2010) 012023 doi1010881742-65962571012023
7
Figure 12 The three characteristic distribution functions of ts in the region IIb of figure 7 Gaussian Gauss-exponential and exponential distribution function
g voltages in neon Applied models from the with experimental data only at low overvoltages Therefore we made empirical
K 1925 Ann Phys 381 231
ocić S R and Đurić S M 2007 Eur Phys J Appl Phys
07
5 Conclusion In this study several empirical and semiempirical models are applied for description of the experimental formative time delay dependence on workinliterature agree corrections that give good agreement with the experimental data over the whole range of overvoltages Moreover the statistical breakdown time delay st and the formative time ft are experimentally
separated and several new distributions are experimentally obtained Gauss-exponential Gaussian and double Gaussian ones for the statistical time delay as well as Gaussian and double Gaussian distributions for the formative time
Acknowledgements I would like to express my thanks to professor V Lj Marković who contributed to this study The work was partial supported by MNZŽS of Serbia (project 141025)
References [1] Morgan C G 1978 in Electrical Breakdown of Gases ed J M Meek J D Craggs (John Wiley
amp Sons Chichester) [2] Zuber [3] von Laue M 1925 Ann Phys 381 261 [4] Stamenković S N Marković V Lj and Gocić 2009 Eur Phys J Appl Phys 45 11003 [5] Marković V Lj Stamenković S N G
38 73 [6] Marković V Lj Gocić S R and Stamenković S N 2009 J Phys D Appl Phys 42 0152[7] Marković V Lj Gocić S R Stamenković S N and Petrović Z Lj 2007 Phys Plasmas 14
103504 [8] Marković V Lj Petrović Z Lj and Pejović M M 1997 Plasma Sources Sci Technol 6 240 [9] Gaumlnger B 1953 Der elektrische Durchschlag von Gasen (Springer-Verlag Berlin) [10] Deutsch F 1965 Proc VII Int Conf Phenomena in Ionized Gases ed B Perović D Tošić
(Institute of Nuclear Sciences Belgrade Yugoslavia) 313 104[11] Schade R 1937 Z Phys 487
S C and Jones F L with math appendix by Dav[12] Dutton J Haydon idson P M 1953 Brit J Appl Phys 4 170
99 72 [13] Davidson P M 1955 Phys Rev 10[14] Morgan C G 1956 Phys Rev 104 566 [15] Maumlrk T D and Oskam H J 1971 Z Phys Rev 247 84
25th Summer School and International Symposium on the Physics of Ionized GasesmdashSPIG 2010 IOP PublishingJournal of Physics Conference Series 257 (2010) 012023 doi1010881742-65962571012023
8

New models and distributions of the electrical breakdown time delay in neon
S N Stamenković
Department of Physics University of Niš PO BOX 224 18001 Niš Serbia
ssuzanapmfniacrs
Abstract The measurements of the electrical breakdown time delay td for a wide range of working voltages and at different preionization levels are presented The statistical breakdown time delay ts and the discharge formative time tf are experimentally separated and theoretical models of their dependencies on the overvoltage and number densities of residual charges during relaxation are suggested Several empirical and semiempirical models are used to describe the formative time delay dependence on working voltages tf (U) The empirical and theoretical models from the literature are also applied to the experimental data without and with empirical corrections Moreover several new distributions are experimentally obtained Gauss-exponential Gaussian and double Gaussian ones for the statistical time delay as well as Gaussian and double Gaussian distributions for the formative time The measurements of the breakdown time delay at different preionization levels (afterglow periods) td (τ) obtained with a galvanic layer of gold and a sub-layer of nickel on the copper cathode are compared to the measurements with a vacuum deposited gold layer on the cathode surface It was found that the surface charges retaining on a galvanic layer of gold influence the breakdown time delay which leads to double Gaussian distributions of the formative and statistical time delay
1 Introduction It is well known that the electrical breakdown in gases does not occur at the moment of voltage application to the gas tube but with some delay A time interval between the moment of application of voltage greater than the static breakdown voltage and the electrical breakdown is the breakdown
time delay [1] It has a stochastic character which was experimentally proved by Zuber [2] and its exponential statistical distribution was theoretically derived by von Laue [3] The breakdown time delay comprises the statistical and the formative time delay ie
sU
dt
st ft fsd ttt += The time that
elapses from the application of working voltage ( ) to the appearance of free electron(s) initiating breakdown is the statistical time delay and from this moment to the collapse of the applied voltage and occurrence of a self-sustained current is the formative time delay The best understanding of breakdown processes may be obtained by combining breakdown time delay measurements and the appropriate theoretical models
wU sw UU gt
In this paper several empirical models for the formative time delay dependence on working voltages are suggested models based on power functions exponential functions and the
product of power and exponential functions A few semiempirical models are presented such as models without and with singularity at the static breakdown voltage The theoretical models from
)(Ut f
sU
25th Summer School and International Symposium on the Physics of Ionized GasesmdashSPIG 2010 IOP PublishingJournal of Physics Conference Series 257 (2010) 012023 doi1010881742-65962571012023
ccopy 2010 IOP Publishing Ltd 1
the literature are also applied but good agreements with experimental data are found only at low overvoltages and therefore empirical corrections are introduced [4]
The measurements at different preionization level were carried out and Gaussian and double Gaussian distributions for the formative time were obtained while for the statistical time delay three characteristic (Gaussian Gauss-exponential and exponential) distributions were identified The measurements of the breakdown time delay at different afterglow periods )(τdt obtained with a galvanic layer of gold on the copper cathode are compared to the measurements with a vacuum deposited gold layer on the cathode [56] It was found that the surface charges retaining on a galvanic
layer of gold influence the breakdown time delay The surface charges mask the exponential decay in afterglow as well as the conversion maximum due to molecular nitrogen ions production in
collisions with nitrogen impurities The formative and statistical time delay distributions are double Gaussians due to combined effects of surface and gas-phase charges from the preceding glow Presence of surface regions with reduced conductivity on a galvanic layer of gold is confirmed by scanning electron microscopy (SEM) images and energy dispersive X-ray (EDX) spectrum
+2Ne
+2Ne
2 Experimental details The breakdown time delay measurements were carried out on gas tubes made of borosilicate glass
(8245 Shott technical glass) with volume of One group of measurements was performed on the gas tube with copper cathode gold plated by a vacuum sputter deposition ( ) while the other group of measurements was performed on the gas tube whit a
3300cmV asympVUs 271=
mμ50 hard galvanic layer of
gold with mμ7 sub-layer of nickel on the copper cathode ( VUs 197= ) The electrodes were cylindrical with the diameter and the interelectrode distance was mmD 6= mmd 6= The tubes were filled with research purity neon at the pressure of (Matheson Co with a nitrogen impurity below ) The time delay measurements were carried out by applying step pulses to the tubes at
glow current glow time
mbar313ppm1
mAIg 10= stg 1= and at different working voltages and afterglow
periods wU
τ The measurements were performed by using an electronic automatic system which achieved the voltage rise time and resolution limit of sμ180 More details about the experimental procedure and measuring system can be found in [7]
3 Empirical and semiempirical models of tf (U) dependence In this section several empirical and semiempirical models were applied for modelling the experimental formative time delay dependence on overvoltages obtained on the gas tube with a
vacuum deposited gold layer on the cathode The formative time delay was determined in three different ways [8] from the Laue diagrams where linear graph of intersects the time delay
axis from histograms as the minimum value of and from a difference
)(Ut f
)ln( Nn
dt =ft asympminus sd tt ( )dd tt σminus
where standard deviation ( )dtσ is approximately equal to the mean value of statistical time delay st
It is known that decreases when overvoltages increase ie ft Ut f Δprop 1 [9] Applied to our
experimental data it takes the form
][7500 sUU
ts
f μminus
= (1)
where and fit is shown by dashed line in figure 1 The better agreement at higher overvoltages is achieved with relation (figure 1 solid line)
VUs 271=
][)(
370070 s
UUt
sf μ
minus= (2)
as an improvement of relation (1) Also the fitting relation [10]
25th Summer School and International Symposium on the Physics of Ionized GasesmdashSPIG 2010 IOP PublishingJournal of Physics Conference Series 257 (2010) 012023 doi1010881742-65962571012023
2
][270 st μ= s
f αα minus (3)
could be used (figure 2 dashed line) where α is the electron ionization coefficient and 1426 minus= cmsα is the value of ionization coefficient at the static breakdown voltage sU [4] A better
he experimental )(Ut f dependence than with relation (3) is obtained with description of t
][)(
33070 st
sf μ
αα minus= (4)
and this fit is presented by solid line in figure 2
Figure 1 The formative time delay (symbols) Figure 2 The formative time delay (symbols)
he next empirical relations can also be used to describe the experimental data
(5)
with the fits based on relations (1) (dashed line) and (2) (solid line)
with the fits based on relations (3) (dashed line) and (4) (solid line)
T
][120 )268(20 set Uf μminus=
][2700 00450 seUU
t U
sf μ
minus= (6)
][1061 9005
seUU
t U
sf μminus
minustimes
= (7)
Appropriate fits based on relations (5) (6) and (7) are shown in figure 3 by dotted dashed and solid
f temporal growth of electron and ion number density when electron-ion
lines respectively The early stage o )(tne )(tni
recombination can be neglected is expressed by
eeie dndn
== nwdtdt
α (8)
where is the electron drift velocity Taking into account the boundary condition at the cathode an
ie γα (9)
where is the ion number density in Townsendrsquos dark
n
ewapproximate solution for the ion number density is
iit nn 0asymp tw
itn discharge before the collapse of the applied
voltage 0i is the initial number density of ions γ is the secondary electron yield and iw is the ion drift velocity [4] From relation (9) the formative time delay can be derived as
i
iit nnt )(ln 0asymp f wγα (10)
25th Summer School and International Symposium on the Physics of Ionized GasesmdashSPIG 2010 IOP PublishingJournal of Physics Conference Series 257 (2010) 012023 doi1010881742-65962571012023
3
The best fit of experimental data is shown by dashed line in figure 4 but as could be seen from the figure this semiempirical model is applicable at relatively high overvoltages far from the singularity at sU The singularity ( infinrarrft ) at sUU rarr could be introduced into the previous model if we define
an approximate preionization level at the static breakdown voltage isn Then the relation (10) takes the following form
is
isitf
nnt )(lnasymp (11)
wγαα )( minus
and the best fit is presented in figure 4 by solid line
Figure 3 The formative time delay (symbols) with the fits based on relations (5) (dotted line)
Figure 4 The formative time delay (symbols) with the fits based on relations (10) (dashed
(6) (dashed line) and (7) (solid line)
In the figure 5 the fit based on the model fromorrections The Schadersquos model
line) and (11) (solid line)
Schade [11] is shown together with our empiricalc
Ubf e
UUUat )(
minus= (12)
s
whit parameters ⎥⎥⎤
⎟⎟⎞
⎜⎜⎛
⎟⎞
⎜⎛minusp ipdB
and pdBb = describes ⎦⎢
⎢⎣
⎡
⎠⎝⎠⎝
minus+=
02
2
2
2
ex)(1ln)(iUU
UUpABwdpAB
UUas
s
i
s
e only at low overvoltages (dotted line in figure 5) Theref with corresponding dependencies are shown in the
the formative tim ore w empirical corrections and the suggested fits of
figure 5 The best agreement is obtained with empirical )(Ua dependence that decreases exponentially at low overvoltages and increases linearly at high overvoltages (solid lines in figure 5) [4] Another model from the literature [12-14] is applied to experimental data and appropriate fit together with our correction are shown in the figure 6 We have used the expression for the temporal growth of ion current and derived the formative time in our conditions [4]
e made )(Ut f )(Ua
⎥⎤
⎢⎣
⎡minusminusminusminustimes
minus= minusminus+ 1)( ]1[)]()1(1[ln1 dwdi
fieiqewt λαα
αλα
λ (13)
⎦0iwhere and are ion and initial ion currents while +i 0i λ is the growth parameter which is determinedfrom the characteristic equation
[ ]11 )( minus= dwie λααγ (14) minus
minus
iwλαDavidsonrsquos model with linear growth parameter is a good representation of experimental data only at low overvoltages (dashed lines in figure 6) and we made empiricathe exponential growth parameter (solid lines in figure 6) that describes the experimental data for all
l correction again ie we introduced
25th Summer School and International Symposium on the Physics of Ionized GasesmdashSPIG 2010 IOP PublishingJournal of Physics Conference Series 257 (2010) 012023 doi1010881742-65962571012023
4
overvoltages In general the good agreement of models from the literature with experimental data was found at low overvoltages while at high overvoltages the empirical corrections are necessary
Figure 5 The formative time delay (symbols) with the fits based on model from [11] inset a(U) dependences
Figure 6 The formative time delay (symbols) with the fits based on model from [12-14] inset λ(U) dependences
4T
Distributions of formative and statistical time he
delay )(τdt dependences (the memory curves) as we viationsll as the standard de )(τσ td are shown in
with a galvanic gold layer on the cathode the gas tube with a vacuum deposited gold
(nabla
figure 7 The measurements carried out on the gas tube ( times lowast) were compared to the measurements performed onlayer ) In the case of the cathode with galvanic layer of gold and sub-layer of nickel nickel atoms from sub-layer diffuse into the gold layer causing defects ie surface regions with reduced conductivity Presence of these regions on a galvanic gold layer that retain the surface charges is confirmed by scanning electron microscopy (SEM) images and energy dispersive X-ray (EDX) spectrum (Figure 8)
Figure 7 The breakdown time delay td and the standard deviations σtd in neon
Figure 8 SEM images and energy dispersive X-ray (EDX) spectrum
In st tions
the region Ia experimental distributions of theatistical time delay and its fluctua
formative time are obtained providing that the tsσ are red s [56] It was found for
acuum deposited gold layer that the formative time delay in the ionic region Ia increases linearly with uced to a negligible value
v
the afterglow period ( τpropft ) (figure 7 ) consistent with an exponential +2Ne decay The standard
deviation of the formative time also increases linearly with τ but faster than ft (figure 7 nabla) [6] The
25th Summer School and International Symposium on the Physics of Ionized GasesmdashSPIG 2010 IOP PublishingJournal of Physics Conference Series 257 (2010) 012023 doi1010881742-65962571012023
5
experimental distributi the formative time delay for a vacuum deposited gold layer in this region are Gaussian (shaded histograms figure 9) and they are fitted by Gaussian distribution functions [6]
ons of
Figure 9 The double-Gaussian density distribution functions of tf measured at the gas tube with a galvanic gold layer on the cathode surface compared to those of the gas tube with a vacuum gold layer (shaded distributions) in the region Ia at U=320V
T
n ies The appearance
he charged particle decay is followed by the simultaneous conversion (Ib) of molecular neon ions to
itrogen ions originating from nitrogen present as impurit NeNNNe 2222 +rarr+ ++
of nitrogen ions is manifested by double-Gaussian distributions (shaded histograms figure 10) and the experimental distributions are fitted by double-Gaussian distribution function [6]
]2
)(exp[2
]2
)(exp[2
)( 22
22
2
221
21
1
1
σσπσσπiiii
iGGttattatf minusminus
+minusminus
= (15)
Figure 10 The double-Gaussian density distribution of tf measured at the gas tube with a galvanic gold layer on the cathode compared to those of the gas tube with a vacuum gold layer (shaded distributions) in the region Ib at U=320V
In the case of a galvanic gold layer on the copper cathode the situation is different (figure 7 times lowast)
he formative time delays and their standaT rd deviations in the early afterglow region of the memory urve are almost flat and lengthened to about The exponential decay inc ms60 +
2Ne afterglow (confirmed experimentally and theoretically for a vacuum deposited gold layer [6]) is masked by the surface charges on the cathode surface Also the conversion maximum obtained in the region Ib for
25th Summer School and International Symposium on the Physics of Ionized GasesmdashSPIG 2010 IOP PublishingJournal of Physics Conference Series 257 (2010) 012023 doi1010881742-65962571012023
6
the gas tube with vacuum deposited gold layer is significantly reduced and shifted to greater afterglow times In the case of galvanic gold layer the formative time distributions are double-Gaussian due to combined effect of surface and gas-phase charges (figures 9 and 10) The first Gaussians correspond to surface charges involved in discharge formation while the second Gaussian distributions (shifted to greater formative times) correspond to gas-phase charges remained from the preceding glow The experimental distributions of the formative time are fitted by double-Gaussian distribution functions (15) and appropriate parameters are shown in figures 9 and 10
With regard to the statistical time delay its experimental distributions are obtained in region II of the memory curves (figure 7) where the time delay distributions are dominated by the fluctuations of the statistical time ie tstd σσ asymp The shapes of st distributions depend on electron yields Y ori
y double-Gaussian dis
ginating from residual ionization and nitrogen atoms The analysis shows that distributions of the statistical time delay st for a vacuum deposited gold layer change from Gaussian and Gauss-exponential to exponential distribution due to influence of residual ionization [6]
In the case of a galvanic gold layer on the cathode surface charges affect the statistical time delay distributions The influence of the surface charges on the experimental st distributions is shown in the figure 11 The appearance of the surface charge initiation is manifested b
tributions obtained in the first part of the region II The experimental distributions of the statistical time delay are fitted by double-Gaussian distribution function (15) (solid lines in figure 11) and appropriate parameters are shown in the figure 11 The first Gaussians in the figure are related to the surface charge initiation while the second ones to the gas-phase charge initiation because the ions from the gas-phase take a time drifting to the cathode after the application of voltage Based on the distributions of the statistical time delay shown in the figure 11 it can be concluded that influence of the surface charge initiation decreasing After the exhausting of surface charges the breakdown initiation is dominated by the decay of gas-phase charges (region IIb) ie by +
2N ions present as
impurities in neon From the slope of the )(τst dependence in region IIb the loss frequency of
dominant species ( 130 minuscong sν ) and the diffusion coefficient 1235 minusasymp scmD could be determined [7] The last value is in a good agreement with the value from the literature obtained for the ambipolar diffusion coefficient of +
2N ions in neon [15] is part of the memory curve the three characteristic distributions of the statistical time delay are obtained when th eriod increases Gaussian Gauss-exponential and exponential distribution (figure 12) The analytic forms of the density distribution functions used for the fitting of the corresponding experimental distributions are also shown in the figure 12
In the afterglow p
Figure 11 The double-Gaussian density distribution functions of ts in the region IIa for the gas tube with a galvanic gold layer on the cathode
25th Summer School and International Symposium on the Physics of Ionized GasesmdashSPIG 2010 IOP PublishingJournal of Physics Conference Series 257 (2010) 012023 doi1010881742-65962571012023
7
Figure 12 The three characteristic distribution functions of ts in the region IIb of figure 7 Gaussian Gauss-exponential and exponential distribution function
g voltages in neon Applied models from the with experimental data only at low overvoltages Therefore we made empirical
K 1925 Ann Phys 381 231
ocić S R and Đurić S M 2007 Eur Phys J Appl Phys
07
5 Conclusion In this study several empirical and semiempirical models are applied for description of the experimental formative time delay dependence on workinliterature agree corrections that give good agreement with the experimental data over the whole range of overvoltages Moreover the statistical breakdown time delay st and the formative time ft are experimentally
separated and several new distributions are experimentally obtained Gauss-exponential Gaussian and double Gaussian ones for the statistical time delay as well as Gaussian and double Gaussian distributions for the formative time
Acknowledgements I would like to express my thanks to professor V Lj Marković who contributed to this study The work was partial supported by MNZŽS of Serbia (project 141025)
References [1] Morgan C G 1978 in Electrical Breakdown of Gases ed J M Meek J D Craggs (John Wiley
amp Sons Chichester) [2] Zuber [3] von Laue M 1925 Ann Phys 381 261 [4] Stamenković S N Marković V Lj and Gocić 2009 Eur Phys J Appl Phys 45 11003 [5] Marković V Lj Stamenković S N G
38 73 [6] Marković V Lj Gocić S R and Stamenković S N 2009 J Phys D Appl Phys 42 0152[7] Marković V Lj Gocić S R Stamenković S N and Petrović Z Lj 2007 Phys Plasmas 14
103504 [8] Marković V Lj Petrović Z Lj and Pejović M M 1997 Plasma Sources Sci Technol 6 240 [9] Gaumlnger B 1953 Der elektrische Durchschlag von Gasen (Springer-Verlag Berlin) [10] Deutsch F 1965 Proc VII Int Conf Phenomena in Ionized Gases ed B Perović D Tošić
(Institute of Nuclear Sciences Belgrade Yugoslavia) 313 104[11] Schade R 1937 Z Phys 487
S C and Jones F L with math appendix by Dav[12] Dutton J Haydon idson P M 1953 Brit J Appl Phys 4 170
99 72 [13] Davidson P M 1955 Phys Rev 10[14] Morgan C G 1956 Phys Rev 104 566 [15] Maumlrk T D and Oskam H J 1971 Z Phys Rev 247 84
25th Summer School and International Symposium on the Physics of Ionized GasesmdashSPIG 2010 IOP PublishingJournal of Physics Conference Series 257 (2010) 012023 doi1010881742-65962571012023
8