new power quality indices
DESCRIPTION
NEW POWER QUALITY INDICES. Z bigniew LEONOWICZ Department of Electrical Engineering Wroclaw University of Technology, Poland. The Seventh IASTED International Conference on Power and Energy Systems , EuroPES 2007 August 29 – 31, 2007 , P alma de Mallorca, Spain. Contents of presentation. - PowerPoint PPT PresentationTRANSCRIPT

NEW POWER QUALITY NEW POWER QUALITY INDICESINDICES
Zbigniew LEONOWICZ Department of Electrical Engineering
Wroclaw University of Technology, Poland
The Seventh IASTED International Conference onPower and Energy Systems, EuroPES 2007EuroPES 2007
August 29 – 31, 2007, Palma de Mallorca, Spain
Contents of presentation
• Motivations for applying parametric spectral analysis in electrical power engineering
• Power quality assessment - IEC groups
• Performance of applied tools• The ESPRIT & MUSIC methods• Results of investigations• Conclusions
Motivations
• The quality of voltage waveforms is nowadays an issue of the utmost importance for power utilities, electric energy consumers and also for the manufactures of electric and electronic equipment. The proliferation of nonlinear loads connected to power systems has triggered a growing concern with power quality issues.
• The inherent operation characteristics of these loads deteriorate the quality of the delivered energy, and increase the energy losses as well as decrease the reliability of a power system.

Motivations
• Methods of power quality assessment in power systems are almost exclusively based on Fourier Transform, which has many limitationswhich has many limitations.
• Parametric spectral methods, such as ESPRIT or MUSIC do not suffer from inherent limitations of resolution or dependence of estimation error on the window length (phase dependence of the estimation error) of FFT.
• The authors argue that the use of high-resolution spectrum estimation methods instead of Fourier-based techniques can improve the accuracy of measurement of spectral parameters of distorted waveforms encountered in power systems, in particular the estimation of the power quality power quality indicesindices.
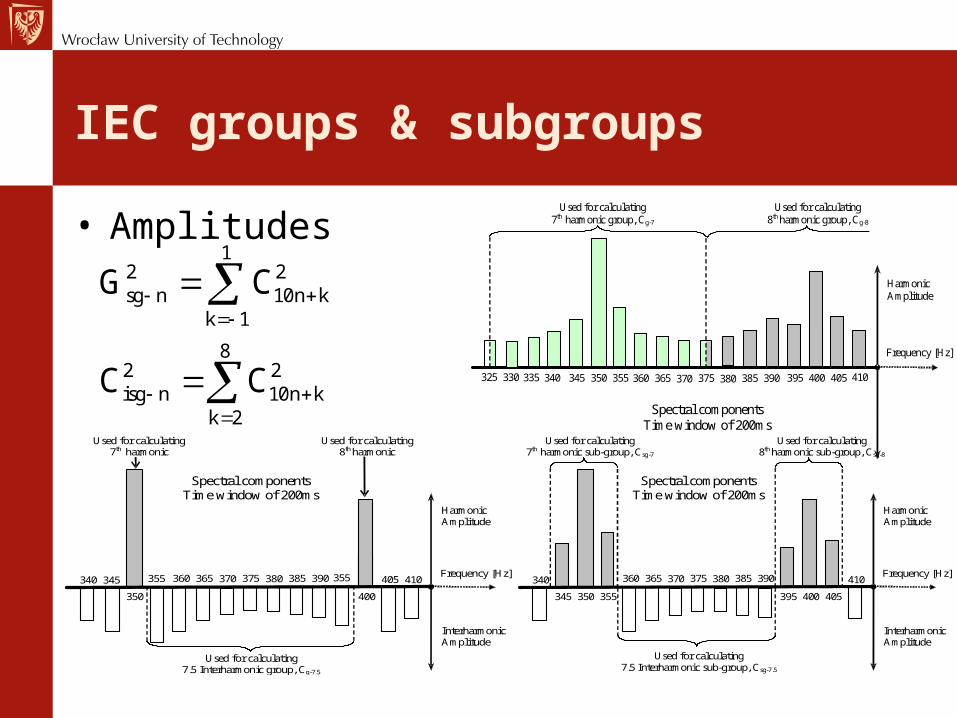
IEC groups & subgroups
• Amplitudes1
2 2sg n 10n k
k 1
82 2isg n 10n k
k 2
G C
C C
340 345 350 355 395 400 370 380 360 365 375 390 385 405 410
Used for calculating 7th harmonic group, Cg-7
Used for calculating 8th harmonic group, Cg-8
Frequency [Hz]
Harmonic Amplitude
Spectral components Time window of 200ms
325 335 330
Used for calculating 7.5 Interharmonic group, Cg-7.5
340 345
350 400
370 380 360 365 375 390 385 405 410
Used for calculating 7th harmonic
Used for calculating 8th harmonic
Frequency [Hz]
Harmonic Amplitude
Interharmonic Amplitude
Spectral components Time window of 200ms
355 355
Used for calculating 7.5 Interharmonic sub-group, Csg-7.5
340
345 350 355 395 400
370 380 360 365 375 390 385
405
410
Used for calculating 7th harmonic sub-group, Csg-7
Used for calculating 8th harmonic sub-group, Csg-8
Frequency [Hz]
Harmonic Amplitude
Interharmonic Amplitude
Spectral components Time window of 200ms

Progressive average of the harmonic subgroups of currents and voltages
Fifth harmonic subgroup of the voltage

Results
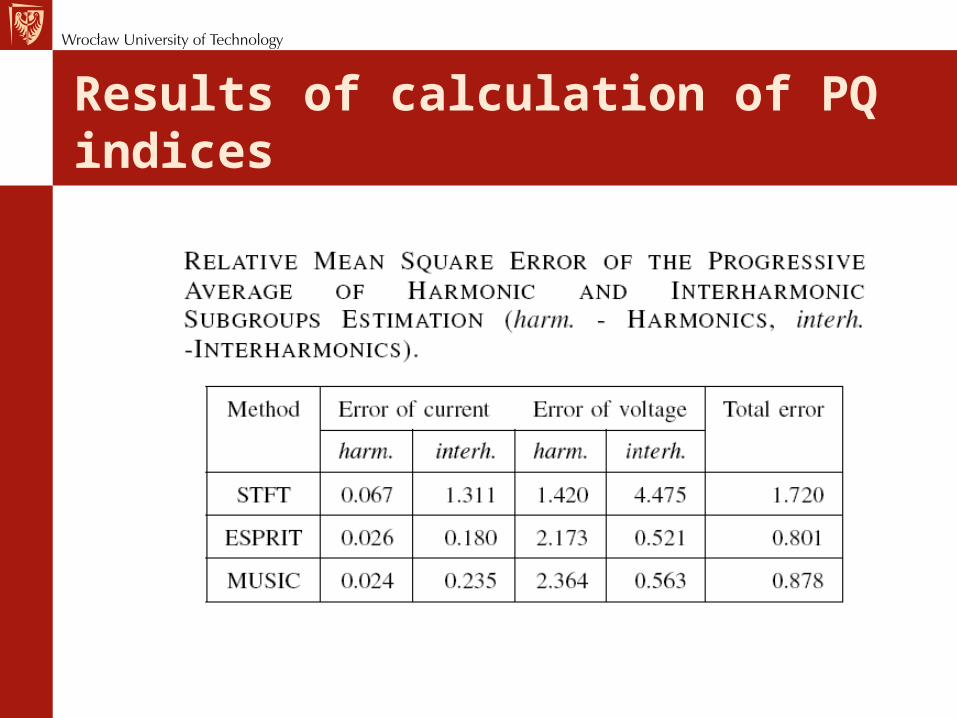
Results of calculation of PQ indices
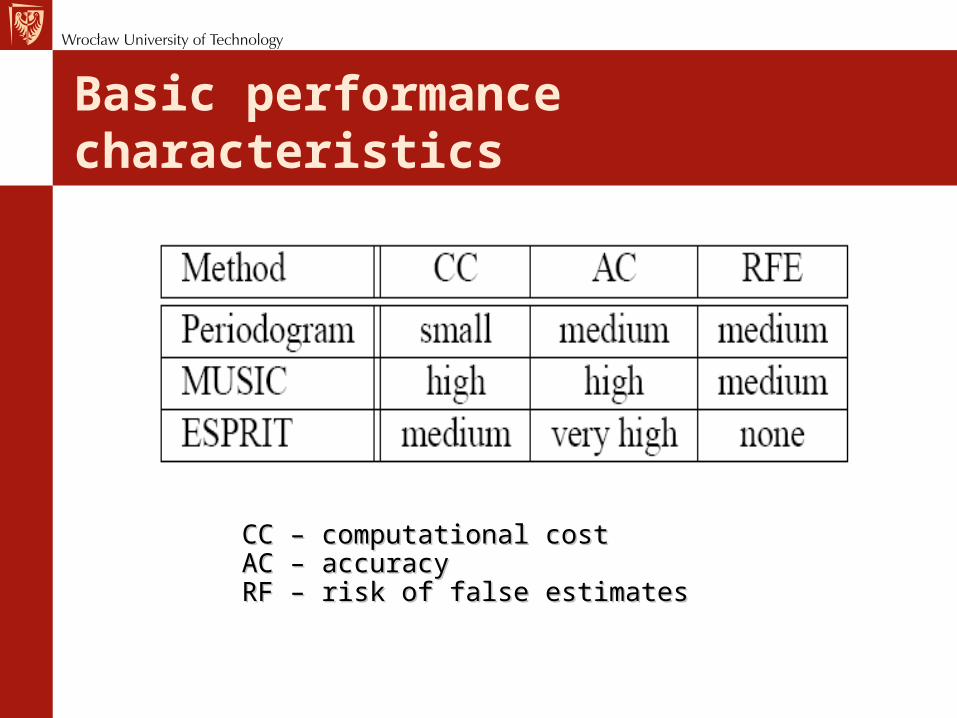
Basic performance characteristics
CC – computational costCC – computational costAC – accuracyAC – accuracyRF – risk of false estimatesRF – risk of false estimates
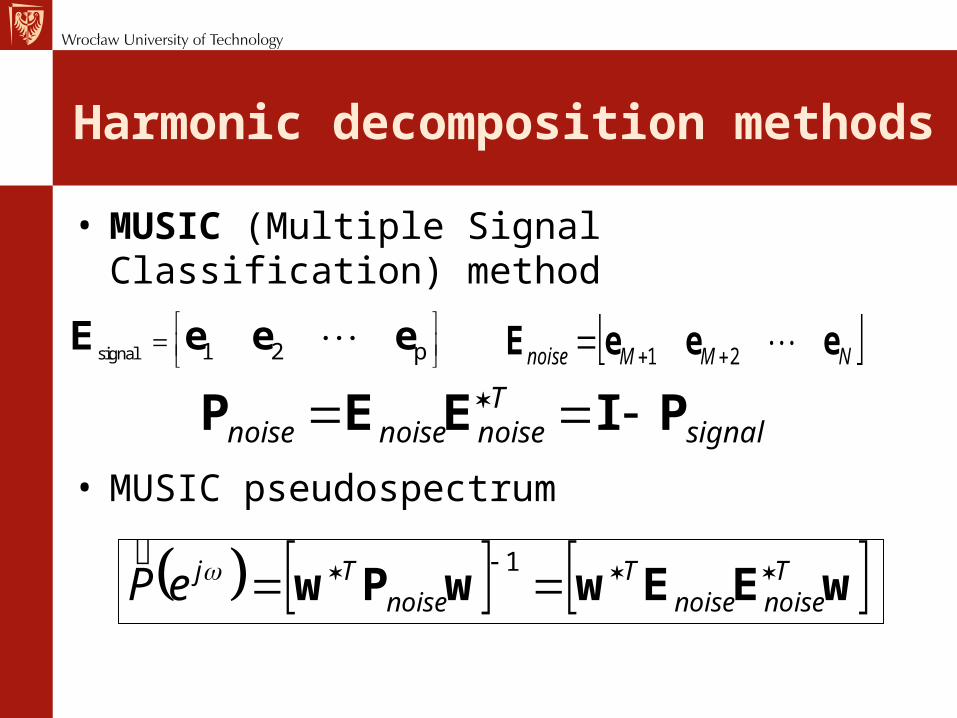
Harmonic decomposition methods• MUSIC (Multiple Signal Classification)
method
signalTnoisenoisenoise PIEEP
signal 1 2 p
E e e e NMMnoise eeeE 21
1wEEwwPw T
noisenoiseT
noiseTjeP
• MUSIC pseudospectrum
Harmonic decomposition methods
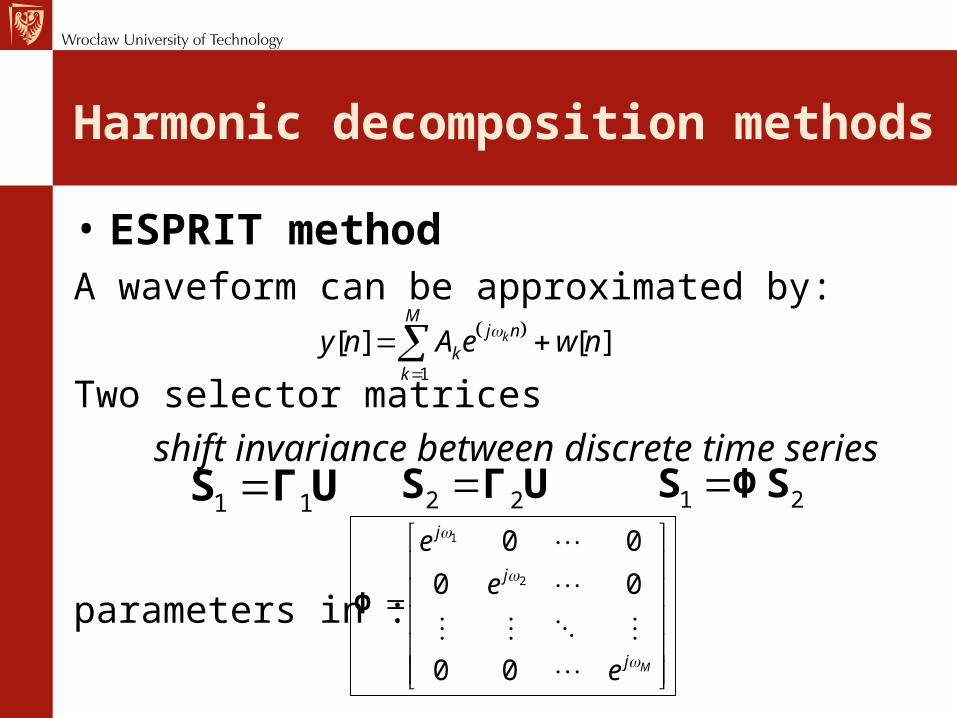
• ESPRIT methodA waveform can be approximated by:
Two selector matrices shift invariance between discrete time series
parameters in :
1
[ ] [ ]k
Mj n
kk
y n A e w n
1 1S Γ U 2 2S Γ U 1 2S ΦS1
2
0 0
0 0
0 0 M
j
j
j
e
e
e
Φ

Performance of MUSIC and ESPRIT•MUSIC uses the noise subspace to estimate the signal components
•ESPRIT uses the signal subspace.
Several experiments with simulated, stochastic signals were performed, in order to compare performance aspects of both parametric methods MUSIC and ESPRIT. Testing signal is designed to belong to a class of waveforms most often present in power systems. Each run of spectrum and power estimation is repeated many times (Monte Carlo approach) and the mean--square error (MSE) is computed.
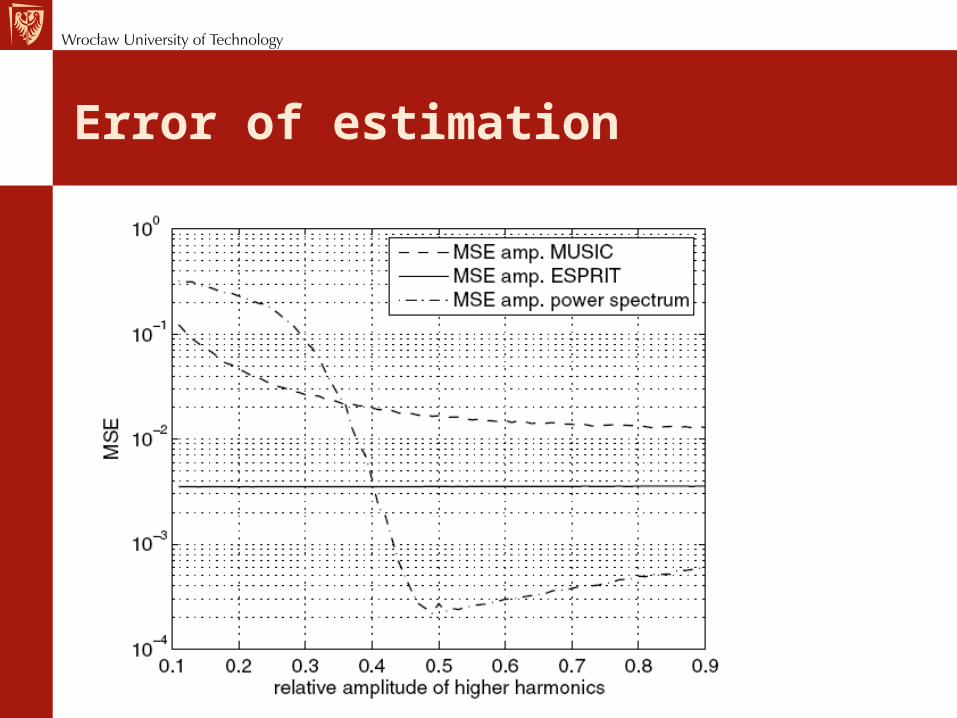
Error of estimation
Results of error comparison
• Problem of masking of the higher low–amplitude harmonics components by a strong fundamental component was investigated.
• The results show an extremely high masking effect in the case of power spectrum, while MUSIC and ESPRIT methods show very little dependence (almost no dependence in the case of ESPRIT method).
• This is a very important feature which partially explains excellent performance of parametric methods in the task of calculation of power quality indices.
Conclusions
• In practical applications, one of the most important questions concerns the optimal choice of analysis methods when taking into account known parameters of the signal and limitations of the chosen analysis technique.
• Performance comparison showed that both parametric methods show similar values of accuracy wich greatly outperform the accuracy of FFT–based non–parametric method.
• Parametric methods show almost complete immunity to masking effect, to variable initial phase of harmonic components and to many other deficiencies off FFT–based techniques, as shown in the relevant literature.
Conclusions
• For all results presented previously, it can be seen that the use of ESPRIT method for calculation of power quality indices offers reduction of the error of estimation of harmonic subgroups by 53% and the use of MUSIC method reduces the error by 49%, when comparing to STFT (FFT–based method).
• Even higher gains in accuracy can be achieved when analyzing waveforms with high inter/sub–harmonic contents.