new prosperity mine summary hydrogeology · pdf filenew prosperity mine hydrogeology review...
TRANSCRIPT
New Prosperity Mine EIS Hydrogeology Review
July 27, 2013
Completed by Daniel Watterson, P.Geo., LHG
Watterson Geoscience Inc. for
Tsilhqot’in National Government
REVIEW OBJECTIVES • Evaluate the EIS and supporting documents with respect
to – 2012 CEAA guidelines established for this project – BC Ministry of Environment Baseline Water Quality Guidance – Professional hydrogeological and best management practice
• Evaluate the proposed project with respect to data and assessment uncertainties and potential environmental risks, especially with respect to Fish Lake
• Develop a “Big Picture” understanding of project area hydrogeology and proposed mine interactions
New Prosperity Mine Hydrogeology Review
• Complete comprehensive assessment and presentation of project area hydrogeologic conditions
• Identify effects of mining and the TSF seepage on local and downgradient groundwater quantity and quality
• Provide a comprehensive numerical model using site data which incorporates all major site features
• Identify and describe monitoring and mitigation measures
New Prosperity Mine Hydrogeology Review EIS GUIDELINE SUMMARY
KEY HYDROGEOLOGY RISKS FROM PROJECT • Potential for solute to leak through till, sediments and
bedrock beneath and along TSF western, northern and southern boundaries, focussing on impacts to Fish Lake
• Incomplete understanding of Pit/Fish Lake interactions – Potential for induced dewatering of Fish Lake, Fish Creek
– Potential pit wall slope stability issues and pit encroachment on FL
• Potential groundwater quality impacts from waste rock, ore stockpiles on Fish Lake
• Potential groundwater quality impacts from the open pit
New Prosperity Mine Hydrogeology Review
KEY HYDROGEOLOGY TECHNICAL FINDINGS • Inadequate Baseline Characterization • Oversimplified Hydrogeology Used for
Modeling and Effects Analysis • Inadequate Modeling, Sensitivity Analyses • Inadequate Mitigation Planning
New Prosperity Mine Hydrogeology Review

INSUFFICIENT BASELINE CHARACTERIZATION New Prosperity Mine Hydrogeology Review
2012 Preliminary TSF Design Report Figure 4.1

New Prosperity Mine Hydrogeology Review
Fig 4.5 2012 Knight-Piesold TSF Design Report Figure 4.5
New Prosperity Mine Hydrogeology Review
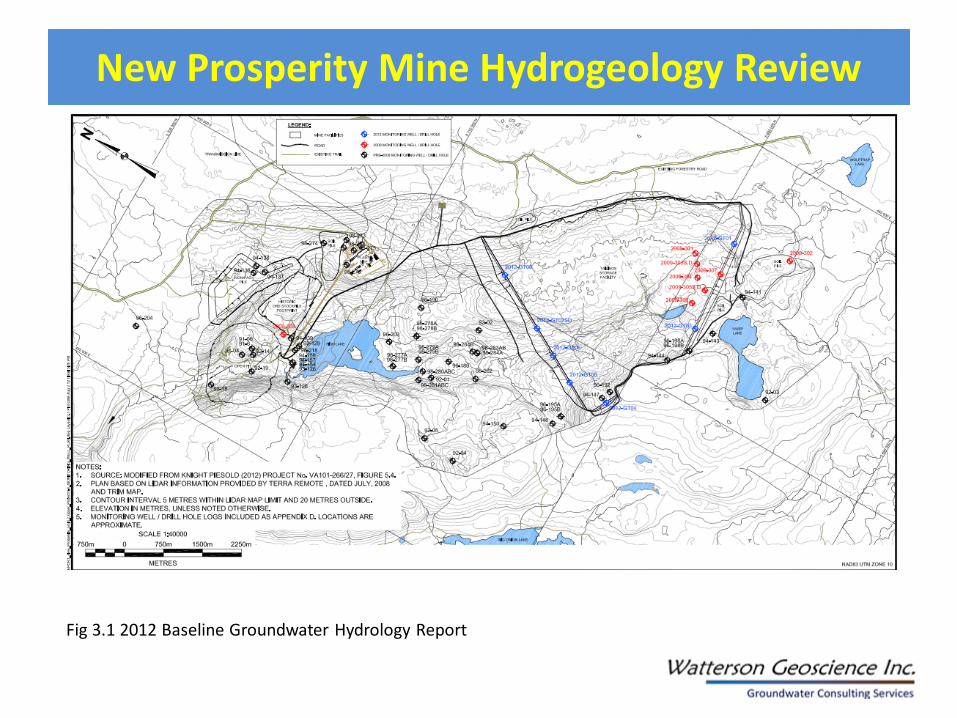
Fig 3.1 2012 Baseline Groundwater Hydrology Report

Note large distances between data points Note question marks and unresolved stratigraphy
2012 TSF Design Report Figure 4.2
New Prosperity Mine Hydrogeology Review
600 m
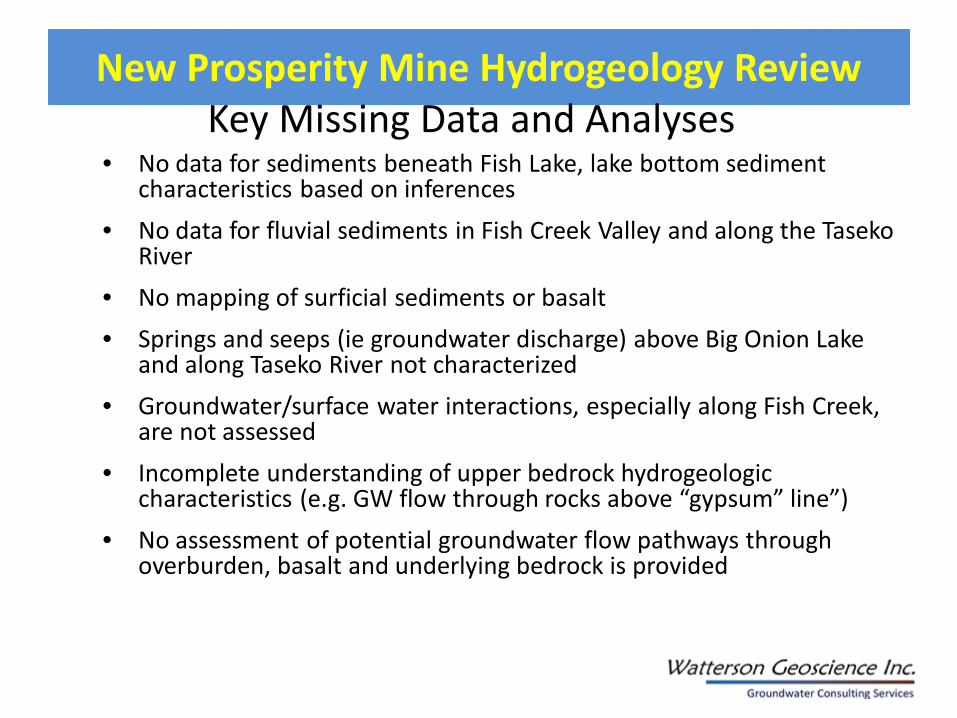
• No data for sediments beneath Fish Lake, lake bottom sediment characteristics based on inferences
• No data for fluvial sediments in Fish Creek Valley and along the Taseko River
• No mapping of surficial sediments or basalt • Springs and seeps (ie groundwater discharge) above Big Onion Lake
and along Taseko River not characterized • Groundwater/surface water interactions, especially along Fish Creek,
are not assessed • Incomplete understanding of upper bedrock hydrogeologic
characteristics (e.g. GW flow through rocks above “gypsum” line”) • No assessment of potential groundwater flow pathways through
overburden, basalt and underlying bedrock is provided
New Prosperity Mine Hydrogeology Review Key Missing Data and Analyses
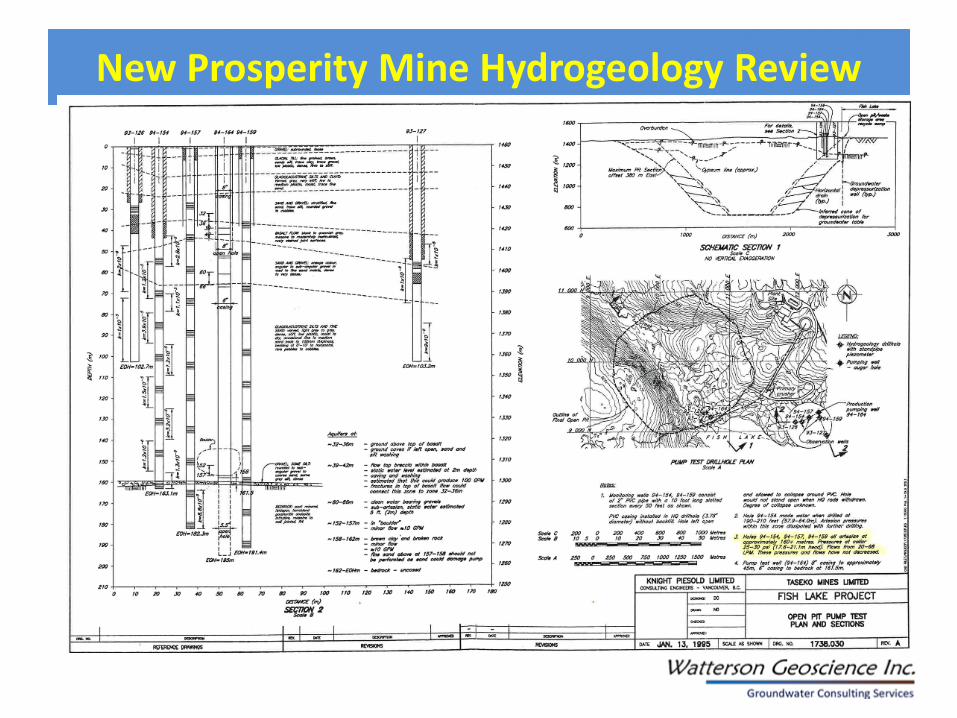
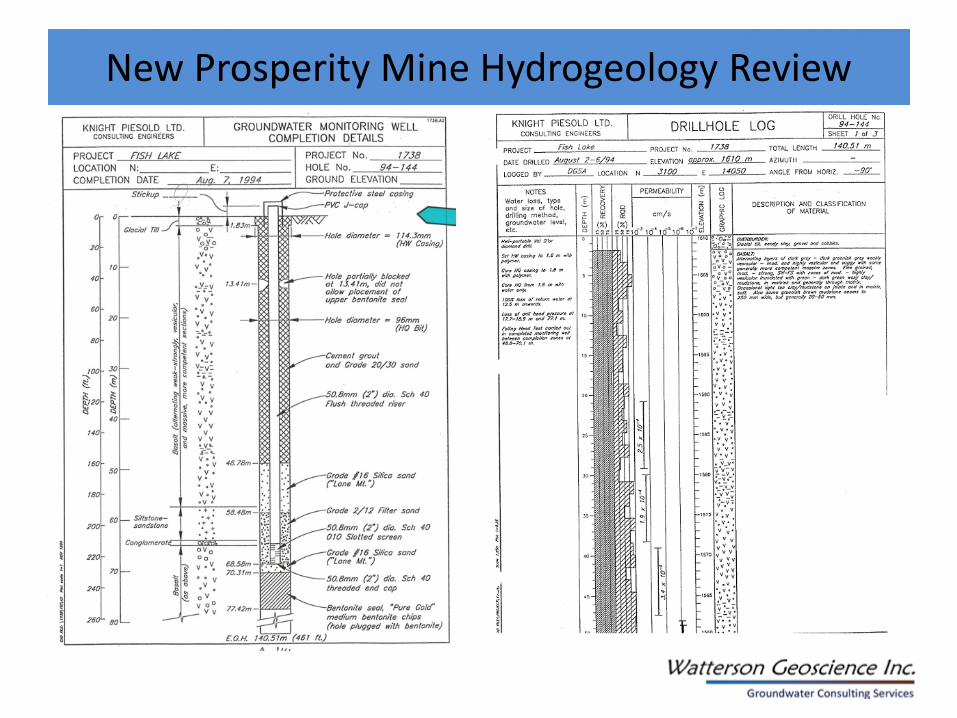
• 1994 aquifer test data not used
– Only aquifer test for the entire project area!
• Geologic and drilling data from many logs not used
• Other available data not used or considered
– Fault data, gypsum line bedrock
New Prosperity Mine Hydrogeology Review Inadequate Use Of Available Data

New Prosperity Mine Hydrogeology Review

2012 Baseline Groundwater Hydrology Report Table C5
New Prosperity Mine Hydrogeology Review
New Prosperity Mine Hydrogeology Review
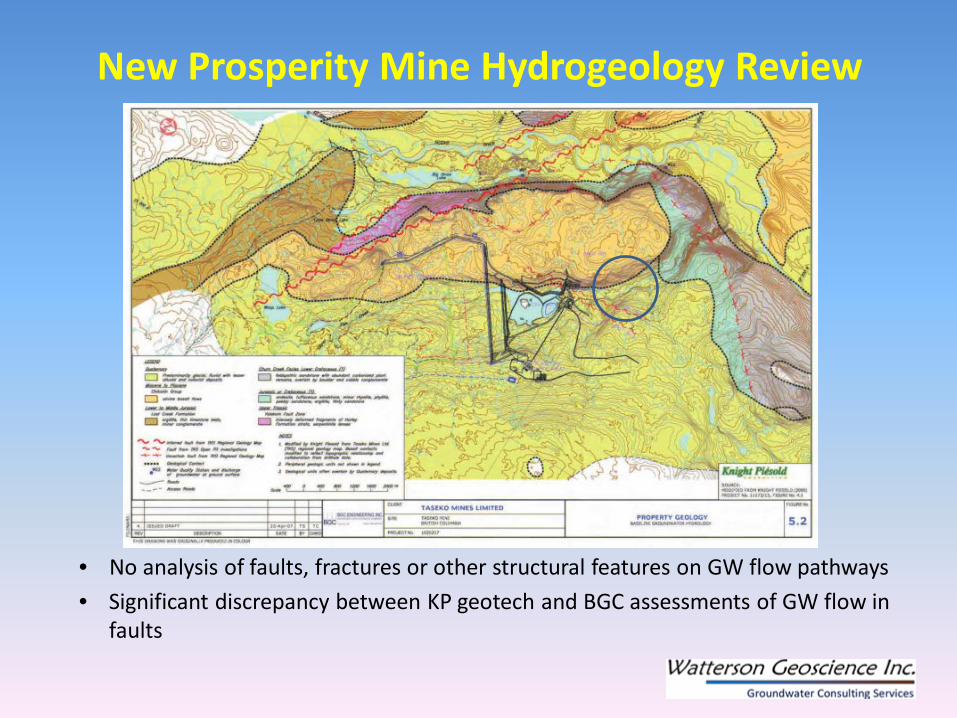
• No analysis of faults, fractures or other structural features on GW flow pathways • Significant discrepancy between KP geotech and BGC assessments of GW flow in
faults
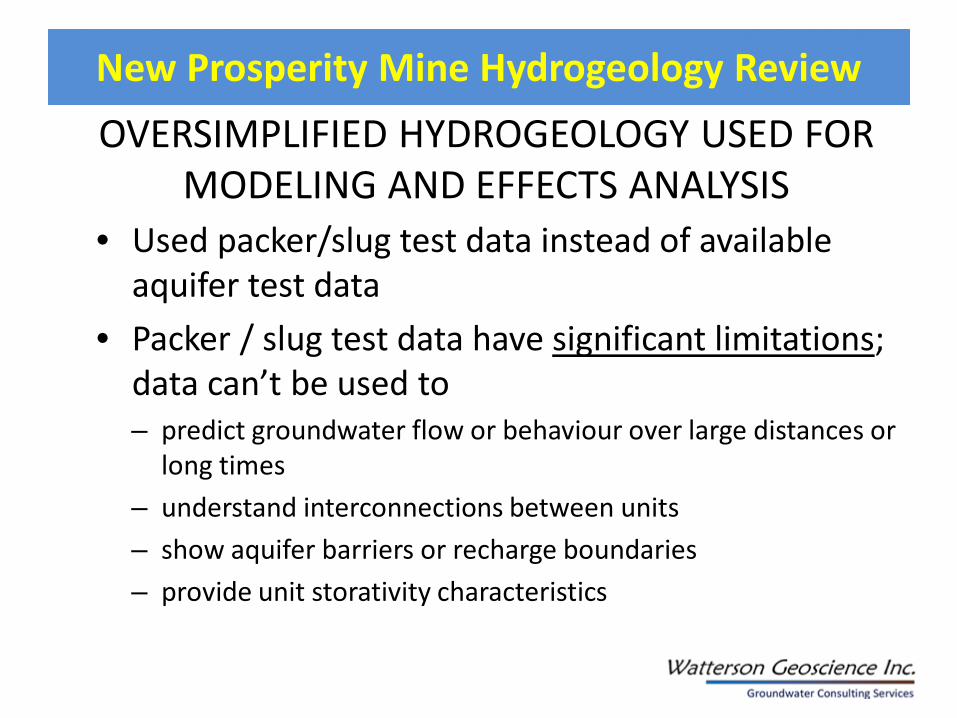
• Used packer/slug test data instead of available aquifer test data
• Packer / slug test data have significant limitations; data can’t be used to – predict groundwater flow or behaviour over large distances or
long times – understand interconnections between units – show aquifer barriers or recharge boundaries – provide unit storativity characteristics
New Prosperity Mine Hydrogeology Review OVERSIMPLIFIED HYDROGEOLOGY USED FOR
MODELING AND EFFECTS ANALYSIS

• Complex geology and hydrogeology “lumped” into 4 (BGC) or 5 (KP) units to model the entire area – All overburden (commonly including basalt) combined into 1 unit
considered as “till” – 5 to 10 geologic units shown on various cross-sections and data
tables – Geometric mean for BR, OB hydraulic conductivity (K) for 14 holes
around TSF perimeter is 1.8 X 10⁻⁴ cm/sec (depth 3 to 55 m)
• K used in models for upper 100 m of OB/Basalt is 1 or 5 X 10⁻⁶ cm/sec, two orders of magnitude lower
New Prosperity Mine Hydrogeology Review
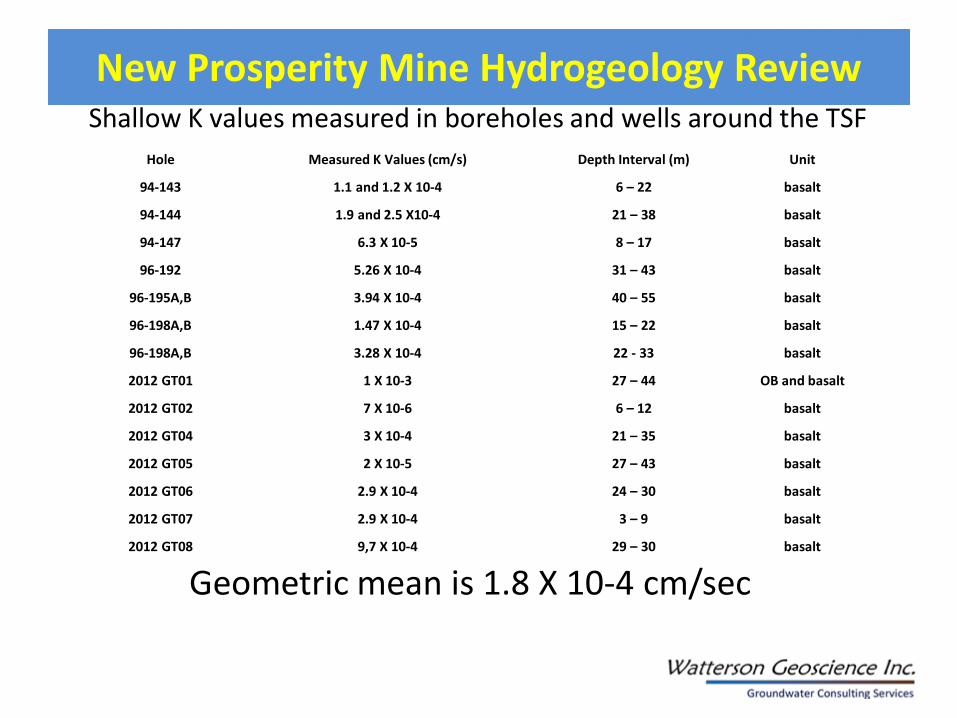
Shallow K values measured in boreholes and wells around the TSF Hole Measured K Values (cm/s) Depth Interval (m) Unit
94-143 1.1 and 1.2 X 10⁻⁴ 6 – 22 basalt
94-144 1.9 and 2.5 X10⁻⁴ 21 – 38 basalt
94-147 6.3 X 10⁻⁵ 8 – 17 basalt
96-192 5.26 X 10⁻⁴ 31 – 43 basalt
96-195A,B 3.94 X 10⁻⁴ 40 – 55 basalt
96-198A,B 1.47 X 10⁻⁴ 15 – 22 basalt
96-198A,B 3.28 X 10⁻⁴ 22 - 33 basalt
2012 GT01 1 X 10⁻³ 27 – 44 OB and basalt
2012 GT02 7 X 10⁻⁶ 6 – 12 basalt
2012 GT04 3 X 10⁻⁴ 21 – 35 basalt
2012 GT05 2 X 10⁻⁵ 27 – 43 basalt
2012 GT06 2.9 X 10⁻⁴ 24 – 30 basalt
2012 GT07 2.9 X 10⁻⁴ 3 – 9 basalt
2012 GT08 9,7 X 10⁻⁴ 29 – 30 basalt
Geometric mean is 1.8 X 10⁻⁴ cm/sec
New Prosperity Mine Hydrogeology Review

2012 Baseline Groundwater Hydrology Report App D
New Prosperity Mine Hydrogeology Review

New Prosperity Mine Hydrogeology Review
• Note lumping of units, significant extrapolation between data points, question marks, unresolved stratigraphy and possible flow pathways
2012 Preliminary Pit Design Figure 4.3
500 m
New Prosperity Mine Hydrogeology Review
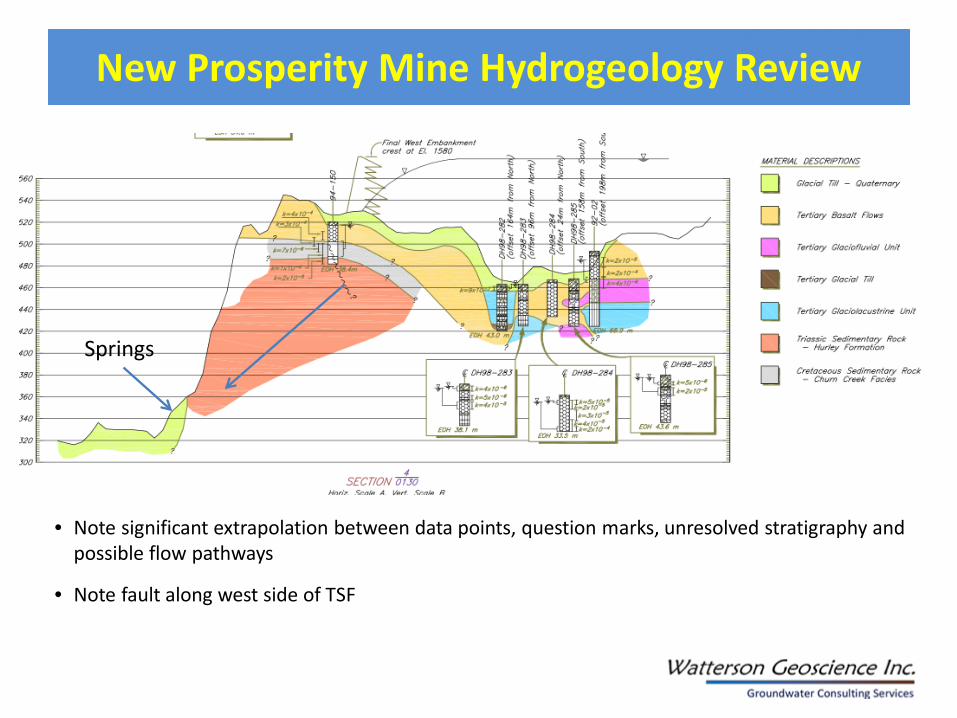
• Note significant extrapolation between data points, question marks, unresolved stratigraphy and possible flow pathways
• Note fault along west side of TSF
Springs

New Prosperity Mine Hydrogeology Review
Well 94-164
New Prosperity Mine Hydrogeology Review
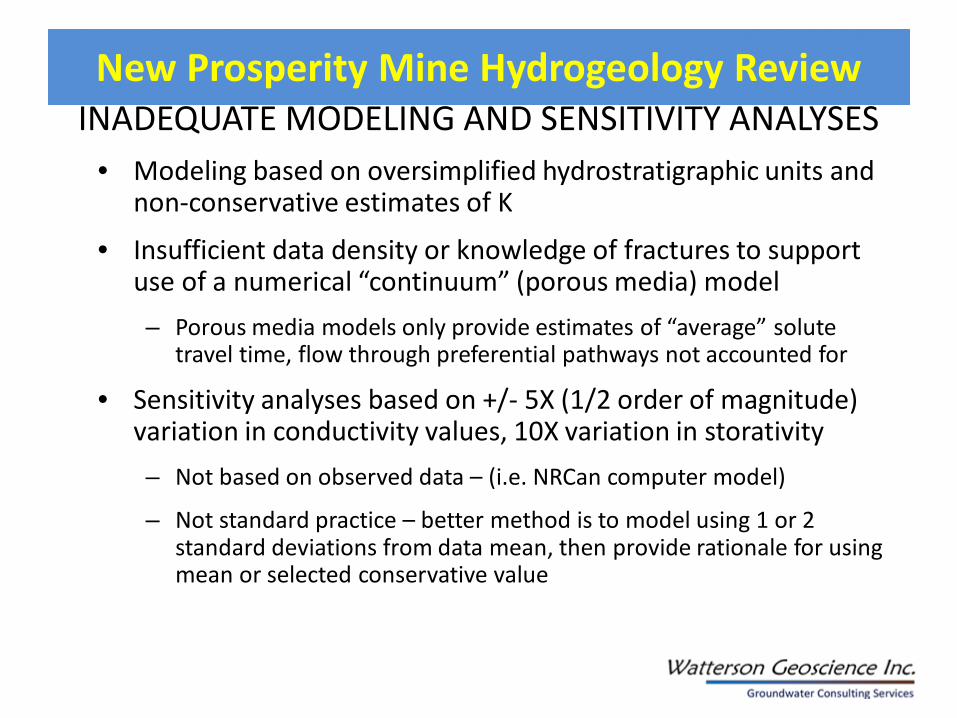
INADEQUATE MODELING AND SENSITIVITY ANALYSES • Modeling based on oversimplified hydrostratigraphic units and
non-conservative estimates of K
• Insufficient data density or knowledge of fractures to support use of a numerical “continuum” (porous media) model – Porous media models only provide estimates of “average” solute
travel time, flow through preferential pathways not accounted for
• Sensitivity analyses based on +/- 5X (1/2 order of magnitude) variation in conductivity values, 10X variation in storativity – Not based on observed data – (i.e. NRCan computer model)
– Not standard practice – better method is to model using 1 or 2 standard deviations from data mean, then provide rationale for using mean or selected conservative value
New Prosperity Mine Hydrogeology Review
New Prosperity Mine Hydrogeology Review
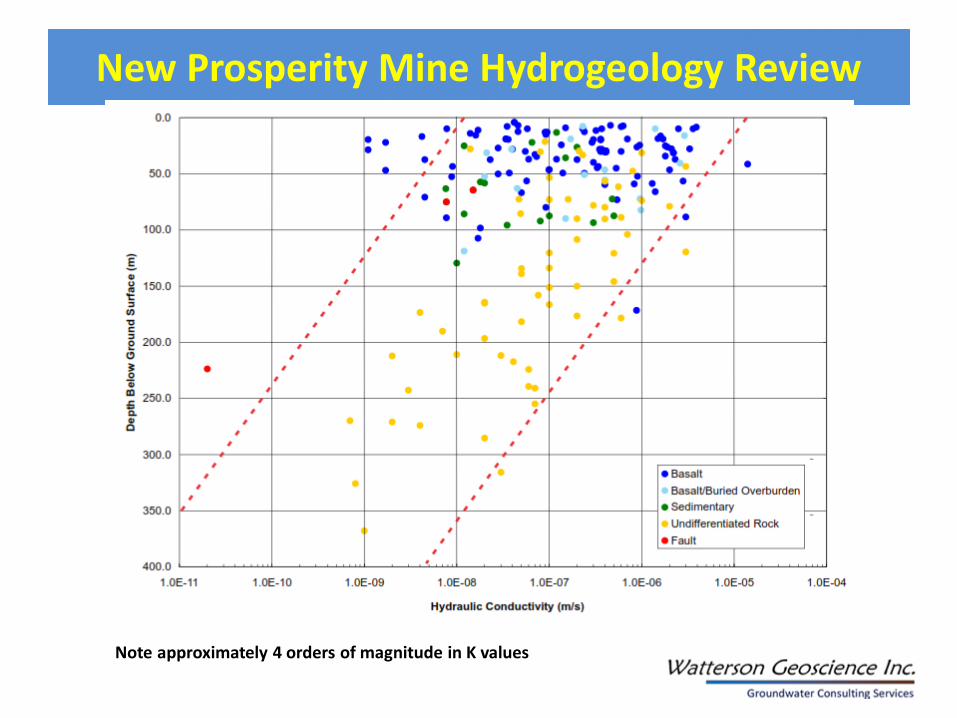
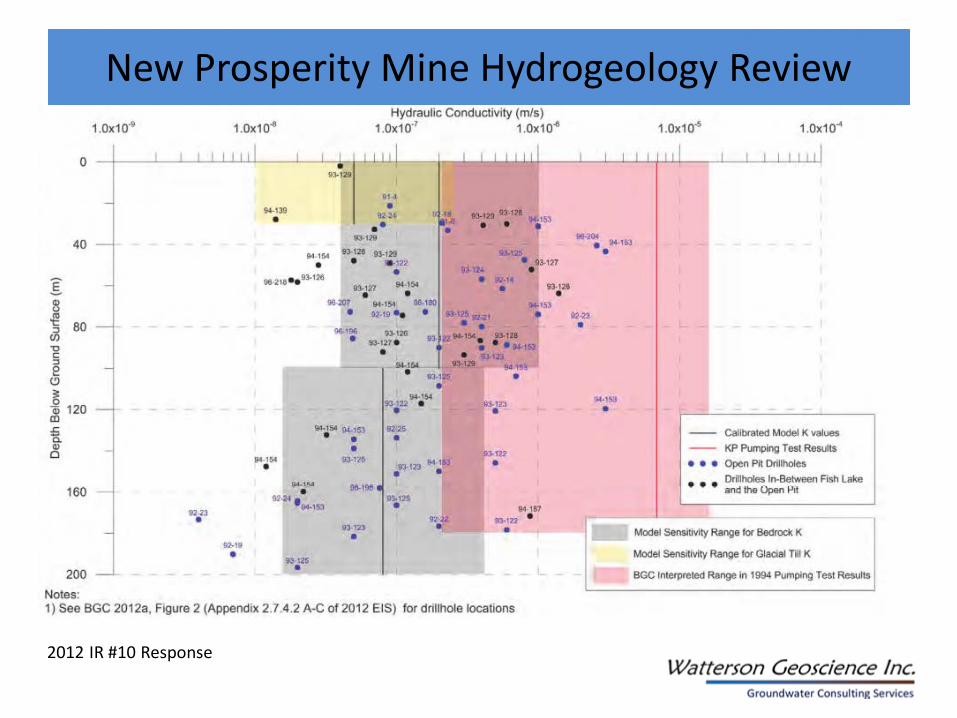
Note approximately 4 orders of magnitude in K values
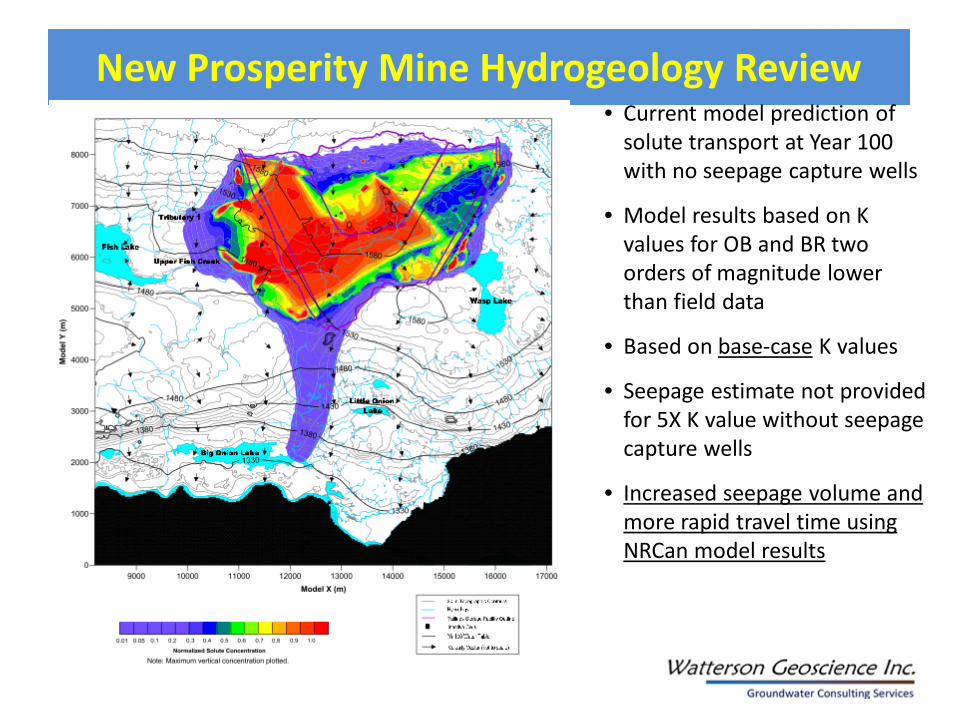
New Prosperity Mine Hydrogeology Review • Current model prediction of
solute transport at Year 100 with no seepage capture wells
• Model results based on K values for OB and BR two orders of magnitude lower than field data
• Based on base-case K values
• Seepage estimate not provided for 5X K value without seepage capture wells
• Increased seepage volume and more rapid travel time using NRCan model results
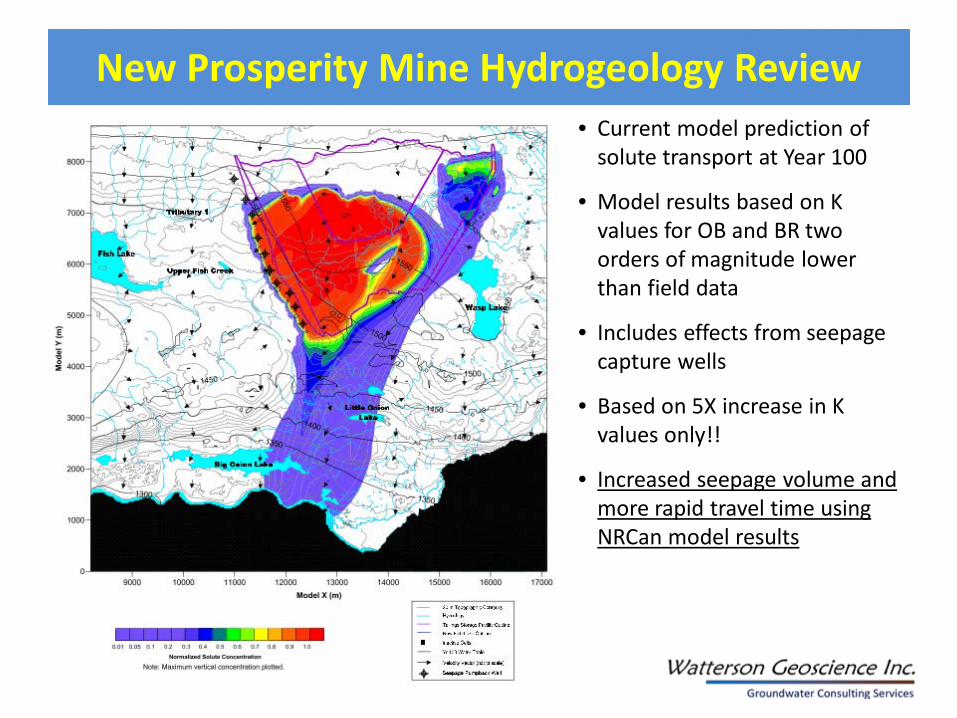
New Prosperity Mine Hydrogeology Review • Current model prediction of
solute transport at Year 100
• Model results based on K values for OB and BR two orders of magnitude lower than field data
• Includes effects from seepage capture wells
• Based on 5X increase in K values only!!
• Increased seepage volume and more rapid travel time using NRCan model results
New Prosperity Mine Hydrogeology Review • Model also predicts potentially significant increases and
decreases for surface flows and groundwater baseflows to Fish Creek, BO, LO and Wasp Lakes and the TR; these effects are not discussed
• Effects of TSF solute transport on downgradient surface and groundwater quality, as well as fish and fish habitat are not discussed
• NRCan model indicates seepage volumes, concentrations and travel times likely significantly greater than predicted by BGC
• No analysis of seepage volume, quality and flow pathways past 100 years is provided –what will be the impacts in 150 years? 200 years?
• Numerical model does not accurately portray current conditions, nor do it accurately portray potential effects
• Insufficient sensitivity analyses to consider natural variation in overburden and bedrock properties
• Effects based on more realistic modeling will be substantially greater
• Effective seepage control systems mandatory to prevent contamination of Fish Lake and other downgradient receptors
New Prosperity Mine Hydrogeology Review

INADEQUATE MITIGATION PLANNING • No identification and assessment of worst-case scenarios
• No assessment of cumulative or residual effects
• No data gap or limitations analysis
• No contingency plans have been developed
New Prosperity Mine Hydrogeology Review

INADEQUATE MITIGATION PLANNING • Seepage control measures are conceptual only
– No comparison of well designs, number, locations and effectiveness with actual stratigraphy has been completed
– Conceptual well designs are for bedrock wells only; no consideration of flow through overburden or basalt
– No information regarding of seepage collection sump designs – collect surface seepage or groundwater seepage?
• Estimates of seepage volume and quality based on inadequate hydrogeology and modeling
New Prosperity Mine Hydrogeology Review
New Prosperity Mine Hydrogeology Review
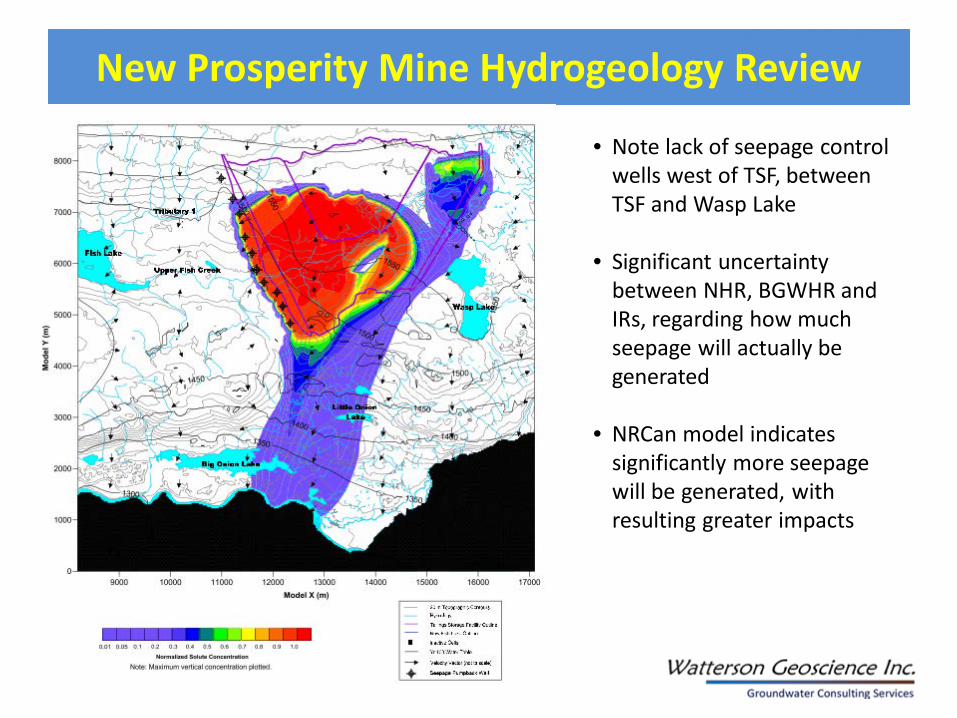
• Note lack of seepage control wells west of TSF, between TSF and Wasp Lake
• Significant uncertainty between NHR, BGWHR and IRs, regarding how much seepage will actually be generated
• NRCan model indicates significantly more seepage will be generated, with resulting greater impacts
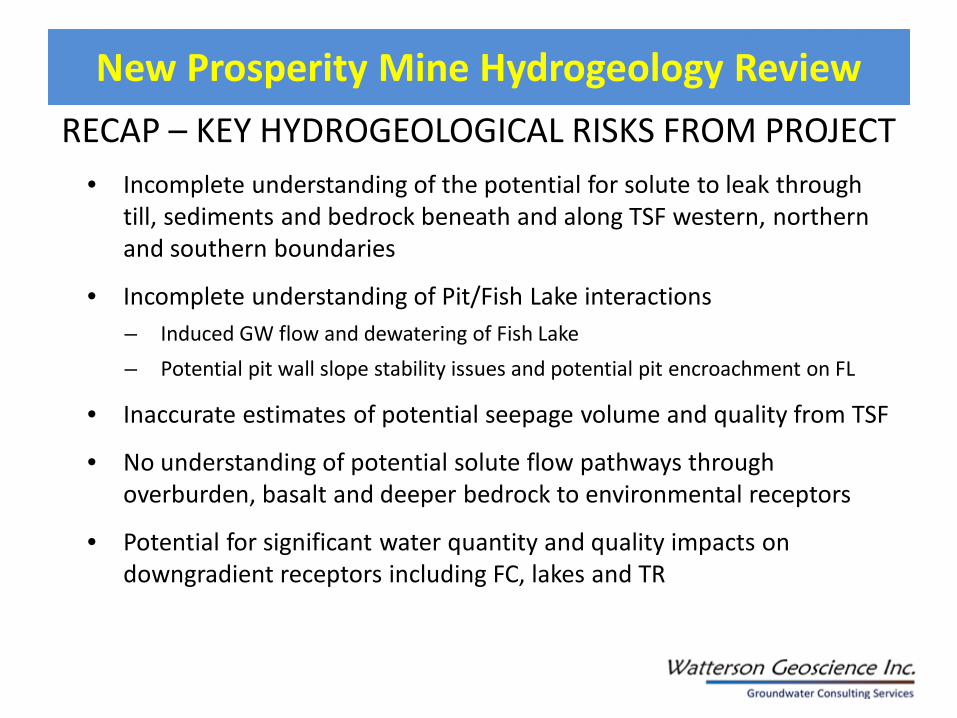
RECAP – KEY HYDROGEOLOGICAL RISKS FROM PROJECT • Incomplete understanding of the potential for solute to leak through
till, sediments and bedrock beneath and along TSF western, northern and southern boundaries
• Incomplete understanding of Pit/Fish Lake interactions – Induced GW flow and dewatering of Fish Lake – Potential pit wall slope stability issues and potential pit encroachment on FL
• Inaccurate estimates of potential seepage volume and quality from TSF
• No understanding of potential solute flow pathways through overburden, basalt and deeper bedrock to environmental receptors
• Potential for significant water quantity and quality impacts on downgradient receptors including FC, lakes and TR
New Prosperity Mine Hydrogeology Review
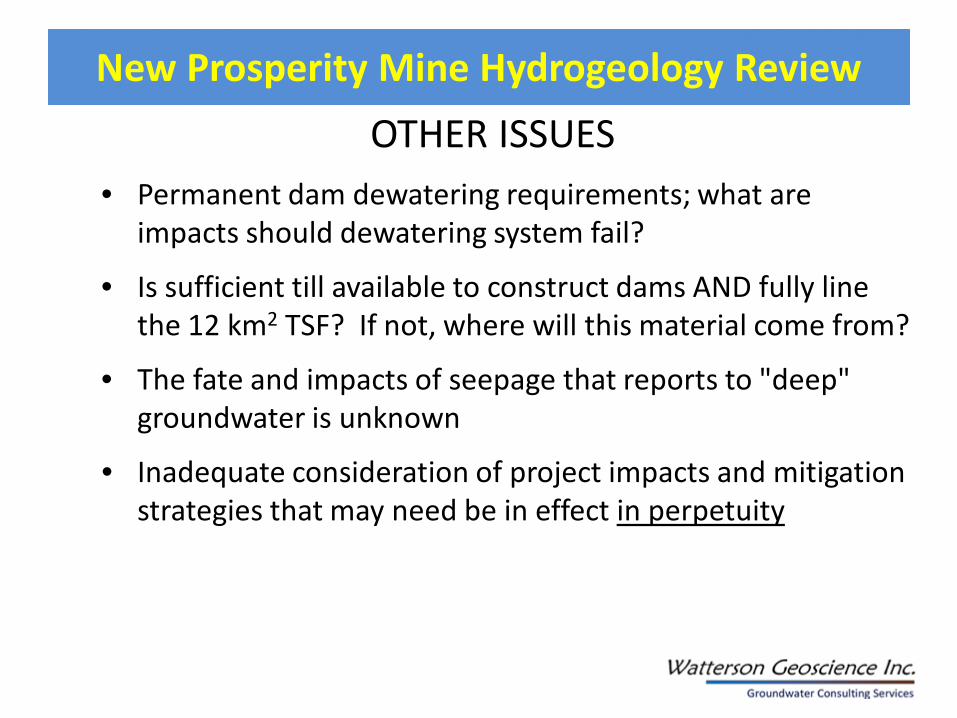
OTHER ISSUES • Permanent dam dewatering requirements; what are
impacts should dewatering system fail?
• Is sufficient till available to construct dams AND fully line the 12 km2 TSF? If not, where will this material come from?
• The fate and impacts of seepage that reports to "deep" groundwater is unknown
• Inadequate consideration of project impacts and mitigation strategies that may need be in effect in perpetuity
New Prosperity Mine Hydrogeology Review
• QUESTIONS?
• COMMENTS?
New Prosperity Mine Hydrogeology Review
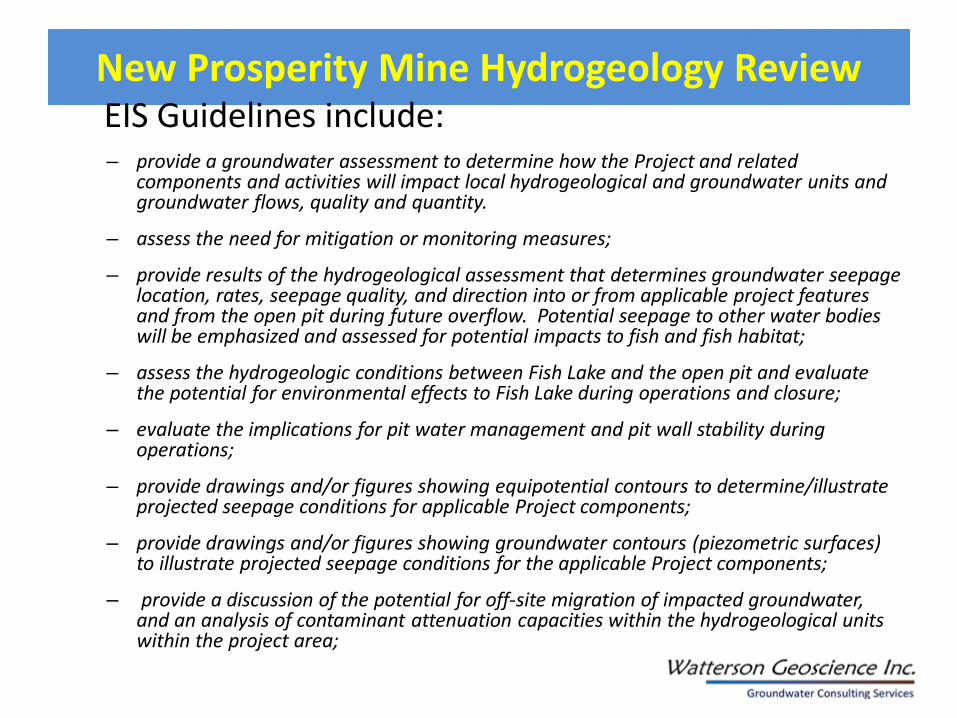
– provide a groundwater assessment to determine how the Project and related components and activities will impact local hydrogeological and groundwater units and groundwater flows, quality and quantity.
– assess the need for mitigation or monitoring measures;
– provide results of the hydrogeological assessment that determines groundwater seepage location, rates, seepage quality, and direction into or from applicable project features and from the open pit during future overflow. Potential seepage to other water bodies will be emphasized and assessed for potential impacts to fish and fish habitat;
– assess the hydrogeologic conditions between Fish Lake and the open pit and evaluate the potential for environmental effects to Fish Lake during operations and closure;
– evaluate the implications for pit water management and pit wall stability during operations;
– provide drawings and/or figures showing equipotential contours to determine/illustrate projected seepage conditions for applicable Project components;
– provide drawings and/or figures showing groundwater contours (piezometric surfaces) to illustrate projected seepage conditions for the applicable Project components;
– provide a discussion of the potential for off-site migration of impacted groundwater, and an analysis of contaminant attenuation capacities within the hydrogeological units within the project area;
EIS Guidelines include: New Prosperity Mine Hydrogeology Review

– provide a description of any proposed mitigation strategies for groundwater seepage, including seepage within the operations area as defined in the MMER and for any migration of impacted groundwater outside of the operations area;
– provide the results of a groundwater flow model of the local catchment for operation and post-closure period incorporating all major permanent mine components, including the open pit, TSF, mine rock stockpiles, and a determination of equilibrium water levels of the pit lake and Fish Lake;
– include an analysis of the potential for sulphide oxidation within surficial and bedrock units as a result of groundwater drawdown within the project area;
– demonstrate how and if the withdrawal of groundwater, or the creation of physical changes to the aquifers within the project area, will affect the availability of groundwater for applicable users (e.g. mine site facility operations, on-site drinking water systems) or base flows in surface water (surface watercourses), thereby causing surface water impacts;
– consider possible groundwater seepage from all water bodies that could be impacted to the open pit during the operational and post-closure phases that could contribute to water deficit problems in Fish Lake; and
– include effects of surface infiltration on groundwater flows that may affect discharges into streams and lakes.
New Prosperity Mine Hydrogeology Review

– predict seepage rates and concentration of contaminants from the TSF toward Big Onion Lake;
– predict how the long-term discharge of tailings porewater to Fish Lake, Big Onion Lake or Wasp Lake would impact water quality in the lakes and to upper Fish Creek;
– consider, describe and assess possible groundwater seepage from all water bodies that would be affected by the open pit during the operational and post- closure phases and any possible relation to water balance in Fish Lake; and
– describe seepage control measures from the TSF during operation and long-term post-closure that would eliminate or minimize water quality degradation to receiving lakes and creeks.
– predict seepage rates, concentration of contaminants, and the effects to water quality in Fish Lake and its tributaries with respect to seepage from waste rock and ore/low grade ore stockpiles;
– use recent site-specific data for all modeling undertaken to support the above work; and explain how representative and why any previously referenced information can be used to assess the effects of the components of the Project that have changed or are new and the corresponding changes to the environmental effects previously predicted.
New Prosperity Mine Hydrogeology Review

New Prosperity Mine Hydrogeology Review
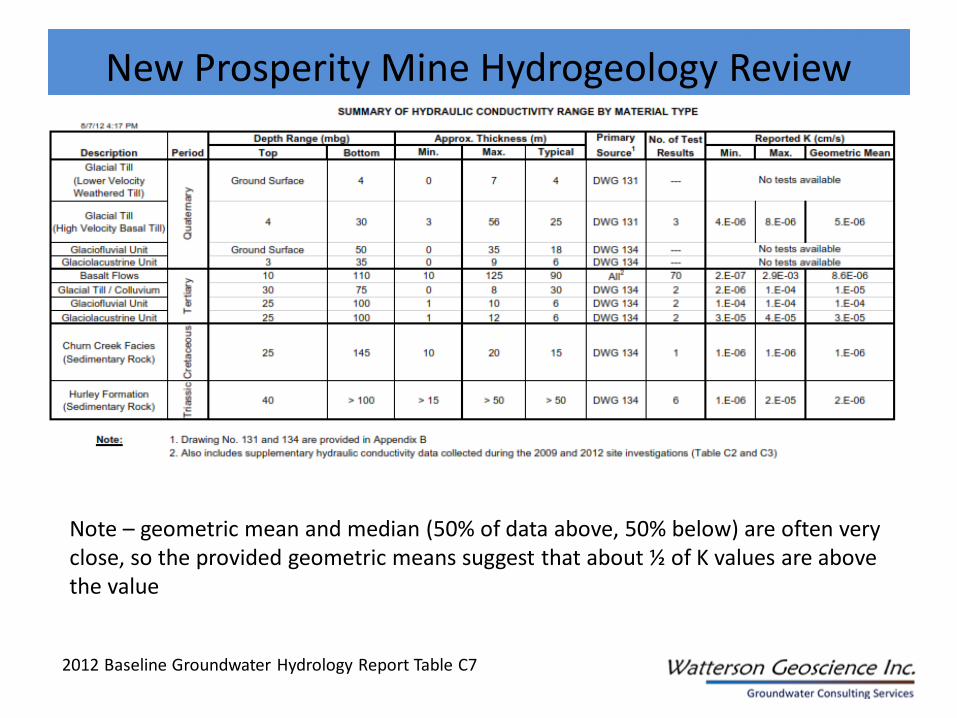
2012 Baseline Groundwater Hydrology Report Table C7
Note – geometric mean and median (50% of data above, 50% below) are often very close, so the provided geometric means suggest that about ½ of K values are above the value

New Prosperity Mine Hydrogeology Review
2012 Baseline Groundwater Hydrology Report App D

New Prosperity Mine Hydrogeology Review
Unit 1 = 5 X 10⁻⁶ cm/sec Units 2-3 = 2 X 10⁻⁵ cm/sec Unit 4 = 8 X 10⁻⁶ cm/sec Units 5-8 = 4 X 10⁻⁷ cm/sec
MODEL K FOR OVERBURDEN IS 2 ORDERS OF MAGNITUDE BELOW DATA

New Prosperity Mine Hydrogeology Review
2012 Geotech Site Investigation Figure 4.3
New Prosperity Mine Hydrogeology Review
2012 IR #10 Response
New Prosperity Mine Hydrogeology Review
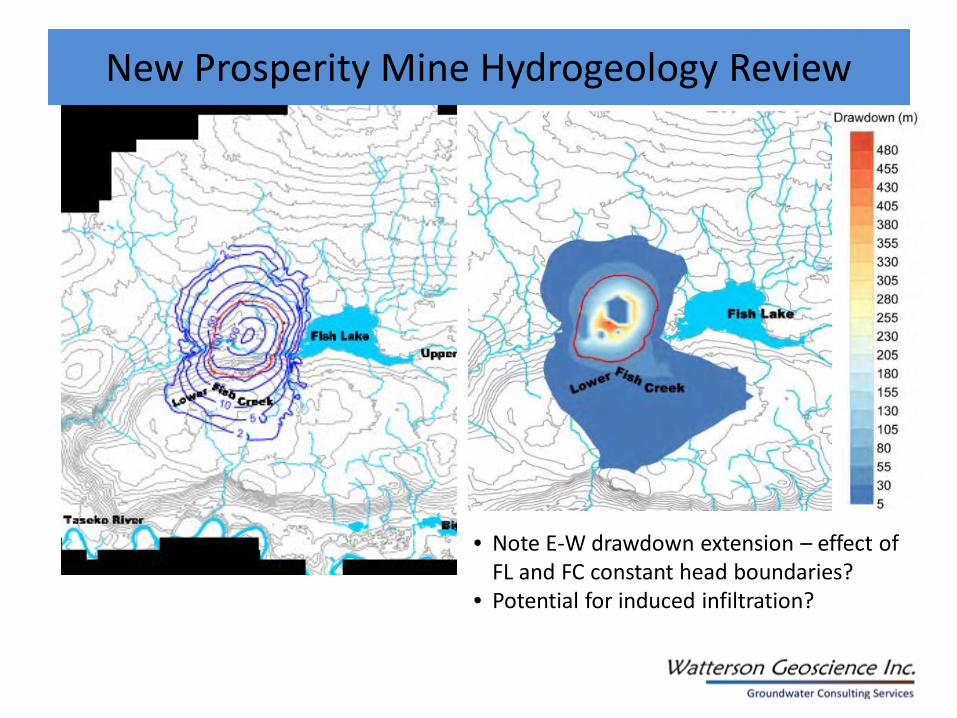
• Note E-W drawdown extension – effect of FL and FC constant head boundaries?
• Potential for induced infiltration?

New Prosperity Mine Hydrogeology Review Model also predicts potentially significant effects on surface flows and groundwater baseflows to Fish Creek, BO, LO and
Wasp Lakes and the TR
Without seepage pumpback wells • Increased inflows to BO (3%) and LO Lake (17%) • Decreased (winter) baseflow to the Taseko River (17%) • Increased inflow to Wasp Lake 5% (summer) and 14%
(winter), with annual seepage from Wasp Lake decreased by 19%
• Filling of pit lake expected to increase summer baseflow to LFC by 45% and decrease winter baseflow by 40%
Predictions with seepage pumpback wells are smaller but still
present

INADEQUATE MONITORING PROGRAM
• Insufficient number of wells located downgradient of TSF, open pit
• Wells insufficiently deep to adequately monitor GW quality in all possible groundwater flow pathways
• Wells not constructed to monitor likely flow zones
New Prosperity Mine Hydrogeology Review
New Prosperity Mine Hydrogeology Review
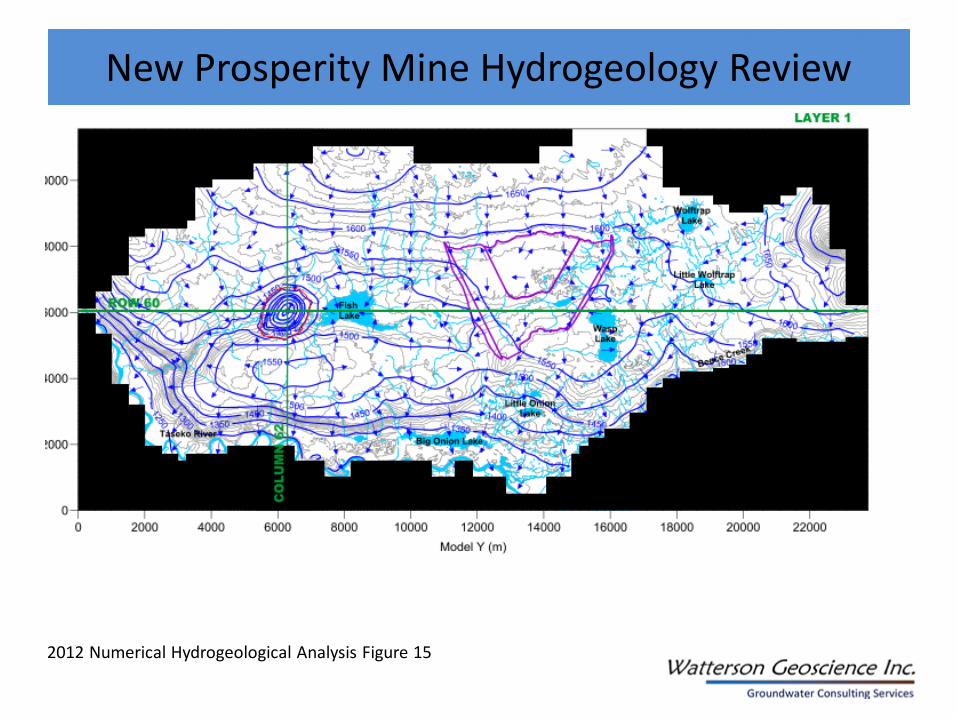
2012 Numerical Hydrogeological Analysis Figure 15

• The TSF along FC valley will be approximately 100 m thick • West boundary wells are not sufficiently deep to monitor
groundwater quality between bottom of TSF (for example 94-143, 94-148, 2012 GT-03 and -04) and BO, LO Lakes and TR (up to 200 m elevation difference)
• Only 3 wells (96-195B, 96-192 and 96-198B) completed between 93 and 99 m bgs for approximately 4 km of west side, remainder are shallower
• Many / most wells not completed in highest K zones • Many piezometers constructed of ¾” PVC; very difficult to get
representative GW samples from this small diameter • Several wells constructed using thin bentonite seals between open
or cuttings filled annulus, thereby potentially compromising GW quality
New Prosperity Mine Hydrogeology Review
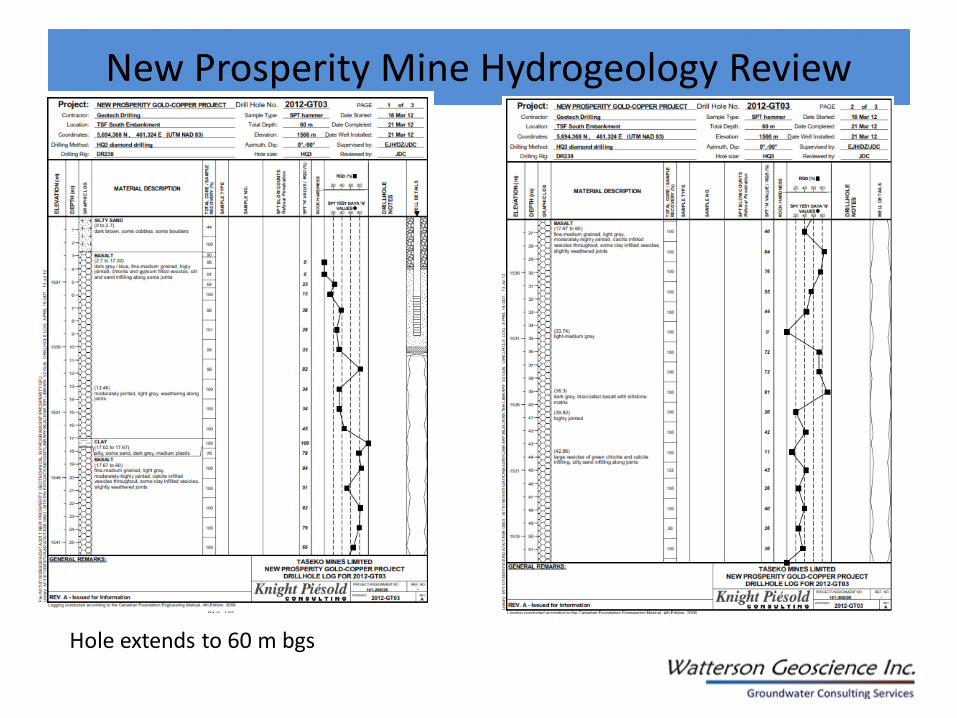
New Prosperity Mine Hydrogeology Review
Hole extends to 60 m bgs
New Prosperity Mine Hydrogeology Review