new rain climatology in the central region of the state of ... filenew rain climatology in the...
TRANSCRIPT
New rain Climatology in the Central Region of the State of Sao Paulo Using
Rio de janeiro, 08/10/2012
Region of the State of Sao Paulo Using Radar Echoes
Goal
RADAR
OTHER
OTHER
MODEL
DATES
OTHER
OTHER
CLIMATOLOGY
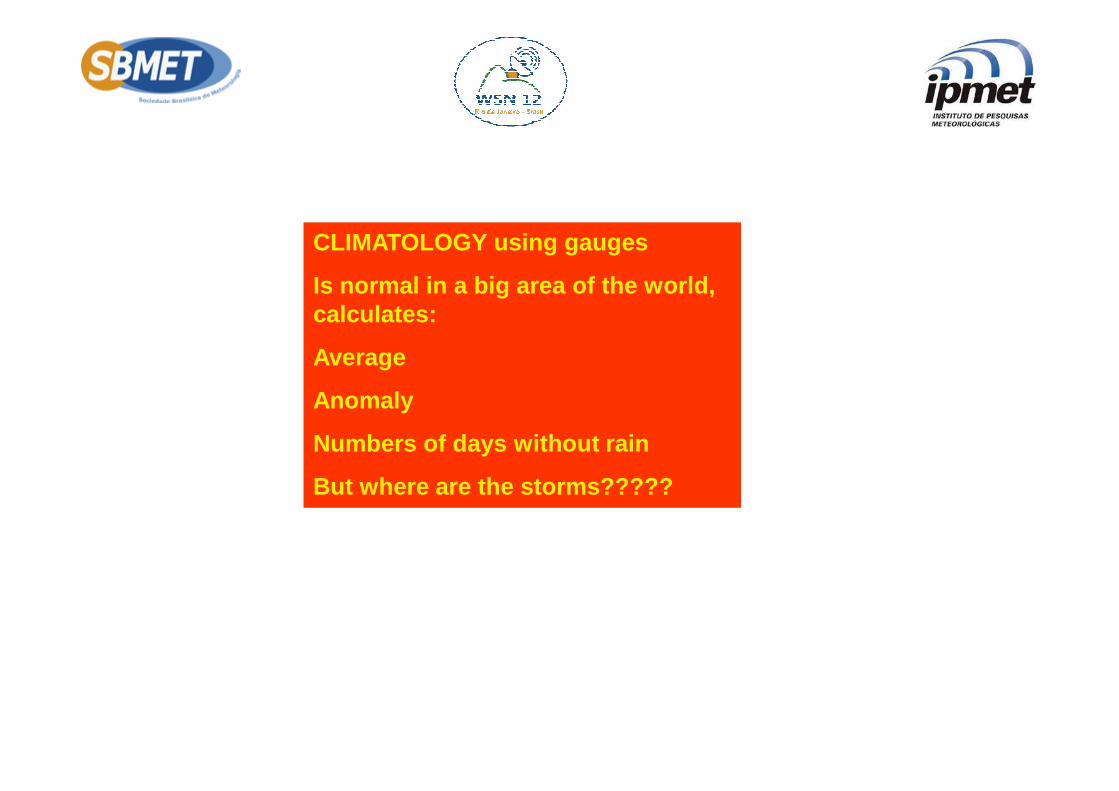
CLIMATOLOGY using gauges
Is normal in a big area of the world, calculates:
Average
Anomaly Anomaly
Numbers of days without rain
But where are the storms?????
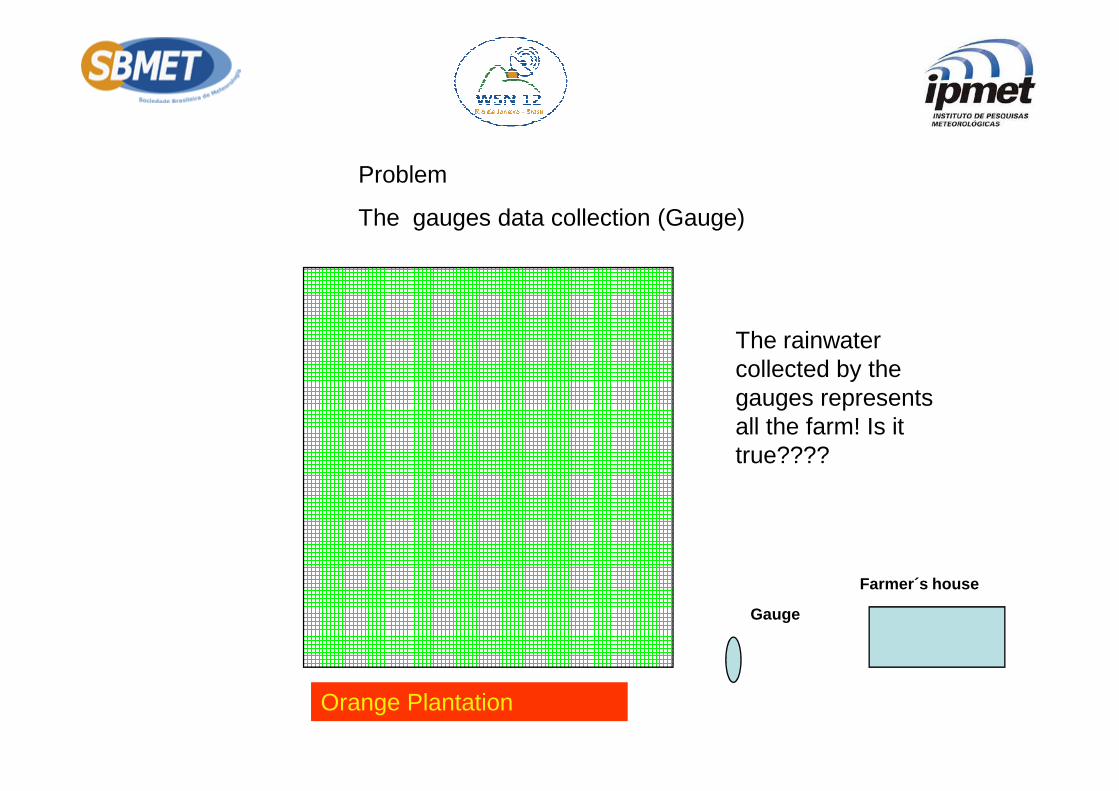
Problem
The gauges data collection (Gauge)
The rainwater collected by the gauges represents
Gauge
Farmer´s house
gauges represents all the farm! Is it true????
Orange Plantation
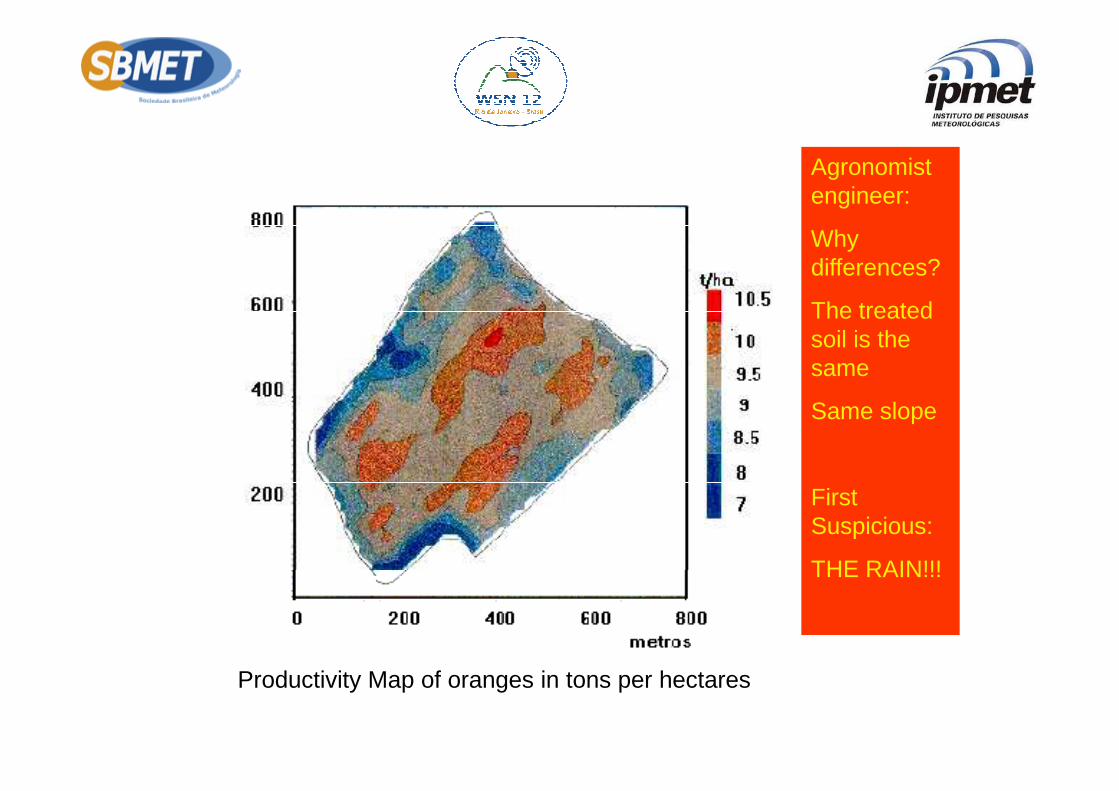
Agronomist engineer:
Why differences?
The treated soil is the same
Productivity Map of oranges in tons per hectares
Same slope
First Suspicious:
THE RAIN!!!
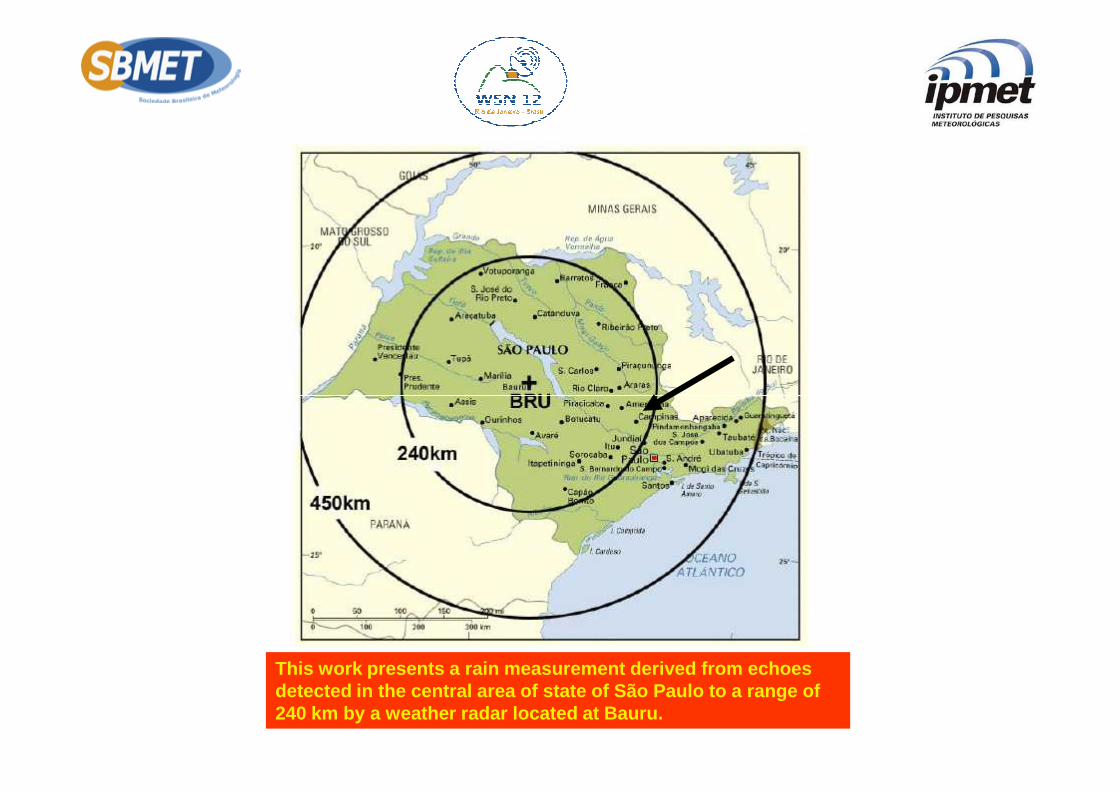
This work presents a rain measurement derived from echoes detected in the central area of state of São Paulo to a range of 240 km by a weather radar located at Bauru.
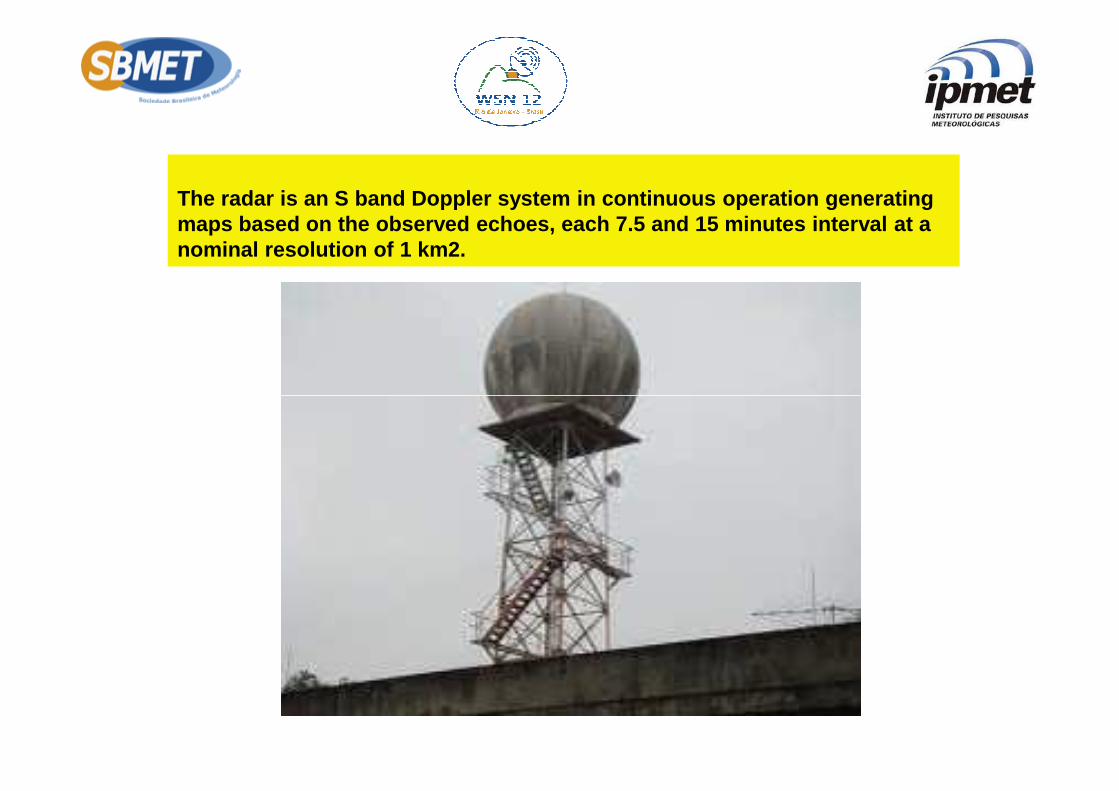
The radar is an S band Doppler system in continuous operation generating maps based on the observed echoes, each 7.5 and 15 minutes interval at a nominal resolution of 1 km2.
Since most of rain falling in the area is of a conv ective nature, the research was concentrated on the wet period, i.e. f rom November-to-march, of the years 1994-to-2004.
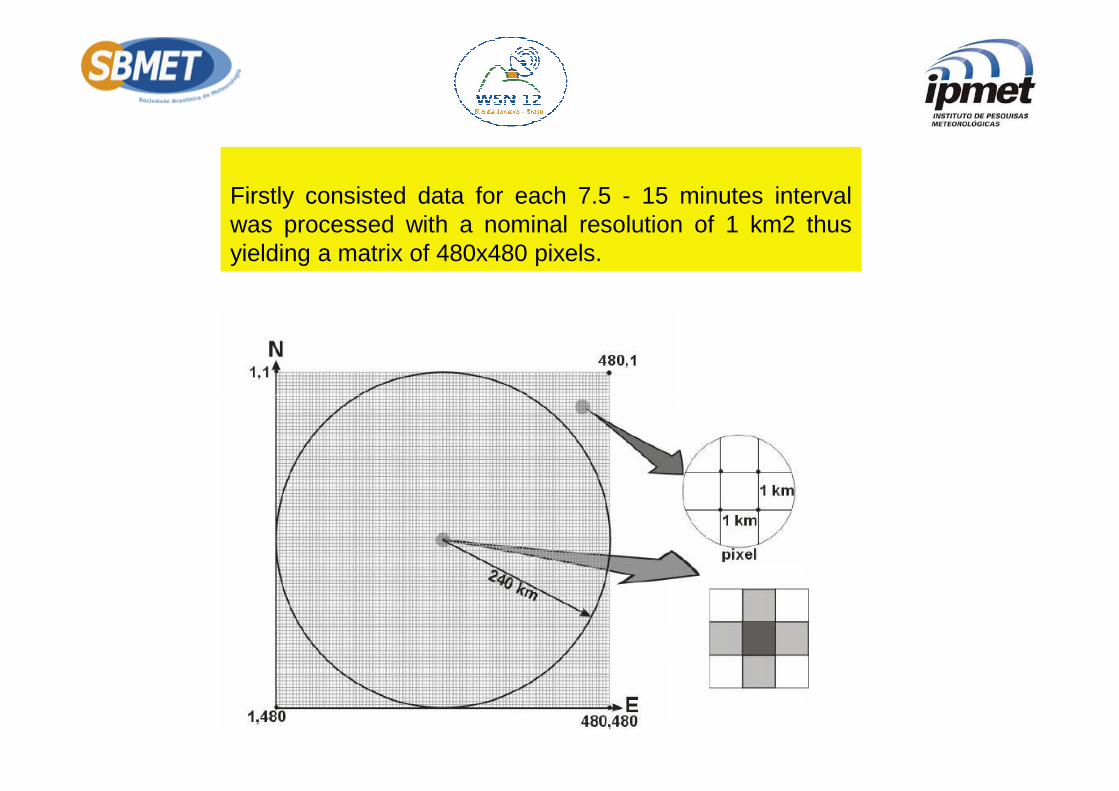
Firstly consisted data for each 7.5 - 15 minutes intervalwas processed with a nominal resolution of 1 km2 thusyielding a matrix of 480x480 pixels.
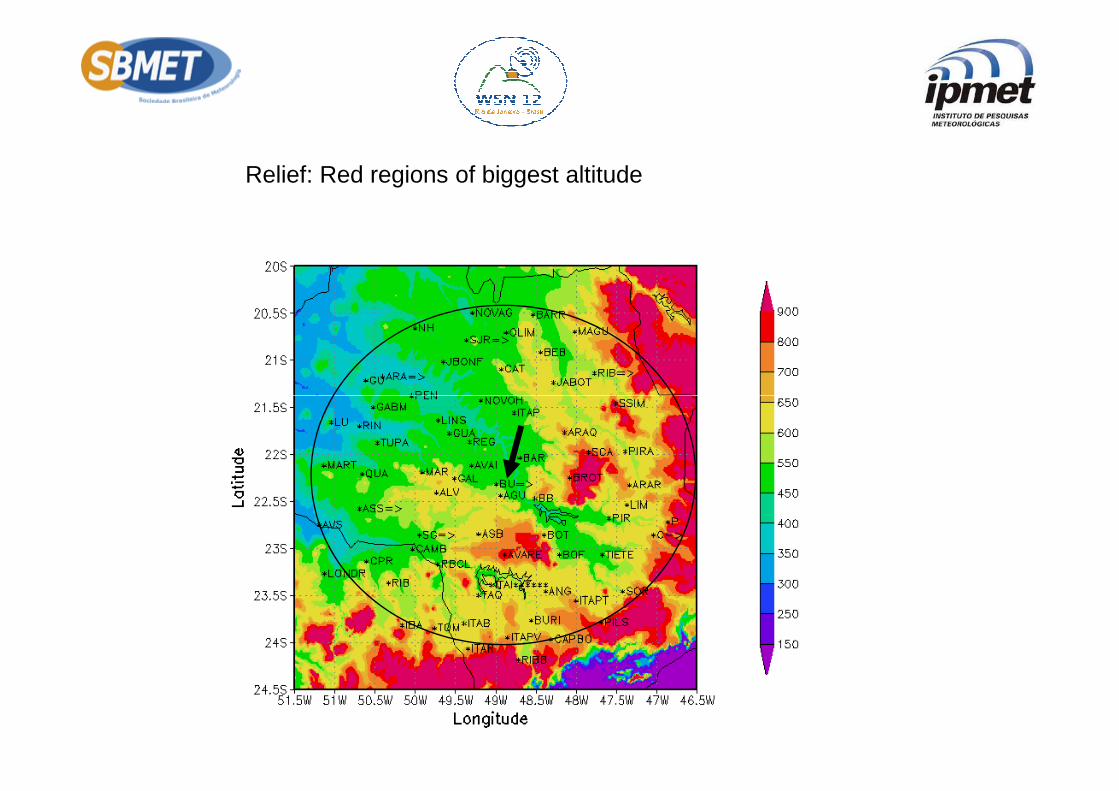
Relief: Red regions of biggest altitude
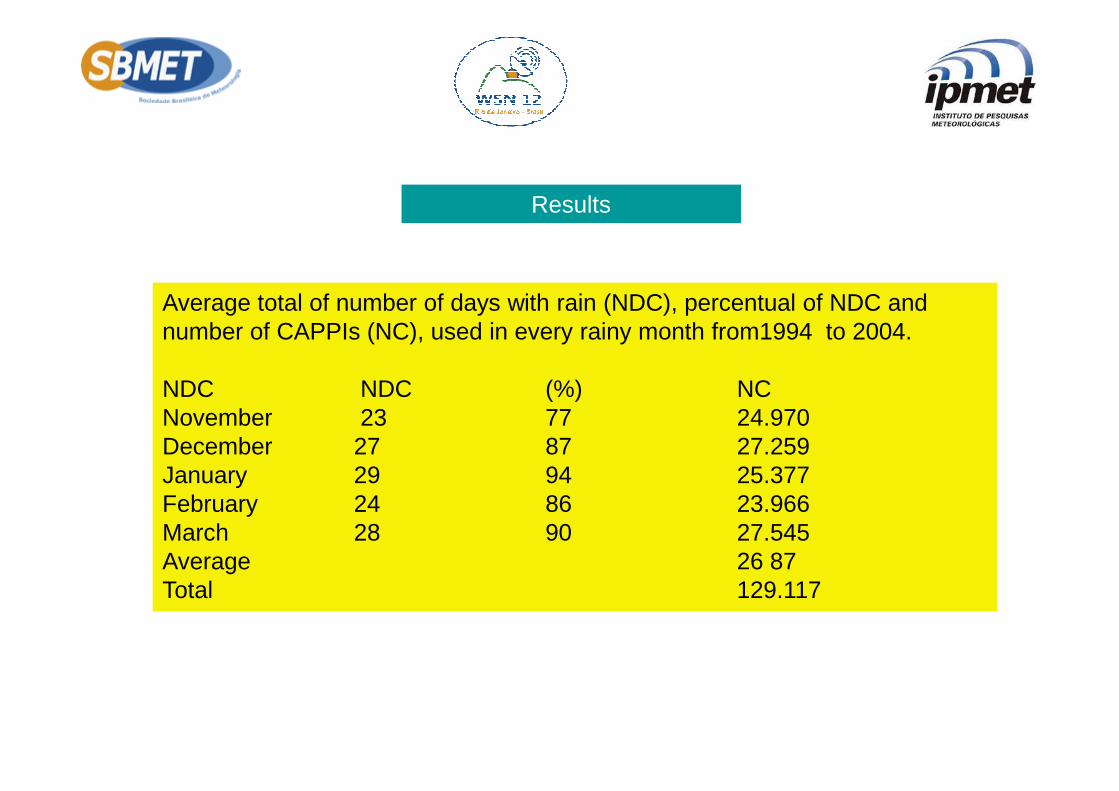
Average total of number of days with rain (NDC), percentual of NDC and number of CAPPIs (NC), used in every rainy month from1994 to 2004.
NDC NDC (%) NC
Results
NDC NDC (%) NCNovember 23 77 24.970December 27 87 27.259January 29 94 25.377February 24 86 23.966March 28 90 27.545Average 26 87Total 129.117
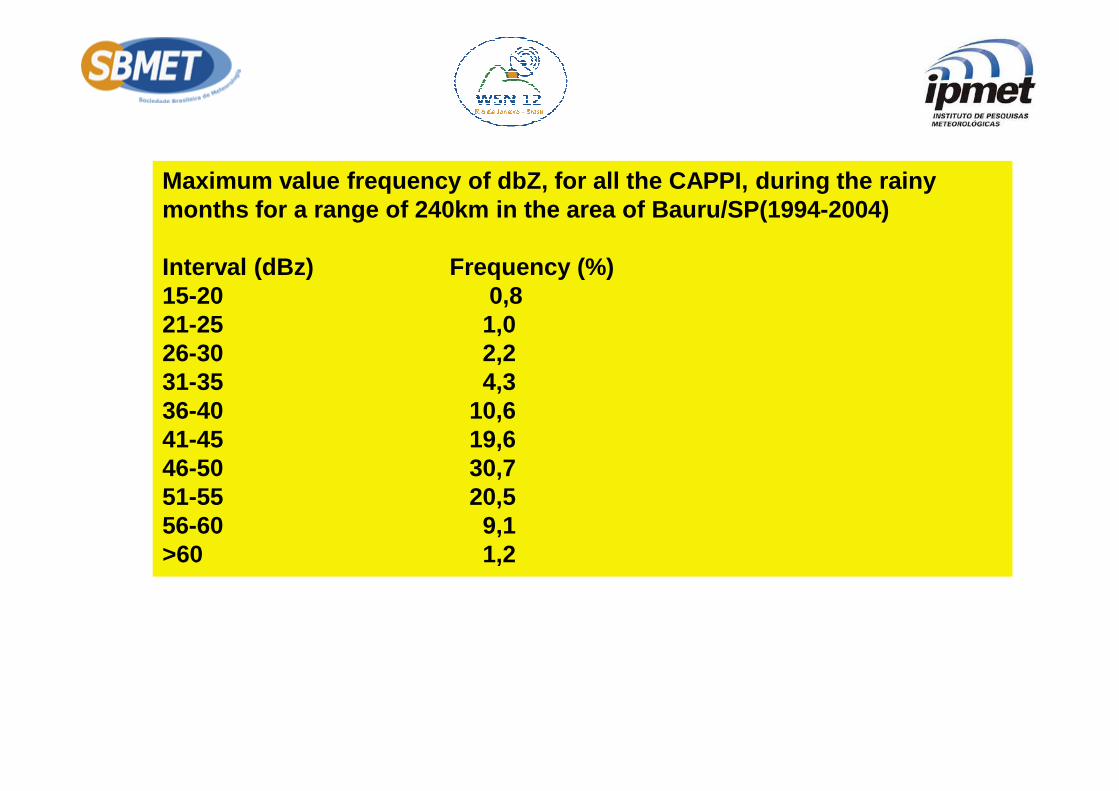
Maximum value frequency of dbZ, for all the CAPPI, during the rainy months for a range of 240km in the area of Bauru/SP (1994-2004)
Interval (dBz) Frequency (%)15-20 0,821-25 1,026-30 2,231-35 4,336-40 10,641-45 19,646-50 30,751-55 20,556-60 9,1>60 1,2
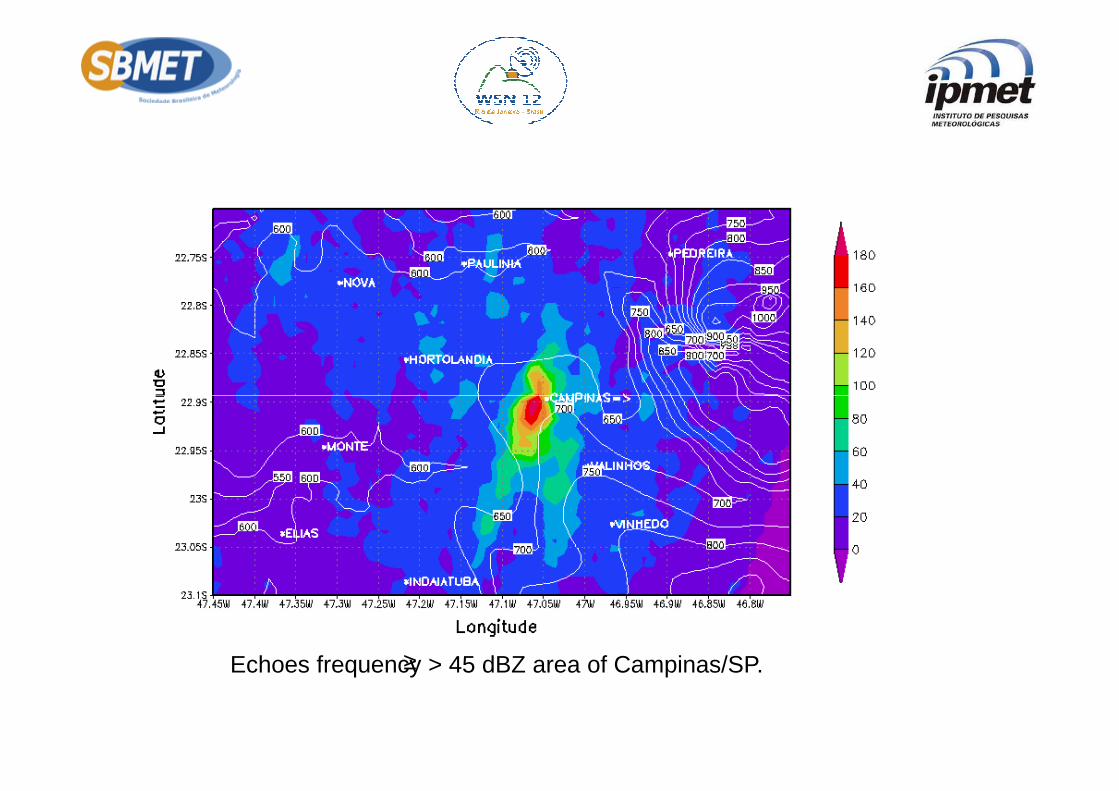
Echoes frequency > 45 dBZ area of Campinas/SP.≥

Rain Anomaly:
Where, mB average of 2004 and mC average 1994 - 2003
November December

January February
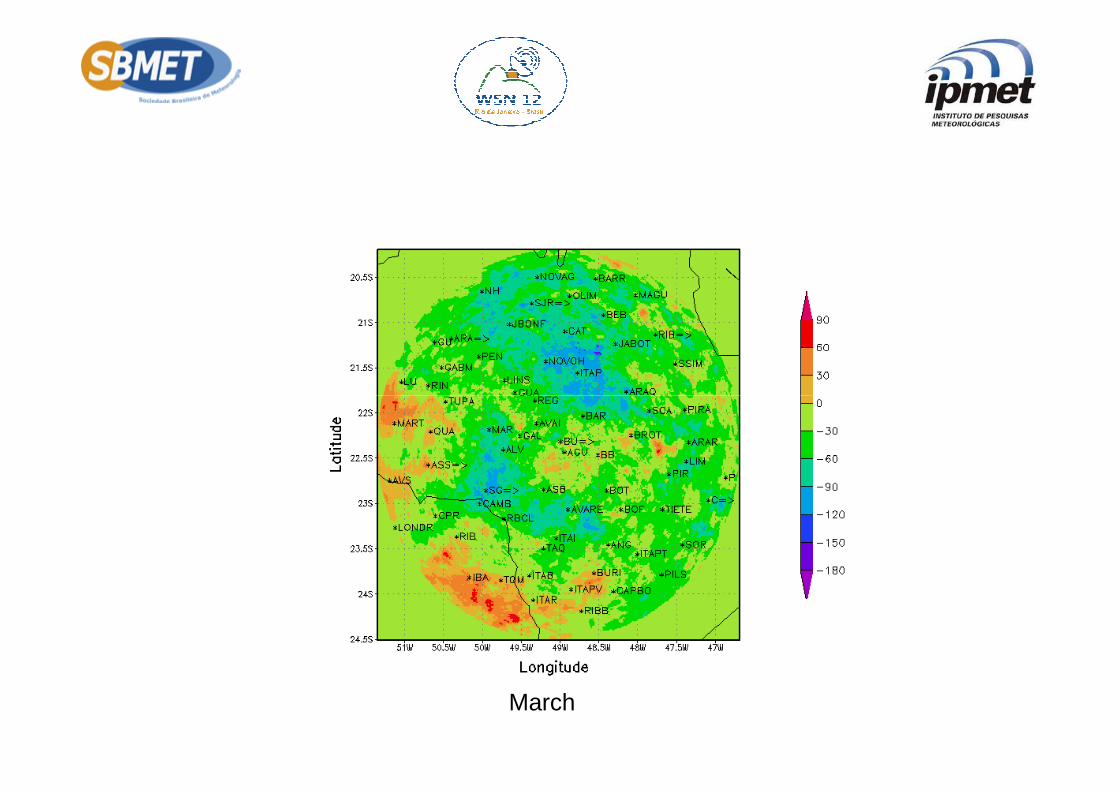
March
• Conclusions
The wet period rainfall represents 65% of the annua l precipitation.The wet period rainfall represents 65% of the annua l precipitation.
Areas with echo cores maximal exceeding a reflectiv ity value of 45 dBZ were concentrated over large metropolitan areas within the 240 km radar range.
It allows to follow the temporary rain variation.
• French bread• Fresh tomatoes slices• Pickles• Mozzarella cheese melted in hot water• Roast beef sliced very thin
The original Bauru sandwich recipe
PS You will only find the orignal in Bauru/SP, so come visit the radar in Bauru and try this delicious.
and Bon appetite!
» THE END