new rainfall maps of brazil
TRANSCRIPT

American Geographical Society
New Rainfall Maps of BrazilAuthor(s): Mark JeffersonSource: Geographical Review, Vol. 14, No. 1 (Jan., 1924), pp. 127-135Published by: American Geographical SocietyStable URL: http://www.jstor.org/stable/208360 .
Accessed: 08/05/2014 18:37
Your use of the JSTOR archive indicates your acceptance of the Terms & Conditions of Use, available at .http://www.jstor.org/page/info/about/policies/terms.jsp
.JSTOR is a not-for-profit service that helps scholars, researchers, and students discover, use, and build upon a wide range ofcontent in a trusted digital archive. We use information technology and tools to increase productivity and facilitate new formsof scholarship. For more information about JSTOR, please contact [email protected].
.
American Geographical Society is collaborating with JSTOR to digitize, preserve and extend access toGeographical Review.
http://www.jstor.org
This content downloaded from 169.229.32.137 on Thu, 8 May 2014 18:37:22 PMAll use subject to JSTOR Terms and Conditions
NEW RAINFALL MAPS OF BRAZIL
By MARK JEFFERSON State Normal College, Ypsilanti
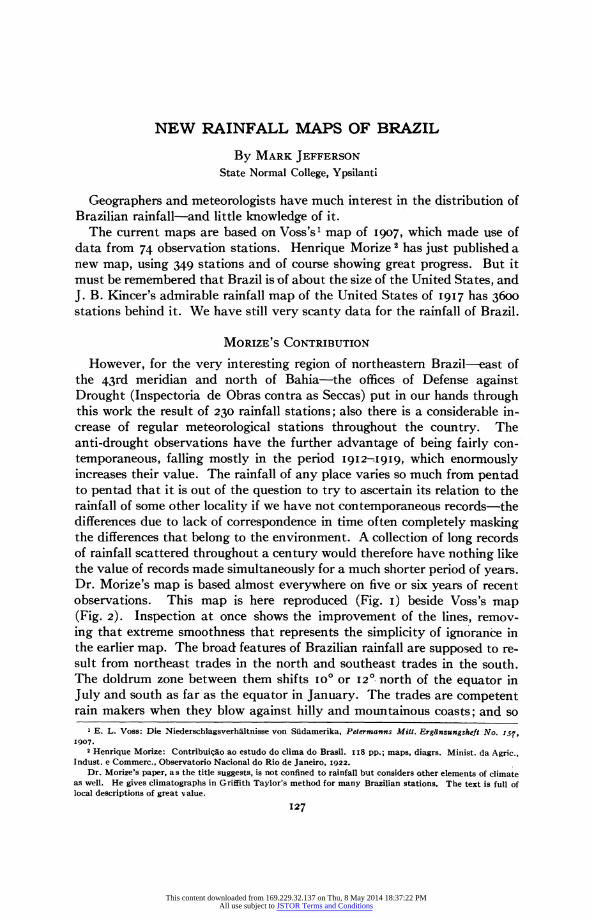
Geographers and meteorologists have much interest in the distribution of Brazilian rainfall-and little knowledge of it.
The current maps are based on Voss'sI map of I907, which made use of data from 74 observation stations. Henrique Morize2 has just published a new map, using 349 stations and of course showing great progress. But it must be remembered that Brazil is of about the size of the United States, and J. B. Kincer's admirable rainfall map of the United States of I917 has 3600 stations behind it. We have still very scanty data for the rainfall of Brazil.
MORIZE'S CONTRIBUTION
However, for the very interesting region of northeastern Brazil-east of the 43rd meridian and north of Bahia-the offices of Defense against Drought (Inspectoria de Obras contra as Seccas) put in our hands through this work the result of 230 rainfall stations; also there is a considerable in- crease of regular meteorological stations throughout the country. The anti-drought observations have the further advantage of being fairly con- temporaneous, falling mostly in the period 1912-1919, which enormously increases their value. The rainfall of any place varies so much from pentad to pentad that it is out of the question to try to ascertain its relation to the rainfall of some other locality if we have not contemporaneous records-the differences due to lack of correspondence in time often completely masking the differences that belong to the environment. A collection of long records of rainfall scattered throughout a century would therefore have nothing like the value of records made simultaneously for a much shorter period of years. Dr. Morize's map is based almost everywhere on five or six years of recent observations. This map is here reproduced (Fig. I) beside Voss's map (Fig. 2). Inspection at once shows the improvement of the lines, remov- ing that extreme smoothness that represents the simplicity of ignorance in the earlier map. The broad features of Brazilian rainfall are supposed to re- sult from northeast trades in the north and southeast trades in the south. The doldrum zone between them shifts IO? or 12? north of the equator in July and south as far as the equator in January. The trades are competent rain makers when they blow against hilly and mountainous coasts; and so
1 E. L. Voss: Die Niederschlagsverhaltnisse von Siidamerika, Petermanns Mitt. Ergdnzungsheft No. I53, 1907.
2 Henrique Morize: Contribuicao ao estudo do clima do Brasil. I 8 pp.; maps, diagrs. Minist. da Agric., Indust. e Commerc., Observatorio Nacional do Rio de Janeiro, I922.
Dr. Morize's paper, as the title suggests, is not confined to rainfall but considers other elements of climate as well. He gives climatographs in Griffith Taylor's method for many Brazilian stations. The text is full of local descriptions of great value.
127
This content downloaded from 169.229.32.137 on Thu, 8 May 2014 18:37:22 PMAll use subject to JSTOR Terms and Conditions

THE GEOGRAPHICAL REVIEW
we looked for heavy rain in the Guianas and along the east coast of Brazil and found it there. The very strong ascent along the eastern border of the Andes is known to be clothed in a rain forest, and the trades should properly yield a very heavy downfall there, in spite of the great distance from the ocean.
THE AMAZON BASIN
The level basin of the Amazon could derive its abundant rains only from the convectional thunderstorms of the doldrum belt. Appropriately this was known to extend north in July as far as Venezuela and to swing south-
MEAN ANNUAL RAINFALL OF BRAZIL
,,O 80 ! t t 92 -3 0
0 ~ ~~~~~~~~~~~~~ -o_~~~~~~~~~~~~0-
FIG. I FIG. 2
20.
Figuresno-Tenths of Meter excessive raires -Tenths o f Meter
at Iquitos, 300 miles east of them. Iquitos showed 2600 millimeters and
Inmap beters cale of tints
the high plateaus of the Andes did not and could not satisfy an inquiringrs
40 I HMORIZE, 1922- 40 " ELVOSS, 1907-
30 30 r , 0.7
7? 0 5, 0 THE GeOeR. REVIEW,JA,. g924 7,0 650 THE GEOR. REVIEW. JAN. 1924
FOG. I FoG. 2
FIGmind. The rain -Rainfall map of Brazil by H. Morize, 1922.
FIG.2-Rapainfall map of Brazil by E. L. VossFigure 3, 190which places a dot on7.
ward in January, following the course of the doldrums. The old map showed
nothing of the excessive rains on the eastern Andes, Vosroom ing only 6basin to years of observation at ManAos, 1300 miles east of the Andes, and I 7/12
at Iquitos, 300 miles east of them. Iquitos showed 2600 millimeters and Man,4os 2ioo, as our theory demanded; but this does not appear on Voss's
map because it has no grades above 2000in tenths millimeters. The resultant flattint from the Atlantic across the Guiana highlands awest ofnd all the Amazon plains to
the high plateaus of the Andes did not and could not satisfy an inquiring mind. The rainfall across the Amazon basin cannot be so uniform. The I922
map meets one's expectations admirably. Figure 3, which places a dot on
every rainfall station that we have been able to identify, in order to show the
great crowding of stations in the northeast, has room in the Amazon basin to
carry a few annual amounts of rainfall expressed in tenths of a meter. Here we have no less than nine stations west of Obidos. The observations are seen to be of the same epoch as the antidrought series and to completely satisfy
I28
This content downloaded from 169.229.32.137 on Thu, 8 May 2014 18:37:22 PMAll use subject to JSTOR Terms and Conditions

RAINFALL MAPS OF BRAZIL
expectation, as far as observations so widely scattered may be said to satisfy anything.
The details for the northeast are reproduced here in Figure 4, which is taken, with orrission of town names and hydrography, from a recent publi- cation of the Federal Office of Defense against Drought.3
FIG. 3-Rainfall stations used in H. Morize s map of Brazilian rainfall tsee Fig. I).
THE SERTAO
The southern part of the area with less than 600 millimeters of rain, in-
cluding two of the four areas with less than 400, has the familiar position in the valley of the Sao Francisco River where it turns from a northeasterly to a southeasterly course a little east of the fortieth meridian. From this point the dry area extends eastward between the 8th and 9th parallels of south latitude as far as the 37th meridian and then north between the 36th and
3 Dados pluviometricos relativos ao nordeste do Brasil (Periodo 1912-1920), collegidos pela Seccao da Esta- tistica e Collecta de bados Physicos e Economicos, e publicados sob a Direccio de C,. M. Delgado de Carvalho, Inspectoria Federal de Obras contra as Seccas, Publ. No. 47.
129
This content downloaded from 169.229.32.137 on Thu, 8 May 2014 18:37:22 PMAll use subject to JSTOR Terms and Conditions

THE GEOGRAPHICAL REVIEW
37th meridians within about a hundred miles of the Atlantic, instead of be- ing three hundred miles distant as formerly supposed. The largest dry areas lie in the states of Parahyba and Rio Grande do Norte. Two smaller patches with less than 600 millimeters occur in Cear,t and Piauhy.
The northern part of Voss's oval of less than 500 millimeters rainfall, which I have put on this map as a heavy dotted line, is seen to be a region
43 42 4'1 4'O 39 1 I I
-2 0 I IT PRELIMINARY RAINFALL MAP _2-
so 0 50 100 150 200 250 KILOMETERS
-i3 , ~~~~~~~by C. M.D de Carvalho 3-
0REEIWAN`%a IN CENTIMETERS
FORTALEZA 120
P~f.. ,fr~ 120- 80 4-
60
,~ 60 20
-o ~~~~~~~~~0 ...... ',-,,
/.......-..,...,-.-.... // / / / ~ ~ ~ ~ ~ ....-.-.....-...- .-...-.. .-....; ..-...:...., .. ...... )
.. .... .............................. .. .
X,, ::::::::::::::::: :::.:: :::::::: P :':. :.::::::.:: :::::::::::::::::N \ ~t: ' ~
Y/l,;/,X,,',.:::: ::::::..:::::::::::::::::::::::::::.::.::.:.:.:::,:.:.:.:,:::::: ::,:::::,::,:::: ::::~ .~.mSM . .V:~x` ~ %` ,;,f$~
?
~.2..:.:'-''-'--'--.........91.....2.:1. 2-.:-.:. 2..-....-2...:''2.:"':
,,,/, .'.:.-..:. . ?..........................
/
43///S,///2 G;J 42 *l1 '. 40 .3g1X,///,//g{,////S S ' ~ TH E GEOGR REVIEW,JAN 1924
FIG. 4-Rainfall map of northeastern Brazil by C. M. Delgado de Carvalho based on a preliminary report of the Inspectoria Federal de Obras contra as Seccas, I922.
of high precipitation, half of it having over 8oo millimeters and one side reaching 1200.
In our latitudes aridity accompanies a rainfall less than 500 millimeters, but the evaporation resulting from higher temperatures so near the equator probably raises the amount of rain needed for safe growth of crops to an annual 700 or 800 millimeters. Probably the whole Sertao, with less than 800 millimeters of annual rain, has an arid type of vegetation. Certainly men perish there of hunger and thirst every few years, and great numbers are
I30
This content downloaded from 169.229.32.137 on Thu, 8 May 2014 18:37:22 PMAll use subject to JSTOR Terms and Conditions

RAINFALL MAPS OF BRAZIL
obliged to abandon their homes during the bad season. September, October, and November are excessively dry in the normal year. Life is adjusted to that, but in abnormal years the rains of December and January also fail. Then famine appears exactly as in India when the monsoon fails to "break" on time. A rough general theory of these interior, drier areas in northeastern Brazil makes them dry because they are so flat-topped! There is heavy rain, 1500, 1700, and 2000 millimeters, on the east coast where the trades are up- lifted-and thereby cooled-by ascent to the upland. The flat table-land of the interior is hot and dry because there is nothing to condense vapors of the trade winds. The Sao Francisco valley would seem to be a hollow into which the winds have to descend. One has to suppose a range of uplands toward the coast through which the river breaks in gorges as at the Falls of Paulo Affonso (longitude 380 W.). The difficulty with this theory is that some months, February, March, and April, have very considerable rain in this interior while the trades are still blowing on the east coast.
Conditions in this region are described by Baron Homem de Mello.4 "The climate of the interior of the state [CearA] is very hot and dry but of great healthfulness. In the coast zone the heat is moister but tempered by the sea breeze. The season of rains begins in February or March and ends in June. For the rest of the year it does not rain, the rivers stop, and the fields turn dry, which at times compels the inhabitants to come into the towns or to emigrate to other regions"--such as the rubber forests of the upper Ama- zon, whose main dependence for labor was on the CearA men. The same work speaks of Piauhy, the state next west of Ceara. "The scourge of drought is felt in August and September, when the ground is transformed into a baked desert, while in favorable years, in the period of rains from February to June, nature reacquires its vigor rapidly." 5 No such distress arises in the valley of the Sao Francisco. There somewhat less rain falls in September and October, but there is no endangering of life.
The little city of Quixeramobim is in the heart of the Sertao of Ceara (lati- tude 5.3? S., longitude 39.9? W.). It has an average annual rainfall of 595 millimeters. Near the coast to the east the city of Natal has I418 milli- meters, owing to its exposure to the trades. Table I gives the details for the average year.
The winds at Natal are east and southeast, both directions trades, I suppose. The city of Natal lies about five miles inland on the south side of the estuary of the Jundiahy, which extends to the northeast from this point to the Atlantic. The south wind is a land wind. The east and south- east winds blow across five miles of low land but come from the sea and therefore contain much water vapor. This accounts well enough for Natal's greater rainfall if the high border of the plateau is near to lift and cool the air. But the variations in amount of rain are difficult to recon- cile with the direction and force of the wind at different seasons.
4 Geographia-atlas do Brazil e das cinco partes do mundo, F. Briquet et Cia., Rio de Janeiro, 91I2, p. 23. 6 Ibid., p. 20.
I3I
This content downloaded from 169.229.32.137 on Thu, 8 May 2014 18:37:22 PMAll use subject to JSTOR Terms and Conditions

THE GEOGRAPHICAL REVIEW
The wind is strongest, according to the last column, in the dry months September, October, November, and December and is feeblest in the period of heavy rains. This does not seem to fit the idea of trades blowing on a shore with high land behind it and forced to give up their moisture by cooling on ascent. We should expect most rain with the stronger winds. As for Quixeramobim, it also has least wind-2.2 to 2.5 meters per second-in the wet months, March, April, May, and June, and most wind in the dry months, September to December, and those winds seem to be the trades. The people in the Sertao regard the trade as the
TABLE I- CLIMATES OF QUIXERAMOBIM AND NATAL
QUIXERAMOBIM NATAL
WIND WIND RAINFALL RAINFALL
MONTHS IN MILLI- METERS IN MILLI- METERS DIRECTION PER SEC- METERS DIRECTION BEAUFORT
OND
January 42 E & NE 3.7 60 E & SE 3.6 February 98 N & NW 3.0 123 E & SE 3.I March I62 W & NW 2.5 I43 E & SE 3.0 April IO8 W & N 2.2 220 E &SE 3.0 May 80 SW&S 2.3 I44 E & SE 3.1 June 43 S&W 2.5 316 E&SE 3.4 July 23 S&SW 2.9 200 E&SE 3.3 August I3 S & SE 3.6 I24 SE & E 3.8 September 2 SE & E 4.6 36 SE & E 4.1I October o E & NE 4.9 I2 E & SE 4.1 November I E & NE 4.9 14 E & SE 3.9 December 23 E & NE 4-7 26 E & SE 3.9
drought wind. If it keeps blowing they expect more drought. The direction of the lighter wind of the wet months, February to July, is northwest, west, or southwest. These observations were made by 0. Weber from I896 to I905.6 He was undoubtedly careful and competent, but the observers whom he trained to carry on the work after him from 1905 to I919 report an east wind in every month at 7 A.M. and 2 P.M. and 9 P.M.
There are many notes by other observers to the effect that in the Sertao the trades give drought. Rain comes with variable, light winds from some westerly direction. From the Boletim Meteorolo'gico I get the daily details of rainfall at Quixeramobim for the year I9IO. The year was unusually wet, in the sense that it had an unusually heavy total rainfall; yet in July, August, September, and October no rain fell. The trades were remarkably well de- veloped through the rainless months. September had regularly a southeast wind at 7 A.M. and 2 P.M. and a northeast wind at 9 P.M., with occasional
6 Morize, op. cit., p. 24.
132
This content downloaded from 169.229.32.137 on Thu, 8 May 2014 18:37:22 PMAll use subject to JSTOR Terms and Conditions

RAINFALL MAPS OF BRAZIL
substitutions of east for southeast. October showed almost the same condi- tions. The monthly amounts of rainfall that year were 122, 78, 297, I78, 274, I6, o, o, o, o, 23, II4; total 1102 millimeters.
In the unusually wet month March, on the contrary, when 297 millime- ters of rain fell, the winds were from every direction. Only 3 days showed southeast, east, and northeast as the directions at the hours of observation. There were 8 northeast winds, I I southeast, 20 east, 10 northwest, 3 south- west, 9 west, 9 south, I6 north, and 7 calms. The rain fell in thundershowers of small, irregular area. Clouds form readily in the dry season, too, but nothing comes of them. We may call them true doldrum rains; they are necessarily uncertain in time and amount. The surface of the Sertao appears to be an elevated plateau of granites and gneisses in which the very inter- mittent rivers have dug out poorly graded channels that partly dissect a flat upland. Chapada is the word applied to this level upland, and chapadas appear to occur all over the Sertao. The rivers have not well graded courses but descend at the borders of the Sertao by falls which carry off the waters of rainstorms with great rapidity. The anti-drought offices referred to above are constructing reservoirs (aCudes) for saving these flood waters and have many finished already.7
FERRAZ'S WORK Besides Dr. Morize's paper there has recently come to hand from a bu-
reau of the same department, the Bureau of Meteorology under the direc- tion of Sampaio Ferraz, another interesting publication,8 containing monthly averages of the meteorological elements at 73 full stations and I8 rain sta- tions. A hasty examination shows that it contains the same statistics as Dr. Morize's paper, without the observations of the Defense against Drought stations, and that the observations have been looked over with an intent to criticize. In the main the figures are identical; but occasionally Ferraz has shortened a series by rejecting a year, noting some months as missing. The only considerable difference noted by the present writer was in the rainfall of Mantos, which Ferraz gives as 1954 millimeters and Morize as I675. Table II contains the mean and absolute maximum temperatures and amount of rainfall of both series for ManAos.
Ferraz says ManAos is a third class station and that third class stations have their temperature observed at 7 A.M. and 9 P.M., means being obtained by the formula (7 A. M. + 9 P.M. + max. + min.) . 4. Morize implies, if he is correctly understood, that Manaos had observations at 7 A.M., 2 P.M., and 9 P.M., and means were obtained by the formula (7 A.M. + 2 P.M. + 9 P.M.) +
3, which would account for some small differences. As to the starred rainfall number 35.3, as compared with 55, only access to the records would decide which is right, but the sum 1954 is obviously an error.
7 Compare the note "Drought Relief Measures in Ceara" in the Geographical Record. 8 Boletim de normaes: Observacoes meteorologicas feitas no ex-Observatorio Nacional, hoje Instituto Cen-
tral do Rio de Janeiro, e nas Estaco6es da rede Nacional, Minist. da Agric., Indust. e Commerc., Direct. de me- teorol., [Rio de Janeiro], 1922. See the review of this publication by E. G. Holt elsewhere in this number of the Geographical Review.
133
This content downloaded from 169.229.32.137 on Thu, 8 May 2014 18:37:22 PMAll use subject to JSTOR Terms and Conditions

THE GEOGRAPHICAL REVIEW
The "Boletim de Normaes" says in the preface that a "new Bureau of Mete- orology was created in May, I921," implying that it takes the place of the "old Bureau of Meteorology and Astronomy, established in November I909, whose first and only Bulletin, for I9IO, was published in I914. Before, there- fore, attending to the printing of the great bulk of data corresponding to the years I9II to 1920 we resolved to publish at once the normal values of the existing series." This preface is dated December, 1921, and signed by Sam- paio Ferraz.
Dr. Morize's paper calls itself on the title page "Work Extracted from the
TABLE II-MONTHLY TEMPERATURE AND RAINFALL AT MANAOS
ACCORDING TO FERRAZ ACCORDING TO MORIZE
MONTHS TEMPERATURE RAINFALL TEMPERATURE RAINFALL - IN MILLI- IN MILLI-
MEAN ABS. MAX. METERS MEAN ABS. MAX. METERS
January 26.7? 37? 210.9 27? 37? 211
February 26.9 36 203.3 26.9 36 203 March 26.6 36 204.6 26.9 36 205 April 26.7 34.6 214.3 26.9 34.6 214 May 26.8 35 I67.7 26.9 35 I68 June 26.8 35 99.5 27.1 35 I00
July 27.2 34.2 46.2 27.3 34.2 46
August 27.6 35.6 33.0 27.8 35.6 33 September 28.2 37.2 35.3* 28.0 37.2 55 October 28.3 37.2 I I6.7 28.3 37.2 117 November 28.0 37.2 114.6 28.I 37.2 I 15 December 27.1 38.6 208 27.2 38.6 208
Year 27.2 I954.1 27.4 1675
Historical, Geographical, and Ethnographical Dictionary of Brazil." It has a preface as such dated May, 1921, and an "Advertencia" that the Ministry of Agriculture and Commerce had decided that "the present work prepared for inclusion in the Historical, Geographical Dictionary of Brazil . . . should be reprinted. . . ." This is dated September, I922. The individual copy of the Morize publication before me reached this country in the early spring, and that of the Ferraz publication in late summer. It looks as if Dr. Morize had published the material of the Normal Values with the authori- zation ot his ministry before Dr. Ferraz published them, and in fuller form.9
CARVALHO'S WORK
The "Dados Pluviometricos," from which we have redrawn Figure 4, is another work of great interest. It professes to be only a preliminary account of the simultaneous rainfall observations at 400 stations of the Defense
9 Compare the statement by Mr. E. G. Holt in his review-EDIT. NOTE.
134
This content downloaded from 169.229.32.137 on Thu, 8 May 2014 18:37:22 PMAll use subject to JSTOR Terms and Conditions

RAINFALL MAPS OF BRAZIL
against Drought for the period I912-I919, with a map and the mean, maxi- mum, and minimum rainfall of each month. It is, as the author, Carlos M. Delgado de Carvalho, says, a real treasure of science. Better still, it is to be followed soon by a "definitive publication which will have an explanatory introduction discussing the data contained in the tables and will study the pluviometry of the northeast with all possible minuteness. Annual and monthly maps, maps of means, percentages, and equal amplitudes will ac- company the edition, which will also contain graphs and diagrams that are now being prepared." The places listed in the eight states of the northeast number 413, but for many of the places the data were not ready at time of printing. Data are printed for 291 stations, for 256 of them the whole eight years' data, 22 of them for seven years' data. The shortest series included are eight of five years each.
That there is no little difficulty in locating these stations even with the official resources of the Inspectoria is seen by the fact that latitude and longi- tude can be given for only 92. This defect will doubtless be remedied in the new work.
The map would have been more expressive if the names and rivers had been omitted, as has been done in the reproduction, and it is much to be de- sired that each station used for drawing the isohyetals should be indicated on the map by a distinct dot or circle, which can in turn be made identifia- ble on a list of stations arranged in order of latitude with the adopted annual value of the rainfall.
The three papers are a most timely addition to our knowledge of the geog- raphy of Brazil and are evidence, with the recently published sheets of the International Millionth Map, of fine stirrings of geographic activity in the Republic.
135
This content downloaded from 169.229.32.137 on Thu, 8 May 2014 18:37:22 PMAll use subject to JSTOR Terms and Conditions