new seti sky surveys for radio pulses - seti@home · new seti sky surveys for radio pulses ... by...
TRANSCRIPT
New SETI Sky Surveys for Radio Pulses
Andrew Siemiona,d, Joshua Von Korffc, Peter McMahond, Eric Korpelab, Dan Werthimerb,d, David Andersonb, Geoff
Bowera, Jeff Cobbb, Griffin Fostera, Matt Lebofskyb, Joeri van Leeuwena, William Mallardd, Mark Wagnerd
aUniversity of California, Berkeley - Department of Astronomy, Berkeley, CaliforniabUniversity of California Berkeley - Space Sciences Laboratory, Berkeley, California
cUniversity of California, Berkeley - Department of Physics, Berkeley, CaliforniadUniversity of California, Berkeley - Berkeley Wireless Research Center, Berkeley, California
Abstract
Berkeley conducts 7 SETI programs at IR, visible and radio wavelengths. Here we review two of the newest efforts,Astropulse and Fly’s Eye.
A variety of possible sources of microsecond to millisecond radio pulses have been suggested in the last sev-eral decades, among them such exotic events as evaporating primordial black holes, hyper-flares from neutron stars,emissions from cosmic strings or perhaps extraterrestrial civilizations, but to-date few searches have been conductedcapable of detecting them. The recent announcement by Lorimer et al. of the detection of a powerful (≈ 30 Jy) andhighly dispersed (≈ 375 cm−3 pc) radio pulse in Parkes multi-beam survey data has fueled additional interest in suchphenomena.
We are carrying out two searches in hopes of finding and characterizing these uS to mS time scale dispersedradio pulses. These two observing programs are orthogonal in search space; the Allen Telescope Array’s (ATA)”Fly’s Eye” experiment observes a 100 square degree field by pointing each 6m ATA antenna in a different direction;by contrast, the Astropulse sky survey at Arecibo is extremely sensitive but has 1/3,000 of the instantaneous skycoverage. Astropulse’s multibeam data is transferred via the internet to the computers of millions of volunteers.These computers perform a coherent de-dispersion analysis faster than the fastest available supercomputers and allowus to resolve pulses as short as 400 nS. Overall, the Astropulse survey will be 30 times more sensitive than the bestprevious searches. Analysis of results from Astropulse is at a very early stage.
The Fly’s Eye was successfully installed at the ATA in December of 2007, and to-date approximately 450 hours ofobservation has been performed. We have detected three pulsars (B0329+54, B0355+54, B0950+08) and six giantpulses from the Crab pulsar in our diagnostic pointing data. We have not yet detected any other convincing bursts ofastronomical origin in our survey data.
Key words:
1. Introduction
The Berkeley SETI group conducts seven searches atvisible, IR and radio wavelengths, covering a wide vari-ety of signal types and spanning a large range of timescales: SETI@home searches for radio signals withtime scales ranging from mS to seconds. SEVENDIPsearches for nS time scale pulses at visible wavelengths.ASTROPULSE and Fly’s Eye search for dispersed uSand mS time scale radio pulses from extraterrestrialcivilizations, pulsars, or evaporating primordial blackholes. SERENDIP and SPOCK search for continuousnarrow band signals in the radio and optical bands re-spectively. DYSON searches for infrared excess from
advanced civilizations that use a lot of energy.
SETI@home II, ASTROPULSE and SERENDIP Vare radio sky surveys at the 300 meter Arecibo tele-scope. Commensal observations have been conductedalmost continuously for the past ten years and are ongo-ing. Most beams on the sky visible to the Arecibo tele-scope have been observed four or more times. We rankSERENDIP and SETI@home candidate signals basedon the number of independent observations, the strengthof the signals, the closeness of the signals in frequencyand sky position, and the proximity to stars, planetarysystems, galaxies, and other interesting astronomicalobjects. SETI@home uses the CPU power of volun-
Preprint submitted to Elsevier November 12, 2008
teered PCs to analyze data. Five million people in 226countries have participated. Combined, their PCs formEarth’s second most powerful supercomputer, averaging482 TeraFLOPs and contributing over two million yearsof CPU time. Here we describe two of the newest SETIsearches, Astropulse and Fly’s Eye.
2. SETI Pulse Searches
One common assumption of SETI is that an aliencivilization wishing to make contact with others wouldbroadcast a signal that is easily detected and easily dis-tinguished from natural sources of radio emission. Oneway of achieving these goals is to send a narrow bandsignal. By concentrating the signal power in a very nar-row frequency band, the signal can be made to stand outamong the natural, broad-band sources of noise. By thesame token, signals leaked from a civilization’s internalcommunications may be narrow band, but would be sig-nificantly weaker than a direct attempt at extraterrestrialcontact.
Because of this, radio SETI efforts have concentratedon detecting narrow band signals. When searching fornarrow band signals it is best to use a narrow searchwindow (or channel) around a given frequency. Thewider the channel, the more broadband noise is includedin addition to any signal. This broadband noise limitsthe sensitivity of the system. Early systems used analogtechnology to create narrow bandpass filters that couldobserve at a single frequency channel. More recent sys-tems use massive banks of dedicated fast Fourier trans-form (FFT) processors to separate incoming signals intoup to a billion channels, each of width ∼1 Hz.
There are, however, limitations to this technique. Onelimitation is that extraterrestrial signals are unlikely tobe stable in frequency due to accelerations of the trans-mitter and receiver. For example, a receiver listening forsignals at 1.4 GHz located on the surface of the earth un-dergoes acceleration of up to 3.4 cm/s2 due to the earth’srotation. This corresponds to a Doppler drift rate of 0.16Hz/s. If uncorrected, an alien transmission would driftout of a 1 Hz channel in about 6 seconds, effectively lim-iting the maximum integration time to 6 seconds. Be-cause of the inverse relationship between maximum fre-quency resolution and integration time (∆ν = 1
∆t ) thereis an effective limit to the frequency resolution that canbe obtained without correcting the received signal forthis effect.
There are other parameters of the signal that are un-known, for example: At what frequency will it be trans-mitted? What is the bandwidth of the signal? Will the
signal be pulsed, if so at what period? Fully investigat-ing a wide range of these parameters requires innova-tive instruments and enormous computing power. An-other possibility that, until now, has not been included inSETI searches is that rather than directing large amountsof power into a narrow frequency band, an extraterres-trial intelligence might direct large amounts of powerinto a narrow time window by sending a short durationwide-band pulse. A wide band signal has the advan-tage of reducing the importance of the choice of obser-vation frequency, and the unavoidable interstellar dis-persion of a broad-band pulse reduces the confusion be-tween terrestrial and extraterrestrial pulses. In an ion-ized medium, high frequencies propagate slightly fasterthan low frequencies at radio frequencies. Therefore RFpulses will be dispersed in frequency during their travelthrough the interstellar medium. The dispersion acrossa bandwidth ∆ν is given by
δt = (8.3 µs )∆ν( MHz )ν3( GHz )
DM (1)
where dispersion measure DM is defined as∫ L
0 nedl andis usually quoted in units of cm−3 pc.
It is possible that a civilization intentionally creatinga beacon for extraterrestrial astronomers would chooseto create “pulses” which have a negative DM. Natu-ral dispersion always causes higher frequency compo-nents to arrive first. A signal in which the low frequen-cies arrive first would stand out as obviously artificial.As a check on this, as well as to establish our back-ground noise limit, we examine both positive and nega-tive dispersion cases. Unfortunately, sensitive detectionof broad-band pulses at an unknown dispersion measurealso requires enormous computing power.
We are currently conducting two searches for thesedispersed radio pulses. Astropulse at Arecibo Observa-tory and Fly’s Eye at the Allen Telescope Array (ATA).The Allen Telescope Array is a joint project of the SETIInstitute and the University of California, Berkeley [10].
2.1. Pulses from Extraterrestrial IntelligenceAstropulse and Fly’s Eye consider the possibility
that extraterrestrials communicate using high intensityand wideband but short timescale pulses. It turns outthat both the conventional (narrowband) method of datatransfer assumed by SETI@home and the wideband,short timescale method assumed by Astropulse andFly’s Eye require the same amount of energy to senda message.
In each case, the energy required to send one bit ofinformation is proportional to the energy (per area) re-quired to send the minimum detectable signal. And this
2
energy is the same for the two methods, so energy con-siderations cannot rule out short timescale pulses as amedium for extraterrestrials’ communication.
SETI@home’s sensitivity in searching for narrow-band signals is given by:
ασTsys
G√
NpolBtint(2)
where α = 2 is a loss from 1-bitting the data twice,σ = 24 is the threshold above noise, Tsys = 28 K isthe system temperature, G = 10 K Jy−1 is the gain, andNpol = 1 is the number of polarizations.
SETI@home searches for narrowband signals with abandwidth of 0.075 Hz, and its longest integration timeis (0.075 Hz)−1 = 13.4 s. To compute the energy (perarea) required to send one bit, multiply by Btint = 1 toget 134 · 10−26 J m−2.
On the other hand, Astropulse and Fly’s Eye aresearching for short pulses, so the sensitivity of these ex-periments will be given in Jansky microseconds, by aslightly different formula:
ασTsys√
tint
G√
NpolB(3)
where the variables have the meanings as before, ex-cept that now tint is the timescale of the pulse and B theentire bandwidth.
For Astropulse, tint is 0.4 µs and B = 2.5 MHz. Also,α = 1.4 because Astropulse 1-bits the data only once,Npol = 2, and σ = 21.5. The resulting sensitivity is24 Jy µs. To compute the energy per area required tosend one bit, multiply by B = 2.5·106 Hz to get 60·10−26
J m−2.For both narrow frequency and broadband pulse
cases, the expression for the minimum detectable en-ergy has the form
ασTsys√
Btint
G√
Npol(4)
with√
Btint = 1, so similar answers are expected.Because these energies are comparable, we have
a chance to detect ETI communications in this newregime.
2.2. Pulses from Evaporating Black Holes
Another intriguing possible source of short durationpulses comes from a suggestion by Martin Rees in 1977[44] that primordial black holes, evaporating via theHawking Process, could emit a large electromagneticsignature. According to Hawking [16], a black hole of
mass M emits radiation like a blackbody with a temper-ature TBH given by:
TBH =~c3
8πkGM= 10−6
( M�M
)K (5)
This radiation emanates from the black hole event hori-zon and comes completely from the black hole’s mass.For a non-accreting black hole, Stefan-Boltzmannyields a lifetime of:
τBH = 1010years(
M1012kg
)3
(6)
For stellar mass black holes, this theory predicts life-times of order 1034 years, much too long to ever expectto observe. However, some cosmologies predict the cre-ation of numerous small (M ∼ 1012g) primordial blackholes in the early universe, which according to theorycould be evaporating now [17].
The specific mechanism by which the evaporatingblack hole produces a strong radio pulse has not beenfully elucidated, but in short, it is thought that the pro-cess is similar to the EMP that accompanies super-nova explosions. In such a process, a highly conduc-tive plasma fireball expanding into an ambient magneticfield can exclude the field and create an electromagneticpulse. For typical values of the interstellar magneticfield, this pulse would be peaked near 1GHz [4].
An observation of these pulses would not only pro-vide a significant confirmation of Hawking radiation,but would also give strong evidence of the existence ofprimordial black holes.
3. Fly’s Eye: Searching for Bright Pulses with theATA
The Allen Telescope Array has several advantagesover other telescopes worldwide for performing tran-sient searches, particularly when the search is for brightpulses. The ATA has 42 independently-steerable dishes,each 6m in diameter. The beam size for individualATA dishes is considerably larger than that for mostother telescopes, such as VLA, NRAO Green Bank,Parkes, Arecibo, Westerbork and Effelsberg. Thismeans that the ATA can instantaneously observe a farlarger portion of the sky than is possible with othertelescopes. Conversely, when using the ATA dishesindependently, the sensitivity of the ATA is far lowerthan that of other telescopes.
The Fly’s Eye instrument was purpose built to searchfor bright radio pulses of millisecond duration at the
3
ATA. The instrument consists of 44 independent spec-trometers using 11 CASPER IBOBs. Each spectrom-eter processes a bandwidth of 210MHz, and producesa 128-channel power spectrum at a rate of 1600Hz(i.e. 1600 spectra are outputted by each spectrometerper second). Therefore each spectrum represents timedomain data of length 1/1600Hz=0.000625s=0.625ms,and hence pulses as short as 0.625ms can be resolved1.
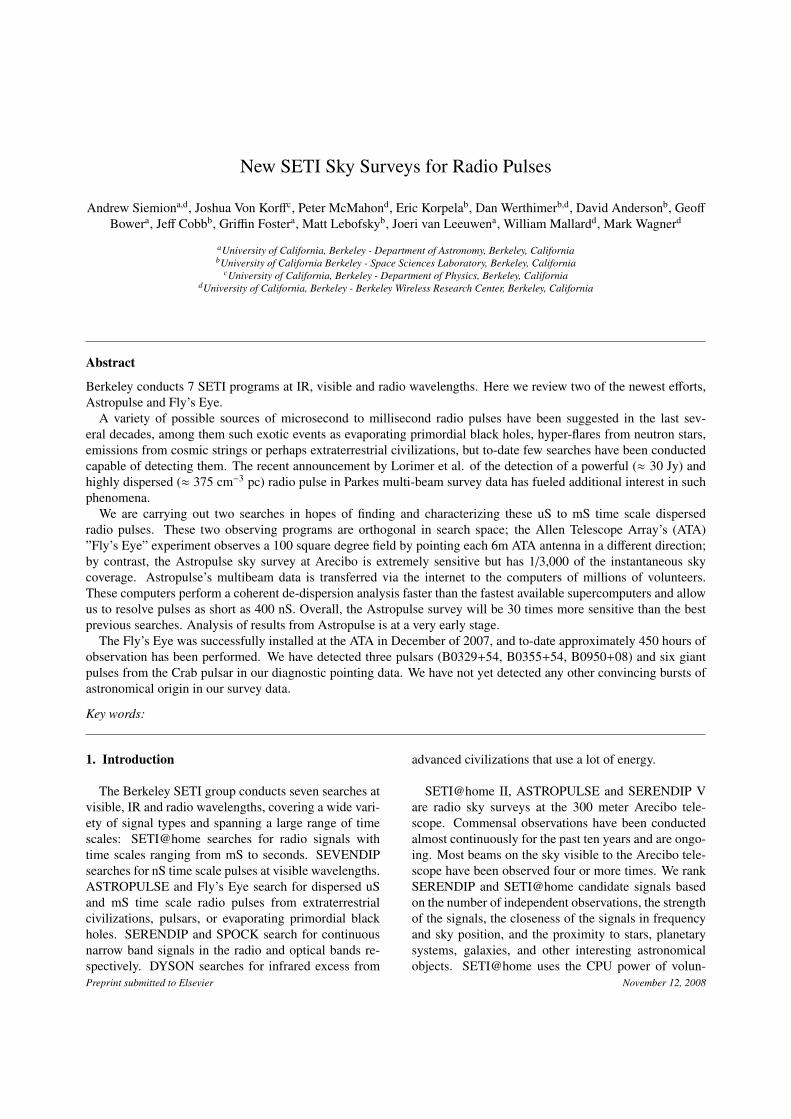
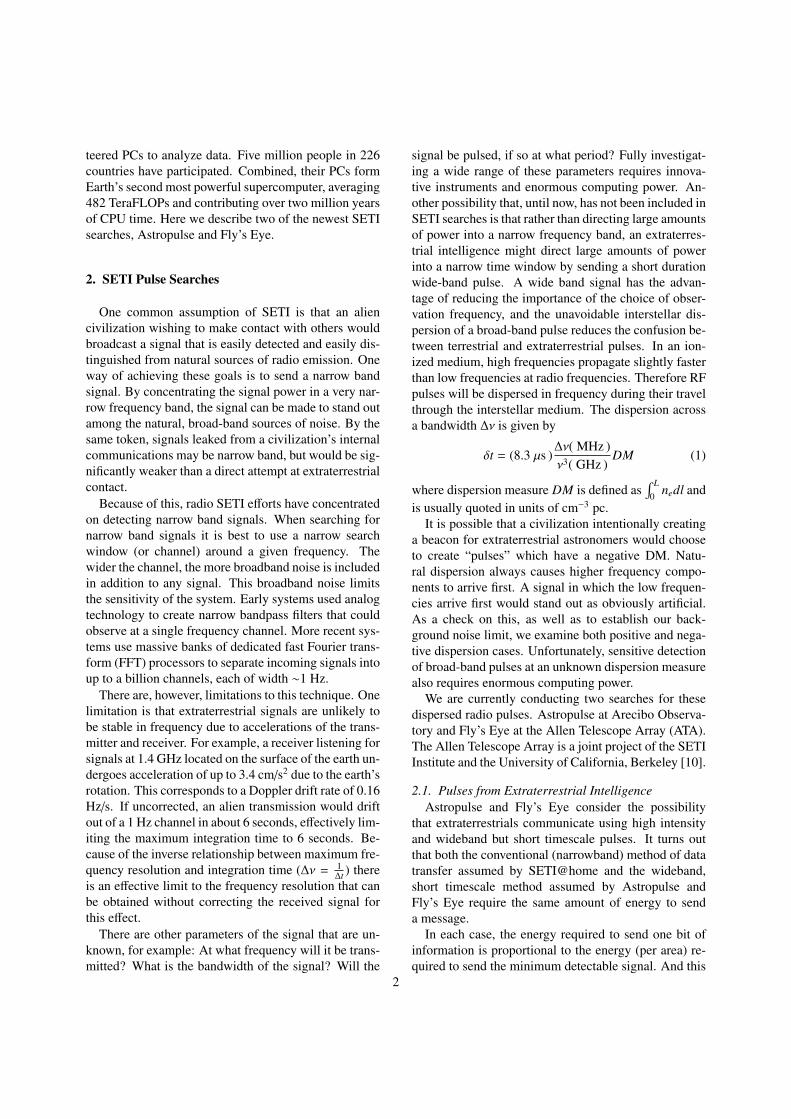
We have to-date performed roughly 400 hours of ob-serving with the Fly’s Eye. Figures 1 and 2 show thebeam pattern and sky coverage using all 42 antennas.
Figure 1: From [? ]. The beam pattern of the 42 beams at ATA,with the diameters equal to the half-power width. This hexagonalpacking is pointing north. A south pointing results in poor interferenceproperties, due to the highly populated areas south of the ATA.
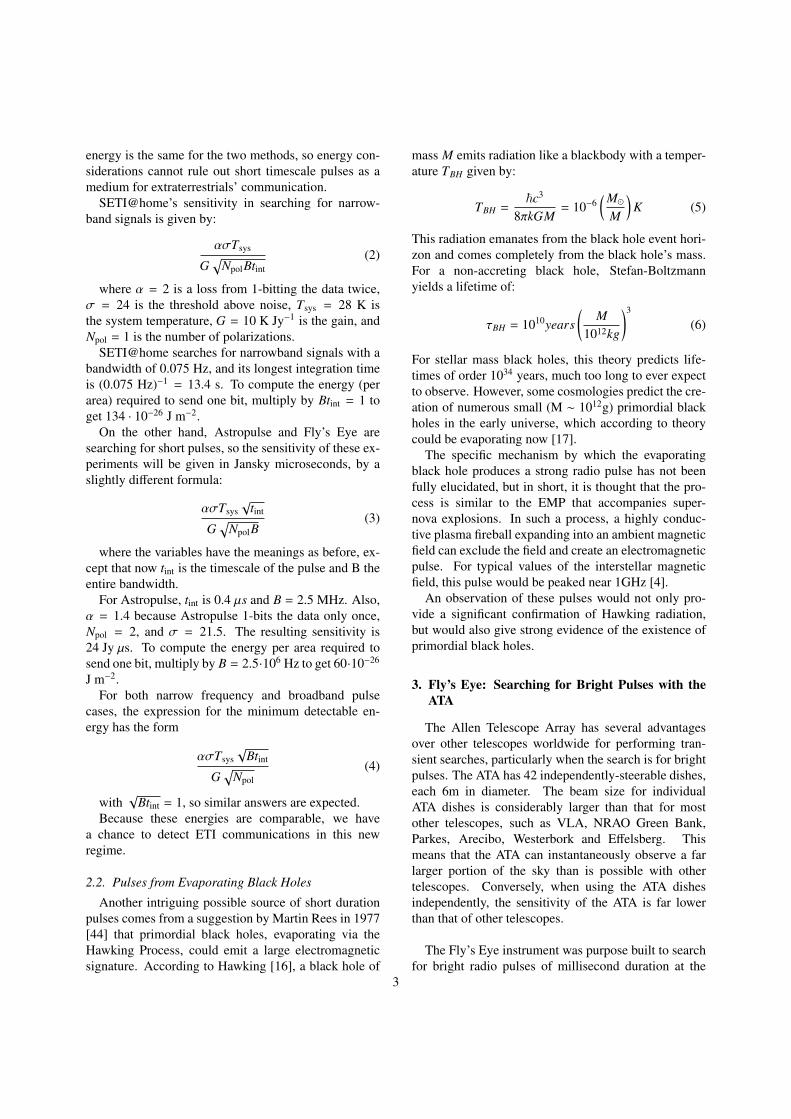
3.1. System ArchitectureThe overall architecture of the Fly’s Eye system is
shown in Figure 3. Each IBOB can digitize four ana-logue signals, and 11 IBOBs are provided so that 44 sig-nals can be processed. The ATA has 42 antennas, eachwith two polarization outputs. A selection2 of 44 of theavailable 84 signals is made, and these are connectedto the 44 iADC inputs. The IBOBs are connected to acontrol computer and a storage computer via a standardEthernet switch.
3.2. Fly’s Eye Offline ProcessingThe analysis required for the Fly’s Eye experiment
is, in principle, fairly simple – we wish to search over a
1Pulses of duration <0.625ms can also be detected provided thatthey are sufficiently bright, but their length cannot be determined witha precision greater than the single spectrum length.
2The selection is made with consideration for the goal of maximis-ing field-of-view – in practice we selected at least one polarizationsignal from every functioning antenna.
Figure 2: From [? ]. The sky coverage of the ATA for an observ-ing period of 24 hours. Both the coverages for southern and north-ern pointings (corresponding to the respective contiguous regions) areshown.
Figure 3: Fly’s Eye System Architecture. A selection of 44 analoguesignals from 42 dual polarization antennas are connected to 44 inde-pendent spectrometers implemented in 11 IBOBs.
4
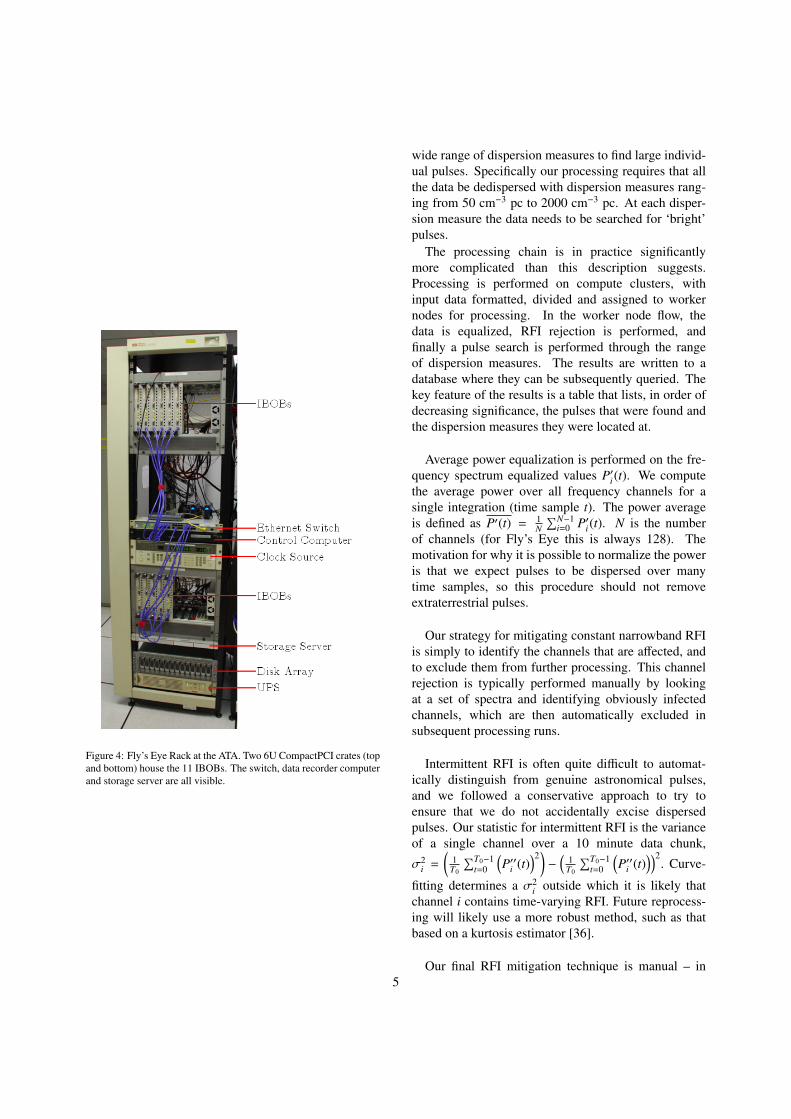
Figure 4: Fly’s Eye Rack at the ATA. Two 6U CompactPCI crates (topand bottom) house the 11 IBOBs. The switch, data recorder computerand storage server are all visible.
wide range of dispersion measures to find large individ-ual pulses. Specifically our processing requires that allthe data be dedispersed with dispersion measures rang-ing from 50 cm−3 pc to 2000 cm−3 pc. At each disper-sion measure the data needs to be searched for ‘bright’pulses.
The processing chain is in practice significantlymore complicated than this description suggests.Processing is performed on compute clusters, withinput data formatted, divided and assigned to workernodes for processing. In the worker node flow, thedata is equalized, RFI rejection is performed, andfinally a pulse search is performed through the rangeof dispersion measures. The results are written to adatabase where they can be subsequently queried. Thekey feature of the results is a table that lists, in order ofdecreasing significance, the pulses that were found andthe dispersion measures they were located at.
Average power equalization is performed on the fre-quency spectrum equalized values P′i(t). We computethe average power over all frequency channels for asingle integration (time sample t). The power averageis defined as P′(t) = 1
N∑N−1
i=0 P′i(t). N is the numberof channels (for Fly’s Eye this is always 128). Themotivation for why it is possible to normalize the poweris that we expect pulses to be dispersed over manytime samples, so this procedure should not removeextraterrestrial pulses.
Our strategy for mitigating constant narrowband RFIis simply to identify the channels that are affected, andto exclude them from further processing. This channelrejection is typically performed manually by lookingat a set of spectra and identifying obviously infectedchannels, which are then automatically excluded insubsequent processing runs.
Intermittent RFI is often quite difficult to automat-ically distinguish from genuine astronomical pulses,and we followed a conservative approach to try toensure that we do not accidentally excise dispersedpulses. Our statistic for intermittent RFI is the varianceof a single channel over a 10 minute data chunk,
σ2i =
(1
T0
∑T0−1t=0
(P′′i (t)
)2)−
(1
T0
∑T0−1t=0
(P′′i (t)
))2. Curve-
fitting determines a σ2i outside which it is likely that
channel i contains time-varying RFI. Future reprocess-ing will likely use a more robust method, such as thatbased on a kurtosis estimator [36].
Our final RFI mitigation technique is manual – in5
our results it is easy to see high-σ hits that are a resultof RFI: these hits appear as simultaneous detections atmany dispersion measures.
3.3. Detection of Giant Pulses from the Crab Nebula
A suitable test of transient detection capability isto observe the Crab pulsar and attempt to detect giantpulses from it.
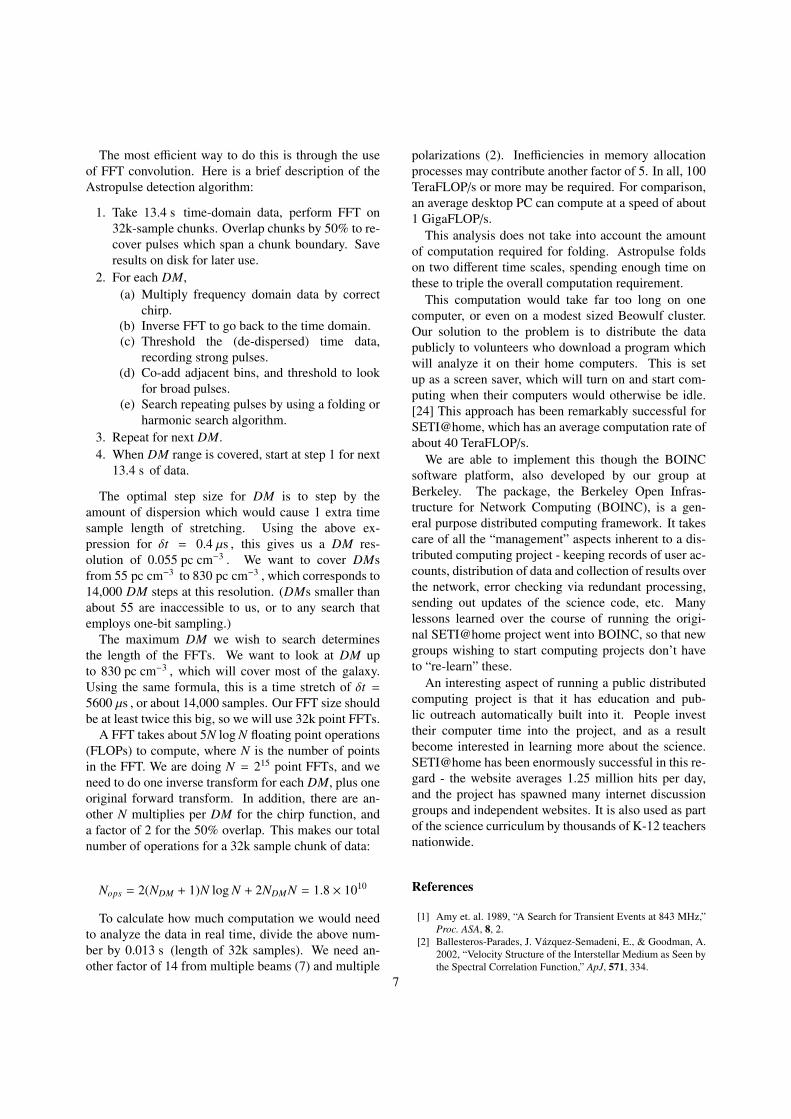
Figure 5 shows a diagnostic plot generated from aone-hour Crab observation. The data is an incoherentlysummed set from the 35 best inputs. The diagnosticplot was generated after the raw data had been dedis-persed using a range of dispersion measures from 5to 200. The Crab pulsar has dispersion measure ≈ 57cm−3 pc, so three giant pulses from the Crab pulsarcan be easily identified in the lower plot. The giantpulses appear only at the expected dispersion measure,whereas wideband RFI appears across a wide range ofdispersion measures.
Figure 5: Diagnostics on data taken from the Crab pulsar in a 60-minute observation conducted on 22 December 2007. The data wasdedispersed using dispersion measures ranging from 0 to 200 cm−3
pc. Top-left: single-pulse SNR histogram. Top-centre: noise appearsat all DMs, but bright pulses (SNR> 7) from the Crab correctly appearat DM ≈ 57 cm−3 pc. Top-right: inset of Figure 6. Bottom: pulse de-tections plotted on the DM versus time plane. Higher SNR detectionsappear as larger circles. Three giant pulses from the Crab are clearlyvisible in this plot.
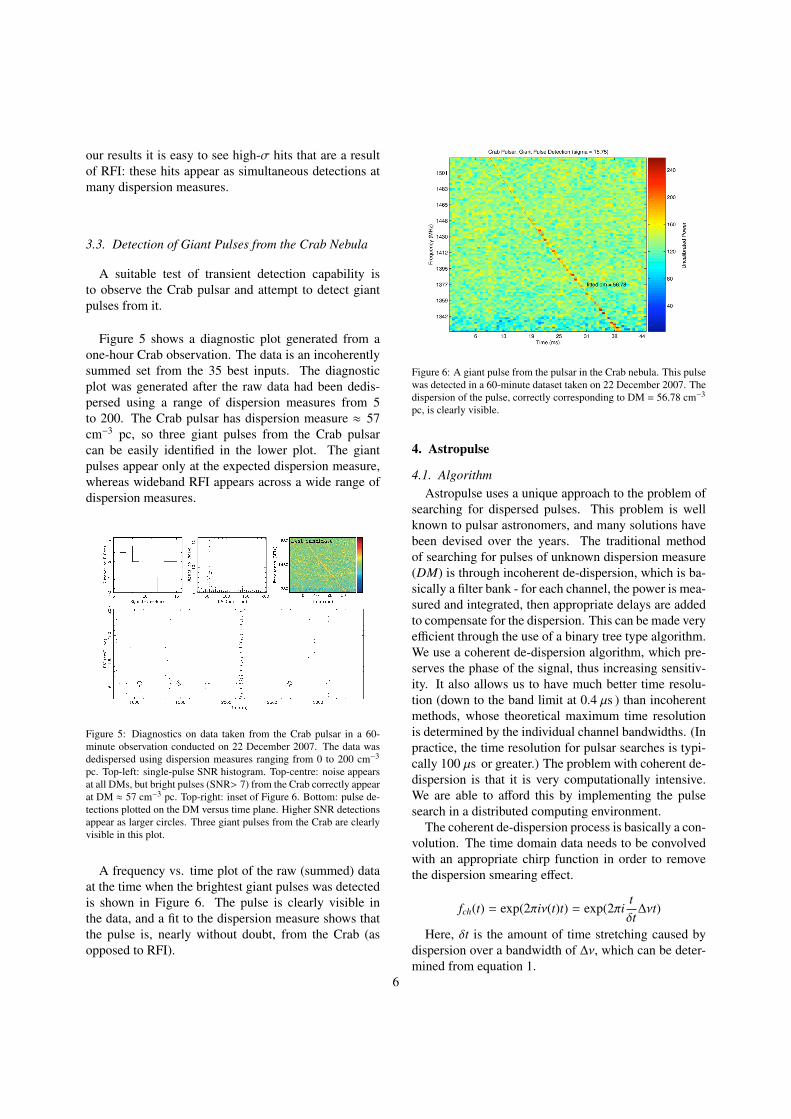
A frequency vs. time plot of the raw (summed) dataat the time when the brightest giant pulses was detectedis shown in Figure 6. The pulse is clearly visible inthe data, and a fit to the dispersion measure shows thatthe pulse is, nearly without doubt, from the Crab (asopposed to RFI).
Figure 6: A giant pulse from the pulsar in the Crab nebula. This pulsewas detected in a 60-minute dataset taken on 22 December 2007. Thedispersion of the pulse, correctly corresponding to DM = 56.78 cm−3
pc, is clearly visible.
4. Astropulse
4.1. AlgorithmAstropulse uses a unique approach to the problem of
searching for dispersed pulses. This problem is wellknown to pulsar astronomers, and many solutions havebeen devised over the years. The traditional methodof searching for pulses of unknown dispersion measure(DM) is through incoherent de-dispersion, which is ba-sically a filter bank - for each channel, the power is mea-sured and integrated, then appropriate delays are addedto compensate for the dispersion. This can be made veryefficient through the use of a binary tree type algorithm.We use a coherent de-dispersion algorithm, which pre-serves the phase of the signal, thus increasing sensitiv-ity. It also allows us to have much better time resolu-tion (down to the band limit at 0.4 µs ) than incoherentmethods, whose theoretical maximum time resolutionis determined by the individual channel bandwidths. (Inpractice, the time resolution for pulsar searches is typi-cally 100 µs or greater.) The problem with coherent de-dispersion is that it is very computationally intensive.We are able to afford this by implementing the pulsesearch in a distributed computing environment.
The coherent de-dispersion process is basically a con-volution. The time domain data needs to be convolvedwith an appropriate chirp function in order to removethe dispersion smearing effect.
fch(t) = exp(2πiν(t)t) = exp(2πitδt
∆νt)
Here, δt is the amount of time stretching caused bydispersion over a bandwidth of ∆ν, which can be deter-mined from equation 1.
6
The most efficient way to do this is through the useof FFT convolution. Here is a brief description of theAstropulse detection algorithm:
1. Take 13.4 s time-domain data, perform FFT on32k-sample chunks. Overlap chunks by 50% to re-cover pulses which span a chunk boundary. Saveresults on disk for later use.
2. For each DM,(a) Multiply frequency domain data by correct
chirp.(b) Inverse FFT to go back to the time domain.(c) Threshold the (de-dispersed) time data,
recording strong pulses.(d) Co-add adjacent bins, and threshold to look
for broad pulses.(e) Search repeating pulses by using a folding or
harmonic search algorithm.3. Repeat for next DM.4. When DM range is covered, start at step 1 for next
13.4 s of data.
The optimal step size for DM is to step by theamount of dispersion which would cause 1 extra timesample length of stretching. Using the above ex-pression for δt = 0.4 µs , this gives us a DM res-olution of 0.055 pc cm−3 . We want to cover DMsfrom 55 pc cm−3 to 830 pc cm−3 , which corresponds to14,000 DM steps at this resolution. (DMs smaller thanabout 55 are inaccessible to us, or to any search thatemploys one-bit sampling.)
The maximum DM we wish to search determinesthe length of the FFTs. We want to look at DM upto 830 pc cm−3 , which will cover most of the galaxy.Using the same formula, this is a time stretch of δt =
5600 µs , or about 14,000 samples. Our FFT size shouldbe at least twice this big, so we will use 32k point FFTs.
A FFT takes about 5N log N floating point operations(FLOPs) to compute, where N is the number of pointsin the FFT. We are doing N = 215 point FFTs, and weneed to do one inverse transform for each DM, plus oneoriginal forward transform. In addition, there are an-other N multiplies per DM for the chirp function, anda factor of 2 for the 50% overlap. This makes our totalnumber of operations for a 32k sample chunk of data:
Nops = 2(NDM + 1)N log N + 2NDMN = 1.8 × 10¹⁰
To calculate how much computation we would needto analyze the data in real time, divide the above num-ber by 0.013 s (length of 32k samples). We need an-other factor of 14 from multiple beams (7) and multiple
polarizations (2). Inefficiencies in memory allocationprocesses may contribute another factor of 5. In all, 100TeraFLOP/s or more may be required. For comparison,an average desktop PC can compute at a speed of about1 GigaFLOP/s.
This analysis does not take into account the amountof computation required for folding. Astropulse foldson two different time scales, spending enough time onthese to triple the overall computation requirement.
This computation would take far too long on onecomputer, or even on a modest sized Beowulf cluster.Our solution to the problem is to distribute the datapublicly to volunteers who download a program whichwill analyze it on their home computers. This is setup as a screen saver, which will turn on and start com-puting when their computers would otherwise be idle.[24] This approach has been remarkably successful forSETI@home, which has an average computation rate ofabout 40 TeraFLOP/s.
We are able to implement this though the BOINCsoftware platform, also developed by our group atBerkeley. The package, the Berkeley Open Infras-tructure for Network Computing (BOINC), is a gen-eral purpose distributed computing framework. It takescare of all the “management” aspects inherent to a dis-tributed computing project - keeping records of user ac-counts, distribution of data and collection of results overthe network, error checking via redundant processing,sending out updates of the science code, etc. Manylessons learned over the course of running the origi-nal SETI@home project went into BOINC, so that newgroups wishing to start computing projects don’t haveto “re-learn” these.
An interesting aspect of running a public distributedcomputing project is that it has education and pub-lic outreach automatically built into it. People investtheir computer time into the project, and as a resultbecome interested in learning more about the science.SETI@home has been enormously successful in this re-gard - the website averages 1.25 million hits per day,and the project has spawned many internet discussiongroups and independent websites. It is also used as partof the science curriculum by thousands of K-12 teachersnationwide.
References
[1] Amy et. al. 1989, “A Search for Transient Events at 843 MHz,”Proc. ASA, 8, 2.
[2] Ballesteros-Parades, J. Vazquez-Semadeni, E., & Goodman, A.2002, “Velocity Structure of the Interstellar Medium as Seen bythe Spectral Correlation Function,” ApJ, 571, 334.
7

[3] Benjamin, R.A., & Danly, L. 1997, “High-Velocity Rain: TheTerminal Velocity Model of Galactic Infall,” ApJ, 481, 764.
[4] Blandford, R. D. 1977, “Spectrum of a radio pulse from an ex-ploding black hole,” MNRAS, 181, 489
[5] Cognard, I., Shrauner, J. A., Taylor, J. H., & Thorsett, S. E.1996, “Giant Radio Pulses from a Millisecond Pulsar,” ApJ, 457,L81.
[6] Cook, G.B., Shapiro, S.L, & Teukolsky, S.A. 1994, “RecyclingPulsars to Millisecond Periods in General Relativity,” ApJ, 423,L117.
[7] Cordes, J.M., Weisberg, J.M., & Boriakoff, V. 1985, “Small-scale electron density turbulence in the interstellar medium,”ApJ, 288, 221.
[8] Crawford, F., Kaspi, V.M., & Bell, J.F. 2000, “A Search for Sub-millisecond Pulsations in Unidentified FIRST and NVSS RadioSources,” ASP Conf. Ser., 202, 31.
[9] D’Amico, N. 2000, “The Bologna submillisecond pulsar sur-vey,” ASP Conf. Ser., 202, 27.
[10] D. Deboer et al. 2004 Experimental Astronomy 17:1934Springer 2005
[11] Dewey, R.J., Taylor, J.H., Weisberg, J.M., & Stokes, G.H. 1985,“A search for low-luminosity pulsars,” ApJ, 294, L25.
[12] Dickey, J.M. et al. 2000, “The Southern Galactic Plane Survey,”APS Conf. Ser., 217, 370.
[13] Edwards, R.T., van Straten, W., & Bailes, M. 2001, “A Searchfor Submillisecond Pulsars,” ApJ, 560, 365.
[14] Gaensler, B. M., Dickey, John M., McClure-Griffiths, N. M.,Green, A. J., Wieringa, M. H., & Haynes, R. F. 2001, “RadioPolarization from the Inner Galaxy at Arcminute Resolution,”ApJ, 549, 959.
[15] Hankins, T. 2000, “Giant Pulses from the Crab Pulsar,” ASPConf. Ser., 202, 165.
[16] Hawking, S. 1974, “Black hole explosions?” Nature, 248, 30.[17] Hawking, S. 1971 “Gravitationally collapsed objects of very low
mass,” MNRAS, 152, 75.[18] Heiles, C., Haffner, L, & Reynolds, R.J. 1999, “The Eridanus
Superbubble in its Multiwavelength Glory,” ASP Conf. Ser., 169,211.
[19] Katz, Hewitt. 2003, “A Search for Transient Astronomical RadioEmission,” Pub. Astr. Soc. Pac., 115, 675.
[20] Higgs, L.A. 1999, “The Canadian Galactic Plane Survey:Atomic Hydrogen Observations,” ASP Conf. Ser., 168, 15.
[21] Hjellming, R. 2000, “Radio Astronomy” in Allen’s Astrophysi-cal Quantities, ed. A. Cox (New York: AIP), 121.
[22] Kinkhabwala A., & Thorsett, S.E. 2000, “Multifrequency Ob-servations of Giant Radio Pulses from the Millisecond PulsarB1937+21,” ApJ, 535, 365.
[23] Korpela, E.J., et al. 2002, “The SPEAR Science Payload,” Proc.SPIE, 4854, in press.
[24] Korpela, E., Werthimer, D., Anderson, D., Cobb, J., & Lebofsky,M. 2001, “SETI@home - Massively Distributed Computing forSETI,” Computing in Science and Engineering, 3, 79.
[25] Korpela, E.J., Bowyer, S, & Edelstein, J. 1998, “Spectral Obser-vations of Diffuse Far-Ultraviolet Emission from the Hot Phaseof the Interstellar Medium with the Diffuse Ultraviolet Experi-ment,” ApJ, 495, 317.
[26] Kramer, M., Xilouris, K.M., Lorimer, D., Doroshenko, O., Jess-ner, A., Wielebinski, R., Wolszczan, A. & Camilo, F. 1998, “TheCharacteristics of Millisecond Pulsar Emission. I. Spectra, PulseShapes, and the Beaming Fraction,” ApJ, 501, 270.
[27] S. Kulkarni, E. Ofek, J. Neill, M. Juric and Z. Zheng. GiantSparks at Cosmological Distances? preprint (2007).
[28] Lommen, A.N., Zepka, A., Backer, D.C., McLaughlin, M.,Cordes, J.M., Arzoumanian, Z., & Xilouris, K. 2000, “New Pul-sars from an Arecibo Drift Scan Search,” ApJ, 545, 1007.
[29] D. Lorimer, M. Bailes, M. McLaughlin, D. Narkevic and F.Crawford. A Bright Millisecond Radio Burst of ExtragalaticOrigin. Science, 318, pp. 777–780 (2007).
[30] Lorimer, D.R., Kramer, M., Muller, P., Wex, N., Jessner, A.,Lange, C., & Wielebinski, R. 2000, “A 1400-MHz pilot searchfor young pulsars,” A&A, 358, 169.
[31] Lorimer, D., Yates, J., Lyne, A., & Gould, D. 1995, “Multi-frequency flux density measurements of 280 pulsars,” MNRAS,273, 411.
[32] Manchester, R.N., et al. 2001, “The Parkes multi-beam pulsarsurvey - I. Observing and data analysis systems, discovery andtiming of 100 pulsars,” MNRAS, 328, 17.
[33] McLaughlin et. al. 2006, “Transient Radio Bursts from RotatingNeutron Stars,” Nature, 439, 817.
[34] McLaughlin, M., Cordes, J.M., & Arzoumanian, Z. 2000,“Searching for FAST Pulsars,” ASP Conf. Ser., 202, 41.
[35] Moffett, D. A. 1997, “High Frequency Radio Properties of theCrab Nebula Pulsar,” PhD. Thesis, New Mexico Inst. Miningand Technology.
[36] G. Nita, D. Gary, Z. Liu, G. Hurford and S. White. Radio Fre-quency Interference Excision Using Spectral-Domain Statistics.Publ. Astro. Soc. Pacific, 119, 857, 805–827 (2007).
[37] Norman, C.A. & Ikeuchi, S. 1989, “The disk-halo interaction -Superbubbles and the structure of the interstellar medium,” ApJ,345, 372.
[38] O’Sullivan, J.D., Ekers, R.D., Shaver, P.A. 1978 “Limits on cos-mic radio bursts with microsecond time scales,” Nature, 276,590.
[39] A. Parsons, D. Backer, C. Chang, et. al. PetaOp/Second FPGASignal Processing for SETI and Radio Astronomy. Proc. 10thAsilomar Conference on Signals, Systems and Computers, Pa-cific Grove, CA, November 2006.
[40] Phinney, S. & Taylor, J.H. 1979, “A sensitive search for radiopulses from primordial black holes and distant supernovae”, Na-ture, 277, 117.
[41] Possenti, A., Colpi, M., Geppert, U., Burderi, L., & D’Amico,N. 1999, “Recycling Neutron Stars to Ultrashort Periods: A Sta-tistical Analysis of Their Evolution in the µ-P Plane,” ApJS, 125,463.
[42] Ray, P., Deich, W., Kulkarni, S., Prince, T., Thorsett, S.,Vashisht, G., Wolzczan, A., & Backer, D.C. 1995, “Much adoabout nothing: Several large-area surveys for radio pulsars fromArecibo,” ApJ, 443, 265.
[43] G. Reber. Cosmic Static. Astrophysical Journal, 91, pp. 621(1940).
[44] Rees, M.J. 1977, “A better way of searching for black-hole ex-plosions?” Nature, 266, 333.
[45] Romani, R.W., & Johnston, S. 2001, “Giant Pulses from theMillisecond Pulsar B1821-24,” ApJ, 557, L93.
[46] Sallmen, S., Backer, D.C., Hankins, T.H., Moffett, D., & Lund-gren, S. 1999, “Simultaneous Dual-Frequency Observations ofGiant Pulses from the Crab Pulsar,” ApJ, 517, 460.
[47] Sallmen, S., & Backer, D.C. 1995, “Single Pulse Statistics forPSR 1534+12 and PSR 1937+21,” ASP Conf. Ser., 72, 340.
[48] Savage, B.D., et al. 2002, “Distribution and Kinematics of O VIin the Galactic Halo,” in press., astro-ph/0208140.
[49] Shelton, R.L., et al. 2001, “Observations of O VI Emission fromthe Diffuse Interstellar Medium,” ApJ, 560, 730.
[50] Shull, J.M., et al. 2000, “Far Ultraviolet Spectroscopic ExplorerObservations of Diffuse Interstellar Molecular Hydrogen,” ApJ,538, L73
[51] Staelin, D.H., & Reifenstein, E.C., III. 1968, “Pulsating RadioSources near the Crab Nebula,” Science, 162, 1481.
[52] Uyaniker, B. & Landecker, T.L. 2002, “A Highly Ordered Fara-day Rotation Structure in the Interstellar Medium,” ApJ, 575,
8

225.[53] Werthimer, D., Ng, D., Bowyer, S., and Donnelly, C. 1995, “The
Berkeley SETI Program: SERENDIP III and IV Instrumenta-tion,” ASP Conf. Ser., 74, 293.
9