new soil water tension sensors: the dihedral and ig sensor · topology. sensor modules were...
TRANSCRIPT

Carlos M. P. Vaz Adonai G. Calbo
New soil water tension sensors: the dihedral and IG sensor

Embrapa Agricultural Instrumentation
São$Carlos,$SP$

- Agriculture - soil management practices
- Irrigation
- Hydrological modeling - watershed and regional
- Drought forecasting modeling
- Landslide studies
- Weather station networks for Climate change studies
Monitoring soil water content

spaceborne
airborne
Soil water remote sensing
ground

Point sensors - Direct field instrumentation
Neutron probe
TDT#
TDR gypsum block
Capacitance, Inductance (FDR)

content, signal attenuation and bit error rate are minimal. The path loss is also influencedby depth of the WUSN.
In the authors’ test model, sensors are buried at depths of 0.8, 1, 1.6 and 2 m, whichimplies a large power source requirement. The UG nodes would have to expend a lot ofenergy in a single-hop to transmit data to the sink node located aboveground. Thus thenodes power sources could deplete quickly thereby shortening the network lifetime.
Kim et al. (2011) designed and developed a sensor network architecture using auton-omous robots with beacons to monitor and detect fires and air pollution in fields. Theauthors built a conceptual linear topology and implemented it in a tree-based networktopology. Sensor modules were developed using a RF transceiver with model numberCC2420, a single-chip 2.4 GHz IEEE 802.15.4 designed for low power and low voltagewireless applications by Texas Instruments, USA. Also, a micro controller with modelnumber ATMega128L by Atmel corporation, California, USA was used. The applicationwas to monitor the temperature, gas, smoke, humidity and illumination. The data collectedwas forwarded to a co-ordinator node every few seconds. Then, the co-ordinator sends thedata to a specific processor called a knowledge information processor for agriculture-sensor data and fire-sensor data (KIP-AF) which shows the measured values in real time.For any data that arrives at the KIP-AF, the server transmits an alert message to the enduser while using the ZigBee enabled SIM (ZSIM). Three types of nodes used in the schemewere the wireless co-ordinator (WC), the wireless router (WR), and the wireless end device(WED). The WC was the sink node and gateway, and it transmitted periodic beacon framesas well as collected data from the WRs and WEDs. The study used heterogeneous sensornodes made up of one co-ordinator node, eight routers or parent nodes and 50 sensor nodes(WED) and a tree-based network topology with a maximum of three hops. A conceptualnetwork topology that models the implementation architecture of the system is shown inFig. 4. All of the sensor nodes transmitted packets in every transmission interval to processemergency data. At every interval, all of the sensor nodes transmit their sensing data to the
Fig. 2 Architecture of the soil moisture real-time monitoring system (Zhang et al. 2012)
Precision Agric (2015) 16:216–238 225
123
Wireless sensor network
- Low cost sensors - Low energy consumption
- Little maintenance

! Technique!! Limitation! Range! Cost!Soil%water%con
tent% Neutron%probe% ionizing%rad.% dry6saturated% high%
TDR% complex% dry6saturated% high%TDT% design% dry6saturated% moderate%
FDR% salinity,%temperature% dry6saturated% moderate%
Dual%needle% relatively%new% dry6saturated% low%
Soil%water%poten
tial%
Tensiometer% maintenance% up%to%80%kPa% low%
Granular%Matrix%6%resistivity%
salinity,%temperature%lower%accuracy%
up%to%200%kPa% low%
Ceramic6FDR% calibration% dry6saturated% low%!
Soil water sensors

Sensor' Brand' Number'of'papers'90’' 00’' 10’' total'
Tensiometer* Home,made,*Irrometer* 8* 29* 27* 64'TDR* TDR100,*Trase,*1502* 1* 25* 24* 50'
FDR*Theta*Probe,*CS616,*Hydrosense,*5TE,*Diviner*2000,*MP,917,*Hydra*Probe,*Environscan,*Hydrofarm*
*0*
*20*
*14* 34'
Neutron*probe* CPN,*Troxler* 6* 12* 8* 26'Resistivity* Watermark,*Bouyoucos*Block* 1* 5* 5* 11'
!
Use of soil water sensors in Brazil
Developing new soil water sensors
- National, low cost sensors
- Greenhouse, garden
- Drip irrigation control
- Sensors for wireless network – site specific
irrigation (VRI)
- Technical tensiometers – Research

Irrigás
A.G. Calbo e W.L.C. Silva
Bragantia, Campinas, v.65, n.3, p.501-510, 2006
508
Figure 5. Soil water tension in which irrigas porous cups featuringdifferent Td values (bubbling pressure) became air permeable.
Figure 6. A- Typical trace for pressure as a function of timefor a 25 kPa E-design irrigas porous cup immersed in waterand subjected to an air-flow of 1.0 ml min-1. Circle (!) isfor a irrigas porous at an water tension adjusted to zeroand square (") for the same irrigas porous cup at a watertension adjusted to 5 kPa. B- Typical trace for air-flow asa function of the applied air-pressure for a 17 kPa irrigasporous cup from the same maker immersed in water.
Figure 7. Relative water content of three porous cups asa function of water tension. The desorption criticalwater tension (Td) of the cups are ! -15.4 kPa, " - 27.5kPa and !- 120 kPa.
Figure 7 illustrates the water loss of three porouscups, with different Td, as function of the soil watertension. It can be observed in Figure 7 that porous cupwith finer pores (higher Td) exchanges less water withthe soil as compared to porous cups with larger pores.This feature is much valuable because the soil hydraulicconductivity decreases very rapidly as the water tensionincreases. Moreover, the near saturated hydraulicconductivity condition remains in the sensor while thewater tension is lower than Td, which is a condition thatfavors rapid soil/porous cup water tension equilibrium.The porous cups used in this work featured a porosityranging from 20 to 35%. For these porous cups hydraulicconductivity is proportional to the square of the effectivepore radius, according to the Poiseuille equation (MOORE,1972). This radius could be estimated from Td (Eq. 1)and inferring from the modified Poiseuille equation, a12 kPa porous cup should be 100 times more waterpermeable than an conventional 120 kPa tensiometerporous cup, a fact which is already well known(MARSHALL, 1959), and that indicates that hydraulicequilibrium in the studied porous cups can be fast(minutes) due to the small water exchange required forthe irrigas sensor response (Figure 7).
Gas driven soil water tensiometer
Both desorption and sorption methods employedto estimate soil water tension as a function of the appliedgas pressure yielded nearly linear responses, as it isillustrated in a sorption case (Figure 8). In thisdifferential operation mode, the gas tensiometer (Figure4) is very convenient to operate, it is portable andmeasures water tension directly, eitherinstantaneously or continuously.
Bubbling#pressure#(kPa)#
Water#te
nsion#(kPa
)#

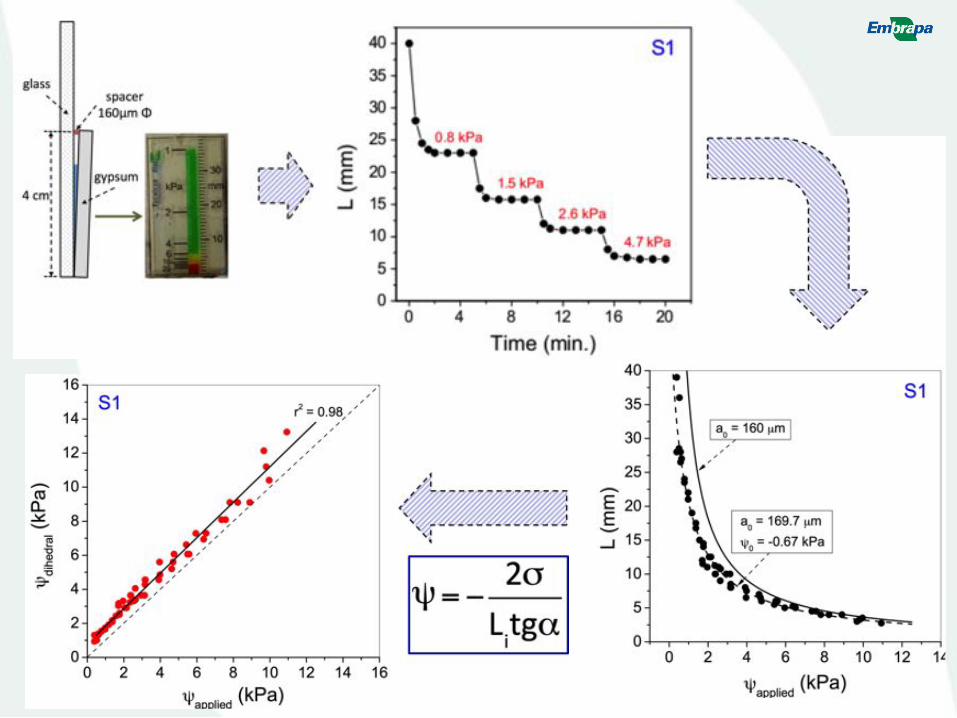
Dihedral tensiometer

Young-Laplace equation
R P0
Pi
θ"α"ri !
P0 −Pi =γ
R
!
R=ri
cos α+θ( )
(1)$
(2)$
!
Pi =−2γai
!
Pi =−cos α+θ( )γ
ri(3)$
(4)$
vertex
0 5 10 15 20 25 300
10
20
30
40
50
60
2mm1mm
0,5mm
h (c
mH
2O)
L (cm)
a0=0,1mm
tgα=a0/200 spacer (a0) tgα=a0/200)

a0
L=5cm

Dihedral tensiometer Publications
CALBO$A.G.$2011.$Dihedral$sensor$for$determining$tension,$potenAal$and$acAvity$of$liquids.$Brazilian$Agricultural$Research$CorporaAon.$Patent#number:$WO$2011/079367$A1$$VAZ,$C.M.P.,$A.G.$CALBO,$L.F.$PORTO,$L.H.$PORTO.$2013.$Principles$and$applicaAons$of$a$new$class$of$soil$water$matric$potenAal$sensors:$the$dihedral$tensiometer.$Procedia#Environmental#Sciences,$19:484X493$$VAZ,$C.M.P.,$A.G.$CALBO,$L.F.$PORTO.$2012.$EvaluaAon$of$a$portable$dihedral$tensiometer$designed$to$measure$water$tension$in$substrates.$SSSA$InternaAonal$Annual$MeeAng,$Tampa,$FL$$VAZ,$C.M.P.,$A.G.$CALBO,$L.F.$PORTO.$2012.$Measuring$soil$water$tension$with$a$staAonary$dihedral$tensiometer:$Principles$and$applicaAons.$SSSA$InternaAonal$Annual$MeeAng,$Tampa,$FL$


!
0 4 8 12 16 200
5
10
15
20
25
30
35
40 S1
4.7 kPa
2.6 kPa
1.5 kPa
L i (mm
)
Time (min.)
0.8 kPa
0 10 20 30 40 500
5
10
15
20
25
30
35
40 S2
10.3 kPa
5.9 kPa
3.9 kPa
2.5 kPa
L i (mm
)Time (min.)
1.5 kPa
0 10 20 30 40 50 600
5
10
15
20
25
30
35
40 S3
32.5 kPa
19.2 kPa
11.2 kPa
L i (mm
)
Time (min.)
6.6 kPa
0 40 80 120 1605
10
15
20
25
30
18.6 kPa
13.1 kPa
8.6 kPa
L i (mm
)
Time (min.)0 10 20 30 40 50
0
5
10
15
20
25
30
35
40
L (m
m)
ψapplied (kPa)
0 10 20 30 40 500
10
20
30
40
50
ψdi
hedr
al (k
Pa)
ψapplied (kPa)
RMSD = 1.4 kPa


Summary and Conclusions
- Easy construction and test
- Low cost sensors
- Relatively large range of WP measurements
- Relatively fast response time (5-40 min.)
- No air cavitation problems (low maintenance)
- Effect of colloids and salts on the glass surface
- Effect of temperature and salinity (contact angle)
- Visual (electric, optics, pneumatic transduction)
- Most glue or resin are water soluble

IG - Light reflection on glass beads sensor
LED PT
glass beads
light
volt
ag
e
water tension vo
lta
ge

IG - Light reflection on glass beads sensor
!!
!! porous cup
glass beads
lid
LED
phototransistor
Electronic circuit board
IG sensor Publications
CALBO,$A.G.,$C.M.P.$VAZ,$W.A.$MAROUELLI,$L.F.$PORTO.$2013.$Water$tension$sensor,$system$for$characterizing$and$conAnuously$measuring$soil$water,$system$for$indicaAng$criAcal$soil$water$tension$and$irrigaAon$rod.$Patent#number:$WO$2014172765$A1.$2$$CALBO,$A.G.,$C.M.P.$VAZ,$L.F.$PORTO.$2014.$A$porous$cup$sensor$to$measure$soil$water$tension$by$light$reflecAon.$SSSA$InternaAonal$Annual$MeeAng,$Long$Beach,$CA$$CALBO,$A.G.,$C.M.P.$VAZ,$L.F.$PORTO.$2014.$Sensor$de$água$no$solo$por$reflexão$de$luz$em$Pparcculas$de$vidro$com$granulometria$controlada.$Simpósio$Nacional$de$Instrumentação$Agropecuário,$SIAGRO$2104,$São$Carlos,$SP$$$

0 20 40 60 80 100
3.5
4.0
4.5
5.0
5.5
6.0
6.5
6533
17 kPa
9 kPa
5 kPa
3 kPa
sens
or (v
olts
)
tempo (min.)
1 kPa
200-250 µm
0 10 20 30 40 50 60 70 803
4
5
6
7
200-250 µm
sens
or (v
olts
)
tensao da agua (kPa)
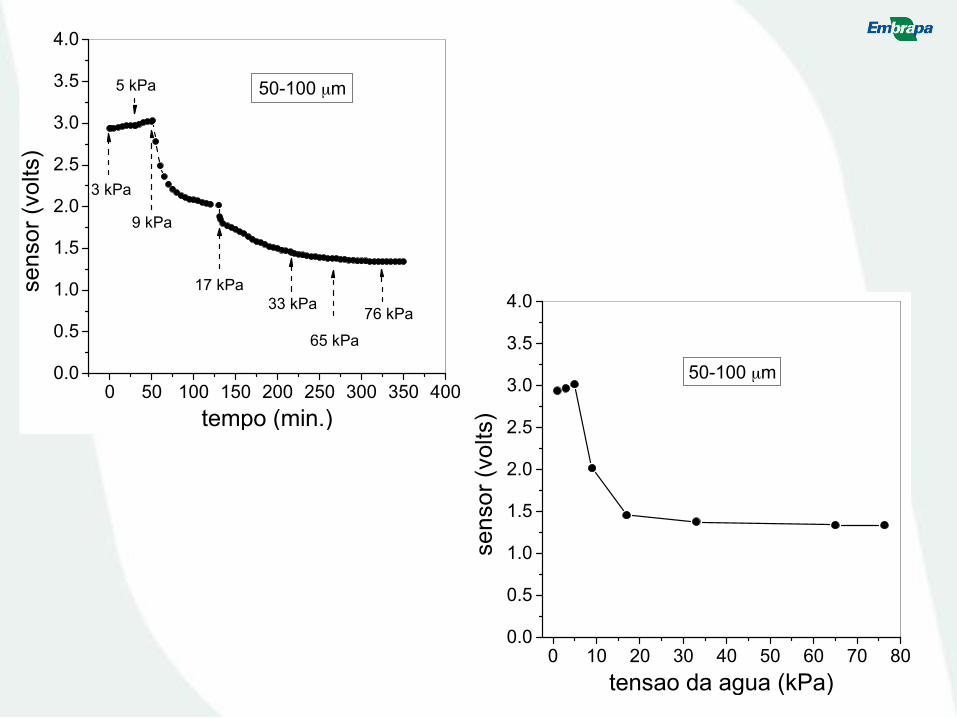
0 50 100 150 200 250 300 350 4000.0
0.5
1.0
1.5
2.0
2.5
3.0
3.5
4.0
76 kPa
65 kPa
33 kPa17 kPa
9 kPa
5 kPa
3 kPa
sens
or (v
olts
)
tempo (min.)
50-100 µm
0 10 20 30 40 50 60 70 800.0
0.5
1.0
1.5
2.0
2.5
3.0
3.5
4.0
50-100 µm
sens
or (v
olts
)
tensao da agua (kPa)
0 50 100 150 200 250 300 350 4000.0
0.5
1.0
1.5
2.0
2.5
3.0
3.5
4.0
76 kPa
65 kPa
33 kPa17 kPa
9 kPa
5 kPa
3 kPa
sens
or (v
olts
)
tempo (min.)
50-100 µm
0 10 20 30 40 50 60 70 800.0
0.5
1.0
1.5
2.0
2.5
3.0
3.5
4.0
50-100 µm
sens
or (v
olts
)
tensao da agua (kPa)

0 20 40 60 80 100 120 1409.5
9.6
9.7
9.8
9.9
87 kPa65 kPa
17 kPa
33 kPa
5 kPa
3 kPase
nsor
(vol
ts)
tempo (min.)
9 kPa
< 50 µm
0 20 40 60 809.5
9.6
9.7
9.8
9.9
< 50 µm
sens
or (v
olts
)
potencial da agua (kPa)
76 kPa
0 20 40 60 80 100 120 1409.5
9.6
9.7
9.8
9.9
87 kPa65 kPa
17 kPa
33 kPa
5 kPa
3 kPa
sens
or (v
olts
)
tempo (min.)
9 kPa
< 50 µm
0 20 40 60 809.5
9.6
9.7
9.8
9.9
< 50 µm
sens
or (v
olts
)
potencial da agua (kPa)
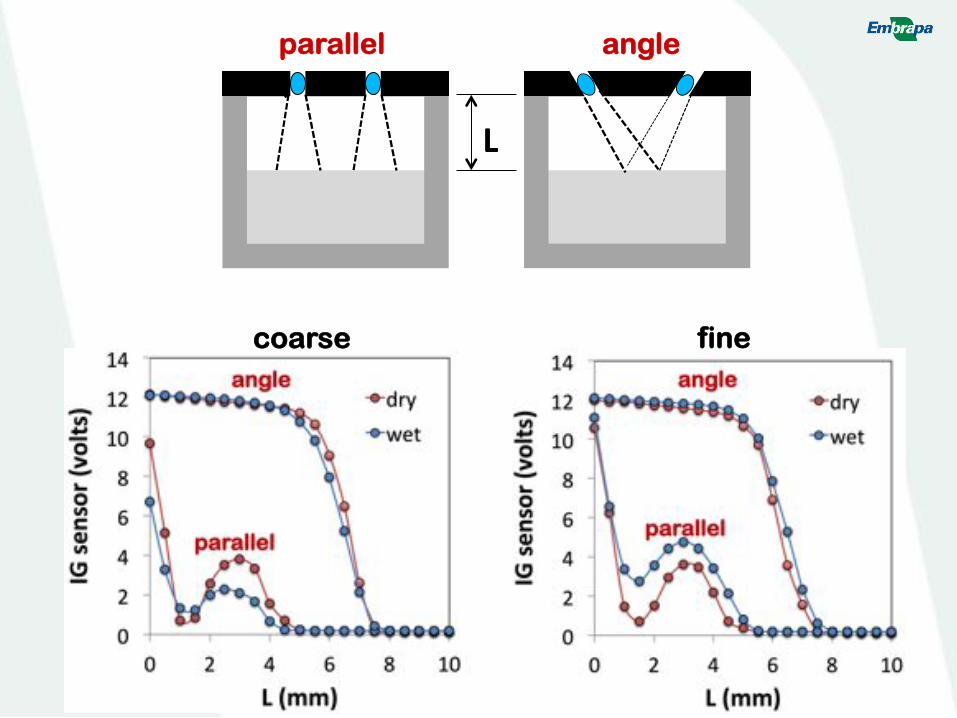
parallel angle
L#
coarse fine

How to bind the GB particles?
- Sintering (600 °C) - Sodium silicate (300 °C)
+ Na2(SiO2)nO
Waterglass Liquid glass
+
300 °C, 30 min.
dry
wet
Surface smoothed with fine sand paper

Measurements in soil
mixture MX1 (coarse) 250-200 μm (20%) 200-150 μm (20%) 150-100 μm (20%) 100 - 50 μm (20%) < 50 μm (20%) < 50 μm (fine) 10-50 μm (98%) < 10 μm (2%)


tensiometer
IG sensor
TDR voltmeter
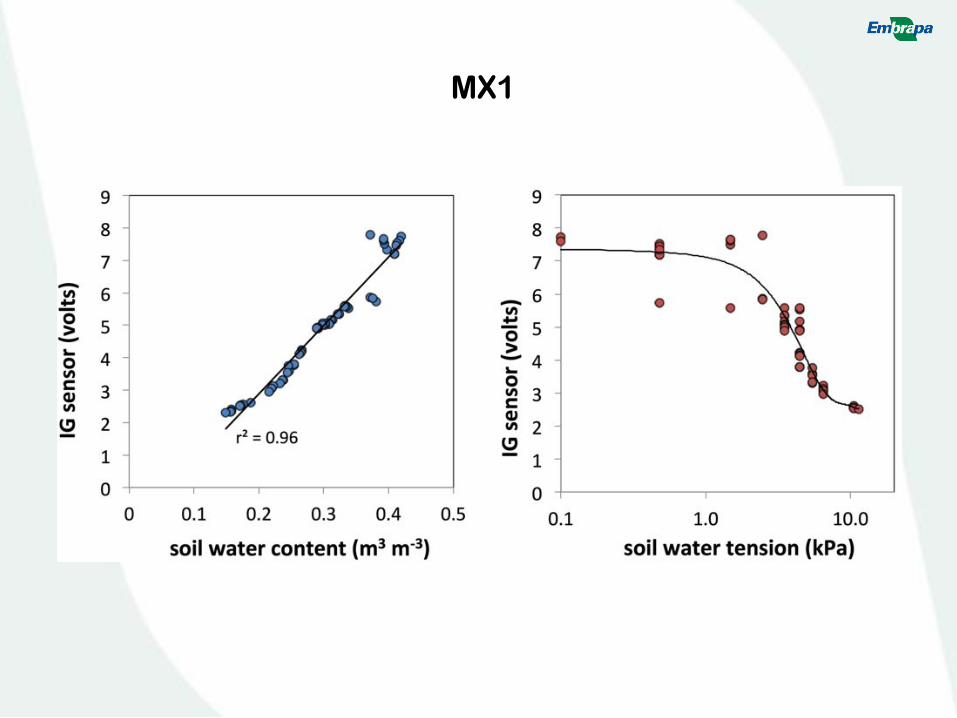
MX1
MX1

IG voltage vs WC/WP inside the sensor

IG voltage vs WC/WP - MX1
4"
5"
6"
7"
8"
0" 20" 40" 60" 80" 100"
IG#se
nsor#(volts)#
Time#(min.)#
0"
0.1"
0.2"
0.3"
0.4"
0" 20" 40" 60" 80" 100"
water&con
tent&(m
3 &m-3)&
Time&(min)&
4"
4.5"
5"
5.5"
6"
6.5"
0" 5" 10" 15" 20"
IG#se
nsor#(volts)#
water#tension#(kPa)#
4"
4.5"
5"
5.5"
6"
6.5"
0" 0.1" 0.2" 0.3" 0.4"
IG#se
nsor#(volts)#
water#content#(m3#m33)#

- Evaluate finer mixtures (< 50 μm and finer) in soils
- Test reproducibility
- Improve sensor design:
GB
glass plate
GB
resin
- Test infrared LED (near and short wavelength: 0.75-3μm)
- Evaluate transmission mode:
NEXT STEPS
GB glass plate
