new teachers for colombia: is quality control working?
TRANSCRIPT

New Teachers for Colombia: Is Quality Control Working?
Zelda Brutti∗ Fabio Sánchez Torres†
This version: May 2016
Abstract
In 2002 the career of Colombian public school teachers was significantly reformed through
the introduction of a selective entry competition and of further quality incentives. This paper
estimates how the new quality-screened teachers impact students’ high school performance. We
exploit the fact that the novel regulation applied only to newly hired teachers, whereas those al-
ready in office in 2002 remained exempt, creating a mix of New-Regulation and Old-Regulation
teachers in Colombian schools. Using data at the school-year-subject level, we eliminate any
school-level confounders and associate the proportion of New-Regulation teachers to the varia-
tion in student test scores. We pin down a positive and significant, although not very large, effect
of New Regulation teachers on student performance. New Regulation teachers have decreasing
marginal returns, are more effective in larger schools and when surrounded by colleagues hold-
ing postgraduate degrees. We also document that the enforcement of the New Regulation has
been somewhat unsatisfactory, since in the period 2008-2013 around 30% of all New Regulation
teachers are employed in temporary positions without having passed the compulsory entry exam.
These teachers have lower and less robust impacts on student performance.
∗European University Institute - [email protected]†Universidad de Los Andes and CEDE - [email protected]
1

1 Introduction and motivation
The opening words of the 2016 OECD report on Colombian education read ‘Colombia has made
education a main priority to improve the economic and social prosperity of the country and pledged
more resources to this sector than any other policy area’ [OECD, 2016]. Indeed, over the past two
decades the country has been transforming its education system on several aspects, and in this paper
we are focusing on the quality assurance mechanisms that have been introduced to the teaching
profession in 2002 in the effort of improving its standards.
Teacher hiring systems that feature competition on skills, such as national entry exams and
performance rankings, may by now be common in the Western world but much less so in Latin
America, Asia and Africa. Before the reform, in Colombia the career of public teacher was open to any
candidate possessing the citizenship and given levels of education. The appointment of candidates into
the open vacancies followed opaque evaluation processes, and once entered the career, salary and rank
upgrades were based on seniority. This system lent itself to dynamics of corruption and clientelism
[Duarte, 2001], beyond not creating any incentives for individuals to invest in their teaching skills
and subject knowledge. Sadly, this type of structure is still common in many developing countries
around the world1, making policy advice and careful reform evaluation in this context particularly
urgent.
This paper analyzes the consequences of the introduction of a broad set of quality controls to the
public teacher profession in Colombia. The quality controls can be summarized by (1) a public entry
contest, that establishes the order in which candidates will choose vacancies 2) a probation period
of 4 to 12 months, which confirms the appointment to the vacancies upon successful completion 3)
continuous evaluation along the career, with yearly performance reports by the school headmaster,
that can result in termination of the employment if unsatisfactory 4) salary upgrades being made
conditional on skills evaluations, which are carried out through a written examination. We measure
the impact of the reform on student performance at high school level, and find that bringing the
1We found many similarities between the pre-reform Colombian context and the current ones in many LatinAmerican countries, such as Chile, Argentina, Brazil, Venezuela, Peru, Nicaragua, El Salvador and Panama’. Forsimilar contexts in South Asia and the rest of the world, find discussions and details in Murillo et al. [2007], Hanushek[2009] and Hanushek and Woessmann [2012].
2

share of New Regulation teachers from 0 to 1 in a given school year and subject increases the average
performance of students by about 6% of a standard deviation.
We further explore heterogeneities in the effect across teacher and school characteristics. We
find that the marginal effect of New Regulation teachers reaches more than double the average
magnitude when the share of these teachers is still low (< 20%) in a given school year and subject:
in other words, marginal returns are initially high and then decreasing. The effect of new teachers
also depends positively on the number of colleagues in the year and subject, and on the share of
postgraduate-holding colleagues. We are not able to pin down any significant relationship between
the effect of New Regulation teachers on student performance and the average entry contest score of
these teachers.
We also examine teacher retention patterns in the education system, and conclude that the
professional incentive framework seems to be working partially, as having a postgraduate degree
and scoring higher in the entry test is associated with longer permanence in the system, but the very
top-scorers are observed dropping out faster than the median ones, suggesting a lower attractiveness
of the profession for such teachers.
Finally, our empirical analysis suggests that loopholes in the new legislation may have allowed
a conspicuous fraction of teachers to evade some of the quality assurance provisions, by teaching
under the status of “temporaries” without having entered the career through the regular path. These
teachers have a lower and less robust effect on student performance.
The next section briefly reviews the closest related works; Section 3 gives a thorough description of
the most important aspects of the 2002 reform; Section 4 describes the data we use; Section 5 details
the empirical strategy employed; Section 6 illustrates and discusses results, followed by concluding
remarks in Section 10.
2 Closely related literature
This paper contributes to the flourishing literature on teacher quality, which divides into several
themes: assessing how much of the variation in student outcomes is explained by the teacher effect
3
2; understanding which teacher characteristics make teachers better 3; understanding which type of
policies and interventions are effective in making teachers better or attracting and retaining better
teachers4. The answer to our main exercise, quantifying the impact of New Regulation teachers on
student performance, shall provide a reference point about the effectiveness of reforms such as the
Colombian one5 in providing better teachers. The results of our secondary analyses on heterogeneity
and retention patterns help towards understanding the channels of the reform effect, and suggests
which types of teachers may find the profession appealing under a framework such as the Colombian
one.
Closest to this paper both in scope and methodology we found work by Ome(2013, 2012), who
also uses a fixed effects methodology to estimate the impact of the Colombian teacher career reform
on primary and high school test scores. He uses three years of data on teacher records and student
scores (2002, 2008 and 2009); he exploits within-school, across-year variation in the share of new-
regulation teachers to identify the effect of the new teachers. While pinning down positive effects at
primary school level and on student dropout rates, he finds no effect of the New Regulation teachers
on test scores at high school level. We think that the little amount of within-school variation in
teacher composition across the three years might be the reason for the negative finding (low testing
power).
3 The 2002 reform of the teacher career
3.1 Pre-reform situation and reasons for the reform
Before 2002, the teaching profession in Colombia was regulated by Decree 2277 of year 1979, and
successive modifications. The appointment and transfers of teachers were considered administrative
2See for example Chetty et al. [2014], Rivkin et al. [2005], Rockoff [2005] and, for an excellent review, Hanushekand Rivkin [2012].
3For example Rockoff et al. [2011], Kane et al. [2008], Gordon et al. [2006]4For example Hanushek et al. [2004], Figlio [2001]5in a context similar to pre-reform Colombia, which is characteristic still today of many countries in Latin America,
see footnote 1.
4

acts, and thus the responsibility of department governors and/or mayors6. There were requirements
on the education levels for teachers at the different school grades. The scheme for career upgrades
was based on combinations of years of service, education level and attendance of training workshops.
Finally, teachers were guaranteed to remain in service until retirement age except in cases of ascer-
tained severe misconduct7. Overall, the legal framework was characterized by very little transparency
in procedures, excessive protection of employed teachers, and lack of incentives towards the improve-
ment of skills and teaching performance. Clientelism and politicization of teacher appointments were
substantial and well-known issues; far too often public schools were used as ‘placement pools’ for rel-
atives and connections of influent personalities (see excellent descriptions and discussions in Duarte
[2001] and Duarte [2003]).
3.2 The new public contest procedure
Teachers that have been entering the profession from January 1st 2002 onwards have to go through
a public contest procedure in order to be assigned a vacancy. Contests are called separately for each
education authority (department or certified municipality) and specify the vacancies available on
their territories, and candidates must choose the one education authority they wish to apply to in
that year. The contest is based on a score system and serves the purpose of establishing a rank among
applicants, which determines the order in which successful candidates will be allowed to choose their
preferred vacancies. The stages of the contest and their corresponding weights are summarized in
Table 1; the subsequent subsections detail each stage further.
The exam
At the first stage of the contest, candidates sit an exam which is identical across the country and is
administered and evaluated centrally by governmental agencies8; it is structured into three modules
6See Art. 106 Ley 115 /19947Only in 1994 the law started to mention public contests as a desirable method of appointment of teachers, but
these never took place until the 2002 reform.8ICFES (Instituto Colombiano para la Evaluación de la Educación) and CNSC (Comisión Nacional del Servicio
Civil). The exam registration fee is below 9 USD (2012-2013 contest). The exam questions are elaborated by theNational University, the largest public university in Colombia.
5

Table 1: Stages of the entry contest
Purpose Use of scoreMinimumthreshold Weight in contest Responsibility
T* H*
ExamTeaching aptitude,subject knowledge
Eliminatoryand ranking
60% (T)70% (H) 55% 45% ICFES21
ExamPsychometric
test Ranking - 10% 10% ICFES
CVCredentialsevaluation Ranking - 20% 30%
CNSC10 ordelegate
InterviewBehavioralevaluation Ranking - 15% 15%
CNSC ordelegate
Note: * T = teachers; H = headmastersSource: MEN [2006]; MEN [2012]; GEARD [2013]
testing teaching aptitude, subject knowledge and psychometric values9. Candidates who do not
score a minimum of 60 /100 points on each of the three modules must exit the contest. For surviving
candidates, the exam stage will represent 65% of their global score (55% for school directors).
The evaluation of credentials
Scores are assigned to academic degrees, additional training courses, academic productions and pub-
lications, past experience, past teaching evaluations (where present) and career awards, according to
official tables set by CNSC10, the body in charge of this stage of the context. The credentials score
represents 20% of the total (30% for aspiring school directors).
9The ‘aptitudes’ module aims at assessing the candidate’s ability to appropriately deal with language and numbers,and his knowledge of basic pedagogical concepts. The second module evaluates proficiency and skills of the candidate inhis subject speciality. The psychometric test evaluates the candidate’s hypothetical responses when facing pedagogicalor institutional issues arising in the everyday teaching life.
10Comisión Nacional del Servicio Civil. It is an autonomous and independent body, located at the highest level inthe structure of the Colombian State. It has legal identity and administrative, financial and managerial independence,and it is not part of any sector of the government authority. (Description translated from the institutional webpage ofCNSC, http://www.cnsc.gov.co/index.php/institucional/direccionamiento-estrategico/quienes-somos-cnsc; fetched on19 Jan 2015)
6

The interview
The interview of candidates is also responsibility of CNSC, who may nominate local delegate bodies
to decentralize the process. Typically universities and other certified higher education institutions
are delegated and form ad hoc interview committees under the supervision of CNSC. The committee
questions each candidate in person and the evaluation accounts for the remaining 15% of the global
contest score.
3.3 The probation period
Once having completed the public contest and chosen one of the available vacancies according to his
or her priority rank, the aspiring teacher starts a probation period that lasts up to the end of the
ongoing academic year (minimum four months). At the end of probation, the candidate’s performance
is evaluated by the school headmaster, and conditional on a positive evaluation the new teacher takes
permanent possession of the chair. Anecdotal evidence suggests that, in practice, very little further
selection is happening at this stage, i.e. that virtually all teachers reaching the probation period are
then appointed to the chair; in Table 5 we show statistical evidence supporting this claim.
3.4 Permanent evaluation and incentives
The New Regulation introduced permanent evaluation practices, aiming at ensuring a continued
satisfactory performance by teachers, as well as providing them with incentives to improve over time.
The first form of permanent evaluation consists of yearly assessments compiled by school head-
masters and reported to the local education authority, in which the headmaster comments on the
teacher’s performance following standardized criteria11. Two consecutive years of negative evalua-
tions lead to discontinuation of the employment as a teacher. This change is important especially if
compared to the over-protected status that teachers were enjoying under the old career regulation.
The second form of permanent evaluation and incentives brought in by the 2002 reform was
making career upgrades conditional on passing public examinations that evaluate teachers’ subject11Evaluación anual de desempeño laboral. The current evaluation procedures are regulated in detail through Decree
3782 /2007 by the Ministry of Education.
7

knowledge and teaching skills (Evaluación de Competencias). The new examination was added to
the existing requirements of possessing the level of education required for the upper level, and of
having spent 3 years at the current one (MEN [2013b]). The career structure and the corresponding
pay scale of New Regulation teachers is different with respect to Old Regulation ones, and the two
are illustrated in Table A.2, along with 2008 salary levels. Noticeable changes between the Old and
the New Regulation are the introduction of a postsecondary specialization as the minimum education
level for teachers12, and the reward of higher education degrees through higher salaries for teachers
holding them.
4 Data
Data on teachers
Data on teachers is available thanks to a the yearly information reporting procedure that is being
enforced by the Ministry of Education across all public schools of the country13. Schools are required
to give details on their pupils, staff and infrastructure, through the standardized formats set by the
Ministry every year14. We have individual data on teachers at all public schools of the country for
the years 2008 to 2013; each record includes the teacher’s demographics, education level, school of
placement, teaching subject, teaching level, type of contract, date first hired in the public education
system, and salary level.
12Bringing the minimum years of education from 11 (secondary education) to 13 or 14 (postsecondary specialization).13Resolución 166 /2003 and following versions.14The reasons behind the collection of this administrative data is for the Ministry to be able to monitor the status of
the public education sector and to identify needs and priorities. School headmasters are in charge of ensuring the correctcollection and reporting of the information, and of passing the data onto the local education authority (“educationsecretariat” of the department or certified municipality), which in turn reports to the Ministry of Education.
8

Teacher test scores, and two types of New Regulation teachers
Using their unique national ID document, we managed to match 81.15% of all New Regulation high
school teachers15 to their entry exam scores. In the analysis we will use the most recent test score
for each teacher, as the most up-to-date measure of his or her skills; Figure 1 graphs the density of
these scores. Surprisingly, the mass of scores is below the minimum requirement of 60 points is very
Figure 1: Entry exam scores of teachers observed over 2008-2013
0.0
5.1
Den
sity
0 20 40 60 80 100
Density of entry test scores (most recent score of each teacher); bin width = 1.33 points; normalcurve is overlaid.
large. A worrying 34% of all new-regulation teachers who were holding a teaching position over the
period 2008-201316 did not meet the minimum test score requirement on their most recent attempt17.
15That is 43,197 out of 53,234 New Regulation high school teachers. Overall we were able to match to their testscores 115,462 out of 145,724 New Regulation teachers (79,23%). The unmatched part is largely due to a large numberof missing IDs in the 2006 edition of the entry examination.
16(and whom we were able to match with their scores)17The figure could be reduced by matching the 2012 entry contest data, that was not available to us at the time of
this project. If all teachers hired in 2012 and 2013 had regularly passed the exam, the percentage of those not havingpassed it would reduce to 28.36%.
9

Table 2 shows that a mere minority of these teachers have obtained a sufficient score at some point
in the past18, leaving almost 13 thousand subjects in teaching positions without having ever passed
the compulsory entry exam19. The law allows such individuals to fill teaching vacancies temporarily,
and only in the absence of legitimate candidates willing to fill the positions. In fact, Table 2 also
reveals that 89% of teachers that have never passed the exam are holding temporary positions and
6% are registered as being on probation, while the remaining 5% has remarkably managed to land a
permanent position.
Table 2: Teachers with most recent score below 60
Type of position Never above 60 Above 60 in past Total
Permanent 676 429 1,1055.24% 23.04% 7.49%
Temporary 11,442 1,261 12,70388.73% 67.72% 86.08%
Probation 777 172 9496.03% 9.24% 6.43%
Total 12,895 1,862 14,757100.00% 100.00% 100.00%
These statistics split the group of New Regulation teachers into two potentially very different
subgroups: New Regulation teachers who have at some point passed the entry exam and New Regu-
lation teachers who have not, and we will refer to these two groups as “New Regulation Passed” and
“New Regulation Not Passed” in the remainder of the paper.
Data on student outcomes
We will focus on high school test outcomes. The Colombian high school test is called Saber11 and is
sat by students after 11 years of schooling, at completion of secondary school and before university20.
18And have been retaking the exam, for example, in order to move to a different education authority.19And almost 37 thousand teachers overall, including the school levels other than secondary. These figures are a
lower bound to the true ones, as we are missing the test scores of about 20% of our sample.20Schooling years 10 and 11 are not compulsory and are attended by around 41% of the eligible school popula-
tion (2012 data: Sistema Nacional de Indicadores - Tasa de cobertura neta - Ministerio de Educación Nacional -http://menweb.mineducacion.gov.co)
10

Saber11 test data is collected by ICFES21 and it is the most complete among the standardized tests
being conducted at different school grades; it is widely accepted as the reference examination to
evaluate the quality of Colombian secondary education. Saber11 evaluates a range of seven school
subjects, which are the same in all secondary schools22; test scores range from 0 to 100 in each subject
and are standardized by subject at the national level, so that each student’s score is informative about
his/her position relative to the national average in that subject. Individual-level Saber11 test scores
are made available by ICFES for the years 2000 to 2012, with information about the school and
municipality to which each student belongs. We will use years 2008-2013 and associate them with
the available teacher data.
Matching students and teachers
Unfortunately we do not have information on class groups, and thus we are unable to achieve a perfect
match between teachers and the students they actually taught. The closest match we can obtain is
between teachers teaching at secondary school level (years 6 to 11) in school i, year t and subject s,
and the Saber11 (year 11) student test scores in the same school i, year t and subject s. Therefore
our unit of observation is a school-year-subject cell, and we collapse and average the individual data
to that level. Our main outcome variable is “Average test score”, our regressor of interest is “Share of
New Regulation teachers”, which is given by the number of teachers hired under the New Regulation
over the total number of teachers teaching the given subject at secondary level, in the given school,
the given year.
5 Empirical strategy
We are interested in measuring the impact that the introduction of New Regulation teachers has
had on student test scores. In our years of reference, 2008-2013, both New Regulation and Old21Instituto Colombiano para la Evaluación de la Educación. The same agency also administers the national tests
taken by students at different stages of their career. It is a governmental agency with social scope within the sectorof public education; a national, decentralized public entity of special nature, with own legal identity, administrativeindependence and own assets; it is bound to the Ministry of Education. (Description translated from the institutionalwebpage of ICFES, http://www.icfes.gov.co/informacion-institucional/marco-legal; fetched on 19 Jan 2015)
22Mathematics; Spanish Language and Literature; Biology; Chemistry; Physics; Philosophy and English.
11

Regulation teachers were teaching in Colombian secondary schools, and we will exploit this fact in
order to identify the effect of the former. We also exploit the fact that within each school, students
sit the exam on different subjects. We use heterogeneity in student performances and in the New
Regulation teacher shares across subject, within the same school. Our main specification would be:
yits = β0 + β1SNPits + β2SNNPits + βkXkits + αit + αs + eits (1)
where the unit of observation is at the school(i)-year(t)-subject(s) level, αit is a school-year fixed
effect, αs is the subject fixed effect and eits is the residual. Our coefficient of interest is mainly β1, on
the share of New Regulation teachers that have passed the entry exam (SNP ), as this is the type of
teachers the reform has been aiming at producing. Secondarily, we are also interested in coefficient
β2, on the share of New Regulation teachers that have not passed the exam (SNNP ), as it can
provide an interesting comparison to β1 and help us understanding the channels of the effect. This
specification enables us to rule out any school-level factor or shocks which may induce selection of
teachers into schools, or cause correlation between the share of New teachers and the student scores,
such as school characteristics of both time-invariant and time-varying nature.
Similar regression models which do not feature school fixed effects are exposed to the bias induced
by non-random selection of new-regulation teachers into schools. Those who feature school- but not
school-year fixed effects (as in Ome [2012a]) are able to account for time-invariant sources of bias
but still exposed to the spurious correlation between yit and SNPit or SNNPit deriving from time-
varying factors or shocks, such as changes in school management or shocks to school resources.
The next section presents our main results. Importantly, we find significant differences between
the output of the more naïve school-fixed-effects model and that of the school-year-fixed-effects
strategy we use.
6 Main results
Table 3 shows our main results, obtained estimating model (1) on the data previously described. We
estimate a positive and significant effect of New Regulation - Passed teachers on student Saber11
12
scores, in a magnitude of about 0.20 points increase in the average score for that subject when the
share of new-regulation teachers goes from 0 to 1 in that subject (6% of a subject standard deviation;
2% of a student standard deviation). Our preferred school-year-fixed effects specification in column
(5) estimates an effect of New Regulation - Passed teachers by two thirds higher than the one we
obtain through a regular school-fixed-effects model (column (3)). Estimations obtained without any
within-school variation are very far off, reflecting strong sorting of teachers into schools (columns (1
and 2)).
We estimate a positive and significant effect on student test scores also by New Regulation teachers
who have not passed their entry exam, in a magnitude of about 0.14 points (4% of a subject- or 1.4%
of a student standard deviation). The effect of this category of teachers will prove less robust to
the inclusion of additional time and experience controls with respect to the effect of fully accredited
teachers (see Table 7), but its magnitude is nevertheless non trivial. We devote section 7.4 to
the discussion of this category, as we reflect upon the possible channels through which the reform
operated. In the Appendix we also show estimation results obtained considering New Regulation
teachers as a single group, without distinguishing between those who have passed the entry exam
and those who have not (Table 3).
6.1 Falsification test
Our main identification assumption is the absence of sorting of teachers across subjects, within each
school and school year. This assumption would be threatened if we were facing dynamics such as
subject-wise selective hiring, i.e. the targeted hiring of New Regulation teachers into a specific subject
(within a school and school year). The legislative framework regulating Colombian public education
is not suited to such dynamics, given the very limited freedom and decisional power that is left in the
hands of single schools and principals - and hiring and firing of personnel is not among their rights23.
Nevertheless, in order to lift any remaining doubts on these matters, we perform a falsification test
that aims at detecting subject-level correlation between pre-reform student test scores and the post-
reform shares of New Regulation teachers in that subject. In other words, we estimate our main23Except the evaluation post-probation period from 2002 onwards (see Section 7.2)
13

Table 3: The effect of New Regulation teachers on student performance
(1) (2) (3) (4) (5)
Share New Regulation Passed –0.35*** 0.89*** 0.12*** 0.20*** 0.20***(0.05) (0.07) (0.03) (0.04) (0.04)
Share New Regulation Not Passed –1.83*** –0.36*** –0.03 0.14*** 0.14***(0.06) (0.08) (0.04) (0.04) (0.04)
Age 0.03* 0.02** 0.03*** 0.03***(0.01) (0.01) (0.01) (0.01)
Age^2 –0.00* –0.00*** –0.00*** –0.00***(0.00) (0.00) (0.00) (0.00)
Experience 0.12*** 0.02*** 0.03*** 0.03***(0.01) (0.00) (0.00) (0.00)
Experience^2 –0.00*** –0.00*** –0.00*** –0.00***(0.00) (0.00) (0.00) (0.00)
Share postgrad degree 0.94*** 0.01 0.02 0.02(0.06) (0.02) (0.02) (0.02)
Subject FE 3 3 3 3 3School FE 3 3 3Year FE 3 3 3 3 3School-year FE 3 3Subject-specific trends 3
Mean(y) 43.33 43.33 43.33 43.33 43.33sd(y) 3.29 3.29 3.29 3.29 3.29N.obs 151,178 151,178 151,178 151,178 151,178N.groups . . 5,969 29,609 29,609R-squared 0.19 0.20 0.68 0.79 0.79
Note: SE clustered by school in parentheses. Each observation is subject ‘s’ in school ‘i’ in year‘y’. No fixed effects in columns (1) and (2), school fixed effects in column (3), school-year fixedeffects in columns (4) and (5). * p<0.05, ** p<0.01, *** p<0.001
Model 1 using 2000 and 2001 test scores on the left-hand side, instead of post-reform scores. If New
Regulation teachers were selectively entering subjects that ‘needed’ them because of bad performance,
or that ‘attracted’ them because of good performance, a negative or positive correlation ought to
emerge. Table 4 reports the coefficients on SNP and SNNP for each combination of pre-reform scores
and post-reform teacher plant. As we can see, no correlation is detected in any of these combinations,
14

bringing further support to our claim of absence of selection of teachers at the subject level.
Table 4: Falsification: Share of New Regulation teachers on pre-reform student test scores
Student test scores 2000 2008 2009 2010 2011 2012 2013
Share New Regulation Passed 0.06 0.01 0.01 –0.04 –0.01 –0.02(0.09) (0.08) (0.08) (0.08) (0.08) (0.07)
Share New Regulation Not Passed 0.02 0.03 0.03 –0.05 0.01 0.00(0.11) (0.10) (0.10) (0.10) (0.09) (0.08)
N.obs 11,715 12,395 12,395 13,366 14,188 15,204N.groups 2,595 2,697 2,697 2,828 2,945 3,057
Student test scores 2001 2008 2009 2010 2011 2012 2013
Share New Regulation Passed –0.05 –0.01 –0.03 –0.08 –0.09 –0.01(0.08) (0.07) (0.07) (0.07) (0.07) (0.06)
Share New Regulation Not Passed –0.01 0.03 –0.02 –0.03 –0.08 –0.02(0.10) (0.09) (0.10) (0.09) (0.09) (0.08)
N.obs 12,103 13,077 12,831 13,818 14,694 15,769N.groups 2,696 2,783 2,798 2,932 3,054 3,171
Note: Pre-reform student test scores regressed on each post-reform year’s share of New Regula-tion teachers. SE clustered by school in parentheses. Each observation is subject ‘s’ in school ‘i’in year 2000 or 2001. School and subject fixed effects, and all controls of Table 3 - model (5) arealso included. * p<0.05, ** p<0.01, *** p<0.001
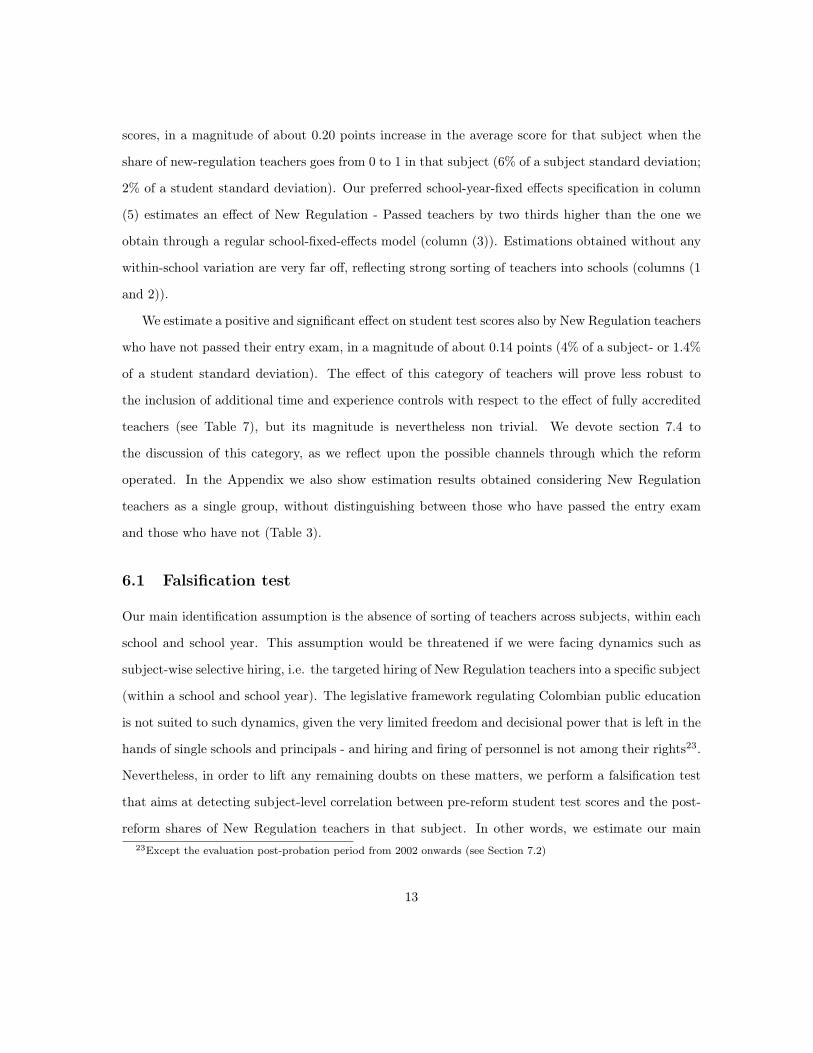
6.2 Nonlinear and interaction effects
In this section we explore nonlinearities in the effect of New Regulation teachers on student subject
performance. Firstly, we are interested in whether the marginal return to New Regulation teachers is
constant across their share, or varying with it. We augment our main model (1) with the quadratic
and cubic terms SNP 2its and SNP 3
its, allowing for a nonlinear response to increasing SNP , the share
of New Regulation teachers who have passed their exam; Figure 2(a) shows the results graphically
and Table A.5 numerically24. We find the marginal effect to be highest at low shares, starting as
high as 0.75 points (22.8% of a school-year-subject standard deviation) and declining with the share,
becoming statistically insignificant when SNP reaches values of around 40%.24In all panels of Figure 2 and the corresponding Tables, the sample has been limited to subject-years with 11 or
less teachers (5 school-subject-year cells dropped).
15

In Figures 2(b) and (d) and the corresponding Tables A.4 and A.7 we can see how the effectiveness
of New Regulation teachers appears to increase with the number of colleagues in the year-subject,
maybe suggesting positive network effects, and with the share of postgraduate-holding colleagues.
Figure 2(c) and Table A.6 show an attempt at pinning down heterogeneous effects by quintiles
of average entry tests scores of teachers: the Table reveals positive associations between student
test scores and higher test performance of teachers, but the interactions with SNP do not display
interesting patterns. Finally, Figure 2(e) and Table A.8 show us that there are some differences in
the effect of New Regulation teachers by subject taught, with the weakest effects on English foreign
language and Philosophy, and the strongest on Mathematics.
7 Channels of the effect
7.1 Selection on skills at entry
The public contest at entry is certainly the most prominent among the novelties that were introduced
by the 2002 reform of the teacher career. Its purpose is allowing the most suitable candidates to
become school teachers, while keeping the less desirable ones out of the profession - and seeking to
measure suitability with transparent and meritocratic criteria, as opposed to the politicized selections
and placements that were common before the reform. The first stage of the contest, the written exam
that is meant to evaluate knowledge and teaching aptitudes, accounts for a major share of the total
score for a candidate (see the contest structure in Table 1). The minimum score threshold required
in the exam seems to represent a tough hurdle for many candidates, and the first four contests saw
exam-passing rates of only about 30% on average (Table A.1). Keeping in mind that we found
indication of a positive correlation between the average entry test scores of New Regulation teaches
and student performance (Table A.6), the data does suggest that the entry exam, by cutting out
an important fraction of candidates with low test scores, is one of the channels through which the
positive impact of New Regulation teachers is materializing.
16
Figure 2: Marginal effects by different subject-year characteristics
The following panels plot the marginal effect of ‘Share New Passed’ on student test scores when thevariable is interacted with other characteristics of the same subject-year: the share of New Passeditself and its square (own interactions), the number of total teachers, the average entry scores of NewRegulation teachers. Capped lines indicate 95% point-wise confidence intervals.
-.50
.51
0 .05 .1 .15 .2 .25 .3 .35 .4 .45 .5 .55 .6 .65 .7 .75 .8 .85 .9 .95 1Share of New Regulation teachers (passed exam)
(a) Marginal effect at different levels of ‘Share New Passed’
0.5
1
1 2 3 4 5 6 7 8 9 10 11Number of teachers
(b) Marginal effect at different numbers of colleagues17

0.5
1 2 3 4 5Average entry score quintile New Regulation colleagues
(c) Marginal effect at different quintiles of average entry scores
0.5
1
0 (0, 0.5] (0.5, 1) 1Share of postgraduate degree holders
(d) Marginal effect at different shares of postgraduate degree holders
18

-.50
.51
Nat.Sc. Soc.Sc. Span. Engl. Math. Chem. Phys. Phil.Subject
(e) Marginal effect at subjects
7.2 Selection on the probation period
The probation period that teachers begin after having successfully passed the entry contest and
selected their preferred vacancy, is a further selection mechanism that the 2002 reform put in place.
School headmasters observe and evaluate the new teachers during their first months of employment,
and have the power to end their employment if deemed unfit for the job. Anecdotal evidence suggests
that, in practice, the firing of teachers after their probation period is a rare event, due to the fact
that headmasters do not wish to incur in the hassle of potential appeals and legal disputes that
fired teachers would recur to. We test this claim using our six years of school censuses (2008 to
2013) and constructing an individual-level panel that records the type of position that each New
Regulation teacher holds each year: permanent, temporary25 and in probation. We then estimate
a model Yit = β0 + β1Tempit + β2Probit + εit, where Yit = 1 if the teacher is still in the panel in
25There are two types of temporary statuses: ‘Temporary in permanent vacancy’, meaning that the vacancy iswaiting to be filled with a new permanent occupant, and ‘Temporary in temporary vacancy’ means that the vacancyhas a permanent occupant who is only temporarily away. We have grouped the two categories into a single one for ouranalysis.
19

period t+ 1 and 0 otherwise26; Temp and Prob are mutually exclusive dummies indicating the type
of position held in year t (omitted category is Perm, permanent position). We then also add the
Ageit controls to the baseline (columns (2) and (4)). In Columns (3) and (4) we adopt a random
effects specification, adding individual teacher effects αi to our model. All columns report the odds
ratios from our maximum-likelihood logit estimates. The results of Table 5 may tell a different story
with respect to the previous anecdotal evidence: teachers on probation are only about 80% as likely
as permanent position teachers to still be recorded system the year after. Nevertheless, we do not
know the reasons behind the sample attrition and we are thus unable to distinguish between teachers
who have voluntarily quit their job and those sacked. It may be that the first year of employment
regularly sees higher dropout rates with respect to the following ones, due to initial adjustment or
unmet expectations of new entrants. In conclusion, even though we do find considerably higher
teacher dropout rates associated with their probation period, we are unable to conclusively say
whether this provision of the reform is implementing selection on new teachers.
Table 5: Panel retention by type of position held (New Regulation teachers)
Logit RE Logit
(1) (2) (3) (4)
Temporary position 0.25*** 0.25*** 0.19*** 0.19***(0.00) (0.00) (0.00) (0.00)
Probation period 0.77*** 0.77*** 0.78*** 0.78***(0.03) (0.03) (0.03) (0.03)
Age bins No Yes No Yes
N.obs 138,869 138,865 138,869 138,865N.groups 48,172 48,171
Note: Odds ratios displayed. Outcome variable: Y=1 if the teacher is still in the panel the follow-ing year, 0 otherwise. Year 2013 excluded. Columns (1) and (2): SE clustered by individual inparentheses. Columns (3) and (4): Observed Information Matrix SE in parentheses. * p<0.05,** p<0.01, *** p<0.001
26We do not use Yi,2013, which is equal to 0 for all subjects, since the panel ends in 2013.
20
7.3 Turnover and discontinuation of employment
We can distinguish discontinuation of employment for Colombian public teachers into forced and
voluntary. It is forced when the teacher is dismissed from his or her employment against his or her
will, and it is voluntary when the teacher leaves the profession by own decision.
In section ?? we discussed how new-regulation teachers, contrary to their old-regulation colleagues,
face the threat of seeing their employment discontinued for reasons other than severe misconduct.
As an incentive to effort and good teaching, discontinuation of employment may happen due to two
consecutive years of unsatisfactory scores on the performance evaluations which are carried out by
school headmasters.
Unfortunately we do not have access to data on these yearly performance evaluations, but we
can start exploring the question of whether new regulation teachers are experiencing significant
screening even once their careers are underway by examining in-career dropout patterns. Table 6
shows maximum likelihood logit estimations of the model Yi = β0+β1NewRegi+ εi, where Yit = 1 if
the teacher is still in the panel in period t+1 and 0 otherwise; and NewRegi is a dummy taking value
1 for new-regulation teachers and 0 for old-regulation ones; again we also add the Agei control to the
baseline. In Columns (3)-(4) we adopt a random effects specification, adding individual teacher effects
αi to our model27. Conditional on having reached the permanent-position stage, New Regulation
teachers actually display higher panel retention rates than their traditional-regulation colleagues,
even controlling for age28. In conclusion, we are unable to find any evidence for high rates of forced
employment termination occurring among teacher subject to the reformed rules, and we are inclined
towards ruling out this channel as an important selection mechanism.
7.4 New Regulation teachers that have not passed the entry exam
Let us now turn to discuss the results we obtained on the second category of New Regulation teachers,
those who have not passed their entry exam (the SNNP variable, for “Share New Not Passed”). In
27In this case fixed effects estimation is not feasible, as the new-regulation or old-regulation status is time-invariant.28Various other flexible forms of controlling for age have been tested without significant changes in the results, and
have thus been omitted in the output.
21

Table 6: Panel retention per type of teacher regulation (permanent-position teachers)
Logit RE Logit
(1) (2) (3) (4) (5) (6)
New Regulation 1.978*** 1.516*** 1.229*** 2.409*** 1.759*** 1.313***(0.030) (0.028) (0.022) (0.044) (0.038) (0.026)
Age 0.979*** 0.972*** 0.975*** 0.971***(0.001) (0.001) (0.001) (0.001)
Year dummies No No Yes No No Yes
N.obs 309,383 309,383 309,383 309,383 309,383 309,383N.groups 94,285 94,285 94,285
Note: Outcome variable: Y=1 if the teacher is still in the panel the following year, 0 otherwise.Columns (1)-(3): SE clustered by individual in parentheses. Columns (4)-(6): Observed Infor-mation Matrix SE in parentheses. * p<0.05, ** p<0.01, *** p<0.001
the main results of Table 3, column (5), we see that the positive impact of these teachers on student
outcomes is estimated at around 70% of the impact of teachers who did pass the entry exam. Teachers
who have not passed the exam can be employed temporarily, in absence of fully accredited candidates.
Nevertheless, they have not officially entered the teaching career and are thus not eligible for any
career upgrades: their salary is locked to the first step (step A) of the level to which they would
belong if they passed the exam29 (see Table A.2 for an idea about numbers). These teachers, the
vast majority of which occupies temporary positions (see Table ??), is also at constant risk of being
replaced by candidates who do pass the exam, as only the latter are entitled to take permanent
possession of vacancies. The positive impact that this category of teachers has on student test scores,
thus still improving on Old Regulation teachers, can probably be attributed to the effort that they
are exerting towards obtaining their full accreditation and overcoming their precarious status in the
system. In this regard, it is important to keep in mind that even though they have obtained a
score below 60, these teachers have attempted the entry exam at least once, and almost 60% of
them have attempted it multiple times30, and are thus likely to have gone through preparation and
quality assurance procedures similarly to their successful colleagues. Moreover, they do possess the29Decree 624/2008.307,392 out of 12,895 teachers have attempted the exam 2, 3 or 4 times between 2002 and 2009
22

preliminary requirements needed to access the entry contest, including the higher education level
requirements introduced by the reform. These considerations may explain quite well our finding of a
still positive but about 30% lower impact on student test scores that these non-accredited teachers
are bringing about, and are consistent with our previous deductions about a positive selection being
implemented through the entry exam and possibly through the probation period.
8 Exploring time patterns
We further pursue the understanding of how the two regulations translate into career differences
by analyzing survival patterns in Old and New public teachers. A public teacher becomes “at risk
of failing” the year in which he/she enters the teacher profession, and “fails” the year in which
he/she exits it for whichever reason. The survival analysis performed in this section is based on
the individual-level information recorded over the direct observation period 2008-201331, and on the
retrospective information about each teacher’s first hiring year32. The survival time of teachers hired
before the start of our observation window in 2008 is treated as conditional on having survived
already up to that year33. In the whole analysis, the sample has been limited to exclude teachers
who voluntarily switched from the Old to the New Regulation (by taking the exam) and the other
cases in which the regulation recorded is inconsistent with the year of hiring (3,902 teachers), as well
as the teachers who are recorded as not exercising in an educational structure (1,899 teachers). The
remaining sample consists of 118,117 teachers teaching one of the Saber 11 test subjects at secondary
level 34, among which 64,883 belong to the Old regulation and 53,234 to the New one (43,197 with
matched test scores).
As a first exercise, we estimate the survival functions corresponding to old regulation and new
regulation teachers non-parametrically, and plot them in Figure ??. Notice that since our observation
31Or a subset of those years, for teachers hired during that time span.32The first hiring date is the date in which the teacher was hired for the first time as a public school teacher.33i.e. we are in the presence of “left censoring”. See the excellent discussion in Wooldridge [2010], ch. 22.3.3.34In the Appendix, we also show the results of the analysis on the 360,644 teachers teaching at any preschool,
primary and secondary level in the country. The patterns identified in the full sample follow closely those found in thelimited one.
23

Figure 1: Kaplan-Meier survivor functions by regulation
0.2
5.5
.75
1
0 5 10 15 20 25 30 35 40 45years since hiring
Kaplan-Meier survivor functions for teachers belonging to the new regulation (solid line) and the oldregulation (dashed line), and 95% confidence intervals.
window spans the years 2008-2013 and the new teacher regulation was implemented in 2002, any old-
regulation teacher we observe has already spent at least 6 years in the public education system (which
explains the ‘shifted’ starting point of the dashed curve in Figure ??). On the other hand, the most
senior new-regulation teachers we observe have spent not more than 11 years in the system (which
explains the ‘early’ end of the solid curve in the figure). The two survival functions are therefore
shifted with respect to each other, with few years of time overlap. This situation makes it difficult to
compare the two survival patterns directly, since the most interesting comparisons between groups
are made looking at the same time from origin, or years since hiring in this case35.
35For example, looking at Figure ?? one might conclude that new-regulation teachers experience a quite steepdropout pattern during their early years of career (say the first five), but one cannot tell whether the same applies toold-regulation teachers, as we do not observe them in such early years
24

We further explore how observable characteristics of teachers are associated with differences in
survival patterns. We show graphical results in Figure 2 and 3 for teachers belonging to the old
and the new regulation respectively. Overall we do not find striking differences in the way teacher
characteristics affect survival patterns under the two regulations. Holding a postgraduate degree is
associated with significantly higher survival rates with respect to not holding one; being female and
being located in a rural area associate with somewhat lower permanence in the system, especially
under the new regulation; as it is natural, survival decreases as the age at which the teachers first
entered the system. In the following subsection we will give special consideration to the patterns on
teacher entry scores, depicted panel (e) of Figure 3.
8.1 Entry exam scores
A very interesting dimension to look at for the case of New Regulation teachers is their entry test score.
We would expect teachers that score higher on the entry test to survive longer in the system, under
the assumptions that 1) the new regulation is effective in rewarding skills and keeping highly skilled
teachers in the system, and effective in eliminating unsatisfactory teachers and 2) the entry exam is
a good measure of the desirable skills that the reform is aiming at. To the support of aspect 2), we
shall recall the positive correlation we found between teacher entry scores and student performance
in our heterogeneity analysis (see Table A.6). Regarding aspect 1), previous work by Ome [2012b,
2013] has evidenced how the 2002 reform has made the teaching profession more attractive to high
skilled individuals, due to the change in the salary structure and the potentially quicker ascent to
top salary levels36.
We have divided teachers into quartiles37 according to their performance in the most recent entry
exam they took, and we plot the survival rates of the four groups in Panel (e) of Figure ??. We
notice how the first (lowest-scoring) quartile exits from the teacher profession at a dramatically faster
rate with respect to the other three. All teachers in the first quartile and part of those in the second36If we consider education level as a proxy for skills, our own data collection summarized in Table A.2 confirms this
view for both individuals holding postsecondary degrees and those holding university (undergraduate or postgraduate)degrees: compared to the Old Regulation, the former are now enabled to reach salary levels double as high, and thelatter face a potentially much quicker ascent to the top salaries.
37The score ranges defining quartiles are [0, 58.35], (58.35, 61.4], (61.4, 64.55] and (64.55,100].
25

Figure 2: Kaplan Meier survival functions by teacher characteristics (Old regulation)
0.25.5.751
05
1015
2025
3035
4045
(a) G
ende
r
0.25.5.7510
510
1520
2530
3540
45
(b) P
ostg
radu
ate
degr
ee
0.25.5.751
05
1015
2025
3035
4045
(c) A
ge w
hen
hire
d0.25.5.751
05
1015
2025
3035
4045
(d) A
rea
(a) f
emal
es (b
) yes
(c) 2
5-34
(d) u
rban
(a) m
ales
(b) n
o (c
) 15-
24 (d
) rur
al
(c) 3
5-44
(c) 4
5+
95%
CI
26

Figure 3: Kaplan Meier survival functions by teacher characteristics (New regulation)
.5.6.7.8.91
05
10
(a) G
ende
r
.5.6.7.8.910
510
(b) P
ostg
radu
ate
degr
ee
.5.6.7.8.91
05
10
(c) A
ge w
hen
hire
d.5.6.7.8.91
05
10
(d) A
rea
.5.6.7.8.91
05
10
(e) E
ntry
test
sco
re
(a) f
emal
es (b
) yes
(c) 2
5-34
(d) u
rban
(e) 1
st q
uarti
le
(a) m
ales
(b) n
o(c
) 15-
24 (d
) rur
al (e
) 2nd
qua
rtile
(c) 3
5-44
(e) 3
rd q
uarti
le
(c) 4
5+ (e
) 4th
qua
rtile
95%
CI
27

quartile have scored below the 60 points required to pass the exam and proceed to the following
stages of the entry context, on their most recent attempt. Back in Table ?? and in Section 7.4
described how a majority of these individuals has actually never passed the entry exam, expressing
our concern about the significant share of teaching positions they occupy. The survival patterns we
describe are consistent with those facts and provide us with some food for thought: on one hand, we
find confirmation of the rather unstable nature of the employment histories of non-accredited New
Regulation teachers, with respect to their better performing colleagues. On the other hand though,
we notice that the instability may be lower than it ought to be, given that the survival chance of
these individuals in the public school system is around 50% even after 10 years of employment.
A final interesting aspect to notice is that the relationship between exam score quartiles and
expected permanence in the profession is non-monotonic, with the highest-scoring teachers showing
lower survival rates with respect to their colleagues in the two middle quartiles. The analysis on
score deciles in the Appendix (Table ??) confirms this finding. It thus appears that even the more
skill-rewarding career structure offered by the New Regulation has not yet succeeded at making the
teaching profession as attractive to top-performers as for their more average colleagues.
9 Robustness checks
9.1 Additional time controls, and one teacher per subject
In this table we repeat our main estimation (Table 3) with additional cohort and experience. In
particular, we add two different sets of hiring cohort dummies (Columns 1 and 3) and limit the
sample to school-year-subject cells who do not contain any teachers with less than 5 or more than 40
years of experience (Columns 2 and 4). In these specifications, the effect of New-Regulation Passed
teachers reduces between 20% and 43% with respect to our main results, remaining statistically
significant throughout. The effect of New-Regulation Non-Passed teachers instead proves less robust
and cannot be distinguished from zero. The final exercise (Column 5) uses only school-year-subject
cells with only one teacher.
28

Table 7: Additional time controls, limiting experience, 1 teacher per subject
Cohorts I Cohorts I +limit exper. Cohorts II Cohorts II +
limit exper. 1 teacher
Share New Reg. Passed 0.113* 0.127** 0.145* 0.162* 0.103(0.044) (0.042) (0.071) (0.070) (0.068)
Share New Reg. Not Passed 0.056 0.070 0.134 0.157 0.029(0.051) (0.050) (0.095) (0.094) (0.081)
Experience 0.032*** 0.034*** 0.057*** 0.045*** 0.017*(0.005) (0.005) (0.012) (0.011) (0.008)
Experience^2 –0.001*** –0.001*** –0.001*** –0.001*** –0.000*(0.000) (0.000) (0.000) (0.000) (0.000)
Age 0.028*** 0.028*** 0.021 0.022 0.013(0.009) (0.009) (0.020) (0.020) (0.013)
Age^2 –0.000*** –0.000*** –0.000 –0.000 –0.000(0.000) (0.000) (0.000) (0.000) (0.000)
Share Postgrad degree 0.024 0.023 0.006 0.002 0.069(0.024) (0.024) (0.035) (0.035) (0.042)
Share hired post 1980 –0.119* –0.105(0.054) (0.076)
Share hired post 1990 –0.111* –0.023(0.053) (0.081)
Share hired post 2000 0.064 0.180*(0.053) (0.083)
Share hired post 1985 –0.146* –0.134(0.057) (0.081)
Share hired post 1995 0.006 0.003(0.037) (0.051)
Share hired post 2005 0.071 0.124(0.043) (0.067)
Subject dummies 3 3 3 3 3
Subject-specific trends 3 3 3 3 3
Mean(y) 43.33 43.33 43.35 43.35 42.58sd(y) 3.292 3.292 3.346 3.346 3.324N.obs 151,178 151,178 74,114 74,114 62,621N.groups 29,609 29,609 25,055 25,055 25,860R-squared 0.79 0.79 0.83 0.83 0.80
Note: SE clustered by school in parentheses. Each observation is subject ‘s’ in school ‘i’ in year‘y’. School-year fixed effects in all columns. * p<0.05, ** p<0.01, *** p<0.001
29

10 Conclusion
In this paper we estimate the effect that the 2002 reform of the public teacher career has had on
the performance of Colombian high school students. The reform introduced exam-based selection at
entry and a set of further quality incentives for teachers. We find positive and significant effects of
New Regulation teachers on student test scores, in a magnitude of around 6% of a subject standard
deviation increase in test scores when the share of these teachers goes from 0 to 1 in a given subject
in a given school and year. When the share of New Regulation teachers in a subject is still low,
increasing it yields a marginal effect up to three times as high the average one, and higher than
average gains are also to be found in larger and more educated teacher groups.
After having explored heterogeneities in the effect and survival patterns of teachers in the ed-
ucation system, we are induced to conclude that the main channel through which the reform has
brought about its positive results on student performance is the selection of teacher candidates at
entry, which has been quite tight as around two thirds of initial candidates do not reach sufficiency at
the exam stage. Selection at the initial probation period and selection on tenured teachers may also
be contributing to raise the quality of surviving educators, but we are currently unable to quantify
these contributions due to the absence of data on reasons for exit from teacher records.
Our analysis has also exposed a less successful side of the post-reform setting, namely the fact
that around 30% of the New Regulation teachers recorded in the system over the 2008-2013 period
are not fully accredited as they have not successfully passed the entry exam. They are employed in
temporary positions but seem to persist in this status sometimes over several years. The intention of
the law in allowing these types of temporary employments was to deal with exceptional circumstances
in which vacancies need to be filled but no eligible candidates are at hand, but the dimension of the
phenomenon appears to be larger than what would be justified by exceptional circumstances.
In terms of future research, we believe that it shall be highly interesting to look at New Regulation
teachers in some year’s time, when their employment histories will be longer and more informative
on the incentives they face over their careers. The availability of data on the reasons for dismissal
or voluntary departure, as well as data on voluntary formation courses attended by teachers, would
30

be of immense value towards understanding to which extent the permanent evaluation aspect of the
reform is effectively operating.
References
Raj Chetty, John N. Friedman, and Jonah E. Rockoff. Measuring the impacts of teacher i: Evaluating bias in teacher
value-added estimates. American Economic Review, 104(9):2633–2679, 2014.
Jesus Duarte. Política y educación: Tentaciones particularistas en la educación latinoamericana. Economía Política
de las Reformas Educativas en América Latina, 2001.
Jesus Duarte. Educación pública y clientelismo en Colombia. Universidad de Antioquia, Medellín, 2003.
David N. Figlio. Can public schools buy better-qualified teachers. Industrial and Labor Relations Review, 55:686, 2001.
URL http://heinonline.org/HOL/Page?handle=hein.journals/ialrr55&id=688&div=&collection=journals.
Grupo GEARD. Explicación de las etapas del concurso para ingreso a la carrera docente 2013, 2013. URL https:
//www.youtube.com/watch?v=r7iyLO3EvZA.
Robert James Gordon, Thomas J. Kane, and Douglas Staiger. Identifying effective teachers using performance
on the job. Brookings Institution Washington, DC, 2006. URL https://books.google.com/books?hl=en&lr=
&id=n0ntgoDT4tkC&oi=fnd&pg=PA189&dq=identifying+effective+teachers+using+performance+on+the+job&ots=
l73g7bXFYN&sig=nLCKr8AZkGWYAZJz3E_RVrQEmoo.
Eric A. Hanushek. School policy: implications of recent research for human capital investments in south asia and
other developing countries. Education Economics, 17(3):291–313, 2009. doi: 10.1080/09645290903142585. URL
http://www.tandfonline.com/doi/pdf/10.1080/09645290903142585.
Eric A. Hanushek and Steven G. Rivkin. The distribution of teacher quality and implications for policy. SSRN Scholarly
Paper ID 2139257, Social Science Research Network, Rochester, NY, July 2012. URL http://hanushek.stanford.
edu/sites/default/files/publications/Hanushek%2BRivkin%202012%20AnnRevEcon%204.pdf.
Eric A. Hanushek and Ludger Woessmann. Do better schools lead to more growth? cognitive skills, economic outcomes,
and causation. Journal of Economic Growth, 17(4):267–321, July 2012. ISSN 1381-4338, 1573-7020. doi: 10.1007/
s10887-012-9081-x. URL http://link.springer.com/article/10.1007/s10887-012-9081-x.
Eric A. Hanushek, John F. Kain, and Steven G. Rivkin. Why public schools lose teachers. Journal of human resources,
39(2):326–354, 2004. URL http://jhr.uwpress.org/content/XXXIX/2/326.short.
Thomas J. Kane, Jonah E. Rockoff, and Douglas O. Staiger. What does certification tell us about teacher effec-
tiveness? evidence from new york city. Economics of Education Review, 27(6):615–631, December 2008. ISSN
0272-7757. doi: 10.1016/j.econedurev.2007.05.005. URL http://www.sciencedirect.com/science/article/pii/
S0272775707000775.
MEN. Decreto 3982 de 2006. Ministerio de Educación Nacional; Diario Oficial, 46449, November 2006.
31

MEN. Estatuto de profesionalizacion docente - informacion general y avances - abril de 2008, April 2008. URL
http://www.colombiaaprende.edu.co/html/productos/1685/articles-161031_archivo_3.pdf.
MEN. Por meritocracia se seleccionarán 20.610 docentes, directivos docentes y etnoeducadores. Technical report, Min-
isterio de Educación Nacional; http://www.mineducacion.gov.co/cvn/1665/w3-article-312669.html [21 Jan 2015],
October 2012. URL http://www.mineducacion.gov.co/cvn/1665/w3-article-312669.html.
MEN. Estadísticas concursos 2004 - 2009. Technical report, Ministerio de Educación Nacional;
http://www.mineducacion.gov.co/1621/w3-propertyvalue-48463.html [20 Jan 2015], May 2013a. URL http://www.
mineducacion.gov.co/1621/w3-propertyvalue-48463.html.
MEN. ¿quiénes se reubican salarialmente o ascienden? Technical report, Ministerio de Educación Nacional;
http://www.mineducacion.gov.co/proyectos/1737/w3-article-309814.html [22 Jan 2015], June 2013b. URL http:
//www.mineducacion.gov.co/proyectos/1737/w3-article-309814.html.
F. J. Murillo, A. González, and M. Rizo. Evaluación del desempeño y carrera profesional docente. una panorámica de
américa y europa. Santiago de Chile: UNESCO.[2a Ed. Revisada], 2007.
OECD. Education in Colombia. Reviews of National Policies for Education. OECD Publishing, Paris, 2016.
Alejandro Ome. The effects of meritocracy for teachers in colombia. INFORMES DE INVESTIGACIÓN 010260,
FEDESARROLLO, 2012a.
Alejandro Ome. Salarios de los docentes públicos en colombia 1995-2010. COYUNTURA ECONÓMICA, 2012b. URL
http://econpapers.repec.org/article/col000438/011643.htm.
Alejandro Ome. El estatuto de profesionalización docente: una primera evaluación. CUADERNOS DE FEDESAR-
ROLLO, FEDESARROLLO, May 2013. URL http://econpapers.repec.org/paper/col000439/011553.htm.
Steven G. Rivkin, Eric A. Hanushek, and John F. Kain. Teachers, schools, and academic achievement. Econometrica,
73(2):417–458, 2005. ISSN 1468-0262. doi: 10.1111/j.1468-0262.2005.00584.x. URL http://www.econ.ucsb.edu/
~jon/Econ230C/HanushekRivkin.pdf.
Jonah E. Rockoff. The impact of individual teachers on student achievement: Evidence from panel data. Amer-
ican Economic Review, 5(1):247–252, 2005. URL https://www0.gsb.columbia.edu/faculty/jrockoff/rockoff_
teachers_march_04.pdf.
Jonah E. Rockoff, Brian A. Jacob, Thomas J. Kane, and Douglas O. Staiger. Can you recognize an effective teacher
when you recruit one? Education Finance and Policy, 6(1):43–74, January 2011. ISSN 1557-3060. doi: 10.1162/
EDFP_a_00022. URL http://dx.doi.org/10.1162/EDFP_a_00022.
Jeffrey Wooldridge. Econometric analysis of cross section and panel data. MIT Press, 2010.
Appendix
32

Data on the past entry contests
Table A.1: Selectivity of the entry contests
CONTESTS > 1st (2004) 2nd (2005) 3rd (2006) 4th (2009)
N. of local authorities 69 66 49 66
Vacancies 50.947 23.355 14.579 25.392
Candidates to exam 140.541 134.090 109.487 228.985
Passed exam stage 60.078 (43%) 32.720 (24%) 27.931 (26%) 66.687 (29%)
Assigned to vacancy 30.568 (22%) 14.092 (11%) 13.620 (12%) 39.468 (17%)
Note: all percentages are relative to ‘Candidates to exam’Source: MEN [2013]
Details on career structure, salaries and education level of teachers
Table A.2: Career structure of public school teachers, and 2008 pay scalesOld Regulation (Dec. 2277 / 1979) New Regulation (Dec. 1278 / 2002)
Step Educationlevel required 2008 salary Level Step Education
level required 2008 salary
A Secondaryschool
525.240
1
APostsecondaryspecialization
745.624B 581.850 B 1.014.6111 652.079 C 1.531.1862
Postsecondaryspecialization
675.922 D 1.759.1883 717.284
2
AUndergraduate
degree
938.3404 745.600 B 1.421.4285 792.628 C 1.834.8016
Undergraduatedegree
838.439 D 1.980.4547 938.315 Master deg. PhD deg.8 1.030.680
3
APostgraduate
degree
1.415.933 1.721.7989 1.141.779 B 1.772.111 2.154.91910 1.250.166 C 2.017.127 2.452.86411 1.427.513 D 2.140.784 2.603.23212 1.698.11213 1.879.682
14 Postgraduatedegree 2.140.766
Source: compiled by the authors based on Decree 2277 / 1979, Decree 259 / 1981, Decree 626 /2008, Decree 624 / 2008, MEN [2008]. Salaries in 2008 Colombian Pesos. The shaded steps are the
possible entry steps for first-time teachers.
33

Descriptive statistics
Table A.3: Descriptive statistics at school-year-subject level
Mean student score 43.33(3.29)
Share New Regulation 0.47(0.43)
Share New Regulation Passed 0.29(0.38)
Share New Regulation Not Passed 0.18(0.34)
Share Old Regulation 0.53(0.43)
Mean age 44.20(8.31)
Mean experience 12.49(9.20)
Share postgraduate degree 0.21(0.34)
N 151,178
Note: Variable means and (standard deviations).
34

35