new this year - wisconsin department of...
TRANSCRIPT

Division of Transportation Scott Walker, Governor System Development Mark Gottlieb, Secretary Bureau of Traffic Operations Internet: www.dot.wisconsin.gov 4802 Sheboygan Ave, Room 501 PO Box 7986 Madison, WI 53707-7986
Page 1 of 12
Date: May 23rd, 2016 To: Region Directors
Attn: Regional System Planning and Operations Sections From: Brian Porter, PE, PTOE
State Traffic Safety Engineer Subject: 2010-2014 Statewide Average Crash Rates
NEW THIS YEAR The crash rate publication contains important changes compared to past editions.
1) WisDOT has implemented new Peer Group categories.
2) Crash Severities have been consolidated to a KAB segment crash rate (KAB Crash Rate), and is the sum of Fatal, A-level, and B-level crashes normalized by volume.
3) Upper Control Limits (UCLs) are now provided to assist in determining when further investigation is needed.
4) Local Road Crash Rates and KAB segment crash rates have been consolidated to a 5-year average, rather than showing individual years.
5) Additional guidance is provided for calculating segment, intersection, and ramp crash rates.
New Peer Group Categories Previous versions of this publication included crash rate information for state highway Peer Groups that relied on population (small or large) and/or traffic volumes to differentiate categories. The new Peer Groups use number of lanes, functional class, Annual Average Daily Traffic (AADT), and/or posted speed limit to define the categories. As in previous versions, there are 12 distinct Peer Group categories for state trunk highways and two Peer Group categories for local roads (Urban Streets and Rural County Trunk Highways). The Peer Groups were updated to more accurately reflect distinct groupings of similar roadway segments based on a statistical analysis. Consideration was given to the availability of data used to establish the Peer Groups and for calculating and applying the crash rates. If you are unsure which Peer Group your roadway falls into, contact the Safety Engineer in your Region or in the Bureau of Traffic Operations. Region-wide shapefiles are available for spatial representation of the 12 Peer Groups that make up the State Trunk Highway Network.

Page 2 of 12
KAB Crash Rate In addition to the overall segment crash rate, a KAB Crash Rate is included for each Peer Group. “KAB” is a severity measure that represents the sum of Fatal, A-Level, and B-Level injury crashes. Where the overall segment crash rate is intended to assess the frequency of crashes (normalized by traffic volume), the KAB Crash Rate is intended to assist with the evaluation of how a particular roadway segment performs compared to its peers from a crash severity perspective (normalized by traffic volume). Upper Control Limits Equations are provided to calculate the crash rate Upper Control Limits (UCLs) for each Peer Group to further assess the roadway’s safety performance. Crash rate UCLs are defined as one standard deviation above the mean crash rate, which is used to identify investigation flags in other WisDOT business practices. Crash rate and KAB Crash Rate UCLs should be calculated for each roadway segment being evaluated. Having rates above the statewide crash rate or a UCL does not indicate whether a safety issue exists, nor does it provide any information related to the nature of the crashes. The comparison simply helps to identify where further analysis might be beneficial. To provide some perspective, approximately 25 percent of roadway segments will have a crash rate or KAB Crash Rate that exceeds an UCL. Local Road Crash Rates To be consistent with how state highway crash data is presented in this publication, local road crash rates have been consolidated to five year averages and only segment crash rates and KAB Crash Rates are shown. This is different than previous editions of this publication, which listed individual years of data and individual severity measures.
Additional Guidance Detailed instructions are provided for how to calculate segment crash rates, KAB Crash Rates, and UCLs. Instructions are also provided for calculating intersection and ramp crash rates, though no statewide averages are provided for intersections or ramps at this time. Previous statewide average crash rate summaries can be found here: http://wisconsindot.gov/Pages/doing-bus/local-gov/traffic-ops/manuals-and-standards/manuals.aspx

Page 3 of 12
Statewide Average Roadway Crash Rates and Upper Control Limits Table 1 shows the Wisconsin statewide average crash rates (excluding deer crashes) for the five year period from January 1, 2010 to December 31, 2014. New this year:
• Individual severity rates have been removed and replaced with a KAB Crash Rate, which includes K-Level (fatal), A-Level (incapacitating injury), and B-Level (non-incapacitating injury) crashes.
• UCLs are provided to assist with screening of potential safety issues.
Table 1 includes the statewide average crash rates for the State Trunk Highway Network broken out by Meta-Manager Peer Group. The Meta-Manager Peer Groups are intended to represent a group of similar highway segments throughout the state. Slight modifications are made to the Peer Groups each year so these crash rates should not be compared to previous statewide average crash rates. Instructions for calculating crash rates, UCLs, and making comparisons are provided in the next section.
Table 1: 2010-2014 Statewide Average Roadway Crash Rates, KAB Crash Rates, and UCLs
Crash Rate KAB Crash Rate
Meta-Manager Peer Group Average UCL Average UCL
110 6-lane Freeways with AADT < 90,300 vpd 58.73 = 58.73 + 523.42�
58.73𝐴𝐴𝐴𝐴 ∗ 𝐿 ∗ 𝑌
6.89 = 6.89 + 523.42�6.89
𝐴𝐴𝐴𝐴 ∗ 𝐿 ∗ 𝑌
120 6-lane Freeways with AADT > 90,300 vpd 91.67 = 91.67 + 523.42�
91.67𝐴𝐴𝐴𝐴 ∗ 𝐿 ∗ 𝑌
7.09 = 7.09 + 523.42�7.09
𝐴𝐴𝐴𝐴 ∗ 𝐿 ∗ 𝑌
130 4-lane Freeways 43.31 = 43.31 + 523.42�43.31
𝐴𝐴𝐴𝐴 ∗ 𝐿 ∗ 𝑌 6.25 = 6.25 + 523.42�
6.25𝐴𝐴𝐴𝐴 ∗ 𝐿 ∗ 𝑌
210 65 mph Expressways* 48.32 = 48.32 + 523.42�48.32
𝐴𝐴𝐴𝐴 ∗ 𝐿 ∗ 𝑌 8.79 = 8.79 + 523.42�
8.79𝐴𝐴𝐴𝐴 ∗ 𝐿 ∗ 𝑌
220 55 mph Expressways* 80.24 = 80.24 + 523.42�80.24
𝐴𝐴𝐴𝐴 ∗ 𝐿 ∗ 𝑌 14.21 = 14.21 + 523.42�
14.21𝐴𝐴𝐴𝐴 ∗ 𝐿 ∗ 𝑌
310 Multilane Divided Highways Posted at 45 mph or higher 181.72 = 181.72 + 523.42�
181.72𝐴𝐴𝐴𝐴 ∗ 𝐿 ∗ 𝑌
22.58 = 22.58 + 523.42�22.58
𝐴𝐴𝐴𝐴 ∗ 𝐿 ∗ 𝑌
320 Multilane Divided Highways Posted at 40 mph or lower 378.88 = 378.88 + 523.42�
378.88𝐴𝐴𝐴𝐴 ∗ 𝐿 ∗ 𝑌
46.13 = 46.13 + 523.42�46.13
𝐴𝐴𝐴𝐴 ∗ 𝐿 ∗ 𝑌
330 Multilane Undivided and One-Way Highways 417.98 = 417.98 + 523.42�
417.98𝐴𝐴𝐴𝐴 ∗ 𝐿 ∗ 𝑌
52.77 = 52.77 + 523.42�52.77
𝐴𝐴𝐴𝐴 ∗ 𝐿 ∗ 𝑌
410 Rural 2-lane Highways with AADT < 2,000 101.25 = 101.25 + 523.42�
101.25𝐴𝐴𝐴𝐴 ∗ 𝐿 ∗ 𝑌
25.68 = 25.68 + 523.42�25.68
𝐴𝐴𝐴𝐴 ∗ 𝐿 ∗ 𝑌
420 Rural 2-lane Highways with 2,000 < AADT < 7,000 73.87 = 73.87 + 523.42�
73.87𝐴𝐴𝐴𝐴 ∗ 𝐿 ∗ 𝑌
17.37 = 17.37 + 523.42�17.37
𝐴𝐴𝐴𝐴 ∗ 𝐿 ∗ 𝑌
430 Rural 2-lane Highways with > 7,000 88.47 = 88.47 + 523.42�
88.47𝐴𝐴𝐴𝐴 ∗ 𝐿 ∗ 𝑌
17.75 = 17.75 + 523.42�17.75
𝐴𝐴𝐴𝐴 ∗ 𝐿 ∗ 𝑌
440 Low Speed 2-Lane Highways Posted at 40 mph or lower 283.09 = 283.09 + 523.42�
283.09𝐴𝐴𝐴𝐴 ∗ 𝐿 ∗ 𝑌
35.72 = 35.72 + 523.42�35.72
𝐴𝐴𝐴𝐴 ∗ 𝐿 ∗ 𝑌
AADT = Average Annual Daily Traffic (vehicles per day) L = Segment Length (miles) Y = Years * "Expressway" means a state trunk highway that, as determined by the department, has 4 or more lanes of traffic
physically separated by a median or barrier and that gives preference to through traffic by utilizing interchanges or limiting at-grade access to selected public roads and public driveways. WI State Statutes: 346.57 (1)(ag)

Page 4 of 12
Instructions for Statewide Average Crash Rates and Upper Control Limits To assist in the safety evaluation of roadways, WisDOT provides statewide average crash rates and UCLs for 12 different categories of state roadways. The following instructions are provided so segment crash rates are calculated and compared using consistent methodologies. In addition, information is provided to assist users in taking the appropriate actions based on the results of the comparisons. There are six steps involved with calculating and comparing segment crash rates and UCLs:
Step 1: Determine Segments Step 2: Determine Total Number of Crashes and KAB Crashes Step 3: Determine AADT Step 4: Calculate Crash Rates and KAB Crash Rates Step 5: Calculate Crate Rate UCLs and KAB Crash Rate UCLs Step 6: Compare Crash Rates and KAB Crash Rates to UCLs and Choose Action
Detailed instructions for each of the six steps are provided below: Step 1: Determine the roadway segments on your project. If multiple Peer Groups exist on your project, crash rates and UCLs should be calculated for each Peer Group by combining adjacent segments of the same Peer Group per the example in Figure 1.
Segments 0.1 miles or less should be excluded from crash rate comparisons unless combined with other segments.
Segments should not exceed 5 miles in length. If necessary, break a long segment into
segments less than 5 miles.
Figure 1: Combining Adjacent Peer Groups
Page 5 of 12
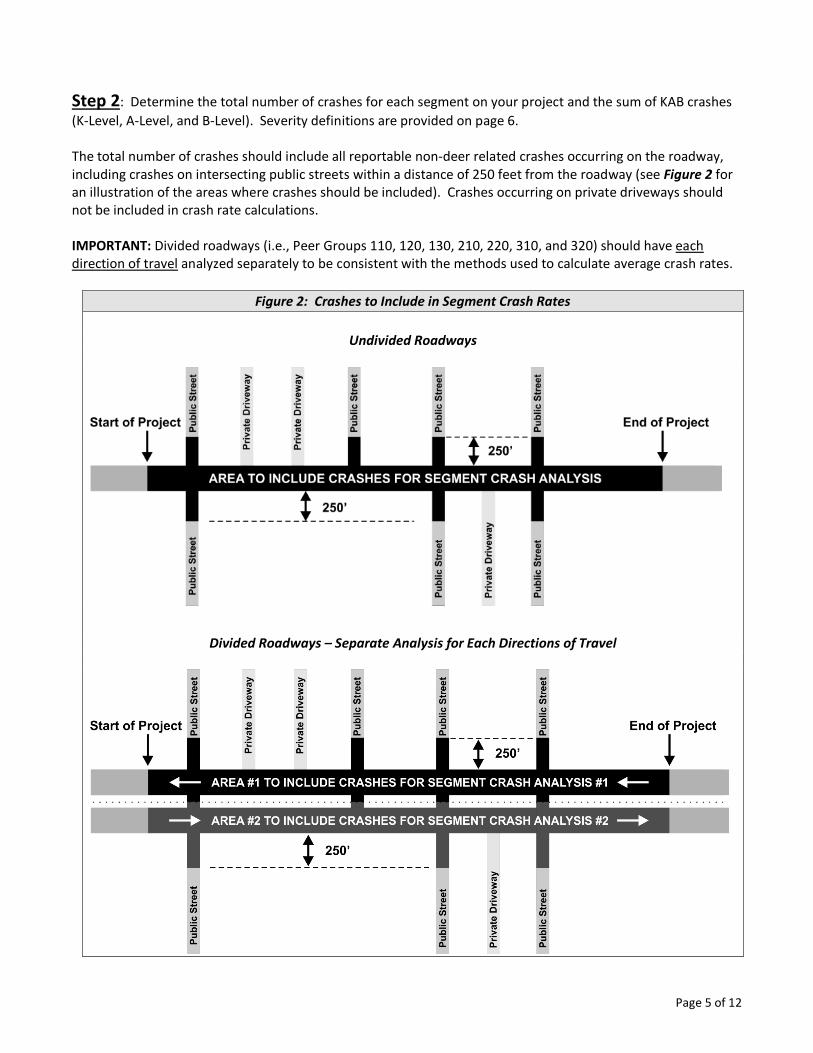
Step 2: Determine the total number of crashes for each segment on your project and the sum of KAB crashes (K-Level, A-Level, and B-Level). Severity definitions are provided on page 6. The total number of crashes should include all reportable non-deer related crashes occurring on the roadway, including crashes on intersecting public streets within a distance of 250 feet from the roadway (see Figure 2 for an illustration of the areas where crashes should be included). Crashes occurring on private driveways should not be included in crash rate calculations. IMPORTANT: Divided roadways (i.e., Peer Groups 110, 120, 130, 210, 220, 310, and 320) should have each direction of travel analyzed separately to be consistent with the methods used to calculate average crash rates.
Figure 2: Crashes to Include in Segment Crash Rates
Undivided Roadways
Divided Roadways – Separate Analysis for Each Directions of Travel

Page 6 of 12
Severity Definitions Crashes are broken out according to the definitions in the Law Enforcement Officer’s Instruction Manual for Completing the Wisconsin Motor Vehicle Accident Report Form:
Fatal (K) = Any injury from a traffic crash which results in death within 30 days of the crash.
A-level = Incapacitating Injury - Any injury other than a fatal injury, which prevents the injured person from walking, driving, or from performing other activities, which he/she performed before the crash.
B-level = Non-incapacitating Injury - Any injury, other than fatal or incapacitating, which is evident at the scene. Evidence of injury may include known symptoms of an injury, which are not directly observable.
C-level = Possible Injury - Any injury which is not observable or evident at the scene but is claimed by the individual or suspected by the law enforcement officer.
PDO = Property Damage Only - The definition of a reportable crash is based on reporting thresholds of $1000 for property damage to any one person’s property, $1000 for government-owned vehicles, or $200 for any other government-owned property, such as traffic control devices or guardrail. Any crash that meets these criteria is categorized as Property Damage Only (PDO).
Step 3: Identify or calculate the AADT for each segment on your project (see Step 1 for instructions about combining adjacent segments with the same Peer Group). If multiple AADTs exist within the same Peer Group, use Equation 1 to calculate a pro-rated AADT.
Equation 1: Pro-Rated AADT Pro-rate AADTs when combining adjacent segments of the same Peer Group that have varying AADTs.
AADTPR = 𝐿1∗𝐴𝐴𝐴𝐴1+𝐿2∗𝐴𝐴𝐴𝐴2+𝐿𝑖∗𝐴𝐴𝐴𝐴𝑖
𝐿1+𝐿2+𝐿𝑖 = Pro-Rated Annual Average Daily Traffic
L1 = Length of Segment #1 (miles) AADT1 = Annual Average Daily Traffic of Segment #1 L2 = Length of Segment #2 (miles) AADT2 = Annual Average Daily Traffic of Segment #2 Li = Length of Segment #i (miles) AADTi = Annual Average Daily Traffic of Segment #i Notes: 1. If multiple AADTs are provided for a particular segment (e.g., Year 2010 L1 = 5,000 and Year 2013 L1 = 6,500), use engineering judgment to calculate an AADT that best represents the five-year average.
2. Engineering judgment should be used when determining where AADT counts begin and end. Roadway characteristics that affect traffic volumes are typically good places to define AADT limits. For example, major intersections, driveways to traffic generating businesses, and transitions in surrounding land uses (e.g., urban to rural) are commonly used as start/stop points for AADTs.

Page 7 of 12
Step 4: Calculate segment crash rates (see Equation 2) and KAB Crash Rates (see Equation 3) for each segment on your project (see Step 1 for instructions about combining adjacent segments with the same Peer Group).
Equation 2: Segment Crash Rate
Segment Crash Rate = 𝐶∗100,000,000𝐴𝐴𝐴𝐴∗𝐿∗𝑌∗365
= Crashes per 100 million vehicle miles traveled (HMVMT)
C = Number of crashes in five year period (years 2010-2014) AADT = Annual Average Daily Traffic (if AADT varies along the roadway, see Equation 1) L = Length of segment (miles) Y = Number of years analyzed (5)
Equation 3: KAB Crash Rate
KAB Crash Rate = 𝐶𝐾𝐾𝐾∗100,000,000𝐴𝐴𝐴𝐴∗𝐿∗𝑌∗365
= KAB Crashes per HMVMT
CKAB = Sum of K-level, A-level, and B-level crashes in five year period (years 2010-2014) AADT = Annual Average Daily Traffic (if AADT varies along the roadway, see Equation 1) L = Length of segment (miles) Y = Number of years analyzed (5)

Page 8 of 12
Step 5: Calculate crash rate and KAB Crash Rate UCLs for each segment on your project per the formulas provided in Table 1. Example calculations are provided below:
Example UCL Calculations Rural Two-Lane Highway AADT = 4,500 Length = 2.0 Miles Crash Rate = 70 crashes per 100 MVM KAB Crash Rate = 50 KAB crashes per 100 MVM Classification: Peer Group (420) Rural 2-Lane Highway with 2,000 < AADT < 7,000 Example UCL Calculations for Peer Group (420) – See Table 1 to find equations for UCLs
𝐶𝐶𝐶𝐶ℎ 𝑅𝐶𝑅𝑅 𝑈𝐶𝐿 = 73.87 + 523.42�73.87
𝐴𝐴𝐴𝐴 ∗ 𝐿 ∗ 𝑌
𝐶𝐶𝐶𝐶ℎ 𝑅𝐶𝑅𝑅 𝑈𝐶𝐿 = 73.87 + 523.42�73.87
4,500 ∗ 2.0 ∗ 5= 95.08 𝐶𝐶𝐶𝐶ℎ𝑅𝐶 𝑝𝑅𝐶 100 𝑀𝑀𝑀
𝐾𝐴𝐾 𝑅𝐶𝑅𝑅 𝑈𝐶𝐿 = 17.37 + 523.42�17.37
𝐴𝐴𝐴𝐴 ∗ 𝐿 ∗ 𝑌
𝐾𝐴𝐾 𝑅𝐶𝑅𝑅 𝑈𝐶𝐿 = 17.37 + 523.42�17.37
4,500 ∗ 2.0 ∗ 5= 27.65 𝐾𝐴𝐾 𝐶𝐶𝐶𝐶ℎ𝑅𝐶 𝑝𝑅𝐶 100 𝑀𝑀𝑀
Results: The segment’s crash rate of 70 crashes per 100 MVM is less than the crash rate UCL of 95.08, but the segment’s KAB Crash Rate of 50 crashes per 100 MVM is higher than the KAB Crash Rate UCL of 27.65. See Step 6 for how to interpret these results and what actions are suggested.

Page 9 of 12
Step 6: Compare your segment’s crash rate and KAB Crash Rates to the calculated UCLs. Use the flowchart in Figure 3 to determine what action should be taken.
Figure 3: Action Flow Chart
Segment Crash Rate > Crash Rate UCL OR
KAB Crash Rate > KAB Crash Rate UCL
Yes
Actions:
1. Further investigation is needed to understand possible contributing factors, and if roadway safety improvements could reduce crashes.
2. Identify any significant crash concentration locations (e.g. intersections or short sections of highway) or other crash patterns that might exist and explain the possible causes of the crashes. If no patterns are found, that should be stated so it is known that the crashes were examined. FDM 3-15-25, 4.3.3.2.2
Action:
1. Identify any significant crash concentration locations (e.g. intersections or short sections of highway) or other crash patterns that might exist and explain the possible causes of the crashes. If no patterns are found, that should be stated so it is known that the crashes were examined. FDM 3-15-25, 4.3.3.2.2
No

Page 10 of 12
Local Road Crash Rates Table 2 includes statewide average crash rates for local roads which are broken into Urban Street and Rural County Trunk Highways. The Urban Street category includes urban city streets, rural city streets and urban county trunk highways. The local road crash rates and KAB segment crash rates have been consolidated to a 5-year average for two peer groups. UCLs are provided to help identify where further analysis might be beneficial.
Table 2: 2010-2014 Statewide Average Roadway Crash Rates, KAB Crash Rates, and UCLs for Local Roads
Crash Rate KAB Crash Rate
Local Road Group Average UCL Average UCL
Urban Streets 332.33 = 332.33 + 523.42�332.33
𝐴𝐴𝐴𝐴 ∗ 𝐿 ∗ 𝑌 38.21 = 38.21 + 523.42�
38.21𝐴𝐴𝐴𝐴 ∗ 𝐿 ∗ 𝑌
Rural County Trunk Highways 99.80 = 99.80 + 523.42�99.80
𝐴𝐴𝐴𝐴 ∗ 𝐿 ∗ 𝑌 22.99 = 22.99 + 523.42�
22.99𝐴𝐴𝐴𝐴 ∗ 𝐿 ∗ 𝑌
AADT = Average Annual Daily Traffic (vehicles per day) L = Segment Length (miles) Y = Years
Page 11 of 12
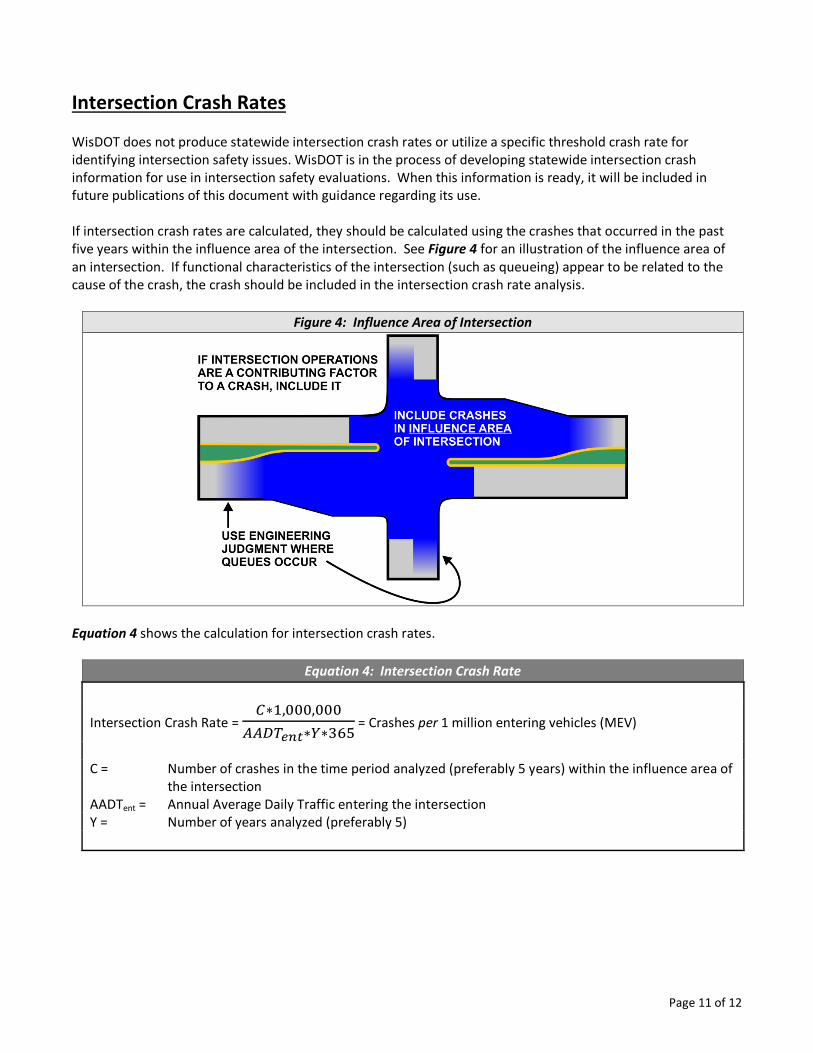
Intersection Crash Rates WisDOT does not produce statewide intersection crash rates or utilize a specific threshold crash rate for identifying intersection safety issues. WisDOT is in the process of developing statewide intersection crash information for use in intersection safety evaluations. When this information is ready, it will be included in future publications of this document with guidance regarding its use. If intersection crash rates are calculated, they should be calculated using the crashes that occurred in the past five years within the influence area of the intersection. See Figure 4 for an illustration of the influence area of an intersection. If functional characteristics of the intersection (such as queueing) appear to be related to the cause of the crash, the crash should be included in the intersection crash rate analysis.
Figure 4: Influence Area of Intersection
Equation 4 shows the calculation for intersection crash rates.
Equation 4: Intersection Crash Rate
Intersection Crash Rate = 𝐶∗1,000,000
𝐴𝐴𝐴𝐴𝑒𝑒𝑒∗𝑌∗365 = Crashes per 1 million entering vehicles (MEV)
C = Number of crashes in the time period analyzed (preferably 5 years) within the influence area of
the intersection AADTent = Annual Average Daily Traffic entering the intersection Y = Number of years analyzed (preferably 5)

Page 12 of 12
Ramp Crash Rates Crashes that occurred on ramps at service interchanges are not included in the crashes used to calculate the statewide average crash rates for roadways. WisDOT is in the process of developing statewide ramp crash information for use in comparisons. When this information is ready, it will be included in future publications of this document with guidance regarding its use. Crashes that occurred on ramps at system interchanges (i.e., freeway to freeway) are included in the crashes used to calculate the corresponding freeway Peer Group average crash rates. Please see Figure 5a for an illustration of service versus system interchanges.
Figure 5a: Service versus System Interchanges
At service interchanges, the variability in ramp designs and interchange configurations present challenges for conducting consistent analysis. If crash analysis is conducted at a service interchange, it is suggested the analysis be conducted using the categorizations shown in Figure 5b.
Figure 5b: Ramp Detail at Service Interchanges
The definitions shown in Figure 5b for speed-change areas and freeway segments are based on definitions in the Enhanced Interchange Safety Analysis Tool (ISETe): User Manual, published May 31st, 2012 through the National Cooperative Highway Research Program (NCHRP). Figure 5b also includes guidance about defining ramps and the influence area of intersections, which are definitions specific to WisDOT business practices.