new tuning features in oracle 11g - how to make your database as boring as possible
TRANSCRIPT

SAGE Computing ServicesCustomised Oracle Training Workshops and Consulting
New Tuning Features in Oracle 11g -How to make your database as boring as possible
Penny CooksonManaging Director
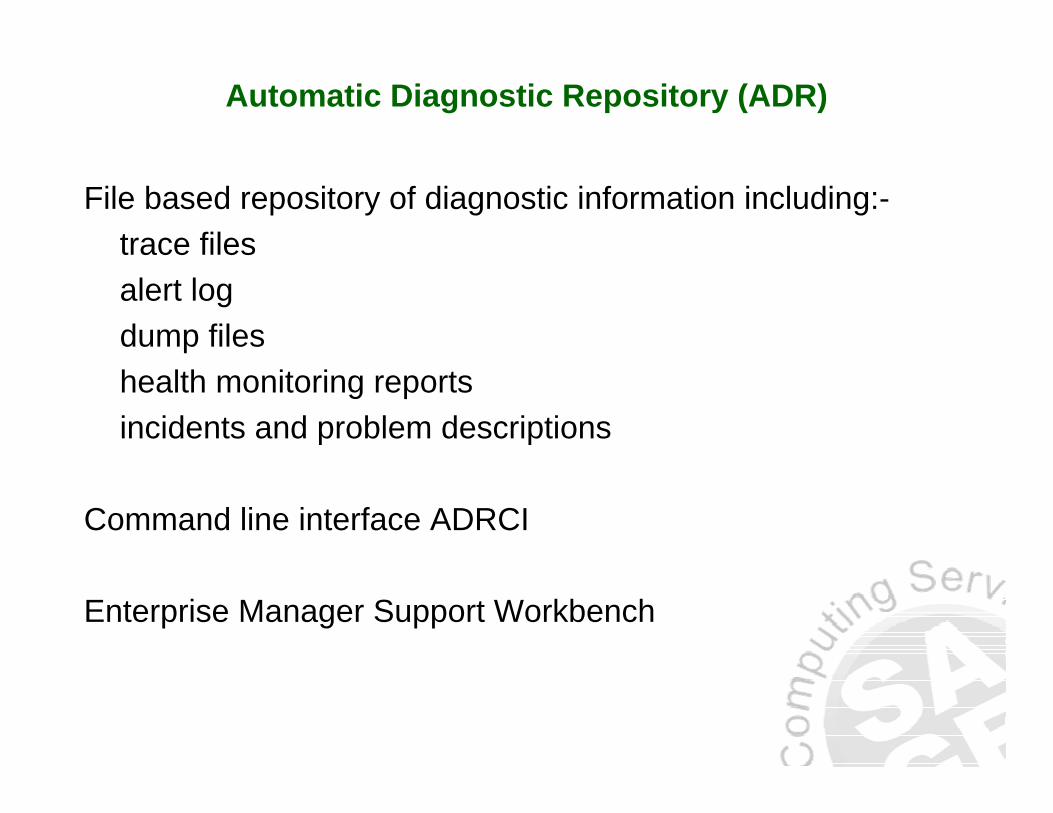
Automatic Diagnostic Repository (ADR)
File based repository of diagnostic information including:-trace filesalert logdump fileshealth monitoring reportsincidents and problem descriptions
Command line interface ADRCI
Enterprise Manager Support Workbench

Finding Trace Files
diagnostic directory
directory for each product
default trace directory
ADR base

Finding Trace Files
SELECT name, description, value , isdeprecatedFROM v$parameterWHERE name = 'diagnostic_dest'OR name like '%dump%'

Finding Trace Files
SELECT *FROM v$diag_info

Finding Trace Files
SELECT pid, program, tracefileFROM v$process

Bind Peeking and Adaptive Cursors
Bind Peeking + Adaptive Cursors
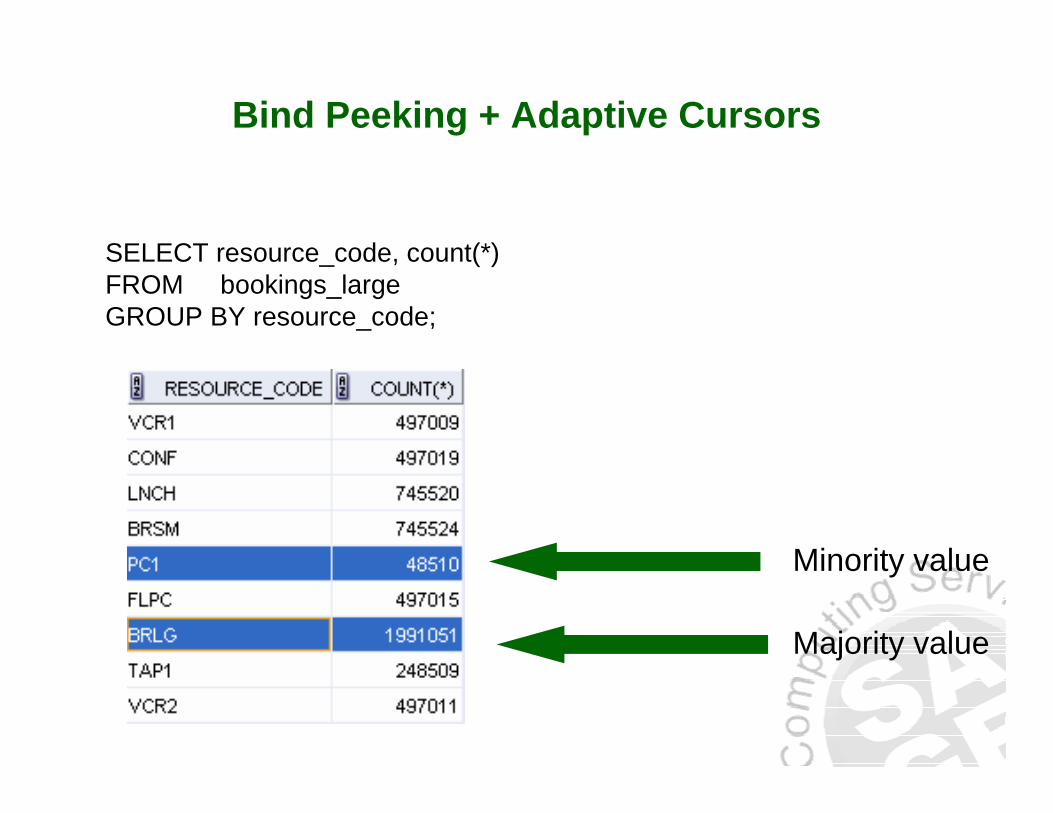
SELECT resource_code, count(*) FROM bookings_largeGROUP BY resource_code;
Majority value
Minority value

Bind Peeking
Look at the value of the bind variable when the statement is parsed
Plan is based on that value
BEGIN :v3 := ‘PC1'; END;
SELECT COUNT(quantity)FROM bookings_largeWHERE resource_code = :v3;
BEGIN :v3 := ‘BRLG'; END;
SELECT COUNT(quantity)FROM bookings_largeWHERE resource_code = :v3;
SAME PLAN STILL INDEX
for 34% of rows
INDEX for <1% of rows
Bind Peeking + Adaptive Cursors
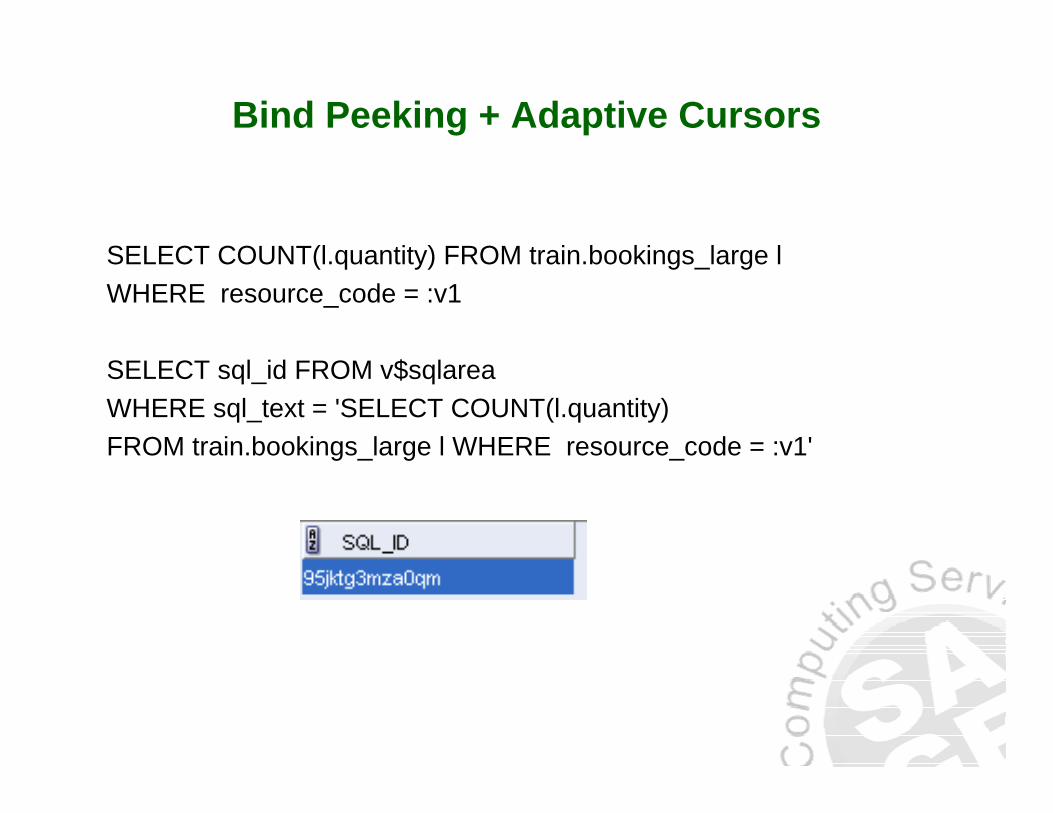
SELECT COUNT(l.quantity) FROM train.bookings_large l WHERE resource_code = :v1
SELECT sql_id FROM v$sqlareaWHERE sql_text = 'SELECT COUNT(l.quantity) FROM train.bookings_large l WHERE resource_code = :v1'

Bind Peeking + Adaptive Cursors
BEGIN :v1 := 'PC1'; END;SELECT COUNT(l.quantity) FROM train.bookings_large l WHERE resource_code = :v1
SELECT sql_id, child_number, is_bind_sensitive, is_bind_awareFROM v$sqlWHERE sql_id ='95jktg3mza0qm';
IS_BIND_SENSITIVE - may need to change the plan- set on first execution of the statement
IS_BIND_AWARE - do need to change the plan

Bind Peeking + Adaptive Cursors
SELECT child_number, bind_set_hash_value, peeked, executions, rows_processed, buffer_gets
FROM v$sql_cs_statisticsWHERE sql_id ='95jktg3mza0qm'

Bind Peeking + Adaptive Cursorscall count cpu elapsed disk query current rows------- ------ -------- ---------- ---------- ---------- ---------- ----------Parse 1 0.00 0.00 0 0 0 0Execute 1 0.01 0.01 0 0 0 0Fetch 2 0.12 0.43 119 6635 0 1------- ------ -------- ---------- ---------- ---------- ---------- ----------total 4 0.14 0.44 119 6635 0 1Misses in library cache during parse: 1Misses in library cache during execute: 1Optimizer mode: ALL_ROWSParsing user id: 82
Rows Row Source Operation------- ---------------------------------------------------
1 SORT AGGREGATE (cr=6635 pr=119 pw=119 time=0 us)48510 TABLE ACCESS BY INDEX ROWID BOOKINGS_LARGE (cr=6635 pr=119 pw=119 time=2870 us cost=1977 size=316008 card=39501)
48510 INDEX RANGE SCAN BK_RES2 (cr=104 pr=0 pw=0 time=527 us cost=90 size=0 card=39501)(object id 69870)
********************************************************************************Elapsed times include waiting on following events:
Event waited on Times Max. Wait Total Waited---------------------------------------- Waited ---------- ------------SQL*Net message to client 2 0.00 0.00SQL*Net message from client 2 0.00 0.00
********************************************************************************

Bind Peeking + Adaptive Cursors
BEGIN :v1 := ‘BRLG'; END;SELECT COUNT(l.quantity) FROM train.bookings_large l WHERE resource_code = :v1
SELECT sql_id, child_number, is_bind_sensitive, is_bind_awareFROM v$sqlWHERE sql_id ='95jktg3mza0qm';

Bind Peeking + Adaptive Cursors
SELECT child_number, bind_set_hash_value, peeked, executions, rows_processed, buffer_gets
FROM v$sql_cs_statisticsWHERE sql_id ='95jktg3mza0qm'

Bind Peeking + Adaptive Cursorscall count cpu elapsed disk query current rows------- ------ -------- ---------- ---------- ---------- ---------- ----------Parse 1 0.00 0.00 0 0 0 0Execute 1 0.00 0.00 0 0 0 0Fetch 2 6.29 78.82 34335 39594 0 1------- ------ -------- ---------- ---------- ---------- ---------- ----------total 4 6.29 78.82 34335 39594 0 1
Misses in library cache during parse: 0Optimizer mode: ALL_ROWSParsing user id: 82
Rows Row Source Operation------- ---------------------------------------------------
1 SORT AGGREGATE (cr=39594 pr=34335 pw=34335 time=0 us)1991051 TABLE ACCESS BY INDEX ROWID BOOKINGS_LARGE (cr=39594 pr=34335 pw=34335 time=626800
us cost=1977 size=316008 card=39501)1991051 INDEX RANGE SCAN BK_RES2 (cr=4437 pr=4436 pw=4436 time=61616 us cost=90 size=0
card=39501)(object id 69870)
Elapsed times include waiting on following events:Event waited on Times Max. Wait Total Waited---------------------------------------- Waited ---------- ------------SQL*Net message to client 2 0.00 0.00db file sequential read 34335 0.29 72.08resmgr:cpu quantum 30 0.10 1.29SQL*Net message from client 2 0.00 0.00
********************************************************************************

Bind Peeking + Adaptive Cursors
BEGIN :v1 := ‘BRLG'; END;SELECT COUNT(l.quantity) FROM train.bookings_large l WHERE resource_code = :v1
SELECT sql_id, child_number, is_bind_sensitive, is_bind_awareFROM v$sqlWHERE sql_id ='95jktg3mza0qm';

Bind Peeking + Adaptive Cursors
SELECT child_number, bind_set_hash_value, peeked, executions, rows_processed, buffer_gets
FROM v$sql_cs_statisticsWHERE sql_id ='95jktg3mza0qm'

Bind Peeking + Adaptive Cursorscall count cpu elapsed disk query current rows------- ------ -------- ---------- ---------- ---------- ---------- ----------Parse 1 0.00 0.00 0 0 0 0Execute 1 0.00 0.00 0 0 0 0Fetch 2 1.23 21.71 35341 35346 0 1------- ------ -------- ---------- ---------- ---------- ---------- ----------total 4 1.23 21.72 35341 35346 0 1
Misses in library cache during parse: 0Misses in library cache during execute: 1Optimizer mode: ALL_ROWSParsing user id: 82
Rows Row Source Operation------- ---------------------------------------------------
1 SORT AGGREGATE (cr=35346 pr=35341 pw=35341 time=0 us)1991051 TABLE ACCESS FULL BOOKINGS_LARGE (cr=35346 pr=35341 pw=35341 time=414975 us
cost=9652 size=15700664 card=1962583)
Elapsed times include waiting on following events:Event waited on Times Max. Wait Total Waited---------------------------------------- Waited ---------- ------------SQL*Net message to client 2 0.00 0.00direct path read 314 0.42 19.45SQL*Net message from client 2 0.10 0.10
********************************************************************************

Bind Peeking + Adaptive Cursors - Executions
SELECT s.executions v$sqlex, c.sql_id, c.executions cs_stat_exec , c.peeked
FROM v$sql_cs_statistics c, v$sql sWHERE s.sql_id = c.sql_idAND s.child_number = c.child_numberAND s.sql_id ='95jktg3mza0qm'

Bind Peeking + Adaptive Cursors - Summary
Statements with histograms and bind variables are bind sensitive
The first time you execute a statement with different selectivity it uses the original plan
The second time it changes the plan and become bind aware
Be careful when statements become invalidated by:-Gathering statisticsFlushing the shared poolRestarting the databaseOr when they are aged out
Otherwise you don’t need to worry any more

Gathering Statistics

Multi Column Statistics
Gather statistics on combinations of columnsImproves plans for complex dependency patterns
SELECT count(b.comments)FROM train.events_large e, train.bookings_large bWHERE e.org_id = 2264AND e.event_no = b.event_noAND e.comments = 'TEST'

Multi Column Data Patterns
SELECT count(*)FROM train.events_large e
SELECT count(*)FROM train.events_large eWHERE e.org_id = 2264
SELECT count(e.comments)FROM train.events_large eWHERE e.comments = 'TEST'
SELECT count(e.comments)FROM train.events_large eWHERE e.comments = 'TEST‘AND e.org_id = 2264

With Individual Statistics
call count cpu elapsed disk query current rows------- ------ -------- ---------- ---------- ---------- ---------- ----------Parse 1 0.00 0.00 0 0 0 0Execute 1 0.00 0.00 0 0 0 0Fetch 2 5.00 22.52 35341 36337 0 1------- ------ -------- ---------- ---------- ---------- ---------- ----------total 4 5.00 22.52 35341 36337 0 1
Misses in library cache during parse: 1Optimizer mode: ALL_ROWSParsing user id: 82
Rows Row Source Operation------- ---------------------------------------------------
1 SORT AGGREGATE (cr=36337 pr=35341 pw=35341 time=0 us)175 HASH JOIN (cr=36337 pr=35341 pw=35341 time=13 us cost=9966 size=33365083 card=1076293)4 TABLE ACCESS FULL EVENTS_LARGE (cr=991 pr=0 pw=0 time=3 us cost=274 size=319770 card=18810)
5767168 TABLE ACCESS FULL BOOKINGS_LARGE (cr=35346 pr=35341 pw=35341 time=225583 us cost=9665 size=80740352 card=5767168)
Elapsed times include waiting on following events:Event waited on Times Max. Wait Total Waited---------------------------------------- Waited ---------- ------------SQL*Net message to client 2 0.00 0.00direct path read 314 0.38 15.88resmgr:cpu quantum 11 0.14 0.27SQL*Net message from client 2 0.04 0.04
********************************************************************************

Auto Created Column Statistics
BEGINdbms_stats.gather_table_stats(ownname=>'TRAIN',
tabname=>'EVENTS_LARGE', cascade=>TRUE, method_opt => 'FOR ALL COLUMNS SIZE AUTO', no_invalidate=>FALSE);
END;
SELECT column_name, histogram, num_bucketsFROM user_tab_col_statisticsWHERE table_name = 'EVENTS_LARGE'

Auto Created Column Statistics
SELECT extension_name, extension FROM user_stat_extensionsWHERE table_name='EVENTS_LARGE‘
Same access path used
********************************************************************************Rows Row Source Operation------- ---------------------------------------------------
1 SORT AGGREGATE (cr=36337 pr=35341 pw=35341 time=0 us)175 HASH JOIN (cr=36337 pr=35341 pw=35341 time=13 us cost=9966 size=33365083 card=1076293)4 TABLE ACCESS FULL EVENTS_LARGE (cr=991 pr=0 pw=0 time=3 us cost=274 size=319770 card=18810)
5767168 TABLE ACCESS FULL BOOKINGS_LARGE (cr=35346 pr=35341 pw=35341 time=225583 us cost=9665 size=80740352 card=5767168)

Manually Create Multi Column Statistics
BEGINdbms_stats.gather_table_stats(ownname=>'TRAIN',
tabname=>'EVENTS_LARGE', cascade=>TRUE, method_opt => 'FOR COLUMNS (org_id, comments) SIZE SKEWONLY', no_invalidate=>FALSE);
END;
SELECT extension_name, extension FROM user_stat_extensionsWHERE table_name='EVENTS_LARGE'

Manually Create Multi Column Statistics
SELECT column_name, histogram, num_bucketsFROM user_tab_col_statisticsWHERE table_name = 'EVENTS_LARGE'

Multi Column Statistics********************************************************************************
SELECT count(b.comments)FROM train.events_large e, train.bookings_large bWHERE e.org_id = 2264AND e.event_no = b.event_noAND e.comments = 'TEST'
call count cpu elapsed disk query current rows------- ------ -------- ---------- ---------- ---------- ---------- ----------Parse 1 0.00 0.00 0 0 0 0Execute 1 0.00 0.00 0 0 0 0Fetch 2 0.01 0.01 0 1175 0 1------- ------ -------- ---------- ---------- ---------- ---------- ----------total 4 0.01 0.01 0 1175 0 1
Rows Row Source Operation------- ---------------------------------------------------
1 SORT AGGREGATE (cr=1175 pr=0 pw=0 time=0 us)175 NESTED LOOPS (cr=1175 pr=0 pw=0 time=71 us)175 NESTED LOOPS (cr=1001 pr=0 pw=0 time=39 us cost=1129 size=26815 card=865)4 TABLE ACCESS FULL EVENTS_LARGE (cr=991 pr=0 pw=0 time=4 us cost=274 size=255 card=15)
175 INDEX RANGE SCAN BK_EVT2 (cr=10 pr=0 pw=0 time=10 us cost=2 size=0 card=57)(object id 69868)175 TABLE ACCESS BY INDEX ROWID BOOKINGS_LARGE (cr=174 pr=0 pw=0 time=0 us cost=57 size=798 card=57)
Elapsed times include waiting on following events:Event waited on Times Max. Wait Total Waited---------------------------------------- Waited ---------- ------------SQL*Net message to client 2 0.00 0.00SQL*Net message from client 2 0.02 0.02
********************************************************************************

Multi Column Statistics********************************************************************************
SELECT count(b.comments)FROM train.organisations o, train.events_large e, train.bookings_large b,
train.resources rWHERE o.org_id = e.org_idAND e.event_no = b.event_noAND b.resource_code = r.codeAND o.name = 'Australian Medical Systems'AND r.description = 'Buffet Lunch'AND e.comments = 'TEST'
call count cpu elapsed disk query current rows------- ------ -------- ---------- ---------- ---------- ---------- ----------Parse 1 0.00 0.00 0 0 0 0Execute 1 0.00 0.00 0 0 0 0Fetch 2 4.64 21.66 35341 36351 0 1------- ------ -------- ---------- ---------- ---------- ---------- ----------total 4 4.64 21.66 35341 36351 0 1
Misses in library cache during parse: 0Optimizer mode: ALL_ROWSParsing user id: 82

Multi Column Statistics********************************************************************************Rows Row Source Operation------- ---------------------------------------------------
1 SORT AGGREGATE (cr=36351 pr=35341 pw=35341 time=0 us)25 HASH JOIN (cr=36351 pr=35341 pw=35341 time=1966789 us cost=9972 size=6555490
card=79945)4 HASH JOIN (cr=1005 pr=0 pw=0 time=8 us cost=281 size=792225 card=12575)1 MERGE JOIN CARTESIAN (cr=14 pr=0 pw=0 time=0 us cost=6 size=46 card=1)1 TABLE ACCESS FULL ORGANISATIONS (cr=7 pr=0 pw=0 time=0 us cost=3 size=26
card=1)1 BUFFER SORT (cr=7 pr=0 pw=0 time=0 us cost=3 size=20 card=1)1 TABLE ACCESS FULL RESOURCES (cr=7 pr=0 pw=0 time=0 us cost=3 size=20
card=1)75243 TABLE ACCESS FULL EVENTS_LARGE (cr=991 pr=0 pw=0 time=1020 us cost=274 size=1282616 card=75448)
5767168 TABLE ACCESS FULL BOOKINGS_LARGE (cr=35346 pr=35341 pw=35341 time=350849 us cost=9665 size=109576192 card=5767168)
Elapsed times include waiting on following events:Event waited on Times Max. Wait Total Waited---------------------------------------- Waited ---------- ------------SQL*Net message to client 2 0.00 0.00direct path read 314 0.35 15.49resmgr:cpu quantum 2 0.12 0.12SQL*Net message from client 2 0.04 0.05
********************************************************************************

Multi Column Statistics - Summary
Manually create column groups and statistics on them
Complex joins may still need SQL Profiles
Use for dependent column such as Country, State

Expression Statistics
SELECT comments, count(*) FROM events_largeGROUP by comments ORDER by count(*) desc

Expression Statistics
BEGINdbms_stats.gather_table_stats(ownname=>'TRAIN',
tabname=>'EVENTS_LARGE', cascade=>TRUE, method_opt => 'FOR ALL COLUMNS SIZE AUTO', no_invalidate=>FALSE);
END;
SELECT column_name, histogram, num_bucketsFROM user_tab_col_statisticsWHERE table_name = 'EVENTS_LARGE'

Expression Statistics********************************************************************************
SELECT count(b.comments)FROM train.events_large e, train.bookings_large bWHERE e.event_no = b.event_noAND e.comments = 'Comments8'
call count cpu elapsed disk query current rows------- ------ -------- ---------- ---------- ---------- ---------- ----------Parse 1 0.00 0.00 0 0 0 0Execute 1 0.00 0.00 0 0 0 0Fetch 2 0.01 0.01 0 1052 0 1------- ------ -------- ---------- ---------- ---------- ---------- ----------total 4 0.01 0.01 0 1052 0 1

Expression StatisticsRows Row Source Operation------- ---------------------------------------------------
1 SORT AGGREGATE (cr=1052 pr=0 pw=0 time=0 us)58 NESTED LOOPS (cr=1052 pr=0 pw=0 time=28 us)58 NESTED LOOPS (cr=994 pr=0 pw=0 time=7 us cost=331 size=1178 card=38)1 TABLE ACCESS FULL EVENTS_LARGE (cr=991 pr=0 pw=0 time=0 us cost=274 size=17
card=1)58 INDEX RANGE SCAN BK_EVT2 (cr=3 pr=0 pw=0 time=3 us cost=2 size=0
card=57)(object id 69868)58 TABLE ACCESS BY INDEX ROWID BOOKINGS_LARGE (cr=58 pr=0 pw=0 time=0 us cost=57
size=798 card=57)
Elapsed times include waiting on following events:Event waited on Times Max. Wait Total Waited---------------------------------------- Waited ---------- ------------SQL*Net message to client 2 0.00 0.00SQL*Net message from client 2 0.02 0.02
********************************************************************************

Expression Statistics********************************************************************************
SELECT count(b.comments)FROM train.events_large e, train.bookings_large bWHERE e.event_no = b.event_noAND initcap(e.comments) = 'Comments8'
call count cpu elapsed disk query current rows------- ------ -------- ---------- ---------- ---------- ---------- ----------Parse 1 0.01 0.00 0 0 0 0Execute 1 0.00 0.00 0 0 0 0Fetch 2 5.70 21.52 35341 36337 0 1------- ------ -------- ---------- ---------- ---------- ---------- ----------total 4 5.71 21.52 35341 36337 0 1

Expression StatisticsRows Row Source Operation------- ---------------------------------------------------
1 SORT AGGREGATE (cr=36337 pr=35341 pw=35341 time=0 us)58 HASH JOIN (cr=36337 pr=35341 pw=35341 time=624644 us cost=9967 size=1779493
card=57403)1 TABLE ACCESS FULL EVENTS_LARGE (cr=991 pr=0 pw=0 time=0 us cost=275
size=17051 card=1003)5767168 TABLE ACCESS FULL BOOKINGS_LARGE (cr=35346 pr=35341 pw=35341 time=301177 us
cost=9665 size=80740352 card=5767168)
Elapsed times include waiting on following events:Event waited on Times Max. Wait Total Waited---------------------------------------- Waited ---------- ------------SQL*Net message to client 2 0.00 0.00direct path read 314 0.41 15.12resmgr:cpu quantum 2 0.10 0.10SQL Net message from client 2 0.03 ********************************************************************************

Expression Statistics
BEGINdbms_stats.gather_table_stats(ownname=>'TRAIN',
tabname=>'EVENTS_LARGE', cascade=>TRUE, method_opt => 'FOR COLUMNS (INITCAP(comments)) SIZE SKEWONLY', no_invalidate=>FALSE);
END;
SELECT extension_name, extension FROM user_stat_extensionsWHERE table_name='EVENTS_LARGE'

Expression Statistics
SELECT column_name, histogram, num_bucketsFROM user_tab_col_statisticsWHERE table_name = 'EVENTS_LARGE'

Expression Statistics********************************************************************************
SELECT count(b.comments)FROM train.events_large e, train.bookings_large bWHERE e.event_no = b.event_noAND initcap(e.comments) = 'Comments8'
call count cpu elapsed disk query current rows------- ------ -------- ---------- ---------- ---------- ---------- ----------Parse 1 0.00 0.00 0 2 0 0Execute 1 0.00 0.00 0 0 0 0Fetch 2 0.03 0.04 0 1052 0 1------- ------ -------- ---------- ---------- ---------- ---------- ----------total 4 0.03 0.04 0 1054 0 1

Expression StatisticsRows Row Source Operation------- ---------------------------------------------------
1 SORT AGGREGATE (cr=1052 pr=0 pw=0 time=0 us)58 NESTED LOOPS (cr=1052 pr=0 pw=0 time=27 us)58 NESTED LOOPS (cr=994 pr=0 pw=0 time=7 us cost=332 size=2223 card=57)1 TABLE ACCESS FULL EVENTS_LARGE (cr=991 pr=0 pw=0 time=0 us cost=275 size=25
card=1)58 INDEX RANGE SCAN BK_EVT2 (cr=3 pr=0 pw=0 time=3 us cost=2 size=0
card=57)(object id 69868)58 TABLE ACCESS BY INDEX ROWID BOOKINGS_LARGE (cr=58 pr=0 pw=0 time=0 us cost=57
size=798 card=57)
Elapsed times include waiting on following events:Event waited on Times Max. Wait Total Waited---------------------------------------- Waited ---------- ------------SQL*Net message to client 2 0.00 0.00SQL*Net message from client 2 0.02 0.02

Gathering Statistics - Preferences

Setting Statistics Gathering Defaults
Obsolete:GET_PARAMSET_PARAM Procedure
Use: GET_PREFS FunctionSET_TABLE_PREFS (set for individual tables)SET_DATABASE_PREFS (sets for all tables, can include/exclude
SYS tables)SET_GLOBAL_PREFS – for new objects

Setting Statistics Gathering Defaults

Setting Statistics Gathering Defaults

Setting Statistics Gathering Defaults
Doesn’t work

Table PrefsPROCEDURE SET_TABLE_PREFSArgument Name Type In/Out Default?------------------------------ ----------------------- ------ --------OWNNAME VARCHAR2 INTABNAME VARCHAR2 INPNAME VARCHAR2 INPVALUE VARCHAR2 IN
PNAMECASCADEDEGREEESTIMATE_PERCENTMETHOD_OPTNO_INVALIDATEGRANULARITYPUBLISHINCREMENTAL (only scan partitions that have been changed)STALE_PERCENT

Table Prefs - Example
BEGINdbms_stats.set_table_prefs(ownname=>'TRAIN',
tabname=>'EVENTS_LARGE',pname=>'STALE_PERCENT', pvalue=>'30');
dbms_stats.set_table_prefs(ownname=>'TRAIN', tabname=>'EVENTS_LARGE',pname=>'METHOD_OPT', pvalue=>'FOR ALL COLUMNS SIZE AUTO');
END;
SELECT * FROM DBA_TAB_STAT_PREFS;

Gathering and Publishing
Set preferences to PUBLISH = ‘FALSE’
Gather Statisticsuser_tab_pending_statsuser_ind_pending_statsuser_col_pending_stats
Run test case
Alter session setoptimizer_pending_statistics= TRUE
Run test case Worse
Better
dbms_stats.delete_pending_stats
dbms_stats.publish_pending_stats
user_tab_statisticsuser_ind_statisticsuser_tab_col_statistics

Gathering and Publishing
SELECT obj#, TO_CHAR(savtime,'dd/mm/yyyy') save_time, rowcnt, blkcnt, avgrln, samplesize, analyzetime
FROM wri$_optstat_tab_historyORDER BY savtime desc

Gathering and Publishing
Never publish any statistics until you are happy they work better

Automatic Tuning

Automatic TuningAutomatic SQL Tuning (maintenance window)
Automatic Workload Repository (AWR)
Identify high load candidates for tuning
for each statement
Run SQL TuningAdvisor
Test with and without profile
ACCEPT_SQL_PROFILES=true
ACCEPT_SQL_PROFILES=false(default)
SQL Profiles
Report

Automatic Tuning

Automatic Tuning

Automatic Tuning

Automatic Tuning

Automatic Tuning

Automatic Tuning

Automatic Tuning
SELECT count(b.comments)FROM train.organisations o, train.events_large e,
train.bookings_large b, train.resources rWHERE o.org_id = e.org_idAND e.event_no = b.event_noAND b.resource_code = r.codeAND o.name = 'Australian Medical Systems'AND r.description = 'Buffet Lunch'AND e.comments = 'TEST'
Automatic Tuning

Automatic Tuning

Automatic Tuningcall count cpu elapsed disk query current rows------- ------ -------- ---------- ---------- ---------- ---------- ----------Parse 1 0.00 0.00 0 0 0 0Execute 1 0.00 0.00 0 0 0 0Fetch 1 5.84 19.13 35341 36351 0 1------- ------ -------- ---------- ---------- ---------- ---------- ----------total 3 5.84 19.13 35341 36351 0 1
Rows Row Source Operation------- ---------------------------------------------------
1 SORT AGGREGATE (cr=36351 pr=35341 pw=35341 time=0 us)149 HASH JOIN (cr=36351 pr=35341 pw=35341 time=66 us cost=9972 size=6504732 card=79326)19 HASH JOIN (cr=1005 pr=0 pw=0 time=10 us cost=281 size=786051 card=12477)1 MERGE JOIN CARTESIAN (cr=14 pr=0 pw=0 time=0 us cost=6 size=46 card=1)1 TABLE ACCESS FULL ORGANISATIONS (cr=7 pr=0 pw=0 time=0 us cost=3 size=26 card=1)1 BUFFER SORT (cr=7 pr=0 pw=0 time=0 us cost=3 size=20 card=1)1 TABLE ACCESS FULL RESOURCES (cr=7 pr=0 pw=0 time=0 us cost=3 size=20 card=1)
74511 TABLE ACCESS FULL EVENTS_LARGE (cr=991 pr=0 pw=0 time=1410 us cost=274 size=1272688 card=74864)
5767168 TABLE ACCESS FULL BOOKINGS_LARGE (cr=35346 pr=35341 pw=35341 time=233788 us cost=9665 size=109576192 card=5767168)
Elapsed times include waiting on following events:Event waited on Times Max. Wait Total Waited---------------------------------------- Waited ---------- ------------SQL*Net message to client 2 0.00 0.00SQL*Net message from client 2 4.20 4.20direct path read 314 0.45 11.84
********************************************************************************

Automatic Tuningcall count cpu elapsed disk query current rows------- ------ -------- ---------- ---------- ---------- ---------- ----------Parse 1 0.01 0.05 1 3 0 0Execute 1 0.00 0.00 0 0 0 0Fetch 1 0.17 1.61 100 2078 0 1------- ------ -------- ---------- ---------- ---------- ---------- ----------total 3 0.18 1.66 101 2081 0 1
Rows Row Source Operation------- ---------------------------------------------------
1 SORT AGGREGATE (cr=2078 pr=100 pw=100 time=0 us)149 NESTED LOOPS (cr=2078 pr=100 pw=100 time=137634 us)
1032 NESTED LOOPS (cr=1047 pr=14 pw=14 time=159 us cost=1649 size=12382 card=151)19 HASH JOIN (cr=1005 pr=0 pw=0 time=19 us cost=281 size=1512 card=24)1 MERGE JOIN CARTESIAN (cr=14 pr=0 pw=0 time=0 us cost=6 size=46 card=1)1 TABLE ACCESS FULL ORGANISATIONS (cr=7 pr=0 pw=0 time=0 us cost=3 size=26 card=1)1 BUFFER SORT (cr=7 pr=0 pw=0 time=0 us cost=3 size=20 card=1)1 TABLE ACCESS FULL RESOURCES (cr=7 pr=0 pw=0 time=0 us cost=3 size=20 card=1)
74511 TABLE ACCESS FULL EVENTS_LARGE (cr=991 pr=0 pw=0 time=1127 us cost=274 size=1272688 card=74864)1032 INDEX RANGE SCAN BK_EVT2 (cr=42 pr=14 pw=14 time=68 us cost=2 size=0 card=57)(object id 69868)149 TABLE ACCESS BY INDEX ROWID BOOKINGS_LARGE (cr=1031 pr=86 pw=86 time=0 us cost=57 size=114 card=6)
Elapsed times include waiting on following events:Event waited on Times Max. Wait Total Waited---------------------------------------- Waited ---------- ------------SQL*Net message to client 2 0.00 0.00SQL*Net message from client 2 17.58 17.58db file sequential read 79 0.07 1.44db fil tt d d 4 0 02 0 05

Automatic TuningSELECT signature, inuse_features, flags FROM sql$ WHERE signature = ‘1697466342721355938’
SELECT /*+ INDEX(sqlobj$ (signature category obj_type plan_id)) */ DISTINCT category FROM sqlobj$ WHERE signature = ‘1697466342721355938’
SELECT obj_type, plan_id, name, flags, last_executedFROM sqlobj$ WHERE signature = ‘1697466342721355938’ AND category = :2
SELECT obj_type, plan_id, comp_dataFROM sqlobj$dataWHERE signature = ‘1697466342721355938’ AND category = :2

Automatic Tuning

Automatic Tuning

Automatic Tuning

Automatic Tuningcall count cpu elapsed disk query current rows------- ------ -------- ---------- ---------- ---------- ---------- ----------Parse 1 0.00 0.00 0 0 0 0Execute 1 0.00 0.00 0 0 0 0Fetch 1 17.67 227.31 9818 1177977 0 1------- ------ -------- ---------- ---------- ---------- ---------- ----------total 3 17.67 227.32 9818 1177977 0 1
Rows Row Source Operation------- ---------------------------------------------------
1 SORT AGGREGATE (cr=1177977 pr=9818 pw=9818 time=0 us)398155 NESTED LOOPS (cr=1177977 pr=9818 pw=9818 time=1802295 us)
1148142 NESTED LOOPS (cr=29836 pr=2508 pw=2508 time=209241 us cost=15 size=144 card=4)19800 INDEX RANGE SCAN EVTLG_PK (cr=37 pr=37 pw=37 time=395 us cost=2 size=17 card=1)(object id 69847)
1148142 INDEX RANGE SCAN BK_EVT2 (cr=29799 pr=2471 pw=2471 time=545049 us cost=2 size=0 card=11)(object id 69868)
398155 TABLE ACCESS BY INDEX ROWID BOOKINGS_LARGE (cr=1148141 pr=7310 pw=7310 time=0 us cost=13 size=76 card=4)
Elapsed times include waiting on following events:Event waited on Times Max. Wait Total Waited---------------------------------------- Waited ---------- ------------SQL*Net message to client 2 0.00 0.00SQL*Net message from client 2 283.03 283.03db file sequential read 7621 0.71 193.61db file scattered read 496 0.60 13.09

Automatic Tuningcall count cpu elapsed disk query current rows------- ------ -------- ---------- ---------- ---------- ---------- ----------Parse 1 0.01 0.03 1 3 0 0Execute 1 0.00 0.00 0 0 0 0Fetch 1 1.48 18.43 35341 35383 0 1------- ------ -------- ---------- ---------- ---------- ---------- ----------total 3 1.50 18.47 35342 35386 0 1
Misses in library cache during parse: 1Optimizer mode: ALL_ROWSParsing user id: 82
Rows Row Source Operation------- ---------------------------------------------------
1 SORT AGGREGATE (cr=35383 pr=35341 pw=35341 time=0 us)398155 HASH JOIN (cr=35383 pr=35341 pw=35341 time=131437 us cost=9656 size=14112720
card=392020)19800 INDEX RANGE SCAN EVTLG_PK (cr=37 pr=0 pw=0 time=304 us cost=2 size=338470 card=19910)(object id 69847)
398155 TABLE ACCESS FULL BOOKINGS_LARGE (cr=35346 pr=35341 pw=35341 time=107228 us cost=9652 size=7321631 card=385349)
Elapsed times include waiting on following events:Event waited on Times Max. Wait Total Waited---------------------------------------- Waited ---------- ------------SQL*Net message to client 2 0.00 0.00SQL*Net message from client 2 30.55 30.55direct path read 314 0.25 15.87

Automatic Tuning
However good this looks:
Let it do its automatic tuning
Don’t let it automatically implement (in a transaction database)
Check its recommendations and implement if you like them
SQL Plan Management

CBO - Instability
CBO?access path decision
System parameters
Session parameters
Optimiser StatisticsIndexes
SQL Profile
Software version
System statistics
DBA playing around

CBO - Instability
• Solution 1– Leave it all alone
• Solution 2– SQL Plan Management– Store plan baseline– Plans not used till accepted– Manually accept or– Allow Oracle to evolve plans

SQL Plan ManagementManual captureDBMS_SPM.LOAD_PLANS_FROM_SQLSET
DBMS_SPM.LOAD_PLANS_FROM_CURSOR_CACHE
Auto capture of repeatable statementsOPTIMIZER_CAPTURE_SQL_PLAN_BASELINE = TRUE
Baseline = (Stored and Accepted plans)
SQL Management Base
New Plan identified during execution
Stored not accepted
SQL Tuning Advisor identifies new plan – SQL*Profile accepted
Auto accept of new plan (if it performs better)DBMS_SPM.EVOLVE_SQL_PLAN_BASELINE
Manual load/accept of new planDBMS_SPM.LOAD_PLANS_FROM_SQLSET
DBMS_SPM.LOAD_PLANS_FROM_CURSOR_CACHE

SQL Plan Management – Fixed Plans
Fixed plan
SQL Management Base
New Plan identified but not added
Non fixed plans
SQL Tuning Advisor identifies new plan – SQL*Profile accepted
Manual load/accept of new planDBMS_SPM.LOAD_PLANS_FROM_SQLSET
DBMS_SPM.LOAD_PLANS_FROM_CURSOR_CACHE
FIXED=> Y

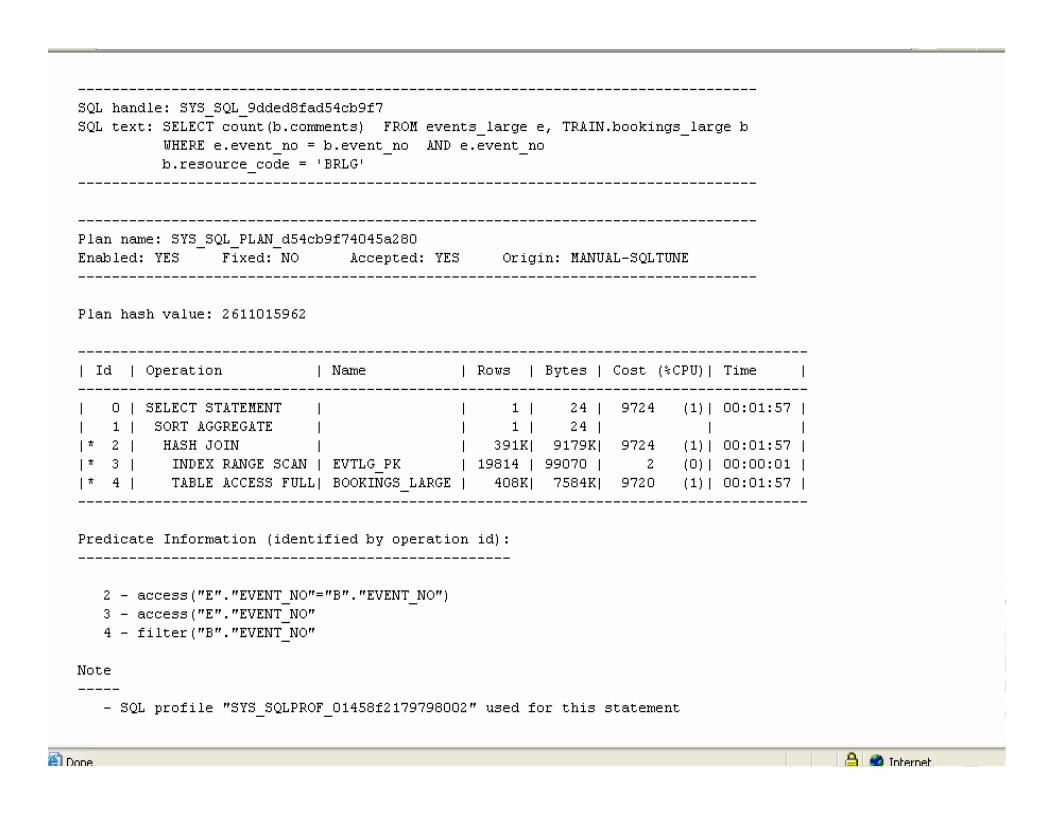
SQL Plan Management
alter system flush shared_poolNo SQL Profiles, No baselines
Execute twice
alter system flush shared_pool

SQL Plan Management

SQL Plan Management

SQL Plan Management

SQL Plan Management
SQL Plan Management

SQL Plan Management

SQL Plan Management – Plan Retention
• Default 53 weeks• Only unused plans purged• Why would you keep a plan for a year if it has only been
used onceBEGIN DBMS_SPM.CONFIGURE( 'plan_retention_weeks',13); END;

SQL Plan Management – Binds
• Will not automatically handle adaptive cursors• New plan identified on first execution• New plan recorded as not accepted• Plan will not evolve• All bind variable values use same baseline plan• Plans show as not bind sensitive or aware

SQL Plan Management – Binds

SQL Plan Management – Binds

SQL Plan Management – Binds
Force Acceptance of the plan

SQL Plan Management – Binds
Once you have forced the plan to be accepted the statementwill be bind aware

Cached Query Results

Results Cache
SGA
SQL Query Results Cache
Results Cache
PL/SQL Function Results Cache
populate invalidate populate

Query Results Cache
RESULT_CACHE_MODE MANUAL
FORCE
--+ result_cache
--+ no_result_cache
Will not cache if:-Dictionary tablesTemporary tablesSequencesDates/timesNon deterministic PL/SQL

Monitoring the Results Cache
• SELECT * FROM v$result_cache_memory• SELECT * FROM v$result_cache_objects• SELECT * FROM v$result_cache_statistics• SELECT * FROM v$result_cache_dependency• RESULT_CACHE_MAX_SIZE• RESULT_CACHE_MAX_RESULT• Explain Plan

Query Results Cache
SELECT * FROM v$result_cache_objects

PL/SQL Function Results CacheCREATE OR REPLACE FUNCTION quantity_booked(p_resource_code in resources.code%TYPE,p_event_date in date)RETURN NUMBERRESULT_CACHE RELIES_ON (BOOKINGS,EVENTS)IS
v_total_booked number := 0;BEGIN
SELECT sum(b.quantity)INTO v_total_bookedFROM bookings b, events eWHERE e.event_no = b.event_noAND p_event_date between e.start_date and e.end_dateAND b.resource_code = p_resource_code;
book_pkg.add_one(v_total_booked, v_total_booked);
RETURN (v_total_booked);END;

PL/SQL Function Results Cache
DECLAREv_num number;BEGINv_num := quantitybooked('VCR2',’06-NOV-2007’);
dbms_output.put_line(v_num);END;
SELECT * FROM v$result_cache_objects
9

PL/SQL Function Results Cache
UPDATE bookings SET quantity = quantity*2;COMMIT;
DECLAREv_num number;BEGINv_num := quantitybooked('VCR2',’06-NOV-2007’);
dbms_output.put_line(v_num);END;
17

PL/SQL Function Results CacheCREATE OR REPLACE PACKAGE BODY
book_pkg ASPROCEDURE add_one (p_result IN NUMBER,
p_result_out OUT NUMBER)IS BEGINp_result_out := p_result+10;
END;END;

PL/SQL Function Results Cache
DECLAREv_num number;BEGINv_num := quantitybooked('VCR2',’06-NOV-2007’);
dbms_output.put_line(v_num);END;
17

PL/SQL Function Results Cache Don’t do stupid stuffCREATE OR REPLACE FUNCTION non_determRETURN VARCHAR2 RESULT_CACHE ISBEGIN
RETURN TO_CHAR(sysdate,'ddmmyyyy hh:mi:ss');
END;

Designing for the PL/SQL Function Results Cache
Data Store
Result Cache
Business Object EvtOrg= PL/SQL function result
Processing

Designing for the PL/SQL Function Results Cache

Designing for the PL/SQL Function Results Cache

Designing for the PL/SQL Function Results Cache
So why do we need a middle tier?
SQL Performance Analyzer

SQL Performance Analyzer

SQL Performance Analyzer

SQL Performance Analyzer

SQL Performance Analyzer

SQL Performance Analyzer

View the Comparison Report

Summary - Setup
Migrate to Test instance of 11gRun application
Collect SQL Tuning setRun SQL Performance Analyzer
Add extra statistics
Run automatic tuning – without automatic implementation Look at suggestions
fix the problem oraccept the profile
Lock any statistics where required (e.g very dynamic tables)
Run SQL Tuning set in SQL Performance Analyzer and compare
For a transaction database Baseline the application SQLIf you are really paranoid fix the baseline plans

Summary
WORTH A TRIALSelectively cache PL/SQL resultsIf you have lots of spare memory turn results caching on

Summary – Maintenance (Transaction DB)
Keep auto stats gathering on (at a sensible interval), or manually gather stats when you have a quiet evening
Publish stats if performance not worse
Keep automatic tuning scheduled– automatic implementation offLook at suggestions
fix the problem oraccept the profile
Monitor new baseline plansmanually test and accept
Before you change anything (your hairstyle/shirt/partner)Run SQL Performance Analyzer and compare old and newconfiguration

Summary – Maintenance (Reporting DB)
Keep auto stats gathering on (at a sensible interval), or manually gather stats when you have a quiet evening
Publish stats if performance not worse
Keep automatic tuning scheduled – automatic implementation on
Before you make significant changes (version)Run SQL Performance Analyzer and compare old and newconfiguration

SAGE Computing ServicesCustomised Oracle Training Workshops and Consulting
Questions and Answers?
Presentations are available from our website:http://www.sagecomputing.com.au
[email protected]@sagecomputing.com.au