new venture, survival, growth198986/fulltext01.pdf · new venture creation and small firm growth...
TRANSCRIPT

New Venture, Survival, Growth Continuance, Termination and Growth of Business Firms and
Business Populations in Sweden During the 20th Century
Marcus Box


ACTA UNIVERSITATIS STOCKHOLMIENSIS Stockholm Studies in Economic History
─────────────── 48 ──────────────
New Venture, Survival, Growth Continuance, Termination and Growth of Business Firms and
Business Populations in Sweden During the 20th Century
Marcus Box
Stockholm University
Almqvist & Wiksell International Stockholm

Department of Economic History Stockholm University, SE-106 91 Stockholm © Marcus Box 2005 ISBN 91-85445-20-7 ISSN 0346-8305 Distribution: Almqvist & Wiksell International, P.O. Box 7634, SE-103 94 Stockholm Email: [email protected] Printed in Sweden Intellecta DocuSys, Nacka 2005

Till Maria och Alva


Contents
1. Introduction .................................................................................................1 The Dissertation: Aim, General Setting, and Delimitations.............................................1
Researching the Growth and Survival of Firms .........................................................3 A Demographic and Population Approach.................................................................7
Outline of the Dissertation ...............................................................................................8
2. Methodological Setting and Source Materials ..........................................11 A Longitudinal Method...................................................................................................11 Source Materials............................................................................................................16
Unprinted Source Materials .....................................................................................17 Printed Sources and Other Data..............................................................................19 Established Databases ............................................................................................21
Concluding Remarks .....................................................................................................23
3. Growth and Survival of Firms in Research ...............................................25 Introduction....................................................................................................................25 Different Disciplines, Shifting Focus Over Time............................................................25 Firm Growth and Survival: Measures and Approaches ................................................29 Causes and Determinants to Firm Growth and Survival in Previous Research ...........31
Individuals and Internal Conditions: Traits, Competencies, Behaviors ...................33 Structural Factors: Age, Size, Industry-Specific Conditions ....................................35 The Environment: Economic Change and Fluctuations, Institutions and Business Climate .....................................................................................................................38
Concluding Remarks .....................................................................................................41
4. Development of the Size Distribution of Firms in Sweden: A Centennial Perspective ...................................................................................................45
Introduction....................................................................................................................45 Explanations to the Changing Size Distribution of Firms..............................................46 Objectives and Methodological Considerations ............................................................52
Sources and Data in the Study ................................................................................54 The Swedish Size Distribution of Firms over Time .......................................................57
Manufacturing, 1896-1999.......................................................................................58 All Sectors, 1931-2000.............................................................................................68
Discussion and Concluding Remarks ...........................................................................70
5. Survival and Selection: Seven Birth Cohorts of Firms ..............................75 Age, Size, Selection ......................................................................................................75 Seven Birth Cohorts of Firms: Overview and Some Methodological Considerations...80 In the Long Run They are (Nearly) All Dead: Termination, Age and Size ....................87 In Good Times and in Bad: Termination and Macroeconomic Environment ................91 Conclusions .................................................................................................................101
6. Surviving Firms: Survival and Growth?...................................................107 Introduction..................................................................................................................107
Size and Survival of Firms Over Time ...................................................................107 Surviving Firms from Seven Cohorts, 1990 to 1999..............................................111
Size of Surviving Firms: Larger Size – but Growth? ...................................................113 Cohort, Start-up Size and Subsequent Size..........................................................117
Discussion and Concluding Remarks .........................................................................123
7. Growth of Firms: Age, Size, Environment...............................................129 Introduction..................................................................................................................129 On Firm Growth: As Larger and Older, the Smaller Their Growth..............................130
Growth of Firms and Their Environment................................................................132 Analytical Framework ..................................................................................................139
Sources and Methodological Considerations ........................................................140 Variables and Measurements ................................................................................145
Growth of Firms and Environmental Conditions..........................................................147 The Role of Environment .......................................................................................150
Conclusions and Discussion .......................................................................................160
8. Succession and Success? Board Turnovers and Firm Performance .....165 Introduction..................................................................................................................165 Successions and Performance, Management and Ownership...................................166
Successions’ Causes and Consequences.............................................................168 Previous Research on Succession and Performance ...........................................171
Objectives and Methodological Considerations ..........................................................177 Measurements and Definitions ..............................................................................178
Succession: Success or Failure? ................................................................................181 Succession and Survival?......................................................................................183 Presuccession and Postsuccession Performance.................................................187
Conclusions .................................................................................................................193
9. Concluding Remarks and Summary .......................................................199
Appendices .................................................................................................209 Appendix 1..........................................................................................................209 Appendix 2..........................................................................................................210 Appendix 3..........................................................................................................210 Appendix 4..........................................................................................................211
Appendix 5..........................................................................................................211 Appendix 6..........................................................................................................212 Appendix 7..........................................................................................................212 Appendix 8..........................................................................................................213
References..................................................................................................215 Unprinted sources .......................................................................................................215 Printed sources............................................................................................................215
Lists of tables and figures List of tables Table 1. Size distribution and number of firms in Sweden during seven observation years,
1931-1999. All sectors. Percent (i.) and absolute numbers (ii.). ..............................69 Table 2. Seven birth cohorts of joint-stock companies. Frequency and percent. ..............81 Table 3. Number of new joint-stock companies per year (yearly averages) in Sweden,
1897-1950.................................................................................................................82 Table 4. Start-up size per cohort. Stock capital. Nominal (i.) and deflated values (ii.).
Cumulative percent...................................................................................................84 Table 5. Age per cohort and in total population. Years. .....................................................85 Table 6. Average annual growth rates of GDP, 1890-1970 (percent). Different periods. ..92 Table 7. Logistic regression results. Termination at young age. ......................................100 Table 8. Surviving firms from the seven cohorts, 1990 to 1999. ......................................112 Table 9. Correlations (rs) between size measures for surviving firms. Employees, turnover,
total assets, and stock capital. ...............................................................................113 Table 10. Subsequent firm size according to subsidiary status. ......................................117 Table 11. Start-up size of surviving firms (tkr.). Deflated values (1930 = 100). Cumulative
percent....................................................................................................................118 Table 12. Start-up size and size in 1990/99. Percentage distribution. .............................120 Table 13. Cohort 1912 and Cohort 1930. Population.......................................................141 Table 14. Annual growth rates in percent over time.........................................................148 Table 15. Regression results. Growth and firm-specific variables. Both cohorts and per
cohort. .....................................................................................................................150 Table 16. Regression results. Growth, firm-specific variables, and environment. Both
cohorts and per cohort............................................................................................154 Table 17. Overview of regression results with four age-size categories. .........................156 Table 18. Regression results. Growth, firm-specific variables, environment, and interaction
variables. ................................................................................................................159 Table 19. Succession and boards in database.................................................................181 Table 20. Regression results. Firm age and succession..................................................186 Table 21. Percentage distribution of presuccession and postsuccession performance. .188 Table 22. Chi2 test of presuccession and postsuccession performance.........................189 Table 23. Logistic regression results. Succession performance, firm age, tenure and firm
size. ........................................................................................................................192
List of figures Figure 1. Lexis' diagram......................................................................................................14 Figure 2. Size distribution in manufacturing. 1896-1945. ...................................................59 Figure 3. Size distribution in manufacturing. 1950-1967. ...................................................60 Figure 4. Size distribution in manufacturing. 1968-1999. ...................................................62 Figure 5. Number of firms in different size classes. Manufacturing, 1896-1999. ...............67 Figure 6a-b. Hazard rates for all firms (6a) and for small and large firms (6b). First ten firm
years. ........................................................................................................................89 Figure 7. Hazard rates per cohort. First ten firm years.......................................................90 Figure 8a-b. Termination rates per cohort (percent). 20 years. 1899-1970. ......................95 Figure 9. Size distribution of surviving companies and of all joint-stock companies.
Employees, turnover, assets, and stock capital. Percent. .....................................115 Figure 10. Firm size and age/cohort. Employees, turnover, assets, and stock capital.
Percent. ..................................................................................................................122 Figure 11a-b. Share of surviving firms in cohorts exhibiting growth, and GDP growth.
Cohort 1912 (11a) and Cohort 1930 (11b). ............................................................152 Figure 12. Some observed effects of succession and performance in earlier research. .172 Figure 13. Relationships and measures of performance and succession in previous
research..................................................................................................................174 Figure 14. Successions among surviving firms (n = 420 at year one). ............................182 Figure 15. Number of succession events and terminations among surviving firms. Firm
year 1-30.................................................................................................................184 Figure 16a-b. Succession events and terminations in percent (16a), and terminations in
control group (non-successor firms; 16b)...............................................................185

Acknowledgements
I have been fortunate to receive support and encouragement from so many: family, friends, colleagues. I am above all grateful to my supervisor, Associ-ate Professor Karl Gratzer. Karl and I have dealt with each other ever since my undergraduate years, and he has without a doubt had the most important role for me in my doctoral studies. Karl has always been full of and open for new ideas and perspectives. His friendship and genuine commitment indeed makes me a very privileged doctoral student. I cannot thank you enough, Karl! I have also been privileged with two careful secondary supervisors. Asso-ciate Professor Sture Martinius was encouraging me during my first years and I owe him many thanks. Professor Johan Söderberg replaced Sture as secondary supervisor after some time, and I am truly grateful for Johan’s thorough remarks, helpful suggestions and good advice over the years. Friends and colleagues at various places have over the years supported me and commented drafts and manuscripts. My first years were spent at the Center for Banking and Finance, Södertörn University College. Many thanks to all of you! I am above all thankful to late Professor Dick Ramström who carefully read and commented early manuscripts and drafts. At the Department of Economic History at Stockholm University have, furthermore, several persons been most helpful. I would here like to thank Professor Sven Fritz for his helpful comments and suggestions, as well as to thank Professor Ulf Jonsson, Professor Ulla Wikander, Ursula Hård, Rodney Edvinsson, Therese Nordlund, Per Simonsson, Kalle Westberg, Ulrica Söderlind, Sven Hellroth, Harald Lund and Per Borg. James Wardally has corrected my English and I am thankful for his thorough comments; all re-maining mistakes are mine. Thank you also to Jane Bagge and Ulrika Mo-berg for administrative help. Academic colleagues, the participants at the higher research seminar, as well as the administrative staff at the School of Business Studies and ENTER forum at Södertörn have been equally supportive with advice and comments, and in making the ordinary working day more enjoyable. I here especially have in mind Professor Bengt Jacobsson, Professor Yohanan Stry-jan, Tommy Larsson, Christopher Zielinski, Izabella Rolnik, Peter Vaigur, Pauline Göthberg and Johan Hansson. In particular, I want to express my gratitude to Associate Professor Besrat Tesfaye and Professor Cheick Wagué for their genuine support and help.

Additionally, Xiang Lin, Södertörn, and Anders Ögren at Stockholm School of Economics have been most helpful in commenting ideas and drafts. Thank you! An economic historian is often dependent on the availability of historical sources. In this, I have received much help from the people working at vari-ous archives, particularly at the National Archives (Riksarkivet) and at Bo-lagsverket (Swedish Companies Registration Office). The average doctoral student is also dependent on financial support. I here thank Riksbankens Jubileumsfond (The Bank of Sweden Tercentenary Foun-dation), Sparbankernas forskningsstiftelse, the Department of Economic History, and Södertörn University College. These past years would have been much more thorny and hard to endure without the encouragement and love from my family. Thank you, all of you for believing in me. Above all, my thoughts go to my two beloved ones, Maria and Alva. Vad vore jag utan er?
Stockholm, December 2005 Marcus Box


1
1. Introduction
Entrepreneurship and small business research has become an established international and multidisciplinary field of research. Several studies about market conditions for survival and growth of existing firms as well as newly-founded firms have been carried out from particularly the last decades of the past century and onwards. Both scientifically and politically, (new) small businesses are being given increasing attention. A view that often dominates is that small new businesses are important economic players since they cre-ate the main share of genuinely new job opportunities. Thereby, increasing new firm-formation and improved growth conditions for small businesses has come to be a cornerstone in economic policy. The rise of the multidisci-plinary field of entrepreneurship and small business research has been regu-larly explained by economic and structural crises in the 1970’s and 1990’s – new venture creation and small firm growth was perceived as one way of coming to grips with macroeconomic problems. In that respect, much debate has been about barriers to and driving forces of enterprising, firm growth and firm survival. Empirical research has ranged from studies on societal and sectoral levels down to micro level studies on businesses and entrepreneurs.1
The Dissertation: Aim, General Setting, and Delimitations The aim with the present study is to analyze change and development in and between populations of firms. I intend to study change or development on both aggregate levels as well as at the micro, or firm level. The concept ‘de-velopment’ includes a rather wide spectrum of definitions: it concerns up-turns and downturns in populations of firms, the founding of new popula-tions, as well as the selection of firms in those business populations. It also embraces internal processes or events over the life of the business such as organizational change as concerns ownership and management. And, fur-
1 See for instance Landström (2005) for a historical-doctrinal review of the development of the research field.
2
thermore, it involves growth processes and behaviors – or lack of such proc-esses – on both the firm and aggregate level. Within the context of this study, development refers to the growth of firms, as well as their ability to continue as business units or to survive. These two conceptions constitute the cornerstone of the dissertation’s general setting. In the first case, how and when firms grow, stagnate or contract; in the second case how long firms survive and when they cease operations or are termi-nated. Even though these conceptions at first may seem to be two rather op-posite phenomena – i.e. growth (‘success’) and termination (‘failure’) – they are not in my point of view mutually exclusive. Nor is the one conception, growth, at all times a prerequisite for the fulfilment of the other, survival. Business organizations do not necessarily have to grow in order to survive. Surviving firms can, moreover, be viewed as ‘failures’ even though they continue operations. And so on. We can therefore – perhaps in many ways depending on research traditions – think of or define the business organization from different points of view, such as economic, social, cultural, or institutional. An analysis of the entry, development and – if so is the case – the fall of firms can without doubt be performed with different methodological and theoretical approaches. The research that has evolved around the dynamics of enterprising activity, growth and failure bears witness to the existence of quite a vast body of sci-entific production. In that respect the growth and survival of business or-ganizations is a thoroughly studied area, especially if we here assume a broad perspective and include research performed in economics, economic history and business administration, including adjacent disciplines such as sociology. A basic yet much-debated subject in this branch of research is why firms and organizations – or at least why some of them – grow, why some are ter-minated, as well as when in time or when in a firm’s life cycle these events take place.2 The fundamental research question and aim in my study is there-fore in what way it is possible to identify a relationship between, on the one hand, the development of individual businesses and business populations, and, on the other, what we broadly speaking could label structural and envi-ronmental conditions, events or phenomena. Therefore, my ambitions are not only confined to an analysis of the relationship between the micro and ag-gregate behavior of firms (or to the research objects) as such: events or phe-nomena that occur ‘outside’ the scope or beyond the influence of business firms, and their effects on the development of those businesses, is addition-ally an integral part of the dissertation. Here have macro or aggregate events
2 Nonetheless is it, as for instance pointed out by Reynolds (2005), nearly impossible to speak of a ‘universally accepted’ indicator as concerns firm development over the business life course (or life cycle); the basic stages – such as initiation, entry, growth and death – perhaps remain appealing merely as general concepts.

3
or structures in theory a plausible effect on the growth and survival possibili-ties of firms.3 In that respect, the connection between firm/micro level and aggregate level phenomena is to some extent twofold. One part involves the interrelat-edness between, on the one hand, an individual firm’s development and con-tinuation and, on the other, its development on more aggregate pattern on the population or, rather, the generation level. Another part concerns whether and to what extent events and factors which we normally conceive of as structural as well as exogenous or external to the individual business coin-cide or are related to the development of businesses and business popula-tions.
Researching the Growth and Survival of Firms This rather broad or general setting discussed above is a research topic fre-quently discussed in the fields of entrepreneurship, (small) business, and business history in general. A central, classical question in the social sci-ences concerns the relationship and interaction between, on the one hand, the scope and possibilities of the individual human being, or a distinct organiza-tion, and, on the other, what we broadly speaking could label as the envi-ronment or structure and how the latter affect the former.4 Thus, micro and macro perspectives are considered to be of different importance and valued differently within as well as between different social science disciplines. In some cases they are considered almost incompatible.5
3 I would like to point out here that the conceptions ‘micro’ and ‘macro’ (or aggregate) are not the actual objects of investigation but rather the development of firms and populations of firms. The conceptions of micro and macro are furthermore quite difficult to define and de-limit, and they rather stand as general concepts in a loosely held theoretical world. Generally speaking refers ‘micro’ in this particular circumstance to the firm-level while ‘macro’ bears reference to a more aggregate level, which of course could embrace the aggregate behavior or pattern of a population of micro units or, for that sake, markets, institutions, or a national economy. 4 Another focus would naturally be to what extent single individuals or groups of them – humans as well as organizations – affect the aggregate, macro development or other courses of events such as institutions. This is discussed to some extent below even though this particu-lar research approach is not in focus in the present study. It is nonetheless reasonable to as-sume that particularly large corporations or organizations can exert an influence on the institu-tional and economic environment, e.g. legislation. In a general sense, however (for example as concerns the ‘average’ small business), is the situation probably the opposite. Starbuck has described the relationship between the organization and the environment as: “… organizations drift along, perceiving that they are succeeding in stable environments, until they suddenly find themselves confronted by existence-threatening crises”; Starbuck (1983), p. 100. 5 Modern (neoclassical) theory in economics can here perhaps serve as an example. Micro behaviors and phenomena cannot simply be aggregated up to the macro level. Thereby, even if it is reasonable – this is at least my own opinion – that the ‘sum’ of micro events and behav-iors represent the macro picture, lies the difficulties here in determining how to sum up these micro behaviors.
4
In other traditions, the micro and macro perspectives have been viewed as complementary. For example, in business history, economic history, and for some economists, a ‘merger’ between the micro and macro perspectives has been regarded as a desirable yet difficult research goal. The overall paradigm is that there is an interaction between individual businesses and their envi-ronment, or a relationship between the actions and behaviors of micro units and changes in aggregates.6 Similarly, researchers in entrepreneurship and small business have called for an increased integration of different perspectives and approaches regard-ing how, why, to what extent, and under what particular conditions firms are founded, developed and terminated. In theoretical circumstances it is regu-larly asserted here that the environment – often quite loosely described in terms of economic stability, industry-specific characteristics, and socio-cultural and political factors – imprint and affect the actions and behaviors of micro units, and (which partly follows from above) therefore that there is an evident interaction or relation between micro and macro events. Studies over the post-entry performance of firms have nevertheless to a lesser extent con-sidered the relation between firm survival and growth and aggregate condi-tions and fluctuations.7 But firms, new or old, do not exist in a vacuum – they are subjected to the pressures and constraints of their environments. Simplistic conceptions of venture outcomes that classify them as successes and failures can have dif-ferent implications for more aggregate levels of analysis. Success on the firm level – for instance survival and growth – may under certain circumstances, or during specific periods, result in negative outcomes on more aggregate levels and vice versa. Thus firm success could translate into economic re-gress as well as success on a societal level. From an evolutionary approach, the phenomena of process and context (strategy, behaviors, and environ-ment) are interacting and drive the outcome of entrepreneurial efforts. There-fore an integration of context and process is considered as a major chal-lenge.8
6 This is as an example discussed by Dahmén (1992) and Ullenhag (1992). See also Schön (1995). Another example is the perspective advocated by Gunnar Eliasson; see for instance Eliasson (2005). 7 Even if there has been much research carried out as concerns aggregate determinants, such as innovative activity, market concentration or ‘industry behavior’, when it comes to business growth and survival, cyclical or macroeconomic factors have received less attention. Often rather short time-periods are studied, which e.g. do not cover a full business cycle. For a discussion, see Boeri and Bellmann (1995). 8 See for instance Aldrich and Martinez (2001) p. 44. Furthermore, Per Davidsson has ad-dressed this issue: e.g. a failure at the firm-level (say, an early termination) can in some cir-cumstances drive market processes and inspire followers; hence the entrepreneurial process is not completed, in Davidsson’s words, but this specific firm as such contributes, perhaps, to the entrepreneurship phenomenon. Davidsson (2004), pp. 12-14. For a discussion, see also Baumol (1990).
5
This particular issue has to some extent also been addressed from two sides: one that takes a starting point in venture level events and outcomes and the effects or gains of such events at a macro or societal level, for in-stance which types of (new) firms that create new jobs;9 another that rather departs from a macro-environmental, or more aggregate, level and directs attention towards the consequences for micro level events and behavior.10 This does not imply that entrepreneurship and small business research (or, for that matter, business history) depreciates the role and actions of individ-ual business owners/managers or entrepreneurs, or that there has been a bal-ance between micro and macro/aggregate approaches. On the contrary, there has been a tradition of strong emphasis on the micro or firm level as well as on the individual. In that respect, the individual business firm and the entre-preneur – the two are also often mixed in both empirical and theoretical cir-cumstances – are dominating objects of investigation. Thus, the actions, motives and traits of the entrepreneurs have frequently been studied in this research field, and this tendency in the main body of research could perhaps explain why attention has been drawn towards the need for alternative meth-ods and new perspectives. Behaviors, patterns or causal links that seem obvious when observed on the micro level or when particular types of empirical data are employed in the analysis – for instance the use of interviews and questionnaires – may with an aggregate or macro approach, or with the use of alternative data (or when we address the issue from a longer perspective of time) give a different or even contradictory picture. Such contradictions, or, rather, such complexi-
9 There have for example been ample studies that have aimed at identifying the (types of) firms that generate genuinely new job-opportunities in an economy, or what effects entry and exit rates of firms have on a societal level. Such studies e.g. almost certainly demand consis-tent and rich (firm level) data over populations and over entries and exits over time in order to study the effects on the macro level. See for instance Birch (1979) and Davis et al. (1996). There has been extensive debate on the subject, first and foremost regarding new and small firms’ contribution to job opportunities. See also Davidsson et al. (2001) and Schreyer (2000). 10 Some research has for example focused on start-up processes and new venture creation. It has here been assumed that benign entrepreneurial environments stimulate the formation of new firms and give incentives to potential entrepreneurs to start a business (and, in many cases, also assumed that increasing start-up activities generally are benign for aggregate eco-nomic performance). Others have studied firms’ ability to survive in relation to environmental conditions while another body has investigated under what conditions firms grow. Hence, in such research it is rather the believed environmental effects on individual businesses that are in focus. See e.g. Bruno and Tyebjee (1988), or Ucbasaran et al. (2001). A further example is the Global Entrepreneurship Monitor (GEM; Reynolds et al., 2000), which acknowledges an importance of the general economic climate or environment for entrepreneurship, start-ups, growth and survival. The dichotomy above may in some senses be merely apparent to the eye. It has nonetheless some implications for research questions as well as for to what extent avail-able empirical data can be applied to test such questions.
6
ties can also lead to the formulation of new research questions and a neces-sity for considerations of research designs.11 Behind observed courses of events – for instance aggregate new firm-formation and firm terminations, or for that matter the success, survival or discontinuance of individual businesses – lie rather complex phenomena and interrelationships. This acknowledged complexity has lead to a call for more empirically oriented studies that address such issues. Theoretical assump-tions of the interrelatedness between the environment and the firm(s) must, it has been stated, be counterbalanced by empirical results. Thus, multi-level designs are identified as one key element for advancements in entrepreneur-ship and small business research. Here are both micro (firm) and macro – population, societal – aspects viewed as significant components in the analy-sis.12 It does however seem that there has been a tendency towards an in-creasing share of micro-oriented studies over past years while aggregate research has diminished. At the same time, the body of studies with a micro-to-macro approach has stagnated.13 Moreover, the time-dimension as such has received increasing recognition. One pertains to research designs and how change in aggregates and in indi-vidual micro units generally is studied. Particularly longitudinal studies are here identified as fundamental for advances in the area of entrepreneurship and small business. Collecting empirical data over multiple time-periods – which would distinguish the longitudinal method – is inherently more time consuming than gathering cross-sectional data. Even so many studies have used cross section data which often are considered to be entirely unsuitable in many instances – for instance as concerns causal analyses explaining business growth.14 Nonetheless, even if there is rising awareness as regards both the relation-ship between the business and its environments (and structures), and the necessity of longitudinal studies, have another – and perhaps somewhat de-viating – body of research recognized a research agenda dominated by youth and smallness. This is an observation that I to some great extent agree with and which also at least partially concurs with the focus or setting in eco-nomic history and business history, namely the longer perspective of time. 11 For instance did Starbuck and Mezias (1996) review a larger number of empirical studies of the accuracies of managers’ perceptions of their environment (in interview/questionnaire research). Seldom were there in most of the research any discussions about validity although it was clear that the objective reality might not always go hand in hand with the (managers’) subjective reality. Thus, people’s perceptions may be unrealistic, and if perceptions contain errors then research describes errors. Furthermore, people tend to misrecollect when in time an event took place, or forget them. Thus, retrospective studies might not give the best data for analyzing causes and effects. See for instance Taris (2000). 12 Such an approach has been called for by for example Shane (2003), see pp. 145-160. 13 See Davidsson and Wiklund (2001) for a research review. 14 For a discussion, see Chandler and Lyon (2001) and Davidsson and Wiklund (2000), pp. 27-28.
7
Research on small old businesses, or research that follow new and/or small firms over a longer period of time, is rather scarce in entrepreneurship and small business.15 Alternative research questions are at least partly neglected in a research environment that concentrates mainly on start-ups, infancy and early termination, leading to a disregard of the continued stagnation and failure of older small businesses. The rather short period studied in most research does not, according to its critics, take into account surviving firms that exhibit growth, decline and re-growth, or businesses that have been in a steady state for years and then start to grow. By this, little research has put a somewhat longer perspective on the development of firms than only a few years. This has implications for definitions and measurements on firm ‘suc-cess’ and ‘failure’.16 While much knowledge over the history of commercial and industrial life as well as of the history of firms has come from decades of research in business history,17 much research has however been based on the histories of (very) large businesses and corporations.18
A Demographic and Population Approach Thus, it is here not only a question of a closer integration of micro and macro (or aggregate) perspectives, or the necessity for multi-level designs. The time-dimension – both as regards empirical and methodological consid-erations and the perspective of time as such – has an equally important role
15 This is also occasionally emphasized in entrepreneurship research. One issue here concerns debate on the contribution to economic well being from entrepreneurship and business ventur-ing activity. Factors that drive changes in the rate of entrepreneurship and business dynamics are not likely to be manifest over short time periods. Therefore, among others, Gartner and Shane (1995) have seen it as necessary to adapt another and longer time perspective than research usually does. 16 The dictating philosophy in mainstream research, according to critics, is that innovations and new ideas mainly are connected with new and young firms. It is furthermore assumed in mainstream research that aging managements, associated with old-fashioned attitudes, prevent growth of smaller firms. Therefore, one view has been that new small businesses have, in economic policy, obtained favorable economic and political subsidies, whereas older small firms have been ‘discriminated’ – both in policy and in research. See for instance Bosworth and Jacobs (1989), p. 31. See also Bridge et al. (1998), p. 171, and Vinell and Hamilton (1999), pp. 5-6. 17 For overviews see Lindgren (1998), Söderberg (1995) and Ullenhag (1993), pp. 1-6. 18 See for instance Gratzer (1995) for a description and overview regarding research on small businesses in economic history/business history and the economic disciplines (there are natu-rally also exceptions in economic history; particularly at Lund, economic historians have produced data and empirical material on firm populations in different sectors and so on – see for instance Dahmén, 1950; Jörberg, 1961). In the field of entrepreneurship and small busi-ness research (and closely related fields), observers have identified a similar picture. It is usually claimed through ‘casual observation’ that old firms have survived due to their trade-marks (newspapers, simple consumer goods), trademarks that have no requirements of organ-izational continuity. An opinion has therefore been that alternative fields, such as ’organiza-tional geriatrics’, or the history of small business, generally have received little attention. For a thorough research overview, see Caves (1998).

8
for the analysis of the growth and survival of business organizations. From an economic historian’s point of view the research field in entrepreneurship and small business has addressed central issues from a quite short period of time and, perhaps, not sufficiently addressed is the question of micro and aggregate relationships. From the viewpoint of entrepreneurship and small business, it might be claimed that economic history and its special branch business history have not focused on small business to any great extent. My ambitions with the present dissertation concur with the types of re-search settings and designs that have been discussed in entrepreneurship and small business studies. When starting with this research project it became quite clear to me that I wanted to use an alternative approach and employ other or alternative types of methods and sources. This does not imply that I here present a dissertation that constitutes a pure, ideal, combination of mi-cro and macro perspectives or, for that sake, that I here suggest an entirely alternative research agenda that opposes or contradicts results and assump-tions generated in the ‘mainstream’ research field. Rather, my dissertation lies within the fields of entrepreneurship and small business and economic history, a study that with the use of historical methods and sources has as its aim to analyze the development, growth and termination of firms and firm populations. The traditional method of working in economic history – source and archive research and the longer time-perspective – can, when combined with the research questions and focuses in research in entrepreneurship and small business, contribute with new perspectives and generate new knowl-edge about the behavior of, and conditions for, business organizations. The dissertation embraces in many respects a demographic and population approach to the problem of firm growth and survival. It uses mainly longitu-dinal empirical data (other types of material are nonetheless also used in the dissertation) and employs – or rather tries to combine – methods, definitions and approaches commonly used in demography, entrepreneurship and small business research, and economic history. The principal empirical material is constituted by a longitudinal database consisting of totally seven birth co-horts of joint-stock companies founded during different years in the first half of the 20th century. The empirical database is mainly constructed on archival, unprinted sources and amounts to nearly 2,200 business units that are traced from their birth to their termination.
Outline of the Dissertation Chapter 2 describes and discusses on a broad level the methodological set-ting and basis for the dissertation. It also gives an account for the source materials and data employed in the study. More detailed accounts and de-scriptions of procedures, methodological choices and definitions are in-cluded in each of the chapters that comprehend the empirical investigations.
9
Chapter 3 is an outline over a field of research that, in my eyes, is fairly ex-tended or wide, namely the survival and growth of business organizations. Focus here is on previous research findings in mainly the economic sciences – first and foremost economic history, economics and business stud-ies/business administration. It is without doubt difficult to clearly define or delimit ‘economic sciences’ since for instance economic sociology etc. could very well be included in such a conception (which they in fact are in the chapter). A study that moves over several academic fields cannot however fully cover all research. I, nevertheless, attempt to identify the development (or trend) in this social science tradition that now for a considerable time more or less explicitly has researched the growth and survival of firms and the causes thereof. An overview and discussion regarding research focus(es) in economic history, economics and business administration is also included in this chapter. A problem that has been in the center of attention in economic disciplines is the shape of and development of the size structure – or size distribution – of businesses, particularly the causes to change of this size structure over time. This problem (or certain aspects of it) – using series of Swedish size distribution data that run over one hundred years – is considered in Chapter 4. By assuming a longer perspective of time, new research results are hope-fully produced that can shed light on the development of the size distribution and the conditions for firm growth. Chapters 5 to 8 embrace the above-mentioned firm generations or cohorts, assuming a longitudinal research setting. In Chapter 5 is the development of the seven birth cohorts of firms in focus, birth cohorts that were founded during different years during the first half of the 20th century. Their macro biographies and development in terms of firm survival, with respect to struc-tural and external, or aggregate/environmental conditions, is the main issue in that chapter. This is followed in Chapter 6 by a study of long-term sur-vival and growth, more specifically an investigation of the firms in these seven generations that managed to survive for a long period of time. One central question regards the growth, or non-growth, of those survivors. An-other question (with some reference to the topic in Chapter 4) addresses the survivors’ empirical size structure, or size distribution. Chapters 7 and 8 both contain a more detailed or micro-level oriented study of two of the seven birth cohorts. I have here – to the extent it has been possible – re-created each individual firm’s development from birth to their (prospective) death, or at most over a thirty year-period. Chapter 7 focuses on firms’ growth over time, assuming a longer time-perspective – and ad-dresses the question of firm age, size and the significance of environmental variables and events. Here, micro behaviors are assumed to add up to an aggregate or generational behavior, and environmental variables are assumed to affect the behavior of individual businesses over time with respect to growth.

10
Chapter 8, the last empirical chapter in the dissertation, deals with a prob-lem that has been frequently researched in business studies, namely the ques-tion of succession of ownership and management in firms and firm perform-ance. Finally, Chapter 9 intends to summarize and discuss the research re-sults of the dissertation.

11
2. Methodological Setting and Source Materials
The study of the entry, development and growth of business organizations has been carried out from a quite wide range of perspectives and methods. This chapter describes the general methodological setting that constitutes the basis for the dissertation. It furthermore gives an account of the source mate-rials and other empirical data.
A Longitudinal Method Although empirical data and sources characterized by a cross-sectional de-sign is employed in the study (see source description, below), its main ap-proach is to employ a longitudinal study in analyzing the development of firms as regards their survival ability and growth. The purpose of a longitu-dinal study is often described as the analysis of patterns of change, and as a method to establish the direction of as well as the magnitude of causal rela-tionships. Longitudinal methods have been used in fields such as demogra-phy, sociology and economic research.19 Longitudinal research can be said to deal with the change of an individual or a unit, or perhaps more accurately, of a population of individuals/units over (a certain period of) time. The con-cept ‘period of time’ – or rather, the length of the study – can depending on the purpose of the investigation as well as the characteristics of the individu-als/units that are studied be both long and short.20 Different types of research design can be viewed as longitudinal if they fulfill some necessary requirements. With a broad definition, a longitudinal analysis contains information that can be ordered in sequences in time, which means that several types of methodological designs can be applied.21 19 See Newell (1988). The cohort method as concerns business demographies has previously been used in Gratzer (1996), Box (2001), and in Gratzer and Box (2000; 2002; 2004). 20 Humans, for example, have a longer life expectancy than fruit flies, but a shorter one than a joint-stock company that in principle (all other things being equal) can have an infinite life length. Similarly, a city or a community has a life expectancy than widely exceeds the one for humans. Therefore, the purpose of a longitudinal study as well as the characteristics of the unit(s) of investigation is in many cases determining if the time perspective (the length of the study) is ‘long’ or ‘short’. 21 For an overview, see Menard (1991), pp. 4 ff.
12
One of them is the prospective study, which follows the same individu-als/units over two or more distinct periods of time right at those periods of time – for instance to follow a set of individuals from a certain point in time and onwards. Retrospective studies are generally carried out on a group of individuals by a certain period for several earlier periods. Taris (2000) states that a pro-spective design nearly always will lead to better data than a retrospective one.22 For example, interviews that ask questions about the past have a built-in risk that can affect the collected data, such as the memory of the respon-dents – or rather the lack of memory of a particular event – or misrecollec-tion of when in time the event in question took place. However, with a retro-spective design, research that is not based mainly on interviews can also be afflicted with potential problems in comparison to the prospective method, such as survival bias which has the risk of selecting only parts of a popula-tion when tracing observation units backwards in time. Additionally, a de-sign with repeated cross sections (sometimes called the trend study) involves data that is gathered on the same set of variables for, and possibly at, two or more periods. The repeated cross section method includes nonidentical but comparable cases in each period. The typical, pure cross section is carried out for a single occasion (and is not longitudinal), but the repeated cross section method implies that it is cross-sectional at the level of the sampling units but longitudinal at the level of the research units.23 A more narrow definition of a longitudinal study is that it must contain diachronous/historical data on the same set of individuals/units, and that it is necessary that it comprise more than one individual (or more than only a few). The last implies that non-comparative case studies – as an example, the history of a single business, or (auto)biographies – cannot be defined as lon-gitudinal according to this approach. Nor would the repeated cross section design be included in this more narrow definition. Carl-Gunnar Janson has described longitudinal studies as:
In the longitudinal study in which each unit is represented by diachronous data, one can analyse change or development on the level of the units. If the units are individuals, the analysis can be made on the individual level. In ad-dition it can also be held on aggregate levels. The units may be other micro units than individuals, such as families, farms, enterprises or neighbor-hoods…
(Janson, 2000, p. 30) 22 Taris (2000), pp. 8-11. 23 Taris lists seven different designs for collecting and analyzing longitudinal data, including e.g. panel studies (relationships across time rather than relationships at one point in time) and time series analysis; Taris (2000), pp. 5-14. Other longitudinal designs can be viewed as ‘not-quite-longitudinal designs’, for instance a series of cross sections in which the same variables are measured repeatedly but where the cases are not identical (as in a repeated cross section), and, additionally, not comparable between periods. Menard (1991), p. 22 ff.
13
Accordingly, a longitudinal study should therefore be able to analyze both populations/groups, such as birth cohorts, that contain several individuals as well as the single individuals. Janson further states that a larger, more long-term study (i.e. more than two or only a few observation periods) of a popu-lation or of several ones is a design that most clearly implements the longi-tudinal perspective. The advantages with a longitudinal design is therefore often stated as its capacity to measure change at both the population and individual level, and that assumptions of causality can be controlled for in a higher degree than in cross section investigations. The disadvantages are, among other things, that it is usually a time-consuming method.24 The Cohort method can be viewed as a special case of the longitudinal method where (individuals/units in) one or several cohorts are followed over time. A cohort is an aggregate of individuals with a shared attribute. It can be persons born the same year, or persons that began elementary school a certain year or at the same age. (In the following, however, the concept of cohort will have the meaning of a birth cohort.) A cohort is consequently an aggregate of individual units, although it is only so in a statistical sense. Hence, all units do not automatically interact: humans from the same genera-tion might know or interact with others from their own generation, but surely not with all of them. The units in a birth cohort are theoretically exposed to the same risk during the same time or at the same age. ‘Risk’ is here a con-cept that denotes not only hazard but also the probability that a certain event has taken place. The individual units experience events – such as marriages or deaths – in their life history in the same chronological interval. Events could be exogenous to the birth cohort, for instance an outbreak of a war or a major macroeconomic upswing. Events could also be related to a specific cohort or age group, which for instance is dependent on the age of the co-hort. The risk of retirement (as an event) is smaller for a cohort of 25-35 year olds, but higher for an older cohort of 55-65 year olds at a certain point in time. Over time, consequently, and all other things being equal, the younger cohort’s risk (probability) for retirement increases. Therefore, the concepts Cohort, Age and Period (time) are central in this special case of longitudinal analysis. In comparison to cross section designs it hopefully becomes less difficult to measure the causes of events that are age-related (Age), historically related (Period) and, perhaps, related to gen-eration (Cohort). Age, Period and Cohort are not entirely possible to sepa-rate from each other, which must be emphasized. The effects of each vari-able depend on the other two variables. However, if we are aware of the
24 Long-term longitudinal projects can be risky since they over time may come to have a fading relevance at the end of the project. Furthermore, there may be a need for new, com-plementary (and extensive) data during the course of the project. Janson (2000), pp. 33, 37-41. See also Janson (1978).
14
(theoretical) effect that the variables can cause, it is possible to take this into consideration. Cohort, Age and Period are linearly dependent. If we know how old a person is (Age, A) at a certain period of time (Period, P), then it is easy to calculate when the person was born (Cohort, C), i.e. P – A = C.25
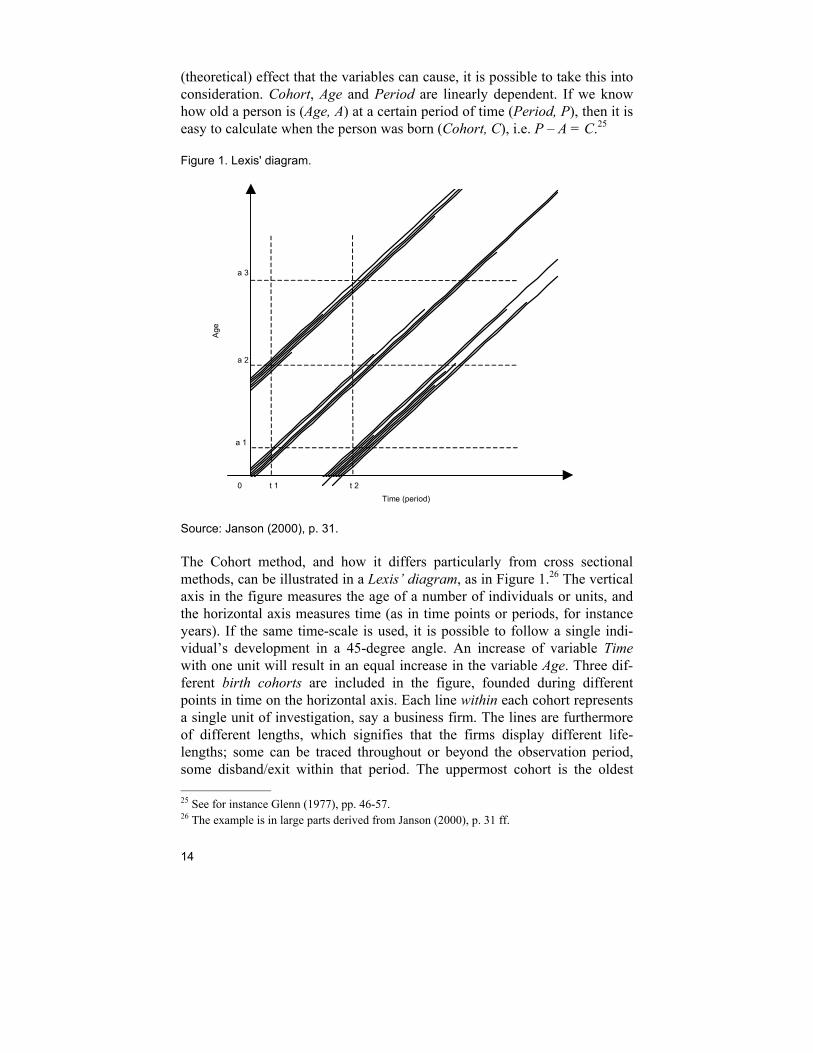
Figure 1. Lexis' diagram.
Time (period)
Age
a 1
a 2
a 3
0 t 1 t 2
Source: Janson (2000), p. 31.
The Cohort method, and how it differs particularly from cross sectional methods, can be illustrated in a Lexis’ diagram, as in Figure 1.26 The vertical axis in the figure measures the age of a number of individuals or units, and the horizontal axis measures time (as in time points or periods, for instance years). If the same time-scale is used, it is possible to follow a single indi-vidual’s development in a 45-degree angle. An increase of variable Time with one unit will result in an equal increase in the variable Age. Three dif-ferent birth cohorts are included in the figure, founded during different points in time on the horizontal axis. Each line within each cohort represents a single unit of investigation, say a business firm. The lines are furthermore of different lengths, which signifies that the firms display different life-lengths; some can be traced throughout or beyond the observation period, some disband/exit within that period. The uppermost cohort is the oldest 25 See for instance Glenn (1977), pp. 46-57. 26 The example is in large parts derived from Janson (2000), p. 31 ff.
15
one; the cohort at the bottom right is the youngest. The cohort in the middle is consequently the second oldest/youngest, and has the age of zero years at the point where the horizontal axis Age intersects the vertical axis Time (pe-riod).27 A single, ‘pure’ cross section at time the point in time, t1 – represented by the dashed vertical line at t1 – would include the firms in the two older co-horts but not the ones in the youngest since that cohort has not been founded before t1. Here for instance it is possible to measure the age and the number of firms in these two cohorts at that particular time. At t1, the surviving firms in the oldest cohort had reached an age of a2 years, and the ones in the sec-ond oldest an age of a1 years (represented by the dashed horizontal lines). As can be observed, no firm that had ended its business (exited) before the cross section at t1 are included in the sample, thereby the notion of that only sur-viving firms at t1 will be a part of the sample (survival bias). A second cross section can, additionally, be carried out at another point in time, t2. This can be said to be a repeated cross section. Between these two cross sections, the third and youngest cohort of firms has emerged, having an age of zero years at a point in time somewhere between the first and the sec-ond cross section. At t2, the members of the youngest cohort have reached an age of a1 years, while the second oldest cohort has now reached an age of a2 years (at t1, it had an age of a1 years), and the oldest one an age of a3 years. Partly the same, partly new units – firms – are included in this second cross section. Since new, younger firms have been added to the sample (the youngest cohort), and since some firms from the older cohorts have exited between the two observation periods, it is not unthinkable that, on an aggre-gate level, the average business age or the number of firms in the two sam-ples has changed. A retrospective study, based on a cross section, is also possible to realize on the same data material. Let’s say that we start from the cross section at t2 and go ‘backward’ in time. By this, the development for each single firm that is included in the cross section can be unfolded (given that this is allowed by the empirical material), but also – at least with some reservation – the de-velopment of each of the three cohorts. In this example, the age of each sin-gle firm at t2 is known, and thereby it is not difficult to calculate when in time each firm was founded, i.e. their birth cohort (P – A = C). It is however not certain that, for a number of reasons, there is a possibility to study or to trace firms in each cohort that disbanded or exited before the cross section at t2 was made. Such a particular retrospective study would then only include firms from the three cohorts that, at t2, had reached an age of a1, a2, and a3
years, but not firms from the two oldest ones that for example merely reached an age of a1 (second oldest cohort), alternatively only an age of a1 or 27 As can be seen, the oldest cohort is founded at a point in time that is situated to the left, beyond the horizontal axis. This is not displayed in the figure.
16
a2 years (oldest cohort). Thus, it would be survival bias in the study: only surviving firms at the specific point in time t2 would be included.28 A prospective study follows, in this example, one or several birth cohorts and their individual members over time from when they are born to the time of their death (or up to a certain point in time). If possible – given the avail-ability of sources and data – every firm from each cohort can thereby be included in the analysis. It is possible to control for the age of each firm at any point in time, as well as when it (perhaps) exits. The potential problems that may arise in a retrospective design and in using the repeated cross sec-tion method can hopefully be avoided. Both of the latter methods can be af-flicted with survival bias; in the case of repeated cross sections it is not even certain that the same firms are studied, and assumptions of causality fur-thermore become uncertain. In employing multiple birth cohorts, as in this dissertation, and in con-structing databases that in several respects facilitate analyses of the life, growth and death of firms from a longitudinal perspective, new knowledge can be generated. From the source material described below a database on joint-stock companies has been created. Seven birth cohorts of joint-stock companies, founded in Stockholm in the years 1899, 1909, 1912, 1921, 1930, 1942 and 1950 are included in this database and the companies are traced from birth to termination. Totally, the database of the birth cohorts consists of some 2,200 joint-stock companies in its basic form.29
Source Materials As mentioned previously the empirical material in the dissertation is based on both printed and unprinted sources. The material that constitutes the foundation for the longitudinal investigation is for the greater part based on unprinted sources at various archives. In a general sense, available empirical material for historical studies of firms and enterprising is better and more comprehensive for joint-stock companies than for other legal forms of busi-ness. From the end of the 1890’s, and especially from 1912 and onwards, government authorities in Sweden did organize information and material about joint-stock companies that facilitates the tracking of individual com-panies over time. Materials or information as regards other forms of enter-prises – such as private businesses or partnerships – are usually missing or 28 It is not unlikely that much research on firm dynamics, such as business growth, is charac-terized by survival bias. Samples of firms of different ages that exist at a certain point in time are followed backwards in time, unfolding their development over time (perhaps even from their birth). Firms from each of the (theoretical) birth cohorts that have disbanded before the cross section is made are inevitably not included in the study. 29 Cohorts 1899, 1909 and 1921 are from Gratzer (1996); the author has constructed the four other cohorts.
17
are less ample, especially the further back in time we go. For such enter-prises has there been less systematic registration compared to joint-stock companies.30 The capital required to start a joint-stock company around 1900 was 5,000 Swedish Kronor (kr.) in nominal values, which was a rather significant sum of money at that time. It is therefore likely that especially small firms or self-employed persons were running a business in other legal forms than the joint-stock company – something quite common also today. It is as a result thinkable that a study such as this tends to be biased towards somewhat lar-ger businesses although it is difficult to control for this in the analysis.31 Databases have been constructed from the source material, and these are further described below.
Unprinted Source Materials The major source material comes mainly in unprinted form from the Swed-ish Patent and Registrations Office (Patent- och registreringsverket, PRV). This authority was from 1897 responsible for registration and supervision of joint-stock companies.32 Each company was at assigned with a registration (identification) number, a number that each firm maintained throughout its active time irrespective of changes in ownership, line of business and so on. Via this number each individual company can thus be tracked over time. It is the chronologically held register of joint-stock companies (aktiebolagsregis-tret) that is the foundation for the Database on Joint-stock Companies. The information contained here is diverse and quite summarized. Yet it contains data on the companies name (firma), line of business, the company board (styrelse) and the size of the stock capital (aktiekapital). This register covers up to 1972, thus for subsequent years other archives must be used.
30 For instance regional authorities (county boards; länsstyrelserna) had the responsibility for trading firms and private businesses for a long period of time. The less comprehensive source situation for these types of firms does not mean that there has not been any research of such enterprises. But the possibility to obtain aggregate pictures of other firm populations over time is due to the source situation quite meager. 31 This does not necessarily mean that firms in legal forms other that joint-stock companies were small; several mills and factories with a considerable number of workers were continued as private businesses long after that the joint-stock company had been introduced in Sweden in 1848. See for instance Jörberg (1961). A discussion regarding firm-formation and related question takes place in Chapter 5. 32 For some time is the section at PRV that dealt with enterprising, or rather joint-stock com-panies (PRV bolag) called Bolagsverket (Swedish Companies Registration Office). I generally bear reference to both institutions when PRV is discussed or mentioned in the text. Most of PRV’s older materials are preserved at the National Archives (Riksarkivet, RA). However, it should be pointed out that some sources – mainly annual reports from larger companies – actually are printed/published. Some of these reports are preserved at the Royal Library (Kun-gliga biblioteket, KB) as uncatalogued material (okatalogiserat tryck, OKAT).
18
More detailed information as regards each individual companies develop-ment is also possible to extract from preserved documents. First and fore-most here Annual accounts, or Annual books (räkenskapshandlingar), are the most significant ones. Each company was from 1912 by law bound to report its financial situation to PRV. Profit and loss accounts (resultaträkn-ing) – which in theory can embrace a large number of items such as pur-chases, expenditures, salaries, write-offs, etc. – are included here, as well as their balance sheets (balansräkning); the latter containing information on assets and liabilities and debts. In this annual material is also occasionally included other types of source information such as the report of the board of directors. If the annual books and the balance sheets can be viewed as more or less quantitative information as regards individual companies it is, on the other hand, the last-mentioned source consisting of the board of directors’ reports that is of a qualitative or narrative nature that gives the (annual) posi-tion of the company in question. It must be pointed out that it is quite un-common with extensive reports in these circumstances. These source materi-als are very heterogeneous. Some companies were quite careful and precise in reporting rather detailed items, and the ‘narrative’ part (the report of the board of directors) could be long and comprehensive. Pertaining to the majority of businesses in the study, other companies were reporting less information, often not more than required by law. Simply put, most of the statements are simple. This has some consequences. The useful-ness as well as measures on firm growth and size becomes somewhat lim-ited. For instance employee figures would be valuable in this circumstance, but such information is hardly ever reported in this source material. Rather, financial data has been a common measure since all companies were obliged to report their annual statement to PRV.33 Although the above-mentioned source materials are the main sources of the investigation, nonetheless closely related sources from PRV have additionally been employed in con-structing the databases in question, even if these have mostly had a more secondary role in the data collection.34 It should also be pointed out that the 33 These annual statements are preserved at RA with reference to firms that had ceased opera-tions before 1960. After that year other archives must be used – for instance if we want to trace all firms in a cohort prospectively and thus avoid survival bias. It is at the Swedish Companies Registration Office (Bolagsverket) where these files and statements are preserved. The availability and possibilities to conduct research at this particular institution are quite meager compared to RA. 34 Documents of registration of a single company (Certificates of Incorporation; registrering-shandlingar); covers the very initial formation of a company, while the Memorandum of As-sociation (stiftelseurkund), and the Subscription List (teckningslista) contain information of the structure of the board, etc. The (intended) line of business/industry, the nominal value of the stock and the number of votes per stock, as well as the total value of the stock capital is also information included in these documents. Furthermore, there are also in such registration documents records from the Constituent Stockholders’ Meeting (konstituerande bo-lagsstämma), during which the formal decision is taken to start up the company. In these documents is also reported the corporate domicile (styrelsens säte), and – sometimes – the
19
source material from PRV in most cases probably constitutes the only pre-served artifacts about the businesses investigated in the dissertation; most of them did not survive for any longer period of time and they remained un-known throughout their lifetimes. Since this unprinted source material is an important empirical base for the dissertation a final remark is necessary concerning above all the investiga-tion’s validity. Public accounts and books and other statements from busi-nesses, or for that matter from other organizations, are perhaps too often assumed to represent factual data or an objective reality. It is still essential to bear in mind that such records also may be more or less ‘political’ docu-ments. They may tell a story that differs quite significantly from the actual course of events or the real situation of the individual business, particularly regarding financial indicators. This has for instance been shown regularly in business histories, and therefore can we sometimes run the risk measuring something else than what was actually intended. On the other hand are the employed sources often the only remnants available to researchers, and even if the ideal situation would be to have multiple indicators of business size is this at most times not possible.35
Printed Sources and Other Data Although a large part of the source material has been unprinted material other sources also have been employed. This material can be partially con-sidered to be from printed sources – or at least comprise public or official material. Data from credit-rating firms concerning more present-day infor-
company’s postal address. The Articles of Association (bolagsordning) are also included here. The Annual Report of the Board, and the Report of the Directors (styrelseberättelse and för-valtningsberättelse) constitute additional sources. In the reports, we sometimes can find data of more ‘qualitative’ nature, e.g. descriptions of the development of the firm, as well as its market situation. The quality and usefulness of these statements and reports vary a great deal from case to case. However, the possibility to receive an annual picture of the firm’s eco-nomic and financial situation other than in only financial terms (as in the accounts and sheets) is in my opinion useful. The yearly Statement by Auditor (revisionsberättelse, later revisors-berättelse) is of course also included, but is in my opinion not as useful as the other sources. RA. PRV, bolagsbyrån. 35 See Hildebrand (1989), p. 1-3. Hildebrand takes several examples from Swedish business histories and argues that the advantage of a business historian is the opportunity to work with internal company records, protocols and correspondence. These have often differed signifi-cantly from ’official’ published documents – ’external sources’ as Hildebrand calls them – both for companies as well as for banks, and these discrepancies seem to be more of a rule than an exception. The employed sources in the present study are, as mentioned, commonly the only remnants available to the researcher. In an ideal situation we would have the choice of multiple indicators of business size and development, something often advocated by re-searchers; see e.g. Delmar et al. (2003). This is further discussed in Chapter 3.
20
mation as regards companies have been employed.36 Furthermore, other sources have been used, or at least examined, in the search for information or to trace the companies in the cohorts.37 I have furthermore employed other sources and databases that embrace both business data and other (statistical) material. Data from the National board of trade (Kommerskollegium) and Statistics Sweden (SCB) – included in the statistical series of BISOS and SOS38 – is comprised by industrial statistics and censuses of enterprises, and is used in the dissertation for constructing longer series and data (cross-sectional) as concerns the number of firms in the Swedish economy on an aggregate level.39 At least partially developments or tendencies can be analyzed here. Additionally, data on price series and macroeconomic data have been em-ployed – both from public statistics and previous research – in a rather wide extent in the dissertation. This is first and foremost historical national ac-counts,40 and interest rate data.41 Such information is used in a supplemen-
36 This data comes from UpplysningsCentralen (UC) and Affärsdata, which contain credit information and other data on companies. In this respect has such data mainly been employed in tracking the surviving companies from the seven birth cohorts. 37 There are actually rather comprehensive printed sources available that can be used in the historical study of (mainly) joint-stock companies. This is more thoroughly described in Box (2001), but it can here shortly be mentioned that Sveriges handelskalender (Sweden’s Trade Directory) and a similar one from Sveriges industriförbund, the Federation of Swedish Indus-tries, (1918-) – Svensk industrikalender, Swedish Industrial Directory – published information on firms – particularly the latter one was quite comprehensive as concerns data, but included on the other hand less firms. Furthermore, during the period 1900-1933 financial and other information on joint-stock companies were published in the series Svenska aktiebolag och enskilda banker: aktieägarens uppslagsbok (Swedish companies and private banks: the stock-holder’s directory) but first and foremost financial data from the 1920’s is available here; see Åberg (1900-1933). The selection of companies is nonetheless rather biased since a minimum amount of stock capital was required for inclusion in the series. This amount was also raised over time (probably due to the increasing number of small joint-stock companies in the econ-omy). These series were continued from 1933 up to 1977 under the title Svenska aktiebolag: aktieägarens uppslagsbok. I went through these publications in an early phase of my research project, but found that this type of data did not correspond with my objectives. Nonetheless should it be pointed out that the data in these series are quite useful. 38 BISOS: Bidrag till Sveriges officiella statistik (older series), and SOS: Sveriges officiella statistik. 39 This data is mainly used in Chapter 4. The material embraces publications and series that mostly concern manufacturing statistics and are published in Statistisk årsbok and in the series of Industri, mainly from 1913 and onwards. Earlier publications are however available (BISOS). Additionally, censuses of enterprises were conducted in 1931, 1951, and 1972, which also embraced the entire economy and not only the manufacturing industries. Regard-ing more current information the business database from SCB has been employed (SCB: CFAR/Företagsdatabasen). 40 This data mainly comes from Krantz (1997). Edvinsson (2005) has published newer revised historical national accounts that differ from earlier data, although I do not think that this has any consequences as concerns results in my own investigations. 41 Data mainly from Persson (2001); furthermore have data from SCB as concerns various price and inflation measures been employed.
21
tary manner as well as integrated variables and phenomena in the various analyses.
Established Databases From both unprinted and printed sources different databases have been es-tablished. From the above-mentioned material based on public (printed) sta-tistics – mainly from Kommerskollegium and SCB – figures over the number of firms and aggregate business structure from the late 1800’s and onwards were combined and established into a coherent database. This data is cross-sectional and not further described here (a more thorough description as regards data considerations and methods is given in Chapter 4). As for as the longitudinal database(s) is concerned there is however reason for a more detailed account. Considering the rather vast population of busi-nesses in Sweden already at the turn of the last century a population of 2,200 firms might appear as rather small. Yet, the material in PRV’s archives is to say the least widespread and comprehensive, and to build a database with supplementary databases is a reasonably extensive work. The fundamental database for the study, Database on Joint-stock Companies, reports basic data on those 2,200 businesses, founded in Stockholm 1899, 1909, 1912, 1921, 1930, 1942, and 1950. Stockholm has here constituted a delimitation due to the large source material. The database’s main source is here PRV’s archives with supplementary archives. All firms in the database are traced longitudinally from their founding to their termination. Included here are a number of basic variables. One is the companies’ birth year, which in this case is synonymous to cohort. Another variable is the way of closure or ter-mination (of so were the case; some of them are still active today – or were until recently – as economic units). Liquidation was the by far most common way to seize operations, followed by bankruptcy.42 Since firms are followed longitudinally from their birth to their termina-tion, or at most to 1999, firm age is also a central variable in the investiga-tion. Firm size is, as concerns Database on Joint-stock Companies, measured as each company’s stock capital at start. Only in some exceptions have I made any investigations of changes in the firms’ stock capital over time. Generally this capital did vary between (in nominal figures) 5,000 Kronor – the smallest capital allowed up until mid-1970 – up to 34 million Kronor. The characteristics of the source material regarding this particular database does not allow for any alternative measurements of firm size.43 The compa-
42 Other, less common ways to terminate were through e.g. merger. As concerns some of the businesses there are indications that they had been terminated but not how, or alternatively, exactly when termination took place. 43 For this, annual reports for each individual company must be used, a much more time con-suming and demanding procedure.
22
nies’ boards furthermore specified the (intended) line of business at registra-tion. It should be pointed out here that this did not correspond to any stan-dardized sectoral or industrial classification.44 These variables that are in-cluded in this particular database on joint-stock companies have in my opin-ion an extensive usefulness while I am of course aware of its limitations.45 By using this database as a foundation can analyses of the life-length of businesses be performed as well as new, supplementary databases be cre-ated. Two supplementary longitudinal databases were furthermore built from the seven-cohort Database on Joint-stock Companies. One database was con-structed with a specific purpose to trace or follow up those companies that survived for a long period of time. Another was established with the purpose to chronologically follow individual companies over time in order to study their growth. The first, Database on Surviving Companies, contains a follow-up of around 350 (of some 2,200) companies that still were active at the end of the 1990’s. On the whole only a small number of firms per cohort did survive for such a long period of time. Thus, we deal here with firms that were active for some fifty to one hundred years. These have been traced through available databases,46 and variables here that were of main interest were various size-measures in order to assess if the firms had grown. The latter database constitutes a ‘re-construction’ of the development of businesses on the firm level, more specifically the development of two out of seven cohorts. Here, the companies in Cohort 1912 and Cohort 1930 are followed (Cohort 1912 and 1930 Database). Measured in the number of ob-servations, this database is the by far largest one.47 Totally there are nearly 6,600 observations – or rather, observation years – for the totally 420 com-panies that are included and followed for at most thirty years per firm. 44 Classifications of sectors etc. have been changed over the decades by the National board of trade (Kommerskollegium) and SCB. In 1969 for example the first SNI code was introduced, and the current system of classification is very detailed. It is questionable whether it is possi-ble (or for that matter meaningful) to retain information as regards the actual – or rather, ‘official’ – line of business of the firms in the birth cohorts. 45 Another aspect hard to control for is the case in which companies in the database were periodically inactive. This could generally be viewed as a quite important aspect since a busi-ness that temporarily ceases its activities on the market might be less exposed to a risk of termination – at least for the moment. The source material used here (the PRV records) do not generally tell if and in what respect the companies had stages of ’hibernation’ during their life-courses. More modern databases indicate that this is a rather common phenomenon for particularly small firms. Naturally may this become problematical – how should we value or assess such a business? Must we define it as terminated (or periodically terminated) and so on? My assessment of this state of affairs as concerns the longitudinal database in question is that this does not seem to constitute any large problem. The few number of companies that informed PRV that they had ceased operations or been inactive for the past one to two years commonly did not resume their business but closed down. 46 Mainly UC and Affärsdata. 47 Source material from PRV bolag, preserved at RA, as well as from the Swedish Companies Registration Office (Bolagsverket), was here used.
23
Mainly unprinted sources (yearly accounts; see above) constitute the founda-tion for this database.48 In this case it has – with some exceptions – been possible to track each company over time and to observe if, when, and in that case to what extent they grew. In this database it has furthermore been possible to employ a wider range of definitions or measures of firm size. Apart from these measures additional variables have been included; vari-ables that concern the companies’ directors or managers – mainly when in the businesses’ life-course and to the extent there was leadership succession. In that respect this database is also a longitudinal record over managements and directors. A considerably large number of running meters of source ma-terial were employed in constructing Cohort 1912 and 1930 Database; I es-timate that some 10-15 meters of material at various archives were used here – nearly 6,600 observation years are in this case equivalent to the same number of annual statements.
Concluding Remarks Several types of source materials are used in studying the growth and devel-opment of firms. For the most part, unprinted sources and data are employed in the dissertation and from this, databases have been established in order to address various problems of firm growth and survival. In that respect we are here dealing with a unique historical record of businesses. To my knowl-edge, similar datasets are not available in public (or secondary) statistics or publications. The overall method for the analyses of growth and survival is the longitudinal approach, or rather, the cohort method that is a special case of the longitudinal method. Longitudinal studies are powerful in the sense that they make it easier – if not entirely possible – to investigate causality. If, for instance, cross section data is used it then actually becomes complicated to explore cause and effect since, as been shown here, we do not know which business units grow, decline or terminate, etc. I employ cross section data in my dissertation, and with several (repeated) cross sections, trends or tendencies can be discerned. Yet, the main approach and method is longitu-dinal. There are in fact quite a lot of definitions of the longitudinal method. Gen-erally we can, when speaking of this subject, state that it concerns the change of an individual unit as well as a population of units over a certain period of time. Actually this dissertation is in much sense approaching the more nar-row definition of a longitudinal study. It contains diachronous – historical – data on the same set of units; it comprises a fairly large set of observations (or a large population); it assumes a long-term perspective, and, finally, the 48 A negligible number of annual statements was actually nonetheless printed/published, mostly by larger companies with a larger number of stockholders.

24
characteristics of the data – or the design of the database – makes it possible to study both populations or groups, as well as individual observation units since the aggregates (or cohorts) are built on observations of individual busi-ness units. This dissertation is mainly prospective and avoids in many re-spects survival bias since we here deal with birth cohorts that are followed forward in time. The cohort method, furthermore, makes it possible to sepa-rate (at least it increases the awareness of) effects of cohort, age and period. Therefore, in analyzing the development of joint-stock companies – repre-sented by, as regards growth and survival of business firms, seven birth co-horts – new knowledge and new perspectives can be generated.
25
3. Growth and Survival of Firms in Research
Introduction In the economic sciences the problem of the growth and survival of business organizations has been a thoroughly researched area. Different research tra-ditions as well as shifting focuses over time have resulted in an ample body of research that consists of different theoretical, methodological and empiri-cal perspectives. This chapter intends to visualize and discuss research re-sults with a specific focus on identified causes and determinants as regards firms’ growth and survival. Here I shall try to apply a rather broad perspec-tive, which means that I have included research that ranges from quite macro-oriented and aggregate studies (mainly in economics), as well as re-search in the field of business history, to the more ‘traditional’ entrepreneur-ship and small business research literature. Therefore this chapter consists of research from different disciplines – research that moreover has had both a more explicit and implicit focus on growth and survival. Some delimitations or reservations must be made here regarding the large body of research that theoretically could be included. Only general results, conclusions and broader methodological concerns will be discussed in this chapter. The stud-ies included are in some respects biased towards Swedish research and find-ings.
Different Disciplines, Shifting Focus Over Time When examining various studies in business administration (business stud-ies), economics and economic history that have approached the problem of business growth and survival, it is evident that research settings, methodol-ogy and definitions or conceptions differ significantly. This is also true of the field of entrepreneurship and small business research; this research branch has undoubtedly displayed the keenest interest in studying the growth and survival of firms, particularly when it comes to elaborating and thorough discussions as regards definitions and measurements. Especially research in business administration that focuses on small busi-ness performance has regularly approached the research problem from rather
26
exhaustive viewpoints as concerns measurements and definitions.49 This field came from especially the 1970’s and onwards to have an increasing interest in small businesses.50 Economists, on the other hand, have often been criticized for not considering and discussing the concept or definition of the (small) firm and related problems such as firm growth and failure to a sufficient extent but rather seen the firm as a black box.51 Nonetheless, theo-ries and methodological concepts from economics have been widely influen-tial and applied in other economic disciplines,52 and, additionally, research on industrial organization has often contributed to discussions about meas-urements and definitions. There has also been a keen interest in novel or new (small) firms in both traditions, especially in business studies. Even if there is no clear-cut line, business studies perhaps have asked more questions about the individuals who start businesses and make those businesses grow (or fail), while economists commonly have developed an interest in net and gross effects – e.g. job generation effects – of (new) business activity. There-fore, what might separate studies in business administration that address (small) business growth and survival from economics research could be the research focus and the object of investigation: in the former the entrepreneur or business owner-manager commonly is the center of attention regarding his or hers traits, behavior and strategies, whereas the field of economics have perhaps researched structural attributes such as industry differences, regional variations, and the like, to a greater extent – thus with a more macro or aggregate approach.53 While extensive debate has evolved around measurements and definitions of the business organization and of firm size and growth in the research field of entrepreneurship and small business, as well as in much economics re-search, it seems that economic history – or rather its special branch, business history – has put less focus on such issues. Business history has to a greater extent than other disciplines researched ‘existing’ firms, or individual (large) businesses, with a rather one-sided focus on large as well as successful ones.54 49 Such questions relate to how to measure firm size and growth and so on; Davidsson (1989), and Wiklund (1998) are examples of studies with elaborate discussions of measurements and definitions. 50 Gratzer (1995), p. 61. For a historical doctrinal study of the development of business ad-ministration in Sweden, see Engwall (1992). 51 This critique is mainly directed at mainstream theory that, according to critics, is built on price theory and static equilibrium; see for instance Kirchhoff (1994), p. 9f., for a discussion. 52 Many theories for instance in business administration are rooted in economics and sociol-ogy. Näslund and Wadell (1971), p. 11ff. 53 See Caves (1998) for an overview. For examples see, among others, Audretsch (1995), Audretsch et al. (1999), and Evans (1987a) 54 Söderberg (1995), p. 22f. There are nonetheless naturally examples of research that do not apply to the one-firm, case study approach in the business history tradition, see for instance Glete (1987) and (1994).
27
Here, a long-standing research debate has been if the ‘traditional’ business history – the monographic, and in many instances descriptive approach – leaves any room for generalizations and theoretical connections.55 Methodo-logical issues that deal with appropriate measurements of size and growth (or for that matter termination) of firms as such – as is often discussed in small business research – do not seem to have played an equally important role. It seems rather to be the expansion on existing and new markets, as well as the diffusion of fields of activities etc. that have engaged the attention of eco-nomic historians. Here, the expansion of the business(es) has mainly been in focus – new markets, new products, increase of an already considerably large work force, and so on – while growth (or growth rate) of firms has been the main interest in economics and business administration where yearly increases or decreases in sales, turnover, revenue, or employment have been important indicators on the performance of firms.56 In addition, business historians have additionally applied a longer time perspective as 55 Lindgren (1998) has as for example claimed that theoretical competence amongst business historians (in the Scandinavian tradition) must be raised. Galambos stated for instance that a synthesis between the individual-oriented approach and the business-oriented approach was needed, and that it was necessary to stress the evolution of the business unit: “This does not mean that the individual would be ignored; it merely proposes that monographic research and in particular biographical studies should address themselves to a coherent body of questions about business organizations” (p. 5.). Particularly sociological theory of complex organiza-tions and the theory of the growth of the firm were ways of stimulating ideas; Galambos (1966), p. 4-6. Karl-Gustaf Hildebrand (1989) has defended the more traditional view of business history. 56 Consequently, less research in economic history/business history has had an explicit aim to study firm growth and survival as in the fields of business administration and economics. It is, just as in the case of research in business administration or economics, almost an impossible task to study all previous scientific production The following studies with focus on expan-sion/growth have been examined: Hassbring (1978), Lindgren (1979), Ullenhag (1970), and Wikander (1977). With exception of Ullenhag’s study, these studies analyze the expansion, strategies and operations of Swedish Match and Ivar Kreuger during the interwar years. The differences are however quite large compared to how the problem of growth/expansion has been treated in business administration. Business growth as a conception can therefore be defined in many ways and does not have to translate into variables such as the number of employees: Palmer (2001), for instance, studied the growth of foreign linkages of several large Swedish corporations between the 1890’s and 1990’s. Westberg (2002), furthermore, has investigated engineering company AGA’s innovative activities during various phases over a nearly 60-year period. Thus, business growth per se may not be the main objective in these studies even if they nonetheless deal with the expansion and development of businesses. This implies that there are some differences between disciplines as regards growth and expansion. Growth and expansion are both concepts generally seen as a change of the busi-ness into bigger premises. These concepts usually stand for more employees, expanding on the market with new concepts or products, etc. However, the growth stage as such is seen as the first considerable boost in central firm-specific variables such as employment or sales, turnover, etc. On the other hand, expansion could be said to constitute a more controlled development and growth, for example in a new or within an existing market; Bridge et al. (1998), pp. 119-120. Hence, there are also differences between how the very concepts of growth, expansion and development of firms have been dealt with in the three academic disciplines. We can therefore ask ourselves whether or not quite two different processes are studied when we compare Business Administration and Economics with Economic History.
28
other fields have had a considerably shorter one. What may be viewed as a common denominator in business studies, entrepreneurship and small busi-ness research, and in business history, is rather a focus on managers and owners as regards their backgrounds, behavior and decision-making. Fur-thermore, in both economic history57 as well as in business administration58 there has been a more pronounced tradition of analyzing business behavior in line with the business environment. It is no exaggeration to claim that the bulk of research that has a focus on small business growth and survival has emerged since the 1980’s and on-wards. As stated earlier this increased attention towards small businesses can be partly explained by structural, macroeconomic, crises in the 1970’s that brought academic and political attention on smaller businesses. And it does seem that the research field has changed over time regarding focus and de-terminants. The focus on the individual or on the entrepreneur has most likely become more pronounced over time. Even though there are exceptions it seems that previous research has put less attention on the individual busi-ness and/or on the individual business owner-manager. Research generated roughly between the 1960’s and –70’s seem to have been directed more to-wards aggregate change in firm populations and towards statistical relation-ships between structural attributes amongst firms such as age and size. A large part often involved discussing stochastic processes regarding the growth and survival of businesses or (industrial) concentration.59 Later dec-ades have witnessed a rising focus on other factors. One of these factors is, as stated earlier, individual-oriented determinants, while another relates to institutional phenomena and economic policy on small business activity.60 Moreover, a focus on small businesses has naturally emerged over the years.
57 Influences here have come from several directions, and the perhaps the most important ones are in new institutional theory (New Institutional Economics); Schumpeterian theory (in which micro or firm growth arises due to entrepreneurial and strategic adaption/interaction to new environments and situations – here markets, technology and institutional setting are influential for firm growth; see for instance Ullenhag 1992 and 1993) and by Alfred D. Chan-dler’s theoretical model of longer changes and historical stages of management and ownership in capitalism; see Chandler (1977). See also Lindgren (1998). 58 See for instance Rhenman (1969), especially p. 65ff. 59 Examples of such studies are Wedervang (1964); Ijiri and Simon (1964); Engwall (1970), and Birch (1979). 60 As concerns institutional determinants and economic policy, see for instance Henrekson and Johansson (1999c). Even though economic history has to a great extent adopted the insti-tutional approach (see Lindgren, 1995), business history is perhaps a field of exception in which managers and owners for a long time have been considered to have a crucial role.
29
Firm Growth and Survival: Measures and Approaches Firms’ ability to survive is a problem that has engaged researchers and theo-rists to a considerable extent. There are several definitions at hand that re-lates to the exit or termination of firms. While an exit – of some sort – from the market or from a population of firms in its simplest way may be regarded as a business failure, ‘failure’ can nonetheless as a concept embrace several causes and have different meanings. Bankruptcy is for instance a common measure even if in that there is the risk of excluding other business exits that are in fact failures. Furthermore, not all bankruptcies are necessarily ‘real’ failures.61 Nevertheless, some studies have employed bankruptcies as indica-tors when measuring firm survival and termination, for instance in analyzing business populations or aggregate data, while others have used a broader perspective and defined all types of business termination as exits and used them to measure the ability of an economic organization to survive (and not necessarily seen them as failures). It is therefore in some respects a question of what is being studied that should determine what measure to use in con-sidering firm survival and termination.62 As stated in the earlier section researchers have frequently focused on size-measures and the growth process as such. For instance it was acknowledged above that growth and expansion might represent two different aspects of firm growth. Nonetheless, two main issues pertaining to growth and size are commonly considered crucial in this respect. One concerns growth as it per-tains to whether the individual firm’s relative growth from one point in time to another is preferable, or if absolute measures should be employed. An-other problem concerns the size variable(s) as such and appropriate indica-tors to measure both size and growth. In considering growth it has been rec-ognized that absolute measures – i.e. absolute change in size between two or more periods of time – differ widely from relative measures. This can in turn have measuring effects; firms that are initially very small – or small at a certain point in time – can appear to have higher growth rates than firms that are larger, although the larger firm may have grown more in absolute fig-ures. Additionally, growth as a phenomenon can also manifest itself as either organic or internal growth, or growth through mergers and acquisitions. De-pending on the research questions and focus some scholars have viewed organic growth as ’real’ growth while mergers and takeovers more are con-
61 For instance has Baumol (1990) discussed various outcomes of business and entrepreneu-rial activities; (economic) success or failure at the micro or firm level does not have to imply that this is transferred into economic failure on the macro or societal level. Thus, bankruptcies and other terminations – or exits – may to a great extent be caused by other factors that do not translate into the common perception of business failure; Gratzer (2001b). 62 This is further discussed in Chapter 5.
30
sidered as a more stable phase for an expanding business.63 Furthermore, concerning the growth process as such several models or theoretical assump-tions have been presented. Such models pertain to how the growth process of the individual business develops. Some scholars have proposed models or theoretical constructs in which the business grows or declines in a smooth manner between two or more periods while others have suggested that it should rather be seen as a stepwise progression, or, alternatively, as an evo-lutionary and more uncontrolled (or unpredictable) process.64 Life cycle theories have furthermore been common and relate to a great extent to such models, in which the business evolves – grows – through various stages.65 Others have asserted that it is more or less fruitless to use such constructs of growth and processes since businesses are heterogeneous in their growth process – if they grow at all – and that life cycle models might be too reduc-tionistic since these stages may not be evident even in a small fraction of firms.66 Secondly, the problem of size has other dimensions. Even if a firm is small measured in terms of number of employees, it can even so be large in terms of for instance market share. Hence, given the problematic nature of the definition of size it is clearly seen that comparison of size whether among firms or industry is not easy to achieve. Some measures are for instance con-sidered to be more appropriate than others depending on industry affiliation and the organizational size has been viewed as multidimensional,67 even if it has also been maintained that various definitions or indicators of size are mutually exclusive, or rather highly correlated.68 Both in research and in official statistics, the number of employees is one of the most common indi-cators of size. There are however other definitions that have been regularly used in research on firms, such as assets, profits and sales. Sales have for instance been a popular indicator for growth in small business research.69 63 For a discussion see Delmar et al. (2003). 64 Various aspects on the growth process and how growth can be looked upon are discussed in e.g. Wiklund (1998). See also Rylander (1995) for the more ‘evolutionary’ or rather ‘unpre-dictable’ approach to firm growth. Carstedt and Isaksson Pèrez (1974) found more fluctua-tions and variations during the start-up phase as well as during the termination phase of busi-nesses. 65 Examples are here Adizes (1988) and Garnsey (1998). 66 Vinell and Hamilton (1999), and Weinzimmer et al. (1998). 67 See for instance Kimberly (1976), Andersson (1987) and Gratzer (1988) for elaborate dis-cussions. 68 It is stated here that there is a rather strong correlation between e.g. the number of employ-ees, assets and turnover of a firm. Agarwal, N. (1979). The observed relationship between measurements are furthermore on an aggregate level and do not by necessity tell us anything of any ‘ideal’ measurements for the single firm: the development of a firm over time can appear very differently depending on the definitions chosen. 69 See Steindl (1945), or Delmar (1997); Delmar examined several recent studies of firm growth. Delmar found that both employees as well as other variables such as turnover and assets are used as indicators of growth. The most common definition in totally 55 studies was
31
Furthermore, the time dimension is added size-and-growth problem. For example, employment figures may not have to be adjusted for inflation, as do financial variables. But even this measurement can aggravate matters since it might be assumed that surviving businesses have a tendency to be-come more efficient over time by substituting capital for labor – at least firms in capital intense sectors such as the manufacturing industries.70 Hence, a firm that in terms of market share, turnover and assets for instance is as equally as large today as thirty years ago may not necessarily have maintained the same number of employees. The question is thus posed, has this particular firm decreased in size or not? There is no clear answer to the question, and depending on the perspectives and definitions a firm may have grown, stagnated or contracted.71
Causes and Determinants to Firm Growth and Survival in Previous Research Just as researchers have often noted the heterogeneity of size and growth measures, they have similarly asserted that there exists no ‘common’ theory about entrepreneurship as well as about firms’ growth in entrepreneurship and small business research – the discipline is fragmented and heterogeneous as concerns theoretical questions.72 In research surveys the determinants of growth and survival are commonly divided into positive or negative factors as well as regularly divided into internal and external conditions.73 We there-fore can observe a wealth of explanations as to why firms grow, and why some survive while others terminate. Furthermore, theories on the growth of business firms have emerged over the decades, as have naturally theories of the firm. I will not here carry out any particularly extensive discussion on the matter. Several theories that discuss the existence and behavior of firms are at hand, but it is beyond the scope of this dissertation to fully address them.74
turnover (33%) and employees (33%). 20 percent were using multiple indicators. Delmar (1997), p. 5f. Similar conclusions were drawn by Weinzimmer et al. (1998), which found that sales were a common indicator. 70 Of course, labor and human capital is heterogeneous and changes (e.g. grows) over time if we compare an industrial worker in 1905 with an industrial worker in 1995. And even if there is an observable correlation between various measurements of size it is more likely that indus-trial firms will ‘behave’ like this if they manage to survive. Small firms in the retail or trade businesses that survive do not however by necessity have to substitute labor for capital. 71 Gandemo (1996), pp. 88-92, discusses for instance some theoretical cases. 72 While this might be true others have questioned this often-identified weakness and rather seen it as a strength; Steyaert and Hjorth (2003), p. 5-6. 73 For overviews: Barth (2004); Bridge et al. (1998), p. 168f, and Storey (1994), p. 154f. 74 See for instance Machlup (1967); Foss (1995), and Loasby (2002) for interesting discus-sions.
32
Yet, problems of firm size, growth and survival in the markets can be traced back to classical economics.75 The neoclassical theory of the firm postulates that firms grow until they reach the size corresponding to mini-mum average cost and there is no incentive to grow beyond this size. Firms that cannot cope with competition leave the market. One explanation as to why smaller firms exhibit higher growth rates – which most studies have acknowledged – could be successful attempts to reach minimum efficient scale as soon as possible. Nonetheless, there have been doubts to this expla-nation of faster growth of smaller firms. In empirical data and in reality, it has been proposed, institutional influences on firms’ growth must probably be more important – thus neoclassical forces can be outweighted by other factors. One such factor would be market imperfections such as economies of scale. A more realistic approach is to assume that there exists firms of widely different sizes that run above the minimum efficient scale and that produce much at the same average cost (assuming constant returns to scale). Thus the individual firms’ growth is determined by the demand for its par-ticular product rather than by cost conditions, and for this reason there have been theoretical arguments to include the impact or importance of environ-mental conditions on the behavior of firms.76 Criticism against neoclassical theory has generally considered basic foun-dations and assumptions. Economists have therefore for instance tried to develop alternative interpretations of the firm. One standpoint is compe-tence-based and evolutionary in which it is accentuated that firms exist be-cause they constitute supreme institutional arrangements that can accumulate and coordinate knowledge and learning.77 There have consequently been attempts to more or less abandon the static approach, and to address internal processes such as the capabilities and behavior of management.78
75 For John Stuart Mill and for Karl Marx, for example, small businesses were predestined to disappear as capitalism evolved; Phillis (1979). 76 Other theories have a stochastic view on the growth of firms, as well as contractual or resource-based views. See Hart (2000) for an overview and discussion. The transaction cost perspective furthermore introduces the problem of firm growth and size in neoclassical the-ory. Transaction costs are here mainly considered to be information costs and costs for up-holding and enforcing contracts. The existence of transaction costs explains both the existence of firms, as well as how (optimally) large they become. Economic activity can be less costly within an administrative, centralized organization (i.e. the firm) compared with a market solution. This explains the existence of firms. Furthermore, when the net profit for arranging economic activity within the framework of a firm is no longer larger than doing it outside the firm – i.e. on the market – the firm will stop growing. See Coase (1937 and Nelson (1991). 77 Nelson and Winter (1982) is one example. 78 Edith Penrose (1959) brought attention towards the internal processes of growth (similar to the evolutionary approach) in industrial firms, with an explicit managerial or entrepreneurial approach. One chief explanation to firm growth according to Penrose is ‘Entrepreneurial capabilities’, where growth must be planned and resources acquired. Firms can grow almost infinitely, and there are but a few real limitations to the growth of firms; Penrose (1959), especially pp. 9-64, 161-164, and 194-196.
33
As regards empirical research results, identified and acknowledged deter-minants of business growth and death can in a simple way be categorized into internal/individual, structural, and external (or exogenous) factors; these are discussed below.
Individuals and Internal Conditions: Traits, Competencies, Behaviors The business owner/manager or entrepreneur has been widely accepted in a large research body as a key determinant to business growth and success, and a keen interest in such questions seems to have evolved in particularly the field of business studies. Much literature has for instance explained failed businesses with individual-oriented variables.79 The works and theo-ries developed in the 1960’s as regards the entrepreneur’s motives and need for achievement has inspired researchers with a management orientation to address the problem of firm growth and performance from a behavioristic perspective, in which also the business owner’s social skills, background and competence are important factors.80 There has been a general profile of the small business manager as a middle-aged, middle-class man that is fairly conservative and reluctant to change and towards bureaucracy. He values on the other hand his freedom and independence. Such circumstances can, ac-cording to a considerable body of research, explain why most firms do not grow, since growth implies expanding the existing organization and increas-ing risks for failure.81 In the light of the above, therefore, there is nothing particularly remarkable in the fact that most small firms do not grow. Nonetheless, studies with fairly large population samples have found varia-tion in growth rates and in different types of managers and firms. New and small businesses are viewed as having more entrepreneurial orientation as regards management and owners; observed growth and performance of firms have been found to be intimately related to the individual’s competence, decisions, goals, needs as well as their perceptions and expectations. Indi-viduals with an entrepreneurial orientation are, it is claimed, prone to be engaged in expanding and growing businesses. Furthermore, other, assess-ment or judgment-related problems are considered to be influential – indi-viduals’ propensity to underestimate initial capital needs are for instance a key factor as to why small firms fail or fail to grow,82 as well as succession events in firms ownership and management.83 Another field related to indi-
79 Gratzer and Box (2002). 80 See for instance Landström (2005) for an overview. 81 Bosworth and Jacobs (1989), pp. 20-33. 82 Hall (1989), pp. 39-57. 83 Much research in organization and management has studied organizational outcomes (firm performance; growth and termination) in relation to changes in ownership and management in
34
vidual-oriented explanations is the entrepreneurial capacity phenomenon. Sometimes seen as a ‘black box’, or as a gift or a talent, this factor is thought of as determining the long run size of a firm. Factors such as time for moni-toring; the value of factors of production; the firm’s spatial dispersion,84 as well as the entrepreneur’s or manager’s knowledge (i.e. human capital) about the firms basic elements are here seen as determining entrepreneurial capacity. Such knowledge or skills can only be acquired at cost. Therefore, it is more expensive to run a larger business with many elements: this explains why firms cannot grow indefinitely, and it also explains why firms do not break up. Learning, knowledge, is here a key element, a non-tradable exter-nality.85 Thus individual-oriented variables have been identified as key determi-nants of failure or success of firms. This can be seen in markets where some business owners or entrepreneurs adopt more successful behaviors or strate-gies.86 These are considered to constitute predictors to venture perform-ance.87 Similar lines of thought, but for larger, established businesses, have been a central theme in business history research – managers and owners have traditionally been ascribed important roles in managing business ex-pansion and guiding them through times of prosperity as well as crises.88 Beyond question, competency, goals and strategies are some important factors to consider in researching the growth of firms. Such an approach can nonetheless become too reductionistic. The failure or poor performance of a specific business does not have to translate into entrepreneurial failure; a business owner can run a profitable business parallel with failing ones.89 Firm and individual-specific models that are short-term, or that assume that firms are in a stable environment (or ignore the environment) are considered to have predictability for business success when there is little change in the environment in question but not when it undergoes more significant changes,
small as well as in large businesses – see Grusky (1961a, 1961b); Beatty and Zajac (1987) and Boeker and Goodstein (1991) for overviews and discussions. Some have for instance main-tained that the continued success or growth of a business demands that the initial owner is replaced by a professional leader (Willard et al., 1992), while other have played down the role of boards of directors etc. (see for instance Bennet and Robson, 2004). 84 Norton (1988), pp. 105-106. 85 See Otani (1996). 86 See Reynolds et al. (1998); Davidsson (1989), especially pp. 51-65; 78-81; Delmar (1996); Wiklund (1998), as well as Dahlqvist et al. (2000); Wiklund et al. (2003); Landström (1987), Utterback and Reitberger (1982), and van Gelderen et al. (2000). 87 Cooper and Gimeno Gascón (1992), pp. 314-318; Cooper et al. (1994), and Delmar and Davidsson (1998). 88 This pertains to business monographs as well as to those on banks; see for instance Anell (1993) on the role of corporate managers in Sweden. See also Hassbring (1978), Gårdlund et al. (1973) and Lindgren (1988). 89 Gratzer (1996) re-created entrepreneurial careers and found such patterns. See also Rosa and Scott (1999), and Storey et al. (1987), p. 315f.
35
such as macroeconomic fluctuations.90 Furthermore, research designs in-tended for interview or for study of existing businesses and entrepreneurs, and that compare variances or occurrences in a population, have difficulties in applying the same design to those firms that were successful in achieving growth in an earlier phase but failed at a later stage. Thus, while this body of research asserts that variables that describe owner-managers’ or entrepre-neurs’ characteristics and behaviors as important, previous research results are also fragmented – for instance, survival bias can risk obstructing or dis-torting empirical results.91 Other, structure-related variables are nonetheless frequently identified – variables that by some are considered to be effective regardless of time or place.
Structural Factors: Age, Size, Industry-Specific Conditions While ‘structure’ as a concept or phenomenon is rather hard to define and comprehend with a single, trouble-free definition – it is used in a variety of ways in the social sciences – research nonetheless has identified key factors or structural attributes that are associated with the growth and death of firms.92 Studies that have not explicitly directed attention towards individual-related phenomena have often acknowledged that structural attributes that are both internal and external to the business are highly correlated to firm performance for as their growth and survival are concerned. Here I shall concentrate mainly on some key structural factors – firm age, firm size, and industry-specific conditions – that have been identified in previous research even if other phenomena related to business growth and survival also could be defined as structural.93 90 Jacobson and Lindé (2000), and Lindhe (2000). 91 For a discussion related to this problem, see Wiklund and Sheperd (2005). 92 ‘Structure’ may for instance from an economic-historical perspective be related to long-term structural cycles and change that run over several (in this respect) shorter business cy-cles; these cycles are not merely short-term economic fluctuations but rather contain signifi-cant change in business life, production and consumption (Schön, 2000a). But it may also naturally translate into social structures (class, ethnicity) or, as in demographic circumstances, into a population’s age structure and so on. According to Kimberly the structuralist perspec-tive in the study of organizations has had three separate but related questions: The relation-ships among the structural characteristics of organizations; the determinants of variability of those structural characteristics, and the consequences of structural variability for variability in organizational outcomes. Kimberly (1976), p. 571. 93 Access to external capital (bank loans etc.) is more difficult for small and new firms. Gen-der or ethnicity could constitute other barriers to growth and survival. Small firms are gener-ally believed to be treated with disbelief on capital markets in relation to larger or more well established businesses. This in turn affects firms’ possibilities for growth or survival and could just as well be defined as structural variables (or in some cases as structural discrimina-tion); Hall (1988), p. 39f, and Storey et al. (1987), p. 323f. The various factors that affect firm growth, firm performance or firm survival can probably be disaggregated further. However, the main factors influencing firm growth and survival are in previous research generally considered to be firm age, firm size, as well as industry-specific differences.
36
Even if results and focus vary to some extent, overall research results maintain that the age and size of firms in particular have explanatory power or, at least, are related to growth and survival. Age and size of firms could be thought of as structural factors in the meaning that several studies have iden-tified that the growth rates of businesses systematically vary with size and age. Additionally other structural-related phenomena, such as industry dif-ferences and/or innovation rates, have been identified in explaining (aggre-gate) differences in growth and survival rates of firms. Even if they are not entirely separable from individual-oriented factors, especially when it ap-plies to start-ups and new firms,94 these variables are thought of as having much explanatory power as well as having implications for economic pol-icy.95 Regarding firm growth is it acknowledged in a large body of research that low business age and/or small size have a negative relationship with firm survival while they have a positive relationship with firm growth. New ven-tures are in general small at start, irrespective of size-definition. Small and young businesses’ relative advantages and disadvantages as concerns both scale and scope are therefore generally recognized in many circumstances: they generally seem to grow more and faster than other firms (even if the societal effects regarding for instance their job-generation effect is debat-able), but they possess generally less economic and political power. Small, new ventures often display higher growth rates than older and larger firms. If they manage to survive their growth rates will consequently decline with age (and with increasing size).96 Others have viewed the problem as more com-plex since this commonly regards businesses in the smaller size classes but not large or very large corporations,97 and it has also been suggested that the patterns of expansion and contraction can be viewed as more unstable and fluctuating during a firm’s start-up phase or termination phase, but not when in a ‘normal’, operative stage.98 Nonetheless a general pattern of small and
94 Industry affiliation, for example, can be seen as a decision on the micro level (individual) for a new venture in a certain industry, or to develop and exploit a concept or a business idea. This suggests that the background, personality and competence of the owner-manager plays a certain role in explaining differences in growth rates and survival rates between industries. Firms in manufacturing or technological industries often display higher growth rates and usually perform better compared to firms in the retail or trade industries. In this case, the studies from Davidsson (1989) and Wiklund (1998) can also serve as examples of research identifying industry-specific differences. See also Birch (1979), p. 36. Several more studies could of course be included here as examples. 95 One view is that if small and young firms grow faster or more than other businesses, and if they generate more jobs, policy measures should be directed towards these firms. See for instance Almus and Nerlinger (1999). 96 See Evans (1987a). 97 Storey et al. (1987), p. 314. 98 See Carstedt and Isaksson Pèrez (1974), pp. 44-80.
37
young firms’ propensity to grow faster than others has generally been ac-knowledged in most research. Small and young firms do however tend to have a higher risk for termina-tion – or failure – than older and larger businesses.99 Few firms in a given population of new ventures survive for any longer period. The risk of termi-nation during the first, uncertain years appear in most empirical studies to be high. This risk tends to decrease significantly for firms that actually do sur-vive. Both the age and size variables as concerns terminations are commonly known as liability of newness, and liability of smallness, respectively.100 It is however hard to find studies that analyze survivors from a given popula-tion of firms for a longer period of time.101 On the whole, studies that take into consideration the impact of structural variables usually analyze a given population of firms for approximately three to five years (although there are exceptions). To my knowledge, fewer studies regarding long-term survival and growth have been carried out, using quantitative population data.102 Even if firms manage to survive in a somewhat longer run – more than two to five years – do they not by necessity have to grow; it is probably more accurate to maintain that a small share of surviving firms exhibit growth or high growth. Thus, growth – at least during the first couple of years – does not appear to be a general prerequisite for survival.103
99 Termination and failure are often used synonymously. The term failure (business failure, entrepreneurial failure etc.) may nonetheless indicate that something quite opposite to ‘suc-cess’ has occurred. But how should a surviving yet stagnating or shrinking business be evalu-ated in comparison to ‘real’ failures such as business bankruptcies? And if personal wealth or economic gains are generated through a business bankruptcy due to for instance institutional conditions, is it still a failure? See for example Gratzer (2001b). 100 For studies on firm survival as regards firm age and size, see for instance Audretsch and Mahmood (1994); Brüderl and Schüssler (1990); Carroll and Hannan (2000); Dunne et al. (1988; 1989), Storey (1990), and Wagner, J. (1994). For discussions concerning the age and size liabilities, see for instance Starbuck (1971). 101 For an exception, see Vesterlund et al. (1998). Here, a follow up study of Swedish me-dium-sized manufacturing firms 1988-1997 was performed. 102 As regards Sweden, results show that the ten to fifteen of the largest (and to that the oldest) companies are those who have exhibited better or higher growth rates relative younger and smaller businesses. The largest companies have survived and been active for a long time – in many cases during the entire 20th century – and one major reason for this is, put simply, be-cause they have been large. This is because research and development (R&D) is considered to have a significant role in many studies when it comes to growth and survival. R&D has gen-erally taken place within the large companies, partly since the large companies almost from the very beginning have had a favorable market position. Finally, large companies also pos-sess financial economies of scale, which smaller and medium-sized firms do not. It has been easier for large businesses to obtain (own) capital or funding for growth and survival. Jagrén (1988), pp. 242-247, 258-261, and 267-273. See also Glete (1995), and Davidsson and Del-mar (2001). 103 That only a small number of firms exhibit strong growth in a given population is well supported; see for example Davidsson and Delmar (1997). See also Du Rietz (1975), and Jagrén (1988).
38
Industry differences have furthermore often been identified. Firms in inno-vative industries or environments, for example, show higher average growth rates than other industries such as retail or trade. At the same time innovative businesses are exposed to a higher termination risk. Even if this risk tends to decrease as for businesses in general as they age – with diminishing liability of newness – it appears that innovative and dynamic industries also consti-tute a factor that reinforces the termination hazard.104 In sum, there seems to be common agreement on the systematically higher growth rates of young and small businesses, as well as the higher risk for termination for those firms. Low age and insignificant size are thereby struc-tural factors that influence firms’ growth and survival probabilities. In spite of this, survival is not conditional upon growth; many surviving firms do not seem to grow even if other structural conditions such as industry differences affect the rate of growth and termination in firm populations. There is little, or rather, less, knowledge as regards firms’ development and survival ability in the longer run or over longer periods of time; most studies have been rather short. Mostly, our knowledge on long-standing businesses has come from business histories or casual observation.
The Environment: Economic Change and Fluctuations, Institutions and Business Climate While there is a large body of research that has a focus on either the traits, expectations and behavior of the individual business owner-manager, or in the age-size (and other structural) relationships, a smaller body has ad-dressed the issue of (real) economic external or exogenous factors and how they affect the growth and termination behavior of business firms. A reason-able explanation to this could partly be the entrepreneurial paradigm or focus as such in much research in which the individual is thought of as having a central role, partly due to research designs and the nature of available or employed data.105 Judging from the literature, environmental factors range from overall, national ‘business climates’ and institutional settings, to eco-nomic aggregate fluctuations and cycles. Here, two approaches stand out in empirical research: one that addresses the overall climate for entrepreneur-ship and small business activity; another that investigates the impact and relationship with economic change over time. Even if it seems reasonable to assume that business behavior is related both to aggregate or macroeconomic fluctuations, as well to the institutional setting in an economy such a one-sided approach can become reductionistic in the sense that it assumes a common or general behavior of business organizations that degrades the 104 See Audretsch (1995), and Agarwal and Audretsch (1999). 105 It is not unusual that ‘secondary’ databases are employed, which have short time-spans and are cross-sectional rather than longitudinal.
39
actions and decisions of individual human beings. Yet, an overall impression is that this is a more under-researched area than are other fields, and micro-to-macro (or to-aggregate) approaches have been called for.106 Research that focuses on the last-mentioned factors has frequently dis-cussed the institutional setting’s impact on firm growth and survival, as well as entrepreneurial activity, often measured as the rate of start-ups in an economy. One part of research has frequently employed managers’ or entre-preneurs’ attitudes or perceptions as indictors of the overall business cli-mate.107 Comparative studies, focusing on e.g. the tax system and legislation and regulations of markets have furthermore investigated how such institu-tions affect business behavior, often with the character of aggregate (macro) research. Organizational ecologists have as an example maintained that new businesses and their development over time are imprinted with institutional and macro conditions at founding – most new businesses do not succeed in gaining legitimacy on their markets and are terminated (which of course also relates to the influence of structural variables).108 Furthermore, particularly empirically oriented economists have acknowledged institutions as key de-terminants for firm growth and survival – this ascribes particularly to the tax system and regulation of markets. In Sweden, there has been debate on the development of the size and employment distribution of firms over time.109 It is here therefore assumed that individuals’ – or rather business owners’ and
106 Aldrich and Martinez (2001). 107 See Wikström (1993), or Hult et al. (2000) on how small firm owner-managers experience as societal attitudes or ‘the climate’ for entrepreneurship and business activity. Such meas-urements also seem to have an important role in the shaping of economic policy and are con-cerned to be significant indicators on the effectiveness of government policy; see Vikström (2005). Others (see for example Shane and Kolvereid, 1995), have suggested a rather opposite pattern – less benign environments select the most efficient firms, thus firm performance (growth) can be higher for firms in economies with more unfavorable national environments. 108 There is in fact more to say about the theoretical and empirical framework in Organiza-tional Ecology. For an overview of the general theoretical framework, see Hannan and Free-man (1989), pp. 23-28 and 115-120 as well as the various contributions in Carroll and Hannan (1995). 109 Here it is stated that the self-employment rate has decreased since the late 1960’s and furthermore that the number of small firms has increased significantly. This has been put in connection to deteriorated incentives for small businesses to grow since legislation and taxes have favored larger plants in Sweden. See for instance Henrekson (1996), especially pp. 35-62 and 76-85; Johansson (1997), Henrekson and Johansson (1998), and Davis and Henrekson (1999). See in addition the Global Entrepreneurship Monitor, GEM, for an overview covering different countries. It is here stated that constraints such as negative attitudes towards entre-preneurship and high corporate and personal tax rates, among other things, are significant for the Swedish economy; Reynolds et al. (2000), p. 43. In an economic-historical study by Jan-Erik Pettersson on the development of Swedish industrial firms during World War II it was demonstrated that the heavily regulated economy did increase the firms’ chances of survival and did in fact cause expansion in some industries. This indicates that the institutional envi-ronment – even if this particular period is extraordinary in many respects – is important for the growth and survival of firms; Pettersson (1980), pp. 174-175.
40
entrepreneurs’ – macro-institutional arrangements and environments deter-mine incentives and behaviors.110 Even though the relationship between firm growth and survival and real economic conditions have been disputed – some claim that it translates into a rather weak correlation – nonetheless factors such as economic cycles and change and financial conditions have been considered to some extent. Such research demands, just as in the case of institutional conditions on business activity, a longer time perspective than only a few years – for instance in order to cover a full business cycle. To my knowledge such factors have played a less important role in empirical research. Concerning the specific topic of economic fluctuations and business growth and survival, two different streams of research can be identified. One regards general measures or universal patterns of correlations between busi-ness growth and termination and economic change – measured as for in-stance macroeconomic growth, aggregate employment rates, interest rate fluctuations, etc. – which has been a common way to address the issue of exogenous factors in entrepreneurship and small business research and in-dustrial organization. Another has a more real-historical approach, such as in business history in which specific (or unique) crises and events over the course of time are thought of as affecting the development of the individual business organization. Business monographs often have had a real-historical approach as con-cerns the interplay between the environment, economic change and the firm. Economic fluctuations and crises over time and institutions have tradition-ally been viewed as providing both opportunities as well as barriers to growth and expansion.111 As for the first-mentioned research body it is ac-knowledged by some that there is a discernable relationship between firm growth as well as business termination rates in population data and changes
110 It is reasonable to assume that institutional setting – taxation, economic policy, labor mar-ket legislation, etc. – de facto is shaping the overall conditions for businesses or for firm growth or survival. A heavy increase in corporate taxation and other related taxes, for exam-ple, could lead to growth problems or failure for many small or medium-sized firms. How-ever, not only entrepreneurs or small firm owner/managers in the society desire more freedom of action or increased resources. Various interest groups – e.g. employers’ organizations, labor unions, or authorities such as the police force – could also serve as examples. Further-more: Does, for instance, a relaxation in certain tax rates automatically lead to increased total firm growth or more positive rules of the game (i.e. institutions)? This line of reasoning has a risk of more or less being based on a priori assumptions: lower taxes will give us growing firms, since the taxes at present are too high. And even in economies with lower taxes or ‘better’ rules of the game than in Sweden – I here willingly refrain from an attempt to define these ‘better’ institutions – a greater share of newly founded or small firms fail or stagnate, when at the same time a lesser proportion is surviving and growing. Thus, the structural fac-tors discussed above are probably quite influential. I here refer to the section covering the importance of structural factors. Many studies, e.g. Evans (1987a) or Audretsch (1995), are using (actually the same) data on American firms. 111 See for example Gårdlund et al. (1973).
41
and fluctuations in economic aggregates, even if individual studies place different importance to different variables. In general, a body of literature with focus on economic change, or changing environmental conditions, has come to the conclusion that termination rates in firm populations decrease when the macro economy is improving and that the conditions for firm growth also improve under such circumstances.112
Concluding Remarks What I have suggested here is that the growth and survival of business or-ganizations is a frequently studied research field in the economic sciences but that different fields are emphasizing different factors, phenomena or variables in the study of under what conditions firms emerge, grow, contract or terminate. Operationalizations and measurements – or for that sake defini-tions – vary to a great extent. As regards business growth and death, the last two to three decades have mostly been in focus in empirical research – i.e. from the 1970’s and on-wards – often with a short time-period studied (two to maybe five years al-though there are exceptions). There is little knowledge about small firm growth and survival historically, and there has also been a shift in the re-search ‘paradigm’, i.e. from viewing the development of firms as a more or less random process or from aggregate perspectives in testing different theo-ries and statistical connections on aggregate levels, towards a more explicit
112 A long-term structural-economic perspective as regards firm growth and termination is found in Dahmén (1950): Older businesses – founded before the first World War – displayed more growth than businesses founded in the inter-war period, during which a larger number of firms became stationary/non-growing. See Dahmén (1950), p. 192; 382f. Lennart Jörberg identified related tendencies in which economic fluctuations affected the size distribution of firms 1872-1912. During periods of economic expansion larger firms could grow more than smaller ones; Jörberg (1961), p. 151f. Similar lines of thought are found in Wedervang’s (1964) study, in which changes in the size distribution of firms over time and firm growth and survival over a period of nearly 20 years (1930-1948) were investigated. Here, the business cycle exhibited influence on growth rates in firms positively: a recession led to low average growth rates while expanding markets facilitated firm growth. The survival of firms also depended on the business cycle and crises – terminations of firms increased during recession years; Wedervang (1964), p. 157f, and p. 203f. In David Birch’s often-cited study (1979), we find similar albeit unclear patterns when it comes to the importance of the business cycle. It is here stated that the rates of loss and replacement of jobs “are somewhat sensitive to the business cycle”, but there is however no discernible pattern (p. 24). For research that has tested the relationships between economic fluctuations and business terminations as regards small firms, see Audretsch and Mahmood (1995); Everett and Wat-son (1998), and Ilmakunnas and Topi (2000). For studies that have investigated larger firms’ survival rates and fluctuations in aggregates, see Goudie and Meeks (1991) and Bhattacharjee et al. (2002). As concerns studies that have tested the relationship between firm growth and economic fluctuations, see Davidsson and Delmar (2001), Kangasharju (2001); Boeri and Bellmann (1995); Gratzer and Box (2002), and Wagner (1995).
42
focus on the micro units and the social and psychological factors of the owner-manager/entrepreneur. Furthermore, the institutional setting and pol-icy measures have become a growing research interest. The upswing of en-trepreneurship and small business research from the 1980’s and onwards, with focus on the individual, is quite obvious. Different fields have, as mentioned, different perspectives. Business ad-ministration – or business studies – differs in some respects from economics, especially concerning the unit of investigation. In the first case the individ-ual, in the latter the business or businesses on a more aggregate level. Meas-urements and other definitions of growth and growth processes have on the other hand been frequent in these disciplines while economic history and business history has put less focus on such issues. Here, the growth and ex-pansion of individual corporations (or banks) is a central theme. Yet, as in much entrepreneurship and small business research, business historians at-tach great importance to managers’ and owners’ behaviors and decisions. There also seems to be in most fields of economic research a tendency to research the performance of growing and surviving businesses, rather than failing or contracting ones. It must be acknowledged that empirical material and data – or for that sake research designs – often do not allow for research-ing failed businesses, failed owners and so on. A problem thus arises that the exclusion of failed firms, or those that may have grown before a sample is drawn, most likely biases the research results. Thus, a study of the dynamics and development of business life in a market economy is in many cases compromised if only surviving (or successful) firms are studied. The long-run perspective is also absent in much research. Measured in time, most studies are short. In particular, micro-oriented studies of the characteristics of entrepreneurs as well as of firms have often been short-term. Naturally, there are also exceptions here, but in most cases the longer time perspective is applied by business historians. Nonetheless, if general conclusions are to be drawn from the development of rather atypical organizations – large and old ones – then results and knowledge as regards smaller businesses may become distorted. The multitude of explanations to the growth and survival of firms that were discussed in this chapter came perhaps as no surprise; to some extent we can explain this particular situation with different traditions and approaches in different disciplines. Some research has recognized a strong relationship between external/institutional factors and firm growth and survival, while other studies focus on structural variables such as firm age or size, alterna-tively structural variables such as industry or innovations. Many other stud-ies have put the spotlight on the characteristics of the owner-manager/entrepreneur, and differences between education, background, mo-tivation etc. Of course, this description is more or less a simplification, since several studies address many of these questions simultaneously. As shown here, factors such as managerial competence and motivation, structural vari-

43
ables and external variables, for instance institutions and – presumably, but to my knowledge not empirically tested on larger populations of firms to a greater extent – crises, shocks or business cycles are most likely to affect growth and survival opportunities. The question is, however, to what extent all of these factors here discussed are influencing firm growth and survival, and – of course – what factor is the most influential of them all. Depending on the level of analysis that is chosen – macro, meso, micro – and depending on what type(s) of data or sources that are employed, the answer to these questions can – as we have seen – be quite different.

44
45
4. Development of the Size Distribution of Firms in Sweden: A Centennial Perspective
Introduction The size distribution of firms has frequently been analyzed in economic re-search. Even if there are differences, most economies and nearly all indus-tries are characterized by a skewed size distribution, meaning that small firms dominate relative to larger units.113 Explanations of this asymmetric distribution have ranged from random processes to institutional determi-nants.114 In this chapter, the development of the Swedish size distribution of firms over a long perspective of time will be studied. A central research question is here connected to previous research results that have discussed changes in the size structure of businesses related to general conditions for firm growth. When addressing the question of the size distribution of firms, a general problem that arises relates to the definition of firm size and classifications of size. What we commonly regard as ‘small’, ‘medium’ and ‘large’ firms can vary substantially given time, place, perspective and source. For instance, according to present-day definitions, intermediate-sized firms are considered to have 10-199 employees115 while small and medium enterprises (SMEs) have less than 250 employees. Broad class-intervals may therefore mix a small business with a quite large one.116 Older classifications and the diffi- 113 European Commission (2003). 114 See Chapter 3; see also for example Simon and Bonini (1958), Hart (1962), Wedervang (1965), Engwall (1970), Carstedt and Isaksson-Pérez (1974), Lucas (1978), and Storey (1994). For more recent (Swedish) research, see below. 115 See for instance Henrekson and Johansson (1997). 116 For discussions regarding measures of firm size and related problems see Andersson (1978), and Gratzer (1988) and (1996). Size of firms can also be measured by other criteria than the number of employees. In the European Union, the definition of a micro firm is 0-9 employees, and a small firm has 10-49 employees. Medium-sized firms employ 50-249 per-sons, while large firms have 250 or more employees. In Sweden, a small firm has traditionally been defined as having zero to 200 employees, and a large business as 500 or more; Lund-ström, A. et al. (1998), pp. 25-27. However, as an example, the label ‘solo entrepreneur’ (zero employees) has also been introduced (although not as an official classification), stating that there in fact is a difference even amongst small firms (see Hult et al., 1998). Consequently,
46
culty in combining different statistical materials additionally magnify prob-lems in studies that want to make comparisons over longer periods of time. Therefore, the study of the development of the size distribution can be fur-ther aggravated by the aggregate nature of available data. On the other hand it would probably demand much effort to produce entirely new material. Yet another problem in analyses of size distributions regards cause and effect. Since the empirical material used in the present study is cross section data, it may become problematical to speak in terms of firm growth as well as causes for growth. Rather, changes in the size composition of businesses can only partly be related to the question of firm growth. Methodological issues are further discussed below, but it must be kept in mind that comparisons over even shorter periods of time can become complicated. Concerning Sweden, shifts in the Swedish size distribution of firms have been identified by empirically oriented economists for the latter half of the 20th century. Here, it is claimed, firms of medium or intermediate size have diminished in numbers while especially small firms have increased signifi-cantly. This shift is explained by institutional change in the macro economy from the 1960’s and onwards. The conclusions drawn from this observed structural shift is that (new) small firms cannot grow to at least medium or intermediate size. Thus, firms in the ‘middle class’ have stagnated in num-bers since the number of growing (small and new) firms has decreased. Shifts in the size distribution of firms were however recognized earlier, for previous periods. Earlier observers saw for instance a tendency of small firms to increase during the interwar period. Furthermore, explanations other than institutional determinants have been proposed as regards why there are movements in the aggregate size relationship between firms. Therefore, by addressing the question of the development of the size distribution of firms over a long period of time, new and complementary research results can hopefully be generated.
Explanations to the Changing Size Distribution of Firms Earlier research has often recognized that the Swedish economy is domi-nated by large corporations, since long rooted in the old industrial society. The domination of large firms has here been viewed as quite outstanding in
the very size classes of firms in official statistics have, as can be observed, a different span. Statistics Sweden nowadays utilizes the size classes of 0, 1-4, 5-9, 10-19, 20-49, 50-99, 100-199, 200-499 and 500 or more employees (SCB: CFAR/Företagsdatabasen). It is obvious that a firm with twice as many (or more) employees than another firm might be included in one and the same size class. Consequently, this reveals that comparisons over time and across economies can become challenging.
47
international comparisons. Few businesses established during the post-war period have, according to this view, reached a position similar to the old industrial companies. In that respect, this research has recognized that the inflow of new, growing firms has been less significant during the second half of the last century. Thus, smaller (and possibly more stagnating) firms have come to dominate the economy.117 Three main tendencies, related to each other, have been recognized by the body of research that has studied recent developments in Sweden (e.g. Hen-rekson, 1996; Henrekson and Johansson, 1999a-c). One concerns self-employment. Here it is stated that Sweden has a comparably low share of self-employed persons relative other economies. The problem of self-employment is not the subject of investigation in the present study, even if there are reasons to believe that this rate has decreased over time.118 A sec-ond tendency, closely related to the first, has also been identified. It is here acknowledged that the employment distribution resembles a snapps-glass. Whether this is significant for Sweden only has on the other hand been de-bated; it has been proposed that also other countries exhibit a similar em-ployment distribution.119 Finally, the size distribution of firms as such has been under scrutiny. The hypothesis here is that medium firms – or, rather, intermediate-sized firms – have decreased in numbers from the latter part of the 1960’s to the early 1990’s when at the same time the number of small firms (measured in both absolute and in relative figures) has risen significantly.120 The primary expla-nation for this aggregate change is interpreted as policy-determined. Such institutional change has been increasing taxation of households and busi-nesses (especially small and/or family-owned ones), wage policies, labor and credit market regulations, and the size of public sector employment. During these years, and especially during the 1980’s, the conditions for small and family businesses were poor. It was not until after the tax reform in the early
117 Glete (1994), p. 16 ff. See also Jagrén (1988) and (1992). 118 See for instance Henrekson (1996) and GEM – Reynolds et al. (2001) – concerning the low level of self-employment. See also Lindh and Olsson (1997) and (1998) concerning the falling rate of self-employment over the last century. Small business research has further proposed that small firms gradually have acquired a more important position, and that the era of big business has passed. See for instance Carlsson (1992) and Pettersson (2004). 119 Jagrén (1992), p. 17, or Lodin (1999), p. 355. The shape of the employment distribution here means that large shares of the work force are employed in either small or large firms, while a smaller part is employed in firms of intermediate size (10-199 employees). See Hen-rekson and Johansson (1999a and b). 120 For an overview and research results on the size and employment distribution of firms in Sweden during the latter part of the 1900’s, see Henrekson and Johansson (1997; 1999a; 1999b), Lodin (1999), and Davidsson och Delmar (2001). For a further discussion see also Johansson (2002).
48
1990’s that the rules of the game for especially small business activity im-proved.121 Tendencies similar to the transformation above, but for earlier periods, were discovered by Erik Dahmén (1950) in his study of Swedish entrepre-neurial activity during the interwar period, 1919-1939. In comparison to businesses founded prior to World War I, new firms in the interwar era were to a greater extent smaller as well as more stationary (non-growing).122 Therefore, today’s observations of a trend for a smaller number of medium firms over the last decades of the 1900’s – and consequently more small businesses – could be a part of a more long-term tendency or movement in the economy. For instance the Federation of Swedish industries, Sveriges industriförbund, noted in the early 1960’s that the shift in the size distribu-tion had been noteworthy over the past decades. Medium-sized firms had declined in numbers. Small firms, meaning businesses with 11-50 workers, had increased their share of the total number of firms in the economy while the largest ones – those firms with over 1,000 workers – also had increased. Medium firms, consequently those with 51-1,000 workers, had thus dimin-ished. Accordingly, on the whole it was recognized that there had been a general increase of smaller businesses, mostly due to technological advances that improved the conditions for small-scale production.123 Other contemporary observers saw here tendencies of concentration. C.H. Hermansson (1959) was of the opinion that concentration towards larger production units within all industries of the economy at least partially had intensified during the first half of the century. Within most industries firms
121 This is discussed in Henrekson (2001) and in Davidsson and Henrekson (2002), p. 82 ff. See also Lundström, R. (2001) for a discussion regarding taxes and corporate structure in Sweden and the effects thereof. Based on figures emanating from this body of research it can be observed that firms with 0-9 employees constituted some 89 percent of the entire popula-tion of Swedish businesses in 1968 – this regards firms of all legal forms in all industries – while the corresponding figure in 1993 was a little more than 94 percent. For manufacturing industries specifically the numbers were nearly 70 percent in 1968 and close to 85 percent in 1993. At the same time firms with 10-199 employees had diminished extensively. This size-group added up to some ten percent of all firms in the economy in 1968 while in 1993 the figure was around five percent (for manufacturing industries 28 and 14 percent, respectively). Firms with 200 employees or more had also experienced decreasing shares: for the entire population of firms around 0.5 percent had 200 employees or more, and a full 0.3 percent in 1993; manufacturing industries at the same time had decreased from 2.2 to 1.3 percent. My own calculations based on Johansson (1997), p. 14. This particular data is calculated on the number/share of firms in different size-groups per 1,000,000 inhabitants. 122 See also Dahmén (1953). 123 The very wide definition of medium firms could naturally be questioned, at least from today’s measures. Furthermore, it was also recognized here that the share of the smallest industrial firms of 0-10 workers had steadily diminished from 1940’s and onward. As can be seen, this observation opposes to some extent the notion that small firms had increased; Sveriges industriförbund (1961), pp. 117-119. Politically small firms – particularly in handi-crafts and small-scale industries – were viewed as important. They were also ascribed impor-tant roles also in the future; see e.g. SOU 1959:7, p. 35 ff.
49
in the ‘middle-class’ had diminished relative to small and large ones. Her-mansson meant, differently from others who suggested an increasing impor-tance of small firms, that concentration in ownership had increased over time. Therefore, the role of smaller firms had weakened,124 and economists during this period of time had a keen interest in issues related to concentra-tion.125 There were therefore here two different standpoints during the 1950’s and –60’s: one that identified tendencies of concentration and increased domination of large corporations and owners. This in turn increased the number of small firms and large.126 Another standpoint held that technologi-cal progress had improved conditions for small firms, which thereby could increase in both numbers and in importance (consequently countering the movement towards concentration in some respects). A closely-related interpretation of the standpoint that saw technological change as a determinant has also been proposed in research on firms’ size: technological specialization and progress has brought about a larger number of small firms in modern economies since large size per se has become less significant. International comparisons have acknowledged that average firm size generally has decreased and that small businesses in a relative sense have increased in numbers from the 1970’s and onwards in different econo-mies – including Sweden.127 For instance Traù (2003) has proposed that a similar pattern of diminishing average firm size can be identified for several major industrial economies from the 1960’s and onwards. Traù’s conclusion is that the ‘Golden Age’ of industrial economies in the postwar period fa-vored large plants. Exceptional macroeconomic conditions made large firms increasingly larger through horizontal and vertical concentration of produc-tion. Exogenous shocks, such as the breakdown of the Bretton Woods sys-tem and greater uncertainty in markets around the end of the 1960’s, how- 124 Hermansson (1959), esp. pp. 13-15. Hermansson here opposed Eli F. Heckscher’s view that small businesses had become more important. Axel Iveroth observed the same tendency during the 1940’s: the ability of small firms to generate job opportunities had diminished considerably since the 1930’s. Nonetheless, they had according to Iveroth still an important role due to the increased standard of living in Sweden as suppliers of goods and services. Iveroth (1943), pp. 162-165. 125 Maurice Dobb for instance claimed that it was important to take into consideration the increasing concentration of capital and production in modern capitalist economies. Suppos-edly small business groups can still dominate an entire industry, thus giving small firms the role of subcontractors or more or less subjects to large business groups. In that respect, small firms continue to exist but their role as such were diminished. See Dobb (1963/1973), pp. 280-285. 126 Also in Glete’s (1994) investigation it is claimed that the influence from the largest groups of owners have increased during the 1900’s. 127 Carlsson (1992), pp. 6ff. See also Schwalbach (1994). Audretsch has classified the post-war era in western economies as a period in which ”small firms and entrepreneurship were viewed as a luxury, perhaps needed by the west to ensure a decentralization of decision mak-ing; but obtained only at a cost to efficiency […] Systematic empirical evidence, gathered from both Europe and North America documented a sharp trend towards a decreased role of small firms during the post-war period”; Audretsch (2005), p. 6.
50
ever, have had significant effects on the size structure of firms over the re-maining century – here, there has been less division of labor within firms, and an increasing division between them. Consequently, the number small firms increased and the relative relationship between firms of different sizes changed during the century’s last quarter.128 Vianen (1993) has proposed similar tendencies of the shifting size distribution of Dutch firms, and more-over that the presence or ‘domination’ of small firms during distinct periods were fluctuating – in a counter-cyclical way – with the business cycle: they played a greater role in the economy during recessions and a lesser one in upturns.129 In that respect, Traù and others address the issue to some extent from something that could be labeled as a ‘real-historical’ or period-specific per-spective. Particular conditions and events have determined or shaped the evolution of the size distribution of firms over time in advanced economies. Additionally, Sweden’s transformed size distribution under the last quarter of the century seems to have coincided with other economies. The last dec-ades of the 20th century have, it seems, witnessed an increase of small firms. In that case an explanation to the relationship(s) between firms of various sizes or size-groups could lie in different periods or phases in the economy. Economic historians have also observed such developments for earlier periods. For instance Lennart Jörberg (1961), in his study of Swedish indus-trial growth 1872-1912, came to the conclusion that small firms in the pe-riod’s early stage had a reduced importance while the somewhat larger ones increased. Here, there were different phases in the industrialization in which successively new small firms were founded. Aggregate industrial production was dispersed over a steadily increasing number of new (small) businesses. Relatively larger businesses stagnated but started to regain their positions during the 1880’s. Gradually, the (absolute) number of new firms increased – and these were commonly smaller – which diminished the relative impor-tance of larger businesses. Jörberg claimed that small firms with limited economic and technical resources could expand or compete with larger ones (thus survive) during periods of economic expansion and high demand. However, when economic conditions worsened – such as during the 1880’s – firms of (somewhat) larger size became more important than small ones.130 128 Traù (2003), see esp. p. 119ff. See also Traù (2000). 129 Vianen (1993), pp. 18-37. 130 Jörberg (1961), pp. 118-120; 151-152; 157. Jörberg’s data differs in some parts from pub-lic statistical material from Statistics Sweden (SCB) and the National board of trade (Kom-merskollegium). This has some consequences when different sources are compared. Jörberg deliberately excluded businesses that were in handicrafts, which had the result that many small firms were not reported. Additionally, the very principles for statistical reporting changed; particularly there was a vast shift between 1889 and 1897 that should be read with care. According to Jörberg, the deflation period in the 1880’s often made it impossible for small firms with less than five workers to reach an output value of 10,000 and they were excluded from the public statistical reporting since this was a minimum limit. In 1872, the
51
Organizational ecologists hold a similar dynamic view. Here it is assumed that small and large firms can outcompete medium-sized organizations: large firms pose a competitive threat to medium firms but hardly any threat to small ones. An increasing number of large firms might even increase the survival chances of small ones. Thus, medium-sized firms are trapped in competition with both small and large businesses.131 For Jörberg was therefore the overall economic development and condi-tions, or specific periods, influential when it came to the observed changes in the size distribution of firms. For later years (1919 and 1939), further data from Dahmén’s investigation can support this notion.132 Nonetheless, even if period-specific conditions have explanatory power, a steadily increasing business activity in the economy over a long period of time as a whole can therefore have brought about an inflow of small firms. This has in turn changed the size structure of firms, even if comparisons over time are aggra-vated by re-classifications and reforms in statistical reporting.133 Addition-ally, concerning the industrial (manufacturing) sector as such earlier studies have claimed that the inflow of new firms measured as the share of new businesses in relation to the total number of firms have decreased rather steadily over the 20th century. The rate of new-firm formation was rather high from the interwar period up until the postwar period, and diminished
price level was high, which made it easy for small firms to reach a high output value. There-fore it is very likely that this (statistical) limitation overestimates the shift between size groups 1872-1889. Jörberg (1961), pp. 119-120. 131 Therefore, the assumption is that the two ends of a size distribution – that is, small and large firms – can outcompete the middle ones; Carroll and Hannan (2000), p. 275ff. 132 Manufacturing firms with less than 20 workers had increased from around 60 percent in 1919 to 66 percent in 1939. Firms that had 20-99 and 100-499 workers had correspondingly diminished while the largest group (500 workers or more) had increased slightly. Dahmén’s thesis was that the interwar period was signified by a major change in business life. More stationary firms were founded. This altered the size structure of business in which small firms became more dominant. Even if Jörberg’s and Dahmén’s data are not fully comparable, we can nonetheless conclude that the Swedish economy from the turn of the century (1897/1903) up until the outbreak of World War II (1939) might have been signified by a general increase of smaller firms. In that case, there were even from this point in time increasing numbers of small businesses in the economy. Dahmén (1950), Appendix (volume II), own calculations. 133 In 1968 there were 27,120 firms per one million inhabitants in Sweden, and in 1993 the corresponding number was 53,806. This concerns all types of firms in all industries etc. The figures should, however, be read with care since changes in statistical reporting have been carried out. See Johansson (1997), p. 8. Later figures show furthermore that this figure had increased to 94,125 firms in 2002. Reforms and re-classifications of (public) statistical data however make such facts rather uncertain. Firms have ‘entered’ the economy due to new criterions and limitations in reporting (i.e. rather than a real increase of firms) both histori-cally and during our times. See SCB, Företagsdatabasen. For a discussion regarding defini-tions of industries etc. as well as how public reporting has changed due to real structural change in manufacturing and service industries over time, see for instance Braunerhjelm (1992). Various reforms and changes in statistical reportings are further discussed below.
52
from the 50’s and onwards, although there were fluctuations over individual years.134 Thus, while it has been claimed that institutional determinants – as regards Sweden – have had substantial effects on firms’ growth possibilities and the evolution of the size distribution as such during the last quarter of the last century, other explanations have also been proposed. Others, including ear-lier observers, recognized the same tendency towards a growing importance – or rather domination – of small businesses, but had other explanations to this shift (technological change, concentration of ownership). Another body of researchers has, as we have seen, identified a common tendency also in other economies from the late 1960’s and onwards that, on the whole, seem to resemble the Swedish development pattern: a growing number of small businesses. Furthermore another trend has been identified, in close relation to the one above, namely that distinct phases or periods have affected the shaping of the distribution of businesses.
Objectives and Methodological Considerations Complementary data and a longer perspective of time can provide new re-search results. On the whole is it however rather complicated to receive a complete picture of the inflows and outflows in the entire population of businesses and in different industries. Structural societal and economic change as well as adjustments in statistical reporting have affected available (public) size distribution data – particularly over long periods of time. There are therefore several reservations that must be made in such a study. A main proposition in this particular study is that the empirical material suggests that especially the relative relationship between firms of various 134 Braunerhjelm and Carlsson (1993), esp. p. 323ff. In Gunnar Du Rietz’ study (1980) of some manufacturing industries between 1954 and 1970, it was established that the rate was positive up until the middle of the 1960’s but fell thereafter; see esp. pp. 22; 83ff. To this it should be added that the Swedish self-employment rate seems to have diminished rather steadily since around 1910. There have been periods of exception; periods characterized by economic crisis such as the interwar period and the early 1990’s in which the rate of self-employment has increased (calculated as the number of self-employed persons relative to the total work force. See Lindh and Ohlsson (1998), p. 32). Yet, this generally weakening trend nonetheless speaks partially against the notion of increasing business activity, at least con-cerning self-employment and/or the manufacturing industry specifically. Economic structural change over long periods of time and the rise of new industries might have some value of explanation here. It is however not unlikely that firm formation and new enterprising also can be regarded as period-specific or cyclical phenomena; phenomena that in turn might have effects on the distribution and structure of businesses. Data regarding new firms in manufac-turing during earlier periods – roughly from 1850 until the early 1900’s – show for instance an increasing trend of new firm formation that is undisputable yet fluctuating around periods of economic upswings and downswings; see Dahmén (1950), pp. 77-84. As Dahmén points out, his data is somewhat biased and does not include the entire rate of new firm formation in the Swedish economy 1850-1909.
53
size classes over time can have an explanation in period-specific conditions. During periods or phases of economic prosperity and growth, small firms (or firms of smaller size) have decreased in importance during which larger units have increased. The position between firms of different sizes has there-fore shifted. In times of economic upswings there have been better opportu-nities for existing (and new) firms to grow. There are as mentioned above complementary (or excluding) explanations to such a hypothesis; among other things it would be likely that self-employment increases during down-swings or depressions. In that case, even if institutional explanations for this structural change under recent decades might be reasonable, the study sug-gests that similar movements have been at hand earlier, meaning that earlier periods have shown similar tendencies (or fluctuations) of increasing num-bers of small businesses and decreasing numbers of medium or intermediate-sized ones. Therefore, distinct macroeconomic conditions under certain peri-ods may affect the growth possibilities for firms. This does not exclude that the total (absolute) number of firms in the econ-omy successively has increased in the long run. The study also proposes that the Swedish case – transforming to fewer medium-sized firms and larger numbers of small, stagnating businesses during the last three to four decades of the past century – might have to be viewed form another perspective, namely that the observed increase of smaller units can be a part of a process that has characterized also other economies during the same period of time, and vice versa. Yet, to speak of or to measure growth of firms with cross section data may be hazardous. Data on firms’ size distribution(s) are by its very nature cross-sectional. This means that a cross section typically includes firms of all ages, i.e. firms that doubtless are in different stages of their life cycle. Old firms are mixed with young or new ventures. Therefore, between two (or more) cross sections – particularly if a longer period has elapsed – there is no in-formation on firms that possibly are included in the first but not in the sec-ond observation. Hence, firms that have failed in the time between are ex-cluded in the second one. Firms founded as well as terminated between ob-servation years are not included at all. Thus, using cross sectional data may involve some serious interpretation problems, particularly regarding cause and effect. Consequently, does an increase or decrease in a particular size group indicate that firms are growing/shrinking (migration of existing firms from one size group to another in the statistics), or does this imply that there are generally more (or fewer) firms in that particular group due to increased new-firm activity (or more failures) in that size group as well as/or in other size groups? Or is it a combination of the two?135 Furthermore, all firms may not grow in the same way. Large businesses are for instance assumed to grow externally to a greater extent than small firms. 135 See discussion in Chapter 2.
54
A decrease of small firms may indicate that larger units are acquiring smaller ones, thus possibly increasing the number of firms in larger size groups (or it could also indicate that small firms are growing organically). A large firm can also, if necessary, at first try to downsize (to a certain limit) while a smaller unit might have to exit the market: one firm exits, and an already existing larger firm migrates to the size group of the former.136 Therefore our conclusions regarding the growth and expansion of both older and newer firms, as well as concerning changes of the number of firms in various size groups (more of fewer) over time, may run into problems of interpretation when using cross section data. Nonetheless, such data can give information over patterns of change over time, or trends – especially if there are several repeated cross sections available.
Sources and Data in the Study Even though different studies have investigated the size distribution for dif-ferent periods, and in spite of generally available historical data on Swedish economy and business life,137 there are nevertheless extensive gaps concern-ing data availability. Industrial statistics (manufacturing) is covered in a greater depth than other industries such as services or trade – particularly from a historical perspective. The National board of trade (Kommerskol-legium) and Statistics Sweden (SCB) were from 1913 and onwards publish-ing information about the number of establishments in mainly the manufac-turing industries. Data on earlier years (from 1896) is however available.138 From this, and with some exceptions, more or less ‘coherent’ series over Swedish manufacturing can be obtained. Principles for reporting and inclu-sion of businesses were however significantly changed over time, and it is beyond the scope of this investigation to fully address this issue. It is how-ever clear that this has some consequences for an analysis, particularly the
136 Commonly, organic growth has usually been viewed as ’real’ growth while external growth is more of a reallocation of resources from one business to another. See for instance Penrose (1959/1995), and Davidsson and Delmar (2001). Gunnar Du Rietz (1975) found that a large number of the firms that were merged with other firms in the 1960’s were closed down shortly thereafter. Few small businesses exhibit any considerable growth. As e.g. Braunerh-jelm asserts, it is very difficult to come up with a clear answer to such questions; Braunerh-jelm (1993), p. 322. 137 As an example, there is much empirical material to use from public/official statistics. Such data on e.g. production, number of workers and so on has also been developed by economic historians; see for instance Schön (1988). 138 Within the framework of SOS (Sveriges officiella statistik) and BISOS (Bidrag till Sveriges officiella statistik) – the precursor series – were such data published. The material in the latter one differs from SOS in many parts considering limitations for inclusion and classi-fication. Data that is comparable with later periods (i.e. from 1913 and onwards) were pub-lished from the late nineteenth century. See BISOS:D. Fabriker och handtverk, 1858-1910.
55
study of change over time. Between 1920 and 1955, data were published every fifth year. Thereafter, annual series were published.139 According to more current information, the statistical limitations for re-porting seem unclear. It has for instance been stated that firms with fewer than ten employees (or, rather, workers) were not reported in publications between 1913 and 1946. This does not however seem likely.140 Firms with fewer than five workers were excluded in the statistical reporting in 1950 (in reality from 1946) up until late 1960. This furthermore means that the total number of firms in the publication from 1945 that consisted of around 22,100 diminished to a little more than 17,000 in 1950.141 There have been more significant changes in principles of reporting over time. Therefore, the consequences for using public statistical material can be substantial. For instance, such statistics are most likely afflicted by a large number of miss-ing cases.142 During the 1970’s was also the reporting in number of employees changed significantly. Previous statistics had mainly reported the number of workers (thus excluding other personnel). Later on, other employees, including workers, are incorporated in the data. This naturally obstructs comparisons over time to a great extent. Moreover, the reporting of various size-groups/classes has often been modified – more specifically, the very class-
139 Data was first and foremost reported in the series Industri and Statistisk årsbok. 140 In Industri 1990, p. 9, it can be read that the limit for inclusion was set to at least five employees in 1946, and that the limit previously had been ten employees. Thus, this can be interpreted as statistical reporting excluded firms with less than ten employees prior to 1946. This is not however clear in the very publications from 1913-1945. These publications consis-tently have size-classes consisting of “establishments with a number of workers up to 10; 11-50; 51-100…”, and so on; Industri 1945. Also older editions denote the smallest size-class as “10 workers or less” (Industri 1925, p. 15). Other, more contemporary observers (Hermans-son, 1959, p. 49) do however claim that firms with ten workers or less regularly were ex-cluded. Thus, we might have reasons to in some parts exclude the smallest size group in some calculations – at least when comparing data over longer periods of time. It should further be noted that also other limitations were applied, such as monetary ones and certain product values for individual businesses. Considering the ‘jump’ (or rather, the fall) in the industrial statistics between 1945 and 1950 – in which the number of firms with 0-10 workers are di-minished heavily – I would like to question the correctness in the notion that this smallest group only consisted of ten workers, but no less. This seems unreasonable. 141 See Industri 1940, and Industri 1950, p. 10ff. The principles for reporting – or, rather, for classification – have differed. Partly depending on source of information, partly due to the fact that the publications were currently and constantly revised over time. As mentioned above, firms with fewer than five employees were excluded from 1950. Other (strange) re-classifications were for instance that during one single year of publication (1945), the smallest group of 0-10 was divided into 0-3 and 4-10 workers, respectively. The next edition (1950) again used the older classification. 142 As an example did Carstedt and Pérez base their investigation on such statistical informa-tion. In 1954 did SCB incorporate some 2,000 firms that previously had not been included. In 1964, another 2,000 firms were included. These firms were ‘discovered’ when different regis-ters were matched; Carstedt and Pérez (1974:V), pp. 34-35. A thorough discussion concerning this problem is also found in Hermansson (1959), pp. 45-52, and in Braunerhjelm (1992).
56
intervals of firm size. And, additionally, statistics prior to the 1970’s regu-larly defined firms as the (physical) establishment, not the legal unit. Thus it is evident that a business that consisted of more than one establishment was included multiple times and was also possibly considered to have fewer em-ployees or workers than in reality. All together, such discrepancies make it difficult to produce consistent and coherent series. More present-day data, as mentioned earlier, has similarly gone through vast changes. One major item regarding statistics produced from 1968 and onwards is for instance often-changed limitations for inclusion of individual businesses in the registers based on taxes (value-added tax, VAT). This has affected the reporting of the number of firms for individual observation years. No statistical source moreover accounts for (or adjust for) corporate groups, subsidiaries and so on. Therefore, each firm/establishment is reported ‘independently’ in the source material, even if they belong to a larger group.143 Consequently, while it can be concluded that the possibility to study changes of the size distribution of firms over even longer periods of time is at hand, it must also be concluded that larger reorganizations have made different materials difficult to compare – for instance materials published before and after the 1970’s. In addition to that comparisons even within dif-ferent series/materials that at a first glance seem to have been subjected to a consistent method for reporting occasionally are aggravated by the fact that limitations and other criterions were modified. Yet, even if manufacturing statistics contain the most extensive data, other materials concerning the size structure of firms are available. Three censuses of enterprises were for instance conducted in 1931, 1951 and 1972, with the aim covering all sectors of the economy. The censuses differed from each other as regards definitions and measurements etc., but are in my opinion to some extent comparable with each other. Since all lines of business were included in the censuses, the total number of firms was also considerably larger than for the manufacturing industries. In the census of 1931, for ex-ample, there were some 240,000 units. Thus, it is possible to compare the 143 The business register at SCB has thus gone through several reforms. Between 1968 and 1976 public business activity and enterprising were excluded (counties, municipalities and the state church), compared to later years. This increased the number of large production units. Furthermore, in 1979, a new criterion was introduced. All firms that had reported employer’s declaration (arbetsgivaruppgift) and/or taxable earnings (VAT) to the local tax authorities were now included. This increased the number of firms in the statistics. In 1987, however, the criteria again changed. The limit for taxable earnings was raised, thus lowering the (official) number of firms. This limit was raised again in 1991, whereby there was an extensive deregis-tration of a large number of businesses. Yet in 1994 new limitations were introduced. Here, the criteria for taxable earnings etc. were removed. It was now sufficient to be registered for preliminary tax (F-skatt). Hereby some 40,000 firms were (re-)included in the statistics. Two years later (1996), new rules were applied and another 200,000 firms were included for the year 1997. Most of them were small businesses with zero employees. Thus, to use the public statistics without a critical notion regarding the pitfalls can significantly compromise the research results. SCB, Företagsdatabasen.
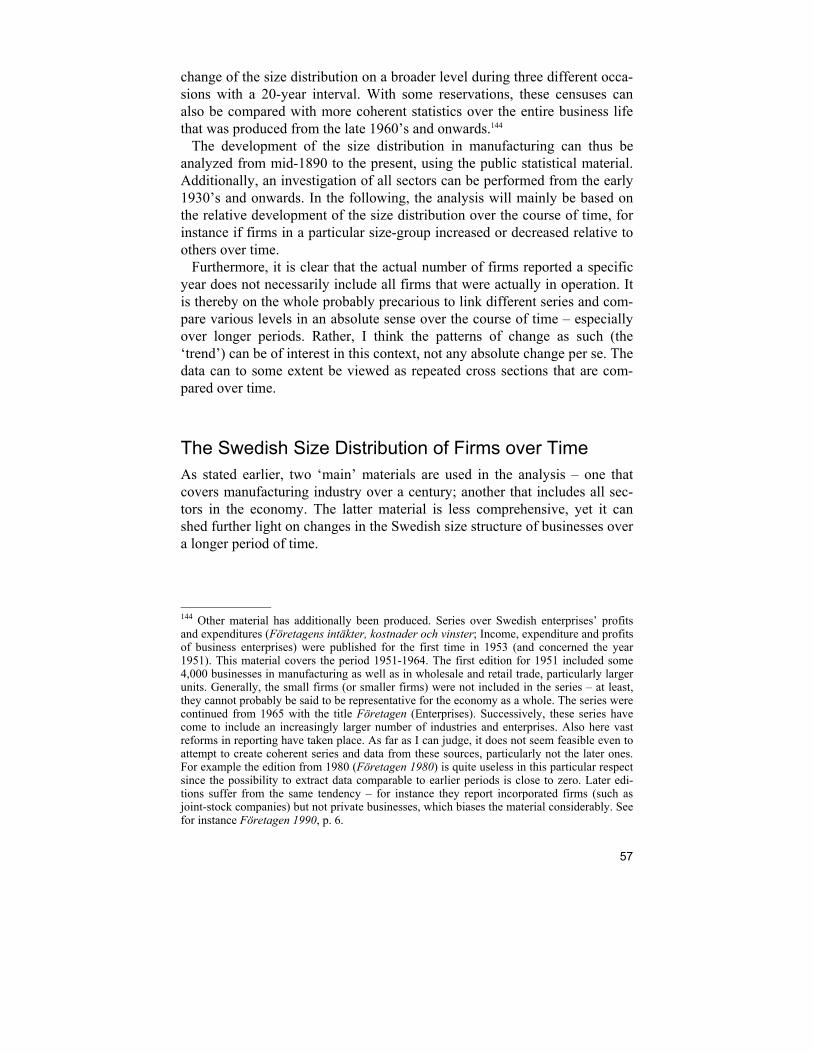
57
change of the size distribution on a broader level during three different occa-sions with a 20-year interval. With some reservations, these censuses can also be compared with more coherent statistics over the entire business life that was produced from the late 1960’s and onwards.144 The development of the size distribution in manufacturing can thus be analyzed from mid-1890 to the present, using the public statistical material. Additionally, an investigation of all sectors can be performed from the early 1930’s and onwards. In the following, the analysis will mainly be based on the relative development of the size distribution over the course of time, for instance if firms in a particular size-group increased or decreased relative to others over time. Furthermore, it is clear that the actual number of firms reported a specific year does not necessarily include all firms that were actually in operation. It is thereby on the whole probably precarious to link different series and com-pare various levels in an absolute sense over the course of time – especially over longer periods. Rather, I think the patterns of change as such (the ‘trend’) can be of interest in this context, not any absolute change per se. The data can to some extent be viewed as repeated cross sections that are com-pared over time.
The Swedish Size Distribution of Firms over Time As stated earlier, two ‘main’ materials are used in the analysis – one that covers manufacturing industry over a century; another that includes all sec-tors in the economy. The latter material is less comprehensive, yet it can shed further light on changes in the Swedish size structure of businesses over a longer period of time.
144 Other material has additionally been produced. Series over Swedish enterprises’ profits and expenditures (Företagens intäkter, kostnader och vinster; Income, expenditure and profits of business enterprises) were published for the first time in 1953 (and concerned the year 1951). This material covers the period 1951-1964. The first edition for 1951 included some 4,000 businesses in manufacturing as well as in wholesale and retail trade, particularly larger units. Generally, the small firms (or smaller firms) were not included in the series – at least, they cannot probably be said to be representative for the economy as a whole. The series were continued from 1965 with the title Företagen (Enterprises). Successively, these series have come to include an increasingly larger number of industries and enterprises. Also here vast reforms in reporting have taken place. As far as I can judge, it does not seem feasible even to attempt to create coherent series and data from these sources, particularly not the later ones. For example the edition from 1980 (Företagen 1980) is quite useless in this particular respect since the possibility to extract data comparable to earlier periods is close to zero. Later edi-tions suffer from the same tendency – for instance they report incorporated firms (such as joint-stock companies) but not private businesses, which biases the material considerably. See for instance Företagen 1990, p. 6.
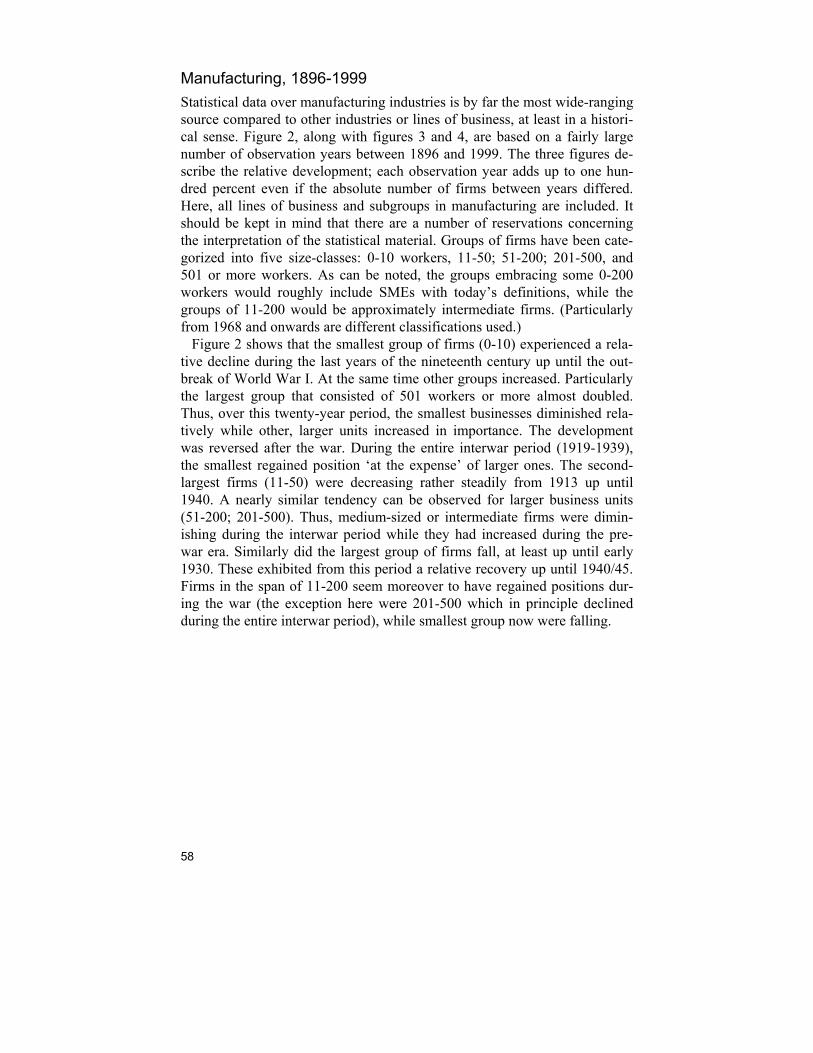
58
Manufacturing, 1896-1999 Statistical data over manufacturing industries is by far the most wide-ranging source compared to other industries or lines of business, at least in a histori-cal sense. Figure 2, along with figures 3 and 4, are based on a fairly large number of observation years between 1896 and 1999. The three figures de-scribe the relative development; each observation year adds up to one hun-dred percent even if the absolute number of firms between years differed. Here, all lines of business and subgroups in manufacturing are included. It should be kept in mind that there are a number of reservations concerning the interpretation of the statistical material. Groups of firms have been cate-gorized into five size-classes: 0-10 workers, 11-50; 51-200; 201-500, and 501 or more workers. As can be noted, the groups embracing some 0-200 workers would roughly include SMEs with today’s definitions, while the groups of 11-200 would be approximately intermediate firms. (Particularly from 1968 and onwards are different classifications used.) Figure 2 shows that the smallest group of firms (0-10) experienced a rela-tive decline during the last years of the nineteenth century up until the out-break of World War I. At the same time other groups increased. Particularly the largest group that consisted of 501 workers or more almost doubled. Thus, over this twenty-year period, the smallest businesses diminished rela-tively while other, larger units increased in importance. The development was reversed after the war. During the entire interwar period (1919-1939), the smallest regained position ‘at the expense’ of larger ones. The second-largest firms (11-50) were decreasing rather steadily from 1913 up until 1940. A nearly similar tendency can be observed for larger business units (51-200; 201-500). Thus, medium-sized or intermediate firms were dimin-ishing during the interwar period while they had increased during the pre-war era. Similarly did the largest group of firms fall, at least up until early 1930. These exhibited from this period a relative recovery up until 1940/45. Firms in the span of 11-200 seem moreover to have regained positions dur-ing the war (the exception here were 201-500 which in principle declined during the entire interwar period), while smallest group now were falling.
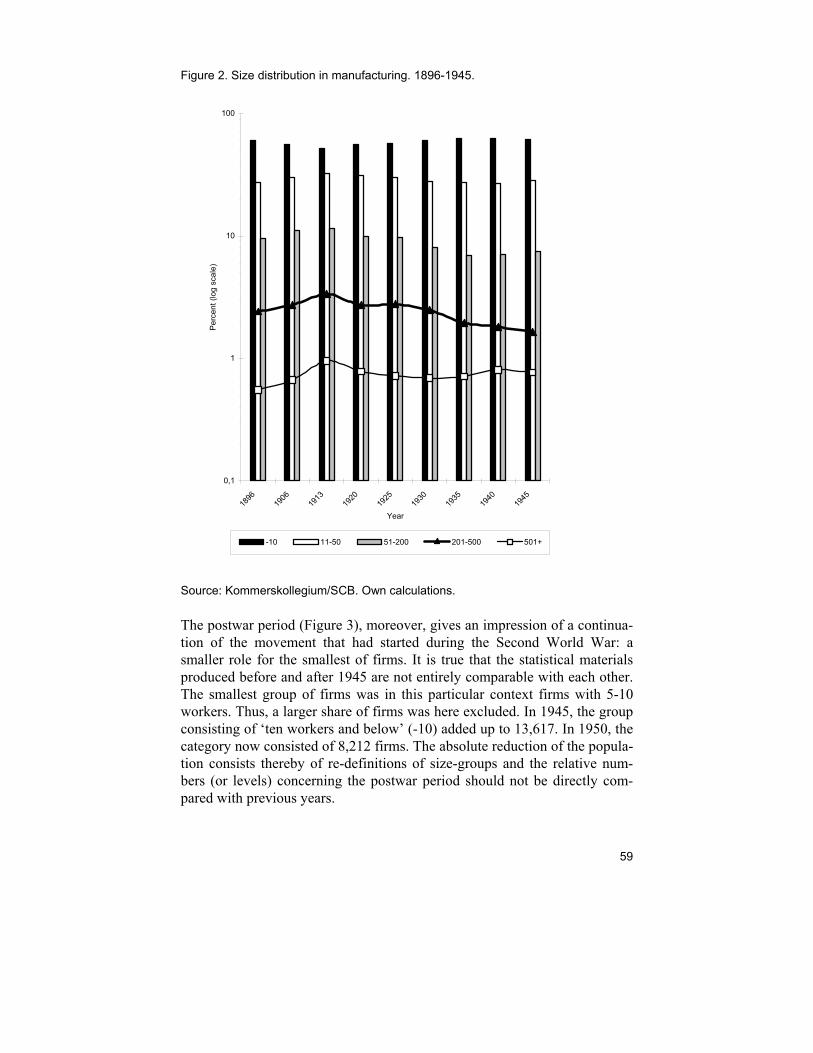
59
Figure 2. Size distribution in manufacturing. 1896-1945.
0,1
1
10
100
1896
1906
1913
1920
1925
1930
1935
1940
1945
Year
Per
cent
(log
sca
le)
-10 11-50 51-200 201-500 501+
Source: Kommerskollegium/SCB. Own calculations.
The postwar period (Figure 3), moreover, gives an impression of a continua-tion of the movement that had started during the Second World War: a smaller role for the smallest of firms. It is true that the statistical materials produced before and after 1945 are not entirely comparable with each other. The smallest group of firms was in this particular context firms with 5-10 workers. Thus, a larger share of firms was here excluded. In 1945, the group consisting of ‘ten workers and below’ (-10) added up to 13,617. In 1950, the category now consisted of 8,212 firms. The absolute reduction of the popula-tion consists thereby of re-definitions of size-groups and the relative num-bers (or levels) concerning the postwar period should not be directly com-pared with previous years.
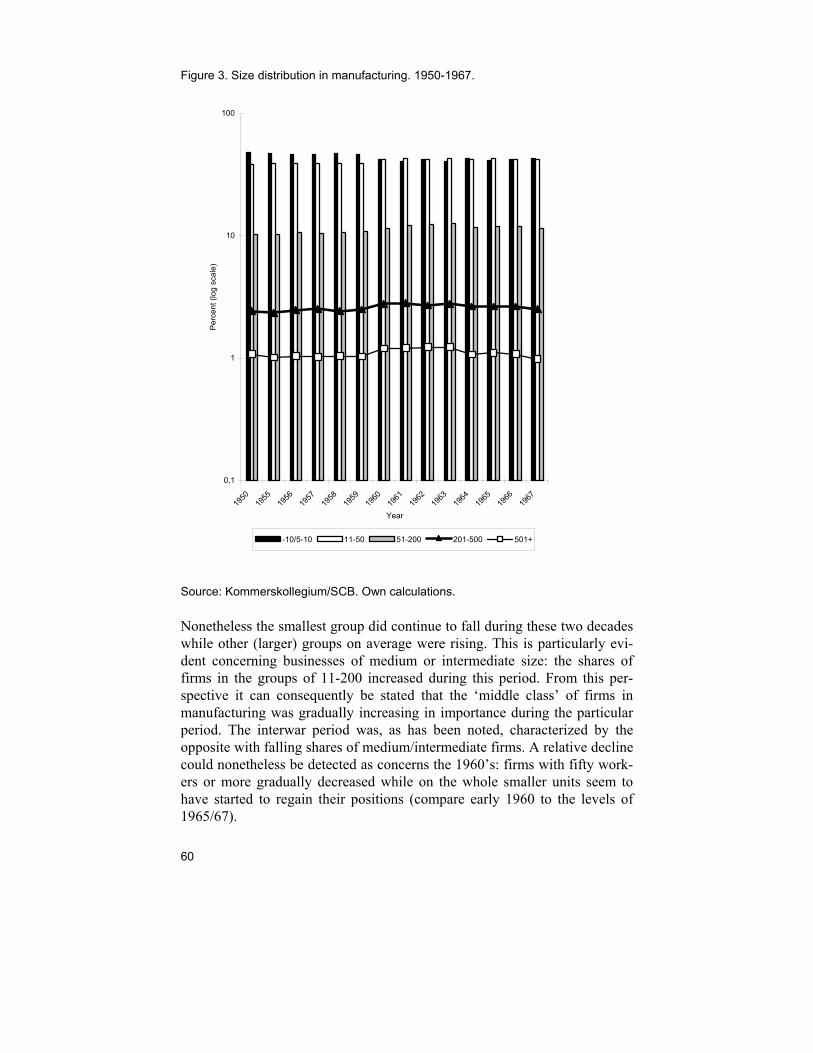
60
Figure 3. Size distribution in manufacturing. 1950-1967.
0,1
1
10
100
1950
1955
1956
1957
1958
1959
1960
1961
1962
1963
1964
1965
1966
1967
Year
Per
cent
(log
sca
le)
-10/5-10 11-50 51-200 201-500 501+
Source: Kommerskollegium/SCB. Own calculations.
Nonetheless the smallest group did continue to fall during these two decades while other (larger) groups on average were rising. This is particularly evi-dent concerning businesses of medium or intermediate size: the shares of firms in the groups of 11-200 increased during this period. From this per-spective it can consequently be stated that the ‘middle class’ of firms in manufacturing was gradually increasing in importance during the particular period. The interwar period was, as has been noted, characterized by the opposite with falling shares of medium/intermediate firms. A relative decline could nonetheless be detected as concerns the 1960’s: firms with fifty work-ers or more gradually decreased while on the whole smaller units seem to have started to regain their positions (compare early 1960 to the levels of 1965/67).
61
From the late 1960’s and onwards until the end of the century (Figure 4), existing data give a picture of a tendency for small firms to increase in num-bers. This group represented just about 70 percent of the entire population in the late 1960’s and around 85 percent from the mid-1980’s and onwards. As mentioned earlier rearrangements and new definitions were at hand even – or even particularly – during the 1990’s. The smallest group is here represented by firms with 2-9 employees (note: not workers as in earlier statistics). The statistical material available for the period 1968-1976 reported the smallest size-group as 0-1 employees. It is not possible to separate ‘Zero-businesses’ from ‘One-employee businesses’. Data after mid-1970 were reported on a more detailed level: 0 employees; 1 employee; 2-4 employees etc. Given that a very large number of firms due to more or less technical reasons – mostly firms consisting of zero to one employees – were introduced particularly during the 1990’s, the figure should be read with some care. Thus, manufacturing firms with zero to one employed are excluded here. Even if this may not be the most ideal proce-dure, it would nonetheless be equally or even more troublesome to assume that the population of firms with zero and/or one employee during the 1990’s increased solely due to new venturing activity.145 Therefore, even if it might be so that there has been an actual increase of firms with 0-1 employees from late 1960 and on, there is reason to use calculations that exclude the smallest of firms when possible.
145 As stated earlier, new definitions meant that a total of 200,000 ‘new’ firms (all industries) were included in 1997. Most of them had zero employees. For the entire population of firms, including all industries, the increase would have been more than 90 percent between 1993 and 1997 (from around 310,000 firms to some 596,000).
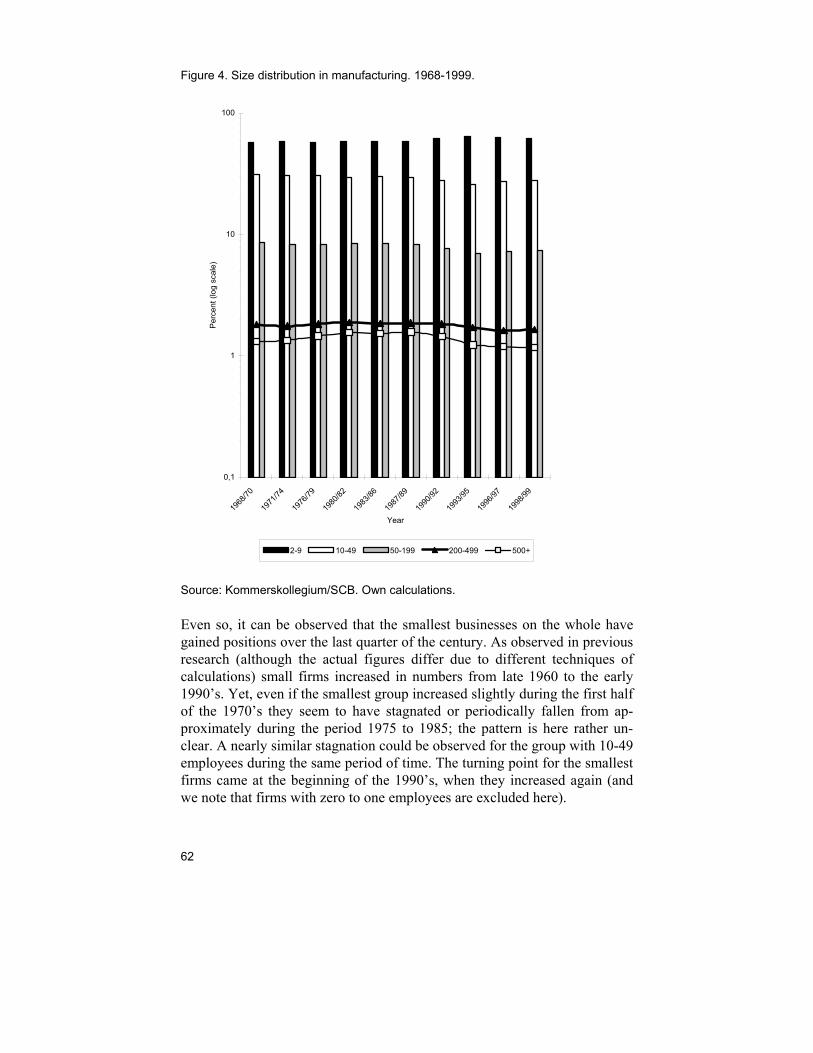
62
Figure 4. Size distribution in manufacturing. 1968-1999.
0,1
1
10
100
1968
/70
1971
/74
1976
/79
1980
/82
1983
/86
1987
/89
1990
/92
1993
/95
1996
/97
1998
/99
Year
Per
cent
(log
sca
le)
2-9 10-49 50-199 200-499 500+
Source: Kommerskollegium/SCB. Own calculations.
Even so, it can be observed that the smallest businesses on the whole have gained positions over the last quarter of the century. As observed in previous research (although the actual figures differ due to different techniques of calculations) small firms increased in numbers from late 1960 to the early 1990’s. Yet, even if the smallest group increased slightly during the first half of the 1970’s they seem to have stagnated or periodically fallen from ap-proximately during the period 1975 to 1985; the pattern is here rather un-clear. A nearly similar stagnation could be observed for the group with 10-49 employees during the same period of time. The turning point for the smallest firms came at the beginning of the 1990’s, when they increased again (and we note that firms with zero to one employees are excluded here).
63
For the period 1968-1999, other firms generally exhibited an opposite de-velopment. These increased on average between 1970 to the end of the 1980’s, and fell during the entire 1990’s compared with the level of the pre-vious decade. There is some indication of recovery for the second-smallest group (10-49) from the second half of the century’s last decade, and a simi-lar development was detected for the size-group of 50-199. The shift be-tween 1980/90 shows however that the two largest groups of firms (200-499; 500+) fell rather steadily in importance over the entire 1990’s. Their devel-opment from the 1970’s up until the end of the –80’s had been opposite – particularly from mid-1970. Large firms increased significantly, as did all other groups (although their patterns were more unstable). Thus, the conclu-sions regarding the three last decades of the 20th century, when this particular statistical material is employed, is that the smallest of manufacturing firms displayed a general decline up to the late 1980’s/early 1990’s. Other groups had an opposite development. Firms commonly defined as intermediate firms (10-199) had as stated in previous research a decline if the late 1960’s is compared to the early 1990’s. Nonetheless, this group of firms was rela-tively speaking more numerous – especially the group of 50-199 – during the late 1980’s than it was both in the 1970’s and in 1990-95.146 What could be a plausible explanation for the development of the size dis-tribution of firms during this period of more than one hundred years, given of course the numerous reservations that must be made regarding the statisti-cal data? It seems that small firms (i.e. those with less than nine or ten em-ployees/workers) have increased during periods characterized by economic crisis or decline. The economic development from around 1890 was defined by strong economic growth during the second industrial revolution. Numer-ous Swedish firms gained a leading position up until the 1910’s. Until World War I, small businesses came to decline in importance while others in-creased (c.f. Figure 2). A plausible assumption here is that even if the total number of firms in absolute figures increased around the time of the second industrial revolu-tion, existing firms were also growing. During and particularly after the war 1914-18, there were several setbacks. In the 1920’s and 1930’s were there severe depressions; in spite of recoveries the macroeconomic problems were pronounced as well as structural to their nature. The gross domestic product, GDP, increased only with 1.9 percent per year between 1910 and 1920, un-employment was high, and the investment ratio compared to both previous and succeeding periods was very low.147 The relative relationship between firms in different size-groups was on the whole transformed between 1913
146 In 1968/70 firms with 10-199 employees were representing around 29 percent of the entire population of manufacturing firms, while the corresponding number in 1987/89 was 32 per-cent, 26 percent in 1993/95 and nearly 29 percent in 1999/00. SCB, own calculations. 147 See Schön (2000a), p. 26; 288ff.
64
and 1945 with a general increase of smaller businesses. In spite of a positive, absolute net inflow of firms of all sizes during the interwar period, nonethe-less, the smallest ones increased most (1920 to 1925 is an exception during which the total number of firms in manufacturing decreased). As Erik Dahmén has stated, there was an inflow of more small (stationary) firms during the interwar period, partly due to new types of entrepreneurs and business owners. A supplementary explanation could be that existing firms were cutting back and downsizing. The economic recovery from the middle of the 1930’s coincided with the relative recovery of some of the larger groups of businesses. It is clear that the smallest group fell while most of the others increased from 1935 to 1945. The situation during the war – particularly the first years – were defined by rationings and negative growth in production. Yet, the recovery was rather swift and industrial production was high at the end of the war. The economy was here additionally protected and regulated. As previous research has claimed, this exceptional situation made some lines of business in manufacturing very profitable.148 The period of generally high growth after the war (here 1950-1967; see Figure 3) does also seem to coincide with the development of the size distri-bution of manufacturing firms: the years 1950-75 have commonly been de-scribed as the Golden Age of industrialism. The average yearly economic growth rate was around 5.6 percent between 1950 and 1970 (Krantz 1997; own calculations). Relative other sectors in the economy the production vol-ume increased significantly.149 The smallest firms diminished in importance during this Golden Age, just as they had around the turn of the century 1800/1900. Instead, other, larger firms increased – especially from 1950 up until the early 1960’s. Earlier research has claimed that the postwar period have not witnessed the rise of new large businesses that are on equal footing with the ones formed in the old industrial society. In spite of this, and in spite of the fact that new-venturing activity generally diminished from the 1950’s in the manufacturing industry, there is nonetheless good reason to believe that the conditions for expansion and growth within existing busi-nesses were favorable. Notwithstanding the difficulties in comparing different statistical series, here it can be established that the smallest firms (here: 2-9 employees; Fig-ure 4) remained on a reasonably high level up until the early 1980’s. The previous decade had witnessed a slowdown in economic growth. The oil price shock 1973/74 triggered an international structural crisis. Whether the new conditions had an effect on the size structure of firms is not entirely clear. The share of small firms remained however on a comparatively high level during the 1970’s, and declined in numbers over the (overheated) boom of the 1980’s. Likewise did the groups of 10-49 and 50-199 exhibit a simi- 148 Pettersson (1980). 149 Schön (2000a), p. 375f.
65
larly unclear/stable pattern 1968-82. It is nevertheless clear that these rose significantly during the economic upswing in the eighties. Firms with 200 employees or more showed here a more pronounced or obvious increase between 1970 and early 1990 – particularly the largest ones (500+). This largely contradicts the idea of decreasing importance of larger pro-duction units from the 1970’s in advanced industrial economies (c.f. Traù, 2003) and brings some support to the notion that large corporations acquired an increasing dominating position over the course of time after the war. It can also be that Sweden in this respect constitutes an exception; the shift may have been delayed due to institutional factors. The second turning point in the early 1990’s coincided with the financial crisis and recession. The smallest firms once again increased, while others were falling behind. Yet, over the course of this last decade of the 20th century, the macroeconomic conditions improved and especially firms in the middle class of 10-199 em-ployees started to increase, followed with some lag by the group of 200-499. Only the largest group of 500 or more decreased steadily over the entire decade. Therefore, the relative development of the size distribution of (manufactur-ing) firms can also be but in a longer perspective of time in which its changes can be put in relation to general conditions in the macro economy. Firms have during periods of economic growth and progress had more room to expand (c.f. Jörberg) – such as during the period 1890-1914; as under the ‘Golden Age’ of the postwar period; during the boom of the 1980’s, and in connection to the recovery during the second half of the 1990’s. During these periods the smallest have diminished while other have increased. Addi-tionally, increasing domination of large(r) business units under various peri-ods also appear to coincide with distinct long-term economic cycles identi-fied by economic historians (c.f. Schön 1995; 2000a-b). Structural cycles of some 40 years – characterized by two behaviors or phases that constitute the foundation for those cycles – have appeared regularly in the economy. The transformation phase, which lasts for some 20-25 years includes changes of industrial structures, increasing investments and reallocation of resources between industries. This first phase is replaced by a rationalization phase, which lasts for some 15-20 years. Here, resources are concentrated to the most productive units coupled with decreasing profit margins and enlarged measures for increasing efficiency. It is also a phase of stabilization in which e.g. consumption of standardized goods has increased.150 Broadly speaking, the periods 1890/95, 1930/35 and 1975/80 were signified by the onset of a new structural cycle and transformation. As we have seen smaller firms were
150 While the first transformation phase contains more long-term investments that are directed towards increasing the development power of industry, investments in the phase of rationali-zation are more short-term, directed to a more efficient use of existing capacity. Schön (2000b).
66
reduced, alternatively stagnated, in connection to these cycles and the fol-lowing period of transformation. Phases of rationalization, which last until the beginning of a new structural cycle, have started around 1915/20 and 1960/65. From here, firms of larger size were reduced in importance while smaller units increased. A similar tendency is detected as concerns the 1990’s.151 Consequently it is not unlikely that firms have expanded and grown (or have had greater scope for this) during transformation phases while they under rationalization phases have concentrated resources and effectuated measures to increase efficiency. Such an unambiguous analysis of course reduces the importance of other explanations. During this long observation period there has been tremendous structural, technological and qualitative transformations in production, in business life, in ownership, and so on (as proposed by Schön). It also ne-glects that institutional factors as proposed in earlier research – suggested by e.g. Henrekson and Johansson – have a plausible explanatory power, as well as that the time period from the late 1800’s up until the 1960’s witnessed a tremendous increase in the total number of firms in manufacturing (and probably in other sectors, although there is less data here). Figure 5 illustrates this phenomenon.152 If we were to create an index over the development of individual size-groups, using the late 1800’s as the base year (= 100), the indexes for all firms in manufacturing would at least had doubled at mid-1960. Yet, even in absolute terms all size-groups had posi-tive as well as negative net changes over individual years. The number of firms with ten workers or less decreased between 1906 and 1913 while other categories increased absolutely. Trendwise, however, all groups increased in absolute figures 1920-1945. The smallest group of ten workers or less in-creased the most; hence the relative calculations here can be used to give the impression that size groups consisting of more than ten workers fell in some absolute sense even if that was not the case. There were exceptions, such as between 1920 and 1925. Here, firms in all size-groups diminished in abso-lute terms. The peace crisis had most likely here an effect on both firm sur-vival and new-venturing activity.
151 The economic crisis in the early 1990’s is an exception from the rule since this period – if we follow Schön’s scheme exactly – not rationalization phase but rather a shorter ‘Transfor-mation crisis’ characterized by shorter rationalizations. 152 Note in Figure 4 that from 1968 and onwards, the smallest size-group (somewhat errone-ously denoted 0-10) includes firms with 0-9 employees. The figure is therefore not entirely comparable to the development reported in Figure 4 in which firms with 0-1 employees were excluded.
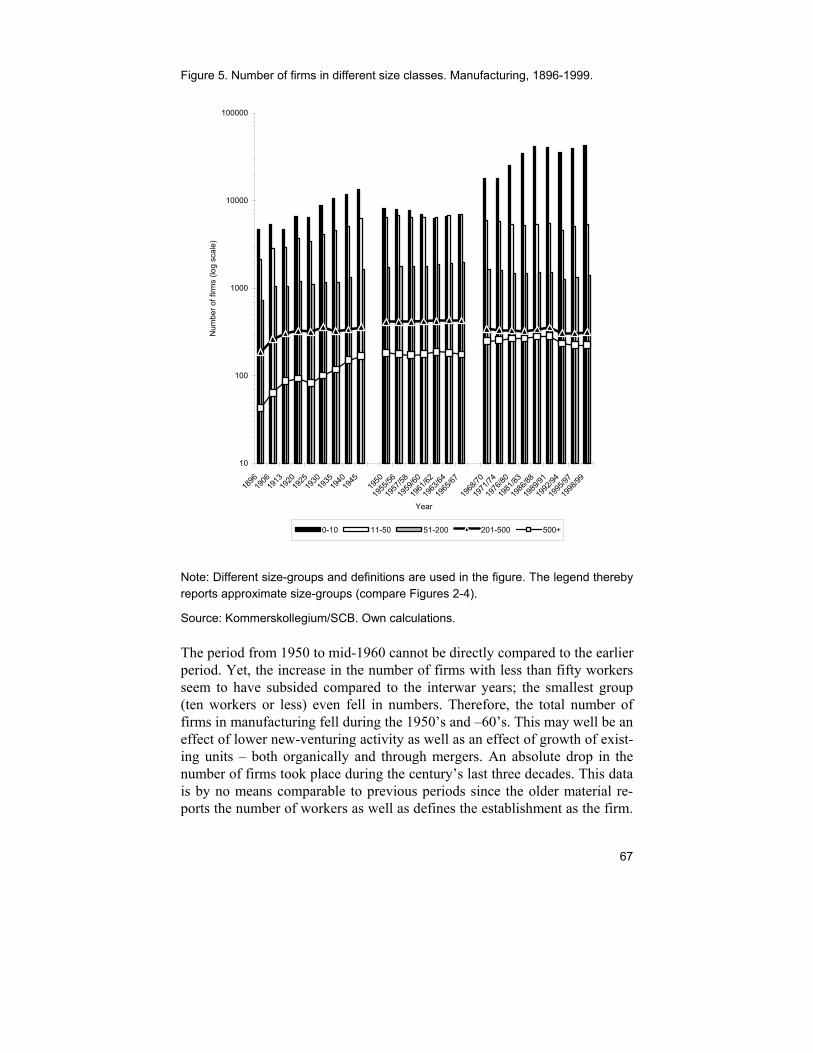
67
Figure 5. Number of firms in different size classes. Manufacturing, 1896-1999.
10
100
1000
10000
100000
1896
1906
1913
1920
1925
1930
1935
1940
1945
1950
1955
/56
1957
/58
1959
/60
1961
/62
1963
/64
1965
/67
1968
/70
1971
/74
1976
/80
1981
/83
1986
/88
1989
/91
1992
/94
1995
/97
1998
/99
Year
Num
ber o
f firm
s (lo
g sc
ale)
0-10 11-50 51-200 201-500 500+
Note: Different size-groups and definitions are used in the figure. The legend thereby reports approximate size-groups (compare Figures 2-4).
Source: Kommerskollegium/SCB. Own calculations.
The period from 1950 to mid-1960 cannot be directly compared to the earlier period. Yet, the increase in the number of firms with less than fifty workers seem to have subsided compared to the interwar years; the smallest group (ten workers or less) even fell in numbers. Therefore, the total number of firms in manufacturing fell during the 1950’s and –60’s. This may well be an effect of lower new-venturing activity as well as an effect of growth of exist-ing units – both organically and through mergers. An absolute drop in the number of firms took place during the century’s last three decades. This data is by no means comparable to previous periods since the older material re-ports the number of workers as well as defines the establishment as the firm.
68
The newer data defines the firm as the legal unit as well as includes the number of employees, not only workers. Nonetheless, these absolute changes correspond to a great extent with the relative changes during the period: small firms – defined as those with 2-9 employees – were more nu-merous in the 1970’s than in the 1980’s but increased during the century’s last decade. Firms with more than 200 employees, which include the groups of 201-500 and 500+, respectively, increased furthermore in total between 1968/70 and 1990/92 (n = 593 and 621, respectively). Subsequently they decreased heavily, and this decrease was mainly due to a fall in firms with 500 employees or more. Thus, it was the largest of firms that seem to have fallen most in the 1990’s; all other groups have – in absolute terms – recov-ered from the decrease that occurred during the depression years.
All Sectors, 1931-2000 By using data from censuses as well as other data from SCB, the entire size distribution of firms can be analyzed, but for fewer observation years. Here, all sectors/industries are included. Since statistical reporting has changed over time – particularly concerning the smallest ones – firms with less than two workers/employees are excluded here. This indicates, as an example, that some 100,000 firms are not included in 1931, or that the analysis ex-cludes some 125,000 businesses in 1968/70. Nonetheless, the cross sections are at least somewhat comparable over time with this procedure, even if it is also important to consider that the census data (1931 and 1951) as discussed earlier defines the firm as the establishment, while the statistics from late 1960’s and onwards use the legal definition.
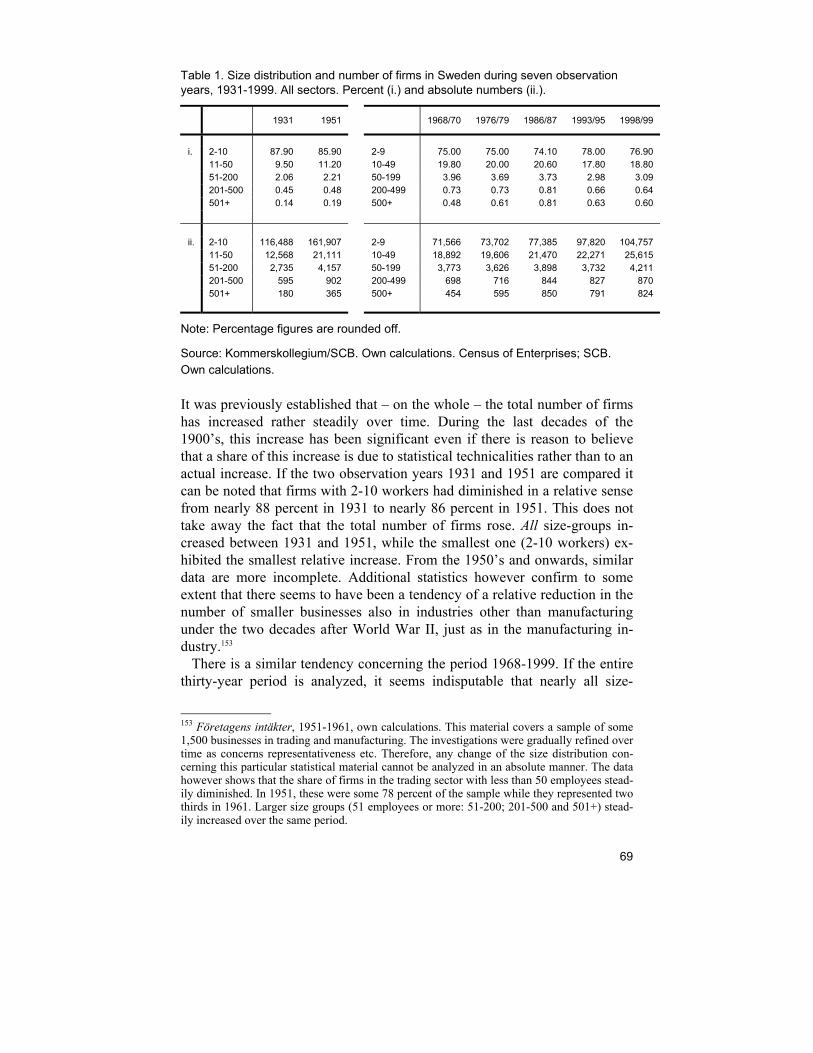
69
Table 1. Size distribution and number of firms in Sweden during seven observation years, 1931-1999. All sectors. Percent (i.) and absolute numbers (ii.).
1931 1951 1968/70 1976/79 1986/87 1993/95 1998/99
i. 2-10 87.90 85.90 2-9 75.00 75.00 74.10 78.00 76.90 11-50 9.50 11.20 10-49 19.80 20.00 20.60 17.80 18.80 51-200 2.06 2.21 50-199 3.96 3.69 3.73 2.98 3.09 201-500 0.45 0.48 200-499 0.73 0.73 0.81 0.66 0.64 501+ 0.14 0.19 500+ 0.48 0.61 0.81 0.63 0.60 ii. 2-10 116,488 161,907 2-9 71,566 73,702 77,385 97,820 104,757 11-50 12,568 21,111 10-49 18,892 19,606 21,470 22,271 25,615 51-200 2,735 4,157 50-199 3,773 3,626 3,898 3,732 4,211 201-500 595 902 200-499 698 716 844 827 870 501+ 180 365 500+ 454 595 850 791 824
Note: Percentage figures are rounded off.
Source: Kommerskollegium/SCB. Own calculations. Census of Enterprises; SCB. Own calculations.
It was previously established that – on the whole – the total number of firms has increased rather steadily over time. During the last decades of the 1900’s, this increase has been significant even if there is reason to believe that a share of this increase is due to statistical technicalities rather than to an actual increase. If the two observation years 1931 and 1951 are compared it can be noted that firms with 2-10 workers had diminished in a relative sense from nearly 88 percent in 1931 to nearly 86 percent in 1951. This does not take away the fact that the total number of firms rose. All size-groups in-creased between 1931 and 1951, while the smallest one (2-10 workers) ex-hibited the smallest relative increase. From the 1950’s and onwards, similar data are more incomplete. Additional statistics however confirm to some extent that there seems to have been a tendency of a relative reduction in the number of smaller businesses also in industries other than manufacturing under the two decades after World War II, just as in the manufacturing in-dustry.153 There is a similar tendency concerning the period 1968-1999. If the entire thirty-year period is analyzed, it seems indisputable that nearly all size-
153 Företagens intäkter, 1951-1961, own calculations. This material covers a sample of some 1,500 businesses in trading and manufacturing. The investigations were gradually refined over time as concerns representativeness etc. Therefore, any change of the size distribution con-cerning this particular statistical material cannot be analyzed in an absolute manner. The data however shows that the share of firms in the trading sector with less than 50 employees stead-ily diminished. In 1951, these were some 78 percent of the sample while they represented two thirds in 1961. Larger size groups (51 employees or more: 51-200; 201-500 and 501+) stead-ily increased over the same period.
70
groups have shown an absolute increase of the number of firms over time. It is furthermore indisputable that the smallest group (here: 2-9 employees) has grown most of all. Therefore, small businesses have gained ‘importance’ compared with larger business units defined here as firms in the middle class (some 10-200 employees). Yet, it seems that there have been periods in which both small as well as medium/intermediate-sized firms have lost as well as regained their positions. The late 1960’s/early 1970’s characterized in comparison to the early 1990’s both a relative and absolute reduction in the number of firms with more than fifty employees. These were on the other hand actually increasing both in a relative and absolute sense between 1976/79 and 1986/87. The real fall came in the first half of the 1990’s, a decade signified by falling eco-nomic activity and recession. And, over the course of the 1990’s when the economy improved, small firms again fell (relatively) when at the same time the larger size-groups, consisting of firms with 10-200 employees increased. Larger firms (200 or more) were, as can be observed, falling measured in percentages over the entire decade even if these again increased absolutely compared to the low level of the period of 1993/95.
Discussion and Concluding Remarks An observer in 1940 would most certainly have come to the conclusion that there had been an increase of the number of smaller businesses compared to 1920 while medium firms had declined. The same observer would have de-tected a reverse picture with reference to the immediate postwar-years when smaller units fell and larger ones – especially medium businesses – in-creased. This raises some questions regarding the causes to such change. The objective with this chapter was to address the problem of changes in the size distribution of firms from a long-term perspective. The study’s con-tribution is twofold. Firstly, it has used and combined different sources and materials over the size structure of firms and additionally, in doing so, iden-tified and discussed several problems that arise in such statistical materials. Secondly, it has revealed patterns and tendencies that may not be detected when more short-term cross section data (or fewer observations) are em-ployed. Here, at least, it has been shown that changes in size distributions may have several, possibly supplementary explanations. Thus, the study has also discussed and given an account for previous explanations to this phe-nomenon. To receive a ‘genuine’ or complete picture of the development over such a long period of time is however not easily achieved. Only certain aspects allow for an investigation. In most historical research, source difficulties are nearly always magnified the further back in time we go. This is true also in this case, although newer statistical material also suffer from the phenome-
71
non of nearly non-comparable data between different years. The statistical material employed is derived from different statistical sources. This data furthermore were based on different samples and used different definitions of the units of investigation. These discrepancies may have considerable consequences for an analysis of changes in the size-composition of busi-nesses over time. Another important aspect to keep in mind is that a period of over one hundred years is loaded with a vast amount of economic, social and technological change. Increasing standard of living, increased consump-tion, technical advances and improvements in production have, as often dis-cussed by economic historians, been immense. The economy has moved from a young to maturing industrial society, towards a service and informa-tion economy from the last decades of the 1800’s up to the early 21st century. Thus, to take into account only the development of the size distribution of firms without considering such important structural changes may lead to erroneous conclusions. It is most likely that such tendencies and movements have had an impact on the observed movements of the size structure in the business life. For example, previous research has acknowledged that the recruitment process of new entrepreneurs and business owners where modi-fied in the interwar era when more firms began to be run by people from the working class. Additionally, these firms were often small and more station-ary than older businesses. It is more or less impossible to speak of or to analyze firms’ growth when just a few or even more aggregate cross sections are employed: between observation years new firms have entered, while others have disappeared. Moreover, even if most firms in fact survive between observation years (which in itself could be questioned especially if considerable time has elapsed between observations; most new firms do not survive) we do not know which of the individual units have grown or declined in size. What is evident is that the number of firms in the economy has grown significantly. It is also evident that the relationship between firms of different sizes has shifted over different periods, even if – by and large – the total number of firms has steadily increased. Applying a longer perspective of time have some advantages: it raises new research questions and can reveal patterns that might remain undetected if shorter time-spans are employed or, alternatively, if only a smaller number of observation periods are available. Data on the intervening periods addi-tionally can reveal other trends or opposite patterns. Nonetheless, even if additional data is used it is still difficult to analyze firm growth with cross section data – particularly if this data is reported on a very aggregate level. Even if I have combined different statistical materials on the size distribution of firms over a longer period of time, thus constructing ‘repeated’ cross sec-tions, firm growth can only be viewed as a subset or one of many parts of these aggregates. Other phenomena – such as entries and exits – are built-in elements in these statistics. Thus, shifts in the relative and absolute number

72
of firms in various size-groups are not easily studied solely from the per-spective of firm growth. It can be that the characteristics of an economy during a particular period also define and determine how production is organized (for instance in the meaning of firm size). Businesses of different sizes can be more, alterna-tively less ‘common’ in one period compared to another due to the type(s) of production methods or – again with the vocabulary from Dahmén – due to the characteristics of the development block that is prevalent during the pe-riod of investigation. It is, as suggested by researchers that have studied the changing size and size structure of businesses for the latter half of the 1900’s, not unlikely that new macroeconomic and market conditions along with new production methods has necessitated or lead to an increased num-ber of smaller units; units that are more flexible than larger (older) busi-nesses. It is moreover likely that institutional change and new policy-conditions may have affected those structures, as proposed particularly when it comes to the case of Sweden. The increasing ‘domination’ of firms of somewhat larger size from the postwar period agrees to some extent with observations of a socio-economic system or of institutions that ‘favored’ larger plants. Small business and entrepreneurship research has often pointed out that the era of big business is over. Additionally, some have remarked that the small business commonly is a more efficient form of organization. In that respect it seems as ‘history’ (i.e. history according to this approach) up until recently has been dominated by big businesses, and that the predictions of the coming death of small firms have been exaggerated (which ‘contemporary’ data would support). In that sense, distinct periods or period-specific circum-stances have been identified with reference to both Sweden and other devel-oped economies. Real economic events and circumstances have affected the size structure of firms. One example is this above-mentioned era of big busi-ness that was succeeded by smaller firms due to events in the macroeco-nomic environment. At the same time, a somewhat different viewpoint has meant that small firms cannot grow to at least medium/intermediate size. At least in Sweden’s case, small firms have increased in numbers during last three decades while others – especially those in the middle class – have de-clined. Yet if we observe the development of the size distribution of firms in the entire business life from the 1930’s and onwards (all sectors), it is notable that small firms – that is firms having 2-10 employees or workers – had a greater frequency during the 1930’s than during the postwar period. Rela-tively speaking, this group declined between 1931 and 1951 and most likely even some time after this latter observation year. Only from the early 1970’s up until the 1990’s could an increase be observed. This gives at least a hint of a ‘domination’ of small firms during earlier periods: small businesses seem to have been more dominant during the interwar period than during the
73
decades that followed World War II. The trend – if it is even possible to speak of a ‘trend’ between two distinct observation periods with a consider-able time-span – thus suggests a falling ‘significance’ of small firms from the interwar period. This tendency was reversed in the 1960’s when small firms increased their dominating position while medium and intermediate-sized firms declined. Large firms (500+), furthermore, seem to have in-creased their relative domination successively ever since at least the 1930’s. In that respect, these (sporadic) statistics show a movement towards an in-creasing domination of larger business units ever since the interwar period, with a possible decline of large businesses at the end of the 20th century. The movement towards an increased number of smaller business units during the interwar period could also be observed concerning businesses in manufacturing industry. During the entire period, firms in the smallest size group (ten or less workers) increased their positions while other groups fell. The picture had been opposite prior to World War I, an economically more prosperous period, when larger businesses had increased. The reduction of larger firms was evident throughout nearly the entire interwar period. From the mid-1930’s, when the economy improved, the number of firms of larger size again increased while the smallest fell. The tendency towards a reduc-tion of the smallest units could also be identified during the postwar period as regards manufacturing. If, furthermore, additional (yet more sporadic) data is taken into consideration it must be claimed here that there was a gen-eral movement towards an increasing relative domination of larger business units. It is therefore not unlikely that smaller businesses lost position over time. It moreover seems that smaller businesses in manufacturing over time increased in numbers, both absolutely and relatively, comparing figures for late 1960’s/early 1970’s to that of the 1990’s. This empirical pattern coincides with the body of research that has recog-nized new conditions for production and organization for devel-oped/advanced economies, which has decreased average firm size. Alterna-tively, it coincides with the body of research that acknowledges deteriorated institutional conditions for small businesses over the 1970’s and 1980’s and improved ones after the 1990’s. Nonetheless, intervening years were charac-terized somewhat by other patterns. Firms of medium or intermediate size (around 10-200 employees) in fact increased both absolutely and relatively from mid-1970 to late 1980. At the same time, the number of small busi-nesses – 2-9 employees – increased steadily during the entire period 1968-1999 in absolute figures. Thus, the number of medium firms grew more than the smallest category in the 1980’s. Therefore, even if there was a tendency for the numbers of medium firms to fall during the last three decades, there were evidently exceptions during this period – as there were similar patterns during earlier periods. The movements over the long period of one hundred years correspond also to long-term shifts in the economy: a reduced importance of smaller firms

74
during or in connection to economic phases characterized by transformation and unbalances and fewer larger firms when the macro economy has entered a period of rationalization. Therefore, while it may very well be true that institutional conditions have altered the positions between small, medium and large firms over time, and that this state of affairs may have affected the possibilities for small, young firms to grow, other explanations may have to be taken into consideration. Here, we have observed that there have been several explanations to adjustments over time of this distribution: techno-logical change, concentration, specific periods and situations, institutional conditions. All seem plausible and it is reasonable to assume that these phe-nomena may occur simultaneously. Some are perhaps even stronger or more leading than others during specific periods. I have in this chapter identified that the positions between firms of different sizes have coincided and been a recurrent phenomenon that – when analyzed from a long perspective of time – has followed the macroeconomic development. This must therefore be seen as a accompanying explanation to other ones.
75
5. Survival and Selection: Seven Birth Cohorts of Firms
In this chapter the termination and survival pattern of firms in seven birth cohorts of joint-stock companies will be studied. The overall purpose is to study the macro biographies of the cohorts – particular interest here lies in investigating the relationship between termination and structural and macro-economic phenomena. A great deal of previous research has identified the liability of newness and the liability of smallness, respectively, as important phenomena in explaining why firms are terminated. Fewer have however addressed the problem of economic environment.
Age, Size, Selection A general assumption in economic theory is that efficient firms survive and, perhaps, grow while inefficient businesses will fail and, presumably, decline in size before they disband.154 Such a supposition might seem reasonable even though several empirical studies have given evidence of the importance of institutional, economic, historical and structural circumstances that pro-vide opportunities as well as circumvent the freedom of action for both indi-vidual firms or groups of firms. Hence, the reasons for why firms fail – that is, exit or disband – or in reverse why they manage to survive might be due to circumstances other or more complex than postulations of inefficiency. The concept of business failure has several definitions. The most common and popular classification is that of bankruptcy. However, using bankruptcy as definition can become quite narrow since it does not include other types of terminations. A wider one incorporates firms terminating business at a loss, which includes bankruptcies as well as other types of terminations. An additional definition “encompasses all kinds of discontinuity in order to avoid losses” (Gratzer 2001a, p. 168). Generally, information over such oc-currences is rather hard to apprehend and the definition is therefore regarded as difficult to apply in empirical research. Finally, another definition in-cludes all three variants above as well as firms that are terminated due to failure of being competitive in comparison to alternative uses of capital and
154 See for instance Jovanovic (1982) or Winter (1988), p. 545.
76
labor. Here, the problem with such a definition can be that particularly small firms can continue operations because of other reasons.155 An even broader classification of ‘failure’ than the above-mentioned four variants would in-clude all types of business terminations, regardless of the causes. Not all terminations of firms can however be regarded as genuine failures (however defined); a long-lived firm that is terminated after several years in operation cannot perhaps be put in comparison with the majority of young firms termi-nated each year in most economies.156 Therefore, ‘genuine’ failures are here mixed with firms that possibly disband due to other reasons. The advantage of such a definition is that it opens up a possibility to measure the duration of a firm’s life, i.e. the termination period for a firm. Much research has used this broader approach, and used termination or exit rates of firms in popula-tions when studying their ability to survive.157 As for the causes of business failure, three main explanations have been put forward. One incorporates a personality-based perspective, such as (the degree of) managerial competency and owner-manager characteristics. An-other recognizes key structural attributes of firms such as their age and size, industry affiliation and so on. A third approach acknowledges environmental conditions for firms, for instance macroeconomic ones.158 At the population level, a widespread opinion amongst researchers is that firms are subjected to a liability of newness. Several empirical studies have demonstrated that young firms exhibit higher termination rates than firms of older age. As time goes by, consequently, termination rates successively fall. It seems to be a pervading idea within this type of research that firms and organizations are subjected to such circumstances irrespective of time and of place.159 Apart from the much-observed age liability, firms or organizations are also viewed as submitted to a liability of smallness. Firms started on a small scale are imprinted with a disadvantage relative to larger organizations. Supposed or observed age effects may, according to such views, actually be effects of
155 Such reasons could be that small-scale business-owners have other goals such as inde-pendence (’being your own’), or that they for the survival of their business contribute with capital from their own pockets. For an overview of the different concepts of business failures, see Gratzer (2001a), pp. 168-169. 156 For a discussion, see for instance Gratzer and Box (2002), or Headd (2003). 157 This has been applied in many studies: Evans (1987a; 1987b), Dunne et al. (1988; 1989), Audretsch (1991, 1997), Gratzer (1996), Wagner, J. (1999), Gratzer and Box (2002). 158 See Brüderl et al. (1992). Anheier (1996), departing from a broader social science ap-proach, includes also political aspects in why organizations fail. 159 See for instance Carroll and Hannan (2000), p. 3f. Closely related research has proposed alternative interpretations of this age liability, stating that, rather, firms might face a liability of adolescence. Brüderl and Schüssler (1990) found that termination rates in firm populations did not fall steadily over time, as firms grew older, but rather described a termination-curve with an inverted U-shape. In the very earliest phase in the life of firms, the risk for termina-tion was small. The risk increased thereafter and reached a peak during their adolescence (2-3 years of age) and then fell again. Everett and Watson (1998) reached a similar conclusion.
77
size. This means that firm size and age are correlated. Small firms are, gen-erally, facing higher death risks. Larger entities have, it is assumed, more resources and presumably more experience and closer contacts with credi-tors. In difficult times when, for example, the economic environment under-goes vast or unexpected change, the larger internal resources of bigger busi-nesses make them endure harder times better than smaller ones. Small and young firms therefore appear to face the highest probability of termination while, on the average, large and old firms exhibit the lowest risk of termina-tion.160 Slightly different results (J. Wagner, 1999) have pointed to that, while termination rates in general seem to decline with increasing age, only smaller shares of all business exits tended to be represented by firms with an age of less than five years. In Wagner’s study, an absolute majority of the exits were between 12-14 years or older; the latter were on average also lar-ger than the exits of lesser age. Thus, high age – and, possibly – larger size do not necessarily imply a guaranteed immunity against termination.161 The positions of big and small businesses have been a long-standing ques-tion in economic theory and research in which small firms commonly are viewed as having a special position or disadvantages.162 If it were assumed that large firms possess some size-advantage relative to smaller firms, economies of scale would imply such an advantage since large firms have lower average costs for production than smaller units. Furthermore, firms can produce more than one product or service. Multi-product firms are gen-erally large, and hence economies of scope can prove to be beneficial for large firms in many circumstances – for example in capability to survive. Firms that have economies of scope may earn cost savings while small firms can be assumed to produce fewer or a single goods or services.163 Economies of scale and of scope therefore have been viewed as positional advantages for large firms: small firms exist closer to the edge while larger firms can continue operations over longer periods before they, perhaps, disband; an unsystematic shock that is only a minor problem for a large firm can prove to be fatal for the smaller business.164 Additionally, small firms, it has been claimed, face problems of access to capital with respect to higher interest
160 Carroll and Hannan (2000), pp. 4f. Evans (1987a) came to a similar conclusion. 161 Wagner, J. (1999). The study consists of three cohorts of exits during three consecutive years, 1990-1992 (i.e. ‘death cohorts’ as opposed to the ‘birth cohorts’ used in this disserta-tion). Furthermore, there were no indications of a prevailing ‘shadow of death’ in the material, i.e. that firms that were terminated exhibited a decline in size the years before exit; therefore, decreasing (i.e. smaller) size did not seem to explain termination behavior. 162 As an example Edith Penrose wrote that “firms that are both larger and older in any econ-omy or industry do tend to have many competitive advantages over smaller or newer firms, no matter how able the management of the latter may be”; Penrose (1959), p. 218. 163 See for instance Steindl (1945), p. 13f, and Chandler (1992), pp. 79-81. 164 See Hannan et al. (1998), p. 283. Large firms can shrink over longer periods, it is assumed, since they have larger assets.
78
and limit to the amount of capital they can obtain since the risk of lending to small firms is greater than large ones.165 Generally, the consequences of environmental conditions at founding, or effects on the firm-population level caused by macroeconomic or external environmental change have received less academic attention and research results have been contradictory.166 Such phenomena nonetheless have been viewed as causing effects for firms’ capacity to survive. Adverse conditions at founding is an example, implying that mortality rates in a population in-crease not only due to low age as such but also because of macro-environmental conditions. Such initial conditions, it is assumed, can remain throughout the entire lifetime; firms in a cohort founded during less benign circumstances are imprinted with a permanent liability. However, it has also been suggested that firms that survive such fierce processes may have better survival chances in the longer run due to the fact that intrinsically weaker firms are selected more fiercely, and due to a collective learning at the popu-lation level.167 Previous research results therefore point to that exogenous conditions or macroeconomic (cyclical) movements affect the termination of firms. Bank-ruptcies or business failures have been viewed as an integrated part of such economic fluctuations, even though it has been debated whether increased business failures/terminations is an early indicator of an economic recession, or if they increase with some delay after the recession has started. Longer periods of positive but low economic growth could have a similar effect on business conditions as a short, moderate recession.168 Erik Dahmén’s (1950) investigation on business dynamics and entrepre-neurial activity during the interwar era, 1919-1939, showed that in many industries, firms exhibited high death rates in the early 1920’s and 1930’s
165 Penrose (1959), p. 218. 166 In some research, it seems to be an opinion that the risk for termination or exit is rather insensitive to variations in the macro environment. See, e.g., Caves (1998), pp. 1957-1958; 1977. See also Gratzer (1999), p. 137. Entries, or new-firm formation, and environment have also been investigated. Highfield and Smiley (1987) performed a study of the relationship between business starts and macroeconomic climate and found that low macroeconomic growth rates, low interest rates and high unemployment rates led to increases in the rate of new incorporations. Similar conclusions were reached by Audretsch and Acs (1994). 167 Swaminathan (1996), pp. 1350-1358; 1368-1373. Collective learning at the population level implies that firms that survive initially harsh conditions develop more successful sur-vival strategies than, for instance, firms born under better conditions. 168 Business cycles and economic growth conditions have received vast theoretical and em-pirical attention over at least the last one hundred years, and theories have replaced each other as well as re-emerged over time. It is not within the scope of this thesis to discuss various problems and questions that have been in the center of attention concerning the causes of economic cycles and macroeconomic growth. Some indicators of business cycles are viewed as pro-cyclical, some indicators are thought of as leading. See Zarnowitz (1985) for an over-view, p. 526 ff, 532. See also Oppenländer (1997), p. 25 ff.
79
when the macro economy were experiencing severe crises.169 Audretsch and Mahmood (1995) performed a somewhat comparable study covering 12,000 firms over a ten-year period. By using aggregate variables such as industry growth rate, as well as unemployment and interest rate level, Audretsch and Mahmood found mixed results. The interest rate level for instance showed no correlation with termination rates of firms; they suggest that this is an effect of the fact that most new firms are not dependent on external capital. The unemployment rate – used as an indicator for macroeconomic fluctua-tions – however proved to have a statistically significant effect on firms’ termination behavior.170 In a study covering over 5,000 start-ups, Everett and Watson (1998) came to similar conclusions. In their examination they found that between 30 to 50 percent of small business failures, depending on the definition of failure, were associated with exogenous economic factors such as unemployment and inflation rates. Ilmakunnas and Topi (1999), furthermore, studied a large sample of entries and exits over a six-year period and argued that, although their results were mixed, growth in real GDP and interest rates affected exits of firms: a fall in demand and increasing interest rates increased the likeli-hood of business failures.171 Correspondingly, research on exits among large businesses and macroeconomic cycles has reached similar conclusions.172 Nonetheless, while there is academic agreement on the influence of age and size-specific variables on the survival of firms, the effects of macroeconomic or external variables have been viewed as less obvious. Some results point to the conclusion that there do not seem to be any relationships: in a cohort study covering a time-span of nearly 15 years, Boeri and Bellmann (1995) had the explicit aim to investigate firm terminations and the business cycle, but found no such relationships.173
169 Dahmén (1950), p. 203 and 247. Death rates of firms were in their lowest levels the imme-diate years after each crisis, that is, when the economy was recovering. Gunnar Du Rietz (1975) came to a similar conclusion in a study over Swedish post-war conditions. Du Rietz (1975), pp. 39-58. 170 See Audretsch and Mahmood (1995), especially pp. 101-102. 171 Everett and Watson (1998), pp. 382-388, and Ilmakunnas and Topi (1999). 172 See Goudie and Meeks (1991). See also Bhattacharjee et al. (2002): their study focuses on large, quoted firms over a thirty-year period. There was a higher propensity for firms to go bankrupt during an economic downturn. 173 Boeri and Bellmann (1995) used among other things indicators such as aggregate (macro-economic) unemployment figures and firm age.
80
Seven Birth Cohorts of Firms: Overview and Some Methodological Considerations If the risk for termination at a specific age would be equal or at least nearly equal for firms regardless of cohort affiliation, one consequence would then be that each cohort’s age distribution would be approximately identical to each other. Then the selection rates – measured as the number of firms ter-minated at a specific age in relation to the number of remaining firms – could moreover be expected to reveal either no differences, or nearly no differences, between cohorts. Thus, for example the same percentage of firms in different generations would approximately be terminated at the age of one, two, three, five, ten and so on. If smaller differences appear, the dis-similarities could naturally be coincidental; although there are differences each cohort would still exhibit a large share of firms terminated at a young age. However, the question is whether considerable deviations in the age distribution of firms – with respect to cohort affiliation – are observable. It is also of interest here if cohorts exhibit different or similar termination ‘behav-ior’ when in the same age. If there are significant differences, other explana-tions than low or high age as such might have to be employed. Hence, al-though there may generally be support for a ‘common behavior’ of firms – e.g. high termination rates due to low age – unique exceptions or discrepan-cies may possibly well have their explanation in other circumstances, for instance the size of firms, or environmental conditions. This perspective could serve as a complementary explanation of firm termination. The total number of firms in the database employed in the present study adds up to 2,154, founded as joint-stock companies in Stockholm during seven different years (Table 2). The oldest cohort, from 1899, originally consisted of 105 firms. With exceptions of cohorts 1912 and 1942, more firms were progressively founded over time. It is not unreasonable to assume that it became more common to start a new business in the form of a joint-stock company. The youngest generation, Cohort 1950, started with nearly five times more firms (n = 504) than the oldest one. The population of Co-hort 1942 consisted of 407 firms and was consequently smaller than the twelve year older generation – Cohort 1930 – that had started with 452 firms. One plausible explanation of this relative new venture-decline in 1942 might of course be the situation during World War II, which probably held back business venturing in general. However, the relatively low new-business activity in Cohort 1912, when comparing this cohort with the ones founded 1909 and 1921, cannot be explained in such terms; the economy was rather prosperous during that time even if there had been an economic downturn some years prior to 1912.
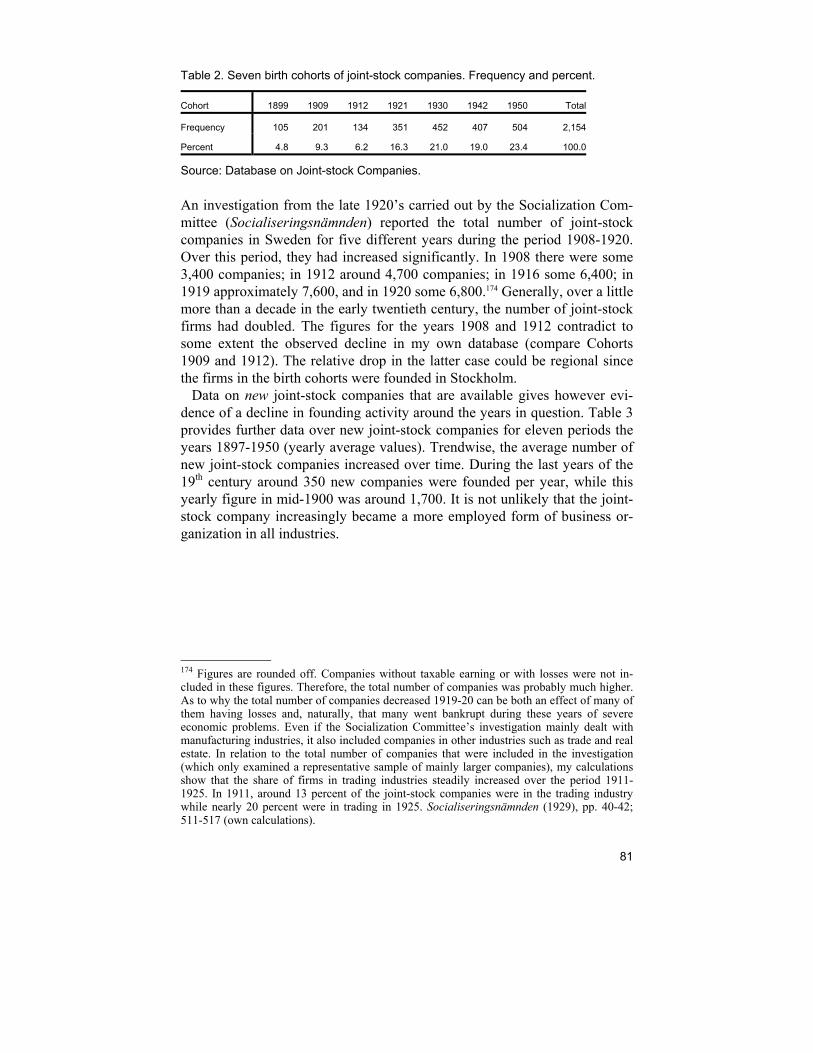
81
Table 2. Seven birth cohorts of joint-stock companies. Frequency and percent.
Cohort 1899 1909 1912 1921 1930 1942 1950 Total
Frequency 105 201 134 351 452 407 504 2,154
Percent 4.8 9.3 6.2 16.3 21.0 19.0 23.4 100.0
Source: Database on Joint-stock Companies.
An investigation from the late 1920’s carried out by the Socialization Com-mittee (Socialiseringsnämnden) reported the total number of joint-stock companies in Sweden for five different years during the period 1908-1920. Over this period, they had increased significantly. In 1908 there were some 3,400 companies; in 1912 around 4,700 companies; in 1916 some 6,400; in 1919 approximately 7,600, and in 1920 some 6,800.174 Generally, over a little more than a decade in the early twentieth century, the number of joint-stock firms had doubled. The figures for the years 1908 and 1912 contradict to some extent the observed decline in my own database (compare Cohorts 1909 and 1912). The relative drop in the latter case could be regional since the firms in the birth cohorts were founded in Stockholm. Data on new joint-stock companies that are available gives however evi-dence of a decline in founding activity around the years in question. Table 3 provides further data over new joint-stock companies for eleven periods the years 1897-1950 (yearly average values). Trendwise, the average number of new joint-stock companies increased over time. During the last years of the 19th century around 350 new companies were founded per year, while this yearly figure in mid-1900 was around 1,700. It is not unlikely that the joint-stock company increasingly became a more employed form of business or-ganization in all industries.
174 Figures are rounded off. Companies without taxable earning or with losses were not in-cluded in these figures. Therefore, the total number of companies was probably much higher. As to why the total number of companies decreased 1919-20 can be both an effect of many of them having losses and, naturally, that many went bankrupt during these years of severe economic problems. Even if the Socialization Committee’s investigation mainly dealt with manufacturing industries, it also included companies in other industries such as trade and real estate. In relation to the total number of companies that were included in the investigation (which only examined a representative sample of mainly larger companies), my calculations show that the share of firms in trading industries steadily increased over the period 1911-1925. In 1911, around 13 percent of the joint-stock companies were in the trading industry while nearly 20 percent were in trading in 1925. Socialiseringsnämnden (1929), pp. 40-42; 511-517 (own calculations).

82
Table 3. Number of new joint-stock companies per year (yearly averages) in Sweden, 1897-1950.
Year Companies Year Companies
1897/00 354 1926/30 1,018
1901/05 452 1931/35 1,030
1906/10 703 1936/40 1,007
1911/15 606 1941/45 1,351
1916/20 1,289 1946/50 1,697
1921/25 1,020
Source: Statistisk årsbok (1940, 1951).
In the following study, the age of firms is measured in full years. Firms that reached an age below half a year (0.5) were designated as zero years in the database, while firms above the age of 0.5 but less than 1.5 were coded as one year old. The same procedure was also carried out for firms with older age: 1.5–2.4 years = 2 years, etc. Since this is longitudinal data, not only is the age of firms controlled but also when in time each firm was founded (cohort). Another advantage is that there is information on when in time the events of interest occurred, here: an exit from the birth cohort. All types of exits, whether liquidation, bankruptcy, etc., are here used as indicators of termination. The main interest here is the ability of a business organization to survive.175 The size of firms is measured as the size of the stock capital at founding. Even though other or multiple indicators of size would be preferable, stock capital is the only available indicator in the source material. Furthermore, only the start-up size is registered in the database. This is acknowledged as a possible disadvantage in the study since firm size signifies start-up size only. 175 The type of exit has also been recorded in the database. The most common way to termi-nate a firm was liquidation, followed by bankruptcy. Other types of closure, for instance merger, were less frequent events. In the database, around 44 percent of all exits were liquida-tions while a little more than 21 percent were bankruptcies. Less than five percent were ter-minated due to merger. There are furthermore strong indications in the case of Sweden of that bankruptcy as a way of closing a business (here: joint-stock companies) generally was less employed than liquidation before the 1960’s. See for example Gratzer (2001a), p. 185. For some firms in the database there is no evidence of exactly when in time – or in what way – they ceased their operations. In such cases, the last year they appear in the source material, has been used as an indicator for exit. A smaller fraction of firms in each cohort were still active during the present investigation or at least until 1999. These firms have been defined as ‘alive’. Furthermore, some firms have, several years after the last sign of life, been deregis-tered by PRV. For example in the 1950’s, PRV sorted out their archives of firms that had been inactive for several years. Therefore, it is unreasonable to assume that such firms were really operative during that entire time. In such cases, the firms have been assigned, hopefully, a more realistic age (way of closure: ‘unknown’). The surviving firms are studied in Chapter 6 but are naturally included in the present chapter as representatives of survivors from each cohort.
83
Thus, in controlling for firm size, it is impossible at this stage to control for firms that perhaps were growing or shrinking. In comparison, each cohort also exhibits different size distributions. The uppermost rows in Table 4 (i.), report the initial nominal stock capital of firms. The lowest capital limit for joint-stock companies was 5,000 kr. dur-ing the entire period of investigation. (In the mid-1970’s, the limit was changed to a minimum of 50,000 kr.) The stock capital in each cohort has been divided into seven size-classes.176 Less than ten percent of the firms in Cohort 1899 started with a stock capital below 9,000 kr., while 65 percent of the firms in Cohort 1950 had less than or equal to 9,000 kr. at start. There were no firms in this youngest cohort with a stock capital exceeding 500,000 kr. Furthermore, no firm in Cohort 1942 had a capital that surpassed the limit of 1,000,000 kr. Therefore, more joint-stock companies were founded over time. There were also an increasing number of firms that started on a smaller scale while larger firms are found in older cohorts. One explanation of this gradual shift towards increasing numbers of small new companies during the first half of the 20th century could be that it progressively became less costly to start a business in the form of a joint-stock company since the minimum capital required remained the same in nominal figures (5,000 kr.) for a long time. The monetary value changed significantly during the period of investigation. The Consumer Price Index (CPI) was used in order to deflate the stock capi-tal in each cohort. For instance, 1,000 kr. in 1899 was around 44,000 kr. in the late 1990’s. As a result, the minimum capital of 5,000 kr. required in 1899 was equal to 220,000 kr. in 1996/99.177 The stock capital in the lower sections of Table 4 (ii.) is expressed at the price level of 1930.178 As can be observed in the lower section of the table, the proportion of firms in the smallest size-classes in Cohorts 1899 and 1909 decreases if their capital is deflated. 5,000 kr. in 1909 was for example equivalent to around 8,500 kr. in 1930. The relationship between cohorts remains – gradually larger shares of firms that are small – but is further en-hanced when expressed in fixed prices. There is an absolute majority of
176 In line with Gratzer (1996), pp. 205-206. 177 The CPI might not be the most ideal tool in deflating the stock capital of firms since it does not necessarily comprise the conditions in business life – rather, the CPI deals with a weighted basket of consumer goods. However, it is easy to employ, and I do not think that any other method would prove to be better. It is however important to remember that even if, e.g., 1,000 kr. in 1899 is equal to some 44,000 kr. in our day according to the CPI, the ‘real’ value of 1,000 kr. over one hundred years ago probably was much higher due to social and economic circumstances – here I have in mind differences between social classes, income levels and so on. See SCB: Levnadskostnadsindex/KPI. Historiska tal. 178 It is of course possible to express the stock capital of firms in more present-day values, although I do not really see the point in such a procedure. Furthermore, by choosing 1930 it is not necessary to change the size groups in Table 4, which facilitates comparisons between nominal and deflated values.
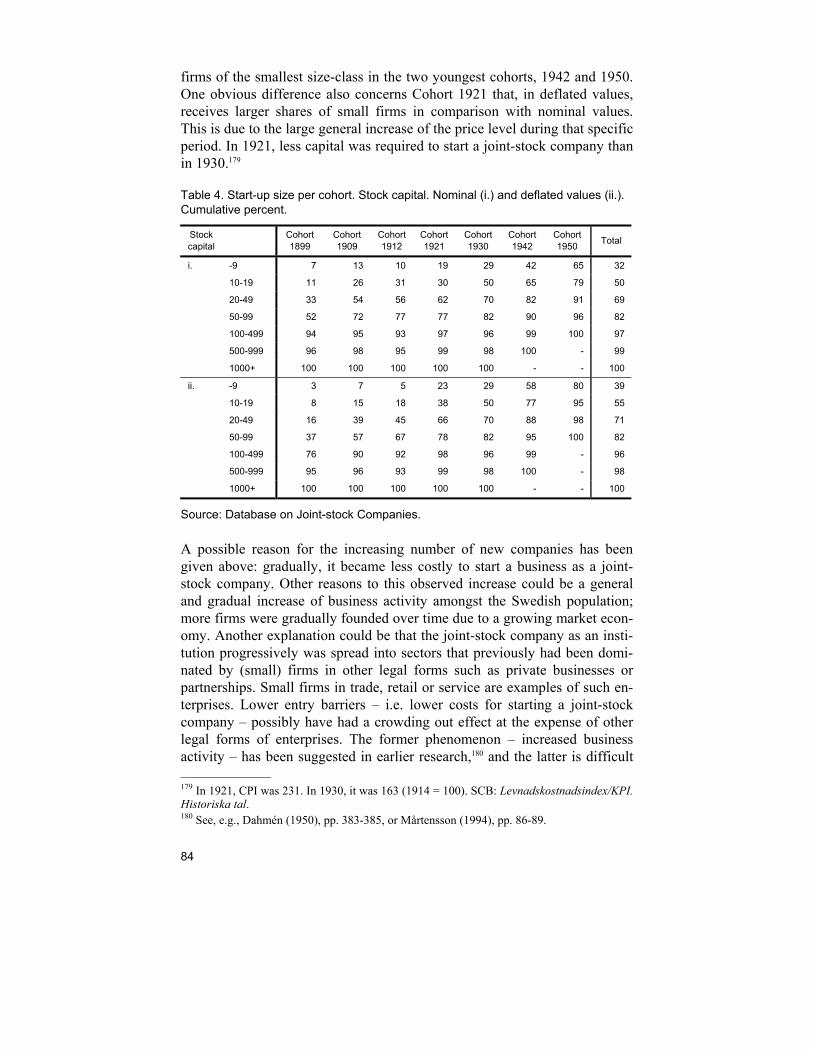
84
firms of the smallest size-class in the two youngest cohorts, 1942 and 1950. One obvious difference also concerns Cohort 1921 that, in deflated values, receives larger shares of small firms in comparison with nominal values. This is due to the large general increase of the price level during that specific period. In 1921, less capital was required to start a joint-stock company than in 1930.179
Table 4. Start-up size per cohort. Stock capital. Nominal (i.) and deflated values (ii.). Cumulative percent.
Stock capital Cohort
1899 Cohort 1909
Cohort 1912
Cohort 1921
Cohort 1930
Cohort 1942
Cohort 1950 Total
i. -9 7 13 10 19 29 42 65 32
10-19 11 26 31 30 50 65 79 50
20-49 33 54 56 62 70 82 91 69
50-99 52 72 77 77 82 90 96 82
100-499 94 95 93 97 96 99 100 97
500-999 96 98 95 99 98 100 - 99
1000+ 100 100 100 100 100 - - 100
ii. -9 3 7 5 23 29 58 80 39
10-19 8 15 18 38 50 77 95 55
20-49 16 39 45 66 70 88 98 71
50-99 37 57 67 78 82 95 100 82
100-499 76 90 92 98 96 99 - 96
500-999 95 96 93 99 98 100 - 98
1000+ 100 100 100 100 100 - - 100
Source: Database on Joint-stock Companies.
A possible reason for the increasing number of new companies has been given above: gradually, it became less costly to start a business as a joint-stock company. Other reasons to this observed increase could be a general and gradual increase of business activity amongst the Swedish population; more firms were gradually founded over time due to a growing market econ-omy. Another explanation could be that the joint-stock company as an insti-tution progressively was spread into sectors that previously had been domi-nated by (small) firms in other legal forms such as private businesses or partnerships. Small firms in trade, retail or service are examples of such en-terprises. Lower entry barriers – i.e. lower costs for starting a joint-stock company – possibly have had a crowding out effect at the expense of other legal forms of enterprises. The former phenomenon – increased business activity – has been suggested in earlier research,180 and the latter is difficult 179 In 1921, CPI was 231. In 1930, it was 163 (1914 = 100). SCB: Levnadskostnadsindex/KPI. Historiska tal. 180 See, e.g., Dahmén (1950), pp. 383-385, or Mårtensson (1994), pp. 86-89.
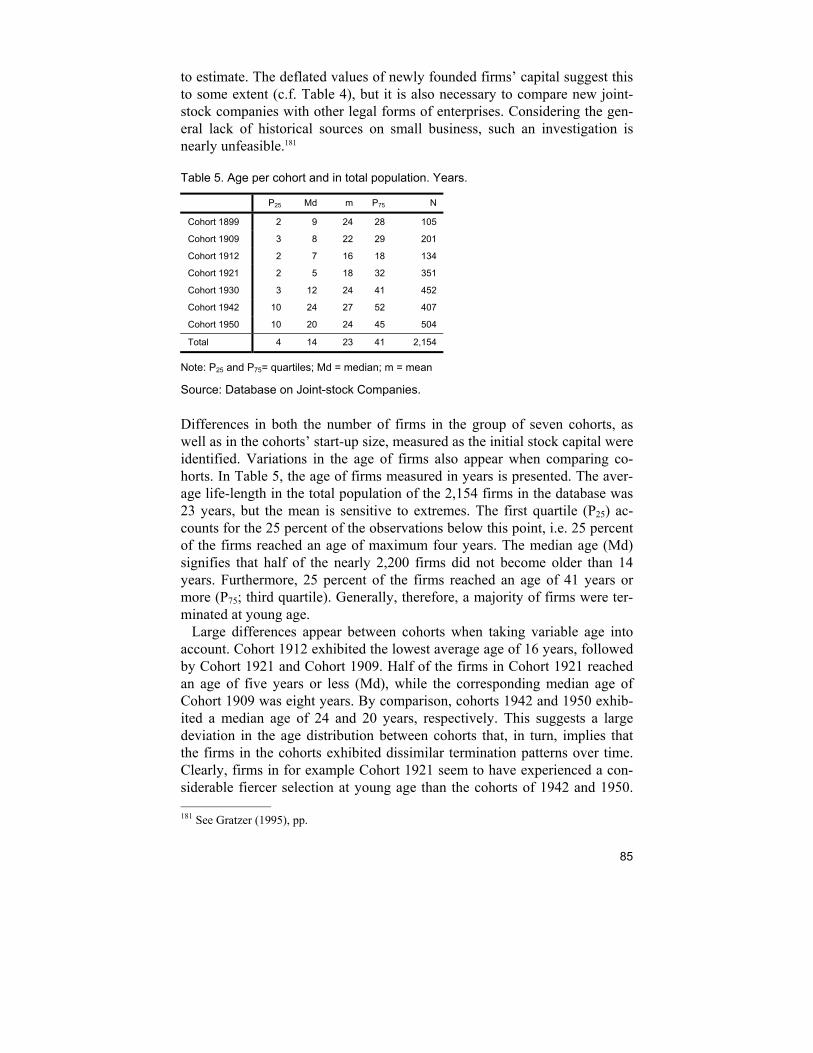
85
to estimate. The deflated values of newly founded firms’ capital suggest this to some extent (c.f. Table 4), but it is also necessary to compare new joint-stock companies with other legal forms of enterprises. Considering the gen-eral lack of historical sources on small business, such an investigation is nearly unfeasible.181
Table 5. Age per cohort and in total population. Years.
P25 Md m P75 N
Cohort 1899 2 9 24 28 105
Cohort 1909 3 8 22 29 201
Cohort 1912 2 7 16 18 134
Cohort 1921 2 5 18 32 351
Cohort 1930 3 12 24 41 452
Cohort 1942 10 24 27 52 407
Cohort 1950 10 20 24 45 504
Total 4 14 23 41 2,154
Note: P25 and P75= quartiles; Md = median; m = mean
Source: Database on Joint-stock Companies.
Differences in both the number of firms in the group of seven cohorts, as well as in the cohorts’ start-up size, measured as the initial stock capital were identified. Variations in the age of firms also appear when comparing co-horts. In Table 5, the age of firms measured in years is presented. The aver-age life-length in the total population of the 2,154 firms in the database was 23 years, but the mean is sensitive to extremes. The first quartile (P25) ac-counts for the 25 percent of the observations below this point, i.e. 25 percent of the firms reached an age of maximum four years. The median age (Md) signifies that half of the nearly 2,200 firms did not become older than 14 years. Furthermore, 25 percent of the firms reached an age of 41 years or more (P75; third quartile). Generally, therefore, a majority of firms were ter-minated at young age. Large differences appear between cohorts when taking variable age into account. Cohort 1912 exhibited the lowest average age of 16 years, followed by Cohort 1921 and Cohort 1909. Half of the firms in Cohort 1921 reached an age of five years or less (Md), while the corresponding median age of Cohort 1909 was eight years. By comparison, cohorts 1942 and 1950 exhib-ited a median age of 24 and 20 years, respectively. This suggests a large deviation in the age distribution between cohorts that, in turn, implies that the firms in the cohorts exhibited dissimilar termination patterns over time. Clearly, firms in for example Cohort 1921 seem to have experienced a con-siderable fiercer selection at young age than the cohorts of 1942 and 1950. 181 See Gratzer (1995), pp.

86
One question that therefore arises if and how much the termination ‘behav-ior’ differed between cohorts. One generally does not encounter a problem when measuring the age of firms. Rather, the start-up size of firms is a greater dilemma. While firms in the seven birth cohorts were gradually smaller at start – indicated by the increasingly smaller stock capital among the cohorts – it also seems that younger cohorts displayed better survival capabilities than older ones. The median age in cohorts 1942 and 1950 (and in some extent in cohort 1930) were considerably higher than in older cohorts. A question that therefore arises is whether small firms generally had better chances of survival than larger ones. If so, this contradicts much prior research that identifies small firms as subjected to a liability of smallness. However, it does not seem rea-sonable to reject this observation; we can generally assume that small firms have a higher risk for early termination. One explanation to the observed age-size relationship concerning the seven cohorts could be that stock capital is an inappropriate size-measure and that other indicators would have dis-played other relationships. This might of course be the case, even if different size variables commonly are correlated with each other. And even so, there are no other alternative variables available than firms’ stock capital. Theo-retically, it could alternatively be assumed that the small firms grew to a greater extent than the ones that were large at start. Hence small firms of younger cohorts grew faster than firms in the older cohorts since the latter on average were larger. This, in turn, increased the formers’ chances of sur-vival. Nonetheless, while this of course might be true to some extent, prior studies have frequently identified that most new firms do not grow. It does not seem reasonable to assume that the seven birth cohorts of firms are an extreme exception from the rule. There are naturally no ideal answers or solutions to this dilemma. We can establish that firms’ start-up size on average decreased over the half-decade (1899-1950) that are studied here. This brings us to the question as to whether a small new firm in 1899 was considered to be a large new firm in 1950. More present-day data reveal for instance that the number of small firms in the Swedish economy have increased significantly over the past 20 years.182 We can ask ourselves if different classifications or size groups are even comparable over time. Should a medium-sized firm as defined today not have been considered a medium-sized firm fifty years ago? This issue among other things was discussed in Chapter 4; however, we have no exact answers to this problem.183 The prevailing state of affairs nonetheless creates 182 See for instance Johansson (1997). Traù (2003) discusses the declining average size of firms in other countries over the past thirty years. 183 While most modern economies from the latter half of the nineteenth century have wit-nessed the rise of very large corporations, small firms have continued. If they have increased in absolute or relative terms is difficult to apprehend. Thus, one interpretation could be that small firms – or, rather, joint-stock companies – were getting even smaller over time (and
87
an actual problem when addressing the question of firm size and survival using the cohort database. Should stock capital as such be used as an indica-tor (as in Table 4) regardless of cohort? In that case, is it better to use the nominal capital in the classification of firms? Deflated values in fact inflate the number of small businesses in younger cohorts and reduce the number of small ones in the older cohorts. Or must other classifications be employed? In solving such a problem, I employ period-specific size measures: small firms that e.g. were founded prior to World War I are defined differently from firms founded after World War II, meaning that a small firm from 1899 actually was rather large when compared to firms founded in 1950. The first-mentioned solution has the risk to neglect that average firm size in fact de-creased over the period of fifty years and thereby the risk to come to errone-ous conclusions regarding for instance the age-size relationship. Correspond-ingly, a ‘period-specific’ classification of firm size has the risk of becoming more or less arbitrary. Thus, even if the variables age and cohort on the whole represent no real methodological dilemma when it comes to defini-tions and measurements, there is reason to believe that size (start-up size) of firms in some respects actually does. While I do not consider stock capital as such as an inadequate size-indicator, the nature of the variables however causes some methodological problems. Previous analyses of the cohorts have used an absolute limitation of stock capital as classification (see Gratzer and Box 2000; 2002; 2004). In this study, period-specific size definitions will be employed. By this, cohorts that were founded during the same period or era are here assumed to share a common attribute. The cohorts from 1899, 1909 and 1912 were therefore defined as Prewar cohorts while the 1921 and 1930 cohorts were classified as Interwar cohorts. Finally, even though Cohort 1942 was founded during World War II, this cohort and Cohort 1950 were defined as Postwar cohorts. By assuming that half of the firms in each of these three ‘synthetic’ cohorts were small at start and the other half large, a rather crude definition of start-up size is obtained (of course, other criterions could be used here). Yet, this procedure can hopefully be checked for in some sense that average firm size decreased over time and thereby control for co-hort/generation.
In the Long Run They are (Nearly) All Dead: Termination, Age and Size Were firms generally terminated at an early age, indicating a liability of newness and were furthermore firms of small size subjected to a liability of
even more numerous due to lower entry costs) under the shadows of giant corporations. See for instance the works of Alfred D. Chandler (1977, 1992), or John Kenneth Galbraith (1967).
88
newness as proposed in earlier studies? Figure 6a gives the (accumulated) hazard rate for all 2,154 firms during their first ten years in operation. The hazard rate signifies the probability for a firm to be exposed to an event – i.e. termination – at a specific point in time; more specifically, it controls both for the point in time when the event occurs and the sequence of time at which it appears. The hazard rate is however sensitive to the absolute figures of remaining firms in a population; to calculate hazards for longer periods of time could therefore be risky.184 It can be observed that the hazard rates were generally higher during the first five years than during succeeding years; hazard rates in years six to ten were considerably lower. Therefore, the risk for termination decreased as firms grew older. It can also be observed that there was a slight increase of hazard from the sixth or seventh firm year. Whether this is due to statistical circumstances or due other effects is diffi-cult to establish. A next step divided the 2,154 businesses into large and small firms, respec-tively, using their start-up size measured as stock capital at founding.185 Es-pecially at the age of 1-2 years, hazard rates were noticeably higher for small firms in comparison to the group of large firms (Figure 6b). After that, the differences became less obvious and occasionally reversed. The highest haz-ard for both groups, however, occurred at year one and they (approximately) displayed similar patterns. Thereafter, and quite much in line with hazard rates for all firms in Figure 6a, hazard rates generally seem to have in-creased. Systematically, firms of smaller start-up size were exposed to a higher relative risk of termination and this risk was higher at a younger age.
There is of course a possibility that the volatility in hazard rates in the figures is random. If not, differences between small and large firms could be interpreted as small firms exhibiting higher termination risk at young age due to a size-disadvantage, a liability of smallness. Difficulties naturally arise in defining what specific type, or types, of disadvantage in size that is present, but it can be assumed that large firms have greater resources and that they possibly possess economies of scale and/or of scope. It is further-more not unreasonable to assume that large firms generally have a higher degree of organizational experience and competence. The termination period for small firms were generally shorter for firms started with a lesser size in comparison to larger businesses. The latter, it can be assumed, could prolong their termination period due to a size advantage; secondary upturns in hazard for large firms when in a somewhat older age – as were the case at the age of five firm years – might support this assumption.
184 If the remaining number of firms in a certain year is small, for instance when a cohort has reached a mature age, hazard rates might become high even if only a small absolute number of firms are terminated that particular year. See for instance Allison (1984), pp. 14-17. 185 Period-specific measures, discussed above, were employed using deflated values of each firms’ stock capital. Fixed prices, 1930=100. SCB.
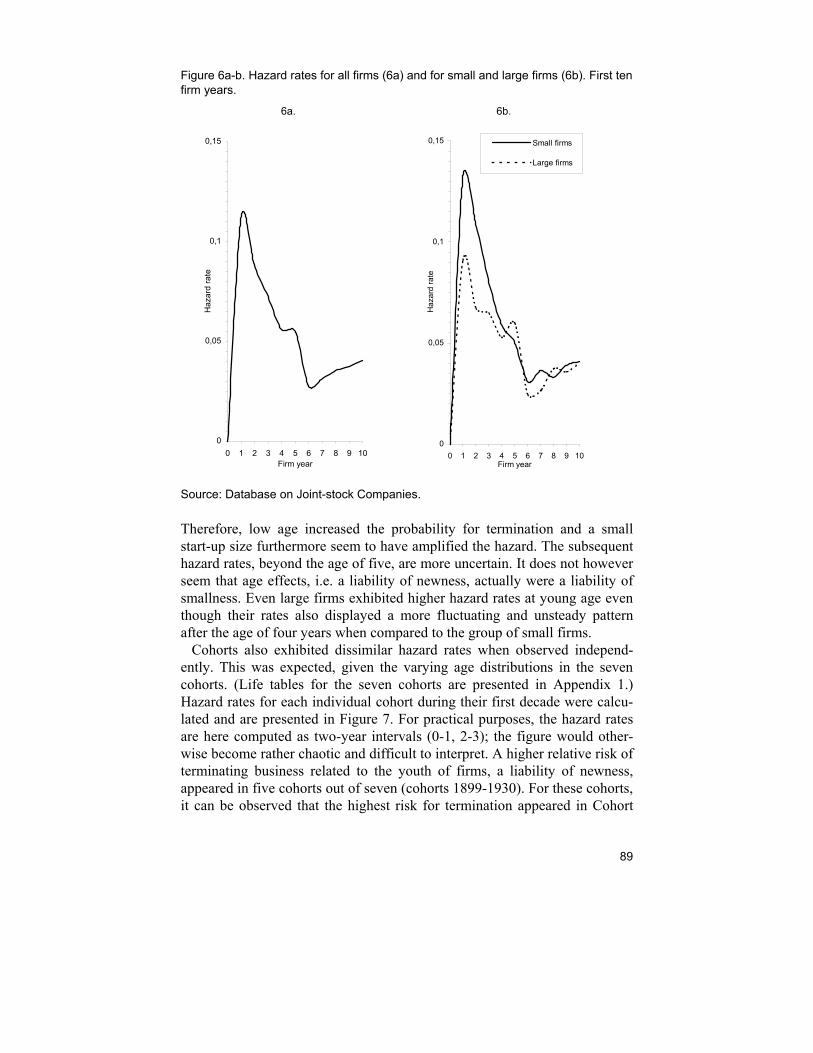
89
Figure 6a-b. Hazard rates for all firms (6a) and for small and large firms (6b). First ten firm years.
6a. 6b.
0
0,05
0,1
0,15
0 1 2 3 4 5 6 7 8 9 10Firm year
Haz
ard
rate
0
0,05
0,1
0,15
0 1 2 3 4 5 6 7 8 9 10Firm year
Haz
ard
rate
Small firms
Large firms
Source: Database on Joint-stock Companies.
Therefore, low age increased the probability for termination and a small start-up size furthermore seem to have amplified the hazard. The subsequent hazard rates, beyond the age of five, are more uncertain. It does not however seem that age effects, i.e. a liability of newness, actually were a liability of smallness. Even large firms exhibited higher hazard rates at young age even though their rates also displayed a more fluctuating and unsteady pattern after the age of four years when compared to the group of small firms. Cohorts also exhibited dissimilar hazard rates when observed independ-ently. This was expected, given the varying age distributions in the seven cohorts. (Life tables for the seven cohorts are presented in Appendix 1.) Hazard rates for each individual cohort during their first decade were calcu-lated and are presented in Figure 7. For practical purposes, the hazard rates are here computed as two-year intervals (0-1, 2-3); the figure would other-wise become rather chaotic and difficult to interpret. A higher relative risk of terminating business related to the youth of firms, a liability of newness, appeared in five cohorts out of seven (cohorts 1899-1930). For these cohorts, it can be observed that the highest risk for termination appeared in Cohort
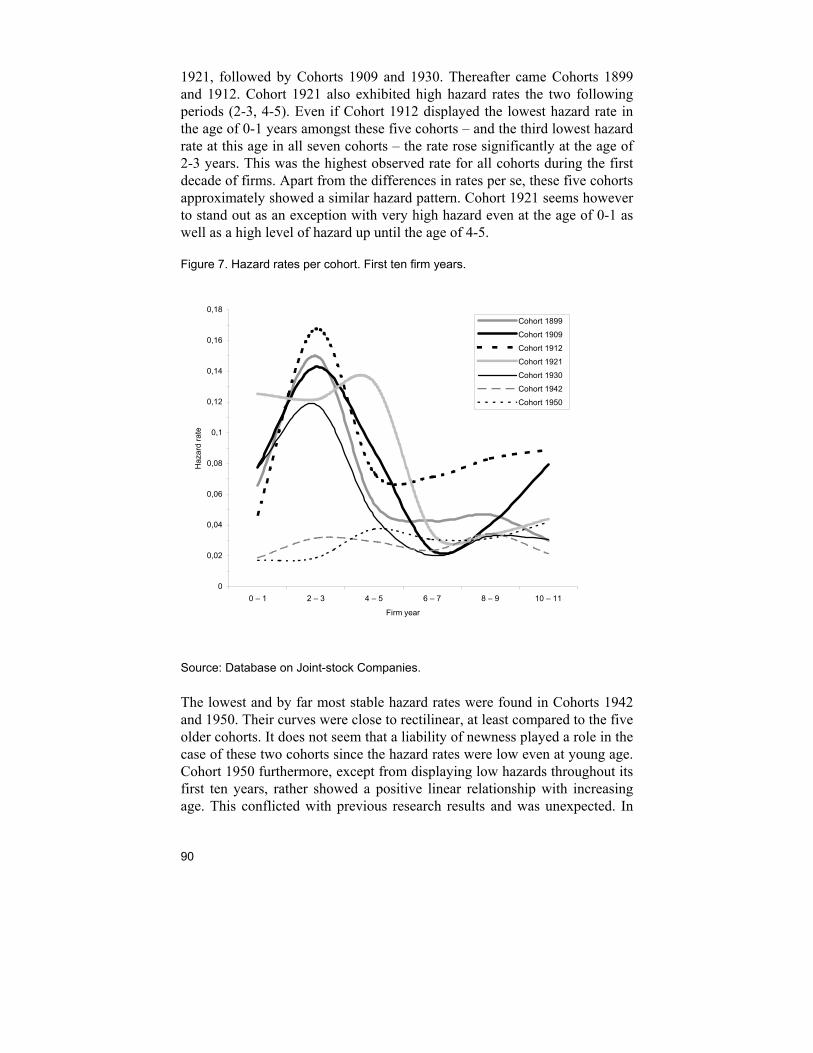
90
1921, followed by Cohorts 1909 and 1930. Thereafter came Cohorts 1899 and 1912. Cohort 1921 also exhibited high hazard rates the two following periods (2-3, 4-5). Even if Cohort 1912 displayed the lowest hazard rate in the age of 0-1 years amongst these five cohorts – and the third lowest hazard rate at this age in all seven cohorts – the rate rose significantly at the age of 2-3 years. This was the highest observed rate for all cohorts during the first decade of firms. Apart from the differences in rates per se, these five cohorts approximately showed a similar hazard pattern. Cohort 1921 seems however to stand out as an exception with very high hazard even at the age of 0-1 as well as a high level of hazard up until the age of 4-5.
Figure 7. Hazard rates per cohort. First ten firm years.
0
0,02
0,04
0,06
0,08
0,1
0,12
0,14
0,16
0,18
0 – 1 2 – 3 4 – 5 6 – 7 8 – 9 10 – 11
Firm year
Haz
ard
rate
Cohort 1899
Cohort 1909
Cohort 1912
Cohort 1921
Cohort 1930
Cohort 1942
Cohort 1950
Source: Database on Joint-stock Companies.
The lowest and by far most stable hazard rates were found in Cohorts 1942 and 1950. Their curves were close to rectilinear, at least compared to the five older cohorts. It does not seem that a liability of newness played a role in the case of these two cohorts since the hazard rates were low even at young age. Cohort 1950 furthermore, except from displaying low hazards throughout its first ten years, rather showed a positive linear relationship with increasing age. This conflicted with previous research results and was unexpected. In
91
particular, the firms in Cohorts 1942 and 1950 had a small start-up size compared to older generations. Hence, neither a liability of newness nor of size seems to be present in these two cases. This verifies the doubts that young firms regularly – regard-less of time and place – exhibit excessive mortality rates due to low age, and that small size further enhances this risk. Such relationships may be exhib-ited on an aggregate level and particularly in cross section data. As has been observed here, there may well be exceptions to the rule. The results here show that separate populations can reveal different levels of hazard when in the same age group. Hence, there were diverging patterns in the ‘termination behavior’ of firms in different generations over time. Some cohorts contin-ued to exhibit relatively high hazard rates at a fairly mature age (1912 and 1921) while for some cohorts, the hazard decreased significantly as they grew older. Others, specifically Cohorts 1942 and 1950, on the other hand showed no indications of higher death risks at young age. The differences discovered here imply that not only age and, possibly, size are important elements in explaining both why, when and to what extent firms are terminated. Cohort as such, the period of birth, may be of equal importance. So may events occurring in the economic environment of co-horts over time.
In Good Times and in Bad: Termination and Macroeconomic Environment Above, it was observed that cohorts generally exhibited different hazard rates and – with exceptions of Cohort 1942 and Cohort 1950 – high hazard rates at young age. It was postulated that, if cohorts would exhibit the same probabilities for termination at the same age there would, firstly, be no dif-ferences between firms of different size and, secondly, no discrepancies in hazard between cohorts. This does not seem to have been the case. The low hazard rates in the younger cohorts could have a plausible explanation in the fact that the general competency to run a business increased over time and that, hence, owner-managers gradually became more skilled than earlier ones. By this, a cumulative learning process would then take place. It is however debatable whether the differences between the very low haz-ards in the two youngest cohorts and the extremely high hazard rates in Co-hort 1921 were caused by a learning process that accumulated competency. High and prolonged hazards in Cohort 1921 over its first five years, com-pared to older cohorts oppose this. Such an assumption is also contradicted by the fact that Cohort 1899 and 1909 revealed lower hazard at the age of 0-1 than the ones established in 1921 and 1930. Furthermore, if large firms generally possess a higher degree of organizational competency (or, for that
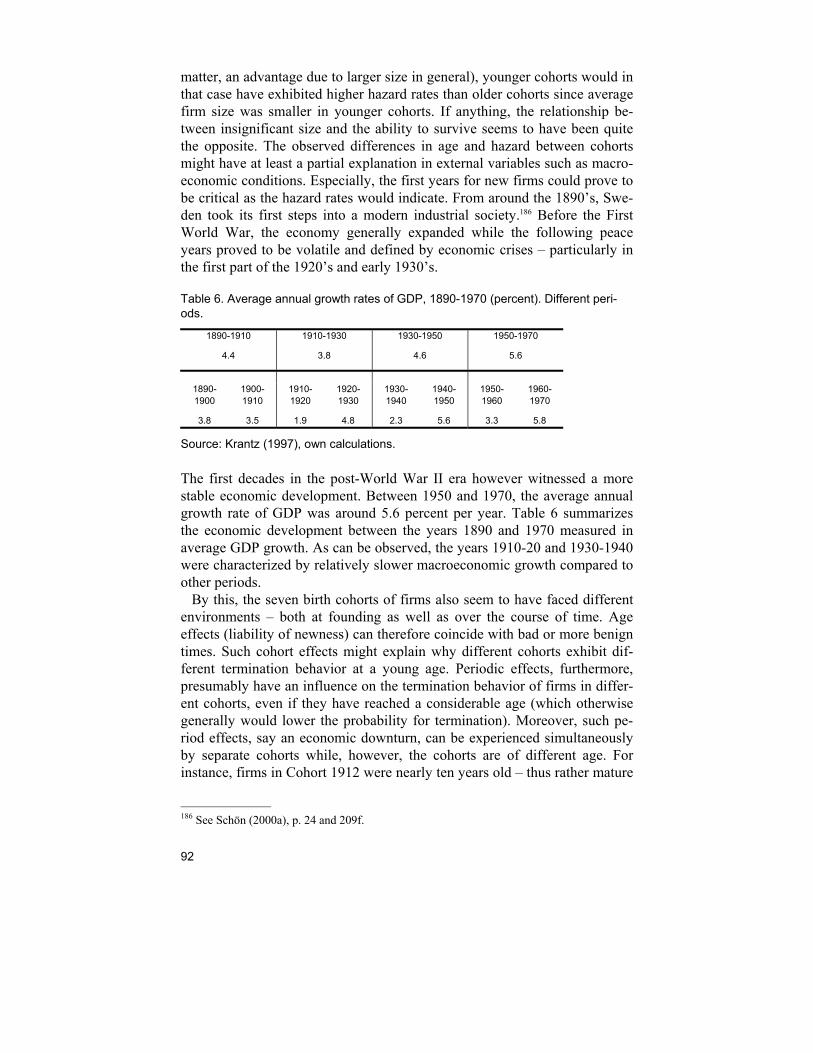
92
matter, an advantage due to larger size in general), younger cohorts would in that case have exhibited higher hazard rates than older cohorts since average firm size was smaller in younger cohorts. If anything, the relationship be-tween insignificant size and the ability to survive seems to have been quite the opposite. The observed differences in age and hazard between cohorts might have at least a partial explanation in external variables such as macro-economic conditions. Especially, the first years for new firms could prove to be critical as the hazard rates would indicate. From around the 1890’s, Swe-den took its first steps into a modern industrial society.186 Before the First World War, the economy generally expanded while the following peace years proved to be volatile and defined by economic crises – particularly in the first part of the 1920’s and early 1930’s.
Table 6. Average annual growth rates of GDP, 1890-1970 (percent). Different peri-ods.
1890-1910 1910-1930 1930-1950 1950-1970
4.4 3.8 4.6 5.6
1890-1900
1900-1910
1910-1920
1920-1930
1930-1940
1940-1950
1950-1960
1960-1970
3.8 3.5 1.9 4.8 2.3 5.6 3.3 5.8
Source: Krantz (1997), own calculations.
The first decades in the post-World War II era however witnessed a more stable economic development. Between 1950 and 1970, the average annual growth rate of GDP was around 5.6 percent per year. Table 6 summarizes the economic development between the years 1890 and 1970 measured in average GDP growth. As can be observed, the years 1910-20 and 1930-1940 were characterized by relatively slower macroeconomic growth compared to other periods. By this, the seven birth cohorts of firms also seem to have faced different environments – both at founding as well as over the course of time. Age effects (liability of newness) can therefore coincide with bad or more benign times. Such cohort effects might explain why different cohorts exhibit dif-ferent termination behavior at a young age. Periodic effects, furthermore, presumably have an influence on the termination behavior of firms in differ-ent cohorts, even if they have reached a considerable age (which otherwise generally would lower the probability for termination). Moreover, such pe-riod effects, say an economic downturn, can be experienced simultaneously by separate cohorts while, however, the cohorts are of different age. For instance, firms in Cohort 1912 were nearly ten years old – thus rather mature
186 See Schön (2000a), p. 24 and 209f.
93
– when the economic crisis of the early 1920’s set in. At the same time, Co-hort 1921 was by all means of infant age in 1921. Hence, the ‘behavior’ of firms can prove to be different, caused by cohort, period as well as age. For the firms in Cohort 1899, the first two years was a period of general industrial and economic expansion. A recession during the years 1901-1902 turned out to be especially harsh in Stockholm. The economy soon recovered and the upswing lasted another six years until another recession occurred. By this time, the new firms in Cohort 1909 faced a macroeconomic slump dur-ing their first years. After 1910, the economy improved and expanded some years into the First World War. Cohort 1912, therefore, seems to have ex-perienced a period of economic expansion during its first years in life. The last war years were however characterized by speculation and by an over-heated economy. So were the two following inflation years in 1919 and 1920. A deep and severe economic depression was the environment that faced the newborns of Cohort 1921. The economic fall was however rather short and ended in 1922, while both the price level was falling and with rig-orous problems for the financial sector. The remaining years of the 1920’s were even so generally signified by macroeconomic revival. Another deep recession occurred in the early 1930’s, which made the firms in Cohort 1930 to initially face a macroeconomic fall in business activity as well as high unemployment. Yet, for the Swedish economy, the recession did not prove to be as severe as in the previous crisis. The economy was improving already in the early 1930’s and the remaining years, up until the outbreak of World War II, was a period of economic expansion. The war years brought about several regulations of business activity and rationing of producer and consumer goods. These remained even after the peace in 1945. The firms in Cohort 1942 were born into times of regulations. After a first drawback in economic activity and fall in aggregate demand 1940 and 1941, the macro economy was recovering. In lack of foreign competition, some industries even expanded during the war. The post-war years witnessed a boom in economic activity. The Korean War, 1950-1953, lead to increasing exports and high inflation rates. From the mid-1950’s, consumption and investments rose significantly. Hence, Cohort 1950 were founded in the be-ginning of an extraordinary economic expansion with few and, in compari-son to the interwar years, less significant slumps in the business cycle. This was an expansion that did not weaken until mid-1960.187 Each separate cohort did therefore, as it seems, face different macroeco-nomic environments: some initially proportionally good years, followed by recession (Cohort 1899), some that faced rougher years (as Cohort 1909).
187 For an overview of the general economic development in Sweden from the late nineteenth Century and onwards, see Dahmén (1950), p. 38f; Jonung (2000); Lybeck (1992), pp. 143-220, and Schön (2000a), p. 223f. For new macroeconomic data and analyses of economic crises 1800-2000, see Edvinsson (2005).
94
For Cohort 1912, the economic conditions were, it could be assumed, ini-tially advantageous while particularly the last years of World War I and the crisis in the aftermath of the war were less benign. Furthermore, and without exaggeration, the early years for the new firms in Cohort 1921 seem to have been particularly severe. An almost similar situation awaited the firms in Cohort 1930 while Cohort 1942 in the beginning faced relatively stable and protected economic conditions, notwithstanding the war situation as such. Finally, firms in Cohort 1950 met a somewhat comparable situation as Co-hort 1942 during the extensive economic expansion of the Swedish post-war economy. Figure 8a describes the termination rates in the three oldest cohorts – 1899, 1909, and 1912 – over a 20-year period per cohort.188 The rates are calculated as the number of firms terminated a specific year in relation to the number of remaining firms in the cohort of interest. As in the case of hazard rates, the figure describes termination rates in two-year intervals. At the age of 0-1 years, around 12 percent of the firms in Cohort 1899 were terminated, while nearly 15 percent were terminated in Cohort 1909 and a little less than nine percent in the generation from 1912. The termination rates reached a peak for all three cohorts when they had achieved an age of 2-3 years. Cohort 1912 reveals a comparatively low ter-mination rate at the age of 0-1 years, perhaps due to the macroeconomic improvement since the downturn in 1908-10. The termination of firms in Cohort 1912 did however intensify significantly during the First World War. If this is an effect of age – i.e. a similar trend as in the two older cohorts when 2-3 years old – or of period (economic recession) is difficult to ap-praise. However, successively decreasing rates over time for the cohorts from 1899 and 1909 did shift into higher termination rates during the war.189 Cohort 1909 in particular were experiencing fierce termination in the early 1920’s; nearly 16 percent of the remaining population vanished during these years. Moreover, the high termination rates in Cohort 1912 continued throughout the remaining war years and over the following period of eco-nomic recession in the beginning of the new decade in spite of increasing age. When the firms in Cohort 1912 had reached an age exceeding five years (from 1917-1918), the termination rates were generally higher than when Cohorts 1899 and 1909 were of corresponding age (1903-04 and onwards; 1913-14 and onwards, respectively).
188 As noted earlier, calculations over longer periods may prove misleading. 189 The increasing rates in particularly Cohort 1899 during and after the war years should probably be read with some caution. The remaining population was quite small and seemingly high rates might prove misleading.
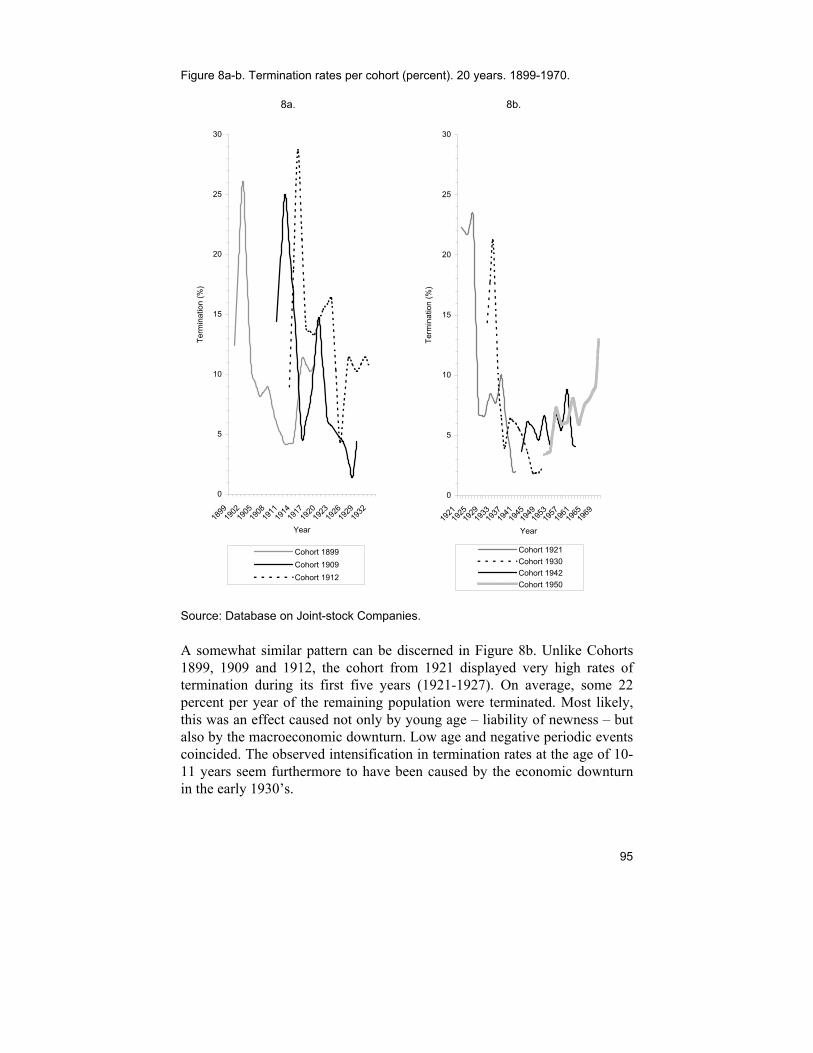
95
Figure 8a-b. Termination rates per cohort (percent). 20 years. 1899-1970.
8a. 8b.
0
5
10
15
20
25
30
1899
1902
1905
1908
1911
1914
1917
1920
1923
1926
1929
1932
Year
Term
inat
ion
(%)
Cohort 1899Cohort 1909Cohort 1912
0
5
10
15
20
25
30
1921
1925
1929
1933
1937
1941
1945
1949
1953
1957
1961
1965
1969
Year
Term
inat
ion
(%)
Cohort 1921Cohort 1930Cohort 1942Cohort 1950
Source: Database on Joint-stock Companies.
A somewhat similar pattern can be discerned in Figure 8b. Unlike Cohorts 1899, 1909 and 1912, the cohort from 1921 displayed very high rates of termination during its first five years (1921-1927). On average, some 22 percent per year of the remaining population were terminated. Most likely, this was an effect caused not only by young age – liability of newness – but also by the macroeconomic downturn. Low age and negative periodic events coincided. The observed intensification in termination rates at the age of 10-11 years seem furthermore to have been caused by the economic downturn in the early 1930’s.
96
Cohort 1930, additionally, revealed a similar pattern of termination as Co-horts 1899, 1909 and 1912 (see Figure 8a), with a peak in termination at the age of 2-3. As in the case of Cohort 1921 it is problematic to determine whether the high rates at young age in Cohort 1930 (1930-1933) could have been caused by low age as such or by the economic recession. It is however clear that the termination rates as such at the age of 2-3 were lower in Cohort 1930 than in Cohorts 1899, 1909 and 1912 even though the rates generally were higher in the former cohort at the age of 0-1 than in the latter ones. It is therefore not unreasonable to imagine that low age and economic recession coincided for the firms in Cohort 1930 although the two variables are diffi-cult to separate. For the succeeding period, a similar difficulty in interpreting the termination rates of Cohort 1930 emerges. Increasing age and economic recovery are related. Higher termination rates can however be observed dur-ing the first years of World War II which, initially, witnessed a macroeco-nomic decline. As noted earlier, the two youngest cohorts in the database exhibited by far the most contradictory patterns of termination when compared to the five other cohorts. Around 3.5 percent in the cohorts from 1942 and 1950 were terminated at the age of 0-1 years. At the age of 2-3, some six percent were terminated in Cohort 1942 while the figure for Cohort 1950 was less than four percent. In these two cases, consequently, young firms did not seem to have a higher risk for termination. This is particularly evident for the young-est generation from 1950, which from the age of 4-5 years actually proved to have (increasingly) higher rates of termination – from around 1954-55 and onwards – than during the age of 0-1 and 2-3 years. The last war years and above all the post-war period were years of exceptional economic growth. In comparison to the five other cohorts, one probable explanation could there-fore be that a protected and regulated economy with a general economic expansion meant a low risk for early termination for new firms. At least, firms that hypothetically ‘should have’ disbanded at an earlier stage (‘should have’ in terms of the observed behavior of older cohorts) were perhaps able to prolong their termination period due to benign environmental circum-stances that were not present for other cohorts. This might be suggested by the fact that even though termination rates generally were low throughout the first twenty years, the termination rates of these two youngest cohorts never-theless showed a nearly positive correlation with increasing age. Even if termination rates on aggregate levels (i.e. the macro biographies) seem to have corresponded with changes in macroeconomic environments, an investigation using firm level data is also possible. Growth in real GDP and the market interest rate were used as indicators for macroeconomic con-ditions.190 GDP growth is here assumed to be an indicator of general demand 190 GDP data is from Krantz (1997). The market interest rate level represents the lowest rate offered by Skandinaviska Enskilda Banken (and predecessors). Data is from Persson (2001).
97
conditions as well as of economic stability. Periods of negative or low eco-nomic growth imply decreasing consumption and investments and a decline in aggregate demand. Strongly fluctuating economic growth rates over peri-ods can in addition lead to intensifications of the termination rates of firms.191 Moreover, high or fluctuating interest rate levels might cool off investments and put demands on firms that have high burdens of debt. It can create uncertainty for economic decisions. Firms could get into financial distress and leave the market. A low or stable interest rate level might there-fore increase firms’ survival chances. Are there reasons to expect different behaviors concerning small and large businesses? In general terms, it might be reasonable to argue in terms of capabilities to survive given scale and scope and given macroeconomic con-ditions. A basic assumption here is that firms with a small stock capital at founding also had fewer or even no employees in comparison to firms started with a larger capital (although there of course may be exceptions). During economic downturns, for instance during periods of low aggregate demand, small-scale entrepreneurs may work harder and continue their busi-ness. Periodically they might reduce or even renounce wage in order to make their business survive. One possible explanation, therefore, is that in small firms, production inputs have fewer alternative uses than in large firms. At least over shorter periods when demand is falling or fluctuating, small firms could possibly well stay in business.192 When times are getting harder, and since there are no alternative uses for labor, small firms will therefore con-tinue. Higher or strongly fluctuating interest rates (or deteriorated lending conditions), however, can represent a credit-crunch for smaller firms. Peri-ods of high interest rates can imply a tightening up of the economy. If small firms’ credit costs rise, highly mortgaged firms or marginal businesses can be terminated. Large firms have, it can be assumed, generally a larger or-ganization, employed personnel and larger fixed costs. Even though large firms that are indebted may be negatively affected by increasing interest rates, their financial strength in terms of solvency is greater than for small firms. Hence, the former may cope with fluctuations in the market interest rate. In times of higher credit costs it may further be un-derstood that large firms have a relative advantage above small businesses 191 For a thorough discussion regarding business cycles and growth, see Zarnowitz (1985), pp. 530-533. 192 See Gratzer (2001a), pp. 168f. Other studies in economic history have proposed similar arguments. For instance, in a study about American tobacco producers in the seventeenth century, Anderson and Thomas found that all tobacco farms without exceptions were small – no producer was in possession of economies of scale. The demand for tobacco was quite unresponsive to price changes (i.e. rather inelastic) while the short-run supply of tobacco was perfectly inelastic: there were no alternative uses for the most important factor of production – labor – which meant that individual planters continued their business to grow tobacco irre-spective of changing market conditions. In the long run, supply of tobacco was perfectly elastic. Anderson and Thomas (1978), pp. 371-374.
98
since large firms are more likely to receive credit (and, it can be assumed, at better conditions) from banks than smaller ones.193 If the demand is falling or is strongly fluctuating, bigger businesses might experience troubles in other ways than small businesses. Large fixed costs in combination with, pre-sumably, reluctance amongst employees to lower their wages might prove large businesses less flexible than smaller ones under such circumstances. But large firms can naturally downsize and they commonly also have greater resources than smaller ones. They may also find alternative uses for their input to a greater extent if economies of scope are present. Therefore, due to a size-advantage they might be able to stay in business longer than small firms. Large firms could thereby theoretically prove to be less ‘flexible’ than smaller ones under volatile or low demand conditions. They may nonetheless also be able to cope with such conditions better than small businesses. How can the termination of firms be tested when including phenomena such as environment and size? Logistic regression is commonly preferred to ordinary least squares regression when the dependent variable is categorial and not continuous. Explained variance (R2) cannot be calculated as in ordi-nary regression; rather, a pseudo-R2 is obtained that explains how well the model fits. In that respect, it resembles an ordinary regression. In logistic regression, the probability – or the odds – that an individual or unit of inves-tigation has a certain status or if it belongs to a certain category, given an independent or several independent variables, is obtained. Odds ratios that are equal (or very close) to one (1) would indicate that an increase in or a certain value of an independent variable has no observable effect on the in-dependent variable. Odds ratios significantly larger or smaller than one, sig-nal that it has an effect – for example, if larger than one it would mean that an increase in an independent variable (holding everything else constant) increases the odds for belonging to a certain category.194 In this context, we are interested in the probability for firm termination, particularly termination at low age. A binary logistic regression analysis was therefore performed in which the dependent variable was represented by early termination. The analysis above using hazard rates showed that termination rates were turbu-lent up to the age of around five years. Thereby, firms terminated before the age of five were coded as 1 (= Yes), while all other was coded as 0 (= No).
193 Helen Manning Hunter’s study over the liquidity of small and large American businesses during and after the Great Depression supports such assumptions. Manning Hunter (1982). 194 An ordinary regression has certain limitations when using categorial data, especially when it comes to estimating probabilities. This is avoided in (binary) logistic regression. For exam-ple: the probability that an individual has a certain status or that a certain event has occurred can vary within the interval zero to one (for instance 0 = No; 1 = Yes). An ordinary probabil-ity model could theoretically predict the probability as larger than one, or smaller than zero; something that is quite unrealistic if an event or status cannot fall below zero or exceed one. A logistic regression analysis is therefore a linear probability model with restrictions. See Edling and Hedström (2003), p. 173ff.
99
Independent variables in the logistic regression were the start-up size of firms, measured as their stock capital at start in fixed prices. Here, size-categories were used, indicating that the fifty percent largest firms were de-fined as large (= 1) while remaining firms were coded as small (= 0).195 Thus, the size-variable is dichotomous. The correlation between the dependent variable and the size-variable is assumed to be negative; expressed in an-other way is it here assumed that the probability for early termination dimin-ished if the firm were of larger size at start (lower odds). Furthermore, by introducing variables that are indicators of macro-environmental conditions in the model it can be tested if firm termination was affected by other factors. Here, GDP change and changes in the interest rate level were employed as independent variables. Since the dependent variable is dichotomous, one question that arises here is how to measure demand and credit conditions. The coefficient of variation was employed. This is a measure of the relative dispersion of a variable, and can be used to calculate volatility. By using for instance the average rate of change over a period (say average GDP growth) would mean that yearly fluctuations are not taken into consideration.196 It is reasonable to presume that a high volatil-ity leads to stronger selection of firms, since smooth and stable periods eco-nomic growth or periods of stable interest rate levels (low volatility) proba-bly involve more stable and secure conditions for firms. In this case, it is assumed that periods of high volatility of the interest rate level and macro-economic growth has a positive relationship with early termination: i.e. the odds for early termination increased if the macro economy were unstable. The coefficients of variance of GDP and interest rate level were calculated for each of the seven cohorts’ first five years, including also the year prior to founding. For instance, the period 1898-1904 is used as an indicator for the first years of Cohort 1899, and so on. Furthermore, interaction terms were also used in order to investigate the combined effect of firm size and environmental variables. Interaction com-monly refers to variables that are added to a model in order to incorporate the joint effect of two independent variables. The effects of separate vari-ables in a model are usually denoted main effects, i.e. the effect of one or several independent variables. The inclusion of interaction variables takes into consideration not only a model with only main effects but also if two independent variables have a combined effect. Thus, an interaction effect
195 Using the period-specific size definition, discussed earlier. 196 Coefficient of variance (cv) = (Standard deviation / Mean) x 100 , Hence, cv is expressed in percentages. See Körner et al. (1984), p. 85. For instance the early 1920’s was a period of recession. In 1921, economic growth was negative while other years during the decade mostly showed positive growth rates even if growth generally was fluctuating significantly. One problem here is therefore that calculations of average economic growth for the period 1920-1925 (for instance) would display rather high positive macroeconomic growth even if com-mon knowledge tells us that the early 1920’s were years of crisis.
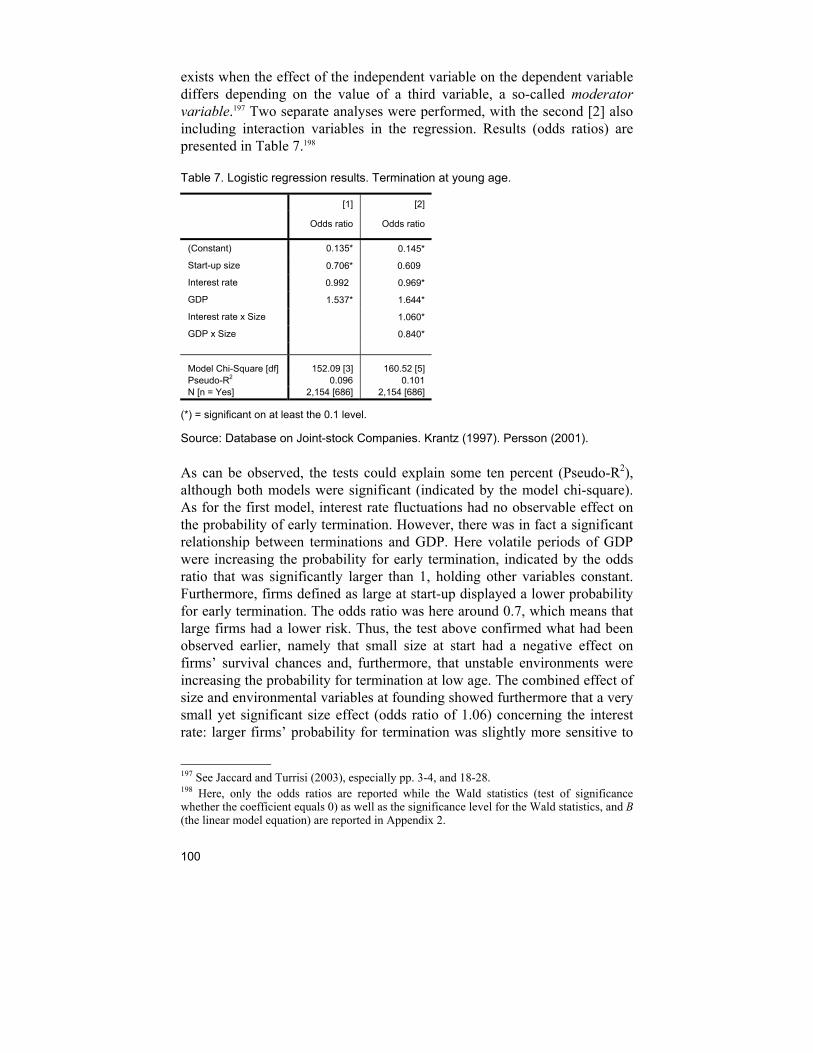
100
exists when the effect of the independent variable on the dependent variable differs depending on the value of a third variable, a so-called moderator variable.197 Two separate analyses were performed, with the second [2] also including interaction variables in the regression. Results (odds ratios) are presented in Table 7.198
Table 7. Logistic regression results. Termination at young age.
[1] [2]
Odds ratio Odds ratio
(Constant) 0.135* 0.145*
Start-up size 0.706* 0.609
Interest rate 0.992 0.969*
GDP 1.537* 1.644*
Interest rate x Size 1.060*
GDP x Size 0.840*
Model Chi-Square [df] 152.09 [3] 160.52 [5] Pseudo-R2 0.096 0.101 N [n = Yes] 2,154 [686] 2,154 [686]
(*) = significant on at least the 0.1 level.
Source: Database on Joint-stock Companies. Krantz (1997). Persson (2001).
As can be observed, the tests could explain some ten percent (Pseudo-R2), although both models were significant (indicated by the model chi-square). As for the first model, interest rate fluctuations had no observable effect on the probability of early termination. However, there was in fact a significant relationship between terminations and GDP. Here volatile periods of GDP were increasing the probability for early termination, indicated by the odds ratio that was significantly larger than 1, holding other variables constant. Furthermore, firms defined as large at start-up displayed a lower probability for early termination. The odds ratio was here around 0.7, which means that large firms had a lower risk. Thus, the test above confirmed what had been observed earlier, namely that small size at start had a negative effect on firms’ survival chances and, furthermore, that unstable environments were increasing the probability for termination at low age. The combined effect of size and environmental variables at founding showed furthermore that a very small yet significant size effect (odds ratio of 1.06) concerning the interest rate: larger firms’ probability for termination was slightly more sensitive to
197 See Jaccard and Turrisi (2003), especially pp. 3-4, and 18-28. 198 Here, only the odds ratios are reported while the Wald statistics (test of significance whether the coefficient equals 0) as well as the significance level for the Wald statistics, and B (the linear model equation) are reported in Appendix 2.
101
interest rate volatility. The larger firms were on the other hand less sensitive to unstable GDP growth periods – here, it does seem that small firms gener-ally were more likely to terminate at low age during volatile macroeconomic conditions. Therefore, even if results are mixed, it seems to have been present, a gen-eral pattern of higher termination risk at low age not only for firms of smaller size but also a probable intensification of this risk when the macro-economic environment was unstable.
Conclusions In this chapter have I focused on a central problem in the study of business behavior, namely the ability of firms to survive. In doing so, I have em-ployed a unique longitudinal database on seven birth cohorts of joint-stock companies, founded in different years in Stockholm during the first half of the twentieth century. Nearly 2,200 companies are included in the database. In academic literature and research, many reasons as to why firms fail or are terminated have been put forward. Our conception(s) of failure would nor-mally contain a supposition that a ‘genuine’ business failure has occurred when there have been losses, or if the firm (or its management) has been inefficient. Such definitions would demand that the researcher is allowed a possibility of viewing each firm that terminates from within – i.e. to look inside the ‘black box’ – in order to determine if a ‘real’ failure has occurred or not. In historical studies, that may occasionally be allowed – such as in business history. This is a research field where a single enterprise or a group of generally large businesses are thoroughly studied. In the case of the seven birth cohorts, most firms were small and anonymous when they started, and they generally maintained that status. We are in these circumstances rarely allowed to catch a glimpse of what goes on inside since, for the most part, no sources are preserved. Furthermore, such an attempt would be difficult to realize since here we deal with nearly 2,200 business firms. Much evidence has however shown that business can continue although they are experiencing difficulties, even if they are textbook failures and are inefficient. For the small-scale entrepreneur, her or his life’s work can be at stake. Therefore, they may put much effort to make the business survive although operating at a loss. I have used all types of exits from each birth cohort as an indicator of termination. Basically, a termination signifies that a firm has exited its birth cohort – without regard for the type of exit (bank-ruptcy, liquidation etc.) or the reasons behind it. Therefore, what has been measured here is a firm’s ability to survive. To take for granted that all ter-minations in the seven birth cohorts were genuine failures – as in inefficient, or as in misallocation of resources – would of course be a very simplistic assumption. Firms disband for many reasons, and likewise firms remain for
102
a number of reasons whether ‘failures’ or ‘successes’. I do however think that the use of the very broad definition of termination rates of firms still can describe under what conditions firms operate. If it is assumed that the major-ity of firms are founded because it is in the interest of their founders or own-ers to run a business, then the main goal of the firm will be to survive. The number of new companies, with some exceptions, seems to have in-creased over the course of time. In 1899, 105 joint-stock companies were founded in Stockholm while a little more than 500 were founded in 1950. Probably, this can be understood as, partly, an increasing business activity in the Swedish economy in an era when the market economy expanded: the total number of joint-stock companies in Sweden increased significantly in the early century. But, even more likely, it also gradually became less costly to start a business in the form of a joint-stock company. It is not unreason-able to assume that the joint-stock company crowded out other forms of business enterprises due to increasingly lower entry barriers. Entrepreneurs with little capital in the early 1900’s were probably confined to use the pri-vate businesses form rather than that of joint-stock companies. In the 1950’s, less capital was needed to start a company. And new firms did in fact in-creasingly become smaller, at least measured in stock capital. It was demon-strated that successively younger cohorts displayed larger shares of firms with a small stock capital at start. For example, in Cohort 1899, around fifty percent of the firms had a stock capital – measured in nominal values – that exceeded 50,000 kr. In Cohort 1921 the figure was around 20 percent, and in Cohort 1950 around four percent of the firms had more than 50,000 as initial stock capital. Furthermore, even if the age distribution of all the 2,154 firms revealed that more firms were terminated at young age – already at the age of four, 25 percent of the firms had disbanded – each cohort’s separate age distribution gave evidence of rather large deviations from the general picture. In the five cohorts founded between 1899 and 1930, a quarter of each cohort’s popula-tion had exited at the ages of 2-3 years. The two youngest cohorts – 1942 and 1950 – had lost an equally large share of firms at the age of ten. Further examples of these diverging age distributions can be seen in the fact that the median age of Cohort 1921 was as low as five years, which can be compared to the median age of Cohort 1942 (24 years). These observations lead to the conclusion that each cohort most likely exhibited different termination behavior. Starting with observing the firms’ behavior on an aggregate level it was here found, in line with much previous research, that the firms in the cohorts exhibited a general liability of new-ness. Hazard rates were higher at young age than when the firms were older. Small and large firms exhibited similar patterns of hazard. However, higher hazard rates were evident for small firms at young age than for large. Over the three first observation years (0-2), small businesses had higher hazard rates. Secondary upturns in hazard for large firms during subsequent years
103
might be explained by that large firms, to some extent, can prolong their termination period due to a size advantage. For the separate cohorts, however, the hazards displayed – as expected, given the different age distributions between cohorts – diverging behaviors. It can be questioned if there is an cumulative learning process that, over time, will lower the death risks amongst populations of firms since business managers learn from the mistakes of previously failed businesses. Such a process might be discernible in single industries, but in the case of the seven birth cohorts fairly low hazard rates in Cohorts 1899 and 1909, high (as well as rather prolonged) hazards in particularly Cohorts 1912 and 1921 and, again, very low hazard rates in the cohorts from 1942 and 1950 contradict such assumptions. Thus, the five oldest cohorts had somewhat similar hazard rates, but the two youngest exhibited hazards that were conflicting with much previous research. They had very low hazard throughout their first ten years. Low age did not seem to increase their hazards. Rather, particularly in Cohort 1950, increasing age even gave some evidence of intensified hazards. Therefore, it is doubtful if the liability of newness is a recurring phenomenon regardless of time and of place. Clearly, the hazards of the two youngest cohorts depart strongly from the common supposition that young firms ex-hibit a larger risk for termination. It is also conflicting with the view that insignificant size will increase the probability for termination. Most firms in Cohorts 1942 and 1950 – at least in comparison to the older ones – were regularly small at start; at least when using an absolute size criterion. The size variable was therefore somewhat problematic. Even if it were established that small firms had higher hazards, a time-span over fifty years showed that firms, the younger they were, had an increasingly smaller start-up size. While it is true that new joint-stock companies gradually were smaller at start, one must perhaps also ask whether or not average firm size in the entire economy decreased. Therefore, one can present the question as to whether or not period-specific measurements (criteria) are preferable to one that does not take into account the factor of time and changes in eco-nomic life and business activity (although such criteria have the risk of sub-jectivity). As stated in the chapter, I do not think that there is an ideal solu-tion to this problem. I do however think that the criteria for determining ‘small’ and ‘large’ not only differs between industries and places but also over time. Thus, I have used period-specific size-criteria when addressing the question of size and termination. Even though age effects generally could reveal to what extent firms were terminated, macroeconomic events here were seen as complementary expla-nations to the termination behavior of firms. When observing the termination rates of firms over time, it was clear that although high termination rates occurred at young age, they seemed to have been intensified by the period as such. As an example, Cohort 1899 had lower termination rates at the age of 0-1 years than Cohort 1909, while Cohort 1912 displayed lower rates than
104
the two older cohorts. We know that the last years of the nineteenth century were economically more prosperous than the recession that occurred from 1908 and, further, that the immediate years preceding the birth of Cohort 1912 were signified by an improvement in the macro economy. Each of these three cohorts exhibited higher termination rates during the First World War, particularly Cohort 1912 that still was of young age at that time. Low age and hostile period effects therefore coincided. Cohort 1921 is, once more, an outstanding example of extended high termination rates. The ‘peace crisis’ in the early 1920’s was severe. This, in combination with in-significant age, did not seem to prove good prospects for survival for its firms. Cohort 1930 is another comparable albeit less obvious example of such circumstances. Its termination rate at the age of 0-1 years (1930-1931) was the second highest of all seven cohorts. Yet, and again, the most deviat-ing termination rates were discovered in Cohorts 1942 and 1950. Regula-tions and a protected as well as growing macro economy characterized the Swedish society from 1941 and onwards. Particularly after the peace, the economy experienced an exceptional expansion. A probable explanation to the low termination rates in the two youngest cohorts might most likely be found in these circumstances. As was observed, termination rates of these two cohorts showed rather a positive correlation over time. A high aggregate demand as well as protections and regulations during and after the war might have made it possible even for less qualified businesses, or for small firms, to stay in business. Hence, a relationship between macroeconomic environment and termina-tion of firms in the seven separate cohorts were identified. Some (alterna-tive) relationships or outcomes concerning termination, firm size and macro-economic conditions were proposed in connection to this. One was that small businesses, due to less or even no alternative uses of factors of produc-tion, might continue operations – at least over some time – regardless of changes in demand. The self-employed entrepreneur will continue, perhaps without economic compensation. Large firms, even if they possess econo-mies of scale and scope and can downsize during harsher times, have on the other hand invested in large fixed assets (i.e. high fixed costs) and have pre-sumably employed personnel that are unwilling to lower their wages. If they lose sales, costs per unit rise. It is furthermore imaginable that large firms have better credit conditions than small firms. For the latter ones, an in-creased interest rate could represent a liquidity squeeze, particularly firms living close to the edge. Hence, they would have to exit. The tests here showed that small firms had a greater probability for early termination than large. Furthermore – and although results were mixed – the economic envi-ronment had an effect on termination. Insecure economic external conditions at founding increased the probability for early termination and, in addition, small firms were generally more sensitive. Consequently, not only structural

105
variables such as small size had an effect on termination rates but also the environment or external conditions. In the same way that human beings can experience the same event or pe-riod, but be affected in many different ways, goes for businesses as well. Here, the database used is heterogeneous, including firms of all industries and sizes. Even if firms from the same cohort experienced the same envi-ronmental events at the same age, it is of course true that some were affected by those events in different ways than others. Therefore, the large quantity of ‘realities’ or circumstances experienced by individual firms and entrepre-neurs over time and in and between periods cannot perhaps be fitted into such simplistic explanations. They rather serve as typical cases on a general level. Events or periods in the economic history could very well be viewed as unique and non-recurrent. In that case, there would be less room for gen-eralizations on what the researcher understands as a common behavior amongst groups of firms. As I have demonstrated here, firms ‘behaved’ simi-larly since they as a rule were terminated at a young age. But cohorts dis-played different behaviors, or termination rates, depending on circumstances at founding and according to events over the course of their lives. Consequently, even in this respect would I like to suggest that there was ‘common behavior’, but from a somewhat different viewpoint that is com-monly suggested in other studies. During harsher times, more firms were terminated than in times of benign conditions. This was true even for firms that had reached a more mature age. Even if this study has not investigated what goes on inside the ‘black box’ I think it is evident that there are forces that operate beyond the scope of the individual firm. Such forces might, as in this case, be changing macroeconomic environments that circumvent the capability for firms to continue operations (while, of course, they also can provide some firms with opportunities). In that respect, not only are the indi-vidual entrepreneur’s or business owner’s capabilities and competency im-portant to include in research but also other factors. For this reason, as has been called for by researchers in entrepreneurship and small business, there is a need for more longitudinal research that can hopefully illuminate the interaction between environment and the (individual) business. The perspec-tive that addresses environmental factors should not exclude or reject indi-vidual or structural-oriented explanations. Rather, the perspectives should be viewed as complementary.

106
107
6. Surviving Firms: Survival and Growth?
Introduction A smaller number of firms from the seven birth cohorts remained in business for a substantial period of time. Even if the selection process, as shown in the previous chapter, was more intense during the businesses’ first years in almost all cohorts – particularly for those of smaller size – nearly one fifth of the entire population of the 2,200 firms survived until the 1990’s. This means that they survived for some fifty to one hundred years. Such firms are perhaps viewed as anomalies in many circumstances since most new ven-tures commonly display considerably shorter life times. These firms will be in focus in the present chapter. The purpose is here to investigate how large these survivors had become, and to explore if it is possible to discover any systematic relationships between their cohort affiliation, start-up size and their size. In many respects the theme in the present chapter concurs with the problem in Chapter 4, namely, the size distribution of business firms.
Size and Survival of Firms Over Time The continuation of small firms has since long been considered in the eco-nomic disciplines. Classical economists and their successors noted the per-sistence of the large number of small firms. This persistence has been stud-ied from various perspectives. Classical, neoclassical, historical and institu-tional theories and models have been used in order to explain these phenom-ena. It has been proposed that the existence of small firms needed not to be explained in any greater extent by Adam Smith. By keeping the economy liberalized most firms would invariably remain small, when at the same time the increasing division of labor in the economy would enhance the size of firms. Smith however utilized the example of a pin factory with around fif-teen employees in describing this phenomenon. This size was probably a quite ‘normal’ size for firms at that time and age (late 18th century). Larger
108
firms were hence unusual, and the problem of ‘large’ and ‘small’ had possi-bly therefore no empirical ground as well.199 Economists after Smith, such as John Stuart Mill and Karl Marx, perceived however in a more explicit way the advancement of larger business units. The division of labor and the industrialization process would make small units obsolete, and they observed and predicted a continuous increase of large organizations in most industries – not only in manufacturing, but also in the retail sector. Small units would accordingly steadily vanish from the economy. For especially Marx, this was an important feature. Small firms could exist and survive, but most likely in newer or younger industries – and only temporarily until larger firms would either drive them out of business or devour them. Finally, in the course of capitalist development, only a few large businesses would remain.200 This was a period of a more mature indus-trial society that witnessed the emergence of large organizations. Thus, economists before the breakthrough of the neoclassical school presented a somewhat dismal view on the small firm; in order to survive the firms must grow.201 From a neoclassical viewpoint, one explanation of the persistence of small firms would be that market imperfections affect the size of firms (e.g. economies of scale, concentration). This might, at a certain observation point in time, leave a market with one or a few firms with economies of scale (large firms) and some with smaller size. Competition will affect firm size: perfect competition restricts the possibilities for firms to reach economies of scale, and is therefore naturally limiting the odds for firms to attain a large size. In that sense firms are not ‘supposed’ to grow, and they do not differ from each other in behavior and in conditions.202 Hence, if there is perfect competition, there are no ‘large’ nor ‘small’ firms, just firms. Following that
199 Larger firms or working sites were, e.g., usually state- or semi state-owned enterprises such as trade companies or shipyards. 200 According to Joseph D. Phillis, Adam Smith did however look with favor on the growing importance of large firms. Furthermore, the obvious persistence of something obvious in everyday life – or the existence of something that soon would become non-existent (i.e. small firms) – can perhaps explain why economists before the neoclassical revolution made no efforts towards a ‘theory of the firm’. See Phillis (1979), pp. 331-340. 201 Later observers were equally surprised over the persistence of small (independent) busi-nesses in developed, modern economies; Dobb (1963/1973), pp. 280-285. 202 See for instance Nelson (1991), p. 64f. Robin Marris has put is as: “In the competitive model of capitalism, firms are neurons of the Invisible Hand… [ ]… neurons are not sup-posed to grow large or directly influence behaviour. [ ] The fact that firms do grow, do be-come large, ... [ ] … is thus one of the keys to explaining the difference between actual capi-talism and the competitive ideal.”; Marris (1971), p. 2. There is a theoretical distinction be-tween internal and external economies of scale: External economies of scale arise when the cost for producing depends on the size of the industry in question, and not on the size of the single firms. Internal economies of scale are the opposite, where the costs depend on the single firm rather that the industry. See also Hart (2000).
109
argument, we would expect firms to exhibit at least approximately the same size. A contractual view of firms and the existence of transaction costs explains the different size of firms not according to economies of scale, as in ‘pure’ neoclassical theory. Here, firms are rather exhibiting different sizes due to transaction costs – costs for concluding and enforcing contracts, costs for administration, search costs, etc. Firms will grow until the costs for allocat-ing activities internally are larger than on the market. The cost curves for firms differ (depending of a variety of factors – internal, industry-specific), and they hence exhibit different sizes.203 Another neoclassical explanation has been that the size distribution of firms, viewed from a macro or aggre-gate perspective, is more or less a random process and that any firm, regard-less of size, has the same chance to grow or decline between two periods of time. This means that a small firm during one observation period has the same likelihood of growing larger in the second observation period, as does a large firm, just as they exhibit equal chances to diminish in size when the next observation is made. The proportionate change in the size of a firm is therefore unrelated to its absolute size.204 By this, we could say that there is no real association between the initial size and subsequent size of firms, and if there is a relationship it would be at least weak. Institutional research has presented a somewhat similar view in line with neoclassical accounts, i.e. that imperfections affect the size distribution of firms. These, in turn, affect the incentive system for economic actors (entre-preneurs, firms), create uncertainty and do not encourage business growth. Here, however, state policy and taxation of businesses are seen more as the real cause in explaining the skewed distribution since there is no proper in-centive system.205 In that sense, however, firms can remain small and survive in a market economy but small firms will, nonetheless, also risk remaining small. Historical or more ‘unique’ explanations (in some sense, of course, con-nected with institutional conditions) have also been presented. The break-through of the industrialized economy in Sweden necessitated large business units, which often were joint-stock companies (whereas smaller or medium-sized businesses usually were of different forms of enterprises such as pri-vate businesses), and many of the largest firms in the economy are also some
203 See Coase (1937), or Cheung (1983), p. 3f. 204 See Simon and Bonini (1958), or Hart (1962), pp. 29-39. 205 Taxes and ‘business climate’ do not promote the growth of especially small firms, and these do not have the opportunities – the proper incentives – to grow and become at least medium-sized firms. Gradually, especially during the postwar period, new firms have had declining opportunities to grow. See discussion in Chapter 4. On corporate/business taxation as such during the last century, see for instance Grosskopf (1976), pp. 40-78; Mutén (1968), pp. 31-36, and Lundström, R. (2001).

110
of the oldest.206 Several of the ‘old’ industrial businesses were active and expansive quite early on the international markets and expanded also by establishing themselves abroad.207 The role of small and large firms has also been characterized by economic historians as an ‘interplay’, where they have had an alternating relationship and have stood out as more important or de-velopment-driving depending on phase of development.208 Historian Jan Glete (1994) has presented a similar explanation, somewhat connected to institutional conditions. It is obvious, according to Glete, that the latest dec-ades have displayed an aging population of large companies.209 By this, it is not necessarily law-like conditions that can explain the rela-tive ‘importance’ and occurrence of large and small firms, but also distinct phases and particular episodes in the economic history, as well as the ‘his-torical fact’ that many of the largest firms have their roots in older times (which most firms in the economy do not have). In that respect, the persistence of the large number of small firms – and the small number of large firms – has had several theoretical and empirical ex-planations. There does not appear to be any clear answer as to the implica-tions of this structure for the economy as a whole. Most developed econo-mies – some with very different market conditions – exhibit a similar size structure of firms.210 In that respect, our perceptions of ‘big’ and ‘small’ could have different meaning depending on time and place. It is therefore interesting to investigate the size of surviving firms from different cohorts that have existed over longer periods. Therefore some basic propositions or
206 Large national projects, such as railroads, canals and power plants, required very large business units (usually in the form of joint-stock companies). Erik Dahmén observed an in-creasing number of self-employed persons from the working class during the mid-war period (non-growing firms; ‘stagnated businesses’), which could be explained by the social and economic development (e.g. the economic crises during the period); Dahmén (1950). Histo-rian Jan Glete has accentuated that only a few of the largest Swedish companies have been founded after World War II, and that the largest companies are rooted in the late 1800s or early 1900s. See Glete (1994). 207 See Lundström, R. (1992), on early Swedish multinationals, and Palmer (2001) on the expansion of Swedish transnational firms such as ABB, Ericsson and Sandvik. 208 Jörberg (1961), p. 151f. 209 Few newly founded businesses have become large after the 1960s. The central explana-tions to this are according to Glete first and foremost a general starvation of the small busi-ness sector (due to structural obstacles), the internal culture of businesses (a somewhat negli-gible use of the stock market for financing further expansion when it comes to new firms), and, finally, that the large supply of new firms has not matched available risk capital on mar-kets. See Glete (1994). 210 Robert Lucas has put it as: “[…] in wealthy economies, ‘bigness’ is widely viewed as a menace against which government activity should, perhaps, be directed; in poor economies, ‘littleness’ is often viewed as a sign of backwardness to be dealt with by government policy.”; Lucas (1978), p. 508. During the 1960s, e.g., a higher relative share of small firms in an econ-omy was seen a sign of backwardness. Today, the view is somewhat the opposite, and a large proportion of self-employed persons is nowadays viewed as an indicator of progress and economic prosperity. See Lindh and Ohlsson (1997).
111
earlier observations could be used when observing and addressing the em-pirical results. One of them is based on classical economists and especially Marx, and would state that the remaining firms in the seven cohorts after the long time that had elapsed from their birth to the last decade of the 20th Cen-tury had become large units in comparison with firms in general, or at least in comparison with young firms. In that respect, no or only a minor share of firms with small size among the old firms (cohorts) would be discovered. We would also notice that increasingly older firms were larger in size, since firms by necessity have to become large in order to survive. Additionally, based on assumptions of perfect competition, the empirical material would give evidence of firms of at least approximately equal size. This does however not seem reasonable since many empirical findings have given evidence of a skewed size distribution, and since the state of perfect competition nearly does not exist on any market (at least to my knowledge). One explanation could, of course, be the existence of imperfect markets. There are no ways to account for this phenomenon in this study since we do not have the accurate means for measurement, nor the means or data for investigating the size of firms according to transaction costs. One further aggravating factor is that the survivors, just as the firms in the seven cohorts in general, were in different industries and thus heterogeneous. If, however, firms are rational and profit maximizing actors, and if there are market ‘imperfections’ in the real economy (which most likely has been the case throughout the economic history), they would nonetheless have seized any opportunity to become larger. Accordingly, surviving firms must to some extent have been more efficient than firms from the same generation that have terminated, i.e. have been weeded out, and we would expect them to be larger than the average firm. Yet another assumption would concern the size distribution and age of firms, as noted above. Firms with a small initial size would have the same opportunity to become larger, as would a firm with a large initial absolute size (and vice versa; the process is here viewed as rather stochastic). If this holds true, it would not be surprising to find that there is either none or only a very weak relationship between the start-up size of firms and their later size. Thus, while I am aware of the long period of time that has elapsed be-tween observation periods, an investigation might nonetheless give some interesting research results and raise some question as regards the growth of long-standing business units.
Surviving Firms from Seven Cohorts, 1990 to 1999 Available data from UpplysningsCentralen (UC) and Affärsdata have been utilized in the search for surviving firms. Additionally, information from
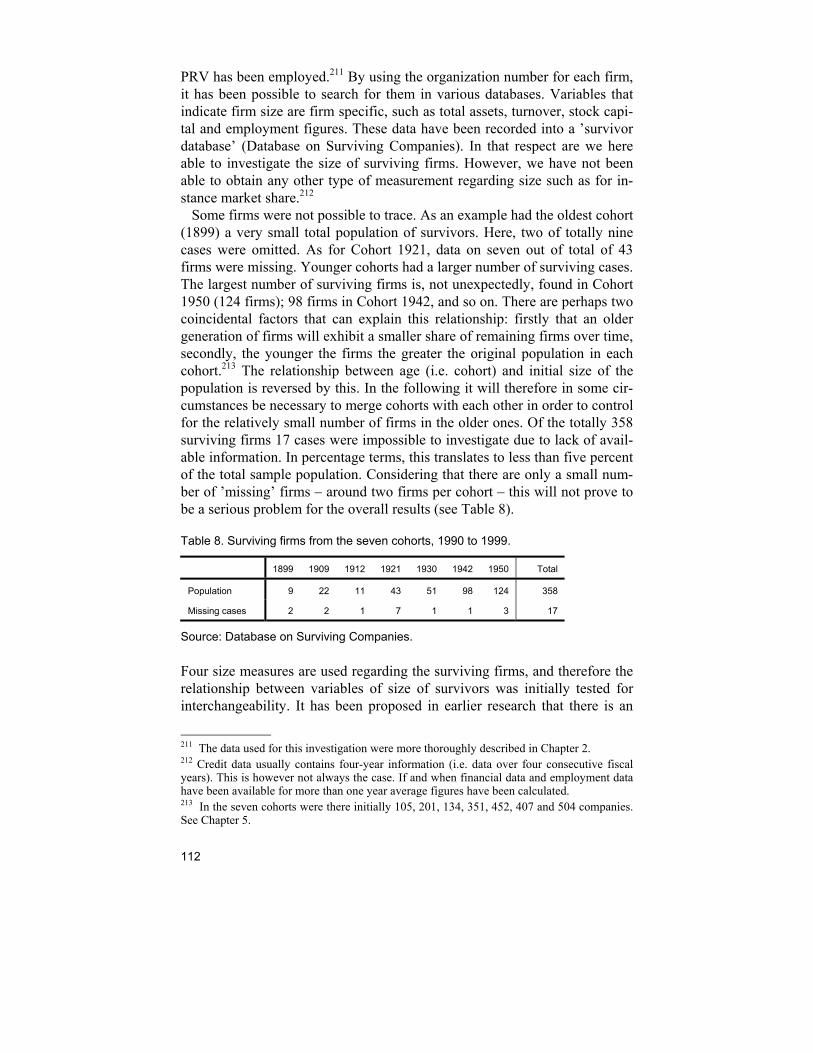
112
PRV has been employed.211 By using the organization number for each firm, it has been possible to search for them in various databases. Variables that indicate firm size are firm specific, such as total assets, turnover, stock capi-tal and employment figures. These data have been recorded into a ’survivor database’ (Database on Surviving Companies). In that respect are we here able to investigate the size of surviving firms. However, we have not been able to obtain any other type of measurement regarding size such as for in-stance market share.212 Some firms were not possible to trace. As an example had the oldest cohort (1899) a very small total population of survivors. Here, two of totally nine cases were omitted. As for Cohort 1921, data on seven out of total of 43 firms were missing. Younger cohorts had a larger number of surviving cases. The largest number of surviving firms is, not unexpectedly, found in Cohort 1950 (124 firms); 98 firms in Cohort 1942, and so on. There are perhaps two coincidental factors that can explain this relationship: firstly that an older generation of firms will exhibit a smaller share of remaining firms over time, secondly, the younger the firms the greater the original population in each cohort.213 The relationship between age (i.e. cohort) and initial size of the population is reversed by this. In the following it will therefore in some cir-cumstances be necessary to merge cohorts with each other in order to control for the relatively small number of firms in the older ones. Of the totally 358 surviving firms 17 cases were impossible to investigate due to lack of avail-able information. In percentage terms, this translates to less than five percent of the total sample population. Considering that there are only a small num-ber of ’missing’ firms – around two firms per cohort – this will not prove to be a serious problem for the overall results (see Table 8).
Table 8. Surviving firms from the seven cohorts, 1990 to 1999.
1899 1909 1912 1921 1930 1942 1950 Total
Population 9 22 11 43 51 98 124 358
Missing cases 2 2 1 7 1 1 3 17
Source: Database on Surviving Companies.
Four size measures are used regarding the surviving firms, and therefore the relationship between variables of size of survivors was initially tested for interchangeability. It has been proposed in earlier research that there is an
211 The data used for this investigation were more thoroughly described in Chapter 2. 212 Credit data usually contains four-year information (i.e. data over four consecutive fiscal years). This is however not always the case. If and when financial data and employment data have been available for more than one year average figures have been calculated. 213 In the seven cohorts were there initially 105, 201, 134, 351, 452, 407 and 504 companies. See Chapter 5.
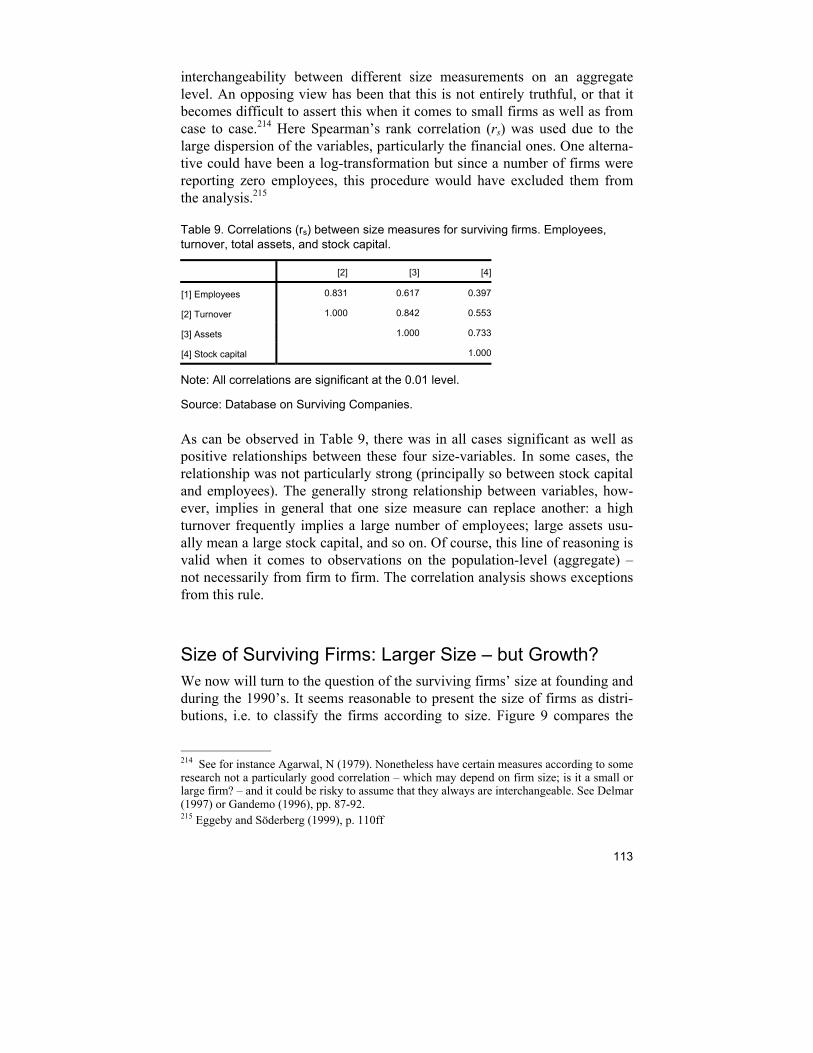
113
interchangeability between different size measurements on an aggregate level. An opposing view has been that this is not entirely truthful, or that it becomes difficult to assert this when it comes to small firms as well as from case to case.214 Here Spearman’s rank correlation (rs) was used due to the large dispersion of the variables, particularly the financial ones. One alterna-tive could have been a log-transformation but since a number of firms were reporting zero employees, this procedure would have excluded them from the analysis.215
Table 9. Correlations (rs) between size measures for surviving firms. Employees, turnover, total assets, and stock capital.
[2] [3] [4]
[1] Employees 0.831 0.617 0.397
[2] Turnover 1.000 0.842 0.553
[3] Assets 1.000 0.733
[4] Stock capital 1.000
Note: All correlations are significant at the 0.01 level.
Source: Database on Surviving Companies.
As can be observed in Table 9, there was in all cases significant as well as positive relationships between these four size-variables. In some cases, the relationship was not particularly strong (principally so between stock capital and employees). The generally strong relationship between variables, how-ever, implies in general that one size measure can replace another: a high turnover frequently implies a large number of employees; large assets usu-ally mean a large stock capital, and so on. Of course, this line of reasoning is valid when it comes to observations on the population-level (aggregate) – not necessarily from firm to firm. The correlation analysis shows exceptions from this rule.
Size of Surviving Firms: Larger Size – but Growth? We now will turn to the question of the surviving firms’ size at founding and during the 1990’s. It seems reasonable to present the size of firms as distri-butions, i.e. to classify the firms according to size. Figure 9 compares the
214 See for instance Agarwal, N (1979). Nonetheless have certain measures according to some research not a particularly good correlation – which may depend on firm size; is it a small or large firm? – and it could be risky to assume that they always are interchangeable. See Delmar (1997) or Gandemo (1996), pp. 87-92. 215 Eggeby and Söderberg (1999), p. 110ff
114
size distribution, expressed in percentages, for surviving firms with all Swedish joint-stock companies with the purpose to observe any differences between businesses that have survived for a longer period of time with an ‘average’ picture. The latter category includes all joint-stock companies ac-tive in all industries.216 Other types of businesses, such as private businesses or partnerships, are thus excluded since their inclusion would distort the comparison; private businesses, e.g., are rarely large firms and if all firms but joint-stock companies are excluded we therefore probably receive a more correct population for comparative purposes.217 The firms were categorized into five different size groups for the four variables employees, turnover, assets, and stock capital. The distribution of all joint-stock companies is first examined. This was asymmetrical as expected and reveals that the proportion of smaller firms was greater than that of larger ones. This particular size distribution was additionally contrasted with a younger population of companies. Companies that were approximately five years old, founded during 1996, were selected from available data (Affärsdata and UC) in order to observe if there were any differences between young firms and the entire population of joint-stock companies.218 The reason for this was that older or very old firms are inher-ently included in the total population of companies. If there would be any significant differences – say, that a population of young firms exhibits a higher share of small firms –this might imply that a comparison between the surviving firms is better done with a population of young firms. The differ-ences in size distributions between the total stock of joint-stock companies and companies with an age of approximately five years showed however no significant deviations. The differences could generally be measured on only a 0.01-digit level. In that respect, the total population of joint-stock compa-nies is probably an approximately useful ‘reference’-group.
216 Data concerns the year 2000/2001. Affärsdata and UC. 217 See for example Dan Johansson’s study (1997). Here are all types of firms – joint-stock companies, private businesses, partnerships and limited partnerships – included. Hence, a higher frequency of small firms (measured as employees) is received. 218 The data on five-year old firms (founded between 1 January and 31 December 1996) was obtained from Affärsdata.
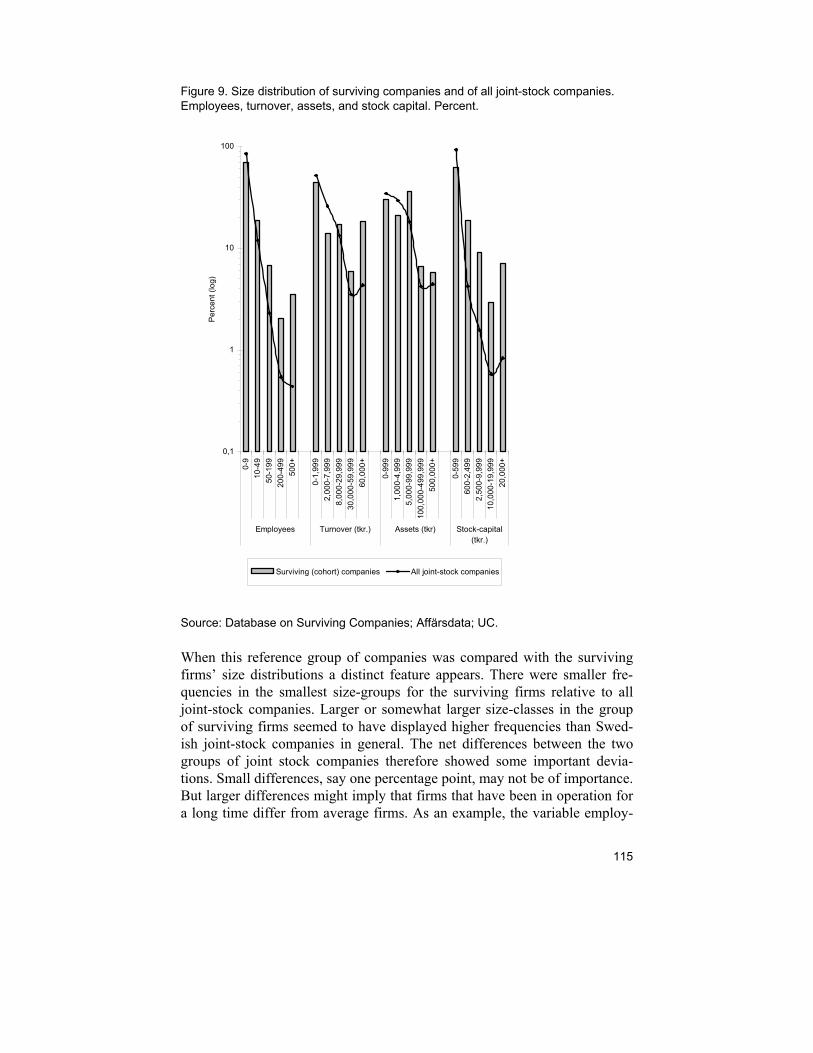
115
Figure 9. Size distribution of surviving companies and of all joint-stock companies. Employees, turnover, assets, and stock capital. Percent.
Source: Database on Surviving Companies; Affärsdata; UC.
When this reference group of companies was compared with the surviving firms’ size distributions a distinct feature appears. There were smaller fre-quencies in the smallest size-groups for the surviving firms relative to all joint-stock companies. Larger or somewhat larger size-classes in the group of surviving firms seemed to have displayed higher frequencies than Swed-ish joint-stock companies in general. The net differences between the two groups of joint stock companies therefore showed some important devia-tions. Small differences, say one percentage point, may not be of importance. But larger differences might imply that firms that have been in operation for a long time differ from average firms. As an example, the variable employ-
0,1
1
10
100
0-9
10-4
950
-199
200-
499
500+
0-1,
999
2,00
0-7,
999
8,00
0-29
,999
30,0
00-5
9,99
960
,000
+
0-99
91,
000-
4,99
95,
000-
99,9
9910
0,00
0-49
9,99
950
0,00
0+
0-59
960
0-2,
499
2,50
0-9,
999
10,0
00-1
9,99
920
,000
+
Employees Turnover (tkr.) Assets (tkr) Stock-capital(tkr.)
Per
cent
(log
)
Surviving (cohort) companies All joint-stock companies
116
ees differed considerably between the survivor firms and the general distri-bution. Here, there was a net difference of more than 15 percentage points in the smallest size-group. The surviving firms hence exhibited a large ‘deficit’ of firms with zero to nine employees compared with companies in general. Significant differences also appeared in larger size groups. Surviving firms were appearing in larger size-groups and they generally displayed a surplus of firms in larger groups to a greater degree. There were for instance nearly eight times more firms with 500 or more employed in the survivor group than among companies in general. This pattern was furthermore rather con-sistent as concerns other variables. In total, the comparison between the surviving firms and all Swedish joint-stock companies gave a picture of long-standing firms that were commonly larger than the cross section of companies. This difference was evident con-cerning all four variables of size, and is therefore an important discrepancy. Significant differences also appeared when controlling for other factors. During the construction of the database firms were classified according to the categories independent units or subsidiaries. This information was avail-able for 331 out of the totally 358 cases included in the study (missing cases around 7.5 percent).219 It could be of interest to observe the size of surviving firms with respect to this relationship. Results show that the largest firms were those that were subsidiaries, i.e. firms that not were independent (Table 10). The average number of employees reveals that subsidiaries had more than double the figure of employees than the other category. The mean value is however sensitive to extremes. We can observe that while ‘independent’ firms had a median employee value of two, the value for subsidiaries was four, and the third quartile (P75) in the distribution shows that while non-subsidiaries had eight employees, subsidiaries had 35. Quite large differ-ences were also detected for the other variables when we compare the two categories of firms with a similar relationship; for instance non-subsidiaries had considerably smaller stock capital than the other group.
219 Of the cases that had available information, 53 percent of the firms had non-subsidiary status, and 47 percent were subsidiaries. Database on Surviving Companies.
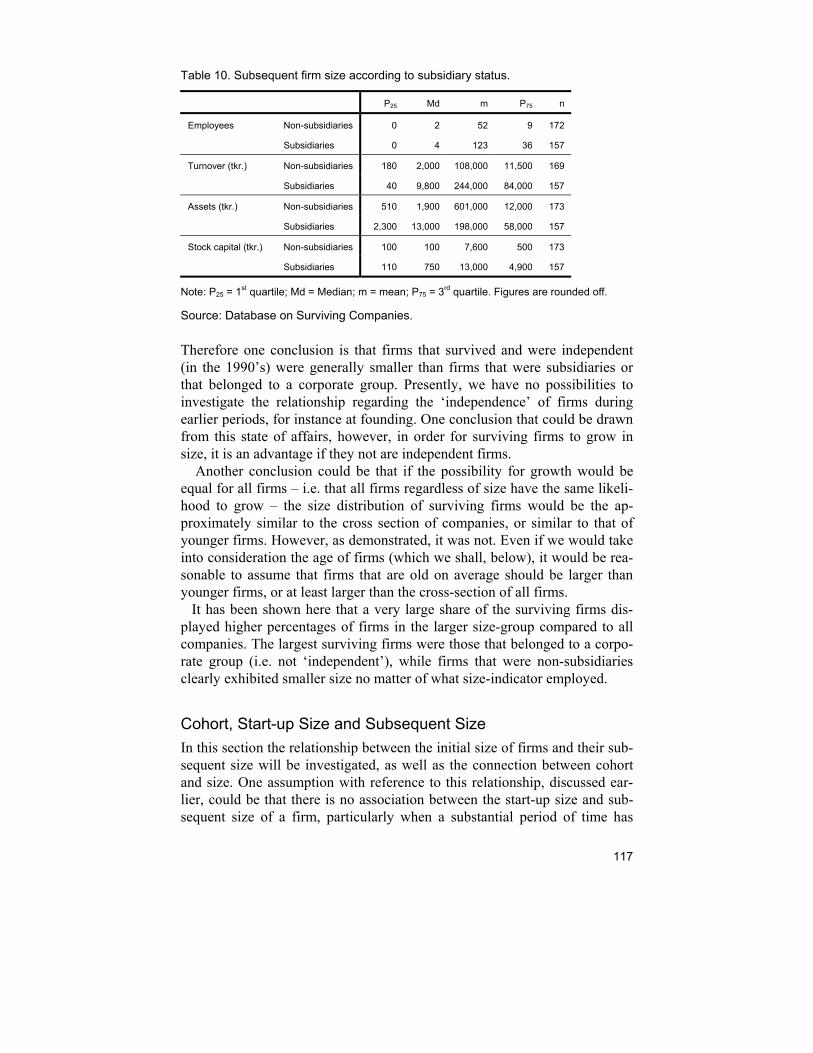
117
Table 10. Subsequent firm size according to subsidiary status.
P25 Md m P75 n
Employees Non-subsidiaries 0 2 52 9 172
Subsidiaries 0 4 123 36 157
Turnover (tkr.) Non-subsidiaries 180 2,000 108,000 11,500 169
Subsidiaries 40 9,800 244,000 84,000 157
Assets (tkr.) Non-subsidiaries 510 1,900 601,000 12,000 173
Subsidiaries 2,300 13,000 198,000 58,000 157
Stock capital (tkr.) Non-subsidiaries 100 100 7,600 500 173
Subsidiaries 110 750 13,000 4,900 157
Note: P25 = 1st quartile; Md = Median; m = mean; P75 = 3rd quartile. Figures are rounded off.
Source: Database on Surviving Companies.
Therefore one conclusion is that firms that survived and were independent (in the 1990’s) were generally smaller than firms that were subsidiaries or that belonged to a corporate group. Presently, we have no possibilities to investigate the relationship regarding the ‘independence’ of firms during earlier periods, for instance at founding. One conclusion that could be drawn from this state of affairs, however, in order for surviving firms to grow in size, it is an advantage if they not are independent firms. Another conclusion could be that if the possibility for growth would be equal for all firms – i.e. that all firms regardless of size have the same likeli-hood to grow – the size distribution of surviving firms would be the ap-proximately similar to the cross section of companies, or similar to that of younger firms. However, as demonstrated, it was not. Even if we would take into consideration the age of firms (which we shall, below), it would be rea-sonable to assume that firms that are old on average should be larger than younger firms, or at least larger than the cross-section of all firms. It has been shown here that a very large share of the surviving firms dis-played higher percentages of firms in the larger size-group compared to all companies. The largest surviving firms were those that belonged to a corpo-rate group (i.e. not ‘independent’), while firms that were non-subsidiaries clearly exhibited smaller size no matter of what size-indicator employed.
Cohort, Start-up Size and Subsequent Size In this section the relationship between the initial size of firms and their sub-sequent size will be investigated, as well as the connection between cohort and size. One assumption with reference to this relationship, discussed ear-lier, could be that there is no association between the start-up size and sub-sequent size of a firm, particularly when a substantial period of time has
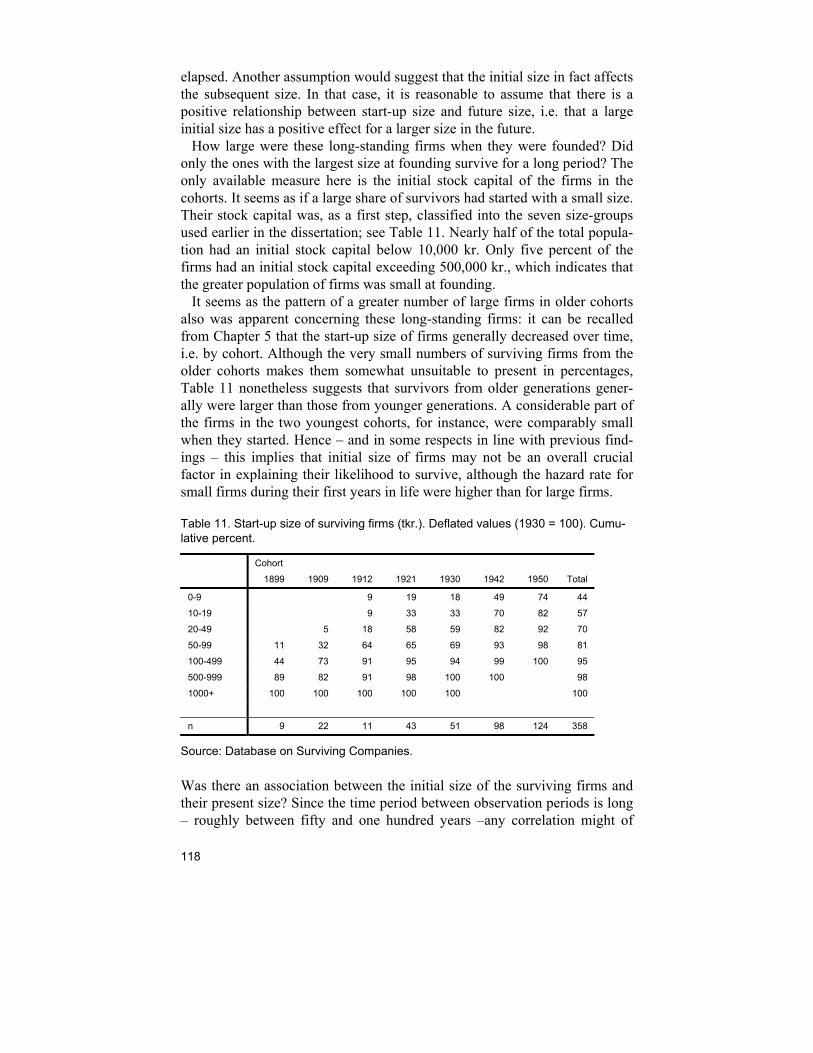
118
elapsed. Another assumption would suggest that the initial size in fact affects the subsequent size. In that case, it is reasonable to assume that there is a positive relationship between start-up size and future size, i.e. that a large initial size has a positive effect for a larger size in the future. How large were these long-standing firms when they were founded? Did only the ones with the largest size at founding survive for a long period? The only available measure here is the initial stock capital of the firms in the cohorts. It seems as if a large share of survivors had started with a small size. Their stock capital was, as a first step, classified into the seven size-groups used earlier in the dissertation; see Table 11. Nearly half of the total popula-tion had an initial stock capital below 10,000 kr. Only five percent of the firms had an initial stock capital exceeding 500,000 kr., which indicates that the greater population of firms was small at founding. It seems as the pattern of a greater number of large firms in older cohorts also was apparent concerning these long-standing firms: it can be recalled from Chapter 5 that the start-up size of firms generally decreased over time, i.e. by cohort. Although the very small numbers of surviving firms from the older cohorts makes them somewhat unsuitable to present in percentages, Table 11 nonetheless suggests that survivors from older generations gener-ally were larger than those from younger generations. A considerable part of the firms in the two youngest cohorts, for instance, were comparably small when they started. Hence – and in some respects in line with previous find-ings – this implies that initial size of firms may not be an overall crucial factor in explaining their likelihood to survive, although the hazard rate for small firms during their first years in life were higher than for large firms.
Table 11. Start-up size of surviving firms (tkr.). Deflated values (1930 = 100). Cumu-lative percent.
Cohort
1899 1909 1912 1921 1930 1942 1950 Total
0-9 9 19 18 49 74 44
10-19 9 33 33 70 82 57
20-49 5 18 58 59 82 92 70
50-99 11 32 64 65 69 93 98 81
100-499 44 73 91 95 94 99 100 95
500-999 89 82 91 98 100 100 98
1000+ 100 100 100 100 100 100
n 9 22 11 43 51 98 124 358
Source: Database on Surviving Companies.
Was there an association between the initial size of the surviving firms and their present size? Since the time period between observation periods is long – roughly between fifty and one hundred years –any correlation might of
119
course be misleading; the businesses may have grown, diminished and re-grown over the years. Nevertheless it could be interesting to see if there is at least an indication of a relationship. Table 12 reports the percentage distribu-tion of this association, using three size-specific groups for the dependent and independent variables,220 and shows an image of some ‘stability’ in size over time. It must be emphasized that the categorizations here are somewhat arbitrary and that alternative groupings may show a different picture. Even so can it be observed that firms that had started in the smallest group tended to remain mainly in the smallest group at the second observation. Take, for instance, the size of stock capital at the second observation period: an absolute major-ity (88 percent) of firms that had started with a capital of less than 50,000 kr. were in the smallest size-group in the 1990’s and had a capital below 2.5 million kr. This figure diminishes among larger start-up sizes. Of those firms that had started with more than 500,000 kr., in this respect the largest size group, ‘only’ a quarter of them were in the smallest group at the second ob-servation. Instead, a relative majority of these firms – nearly 50 percent – were in the group of firms that had a stock capital exceeding 20 million kr. in the 1990’s. Similar tendencies are also found for the other size variables: those firms that had started on a relatively smaller scale tended to be smaller than others from the same population. Correlations of the firms’ initial size and their size at the second observation period, when using firm-level data, revealed additionally somewhat weak yet significant correlations.221
220 The dependent variables employees, turnover, assets and stock capital were classified according to Figure 9. 221 For example the Spearman rank correlation coefficient (rs) was nearly 0.3 between the initial size of the stock capital and stock capital in the 1990’s. Other variables displayed both significant as well as much weaker associations with the start-up size of firms, but generally there were positive relationships: a larger size at start was positively correlated with subse-quent size even if the strength of association generally was weak. Spearman’s rank correlation (rs) gave the following results as concerns the relationship between business initial size and subsequent size measured, in order, as employees; turnover; assets, and stock capital: -0.002; 0.080; 0.178, and 0.290. The first two were not significant (n.s.) and the latter significant (sig.) on least at the 0.001 level. Pearson’s correlation (rxy) showed somewhat similar results: 0.178 (sig.); 0.245 (sig.); 0.009 (n.s.), and 0.245 (sig.). Database on Surviving Companies.

120
Table 12. Start-up size and size in 1990/99. Percentage distribution.
Stock capital at start (tkr.)
-49 50-499 500+
Employees -49 91 84 56
50-499 7 11 25
500+ 2 5 19
(241) (83) (16)
Turnover (tkr.) -7,999 63 51 31
8,000-59,999 23 27 13
60,000+ 15 22 56
(239) (82) (16)
Assets (tkr.) -9,999 64 52 25
10,000-499,999 33 40 38
500,000+ 3 8 38
(242) (83) (16)
Stock capital (tkr.) -2,499 88 72 25
2,500-19,999 8 20 31
20,000+ 4 9 44
(242) (82) (16)
Note: Number of observations (n) in parentheses.
Source: Database on Surviving Companies.
Even though the relationship is not entirely obvious and even if different measures are used in the correlations (and even if there obviously were ex-ceptions from the overall picture) this nonetheless raises some questions as regards the long-term growth of businesses that have managed to survive. One of them is whether surviving firms had really grown or generally had remained in the ‘same’ size or size-group over time. Given the long time period that had elapsed between observations this systematical relationship was somewhat unexpected. This relationship, in turn, may tell that firms do not exhibit the same opportunity to become larger (or smaller) no matter of their initial size. On the contrary it seems as if a small start-up size tended to result in a small subsequent size, and vice versa. This result is to some extent also confirmed by previous research (see Vesterlund et al. 1998): there is quite much ‘stability’ in firms’ development patterns.222 So far it has been established that firms that survived were not necessarily large at start. Several of the survivors were small at start. It was further de-tected a somewhat weak yet observable tendency for a positive association between their initial size and subsequent size. Can we then see any detect-able pattern between the size of survivors after a long period of time and their cohort affiliation, i.e. age? It would be reasonable to assume that older 222 Vesterlund et al. (1998) showed that firms in various size-classes in 1988 mostly had remained in the same classes when followed up in 1996/97, i.e. over nearly ten years.
121
firms should have a larger size than younger firms if time as such positively affects the possibilities to become larger. It would furthermore be reasonable to detect such a picture due to the findings above: there was a general asso-ciation between the size of firms at start and their subsequent size. And it was additionally shown that older firms that had managed to survive on the whole had had a larger size at start and that survivors that belonged to younger cohorts generally had started on a smaller scale. This is confirmed to some extent in Figure 10. Here, three categories of age were used, classifying the cohorts into prewar, interwar and postwar cohorts respectively. Particularly the small number of firms in the three old-est cohorts made this procedure necessary.223 The size groups employed in Table 10, furthermore, were used in dividing the businesses into ‘small’, ‘medium’, and ‘large’ firms. For instance small firms as regards employees were those with less than 50 employed while large firms had more than 500 employees. If the age of firms would positively affect their subsequent size it could be expected that the population of the oldest firms (i.e. the oldest cohorts) ex-hibits the smallest share of small firms, and vice versa. The distribution would in this case become skewed, leading to higher percentages of small firms in younger age groups. This suggests a high upper tail, and small fre-quencies in the lower tail of the distribution. For medium firms it is reason-able to assume a distribution that approximately resembles a normal curve – a smaller percentage in the oldest and youngest age groups, and a higher frequency in the age groups between. Finally, large firms would be most frequent in the oldest size-group, hence a mirror image of the distribution of small firms. This picture was partially confirmed in the empirical material. Generally the younger cohorts – the postwar cohorts – had larger shares of small businesses while older cohorts, preferably the prewar cohorts, dis-played higher frequencies of large firms. Exceptions were nonetheless de-tected, and no size variable showed exact distributions as assumed above.
223 This categorization was also employed in Chapter 5. Cohorts 1899-1912 were defined as prewar cohorts; Cohorts 1921 and 1930 as interwar cohorts, and Cohorts 1942 and 1950 as postwar cohorts.
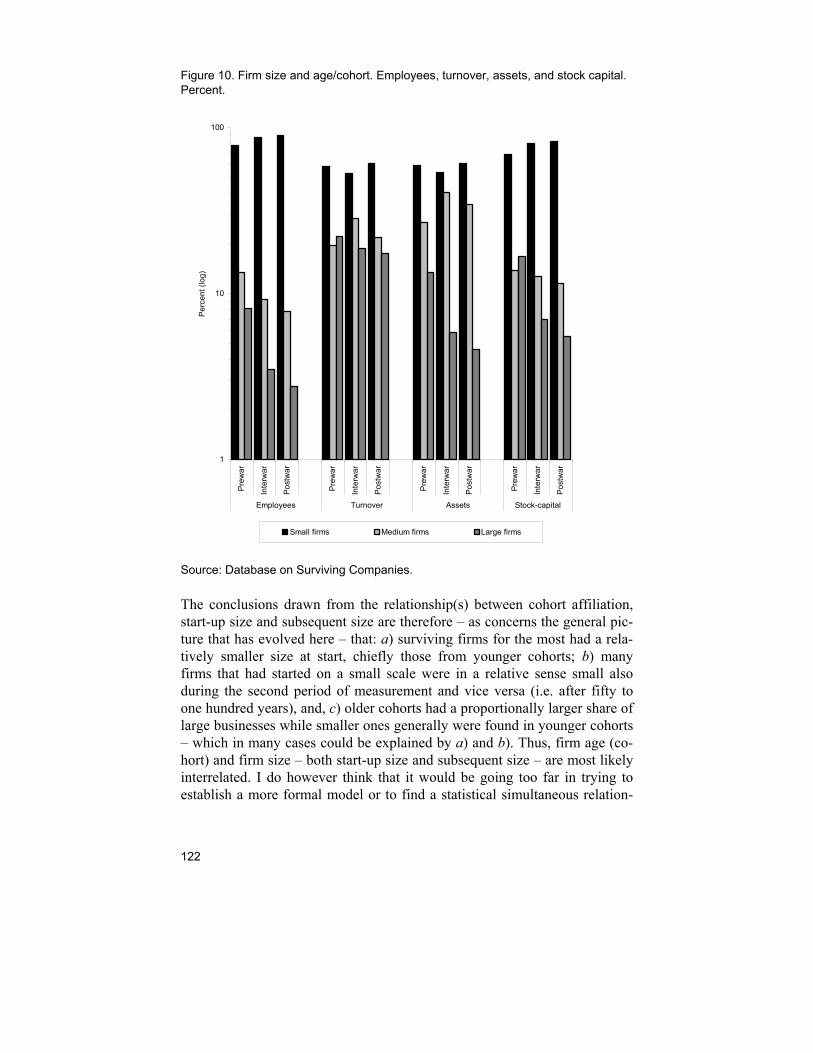
122
Figure 10. Firm size and age/cohort. Employees, turnover, assets, and stock capital. Percent.
1
10
100
Pre
war
Inte
rwar
Pos
twar
Pre
war
Inte
rwar
Pos
twar
Pre
war
Inte
rwar
Pos
twar
Pre
war
Inte
rwar
Pos
twar
Employees Turnover Assets Stock-capital
Per
cent
(log
)
Small firms Medium firms Large firms
Source: Database on Surviving Companies.
The conclusions drawn from the relationship(s) between cohort affiliation, start-up size and subsequent size are therefore – as concerns the general pic-ture that has evolved here – that: a) surviving firms for the most had a rela-tively smaller size at start, chiefly those from younger cohorts; b) many firms that had started on a small scale were in a relative sense small also during the second period of measurement and vice versa (i.e. after fifty to one hundred years), and, c) older cohorts had a proportionally larger share of large businesses while smaller ones generally were found in younger cohorts – which in many cases could be explained by a) and b). Thus, firm age (co-hort) and firm size – both start-up size and subsequent size – are most likely interrelated. I do however think that it would be going too far in trying to establish a more formal model or to find a statistical simultaneous relation-
123
ship between these three variables – for this, a more comprehensive and larger material would be necessary.
Discussion and Concluding Remarks This chapter has had an overall aim to trace the 358 surviving firms from the seven cohorts that survived over a long period of time. It has been possible to study some 340 of them. In that respect only a very small percentage (less than five percent) was omitted in the study. ‘Survival’ has here been defined in legal terms: that is, the legal status of business unit at least at some point in time between 1990 and 1999. In that respect, the firms have had up to one hundred years to develop and to grow. As was accounted for in this chapter, a majority of firms had not become large in any significant terms. Many of the surviving firms had, during the period 1990/99, a fairly small size. In a relative sense, smaller firms were more numerous than larger ones in the survivor sample. In comparison to a cross section sample of joint stock companies obvious differences appeared. It is quite clear that firms were larger in the survivor sample than when comparing a cross section of com-panies. In that respect, firms that were older were, in some respects, gener-ally larger. At least the observed frequencies would imply this state of af-fairs. The size distribution of surviving firms approximately resembled any other size distribution (such as the above-mentioned cross-section). When I took into consideration the start-up size of the firms, a relationship was discov-ered between the initial size (measured as stock capital) and the subsequent size. First, a large share of firms had started with a tolerably small size. Sec-ond, there was a correlation between a firm’s start-up size and its subsequent size, in particular those from younger cohorts. It did not seem reasonable to assume a negative relationship, but rather that either a positive or zero-relationship would be present. Although the period between measurements was long (and without any measurements in intervening periods, which is acknowledged as a weakness), I nevertheless found a relationship between these two variables: firms with a small start-up size tended to maintain that size during the next observation period (1990/99), and, similarly, a large start-up size meant continuous large size. It would of course be desirable to be able to correlate the same variables with each other, e.g. employees at start with present employee force, and so on. There was however a general interchangeability between measurements of size (which also was tested here). Here it was furthermore recognized that the size of firms was affected by their status as subsidiaries or non-subsidiaries. Firms that had a parent com-pany were larger than ‘independent’ firms. Although we know nothing re-garding the entire history of ownership and related matters for the surviving
124
firms, my results suggest that there is a smaller possibility to become larger if a firm is ‘independent’. For Edith Penrose (see Chapter 3), it is the inter-nal, organic growth of firms and its processes that are in focus, not external growth through mergers and acquisitions. Penrose asserts, however, that a reasonable conclusion is that firms that have grown externally generally will be larger than firms that have grown organically (due to the costs and prob-lems for organic growth). Furthermore, Penrose emphasizes that smaller, ‘independent’ firms might reach a point where it is better to sell to another (larger) firm rather than to continue to grow organically. This might be an explanation as to what we have seen here, even though we – with the present design of the database – cannot state that for sure. This is nevertheless an important future research question. And much of the small business literature that aims at studying firm growth has often focused on internal, organic growth in independent firms. My results suggest that firms with a subsidiary status have, at least in the long run, obtained an average size that is larger than the size of independent firms. Perhaps too much attention in research has been put on the growth of the small share of single organizations that exhibit fast growth.224 Furthermore, if as it is claimed in much of the small business literature, small firms on average exhibit higher growth (or growth rates) than larger firms, it however does not seem as though the small firms generally grew more – in absolute terms – than larger ones. It seems on the contrary that large firms in the cohorts ‘remained large’, and that small firms ‘remained small’. A large size might not be strategically important for survival, and therefore it probably becomes quite insignificant in this respect even if there is of course some uncertainty around this problem. My results show, how-ever, that in order to become large during subsequent periods it is an advan-tage to be large at start. Following that, it also seems that the fact of becoming larger or smaller is not a ‘random process’. Economists have for instance proposed that all firms, regardless of size, may have the same opportunity to grow and to con-tract regardless of size. My results demonstrate, as noticed, that the initial size of firms affected their subsequent size. I have however conducted a total investigation over different cohorts that have experienced different cyclical and political conditions, and this suggests that the results cannot be treated as insignificant. One interesting discussion could of course be whether the ‘growth behavior’ of firms has changed over time, during the course of the period of interest (that is, 1899-1999). For this, we have no answer. We know that Swedish businesses were expanding – thus growing – heavily abroad (with large foreign direct investments) by the turn of the last century.
224 A somewhat similar view is expressed by Davidsson and Delmar (2001), pp. 109-111. It is here rather the aggregate picture that is of interest, as well as renewal in the business sector.
125
The size of the surviving firms might therefore be an effect, or result, of cohort (i.e. age). A somewhat vague relationship was also observed: the older the firms in the survivor sample, the larger they were. There were of course exceptions to this rule. Here I proposed that if older firms generally were larger than are younger firms (as with the comparison with the cross-section of firms), lower frequencies of small firms would be found in older cohorts. These frequencies would gradually increase the younger cohorts we observed. It was furthermore proposed that medium-sized firms would exhibit something resembling a normal curve, i.e. the highest frequencies in interwar cohorts and the lowest frequencies in the oldest and in the postwar cohorts. Rela-tively higher frequencies of large firms would appear in older cohorts and lower frequencies in younger cohorts. What were the results? Quite obvi-ously, when attending to large firms and cohort affiliation, there was to some extent a relationship between age (cohort) and the percentages of large firms. At least the distribution suggests a relationship between cohort and number of large firms. A more indiscernible pattern could be observed for medium-sized firms, and for small firms. Some exceptions could therefore be found. One explanation as to why the older firms (cohorts) generally exhibited higher frequencies of large firms can be institutional (not, however, institu-tional in the sense of the institutional explanations to the asymmetric size distribution): joint-stock companies founded at the turn of the previous cen-tury were commonly larger in both scale and scope compared with compa-nies founded later on. The size of required stock capital was 5,000 kr. be-tween the period of investigation and 1975/77. With respect to the deprecia-tion of the currency it gradually became less costly to found a joint-stock company, and, as we have seen, there was an association between start-up size and subsequent size, which in turn would explain why there was a larger number of large companies in older cohorts. For classical economists and above all Marx the small firm would gradu-ally become obsolete in the evolution of capitalism and with increasing divi-sion of labor. In order to remain on the market – i.e. to survive – firms would have to grow. At last, the economy would be characterized by a few mo-nopolies. In that respect, we would expect to find that the firms generally would be large, and no firm would be small. The findings in this chapter do not support this view, but these results are however by no means new. The classical standpoint, in which we would find a positive relationship between cohort and size, is however to some degree given a case here. The notion of monopolies for economists such as Mill and Marx, nevertheless, was that there would be a few large monopolies, and no other firms. It is perhaps not inaccurate, however, to describe the market structure of today as monopoly-like or monopolistic markets in many aspects. There are some few very large firms, and many small firms that probably quite often are ‘dependent’ as
126
subcontractors. This asymmetric dependency that has emerged was some-thing that these economists did not predict. In neoclassical theory, the equal opportunity to grow for any firm at any point in time has been a common feature. Perfect competition will keep firms at approximately ‘equal’ size (however measured), and market imper-fections will lead to economies of scale and, probably, monopolies. It is from my viewpoint not particularly fruitful to discuss the problem in terms of perfect competition (since almost no market is characterized by it). More-over, we do not know if the large firms in the survivor sample possess economies of scale (as defined in theory) or if there have been or are internal or external economies of scale. The surviving firms are not, and have not been, active in the same industry – we recall that the database is heterogene-ous in this respect. If, however, the firms that have survived have been more efficient than the firms from their own generation that failed (which were weeded out), we would perhaps expect that they – rational, profit-maximizing actors – have grown large or at least larger than other firms. If the surviving firms were de facto more efficient than the other firms of their generation (something about which we have no information), they have ap-parently not seized the opportunity to grow: it was more common for the survivors to exhibit a relatively larger share of small firms than the cross-section of joint-stock companies. The existence of transaction costs, it is claimed in theory, holds that firms will grow up to a certain limit. This limit is reached when an additional (marginal) allocation measure is less costly to realize externally than within the firm. If most of the firms here had not grown (which I assert), one inter-pretation would in that case be that the firms in question have not had any requirements to change their size over the years. In that case, the market has not ‘demanded’ that the firms must grow or reduce their size. This must re-quire a situation where the transaction costs have been constant over time, and where the firms – rational and profit-maximizing units – therefore have not grown or contracted. It is however not realistic to assume that the trans-action costs for surviving firms – and therefore market conditions – have not changed during the twentieth century. On the contrary have there probably been constantly changing conditions for firms that have survived for a long period of time, both industry-specific, political, and so on. If we would prefer an institutional and historical explanation as to why the older firms on the average are larger than younger ones, we might say that during the second half of the 20th century, there was an increasing tax pres-sure. Hence, the relatively higher share of small firms amongst Cohorts 1942 and 1950 can be explained by the fact that they have not had the opportunity to grow as older cohorts (since the older cohorts did not experience the same negative climate for business during their first years). If so, historical and less law-like events might equally explain the differences between cohorts. Nonetheless the age, or cohort factor in itself might also explain why firms
127
in the younger cohorts have higher frequencies of small firms. In that re-spect, the classical explanation of the possibilities of firms may be of value. A historical explanation as to why older cohorts generally exhibited larger shares of large firms might also be that the oldest firms usually are the larg-est firms in the economy. Glete (1994) has for instance suggested this. Busi-nesses founded after the 1960s have not become as large as the older firms in the economy. The large firms here are considered to be rooted in the ‘old’ industrial era, which takes into consideration the industrialization process as such, with its distinct phases (the second industrial revolution, for instance). In my opinion, we cannot really say if this is truly the case. The formation of large Swedish businesses took place during the turn of the last century. In that case, the age of firms, i.e. that younger firms generally are smaller than older firms just because they are younger, becomes somewhat less im-portant as an explanatory variable. For this would we need more coherent longitudinal data. The hypothesis that we can interpret the results from a real, historical or unique, less law-bound perspective might be true to some extent, but it might also be that time (age) in itself is an influential variable. These are two competing hypotheses. But even the proposition that age of firms affect their size, does not hold entirely. Since there were exceptions, the suggestion that we would find more larger firms in older generations is therefore challenged when we observe the surviving firms in the cohorts. There is of course some sort of randomness as to why in some cases there was not a strong or observable relationship between age and subsequent size. There could evidently also exist some randomness between the survivors’ start-up size and present size, or – for that respect – between the survivor sample and a cross-section sample of all joint-stock companies. The pattern is however rather clear, and the long-term growth and size of long-standing firms is perhaps an issue that has to be investigated more thoroughly. As implied here it does not seem as though large size, or for that matter, increas-ing size over time, is a necessary requirement for survival.

128
129
7. Growth of Firms: Age, Size, Environment
Introduction The aim of the present chapter is to investigate the growth of firms, using longitudinal data that covers more than 400 joint-stock companies founded in 1912 and 1930. While Chapter 5 studied the termination of businesses in seven birth cohorts, the present chapter will study the opposite side of the problem, namely growth. The precise intention is to study firm growth and effects of environmental-related factors. For instance, were firms growing and contracting as the macro economy changed? If so, were there any differ-ences between businesses of different size and age? Where possible, each firm in the two birth cohorts has had its development ‘re-created’ in line with the source situation. It is here a unique database in which each firm is traced longitudinally (year-by-year) over the course of its lifetime. In some cases it contains firm level data over a thirty-year period for individual businesses. Here, there are totally nearly 6,600 observation years in the database. While the birth cohorts from seven different years were specifically chosen because they were founded under different envi-ronmental conditions, the choice of Cohorts 1912 and 1930 is based on the same assumptions. On the whole, Cohort 1912 went through two World Wars and two severe depressions as well as times of prosperity. Its first years were defined by stability and relative prosperity. Cohort 1930, on the other hand, was born into a period of crisis and depression, then experienced a more stable and growing economy from the mid-30’s and, thereafter, World War II. Hence, there were different founding conditions for the firms in the two cohorts. Additionally, the two cohorts also experienced the same events and environment but at different ages: in the early 1930’s, Cohort 1912 was relatively mature while Cohort 1930 was a newborn cohort. Thus, the depression in the early 30’s and the effects of World War II were experi-enced by the surviving firms from both cohorts. A longitudinal, long-term perspective hopefully can be helpful in analyzing the relationship between firm growth and environmental conditions. If anything, it may be difficult to investigate such links when using short-term cross section data.
130
On Firm Growth: As Larger and Older, the Smaller Their Growth Much business growth literature and research has acknowledged observed growth of firms as being dependent of the size and age of firms. For instance the size of firms – e.g. their start-up size – has been viewed as influential in explaining how much they grow in the future. A general consensus is that small firms grow more (faster) than large firms. Furthermore, the growth rates of surviving firms decline not only with size but also with increasing age. A small firm exhibits higher growth rates at a young age, while the same firm (if it manages to survive and grow larger) will have diminishing growth rates over time. A young large firm, consequently, will have smaller growth rates than the young small firm, and, accordingly (if also this firm survives), lower growth rates than the old small firm over the course of time. Hence, it has been claimed that ‘stylized results’ show that there is a gen-eral pattern that a) growth rates are higher for smaller enterprises, and b) growth rates are higher for younger enterprises.225 One view has however been that the size of firms and their growth rates are unrelated, referred to as Gibrat’s law, or the Law of proportionate effect. Here, growth of firms is seen as independent of size and implies that a large firm just as a small one can exhibit negative or positive growth in the next period(s). Therefore, there is no association between, say, the start-up size of firms and their subsequent development. Among other things, these relationships have been employed in analyzing market structures.226 In addition, the argument that small firms grow faster than larger ones has regularly been put in connection with debate concerning the extent to which small businesses contribute to economic growth and the creation of (new) job opportunities, thereby becoming a matter for economic policy measures. Overall, there have been two main views on the matter. One side has claimed that small firms – or, more specifically a smaller share of small firms – con-
225 See Audretsch (2002), p. 18, or Evans (1987a; 1987b), and Storey (1994), especially p. 137 ff. 226 Hannan and Freeman (2000), p. 314 ff for an overview; see also Sutton (1997) . Others have claimed that although small firms have e.g. higher relative growth rates than large firms, indicating a negative relationship between growth and size, absolute size at a specific period in fact is positively correlated with the start-up size of firms or their size during a previous period. A small young firm may, according to this, naturally grow faster than a large young firm in a relative sense since small changes of size might have large effects on the growth rate as such if the firm is small. Going from 1 unit (start-up size) to 2 (subsequent size) is growth by 100 percent, while a change from 4 to 6 is growth by 50 percent. Four is however more than one to begin with. Furthermore, in the latter case, absolute growth is larger (two units compared to one unit). And, as can be seen, the initially small firm is still small in the second period compared to the other firm. It is also frequently claimed that ‘historical’ growth rates are positively correlated with future growth rates. Firms that grow one period generally con-tinue to do so in the future; for a discussion of firm growth and ‘continued entrepreneurship’, see Davidsson (1989) and Wiklund (1998).
131
tribute significantly to economic prosperity since they grow faster than both larger ones and the majority of new and small firms. For instance a body of research claim that a small part of new (small) firms create the lion’s share of new jobs.227 Others have been more skeptical and occasionally claimed opposite patterns. For example, Davis et al. (1996) came to the conclusion that large firms were more important in job creation than small ones. In addi-tion, many studies often fail to acknowledge that small firms also have a higher failure rate than larger businesses.228 Similar arguments are found in studies that maintain that it is not only a minor share of (new) small firms that create genuinely new jobs. Rather, the overall entry of and marginal growth in a very large number of micro firms add up to significant effects on aggregate levels.229 (Nonetheless, such assumptions/dichotomies might risk neglecting another aspect, namely the lessening autonomy of small firms in modern production systems. Thus, small firms’ strong dependency on larger ones is probably an important factor; the behaviors and decisions of large businesses probably affect the life, growth and death of smaller units to a great extent.) Apart from the influence of age and size on the degree and timing of firms’ growth, much attention has been laid on the influence of ‘entrepreneurial variables’. Examples of such variables are the business owner-managers’ background, education, motivation and their attitudes to growth and expan-sion.230 Studies that analyze the significance of technology, innovations and industry differences, as well as the role of institutions, legislation, bureauc-racy, and taxes have also been increasingly given focus.231 It is quite com-mon to use a set of the above-mentioned variables in the study of firm growth. It therefore seems that the main interest has been in exploring the above-mentioned age-size relationship and/or entrepreneurial personalities (individual-oriented explanations) along with some other independent vari-ables such as the businesses legal form(s), their industry affiliation and so on, in order to test if and how much they affect firm growth.232 Cross section data have been frequently used in much research and, fur-thermore, the time period studied is generally a few years. A smaller number
227 See Birch (1987) and Storey et al. (1987), p. 131ff. Thereby, research has frequently made attempts in ‘picking the winners’, i.e. what firms are likely to grow or fail, which firms gener-ate new jobs, etc.? Consequently, the question has additionally become rather political. 228 Davis et al. (1996), p. 312, found that their research results “clash sharply with conven-tional wisdom about the job-creating prowess of small business”. 229 Davidsson and Delmar (2001), pp. 84-85. 230 See for instance Davidsson (1989), Cooper et al. (1994), Wiklund (1998), and Davidsson et al. (2002). 231 See Audretsch (2002), pp. 18-23, and Davidsson and Henrekson (2002). 232 For instance Delmar et al. (2003) used 21 independent variables (ranging from firm age and firm size to types of ownership, geographical location of firms, their legal form etc.) in a study over firm growth.
132
of studies has aimed at introducing longer periods and using longitudinal data. Therefore, although f the relationships between the age and size of firms described above have received much attention, there is little knowl-edge of these relationships over longer periods of time. Surviving firms can, it has been claimed, grow, contract and resume growth.233 What could be the consequences of research designs that use cross sectional data and, addition-ally, rather short observation periods? One is, that it could turn out to be problematical to observe or apprehend an assumed influence of environ-mental conditions or change. As has been established in many research con-texts, if young firms grow faster than old firms, will their growth rates, for example, over a two or three year period be an effect of (or be amplified by) fluctuations in the macro economy or of institutional change? Additionally, if cross section data is employed, firms of all ages are included in the sam-ple. Hence, even though the units of observation in a statistical sense share a common attribute such as the same age, they may quite probably have been founded during different periods (years). In that case, they have experienced different environmental conditions at start and in that respect there is a prob-lem in separating age and size effects from environmental ones. Further-more, cross sectional data is usually imprinted with survival bias, meaning that firms that have been closed down are not included in a cross section data set. Thus, even if we in the cross section could control not only for the age of firms but also for the time in which they were founded (as a birth cohort), firms that have belonged to but exited this cohort in an earlier period are excluded from the data. Any possible effects of external factors, such as period effects, could of course be measured, but without including all firms from the birth cohort.234
Growth of Firms and Their Environment Although the relationships between the age and size of firms (described above) have received much attention, there is probably little knowledge on the growth of surviving firms over longer periods of time. Additionally, even if some of the explanatory variables used as determinants of or explanations to firm growth can be said to be external or exogenous (such as institutions, taxes, technology), there seem to be fewer studies that have actually sought to elucidate such relationships. Furthermore, even fewer have investigated whether e.g. fluctuations in the macro economy have an observable effect on firms’ growth rates over time. Boeri and Bellmann (1995) have among oth-ers acknowledged that it is a necessary requirement to address such issues since the bulk of research has focused mainly on structural determinants such as innovative activity etc. Their explanation of this state of affairs is 233 Vinell and Hamilton (1999). 234 A discussion is found in Hagenaars (1990), and in Chapter 2.
133
that there are few long time-series available and that effects of environment generally become difficult to investigate.235 Some previous research have therefore tested or at least indicated that the growth of firms might be affected by macroeconomic change. Environ-mental-related phenomena have been acknowledged by some social scien-tists as significant in explaining when, why and to what extent firms and organizations are founded, grow and are terminated. Other schools have been more sceptical towards the overall assumption that structural con-straints and environment affect the behavior of firms and ascribed more im-portance to individual leaders and managers,236 while another body of re-search has played down the significance of general external conditions as such, for instance business cycle conditions, in explaining firm growth or come to the conclusion that such conditions play a lesser role.237 It seems furthermore that other research has viewed real events or macroeconomic conditions as more or less ‘disturbing’ elements in formal models on firm growth.238 ‘Business conditions’ or ‘entrepreneurial environments’ could, further-more, judging from previous research and literature, theoretically include nearly an infinite number of factors. There probably does not exist a man-ageable body of definitions on which there is some common agreement. For instance, Gnyawali and Fogel (1994) has described it as: “… while the role of environmental conditions in developing entrepreneurship has been recog-nized, most of these studies have been fragmented, highly descriptive, and focused on only a few aspects of the environment”.239 ‘Environment’ is consequently a broad conception and represented by a spectrum of factors that range from general economical, socio-cultural and political factors in an economy, down to economic cycles; technological conditions and change; industry specific or regional circumstances and dif-
235 Boeri and Bellmann (1995), p. 484. 236 Skeptics have for instance meant that there are often enormous differences in the ’quality of life’ of surviving ventures; managers or entrepreneurs can and do influence the perform-ance of particularly young and small firms. Some grow while ”others languish as small firms, surviving, but barely clinging to life.”; Eisenhardt and Schoonhoven (1990), p. 504. 237 Bartelsman et al. (2003) found for instance that observed effects in post-entry growth amongst surviving firms could only partly be explained by statistical technicalities or business cycle conditions. 238 For instance Evans (1987b) seems to deliberately exclude periods signified by macroeco-nomic depression when analyzing the relationship between business growth, age and size. Such an approach reminds of macroeconomic theories of growth: some neoclassical growth theories assume that factors such as labor supply and technology are exogenously given, while newer endogenous growth theories have tried to include phenomena such as human capital, knowledge and R&D as well as other assumptions than merely perfect competition and homogenous firms. See for instance Romer (1994) for an overview. 239 Gnyawali and Fogel (1994), p. 43.
134
ferences; wage levels, or as another example, down to different policy meas-ures for certain types of businesses. Both in theory and research, it is at any rate presupposed that social, cul-tural and economic environments in an economy is important for the forma-tion, survival and growth of firms. Some research has analyzed venture level events and outcomes, and the effects or gains of such events at a more ag-gregate/societal level. Others have rather departed from a macro-environmental level and analyzed the consequences for micro level events and behavior.240 Investigations of effects of micro level events on the macro level have for instance tried to identify the (types of) firms that generate genuinely new job-opportunities in an economy, or effects of entry and exit rates of firms.241 Inversely, investigations of environmental effects on firm behavior have for example focused on start-up processes and new venture creation. Here it has been assumed that benign entrepreneurial environments stimulate the formation of new firms and give incentives to potential entre-preneurs to start a business (and, in many cases, also assumed that increasing start-up activities generally are favorable to aggregate economic perform-ance).242 Others have studied firms’ ability to survive in relation to environ-mental conditions, something investigated earlier in the present disserta-tion,243 while another body has been investigated in relation to the conditions under which firms grow. Hence, in such research, what is in focus it is rather the environmental effects on individual businesses. Even though a connection between the individual, or the firm on the one hand, and on the other the environment has been identified in various litera-ture and contexts – and although it seems reasonable to think of the relation-ship between the individual business and the environment as an interplay – the question still remains as to what particular factors or variables should be included when addressing the problem of environment, as well as how to measure the environment.
240 The view is here that successful or failing businesses (micro level events) may have differ-ent or opposite effects on the aggregate level. Davidsson (2004), p. 12ff. 241 See for instance Birch (1979) and Davis et al. (1995). There has been extensive debate on the subject, first and foremost regarding new and small firms’ contribution to job opportuni-ties. See also Davidsson and Delmar (2001), and Schreyer (2000). 242 Bruno and Tyebjee (1988). See also Ucbasaran et al. (2001). As another example, the Global Entrepreneurship Monitor (GEM) measures entrepreneurial activity among a vast number of economies (business start-ups, growth firms etc). GEM states among other things that the general climate for entrepreneurship in an economy is important for economic suc-cess, and that in some cases, including Sweden, negative cultural attitudes towards small business activity and towards business failures impede new business activity and entrepre-neurship. However, it is impossible to find how those statements are supported. See for exam-ple GEM (2000). Others have used exogenous or external variables to explain rates of new-firm formation, such as macroeconomic growth, unemployment rates and interest rates; see for instance Audretsch and Acs (1994). 243 See Audretsch and Mahmood (1995), and Everett and Jackson (1998). See also Chapter 5.
135
For instance institutional economic theory has recognized that the rules of the game, the institutional setting in an economy, create both boundaries and possibilities for economic agents, e.g. firms. Therefore some research has, as mentioned earlier, investigated the institutional setting (measured as legisla-tion, bureaucracy, and taxes) and its relationship with firm formation, growth and survival. From this viewpoint, deteriorated environmental conditions impede business activity and vice versa.244 Such studies therefore identify economic policy settings to a great extent. Similar thoughts can be found in other theoretical contexts on the behavior of firms. An interest in neoclassi-cal models in the firm’s external relations with labor, capital, and product markets has addressed such issues. In economic models that have been de-veloped, firm behavior is as at least partially dependent on environmental uncertainty, such as high inflation or unstable government policy (see for instance Greenwald and Stiglitz, 1990).245 Economists have furthermore suggested that events or conditions such as macroeconomic demand shocks and cyclical conditions may affect firms’ growth.246 Other economic theories have recognized similar relationships. Penrose (1959), although she developed a theory for the internal organization and management of growing businesses, admitted that external conditions, in particular credit constraints along with economic policies, might affect the growth possibilities of firms. Higher interest rates and restrictions on credit implies that small firms must have more profitable opportunities than large ones. Thus, growth of small firms can be limited by increasing interest rates and of anti-inflationary policies since rising interest rates and restrictions on bank credit reflect the scarcity of real resources for further investment, i.e. growth.247 Therefore, it has commonly been acknowledged in literature and research that general economic conditions as well as credit constraints – along with different financing conditions and fiscal and regulatory influences – are in-fluential on especially small firms’ success and growth. It has been sug-gested that low or diminishing interest rates generally are favorable for small firms.248 There is reluctance on the part of banks to give credit to small firms as they are seen as being too risky. Thus by this, small firms have a dispro-
244 Davidsson and Henrekson (2002) have, among others, discussed these issues. See also Henrekson (1996). 245 Greenwald and Stiglitz (1990) claim that information asymmetries are key determinants in explaining behavior of firms, measured as how likely it is that a firm reacts to external envi-ronmental and policy changes. 246 Higson et al. (2004). Furthermore, Machin and Van Reenen (1993), studying profit mar-gins amongst firms and the business cycle, reached similar conclusions. 247 Penrose (1959/1995), p. 219f. 248 Steindl (1945), p. 39, claimed that: “… if the rate of interest is lowered, this will afford some breathing space for the small firm”.

136
portional access to credit and are often subjected to high credit costs that affect their growth negatively.249 Another, somewhat parallel school of thought can be found in literature that address entrepreneurship and economic and market change. Such ap-proaches can for instance be represented by Erik Dahmén’s theoretical framework, which is to combine micro and macro perspectives. Micro in the sense that behaviors and strategies of individual firms play a significant role in explaining why some grow and survive (and why new markets emerge); macro from the perspective of among other things growing and diminishing markets, transformation and growth in the macro economy, and institutional change. The latter phenomena affect both existing firms and new-firm for-mation. Firms are here reactive and proactive. For Dahmén, some individual businesses can be highly competitive and innovative. Sometimes these create new markets by introducing innovations, new technologies, goods or ser-vices – something Dahmén labeled ‘market creation’. Even on already exist-ing, ‘old’ markets, some firms are competitive and expand (market expan-sion). Dahmén however emphasizes that firms also emerge, fade away, and grow (or contract) due to what they – as individual businesses or as a group – perceive as an increase or decrease in demand for their products or ser-vices. Therefore, firms also respond in a great extent on their environments. For Dahmén it is necessary to be analytically aware of such differences: have new firms emerged or existing firms grown or declined because of events on the market or economic change; or what types of firms have cre-ated new markets? Dahmén states that a fairly wide set of phenomena could be constituted as ‘environment’, and his general assumptions are in my opin-ion reasonable to a great extent.250 Similar lines of thought have also been proposed in theoretical models developed by economist and economic histo-rians. For instance, such models address the degree to which the environ-ment under certain (periodic) conditions affect the freedom of action of businesses, although, to my knowledge, explicit micro-(firm)-to-macro em-pirical investigations have been uncommon.251
249 See Miller and Friesen (1983), Covin and Slevin (1989), p. 75, Brito and Mello (1995), and Reid (1996). Gertler and Gilchrist (1994) found that small firms contracted significantly when money was tight. 250 Dahmén has used the definitions market suction (approx. [increasing] market demand; marknadssug) and market contraction (i.e. diminishing markets, marknadskrympning) for situations in which firms to a greater extent react than during market expansion or creation. Analyses of markets – which Dahmén views as the meso level – along with macro level stud-ies (e.g. institutions, general economic development, macroeconomic transformation etc.) are of importance according to Dahmén. Are (individual) markets emerging, stabilizing or con-tracting? See first and foremost Dahmén (1992). 251 More specifically, some theories have taken a long-term perspective on economic devel-opment, for instance the long-term structural model by Erixon (1998, 2001) in which firms react to immediate challenges or events in their environment which in turns puts a transforma-tion pressure on them. This has aggregate effects. Lennart Schön’s theoretical model of struc-
137
Another important question of interest is: what have been operational defi-nitions of environmental variables or factors in earlier studies on firm growth? As stated earlier, the environment for business is a wide concept. In some research, managers’ or business owners’ own perception(s) of their environment or their market situation are used as indicators (often using questionnaire or interview data).252 While such information on many occa-sions is the only data available, there have been critical remarks on the use of such records, particularly since they may not reflect ‘objective’ situations. Validity problems may therefore arise.253 In other research, business environment has been quite often represented by aggregate industry specific indicators and fluctuations of those indicators over time – particularly in research that utilize data on homogenous popula-tions of firms. Here, these variables are for instance presumed to be related to the growth of the individual firm: growing industries or highly innovative environments can provide opportunities for (as well as barriers to) growth of individual firms. It is not necessarily assumed that individual firms generally grow or have a higher probability to grow if their industry expands and vice versa. Since it most probably is a fairly complicated set of variables that is related to firm growth (and survival), high-competition industries or harsh environments have for instance often been thought of as favorable for some but not for all firms. The potential gains for individual businesses may be larger in competitive environments, but the risk for failure may also be higher. For instance Audretsch (1995) came to such conclusions: the under-lying technological conditions in an industry were linked to the survival and growth of firms.254 The assumption that individual businesses and their behavior can be viewed as an interplay with aggregate and industry-specific economic change and events is related mainly to studies in business history, which have as a rule investigated a single company’s development over the course of time. This is a point of view that also relates to research in strategic man-
tural cycles (40-50 years) that contain periods of transformation and rationalization in an economy is another example; see first and foremost Schön (2000a). 252 See for instance Zahra (1993), Binks and Ennew (1996), or Strandberg and Westman (1997). 253 Starbuck and Mezias (1996) are for instance critical towards general research results when it comes to measuring environment and individuals’ perceptions thereof: most of the time, studies seldom compare ‘perceptual’ data with ‘objective’ data, or even attempt to seize a more critical viewpoint. 254 Audretsch (1995) used variables over innovation rates and industry growth as independent variables. See also Eisenhardt and Schoonhoven (1990). Regional (spatial) differences for firm growth have furthermore been thought of as having similar effects; see for instance Vaessen and Keeble (1995).
138
agement, in which it is assumed that firms that obtain good alignment with their environments tend to be high performers.255 Thus, research with an aggregate and population-focused approach has in many instances taken this fairly broad spectrum of environmental circum-stances into consideration in the study of firm growth. Studies that explicitly incorporate real (macro or environmental-related) economic factors in the analysis seem however to be less common than more short-term, individual or firm focused studies which generally appear to have put less focus on those relationships.256 Some previous research has tested or suggested that the growth of firms might be affected by macroeconomic variables and/or conditions and fluc-tuations in their external environment. Results have been mixed.257 Davids-son and Delmar’s (2001) study of Swedish firms over the period 1988-1996 found that the growth of firms, at an aggregate level, might have been af-fected by the severe economic downturn in 1991-93. Poorer economic condi-tions led to low or negative rates of firm growth. Even the top ten percent of firms that exhibited strong growth over the period in question exhibited a similar, although weaker, pattern of slowed-down growth. Davidsson and Delmar’s conclusions were that a majority of firms were unable to control their own development while a smaller amount of firms (probably) could, even through varying and sometimes harsh environmental conditions.258 Kangasharju (2001) furthermore, using cross section data, found that small firms were affected by macroeconomic fluctuations during the period 1988-95: growth of firms was more likely during an economic upturn than during a recession although the influence of other variables, such as low firm age, diminished the effects of environmental conditions.259 Boeri and Bellman (1995) also considered age and size effects in an analysis of birth cohorts that covered a period of one and a half decade. Here, cyclical conditions (measured as aggregate unemployment rate) had little effect on surviving firms’ growth rates when they were young. As firms grew older/larger how-ever, they became more responsive. Although such relationships seem odd at first – one considers perhaps small firms in general as more sensitive to cy- 255 For an example in business history, see Lindgren (1979). See for instance Keats and Hitt (1988), and Venkatraman and Prescott (1990) for strategic management studies. 256 A thorough research and literature survey of entrepreneurship by Audretsch (2002) con-tains as an example nearly no references to such ‘environmental’ factors other than taxes, institutions etc. 257 See for instance Bridge et al. (1998), pp. 178-179. Filippi and Zanetti (1971) found no relationships between the growth amongst large Italian firms and exogenous economic vari-ables such as macroeconomic fluctuations. 258 In the study, there was a tremendous loss of jobs among the majority of smaller firms 1991 to 1993. From 1994 and onwards – after macroeconomic improvement – the trend was re-versed. Davidsson and Delmar (2001), esp. pp. 103 ff. 259 That is, environmental conditions were of importance, but other variables such as founder-owner characteristics were more influential.
139
clical conditions than large – an explanation offered was that larger plants on average are older than young ones. Hence, in times of adverse economic shocks, surviving (mostly larger) firms contract rather than terminate while small (younger) firms cannot since they already have a minimum size. Therefore small firms are terminated, they do not shrink.260 Also other findings have been more uncertain or at least produced equally mixed results when it comes to the influence of environmental conditions. For instance J. Wagner (1995) used longitudinal data consisting of birth co-horts of firms that were followed over a ten-year period. Results showed that growth rates in the cohorts were high when the firms were young. Over time, the surviving firms in each cohort compensated the ‘loss’ of employment caused by exiting firms, i.e. surviving firms tended to grow on the average. Wagner did not however find any clear relationship between the growth rates of the cohorts and macroeconomic circumstances, and similar albeit equally uncertain research results have been presented also in other studies.261
Analytical Framework As mentioned earlier, the aim of this chapter is to investigate the long-term growth of firms in two birth cohorts of firms (1912 and 1930) with a specific interest in exploring the relationships between firm growth and environ-mental conditions. Even though it can be assumed that a complicated set of factors affect the survival and growth of firms – ranging from firm and man-ager-specific factors to general economic conditions – the empirical material available to a researcher defines both the possibilities and limitations of a study. In the present case, the database on the two birth cohorts is homoge-nous in the sense that e.g., when observing the cohorts separately, firms ex-perienced the same event at the same age. It is however heterogeneous when it comes to industry affiliation – some firms were active in service sectors, some as manufacturing technical companies. Hence, one question is the measure of firm-specific variables such as the size of firms (which could be measured in several ways; some size measures may furthermore be more appropriate for some industries than others, see discussion in Chapter 3). Another question regards the measure of ‘environ-ment’. Since there is substantial heterogeneity in the database concerning industry affiliation, specific industry measures are difficult to employ when 260 Boeri and Bellmann (1995) however offer some other explanations, for instance that older plants have accumulated more physical capital over time and operate below capacity. There-fore, an economic downturn may affect them to a lesser extent. 261 Furthermore, Almus and Nerlinger (1999) found that wage rates generally had a negative relationship with firm growth. See also Heshmati (2001): labor market conditions (represent-ing an external variable) had positive (but little) impact on the growth of Swedish firms over a four-year period in the 1990’s.
140
studying effects of environment on firm growth. Chapter 5, which investi-gated the life-length and termination rates of firms in the seven birth cohorts, therefore utilized general, or aggregate, variables: growth of the Gross Do-mestic Product (GDP) and changes in the interest rate level. It seems reason-able to use the same variables when addressing the problem of firm growth. Increasing GDP implies generally increasing aggregate demand. Firms ac-cordingly, it may be presumed, find better markets for their products or ser-vices. Therefore, firms may have better opportunities to expand, i.e. grow. Changing interest rates have opposite effects: increasing interest rates means that money is more costly. Firms may have to look for other ways to finance the business or to grow. Alternatively, they might decrease in size.
Sources and Methodological Considerations A study that wants to investigate the relationship between firm growth and changing environment(s) requires a method and data that makes it possible to trace firms from the point in time when they are founded until they cease to exist. Thus, a necessary requirement here is to re-create the development of each cohort member (firm) over the course of time, not only to be able to control for when in time firms are founded and when they are terminated (birth cohort). In previous chapters (5 and 6), the life-lengths and termination patterns were investigated. In the present chapter, firms – in cases where it has been possible – are followed on the micro-level. Such an approach further calls for a possibility to re-create a fairly large population. Too large a number of missing cases in the analysis could theo-retically imply that the analysis becomes biased. On the other hand, missing cases are almost generally a problem in any type of investigation, be it a historical study or a contemporary. When possible, each joint-stock com-pany’s development – measured as firm-specific variables, described in more detail below – has been re-created, in this case the life-courses of a total of 420 firms out of 586. In Cohort 1912, 102 of 134 firms (76 percent) were located in various archival sources while the figure for Cohort 1930 was 318 of 452 firms (a little more than 70 percent). These particular com-panies have been traced from their birth until their prospective termination or, at most, for a thirty-year period. Therefore, missing cases here represent some 30 percent of the total popu-lation (Table 13). Such missing firms consisted for the most part of busi-nesses that, relative to other firms in the data set, reached only a low age. This circumstance has most likely an explanation in the fact that firms that did not survive for any longer period of time (one to two years, sometimes less) were less likely to produce any artifacts such as annual statements or other documents that are used as empirical material. This is reasonable. Firms that in an early phase of their lifetime were discontinued have left fewer historical traces; in some cases it is not unlikely to assume that firms
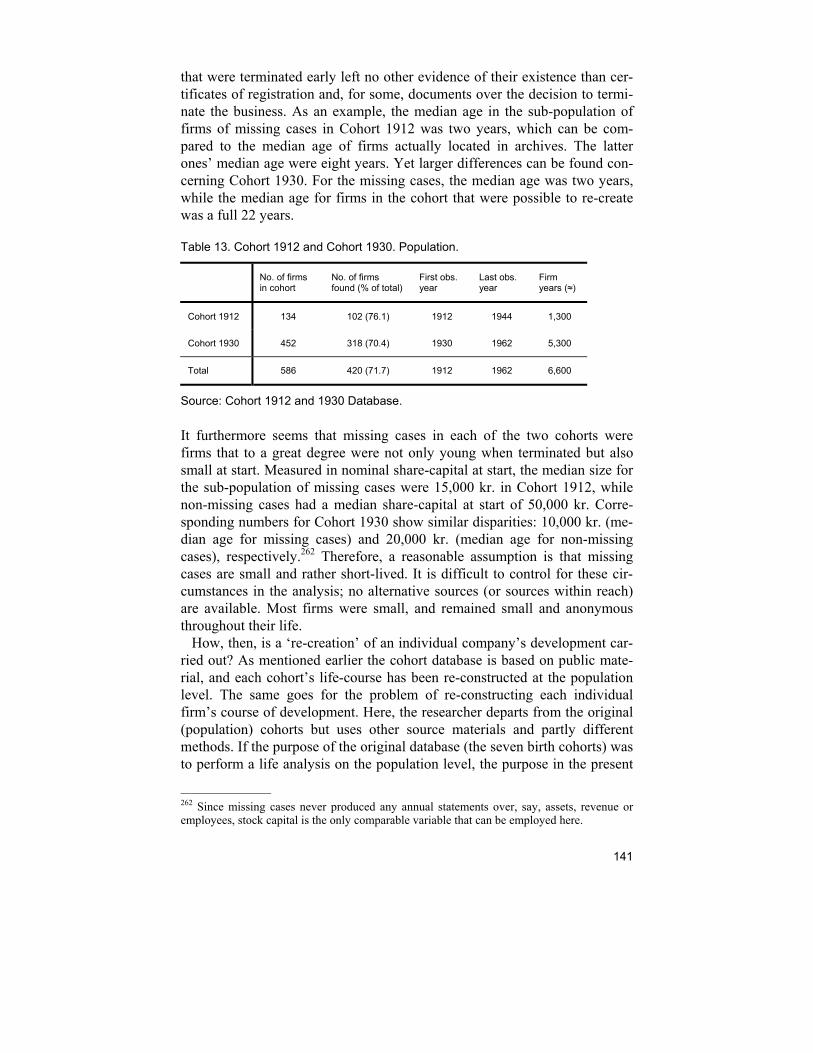
141
that were terminated early left no other evidence of their existence than cer-tificates of registration and, for some, documents over the decision to termi-nate the business. As an example, the median age in the sub-population of firms of missing cases in Cohort 1912 was two years, which can be com-pared to the median age of firms actually located in archives. The latter ones’ median age were eight years. Yet larger differences can be found con-cerning Cohort 1930. For the missing cases, the median age was two years, while the median age for firms in the cohort that were possible to re-create was a full 22 years.
Table 13. Cohort 1912 and Cohort 1930. Population.
No. of firms in cohort
No. of firms found (% of total)
First obs. year
Last obs. year
Firm years (≈)
Cohort 1912 134 102 (76.1) 1912 1944 1,300
Cohort 1930 452 318 (70.4) 1930 1962 5,300
Total 586 420 (71.7) 1912 1962 6,600
Source: Cohort 1912 and 1930 Database.
It furthermore seems that missing cases in each of the two cohorts were firms that to a great degree were not only young when terminated but also small at start. Measured in nominal share-capital at start, the median size for the sub-population of missing cases were 15,000 kr. in Cohort 1912, while non-missing cases had a median share-capital at start of 50,000 kr. Corre-sponding numbers for Cohort 1930 show similar disparities: 10,000 kr. (me-dian age for missing cases) and 20,000 kr. (median age for non-missing cases), respectively.262 Therefore, a reasonable assumption is that missing cases are small and rather short-lived. It is difficult to control for these cir-cumstances in the analysis; no alternative sources (or sources within reach) are available. Most firms were small, and remained small and anonymous throughout their life. How, then, is a ‘re-creation’ of an individual company’s development car-ried out? As mentioned earlier the cohort database is based on public mate-rial, and each cohort’s life-course has been re-constructed at the population level. The same goes for the problem of re-constructing each individual firm’s course of development. Here, the researcher departs from the original (population) cohorts but uses other source materials and partly different methods. If the purpose of the original database (the seven birth cohorts) was to perform a life analysis on the population level, the purpose in the present
262 Since missing cases never produced any annual statements over, say, assets, revenue or employees, stock capital is the only comparable variable that can be employed here.
142
circumstances rather is, for each year each individual firm were active, to unfold its development. By using each individual company’s unique registra-tion number it is possible to find out if, and in that case when, the company in question was terminated. It is therefore also possible to search for and use other source material that each company produced. Each company was obliged to annually report their accounts and statements to PRV. For busi-ness historians, yearly statements and accounts have often constituted an important source when re-creating a company’s development over time – not only in financial terms but also with respect to the company’s strategies and actions and how management assessed its situation on the market.263 Thus, the database on the development of firms on the micro level is founded on documents and certificates of registration and, above all, annual statements produced by the companies in question. Furthermore, these are principally the only sources and remnants for many of the firms in question. We here deal with firms that, more or less, were active for a rather short period of time and that throughout their life-courses remained quite anony-mous. A large part of this source material is preserved at RA, at the least concerning firms that were discontinued before 1960. Documents for firms active after that year, irrespective of when in time they were founded, are preserved at PRV.264 In the best of worlds, a researcher would have the opportunity to recover the company files and documents about each firm in the investigation. Fur-thermore, the researcher would also here be able to employ a number of al-ternative variables or indicators over business size, development and growth. Unfortunately, this is not the case for the type of source material used in the present investigation (and that, moreover, is the only source of information regarding the companies in the study). As mentioned above, for several cases (firms) sources are completely missing and there are consequently no avail-able information regarding these. I have earlier in this dissertation discussed various measures of size in previous research. The best way would of course to be able to use a larger set of definitions and measures in order to analyze individual firms as well as to make comparisons between firms over time. Thus, for each year of activity (firm year) for each individual company, measures such as the number of employees, assets, revenue, turnover etc. would be used. Yet, vast differences in the quality – or, rather, usefulness – of yearly statements and accounts are present. Few firms were very precise in their 263 See for example Ullenhag (1970). 264 At RA the availability of public material is rich and, hence, there are almost never any difficulties in obtaining documents on – as in this case – joint-stock companies (some files have also been discovered at KB). The situation is somewhat different concerning the Swed-ish Companies Registration Office. While it is true that the primary business concept for the latter institution is not to make historical material available for research purposes, its archives are less accessible.
143
accounts concerning their financial situation. Examples of this are detailed accounts of wage costs, short and long term debts, the number of employees and so on. Additionally, such firms in their annual reports did thoroughly describe the development of the business during the year that had gone. Such ‘model accounts’ are nonetheless very few when put in relation to the total body of source material. It was generally the larger firms in the birth cohorts that gave such detailed accounts and descriptions even if there were excep-tions. A fairly small firm, started in 1912 with a stock capital of 35,000 Kro-nor, Aktiebolaget Matthiessen & son (initially with the name Aktiebolaget Heinr. Schipmann), gave for instance the following report in the statement of 1918, after a severe war recession and political turmoil:
The business was normal during the first three quarters, but underwent after the temporary ending of the war – due to the general crisis and the English blockade – a change for the worse akin to standstill. Therefore, the board thought it necessary to make cutbacks in personnel. Due to the Russian state of affairs, the board has made relevant write-offs concerning some Russian claims that, unfortunately, now must be considered worthless (my transla-tion)265
Another firm, AB Aug. Fredlund, founded in 1930, gave somewhat similar accounts during the economic depression in the early 1930’s. The crisis – particularly falling prices on goods and a general insecurity on the exchange market – was viewed as the main reason that the business had developed in an undesired direction. Ten years later, in 1942, the war situation and the regulated economy had again brought about harsher times:
Due to the small earnings permitted for rationed goods, the company has notwithstanding increasing turnover run at a loss of Kronor 30,457:30. Among expenditures, of which all have increased, are taxes, client losses, and car expenses; the latter adding up to Kronor 13,769:56 (my translation)266
As can be noted, both firms recognized that changing conditions were influ-ential in explaining the development of the business over the year. Such rich descriptions of individual businesses are as a rule unfortunately lacking.
265 In Swedish: ”Affären som under de tre första kvartalen visade sig normal, undergick efter krigets provisoriska slut på grund av den allmänna krisis och den engelska blockaden tyvärr en nära till stillestånd gränsande försämring, varför styrelsen ansåg nödigt vidtaga inskränkningar i personalen. På grund av de ryska förhållanden har styrelsen gjort lämpliga avskrivningar å en del ryska fordringar som tyvärr måste anses såsom värdelösa”. Statement from 1918, Aktiebolaget Mattiesssen & son (reg. no. 10 999) 266 In Swedish: ”På grund av ringa avance som medgives på ransonerade varor, har bolaget, oaktat ökad omsättning, gått med en förlust av Kronor 30,457:03. Bland utgifterna, som samtliga ökat, märkes skatter, förlust på kunder och bilomkostnader, vilka senare uppgå till Kronor 13,769:56”. Aktiebolaget Aug. Fredlund (reg. no. 28 635), statements from 1932 and 1942. Quote from the 1942 statement.
144
Furthermore, even if such statements and accounts are useful in particularly case studies, they are nonetheless rather difficult to translate into figures and numbers in a study with a more quantitative approach. The most ordinary annual statement therefore consists of a handwritten or typewritten document that in a very basic manner, and without any detailed items, accounts for the year’s profits and losses and the company’s balances in quite aggregate figures. Moreover, no further information regarding for instance the number of employees (if there at all were any) or about the de-velopment of the business (i.e. something resembling an annual statement of the board) is to be found in most of the statements. Therefore, the question here is to find a collective measure of business development, i.e. to obtain something that can represent a least common denominator. As mentioned earlier, the number of employees would theo-retically be such a measure. On the other hand, the number of employees is rarely accounted for in the documents and if so, mostly as regards somewhat larger businesses. From the 1940’s and onwards employee figures appear somewhat more frequently in the statements, at least this is a tendency in the source material. The cases are nonetheless too few. There are still some common measures that can be used, namely economic and financial data. Small as well as large firms gave as implied above each year accounts for their profits and losses, their assets and debts and the size of their stock capi-tal. From such data it is thus possible to re-create at least parts of each firm’s development and to measure the size of firms in financial terms. In the re-creation of the development among the 420 firms I estimate that some ten to twelve meters of archive material have been used – if not more; nearly 6,600 observation years means that nearly 6,600 annual statements for 420 incorporated firms have been used. In that respect, to longitudinally re-create even so ‘few’ cases as 420 has been quite an extensive exercise. Sim-ply put, it has been a question of identifying the individual companies and thereafter to chronologically document the selected variables from each an-nual statement. Each company’s development over time – from the time it was founded and onwards – has thereafter been recorded in a database and processed and analyzed. The actual workload is in fact a partial reason as to why two, and not more, cohorts have been reconstructed.267 Naturally, more cohorts would perhaps be more desirable, but is on the other hand not possible in a limited horizon of time. The advantage with this longitudinal cohort method however, is that the development of cohorts can be studied in a timely order on the micro level. It is for instance here possi-ble to control for the age of individual firms (such as its age when it has reached a certain size), as well as when in time it grew or contracted. An-other advantage with this particular database is that there is probably less 267 My hopes are that future research will provide opportunities to include a larger set of birth cohorts.
145
under-sampling than is the case in most other studies. As mentioned earlier, firms are missing here – particularly smaller ones – but studies that build on ‘secondary’ data have probably even fewer small firms included. Therefore, this particular database covers hopefully a wider and more representative range of firms of all sizes. Even if most of the firms in the cohorts of 1912 and 1930 did not survive for an especially long time (see chapters 5 and 6), the total number of obser-vation years – here denoted firm years – in the database adds up to a rather large number. As mentioned, there are here just about 6,600 observation years if each company’s life-length is included. Thus, there are indeed 420 firms that are traced over time in the database, but nearly 6,600 observations when the analysis is performed longitudinally on the firm level.268 As an example: consider hypothetically that each firm in the database would reach an age of exactly five years, no more or no less. Therefore we receive 420 firms times five years. This adds up to 2,100 firm years. Or, for that matter, consider that 30 of the 420 firms were active for 30 years. These few firms contributed in that case with 900 firm years to the database. This is also the reason why the number of observations (firm years) adds up to such a large figure. A majority of firms in the databases did not however reach an age over five, but the ones that did contributed significantly with many firm years.
Variables and Measurements In the analyses of the micro level growth of firms, firm-specific variables will be employed. Additionally, events that are defined as occurring outside the individual firm will be included in the tests. Those variables are assumed to be ’environment’-specific at a particular point in time of a firm’s life. Firm-specific variables that are used are the firms’ yearly assets, as well as their age. The dependent variable that here measures size and growth of firms is the firms’ assets (total assets) at any given point in time (i.e. at a certain age/specific time, t) defined as Size t in the study. Therefore, size at t0, t1, t2,…, and so forth is used to measure the size and growth of each indi-vidual business at a particular age, given that the firm in question still was active at that age. The start-up size of firms, measured as the size of assets the first year of observation of each firm, is furthermore used a an independent variable that controls for any size advantage or disadvantage for the individual firm over the course of its lifetime (Start-up size). Hence, this variable is held constant
268 Naturally it is impossible to measure growth for firms that were active for only one single year, i.e. when there is only one observation (firm year) for an individual firm. Thereby will the total number of firm years not add up to 6,600 in the analyses below.

146
for all firms in the tests. In some parts of the analysis, the firms’ assets at founding will be used as a basis for grouping the firms into size classes. It is furthermore reasonable to imagine that earlier size – i.e. size of a firm a previous year – affects its subsequent size. In the tests, therefore, previous size of firms at any point in time (t) is used as an independent variable that is assumed to have influence on firm size a subsequent period. If for instance the relationship between size at t-1 and at t were to be insignificant or unre-lated, this would mean that previous size cannot explain the size and growth of firms. Age of firms is furthermore used as a firm-specific variable in the analyses. In the specific database employed in the study, age can assume any value between 1 and 33. Finally, a firm-specific variable, Last 2 years, is a dummy variable that indicates the last two observation years per firm (0 = no, 1 = yes). If for example firms generally tended to shrink in size before they disbanded, the relationship between the independent variable Size t and Last 2 years would be negative.269 It is additionally assumed here that environmental phenomena might affect the size and growth of firms over time, just like increasing age. There are of course a number of possible factors that theoretically could be employed to indicate environmental circumstances. Since the cohorts consist of heteroge-neous firms in the sense that joint-stock companies of all types of industries are included, it might become problematic to use for instance industry-specific indicators. One alternative therefore is to employ more general, or common indicators, for instance economic growth such as in Chapter 5. Therefore, here I will use two macroeconomic indicators when the growth of firms over time is tested. First, GDP growth is employed to measure change in aggregate demand in the total economy. Falling GDP growth rates indicate that demand is falling. In such cases it is assumed that the opportu-nities for firm growth generally are diminishing. Individual (or groups of) businesses might stagnate or contract during such circumstances, while peri-ods of increasing aggregate demand would improve the possibilities for firms to grow. Historical GDP data from Olle Krantz (1997) is used, and the calculations are measured as GDP ratios. Therefore, positive GDP growth rates are expected to have a generally positive relationship with the growth of firms. Second, interest rate change, measured as the increase or decrease in the market interest rate level, is used to measure any tightening or expan-sion of credits. Increasing interest rates, as GDP growth, is measured as the relative interest rate change (ratio). If the ratio increases over time, this im-plies higher costs of borrowing compared to previous periods; if they fall it is then assumed that the possibility for growth among firms on average will increase since capital is available at lower costs.270
269 There has been debate over firms’ growth prior to termination; for instance did Almus (2004) find that firms diminished in size before disbanding. 270 Interest rate data is from Persson (2001).
147
Furthermore, each of the two cohorts’ (aggregate) selection rate – meas-ured as the percentage of firms terminated a specific year – was added (here: Selection rate t-1). The purpose was to analyze if specific ‘cohort behavior’ reflected growth behavior among the firms. More specifically – and as dem-onstrated previously in the dissertation – the selection rates of firms were not only sensitive to low age (i.e. low age on average meant higher death rates); a further proposition is that selection (termination) of firms also were sensi-tive to macroeconomic/environmental change. Therefore, to include the se-lection rate of Cohort 1912 and 1930 would assume that a year/period that was defined by high termination would to some extent reflect that growth conditions for (surviving) firms in each cohort had deteriorated. In the analysis below (particularly in the regressions that are carried out) variables included have generally been transformed into logarithms in order to, among other things, attempt to reduce problems of heteroscedasticity. All calculations are additionally based on deflated values/fixed prices concern-ing the development of businesses over time. Since the source material (bal-ance sheets, and profit and loss accounts) report in current prices, it is rea-sonable to transform the values into fixed prices, and the price-level of 1930 (= 100) is used throughout the study.271
Growth of Firms and Environmental Conditions To what extent can environmental, or external, variables be said to have had an effect on the growth behavior of firms over time? As mentioned earlier, GDP growth and changes in the market interest rate are here used as indica-tors of such environmental variables: GDP as change in aggregate demand; interest rate in the sense that e.g. increasing interest rates signals a tightening of money and hence that the cost for borrowing increases. Firms’ expansion plans can therefore be hampered by increasing credit costs or by a fall in aggregate demand and vice versa. While most studies have focused solely – or more or less – on firm specific variables such as the (start-up) size, one question, as claimed by previous research, that therefore arises: did smaller firms in the present study grow faster than larger ones and did growth rates decline with increasing age? While the law of proportionate effect (Gibrat’s Law) is not the main inter-est in the present study, the suggestion that small and particularly young firms exhibit higher growth rates than larger (and older) firms, is still inter-esting to investigate. Much small business and entrepreneurship research has identified them as important phenomena. As stated above, there are various research designs that can be employed in testing these relationships. Some researchers have investigated rather short time-spans, with a pronounced 271 Deflator from Krantz (1997). 1930 = 100.
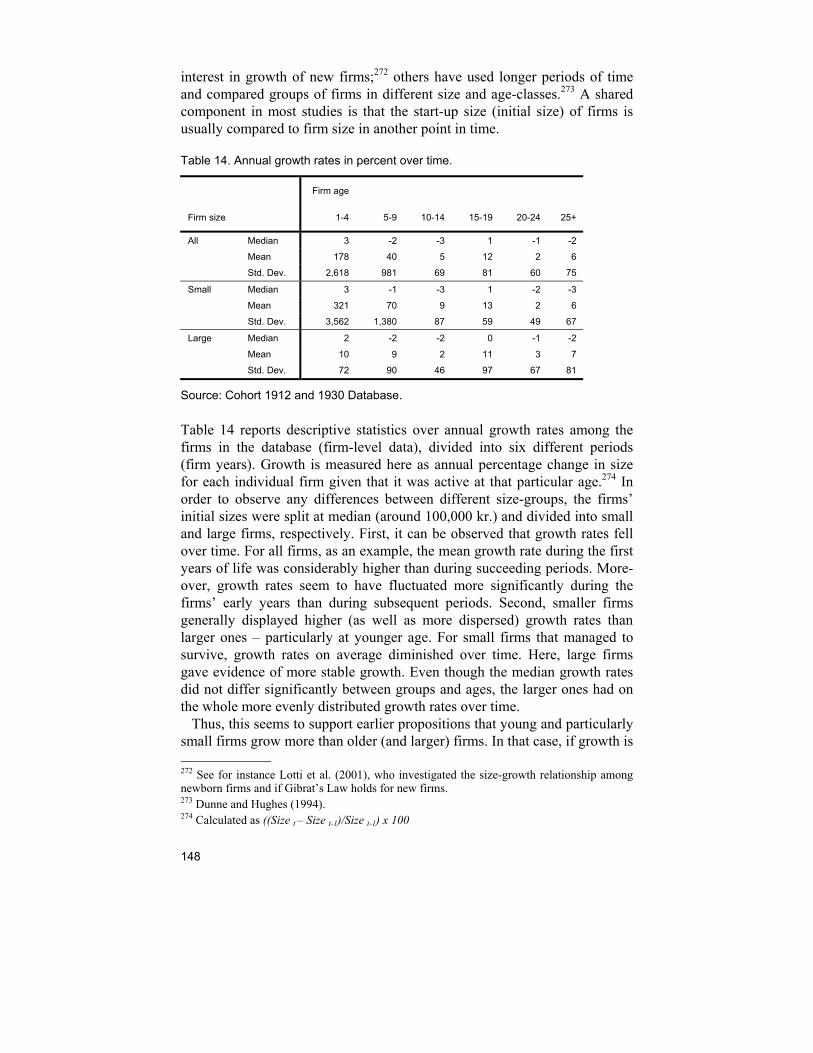
148
interest in growth of new firms;272 others have used longer periods of time and compared groups of firms in different size and age-classes.273 A shared component in most studies is that the start-up size (initial size) of firms is usually compared to firm size in another point in time.
Table 14. Annual growth rates in percent over time.
Firm age
Firm size 1-4 5-9 10-14 15-19 20-24 25+
All Median 3 -2 -3 1 -1 -2
Mean 178 40 5 12 2 6
Std. Dev. 2,618 981 69 81 60 75
Small Median 3 -1 -3 1 -2 -3
Mean 321 70 9 13 2 6
Std. Dev. 3,562 1,380 87 59 49 67
Large Median 2 -2 -2 0 -1 -2
Mean 10 9 2 11 3 7
Std. Dev. 72 90 46 97 67 81
Source: Cohort 1912 and 1930 Database.
Table 14 reports descriptive statistics over annual growth rates among the firms in the database (firm-level data), divided into six different periods (firm years). Growth is measured here as annual percentage change in size for each individual firm given that it was active at that particular age.274 In order to observe any differences between different size-groups, the firms’ initial sizes were split at median (around 100,000 kr.) and divided into small and large firms, respectively. First, it can be observed that growth rates fell over time. For all firms, as an example, the mean growth rate during the first years of life was considerably higher than during succeeding periods. More-over, growth rates seem to have fluctuated more significantly during the firms’ early years than during subsequent periods. Second, smaller firms generally displayed higher (as well as more dispersed) growth rates than larger ones – particularly at younger age. For small firms that managed to survive, growth rates on average diminished over time. Here, large firms gave evidence of more stable growth. Even though the median growth rates did not differ significantly between groups and ages, the larger ones had on the whole more evenly distributed growth rates over time. Thus, this seems to support earlier propositions that young and particularly small firms grow more than older (and larger) firms. In that case, if growth is 272 See for instance Lotti et al. (2001), who investigated the size-growth relationship among newborn firms and if Gibrat’s Law holds for new firms. 273 Dunne and Hughes (1994). 274 Calculated as ((Size t – Size t-1)/Size t-1) x 100

149
a measure of success, then small firms were more successful. However, based on previous results in the present dissertation, if survival is a measure of success then large firms seem generally to have been more successful since they had higher average survival rates. In the present study a rather simple but quite conventional test that is quite common in contemporary research was used: the comparison of the size of a firm at one point in time to its size at another point in time using regression analysis. The size measure (i.e. firms’ assets) was transformed into loga-rithms. Therefore, if smaller firms did not grow faster – or more – than lar-ger, the law of proportionate effect (Gibrat’s Law) would then be confirmed if the regression coefficient was equal (or close) to 1. This would mean that firms (more or less) exhibited the same growth rates regardless of size. If smaller than 1, it would mean that small firms grew more than larger ones; if larger, then large firms grew more than smaller firms. Based on previous research designs (see for instance Dunne et al., 1989; Dunne et al., 1994), different periodizations were employed in order to control for any age ef-fects. The tests consisted of basically two different approaches – one using the start-up size of firms (Size t0) as the independent variable, another test using previous size at a particular point in time, for example measuring the growth of firms over a five-year period between the age of 1-6 years, 6-11, and so on (‘running’ tests). The first approach showed that firms with a smaller start-up size – if they managed to survive – grew more than large firms over time. As firms grew older, the smaller the firm at start, the more it grew. Coefficients did how-ever tend to increase as firms reached a mature age (here: from the age of 15 years), meaning that there was a tendency towards a law of proportionate effect of size among the firms as they grew older. This is in line with previ-ous research results; the test therefore suggests that small firms grew more than old at younger age but not when older.275 The second approach, using ‘running’ regressions further confirmed this tendency. The smaller the size of young firms any previous period, the faster their growth. As the firms grew older, their size in any previous period gradually became of lesser im-portance since regression coefficients generally moved towards 1. The re-gression coefficients are reported in Appendix 3.276 Similarly, when analyzing firm growth controlling for multiple independ-ent variables, regression results confirmed that increasing age had a negative effect on growth over time (see Table 15). Here, four independent, firm spe-cific variables were included (all variables except the dummy variable were transformed into logarithms). Three separate regressions were carried out: one including both cohorts, and separate regressions per cohort. By measur-
275 See as an example Hannan and Freeman (2000). 276 Additionally, regression results in Appendix 5 also confirm this pattern to some extent.
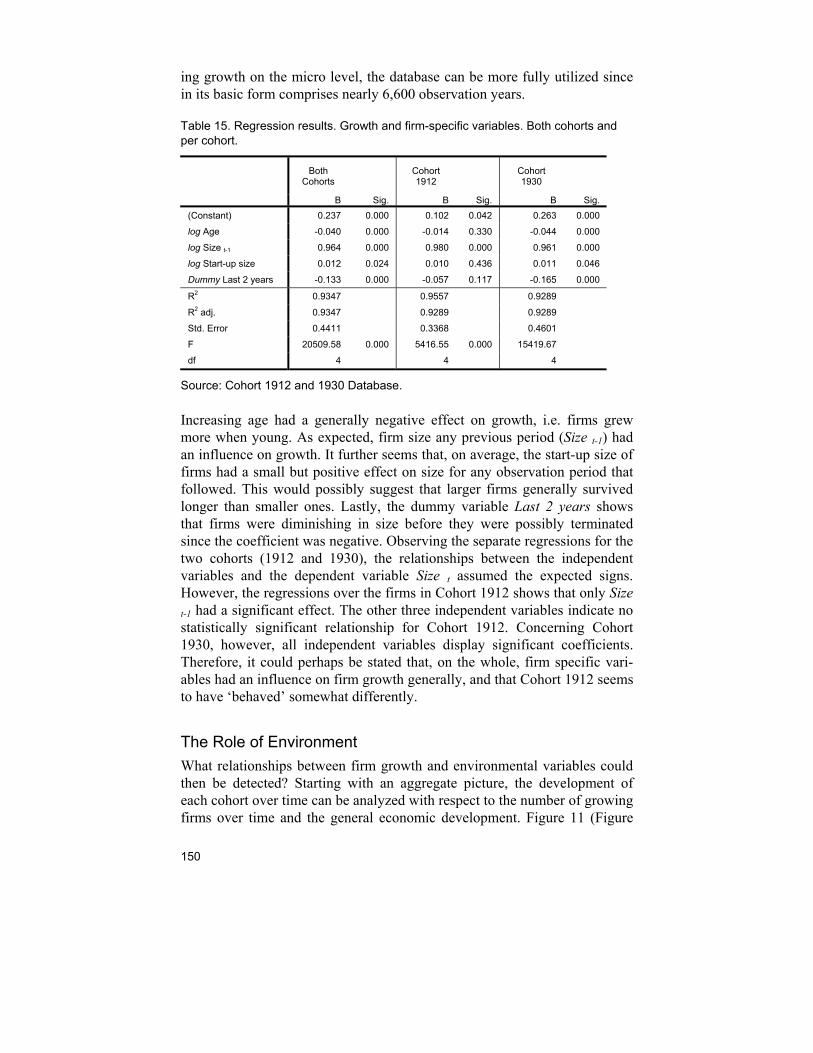
150
ing growth on the micro level, the database can be more fully utilized since in its basic form comprises nearly 6,600 observation years.
Table 15. Regression results. Growth and firm-specific variables. Both cohorts and per cohort.
Both Cohorts
Cohort 1912
Cohort 1930
B Sig. B Sig. B Sig. (Constant) 0.237 0.000 0.102 0.042 0.263 0.000
log Age -0.040 0.000 -0.014 0.330 -0.044 0.000
log Size t-1 0.964 0.000 0.980 0.000 0.961 0.000
log Start-up size 0.012 0.024 0.010 0.436 0.011 0.046
Dummy Last 2 years -0.133 0.000 -0.057 0.117 -0.165 0.000
R2 0.9347 0.9557 0.9289
R2 adj. 0.9347 0.9289 0.9289
Std. Error 0.4411 0.3368 0.4601
F 20509.58 0.000 5416.55 0.000 15419.67
df 4 4 4
Source: Cohort 1912 and 1930 Database.
Increasing age had a generally negative effect on growth, i.e. firms grew more when young. As expected, firm size any previous period (Size t-1) had an influence on growth. It further seems that, on average, the start-up size of firms had a small but positive effect on size for any observation period that followed. This would possibly suggest that larger firms generally survived longer than smaller ones. Lastly, the dummy variable Last 2 years shows that firms were diminishing in size before they were possibly terminated since the coefficient was negative. Observing the separate regressions for the two cohorts (1912 and 1930), the relationships between the independent variables and the dependent variable Size t assumed the expected signs. However, the regressions over the firms in Cohort 1912 shows that only Size
t-1 had a significant effect. The other three independent variables indicate no statistically significant relationship for Cohort 1912. Concerning Cohort 1930, however, all independent variables display significant coefficients. Therefore, it could perhaps be stated that, on the whole, firm specific vari-ables had an influence on firm growth generally, and that Cohort 1912 seems to have ‘behaved’ somewhat differently.
The Role of Environment What relationships between firm growth and environmental variables could then be detected? Starting with an aggregate picture, the development of each cohort over time can be analyzed with respect to the number of growing firms over time and the general economic development. Figure 11 (Figure
151
11a, 1912/13-1944; and 11b, 1930/31-1962) displays the share of (surviving) firms in the two cohorts that exhibited growth during a particular year. The limit for growth here was set to a minimum: given that an individual firm displayed any growth at all, measured as increasing assets no matter how small, the firm was included in the figure (assets in fixed prices; 1930 = 100). The bars in the figures therefore represent the percent of firms that grew that particular year (left axis). The lines, which are read on each fig-ure’s right axis, represent GDP growth in 3-year moving average values. Two features can be observed in the figures. First, a larger share of firms exhibited growth at very young age; a share that decreased over time as firms grew moderately older. Compare, for example, the number of firms exhibiting growth in 1913/14 with the number in 1915/16 (Cohort 1912), and 1931/32 with 1933/34 (Cohort 1930). This is in line with previous re-search results. In both Cohort 1912 and 1930, more than 70 percent of the remaining populations grew during their second year – 1913 and 1931, re-spectively. This does not however seem to imply that as firms grew older they gradually displayed weaker growth. In both cases there is an indication that surviving firms from each of the cohorts could demonstrate growth even at a reasonably high age. As for Cohort 1912, a very large share of the survivors grew during the early 1920’s, i.e. when ten years or older. A large part of the survivors from Cohort 1930 exhibited a similar pattern around the age of 15, i.e. in 1944-46. Thus, even if the proportion of growing firms fell as they became older, quite opposite patterns over a longer period of time could be observed. Pre-vious research has for instance suggested that growth is strong at a young age and that, on average, it declines with increasing age. Most studies have however researched firm growth over quite short time spans. Hence, even if the data used here to some extent confirms earlier research, it also raises some questions regarding the validity of research that measures growth over, say, a three-to-five year period. Evidently, other factors must be included to explain why many of the remaining firms in the cohorts displayed growth at such an ’old’ age.
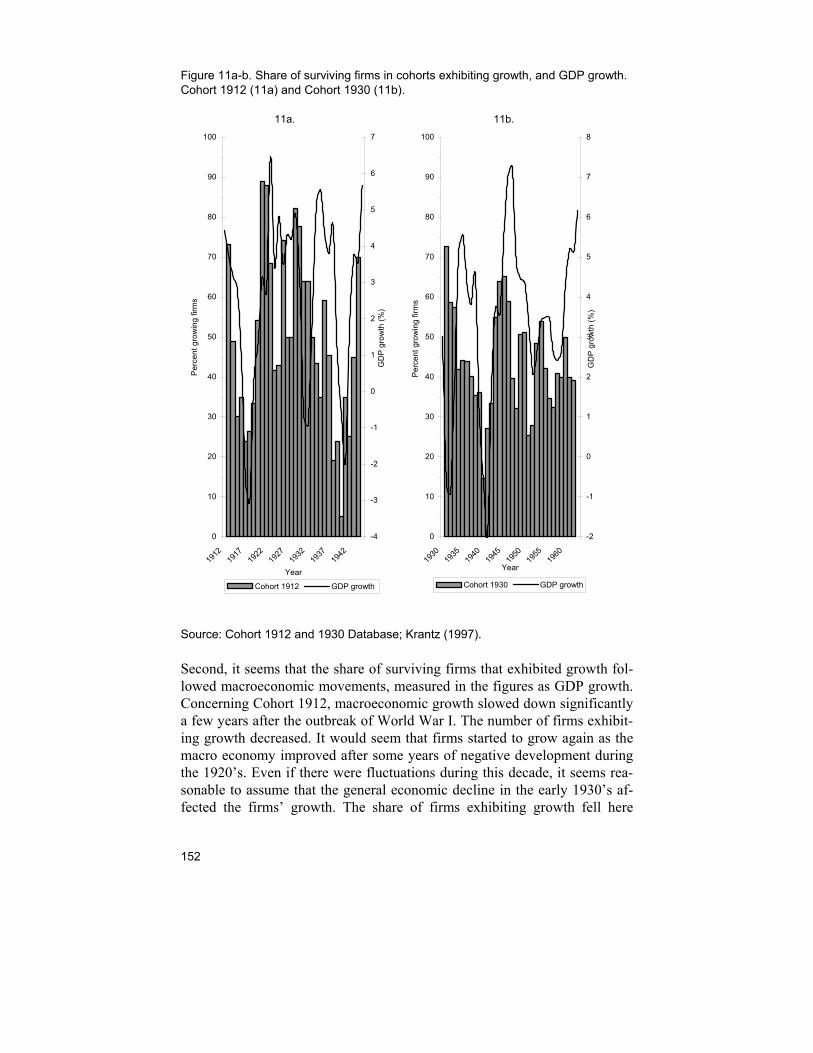
152
Figure 11a-b. Share of surviving firms in cohorts exhibiting growth, and GDP growth. Cohort 1912 (11a) and Cohort 1930 (11b).
11a. 11b.
0
10
20
30
40
50
60
70
80
90
100
1912
1917
1922
1927
1932
1937
1942
Year
Per
cent
gro
win
g fir
ms
-4
-3
-2
-1
0
1
2
3
4
5
6
7
GD
P g
row
th (%
)
Cohort 1912 GDP growth
0
10
20
30
40
50
60
70
80
90
100
1930
1935
1940
1945
1950
1955
1960
Year
Per
cent
gro
win
g fir
ms
-2
-1
0
1
2
3
4
5
6
7
8
GD
P g
row
th (%
)Cohort 1930 GDP growth
Source: Cohort 1912 and 1930 Database; Krantz (1997).
Second, it seems that the share of surviving firms that exhibited growth fol-lowed macroeconomic movements, measured in the figures as GDP growth. Concerning Cohort 1912, macroeconomic growth slowed down significantly a few years after the outbreak of World War I. The number of firms exhibit-ing growth decreased. It would seem that firms started to grow again as the macro economy improved after some years of negative development during the 1920’s. Even if there were fluctuations during this decade, it seems rea-sonable to assume that the general economic decline in the early 1930’s af-fected the firms’ growth. The share of firms exhibiting growth fell here
153
sharply but increased again as macroeconomic conditions improved during the second half of the decade. The first years of the Second World War wit-nessed once more falling production and demand. GDP growth rates fell during the early years but improved at the end of the war. As can be ob-served, the early war years were represented by relatively low proportions of firms demonstrating growth in Cohort 1912 while the overall economic im-provement thereafter seems to have brought about more growing firms in the cohort. The first years in life for the firms in Cohort 1912 coincided to a great extent with favorable economic conditions. GDP had increased by nearly 13 percent between 1910 and 1914 while the economic growth rate was minus approximately three percent for the period 1915-19. Interest rates also in-creased significantly during the period. In 1918, the lowest interest rate of-fered by Stockholms Enskilda Bank was around thirty percent higher than it had been in 1912-17.277 Unfavorable economic conditions prevailed during the first years in life of the firms in Cohort 1930. Even if the last years of the 1920’s had been characterized by positive development and lower interest rates than during its first years, the crisis, which for Sweden’s part was par-ticularly severe in 1931-32, coincided with the early years of the Cohort. Even so, a relatively large shares of firms displayed growth during the period 1931-33. Therefore, it seems as even though the general conditions were poor, firms – on the whole – grew because of low age. Nonetheless, the aggregate de-velopment of Cohort 1930 seems to have been equally affected by general economic conditions over time. It is not unlikely to think of the increasing shares of firms that grew in the latter half of the 1930’s followed the macro-economic improvement and the subsequent decline during the first years of World War II. Consequently, a difference between the early years of each cohort can be observed: in the older cohort a smaller proportion of firms displayed growth at around five years of age than the older (1916/17 and 1934/35, respectively). As can be observed, the economy was in a downturn in the last years of World War I but in a recovery phase during the latter part of the 1930’s. It is moreover noteworthy that both cohorts displayed a down-turn in the number of growing firms in the beginning of the Second World War. The last observation year for Cohort 1912 is 1944, hence no further information of the subsequent fate of the remaining firms is available when using the present database.278 The development of Cohort 1930 from the last war years and onwards seems however to have been affected by the eco-nomic development, particularly from the early 1950’s and onwards. Al-
277 GDP: Krantz (1997), own calculations. Interest rate: Persson (2001); own calculations. 278 For firms surviving after 1944, there are of course information and statements preserved in the archives. When constructing the database, however, the last observation year chosen for Cohort 1912 was 1944.

154
though the numbers were fluctuating when observing single years, the num-ber of growing firms increased trendwise from the 1950’s to the early 1960’s as did macroeconomic growth. On an aggregate level, therefore, it seems that economic fluctuations were influential at least partially in determining when in time firms grew. A posi-tive relationship between aggregate cohort growth and macroeconomic growth was detected. Similar patterns can be observed concerning changes in the interest rate over time for the two cohorts: during periods of increasing interest rates, the number of firms exhibiting growth during a specific period decreased, signaling a negative relationship. Additional calculations (correla-tions) for these aggregate relationships are presented in Appendix 4.
Table 16. Regression results. Growth, firm-specific variables, and environment. Both cohorts and per cohort.
Both Cohorts Cohort
1912 Cohort 1930
B Sig. B Sig. B Sig.
(Constant) 0.304 0.000 0.184 0.007 0.392 0.000
log Age -0.061 0.000 -0.030 0.068 -0.081 0.000
log Size t-1 0.965 0.000 0.978 0.000 0.961 0.000
log Start-up size 0.013 0.015 0.013 0.331 0.011 0.045
Dummy Last 2 years -0.125 0.000 -0.056 0.115 -0.159 0.000
log GDP growth 0.400 0.029 0.517 0.066 0.456 0.055
log GDP growth t-1 0.094 0.599 0.445 0.057 -0.072 0.766
log Interest rate change -0.161 0.000 -0.265 0.005 -0.115 0.036
log Interest rate change t-1 -0.102 0.025 -0.225 0.006 -0.047 0.395
log Selection rate t-1 -0.032 0.000 -0.040 0.029 -0.049 0.000
R2 0.9356 0.9578 0.9296
R2 adj. 0.9355 0.9575 0.9294
Std. Error 0.4390 0.3294 0.4582
F 9209.52 0.000 2521.81 0.000 6912.82 0.000
df 9 9 9
Source: Cohort 1912 and 1930 Database. Krantz (1997). Persson (2001).
Regression analyses were utilized yet again in order to observe any effects between environmental variables and firm growth. Table 16 reports regres-sion results where firm specific and environmental specific variables were included. GDP growth rates over a one year period (GDP growth), as well as lagged GDP growth (GDP growth t-1) were added to the model; in addition, interest rate change between two years and a one year-lagged variable over interest change (Interest rate change, and Interest rate change t-1, respec-tively) were also included. Finally, the selection rates in each cohort over time, Selection rate t-1, were added.
155
The results largely confirmed the assumptions that environmental factors exhibit significant relationships with firm growth. For instance, macroeco-nomic growth did have a positive influence. For both cohorts, an average increase in the macro economy of five percent compared to the previous year would on average increase firm size by two percent, holding all other vari-ables constant. Similarly, a ten percent increase in the interest rate (not an addition of ten percentage points to the prevailing rate) at a specific year compared to the previous year would decrease average firm size by around 16 percent. In the same way were each of the two cohorts’ macro ‘behavior’ influential: increasing cohort selection rates (Selection rate t-1) a previous year would negatively affect growth of firms, indicating that firms that were of equal age (i.e. from the same cohort) were experiencing harsher times. Furthermore, the two cohorts independently exhibited similar responses to macroeconomic and external events: a positive relationship was on average detected for macroeconomic growth, and a negative concerning rising inter-est rates and selection. As can be noted, some firm specific variables were also in this model insignificant concerning Cohort 1912 (Start-up size, and Last 2 years), even if the age variable now assumed a significant value at the 10-percent level. It is possible that an introduction of environmental vari-ables could explain the behavior of Cohort 1912 better than with only firm specific variables. The surviving firms in Cohort 1912, in particular, that survived for a somewhat longer period of time probably experienced in-tensely fluctuating conditions: from a youth of relative stability and prosper-ity, into severe circumstances at the end of the war and the years that fol-lowed with, among other things, sudden price changes and falling demand. That is perhaps why the Last 2 years variable had no observable effect on the firms in Cohort 1912: selection rates were, as noted earlier, high in the cohort during the years of World War I. Hence, firms in Cohort 1912 had perhaps no ‘time’ to shrink before termination – death may have come very sudden during the depression years.
Controlling for Effects of Size and Age In order to elucidate relationships between environmental variables and the size and age of firms, further tests were employed. One question inquired as to whether firms of different size and age diverged in their sensitivity to changing environmental conditions. Tests for interaction between firm-specific variables (size and age) and environmental variables were performed. Controlling for interaction between independent variables in an analysis can be performed in several ways, using different techniques. One rather common way, occasionally criticized in applied research, is to make group comparisons. Simply put, this implies performing separate regressions for each category of interest, for instance
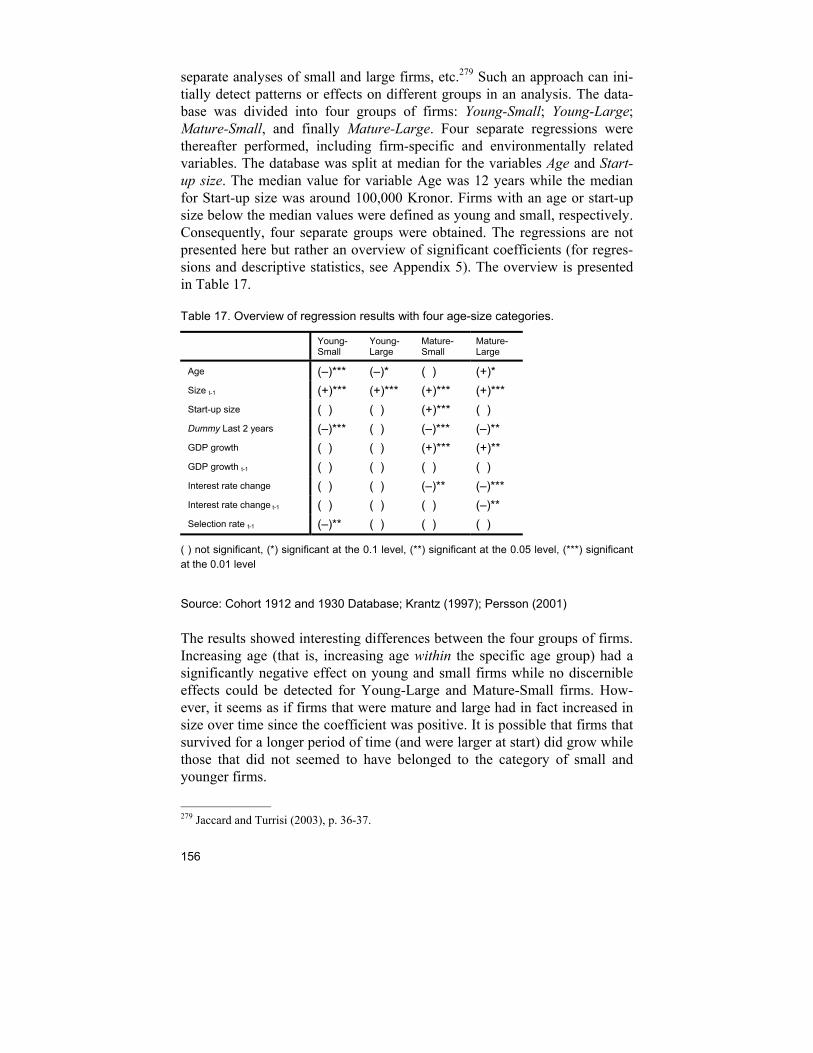
156
separate analyses of small and large firms, etc.279 Such an approach can ini-tially detect patterns or effects on different groups in an analysis. The data-base was divided into four groups of firms: Young-Small; Young-Large; Mature-Small, and finally Mature-Large. Four separate regressions were thereafter performed, including firm-specific and environmentally related variables. The database was split at median for the variables Age and Start-up size. The median value for variable Age was 12 years while the median for Start-up size was around 100,000 Kronor. Firms with an age or start-up size below the median values were defined as young and small, respectively. Consequently, four separate groups were obtained. The regressions are not presented here but rather an overview of significant coefficients (for regres-sions and descriptive statistics, see Appendix 5). The overview is presented in Table 17.
Table 17. Overview of regression results with four age-size categories.
Young-Small
Young-Large
Mature-Small
Mature-Large
Age (–)*** (–)* ( ) (+)* Size t-1 (+)*** (+)*** (+)*** (+)*** Start-up size ( ) ( ) (+)*** ( ) Dummy Last 2 years (–)*** ( ) (–)*** (–)** GDP growth ( ) ( ) (+)*** (+)** GDP growth t-1 ( ) ( ) ( ) ( ) Interest rate change ( ) ( ) (–)** (–)*** Interest rate change t-1 ( ) ( ) ( ) (–)** Selection rate t-1 (–)** ( ) ( ) ( )
( ) not significant, (*) significant at the 0.1 level, (**) significant at the 0.05 level, (***) significant at the 0.01 level
Source: Cohort 1912 and 1930 Database; Krantz (1997); Persson (2001)
The results showed interesting differences between the four groups of firms. Increasing age (that is, increasing age within the specific age group) had a significantly negative effect on young and small firms while no discernible effects could be detected for Young-Large and Mature-Small firms. How-ever, it seems as if firms that were mature and large had in fact increased in size over time since the coefficient was positive. It is possible that firms that survived for a longer period of time (and were larger at start) did grow while those that did not seemed to have belonged to the category of small and younger firms.
279 Jaccard and Turrisi (2003), p. 36-37.
157
a smaller size for smaller and younger firms had a negative effect. The start-up size of firms, furthermore, did not seem to have any effect on size for any group except the one that incorporates Mature-Small firms. In this group, firms that had survived for a somewhat longer period of time seem to, rela-tively speaking, have possessed an advantage in their larger size. Addition-ally, three out of four groups displayed a significantly negative relationship with the dummy variable Last two years, which can be understood as that firms generally decreased in size before termination. An interpretation of the findings therefore is that young firms on average may have been more negatively affected in their growth as they grew older than large firms, while more mature (and larger) firms were not affected by increasing age, or may possibly have been even positively affected. Differ-ences also appeared when observing the significance of the start-up size of businesses in which only mature and small firms showed any significant positive relationship. This might tell about positive effects of a relatively larger start-up size for growth and survival in the longer run. The environ-mental variables – GDP growth, interest rate change and selection rate – discerned further differences. Results showed that GDP growth and interest rate fluctuations had no noticeable effects on growth among firms of low age and small size. Here, only the cohorts’ selection rates showed any significant relationship, meaning that a high termination rate the previous year had a negative influence on growth. Young but large firms demonstrated no such relationship. Therefore, small size – as proposed earlier in the dissertation – was disad-vantageous to growth when observing the effects of termination of each co-horts. Furthermore, macroeconomic growth or interest rate changes did not seem to affect businesses that were young and had a larger size. Rather, sen-sitivity to economic fluctuations, according to the regression results, on the average was displayed by mature firms. For both Mature-Small and for Ma-ture-Large firms, GDP growth and interest rate changes did have an influ-ence: increasing GDP meant generally that firms grew, while increasing interest rates implied shrinkage and vice versa. Consequently, one hypothesis derived from the analysis above could be that the firms’ age made a difference: ‘young’ firms (here, firms were around a decade old) were here not affected by environmental change while older firms were. The separate regression analyses can therefore serve as a founda-tion for extending the model to include interaction variables. Interaction commonly refers to variables that are added to a model in order to incorpo-rate the joint effect of two variables. The effects of separate variables in a model are usually denoted main effects, i.e. the effect of one or several inde-pendent variables. The inclusion of interaction variables takes into consid-eration not only a model with only main effects but also whether two (or several) independent variables have a combined effect. Thus, an interaction
158
effect exists when the effect of the independent variable on the dependent variable differs depending on the value of a third variable, a so-called mod-erator variable. For an example, social science research may take into con-sideration ethnicity when observing what effect the number of years of edu-cation may have on a person’s income. Education might have a greater im-pact on income for some ethnic groups than for others. Ethnicity is thereby the moderator variable. As stated earlier, interaction can be performed in different ways for instance by using dummy variables. In the present case, interaction variables were created by multiplying continuous variables used the previous regression models, theoretically: variable X times variable Z.280 Four interaction variables were created with the explicit purpose of explor-ing the effects of size, age and environmental conditions on growth of firms. The first variable takes into consideration the effect of macroeconomic growth and firms’ start-up size (GDP growth x Start-up size); the second possible effects of macroeconomic growth and firm age (GDP growth x Age), while the third and fourth variable included the interaction between interest rate change and firm start-up size and age, respectively (Interest rate change x Start-up size, and Interest rate change x Age).281 Regression results are presented in Table 18. As can be observed, the ‘main-effects’ still showed significant coefficients concerning e.g. age: in-creasing age still had a negative effect on size. The start-up size of firms now assumed a non-significant relationship when including the interaction vari-ables. Moreover, main effects from GDP growth and interest rate change were on the whole still significant. Furthermore, selection rates in the co-horts were still negatively affecting firm size. Thus, environmental variables generally had a significant effect on the growth of firms. The interaction variables tell of the combined effect of size and environment and age and environment, respectively.
280 Such an approach may according to some produce problems of multicollinearity, i.e. that the two independent variables that are correlated with each other, although for instance Jac-card and Turrisi (2003) do not consider this as a real dilemma in most circumstances. One way to avoid such problems is to mean center both variables (i.e. subtract the mean) before forming the product term, which then results in an interaction variable that is uncorrelated with both X and Z. See Jaccard and Turrisi (2003), especially pp. 3-4; 18-28. 281 The variables were mean centered before calculating the interaction variables.
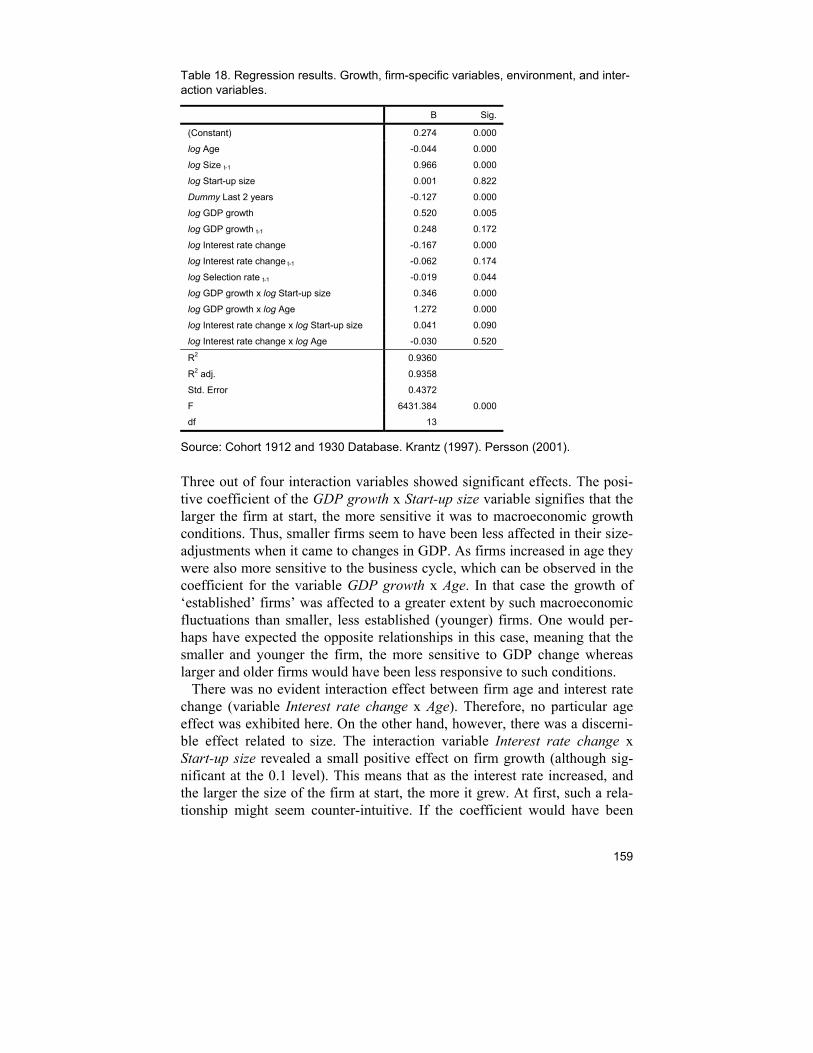
159
Table 18. Regression results. Growth, firm-specific variables, environment, and inter-action variables.
B Sig.
(Constant) 0.274 0.000
log Age -0.044 0.000
log Size t-1 0.966 0.000
log Start-up size 0.001 0.822
Dummy Last 2 years -0.127 0.000
log GDP growth 0.520 0.005
log GDP growth t-1 0.248 0.172
log Interest rate change -0.167 0.000
log Interest rate change t-1 -0.062 0.174
log Selection rate t-1 -0.019 0.044
log GDP growth x log Start-up size 0.346 0.000
log GDP growth x log Age 1.272 0.000
log Interest rate change x log Start-up size 0.041 0.090
log Interest rate change x log Age -0.030 0.520
R2 0.9360
R2 adj. 0.9358
Std. Error 0.4372
F 6431.384 0.000
df 13
Source: Cohort 1912 and 1930 Database. Krantz (1997). Persson (2001).
Three out of four interaction variables showed significant effects. The posi-tive coefficient of the GDP growth x Start-up size variable signifies that the larger the firm at start, the more sensitive it was to macroeconomic growth conditions. Thus, smaller firms seem to have been less affected in their size-adjustments when it came to changes in GDP. As firms increased in age they were also more sensitive to the business cycle, which can be observed in the coefficient for the variable GDP growth x Age. In that case the growth of ‘established’ firms’ was affected to a greater extent by such macroeconomic fluctuations than smaller, less established (younger) firms. One would per-haps have expected the opposite relationships in this case, meaning that the smaller and younger the firm, the more sensitive to GDP change whereas larger and older firms would have been less responsive to such conditions. There was no evident interaction effect between firm age and interest rate change (variable Interest rate change x Age). Therefore, no particular age effect was exhibited here. On the other hand, however, there was a discerni-ble effect related to size. The interaction variable Interest rate change x Start-up size revealed a small positive effect on firm growth (although sig-nificant at the 0.1 level). This means that as the interest rate increased, and the larger the size of the firm at start, the more it grew. At first, such a rela-tionship might seem counter-intuitive. If the coefficient would have been
160
negative the relationship could have been interpreted as that the growth of firms would have diminished as interest rate and start-up size increased. Thus, holding all other variables constant, the smaller the start-up size of the firm, the greater would be the decrease in its size. Here however, the coeffi-cient was positive. One interpretation could be that larger firms received higher returns on assets or investments – and thereby grew more – when the interest rate increased. It could be assumed that larger firms usually have greater or more diversified (financial) assets than small businesses. When interest rates are rising, larger firms may invest some assets or excess re-sources in interest-bearing bonds. Smaller firms may not have that opportu-nity. This is however only speculative and further investigation is called for concerning these circumstances.
Conclusions and Discussion The present chapter has dealt with the growth of firms over time, with an explicit aim of taking a long-term perspective and to investigate whether exogenous conditions could explain when and to what extent firms grew. In order to do so, longitudinal cohort data consisting of firm level data on firms founded in 1912 and 1930 were used. The author, using public material, has compiled this database. The two birth cohorts experienced different founding conditions as well as fluctuating conditions over time. Cohort 1912 was founded under more or less favorable conditions but also went through two major wars and depressions. Cohort 1930 was born into a period of eco-nomic decline and crisis and experienced after nearly a decade after its birth the initially severe conditions of the Second World War (something also experienced by the surviving firms in Cohort 1912, but at a considerably more mature age), as well as the ‘golden age’ of the post-war Swedish econ-omy. As has been suggested in the present study, growth of the firms in question was affected by events and conditions beyond the scope of the indi-vidual firm. Economists with an interest in firm growth have frequently investigated the correlation between growth, size and age of businesses. Similarly, re-search in entrepreneurship and small business has displayed an equal interest in such relationships with a keen interest in new and small firms. Particularly in entrepreneurship research, a key concern has frequently been researching the degree to which individual oriented (entrepreneurial) variables affect observed growth and survival rates among small and newly founded busi-nesses. Indeed, much truth lies probably in the fact that skilled, motivated entrepreneurs stand a better chance in succeeding to make their business grow than new, inexperienced persons. Even if the present investigation has not studied such circumstances, that was most likely also the case when it comes to the firms in Cohort 1912 and Cohort 1930. Complementary expla-
161
nations are however necessary in order to understand fluctuations and pat-terns over time. At any rate, such explanations or perspectives can shed light on a specific phenomenon from a different angle. ‘Environment’ is normally employed in research as an umbrella term con-sisting of a fairly wide set of external or exogenous factors: industry-specific fluctuations, institutions, policy, economic growth, and so on. This is per-haps not that problematic since most social science research is characterized by the same problem. What may be more surprising is that fewer studies, relatively speaking, seem to have had a pronounced interest in exploring the relationship between firm growth and the environment. While most would admit that events and circumstances that are ‘exogenously’ given for the individual business are of importance in explaining its development, it has not been equally acknowledged in applied research as have individual re-lated and structural factors. Even so, various academic fields have in both theoretical as well in empirical studies identified the wide concept environ-ment as significantly important when it comes to firms’ possibilities to grow. In this particular study environment was measured as growth of the macro economy, changes in the interest rate, as well as aggregate cohort ‘behavior’ in terms of each cohort’s selection rate. While I am aware that alternative (available) indicators of the environment very well may have been used – for instance aggregate unemployment data etc., as in previous research – I do on the other hand think that the variables chosen here capture a significant part of the reality experienced by the firms in question. Since the cohorts consist of heterogeneous firms, a general/mutual indicator such as GDP or the equivalent may be the best alternative to employ. Additionally, the common firm specific indicator (size) used in the study was an individual firm’s as-sets during a particular year. Perhaps other variables – say, employment figures – would have given different results in the analysis even if previous research has also often claimed that there usually exists a strong correlation between firm specific size indicators. It is beyond the scope of this disserta-tion to investigate whether this is the case. Here we have dealt with firms that often were small. The only artifacts from those firms are annual state-ments – documents that frequently were simple to their nature. Even if it can be assumed that most of the firms had employed personnel (or at least were self-employment businesses), the sources in more than nine cases of ten do not tell us this. What, then, are the conclusions in this study on firm growth and the influ-ence of environmental phenomena? As found in much previous research, the growth of firms seems to have been more vigorous at young age and, fur-thermore, small firms generally had higher growth rates than large ones. Hence, this study confirms the findings of previous research. However, by introducing environmental variables, further relationships could be identified, and generally both cohorts in the study exhibited similar ‘behavior’ concerning the relationship between firm age, size and environ-
162
ment. Some previous research findings are supported by the results in the present study. Research with an explicit focus on the relationship between firm level growth and economic fluctuations or the environment has often used industry specific or aggregate data as independent variables. An as-sumption here has been that falling aggregate demand, higher unemployment rates or macroeconomic shocks affect firms’ market situation. It is then not unreasonable to expect that growth rates among firms are falling. Thus, stud-ies using empirical data on different economies and different time periods support my findings even if actual research methods diverge.282 Theoretical considerations in predominantly neoclassical fields as well as more hetero-dox schools (such as Penrose and Dahmén) have furthermore assumed that firms may react or respond to events and/or cyclical movements in their sur-roundings. This also seems to have been true considering the two cohorts born in 1912 and 1930, particularly when firms had reached a somewhat more mature age. The assumptions in the present chapter were also that increasing GDP (ag-gregate demand) would have positive effects on observed firm growth, while increasing interest rate would signal increasing credit costs. So it was seen that firms expanded when the economy did; that increasing interest rates led to firms’ contraction. Therefore, in times of relative prosperity – high or relatively stable macroeconomic growth and stable interest rates – one can assume that individual firms on average had a greater chance to grow than during periods when the macro economy contracted or credit costs increased significantly. The inclusion of ‘generation effects’ in the analysis – measured as each cohort’s selection rate, indicating that ‘fellow firms’ from the same generation on average experienced harsher times – displayed similar effects on firm growth. Therefore, not only a connection between aggregate macro data (GDP) and interest level changes but also less-aggregate (meso) condi-tions on the population level were discovered. Furthermore, when observing effects of age and start-up size of firms there were some interesting results. The purpose here was to observe whether firms of different size and age displayed different growth behavior when addressing the issue of environmental variables. Interest rate changes gener-ally had a negative effect on firm growth. On average, firms shrunk when interest rates increased. However, larger firms were more sensitive to in-creasing interest rates than smaller in the sense that increasing interest had a positive effect on those firms’ growth. It was suggested here that larger firms might have received higher returns on assets or investments by investing some resources in e.g. interest-bearing bonds or the equivalent. The interest rate reflects not only credit costs – i.e. costs for borrowing – but also the alternative cost for keeping assets totally liquid. Hence, larger firms may 282 See for instance Davidsson and Delmar (2001); Heshmati (2001), and Almus and Nerlin-ger (1999).
163
have had that alternative if they had excess resources, something smaller ones could not. However, even if those relationships may have to be investi-gated more systematically in future research, it seems as a reasonable as-sumption. It was moreover found that larger and older firms were more sensitive to the business cycle (GDP growth) than younger and smaller ones. Previous research results have come to similar conclusions and proposed that this can be explained by the fact that a greater number of large firms than small ones tend to survive in the longer run. When business conditions worsen, large firms contract in size while smaller simply may be forced to close down.283 Thus, while business terminations may be affected by macroeconomic fluc-tuations, particularly smaller and younger ones (as investigated in Chapter 5), small (young) firms may be less sensitive than large/old ones when it taking business growth and macroeconomic fluctuations into consideration. It is reasonable to assume that small firms mainly operate on local markets. This was perhaps particularly true during the first half of the 20th century. Thus, larger firms were possibly more active on national or international markets than smaller ones and thereby more sensitive. An alternative or complementary explanation to the sensitivity of larger firms to the GDP growth rate may be that more small firms may have no alternative uses for their resources. Support for such arguments can be found in for instance Anderson and Thomas (1978), that even when conditions have changed for the worse small firms still remained in business. Size-adjustments down-wards could, under certain circumstances, have been impossible for smaller firms since they already may have been already operating on a minimum scale and could not downsize – hence they were less affected by falling de-mand. I would like to claim that the scientific strength of this particular study lies in the long-term perspective and that a large number of observation years (6,600) of a fairly large set of businesses are included. A further advantage is the ambition to include all firms from the two cohorts, which is the strength in employing a prospective research design. Even if this was not the case in reality (mainly because of short life-spans; see discussion earlier in the chap-ter), many studies on firm growth are often limited in the sense that ‘small’ firms occasionally are relatively ‘large’ compared to the actual, empirical size of small firms in an economy or in a real, empirical population/cohort. Data availability in public registers etc. not sometimes does contain informa-tion on the smallest firms. Hence, while this study is marked by similar prob-lems – as we saw, missing cases were normally smaller firms – I do think that a greater number of (in a relative sense, and from a cohort perspective) small firms are included in the present study than in other ones. Hopefully, the research results are representative to a greater extent. 283 Boeri and Bellmann (1995).

164
To include more birth cohorts and to expand the analysis further would be of great interest. Perhaps it would further elucidate the relationship between the growth of firms and their environment. For instance the inclusion of more cohorts would make it somewhat easier to separate age effects from size effects and, furthermore, to separate cohort effects from period effects, and so on. By assuming a longer time perspective and by using longitudinal data, developments and relationships that are difficult to discover with short-term cross section data and with an individual oriented focus, complemen-tary explanations to firm growth can be generated. Therefore, even if the findings here in many ways may appear self-evident – i.e. that business be-havior is an interplay between the firm and the environment – I do also think that such circumstances to a greater extent must be taken into consideration in theoretical and empirical contexts. If, for instance, the creation of benign environments for new small businesses (entrepreneurs) are that important as both researchers and policy makers claim, then it would be of great use to elucidate the relationship between environment and firm development even more.
165
8. Succession and Success? Board Turnovers and Firm Performance
Introduction Business leaders and managers are commonly regarded as important in ex-plaining the success or failure of firms. In business studies in general and, to a considerable extent, in business history, much attention has been directed towards the attributes, backgrounds and behavior of business leaders. Or-ganization and management research have recognized successions, or turn-overs, of leaders and owners as important events in the development of a business firm or an organization. Like much research in social sciences, there has been much debate on cause(s) and effect(s); studies have for in-stance addressed the reasons as well as the timing of succession events in firms. Furthermore, there has been extensive debate concerning the effects of new management or ownership on firm performance. The purpose with this chapter is to study the timing and effects of succes-sion events among newly founded and mostly small firms over time. Here, attention is directed towards the relationship between firm performance and observed succession events that took place in the firms. My empirical mate-rial consists of the two birth cohorts of joint-stock companies from 1912 and 1930, also analyzed in Chapter 7 regarding their growth over time. There-fore, 420 firms are ‘traced’ over time from their birth to their (prospective) termination or, at most, over a period of thirty years with respect to each individual firm’s development and possible changes of owner-ship/management. Some firms displayed quite short life spans, while others stayed in business for a very long time and the database that constitutes the foundation for the empirical investigation of the 420 firms contains nearly 6,600 observation years. Hence, and unlike much previous research on suc-cession and performance, longitudinal, firm-level data is used in the study, including small, large, young and old businesses.
166
Successions and Performance, Management and Ownership When a business undergoes a crisis, perhaps a typical image that comes to mind is that management resigns or is dismissed. At least, such an outcome could very well occur in large, established corporations. The new leaders here are supposed to improve business performance and reputation. Whether businesses in fact exhibit improved performance after a renewal of leader-ship has however been considered debatable in research.284 A closely related problem has been the relationships between managers in and owners of (of-ten larger) companies. Least of all in corporate governance such relation-ships have been recognized as essential in explaining the behavior and per-formance of firms.285 The management-owner relationship is not in focus per se in the present study. Yet, by way of introduction it might be reasonable to discuss related questions in a longitudinal investigation of succession in young, often small firms. Research has often acknowledged that small or medium firms (SMEs) are owned and operated in other ways than are larger ones, as well as that SMEs commonly operate under different conditions. Frequently, the owner-manager in smaller firms has been placed on an equal footing with the business firm as is indicated in entrepreneurship and small business research286 as well as in economic theory.287 Small firms, it is often stated, constitute opposites to large ones. The former, it is claimed, are less complex organizations where decision (management) and risk (owner-ship) fall under the same person as a rule than in large businesses. Hence, small business owners often have dual roles as both owners and managers. Such organizational arrangements have been viewed as advantageous as well as unfavorable for the small business, even though empirical studies of gov-ernance practices in small firms have been less common. Research specifi-cally focused on manager or ownership successions and turnovers have, similarly, mainly investigated larger or very large businesses. Successions and other related questions in smaller firms have constituted a less attended research field.288
284 Greiner and Bhambri (1989). 285 Fama and Jensen (1983), and Schleifer and Vishny (1997). 286 See for instance Shane (2003), pp.4-5. 287 Such assumptions are for instance made in the ’classical theory of the firm’; Stauss (1944), Simon (1964), p. 2f, and Chandler and Hanks (1994). As Thurik and Wennekers (2004) have pointed out is entrepreneurship and small business related but certainly not synonymous concepts. 288 On the one hand, such dual roles of owners-managers in smaller firms are recognized as reducing monitoring costs and increasing the growth possibilities. On the other, opposite effects have been identified, such as organizational inertia due to lack of time for necessary strategic issues which, in turn, hampers firm performance. See Gabrielsson (2003), for a study of governance in SMEs. See also Huse (2000), esp. 284ff, and Bennet and Robson (2004); the
167
Lack of empirical data on small businesses can perhaps explain at least partially why large firms have received more attention in governance and succession research. It is, in addition, probably rather complicated to obtain an image of changes in ownership and management in business life over the course of time. A dominating interest in big business within economic his-tory can be a possible explanation.289 Business historians have as a rule in-vestigated the development of large, single businesses and studied their owners and leaders. Owners and managers have been attributed significant roles in explaining the development of the business.290 In relation to such research, one proposition put forward is that there has been a general devel-opment from family-owned and family-managed firms towards a more ac-centuated separation of ownership and management, at least in the large-scale industries and the big business sector. It is here that distinct stages in general business life have been identified. For example, business economist Sune Carlson wrote in 1945 that it was quite common from the 1800’s until the First World War that “…[you] either became a business leader by found-ing your own business, or you inherited one” (my translation). Over time, when the industrial society entered a more mature stage in which business firms grew in both organizational complexity and in size, there was a ten-dency towards a more distinct differentiation between business owners and corporate leaders.291 Such descriptions over changes or shifts in the overall business life can perhaps be valid when studying the development of, as well as within, larger industrial companies or groups. It might perhaps be less applicable for SMEs or other sectors in the economy. Here, the picture is rather unclear; to my knowledge our understanding of the historical development is rather incom-plete. It could be hypothesized that while there have been significant changes over time in the organization, ownership and leadership of large corporations, smaller businesses have generally been owner-managed to a
latter claim that board size, structure and competence have a rather weak link with firm per-formance. 289 Gratzer (1995). 290 For an overview and discussion, see for instance Sjögren (2003), pp. 27-30. 291 Carlson (1945), p. 95: ”… [man] blev företagsledare genom att själv grunda företag, eller så ärvde man ett”. For example has Matti (2003) studied the process of professionalization of management and Swedish managers between 1900 and 1940. The image of various distinct stages in the ownership in business life emanate from a view that the dominating form of enterprise was represented by the family business, which was succeeded by a phase in the more mature industrial society characterized by professional managers’ power. So called ‘entrepreneurial owners’ – a term from Alfred D. Chandler – were at least in large scale in-dustry or in big businesses in Sweden rather unusual during the first half of the 20th century; see Glete (1999). Glete states that the three-stage model proposed by Chandler is not repre-sentative for the Swedish development. Chandler claims that businesses, in a first stage, were managed and led by their owners, and thereafter managed by professional leaders (day-to-day business) while owners themselves made the strategic decisions. Finally, in the third stage, there was a distinct separation of management and ownership.
168
greater extent. Research results have however shown evidence of both di-verging and complex relationships. Systematic ‘reconstructions’ of the de-velopment of smaller Swedish joint-stock companies during the first decades of the 1900’s have demonstrated that ownership and management, just as in bigger businesses, were separated to a large degree. Ownership was often dispersed; significant ownership turnovers (successions) were moreover quite common. Thus, continuity with respect to ownership and managers in the firms were not always a reality even in smaller businesses.292 Investigations of more present-day conditions in smaller businesses have revealed similar results and pointed to regular occurrences of ‘portfolio en-trepreneurs’, that is, individuals that are involved in more than one business as both managers and owners.293 Cross-holdings as well as multiple (active) ownership therefore can constitute phenomena that are common also outside the sphere of big business. Consequently, it may be in many instances ra-tional to recognize that the smaller firm is simple by its nature, while the large (or the larger) business is more complex. Furthermore, it may be rea-sonable to assume that the two normally face rather different business condi-tions. This image may however be too simplistic. So may also the concep-tion(s) of the small business as being lead by one single owner-manager, along with assumptions that small businesses behave and are owned and managed in ways (both historically and in present-day conditions) that differ significantly from their larger counterparts.
Successions’ Causes and Consequences Even if it can be assumed that management and management competence and behavior is significant for the individual firm’s performance and devel-opment, and even if succession of management and owners in businesses has been a long-standing research topic, an overview of previous research re-sults, nevertheless, gives an ambiguous and rather contradictory picture. Research that has specifically concentrated on turnover or succession of leadership or ownership in business organizations has presented three main
292 In his investigation of the industry of automated vending restaurants/machines, Gratzer found that ownership in fact was highly dispersed during the industry’s first phases of forma-tion and expansion. When the industry matured, ownership became more concentrated, such that in some cases firms became mere family businesses. Gratzer (1996), pp. 195-196. 293 Rosa and Scott (1999) conducted an investigation of multiple ownership in SMEs and came among other things to the conclusion that vast connections between different firms could be discovered concerning ownership representation. A fully firm-focused approach would, according to the authors, not have revealed such patterns. Research on interlocking directorates have in addition pointed to the occurrences of cross-ownership and representation in larger businesses; see e.g. Bunting and Barbour (1971), or Palmer (1983). Furthermore, other research results have proposed that duality can be frequently discovered even among large businesses (for instance that the CEO and the chairman of the board is the one and the same person). See Baliga et al. (1996), pp. 41-42.
169
propositions. First, one part of research results has implied that a succession event generates an organizational crisis. Organizational performance is therefore affected negatively; succession of management or ownership is here viewed as a disruptive event for the firm. Second, another part of previ-ous research results has come to the opposite conclusion and suggested that succession as such in fact improves performance. Third, another body of empirical evidence has proposed that the relationships between succession and firm performance are weak. There is reason to return to previous re-search results along with discussions concerning measurements and opera-tional definitions in more detail below. Since the ‘behavior’ of business organizations – or organizations in general – along with the actions, backgrounds, motivations and skills of business leaders and owners has constituted a long-standing research issue in many social sciences, it is a somewhat difficult task to present a representative and ample description of previous approaches and perspectives in this limited space. As stated earlier, the business owner or manager (often referred to as the entrepreneur) has frequently been integrated with the business as an entity in the case of SMEs. Therefore one assumption, rooted in neoclassical economic theory, is that an entrepreneur exits the firm if he or she under-performs and that also the firm is disbanded. A difference between an entre-preneurial/owner-manager exit (failure) and a business failure is commonly acknowledged; to assume that the two phenomena generally are synonymous would be too simplistic.294 However, assumptions in economic theory can provide some relatively reasonable insights as to why managers/owners might choose to exit a busi-ness. Some have suggested that the business owner or the dominating owner discovers better opportunities and alternative uses for hers or his resources. Consequently, the owner removes those resources either by terminating the business or by selling it. And, accordingly, the owner exits the business while the business as such goes on. Thus, an individual after starting or ac-quiring a business will in each period that follows decide to continue the business or to separate from it.295 The development or ‘fate’ of the ongoing business after an owner’s exit is perhaps more unclear. Asymmetric informa-tion, as defined in economic theory, would imply that the seller possesses more knowledge of the business than the prospective buyer.296 One theoreti-cal situation would then be that the business as such has been managed poorly, or is (nearly) insolvent, or that market conditions have deteriorated. Succession in ownership would then possibly result in a higher risk for ter-mination or deteriorated firm performance since the buyer (i.e. the new ‘en-trepreneur’) holds less information. 294 Storey (1994), pp. 87-88. 295 See Holmes and Schmitz (1995) and Gimeno et al. (1997). 296 See Akerlof (1970).
170
There is however reason to assume that an individual’s (or a team’s) choice to exit a business may depend upon other circumstances. Succession in a family business is one possible situation in which, it might be presumed, no one has a reason to withhold information about the business from the successor. Another issue concerns the size and age of businesses, e.g. is it a small and relatively young firm, or is it a large established corporation? Such conditions could have consequences for an owner’s or owner-manager’s freedom of action and the set of choices or options that are available. For instance, a stockholder in a larger company can choose to exit (sell) or use the right to vote at the stockholders’ meeting. Therefore, this owner has a set of options.297 This might not be so in the case of the small business: postula-tions which presume that managers/owners separate from the business due to discoveries of alternative uses of their resources, also assume in a large sense that resources or assets can be reallocated rather frictionless from one eco-nomic activity to another. They also assume that resources have alternative uses. However, apart from the fact that business owners (or for that matter other individuals) might not always be aware of alternative uses or might not be ‘rational’ in their decisions, some resources or assets – firm- or industry-specific – are tied for instance to the specific business in question. Alterna-tives, furthermore, are not always necessarily ‘given’.298 This would imply that not all types of resources are easily transferred from one economic ac-tivity to another. In situations where no alternative uses exist, a business or a business owner might, in spite of losses, continue operations.299 Business owners might also value their own business more than others would – long-standing small business owners (or as in the case of family firms) often value their businesses more than would an ‘outsider’, or would the market. A life’s work might not easily be voluntarily sold or liquidated. Thus, although to some extent it might be reasonable to assume that owner-manager succes-sions can be affected by the discovery of alternative opportunities, there are also in my opinion several arguments that could be put against such assump-tions. Other viewpoints related to managerial behavior and action could perhaps shed some further light on the issue, since management studies and research focused on the skills and motivation of business leaders or owners (natu-rally) accentuate the importance of such attributes. For example, Edith Pen-rose’s theory (1959) has been influential. While not considering leadership
297 See for instance Albert O. Hirschman’s (1972) theory of exit, voice and loyalty. 298 Erik Dahmén has for instance been critical towards assumptions in neoclassical economic theory. See Dahmén (1992). See also Cyert et al. (1956) or Simon (1979) for discussions over decision-making in businesses and economic theory. 299 Anderson and Thomas’ (1978) study of small tobacco farms in seventeenth century Colo-nial America gave evidence of such circumstances.
171
succession as such, Penrose emphasized that managerial abilities were im-portant in explaining performance. Planning is here a key concept, and there-fore continuity of some kind is essential for business performance, at least in the long run. Penrose also stressed that for small firms, planning and release of managerial services as in the case of large businesses might become prob-lematic due to the formers’ limited resources.300 Such a theory could in some way shed some light on succession – at least if succession is viewed as an event that ‘disrupts’ planning for expansion for the individual firm since there are discontinuities in management or leader-ship, particularly in smaller firms. Arguments similar to Penrose’s have been proposed in other circumstances, not least in life-cycle theories of firms in which management practices are assumed to differ depending on the age and size of the business. In the early stages of the life of a business, creativity and delegation are seen as more important than coordination, which is more important in a more mature stage. Therefore, as firms mature (if they indeed succeed to survive), they will be managed differently.301
Previous Research on Succession and Performance In management and organization studies successions or leadership turnovers has been one of the most frequently addressed research questions.302 In em-pirical research that has had a specific focus on the causes and effects of succession in business firms, contradictory assumptions and explanations have been put forward as to why firms exhibit varying performance in con-nection to observed succession events. Some have viewed firms and organizations as adaptive in the sense that changed conditions – conditions that can be firm specific (internal) or relate to changes in their environment – necessitate adjustments. In the strongest sense, when conditions are poor and, it is assumed, the firm exhibits weak performance, succession of leadership is hence beneficial for the firm and serves as a catalyst to adaption. Therefore, it has here been assumed that the
300 Over time, if planning is consistent, managerial resources (services) are released, which in turn facilitate expansion of the firm. This is followed by periods of relative ‘stagnation’: further expansion must be planned and (new) managerial services and resources again must be accumulated. See Penrose (1959/1995), especially pp. 43ff, and pp. 215ff. 301 Management problems and principles are thought of as rooted in time. The critical task for management is to find a new set of practices for the next period in the firm’s development since its development can be categorized into distinct phases. The view of a life cycle of firms, using biological analogies, is rather well established. Firms – like humans – are thought of as going through various stages: from birth to adolescence, maturity, old age and finally death. For instance Garnsey (1998) has developed a model that builds on Penrose’s theory. Greiner (1972) identified for instance five distinct management phases in the chronology of a business, which were (in time order): creativity, direction, delegation, coordination, and col-laboration. See also Adizes (1988). 302 See Wagner, G. et al. (1984).
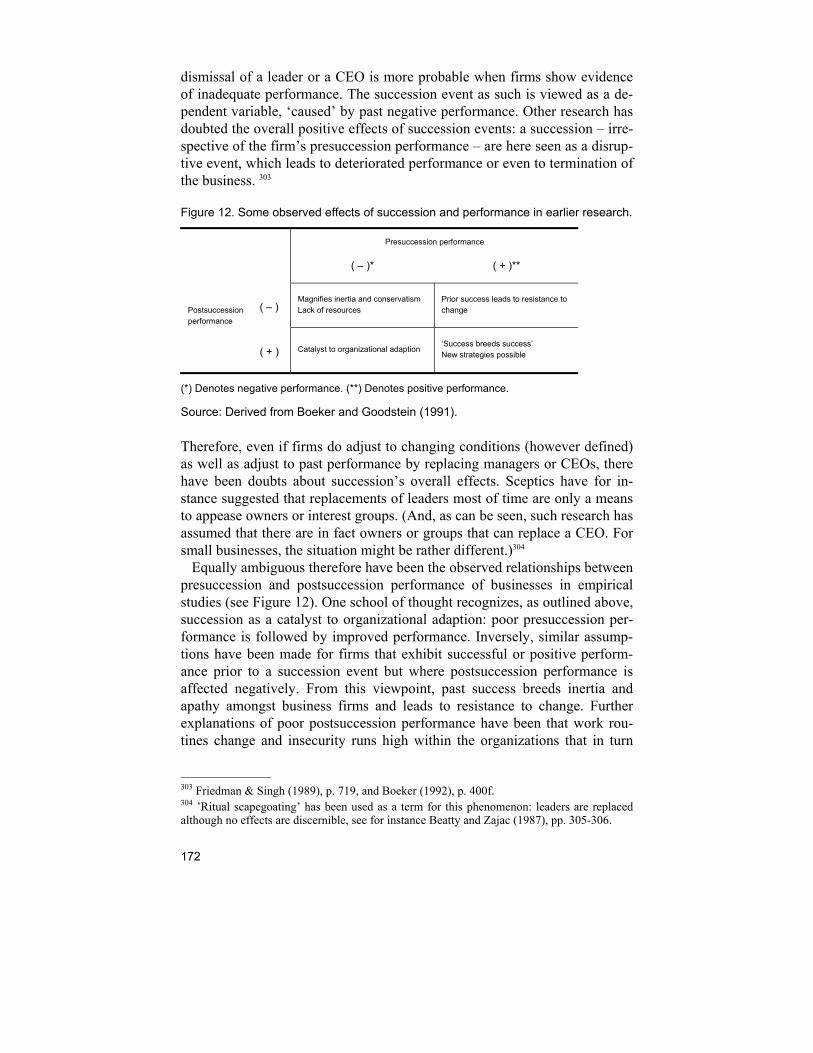
172
dismissal of a leader or a CEO is more probable when firms show evidence of inadequate performance. The succession event as such is viewed as a de-pendent variable, ‘caused’ by past negative performance. Other research has doubted the overall positive effects of succession events: a succession – irre-spective of the firm’s presuccession performance – are here seen as a disrup-tive event, which leads to deteriorated performance or even to termination of the business. 303
Figure 12. Some observed effects of succession and performance in earlier research.
Presuccession performance
( – )* ( + )**
Postsuccession performance
( – )
Magnifies inertia and conservatism Lack of resources
Prior success leads to resistance to change
( + ) Catalyst to organizational adaption
‘Success breeds success’ New strategies possible
(*) Denotes negative performance. (**) Denotes positive performance.
Source: Derived from Boeker and Goodstein (1991).
Therefore, even if firms do adjust to changing conditions (however defined) as well as adjust to past performance by replacing managers or CEOs, there have been doubts about succession’s overall effects. Sceptics have for in-stance suggested that replacements of leaders most of time are only a means to appease owners or interest groups. (And, as can be seen, such research has assumed that there are in fact owners or groups that can replace a CEO. For small businesses, the situation might be rather different.)304 Equally ambiguous therefore have been the observed relationships between presuccession and postsuccession performance of businesses in empirical studies (see Figure 12). One school of thought recognizes, as outlined above, succession as a catalyst to organizational adaption: poor presuccession per-formance is followed by improved performance. Inversely, similar assump-tions have been made for firms that exhibit successful or positive perform-ance prior to a succession event but where postsuccession performance is affected negatively. From this viewpoint, past success breeds inertia and apathy amongst business firms and leads to resistance to change. Further explanations of poor postsuccession performance have been that work rou-tines change and insecurity runs high within the organizations that in turn
303 Friedman & Singh (1989), p. 719, and Boeker (1992), p. 400f. 304 ’Ritual scapegoating’ has been used as a term for this phenomenon: leaders are replaced although no effects are discernible, see for instance Beatty and Zajac (1987), pp. 305-306.
173
affect performance negatively.305 Hence, studies that have identified inverted relationships between firm performance surrounding succession events have viewed such events as breaks or disruptions in organizational momentum. Succession is useful when firms are experiencing stagnation and deteriorat-ing performance (for whatever reason). It is however inefficient – and leads to deteriorated performance – when firms’ previous performance has been positive.306 Other studies have maintained opposite relationships (Figure 12). It is here assumed that weak prior performance frequently is followed by weak postsuccession performance, and vice versa. Succession here has a moderat-ing or a reinforcing effect on a business. The explanation put forward here is that a business organization that exhibits a negative development will con-tinue to do so since it strengthens organizational conservatism and inertia. Similarly, firms that have displayed positive performance and that (for some reason) go through a succession event will also exhibit positive develop-ments after the succession since prior performance, among other things, gen-erates excess resources to the firms.307 Such assumptions might be inter-preted as that successions and changes of leadership and ownership might not have any effects. However, as stated, succession events are not here con-sidered insignificant but rather have the role of moderators of prior perform-ance; they do consequently affect the direction in which firms develop. Al-though, as I understand it, no study of successions has addressed the problem from that particular viewpoint, an approach that perceives successions as moderators is to some extent in line with assumptions in institutional eco-nomic theory. Douglass North (1990), e.g., points out the self-reinforcing mechanisms in economic systems, among other things the presence of large setup or fixed costs, and adaptive expectations among economic agents, which can explain the path of development.308 Hence, businesses – irrespec-tive of whether new owners or leaders have entered – will accordingly run the ‘risk’ of continuing operations in the same manner as before (see also the discussion regarding alternative uses of assets for especially small firms, above).
305 See Boeker and Goodstein (1991) and Carroll (1984). 306 Miller (1993), pp. 654-656. 307 Boeker and Goodstein (1991), pp. 806-808. 308 North addresses these questions from a macroeconomic viewpoint, i.e. path dependence and different economic or technological solutions at the macro level; see North (1990), pp. 93-95.
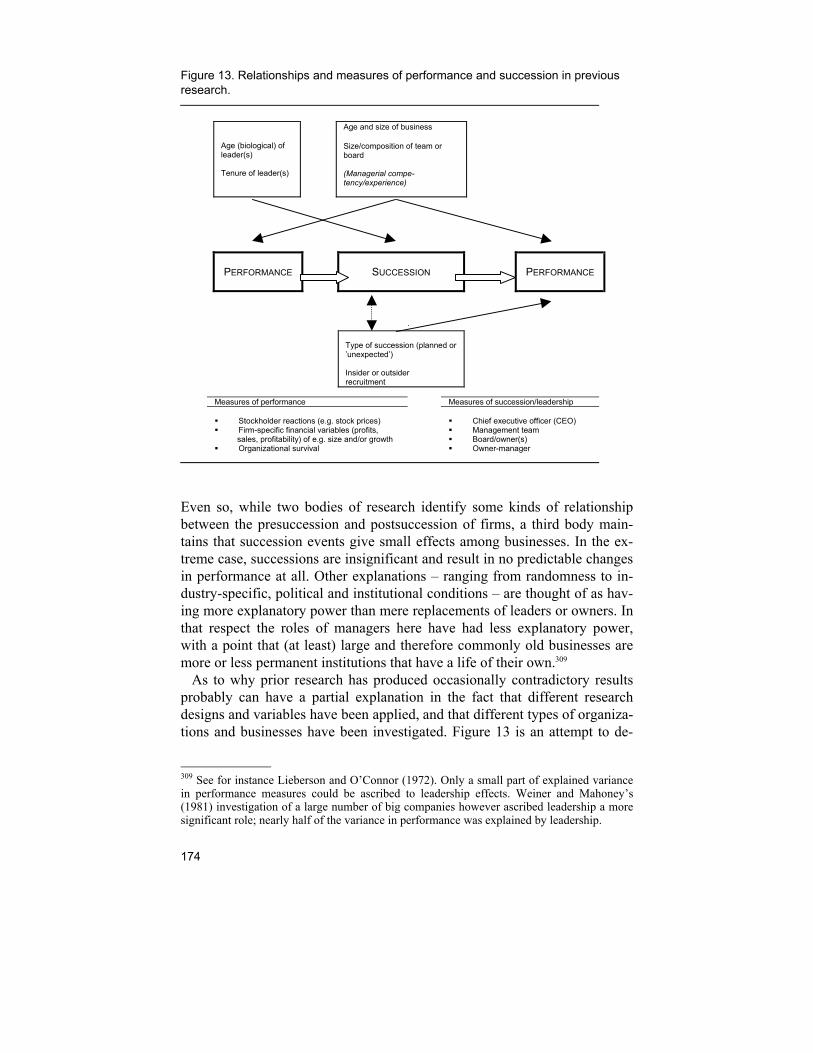
174
Figure 13. Relationships and measures of performance and succession in previous research.
Age (biological) of leader(s) Tenure of leader(s)
Age and size of business Size/composition of team or board (Managerial compe-tency/experience)
PERFORMANCE
SUCCESSION
PERFORMANCE
Type of succession (planned or ’unexpected’) Insider or outsider recruitment
Measures of performance Measures of succession/leadership
Stockholder reactions (e.g. stock prices) Firm-specific financial variables (profits,
sales, profitability) of e.g. size and/or growth Organizational survival
Chief executive officer (CEO) Management team Board/owner(s) Owner-manager
Even so, while two bodies of research identify some kinds of relationship between the presuccession and postsuccession of firms, a third body main-tains that succession events give small effects among businesses. In the ex-treme case, successions are insignificant and result in no predictable changes in performance at all. Other explanations – ranging from randomness to in-dustry-specific, political and institutional conditions – are thought of as hav-ing more explanatory power than mere replacements of leaders or owners. In that respect the roles of managers here have had less explanatory power, with a point that (at least) large and therefore commonly old businesses are more or less permanent institutions that have a life of their own.309 As to why prior research has produced occasionally contradictory results probably can have a partial explanation in the fact that different research designs and variables have been applied, and that different types of organiza-tions and businesses have been investigated. Figure 13 is an attempt to de-
309 See for instance Lieberson and O’Connor (1972). Only a small part of explained variance in performance measures could be ascribed to leadership effects. Weiner and Mahoney’s (1981) investigation of a large number of big companies however ascribed leadership a more significant role; nearly half of the variance in performance was explained by leadership.
175
scribe variables and relationships identified in earlier research. Frequently the tenure of managers or board members – as well as their biological age – have been used as explanatory or independent variables in the study of suc-cession. Irrespective of the size of a business, a longer period of business activity eventually makes a succession event inevitable; the longer a busi-ness continues, the more probable is succession.310 Other commonly used indicators that, presumably, affect the postsuccession performance of firms have been team or board size, as well as from where new leaders are re-cruited (i.e. inside or outside recruitment).311 Further factors are also considered crucial in explaining the performance of firms. Unexpected occurrences – such as deaths or involuntary resignations of leaders – have been recognized as non-comparable with planned succes-sions in businesses (such as customary retirements). The outcomes of firm performance may as a result differ significantly. Some have therefore recog-nized that much explanatory power lies in knowledge of the forces initiating leadership or ownership change.312 Several other situations and contexts that could explain why firms exhibit different performance behavior could very well be accounted for. Here, perhaps, it might be sufficient to say that many explanations of both succession and its effects have been proposed in a large number of studies. Nevertheless, it should be pointed out that most studies on successions have investigated large businesses. While researchers with a distinct focus on large corporations might not be forced to consider possible effects of the age and size of businesses, a study (such as this) that utilizes longitudinal data on for the most part small – and in many cases young – firms may very well have to. A one-sided or dominating focus on large businesses can pro-duce biased results and erroneous generalizations. Investigations of smaller and younger businesses have suggested that such variables are of impor-tance. Large firms are often in a relatively mature phase in their organiza-tional life cycle; at least it can be assumed that they have a lower death risk than that of young and small firms. Hence, relative to the latter, large busi-nesses can without any significant consequences experience succession events. It has been proposed that the process of succession in large, bureau-
310 See e.g. Boeker (1992), p. 400f, or Wagner, G. et al. (1984). Grusky (1961b), p. 262 has put is as: ”Since man is mortal, all organizations, large and small, must experience succes-sion”. 311 Examples of such studies are Boeker (1992, 1997); Helmich and Brown (1972); Helmich (1974); Wagner, G. et al. (1984), and Haleblian and Finkelstein (1993). 312 Friedman and Singh (1989) studied stockholder reactions to successions in large quoted companies and maintain that it is important to be aware of the performance contexts in which successions occur and the forces initiating the changes. Outsider or insider recruitment is an example of such contexts.
176
cratic companies with fixed routines differs widely in both content and ef-fect.313 For small firms or SMEs, their behavior and performance to a greater ex-tent than for large business units have been linked to the actions and behav-ior of the individual owner-manager. Some research has suggested that the continuation of a successful enterprise (e.g. continued growth) necessitates that the founder is replaced by a professional, hired manager while others have viewed the first succession event in a firm as particularly risky for its survival.314 Additionally, smaller businesses with long-standing owners face somewhat different succession problems than do large established corpora-tions. For small firms, a reluctance of the owner to let go of the business is an often-identified factor, as well as the problem of finding an appropriate successor. Notwithstanding, such questions have frequently been addressed in family business research,315 and they have been recognized as crucial for the performance of SMEs. A study of successions of ownership and leader-ship in a large number of Swedish SMEs showed that performance was lower in firms that were on the brink of succession in comparison to firms that had experienced a succession event. These results agree to some extent with the proposition that owner-manager change in smaller (and possibly smaller and somewhat mature) firms serves as a catalyst to increased per-formance.316 Therefore, to make a distinction between firms of different size and age can be relevant when it comes to the issue of succession. Figure 13 also reports commonly used measures of performance and suc-cession in previous research. Performance measures often have been firm-specific financial variables such as profitability or sales, or organizational survival. Particularly in small business and entrepreneurship research, firm survival and/or growth have been acknowledged as central indicators of firm performance. Other studies that have investigated succession events and out-comes in large, listed companies have used stockholder reactions as indica-tors of business performance (hence disregarding the fact that business be-havior can differ significantly between the larger listed companies and firms
313 Often, this standpoint has been inspired by Max Weber; see Grusky (1961a). 314 Glenn R. Carroll (1984) investigated first-time succession events in a study of the newspa-per industry, where data on the age of the businesses were available. Carroll found that first-time succession events had negative effects on the survival of the businesses. A study similar to Carroll’s has been carried out by Haveman and Khaire (2004), but with a focus on the founder’s ideological and political standpoints along with the successions and business sur-vival. Willard et al. (1992), on the other hand, found no differences in performance between founder-managed firms och professionally managed firms. See also Jayarman et al. (2000). 315 In Trow’s (1961) analysis of small (family) businesses, Trow came to the conclusion that planning for succession in firms was to a great extent dependent upon availability of willing family members and their competency. See also Miller et al. (2003). For an overview of en-trepreneurship and family business research, see for instance Brockhaus (1994). 316 NUTEK (2004). Other results indicate that business owner themselves do not identify (intra)generational succession as a particularly large problem; see Lundström, A. (1990).
177
in a general sense).317 Thus, a variety of indicators of performance have been used. Similarly, there have been plenty of definitions of succession. While some have studied replacements of chief executive officers (CEOs), others have studied turnovers of boards or of top management teams.318
Objectives and Methodological Considerations The purpose of the present study is as mentioned earlier to investigate the relationship between successions and performance among totally 420 firms in two birth cohorts of firms, founded in Stockholm in 1912 and 1930.319 Although they are two separate birth cohorts, in the following they will be treated as one single (‘synthetic’) birth cohort.320 In order to be able to per-form such a study, a necessary condition is that there are a fairly large num-ber of cases available, and that the observed period of investigation is suffi-ciently long. The above-mentioned database on 420 joint-stock companies, comprising nearly 6,600 observations years (referred to as firm years), serves as an empirical basis. Hence, the database consists of annual longitu-dinal firm-level data. By re-creating the development of each individual joint-stock company for each company’s year in life, changes in each com-pany’s board was also recorded during the construction of the database. Each firm has thus been tracked from its founding until its termination (to the extent that this was the case) or at most over a thirty-year period.321 Succession events – as here defined; see below – occurred at least one time among 210 of the totally 420 firms. Some of them experienced more than one succession event, particularly if they were active for a long period of time. Mainly, firms that actually underwent a succession event (or several events) are in focus in the present study, even if what I have chosen to call ‘non-successors’ also are investigated to some extent. The source material therefore allows, among other things, the analysis of board tenure; the total number of boards in a company; and when in each individual company’s
317 Listed companies constitute a very small total number of businesses. Therefore, generali-zations regarding business behavior, governance or succession can become very limited when considering the 99 percent of non-quoted firms in an economy. 318 A general discussion and overview can be found in Pitcher et al. (2000). Regarding discus-sions and definitions that concern performance measures in entrepreneurship and small busi-ness research, see for example Delmar (1996), pp. 7ff, or Shane (2003), p. 4-6. 319 Cohort 1912 consists originally of 134 firms, while Cohort 1930 comprises 452; totally 586 firms. In the present study, Cohort 1912 consists of 102 firms while Cohort 1930 has 318. Hence there are missing cases (n = 166) that, due to several circumstances, have not been possible to investigate. 320 Separate analyses of different cohorts have been made elsewhere, see e.g. Box (2001), or Gratzer and Box (2002). 321 The reason for the large number of observation years (ca. 6,600) is that some of the 420 firms exhibited long life-spans (while, of course, others did not).
178
lifetime (at what firm age) succession took place. By law, each change in the companies’ board composition had to be reported and each company was furthermore obliged to report its financial situation annually. In most cases, this is the only information that is available concerning these joint-stock companies.
Measurements and Definitions The analysis below is based on a set of definitions of succession and per-formance. Furthermore, here I will also employ control variables such as the age and size of firms, where firms’ age and size have been dichotomized (i.e. young-old, small-large). The median firm age at succession for all observed succession events was 11 years in the database while the median size of firms – measured as each firms’ assets at the year subsequent to succession – were nearly 150,000 kr. in fixed prices (1930 = 100). The database has been split at the median, where young firms are defined as less than 11 years and small firms as those with assets less than 150,000 kr.322 However, the main focus in this section concerns how succession and performance are defined. To a fairly large extent will I here attempt to perform a study using some variables identified as important in previous research. There are evidently a number of limitations at hand as well as need for some clarifications. One question concerns the measuring – or definition – of ownership and management; another relates to the ‘causes’ of successions or board turnovers. First, a limitation in the present study concerns the very definition of management and, to a great extent, ownership. It would natu-rally be ideal to be in the possession of source materials that contain infor-mation on CEO (manager), owners, chairman of the board and other board members in a study that has an aim to investigate successions. Nevertheless, such information is only occasionally available, for instance if the chairman of the board was also the company’s CEO (or to the extent owners were active in the board, and so on). The roles of owner and manager were proba-bly dual in particularly smaller firms since these commonly consisted of only a small number of board members (sometimes there was in fact only one). This is however only speculative; previous research results have indicated that other arrangements even in small businesses can occur. At least theo-retically some additional PRV sources could be used to receive a fuller un-derstanding of ownership and (possibly) management in each of the firms. Subscription lists (teckningslistor) could for instance be utilized. A re-construction of the yearly development of over 400 firms with respect to their financial situation as well as to their board composition and changes thereof is however time consuming; as mentioned earlier there are nearly 6,600 observation years. Here, we have to settle with the assumption that 322 Database on Cohort 1912 and 1930. See also Appendix 6.
179
successions in the investigated companies’ boards also are indicators of changes in management and/or ownership. Concerning the reasons (or causes) for succession events, such information was provided by the businesses in question in only a very small number of cases.323 Hence, it is possible to observe that a new board, or new board members, entered the firm but generally the reason is not known. Boards or leaders with a long tenure might, as discussed earlier, resign due to old age, but here we can only hypothesize on what were the reasons for resignations or withdrawals. Additionally, other limitations regarding the boards’ charac-teristics have, due to source-specific reasons, also been necessary.324 Also the degree or scope of succession in a company is probably of impor-tance when it comes to constructing an indicator for succession. The with-drawal or replacement of a single board member may not be placed on an equal level with situations in which the entire board or the CEO was re-placed. In the latter case, it could be imagined that something of greater im-portance occurred in the firm. Therefore, the database tells not only that a succession event (of some kind) has taken place, but also the extent of suc-cession. This was recorded for each individual firm’s year in operation, and initially this was carried out using a four-degree scale. Zero (0) indicated that no succession (of any kind) were at hand at time t, while One (1) signified a smaller type of event, for instance an individual board member. Two (2) indicated, when possible, resignations of the CEO, the chairman of the board and/or a majority of board members – in the latter case more than 50 percent. Finally, Three (3) indicated that the entire board resigned.325 In a later stage of the analysis this succession variable was di-chotomized into No or Moderate change (Zero to One), and Stronger to Substantial change (Two to Three). The cases where the entire board re-signed were very few. Therefore, the definition of succession here is that a firm exhibited a succession event at a point in time, (t), when a stronger or substantial change in the board occurred. It must be emphasized that we should not confuse a succession event or several events (in an individual firm) with the firm as a unit of observation: a firm could exhibit more than one succession event over its course of life, particularly if it was active over a longer period. 323 Some individual company files mention or at least hint on the reasons for why e.g. the chairman of the board or the CEO resigned. However, such statements have been very rare. 324 As mentioned, earlier studies on successions in firms have included variables such as the recruitment of (new) leaders or board members, their background, previous experience etc. Such variables are nearly impossible to include in the present investigation. 325 Naturally, a company that e.g. consisted of only two board members could here be coded as (1) as well as (2); since ’only’ one single individual resigned it was also equivalent to the resignation of half of the board. Here, a good measure of common sense must be employed when the source material is coded and interpreted. For companies that consisted of rather large boards, say ten or so, the effects of a single individual’s resignation may not have been as important as in small companies that had only one or two board members.
180
As for the variable firm performance, two main measures are used here. First, the individual firms’ development in purely financial terms constitutes one performance measure, where changes in revenue growth between each observation year measures performance. Second, each individual firm’s sur-vival ability is also used as a performance variable, i.e. the extent to which a business managed to survive a succession event. It must be emphasized again that succession events (in a firm) should not be confused with the firm as a unit of observation. In the first case, presuccession and postsuccession performance can be analyzed by comparing changes in each firm’s revenue prior and after a succession event. In the second case, where survival ability is used, the life-length or remaining life-length of firms after a succession event is used to measure firm performance. In more detail, the variables have been defined as follows. Presuccession performance: firms that had exhibited increasing revenue – or, at least unchanged revenue – under the two years that preceded a succes-sion event at t0, where coded as positive performance (= 1), while firms with a negative development (decreasing revenue) were coded as poor performing firms (= 0).326 Note that t0 here signifies a succession event. Theoretically, a succession event could take place at any age of a firm, e.g. at the age of one, two, three… etc. Similarly, postsuccession performance was defined in a similar manner as regards measures in revenue. Here, changes in revenue over a two-year period from the succession event in question (i.e. from t0) were coded in the same way as presuccession performance.327 Furthermore, it was also observed whether the firms in question remained in business – i.e. survived – after a succession event, in this case if they were still active as businesses two years after the event in question. Firms that were terminated within this two-year period were coded as poor-performing firms, while survivors were coded as positive performance. Both post-performance meas-ures have generally been combined in the analysis. Thus, both the single firm’s ability to survive as well as its performance after a succession event is measured here.328 Nearly all operationalizations and definitions in research can be criticized. And particularly concerning the coding of firm-specific variables, it could of course be claimed that firms perform in varying degree and that they per-form differently depending on for instance their age and their size. This is also the case here; some firms could increase (or decrease) their revenue with over a hundred percent while others exhibited only smaller changes.
326 Thus, on a hypothetical time-scale, changes in revenue between t-1 och t-3, where the suc-cession event takes place at t0. 327 In this case, comparisons of revenue change between t0 och t2 for each succession event/firm. 328 Termination could e.g. be bankruptcy, liquidation or merger. I make no difference here between the different ways of termination.
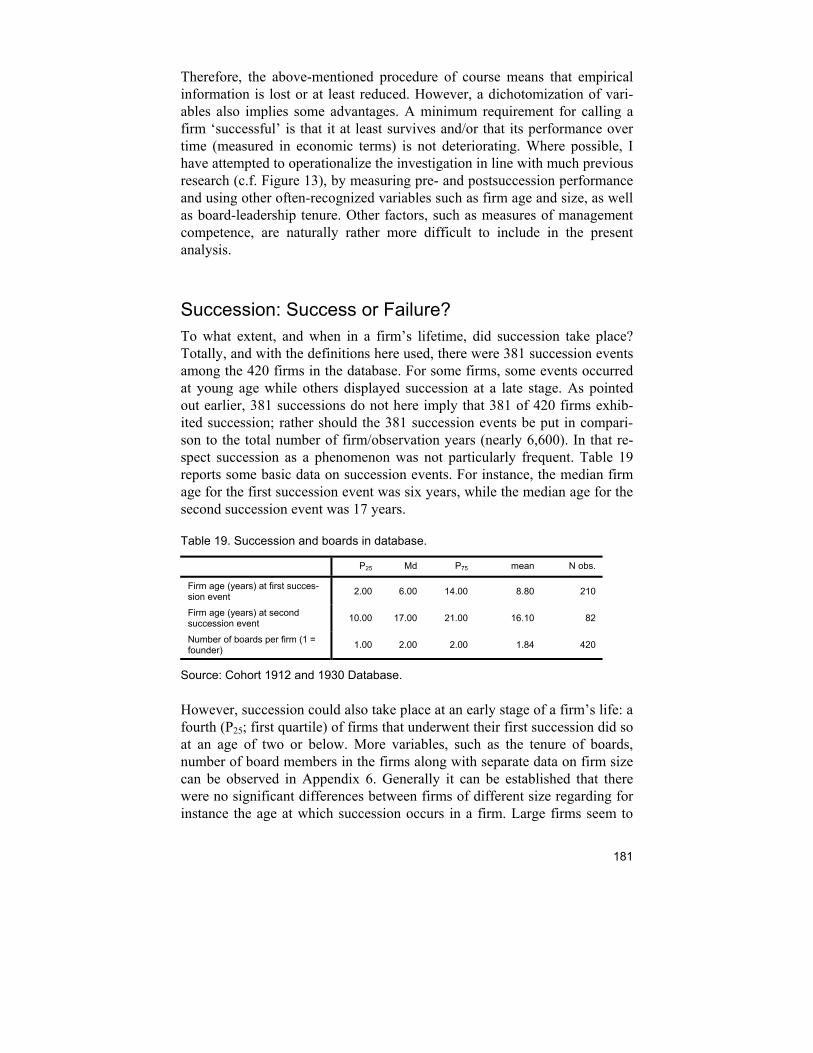
181
Therefore, the above-mentioned procedure of course means that empirical information is lost or at least reduced. However, a dichotomization of vari-ables also implies some advantages. A minimum requirement for calling a firm ‘successful’ is that it at least survives and/or that its performance over time (measured in economic terms) is not deteriorating. Where possible, I have attempted to operationalize the investigation in line with much previous research (c.f. Figure 13), by measuring pre- and postsuccession performance and using other often-recognized variables such as firm age and size, as well as board-leadership tenure. Other factors, such as measures of management competence, are naturally rather more difficult to include in the present analysis.
Succession: Success or Failure? To what extent, and when in a firm’s lifetime, did succession take place? Totally, and with the definitions here used, there were 381 succession events among the 420 firms in the database. For some firms, some events occurred at young age while others displayed succession at a late stage. As pointed out earlier, 381 successions do not here imply that 381 of 420 firms exhib-ited succession; rather should the 381 succession events be put in compari-son to the total number of firm/observation years (nearly 6,600). In that re-spect succession as a phenomenon was not particularly frequent. Table 19 reports some basic data on succession events. For instance, the median firm age for the first succession event was six years, while the median age for the second succession event was 17 years.
Table 19. Succession and boards in database.
P25 Md P75 mean N obs.
Firm age (years) at first succes-sion event 2.00 6.00 14.00 8.80 210
Firm age (years) at second succession event 10.00 17.00 21.00 16.10 82
Number of boards per firm (1 = founder) 1.00 2.00 2.00 1.84 420
Source: Cohort 1912 and 1930 Database.
However, succession could also take place at an early stage of a firm’s life: a fourth (P25; first quartile) of firms that underwent their first succession did so at an age of two or below. More variables, such as the tenure of boards, number of board members in the firms along with separate data on firm size can be observed in Appendix 6. Generally it can be established that there were no significant differences between firms of different size regarding for instance the age at which succession occurs in a firm. Large firms seem to
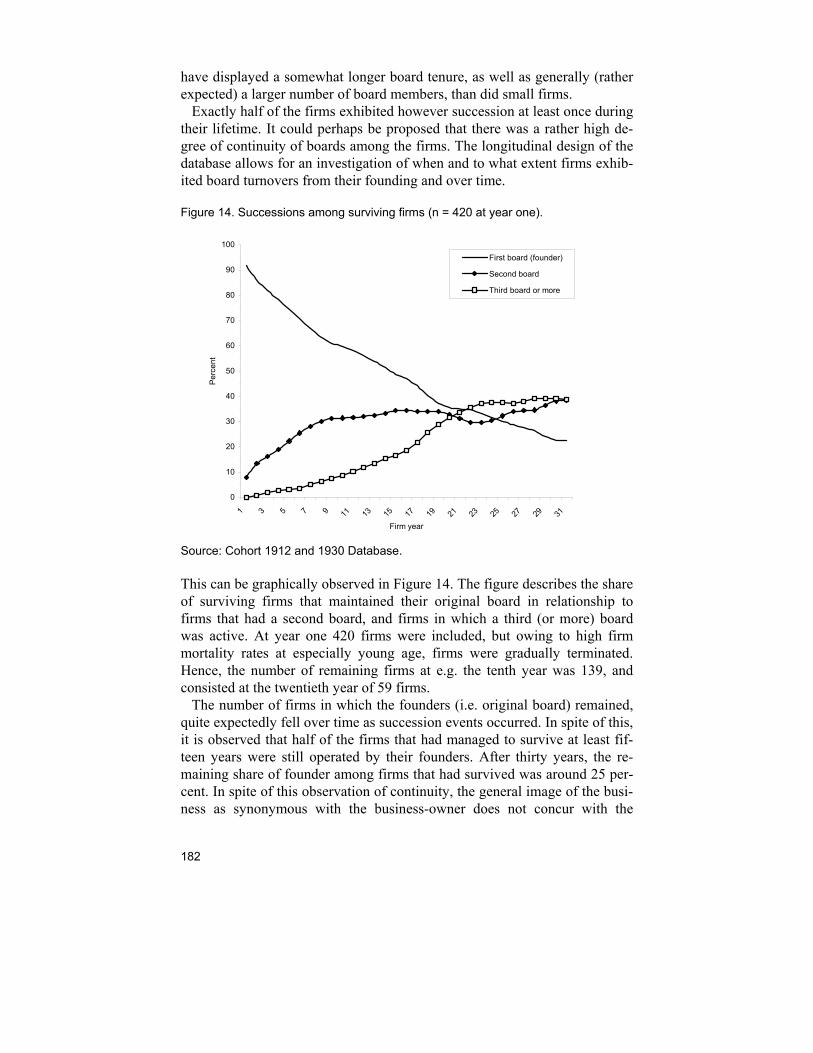
182
have displayed a somewhat longer board tenure, as well as generally (rather expected) a larger number of board members, than did small firms. Exactly half of the firms exhibited however succession at least once during their lifetime. It could perhaps be proposed that there was a rather high de-gree of continuity of boards among the firms. The longitudinal design of the database allows for an investigation of when and to what extent firms exhib-ited board turnovers from their founding and over time.
Figure 14. Successions among surviving firms (n = 420 at year one).
0
10
20
30
40
50
60
70
80
90
100
1 3 5 7 9 11 13 15 17 19 21 23 25 27 29 31
Firm year
Per
cent
First board (founder)
Second board
Third board or more
Source: Cohort 1912 and 1930 Database.
This can be graphically observed in Figure 14. The figure describes the share of surviving firms that maintained their original board in relationship to firms that had a second board, and firms in which a third (or more) board was active. At year one 420 firms were included, but owing to high firm mortality rates at especially young age, firms were gradually terminated. Hence, the number of remaining firms at e.g. the tenth year was 139, and consisted at the twentieth year of 59 firms. The number of firms in which the founders (i.e. original board) remained, quite expectedly fell over time as succession events occurred. In spite of this, it is observed that half of the firms that had managed to survive at least fif-teen years were still operated by their founders. After thirty years, the re-maining share of founder among firms that had survived was around 25 per-cent. In spite of this observation of continuity, the general image of the busi-ness as synonymous with the business-owner does not concur with the
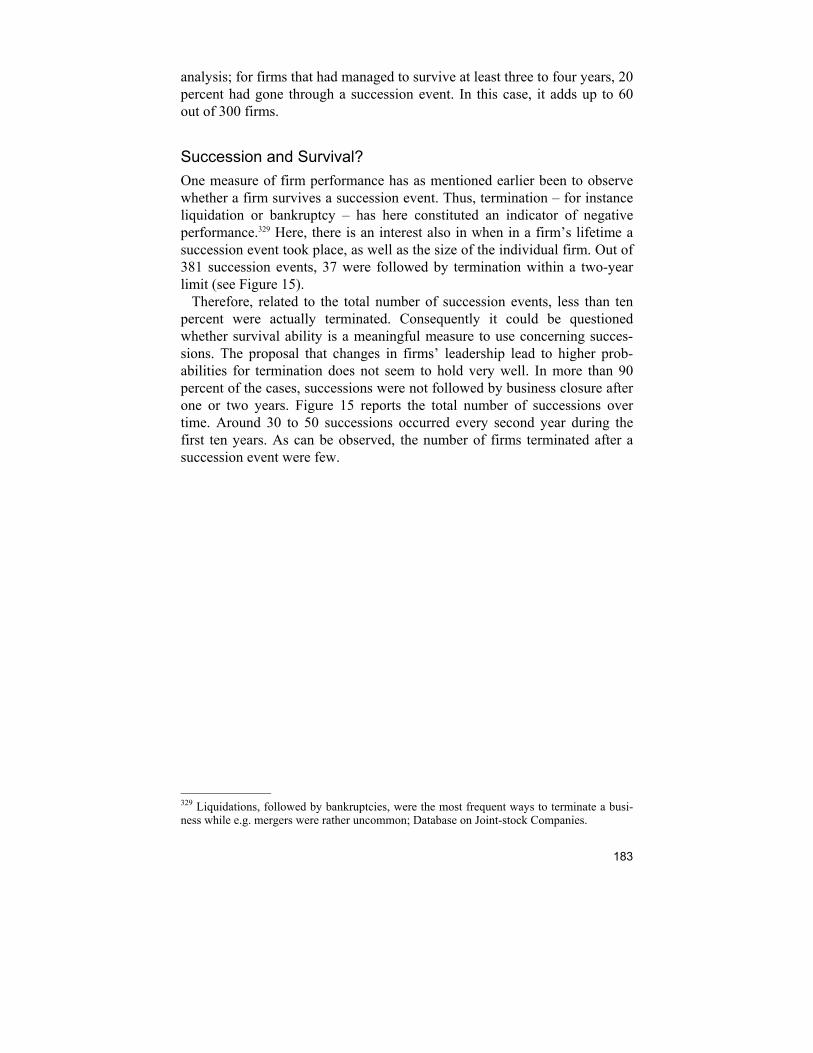
183
analysis; for firms that had managed to survive at least three to four years, 20 percent had gone through a succession event. In this case, it adds up to 60 out of 300 firms.
Succession and Survival? One measure of firm performance has as mentioned earlier been to observe whether a firm survives a succession event. Thus, termination – for instance liquidation or bankruptcy – has here constituted an indicator of negative performance.329 Here, there is an interest also in when in a firm’s lifetime a succession event took place, as well as the size of the individual firm. Out of 381 succession events, 37 were followed by termination within a two-year limit (see Figure 15). Therefore, related to the total number of succession events, less than ten percent were actually terminated. Consequently it could be questioned whether survival ability is a meaningful measure to use concerning succes-sions. The proposal that changes in firms’ leadership lead to higher prob-abilities for termination does not seem to hold very well. In more than 90 percent of the cases, successions were not followed by business closure after one or two years. Figure 15 reports the total number of successions over time. Around 30 to 50 successions occurred every second year during the first ten years. As can be observed, the number of firms terminated after a succession event were few.
329 Liquidations, followed by bankruptcies, were the most frequent ways to terminate a busi-ness while e.g. mergers were rather uncommon; Database on Joint-stock Companies.
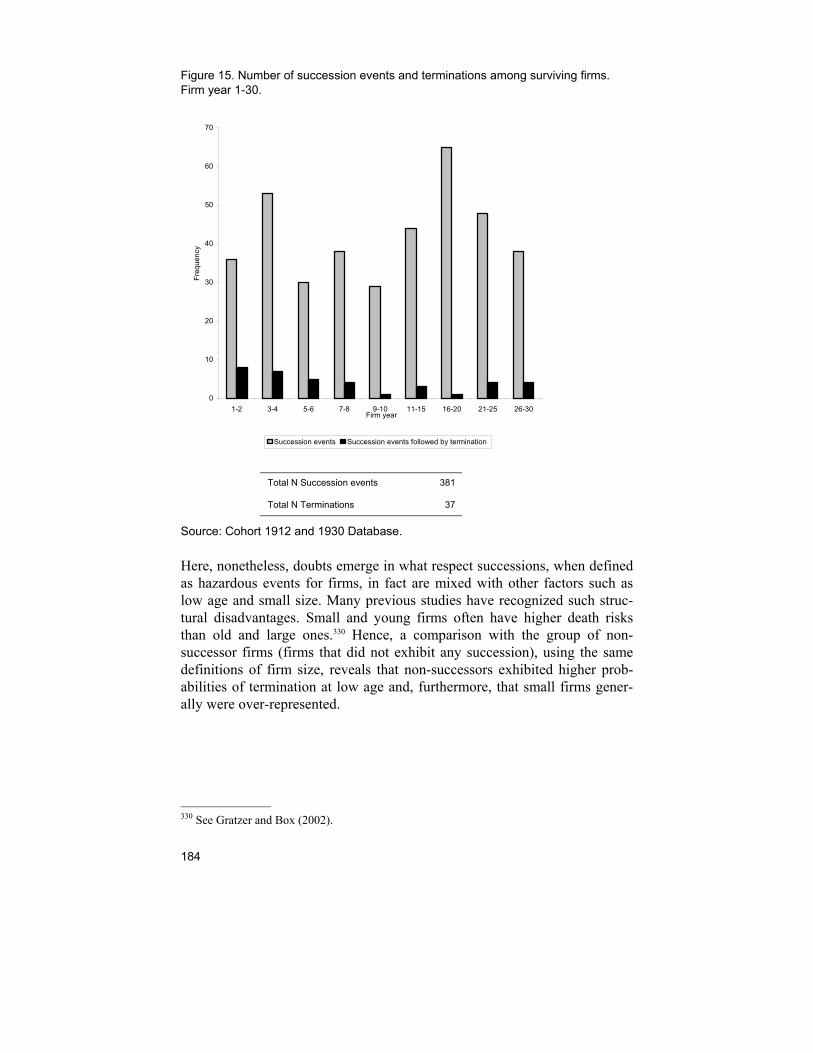
184
Figure 15. Number of succession events and terminations among surviving firms. Firm year 1-30.
0
10
20
30
40
50
60
70
1-2 3-4 5-6 7-8 9-10 11-15 16-20 21-25 26-30Firm year
Freq
uenc
y
Succession events Succession events followed by termination
Total N Succession events 381
Total N Terminations 37
Source: Cohort 1912 and 1930 Database.
Here, nonetheless, doubts emerge in what respect successions, when defined as hazardous events for firms, in fact are mixed with other factors such as low age and small size. Many previous studies have recognized such struc-tural disadvantages. Small and young firms often have higher death risks than old and large ones.330 Hence, a comparison with the group of non-successor firms (firms that did not exhibit any succession), using the same definitions of firm size, reveals that non-successors exhibited higher prob-abilities of termination at low age and, furthermore, that small firms gener-ally were over-represented.
330 See Gratzer and Box (2002).
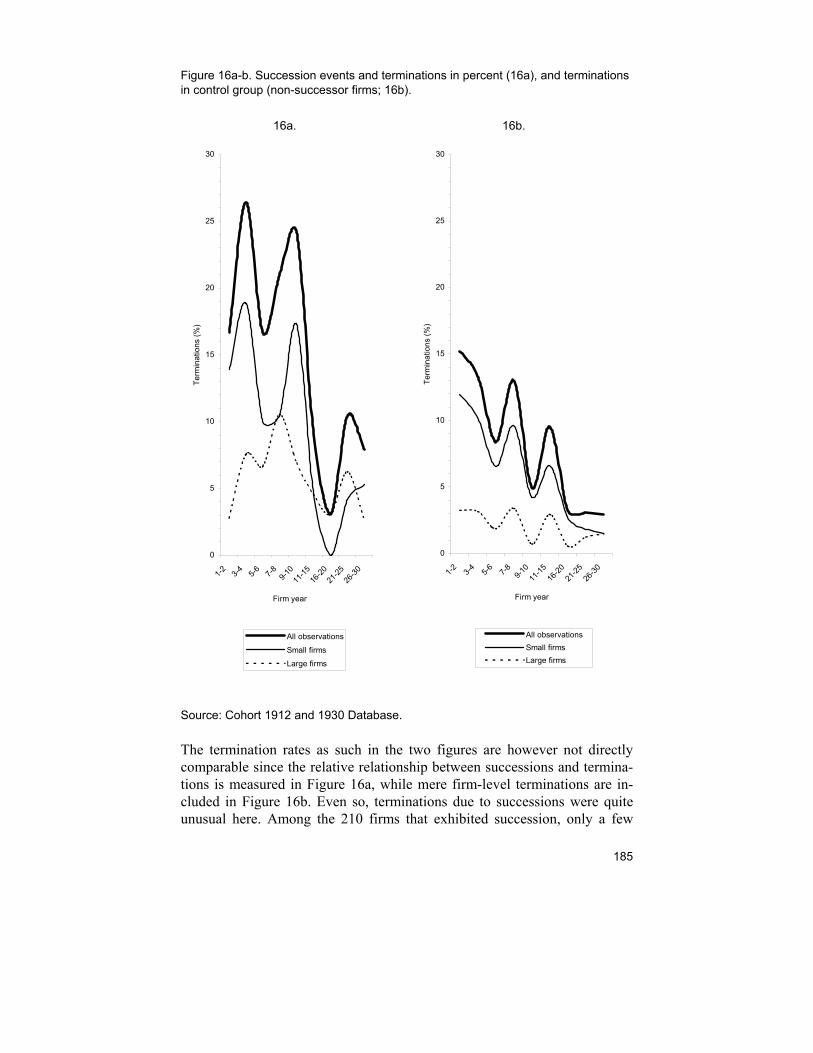
185
Figure 16a-b. Succession events and terminations in percent (16a), and terminations in control group (non-successor firms; 16b).
16a.
16b.
0
5
10
15
20
25
30
1-2 3-4 5-6 7-8 9-10
11-15
16-20
21-25
26-30
Firm year
Term
inat
ions
(%)
All observations
Small firms
Large firms
0
5
10
15
20
25
30
1-2 3-4 5-6 7-8 9-10
11-15
16-20
21-25
26-30
Firm year
Term
inat
ions
(%)
All observationsSmall firmsLarge firms
Source: Cohort 1912 and 1930 Database.
The termination rates as such in the two figures are however not directly comparable since the relative relationship between successions and termina-tions is measured in Figure 16a, while mere firm-level terminations are in-cluded in Figure 16b. Even so, terminations due to successions were quite unusual here. Among the 210 firms that exhibited succession, only a few
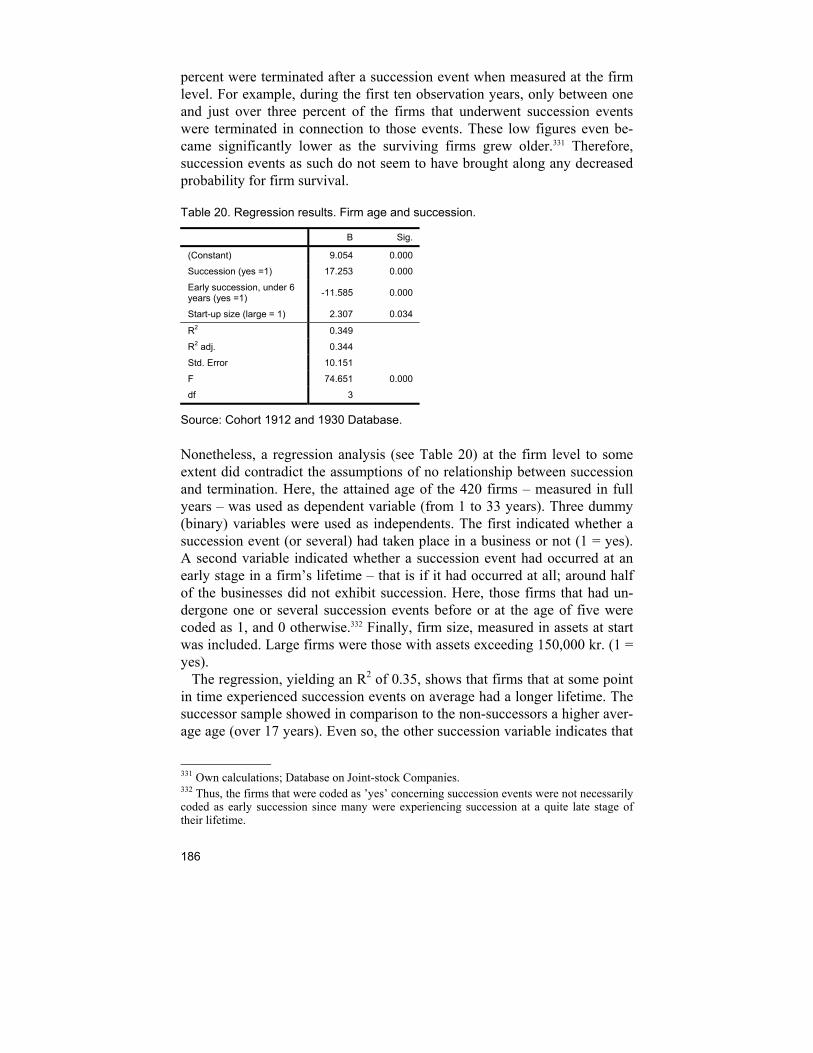
186
percent were terminated after a succession event when measured at the firm level. For example, during the first ten observation years, only between one and just over three percent of the firms that underwent succession events were terminated in connection to those events. These low figures even be-came significantly lower as the surviving firms grew older.331 Therefore, succession events as such do not seem to have brought along any decreased probability for firm survival.
Table 20. Regression results. Firm age and succession.
B Sig.
(Constant) 9.054 0.000
Succession (yes =1) 17.253 0.000
Early succession, under 6 years (yes =1) -11.585 0.000
Start-up size (large = 1) 2.307 0.034
R2 0.349
R2 adj. 0.344
Std. Error 10.151
F 74.651 0.000
df 3
Source: Cohort 1912 and 1930 Database.
Nonetheless, a regression analysis (see Table 20) at the firm level to some extent did contradict the assumptions of no relationship between succession and termination. Here, the attained age of the 420 firms – measured in full years – was used as dependent variable (from 1 to 33 years). Three dummy (binary) variables were used as independents. The first indicated whether a succession event (or several) had taken place in a business or not (1 = yes). A second variable indicated whether a succession event had occurred at an early stage in a firm’s lifetime – that is if it had occurred at all; around half of the businesses did not exhibit succession. Here, those firms that had un-dergone one or several succession events before or at the age of five were coded as 1, and 0 otherwise.332 Finally, firm size, measured in assets at start was included. Large firms were those with assets exceeding 150,000 kr. (1 = yes). The regression, yielding an R2 of 0.35, shows that firms that at some point in time experienced succession events on average had a longer lifetime. The successor sample showed in comparison to the non-successors a higher aver-age age (over 17 years). Even so, the other succession variable indicates that
331 Own calculations; Database on Joint-stock Companies. 332 Thus, the firms that were coded as ’yes’ concerning succession events were not necessarily coded as early succession since many were experiencing succession at a quite late stage of their lifetime.
187
firm age decreased significantly for businesses that had early succession. Thus, board turnovers at an early stage might have decreased the probability for high age. Finally, and as confirmed previously in the dissertation, a larger size at start increased a business lifetime. In that respect, at least for these particular 420 businesses, structural variables (size) as well as internal events (succession) were influential for firm survival. Succession was – especially in the long run – necessary for firm survival, while early succession nonethe-less decreased average firm age substantially. To some extent these results lend some support to previous research results in the sense that, measured at the event level, succession events to a greater extent seem to have ended in termination at young age, where particularly small firms were exposed to a higher death risk or showed shorter lifetimes (c.f. Carroll, 1984). At the firm level an analysis furthermore showed that successions as such probably were necessary for firm survival, since the firms that underwent succession displayed longer life-lengths. Yet, early ‘board turbulence’ did seem to negatively affect the firms’ life-length. This might support previous findings as regards continuity and planning in firms as concerns successions. However, if only some ten percent of all 381 ob-served succession events recorded here ended in – or ‘caused’ – termination, then the overall degree of explanation can be considered rather low: in nine cases of ten did succession not lead to termination.
Presuccession and Postsuccession Performance As a second step, analyses of the relationship between firms’ presuccession and postsuccession performance were carried out. One question is whether there were any discernible relationships between the performance of firms prior to a succession event and after. In this respect, 324 of the totally 381 succession events could be analyzed; in some cases presuccession perform-ance could not be calculated due to the fact that succession took place at an early stage in some firms.333 Postsuccession performance is here defined as a combination of performance variables in the sense that both performance in revenue and performance in survival were included. If a firm for example exhibited positive performance after succession it was nevertheless coded as poor performing if it was terminated within a two-year period. Table 21 gives aggregate data on performance of firms that underwent successions. The distribution of the number of succession events preceded by negative and positive performance seems to be rather evenly distributed (c.f. All firms). This may suggest that performance as such did not have any causal link as to why firms exhibit succession, as suggested in previous re-search. Similarly, postsuccession seems to have been equally evenly distrib- 333 Presuccession performance is e.g. difficult to calculate if succession takes place during the first firm year; see the discussion on measurements above.
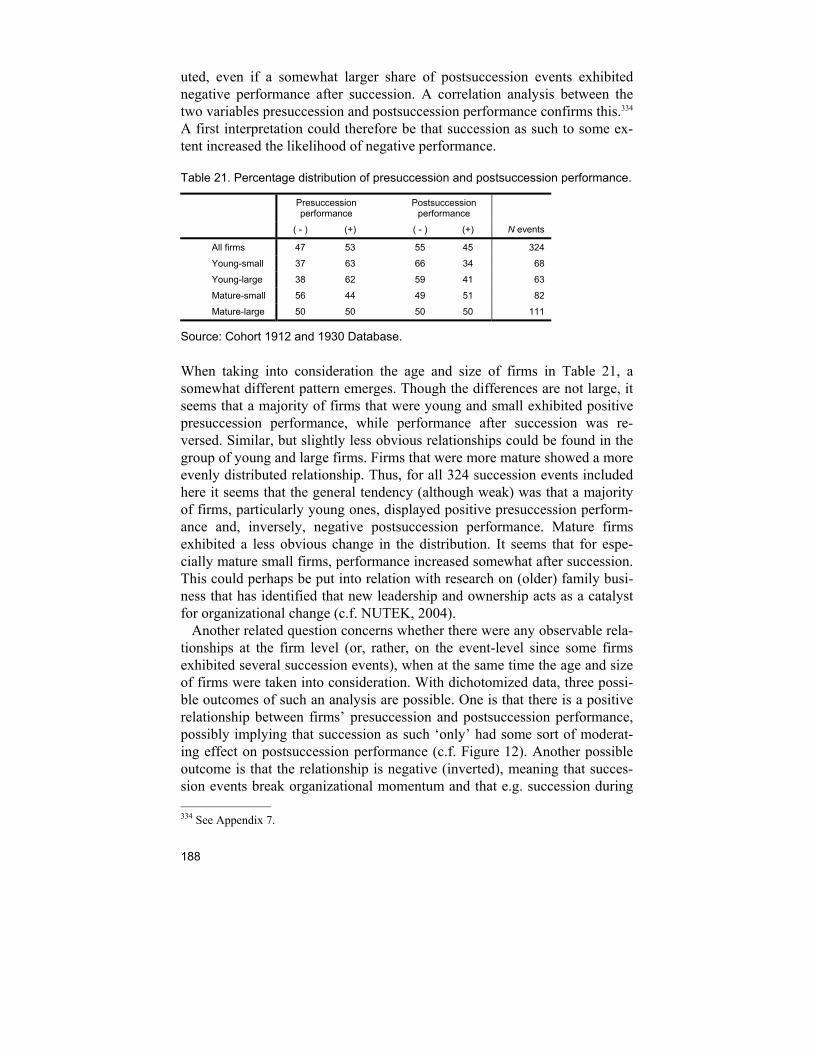
188
uted, even if a somewhat larger share of postsuccession events exhibited negative performance after succession. A correlation analysis between the two variables presuccession and postsuccession performance confirms this.334 A first interpretation could therefore be that succession as such to some ex-tent increased the likelihood of negative performance.
Table 21. Percentage distribution of presuccession and postsuccession performance.
Presuccession performance
Postsuccession performance
( - ) (+) ( - ) (+) N events
All firms 47 53 55 45 324
Young-small 37 63 66 34 68
Young-large 38 62 59 41 63
Mature-small 56 44 49 51 82
Mature-large 50 50 50 50 111
Source: Cohort 1912 and 1930 Database.
When taking into consideration the age and size of firms in Table 21, a somewhat different pattern emerges. Though the differences are not large, it seems that a majority of firms that were young and small exhibited positive presuccession performance, while performance after succession was re-versed. Similar, but slightly less obvious relationships could be found in the group of young and large firms. Firms that were more mature showed a more evenly distributed relationship. Thus, for all 324 succession events included here it seems that the general tendency (although weak) was that a majority of firms, particularly young ones, displayed positive presuccession perform-ance and, inversely, negative postsuccession performance. Mature firms exhibited a less obvious change in the distribution. It seems that for espe-cially mature small firms, performance increased somewhat after succession. This could perhaps be put into relation with research on (older) family busi-ness that has identified that new leadership and ownership acts as a catalyst for organizational change (c.f. NUTEK, 2004). Another related question concerns whether there were any observable rela-tionships at the firm level (or, rather, on the event-level since some firms exhibited several succession events), when at the same time the age and size of firms were taken into consideration. With dichotomized data, three possi-ble outcomes of such an analysis are possible. One is that there is a positive relationship between firms’ presuccession and postsuccession performance, possibly implying that succession as such ‘only’ had some sort of moderat-ing effect on postsuccession performance (c.f. Figure 12). Another possible outcome is that the relationship is negative (inverted), meaning that succes-sion events break organizational momentum and that e.g. succession during 334 See Appendix 7.
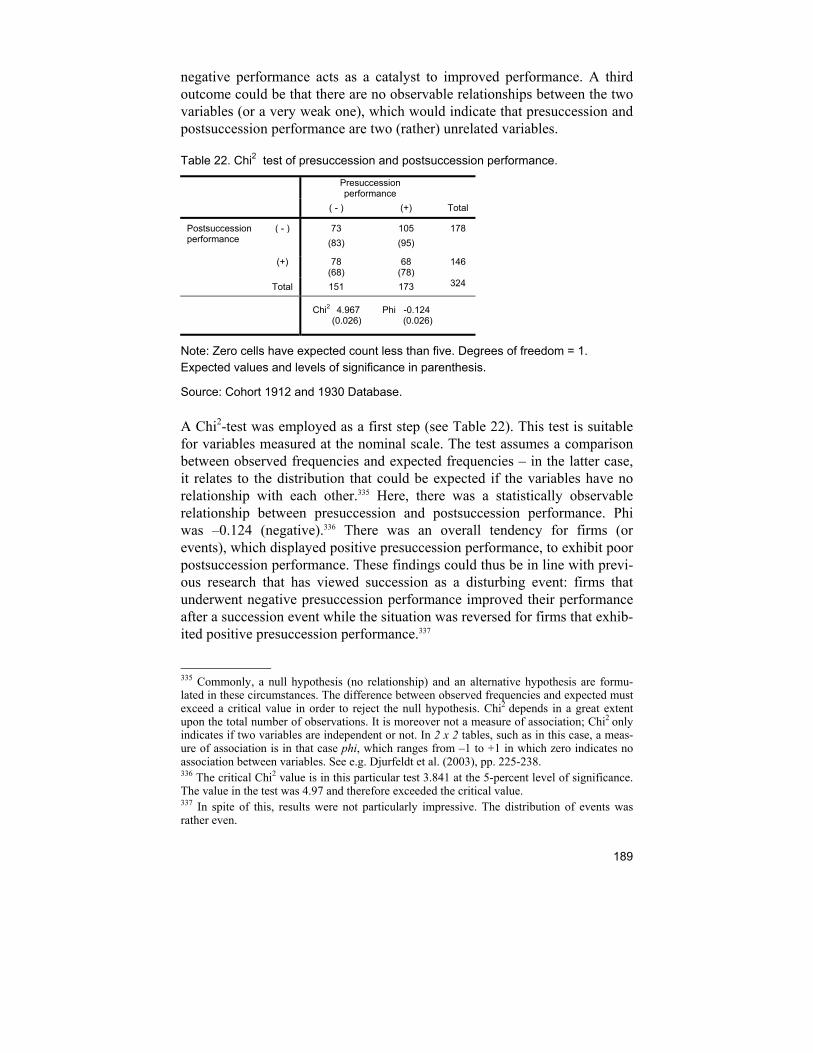
189
negative performance acts as a catalyst to improved performance. A third outcome could be that there are no observable relationships between the two variables (or a very weak one), which would indicate that presuccession and postsuccession performance are two (rather) unrelated variables.
Table 22. Chi2 test of presuccession and postsuccession performance.
Presuccession performance
( - ) (+) Total
Postsuccession performance
( - ) 73 (83)
105 (95)
178
(+) 78 (68)
68 (78)
146
Total 151 173 324
Chi2 4.967 (0.026)
Phi -0.124 (0.026)
Note: Zero cells have expected count less than five. Degrees of freedom = 1. Expected values and levels of significance in parenthesis.
Source: Cohort 1912 and 1930 Database.
A Chi2-test was employed as a first step (see Table 22). This test is suitable for variables measured at the nominal scale. The test assumes a comparison between observed frequencies and expected frequencies – in the latter case, it relates to the distribution that could be expected if the variables have no relationship with each other.335 Here, there was a statistically observable relationship between presuccession and postsuccession performance. Phi was –0.124 (negative).336 There was an overall tendency for firms (or events), which displayed positive presuccession performance, to exhibit poor postsuccession performance. These findings could thus be in line with previ-ous research that has viewed succession as a disturbing event: firms that underwent negative presuccession performance improved their performance after a succession event while the situation was reversed for firms that exhib-ited positive presuccession performance.337
335 Commonly, a null hypothesis (no relationship) and an alternative hypothesis are formu-lated in these circumstances. The difference between observed frequencies and expected must exceed a critical value in order to reject the null hypothesis. Chi2 depends in a great extent upon the total number of observations. It is moreover not a measure of association; Chi2 only indicates if two variables are independent or not. In 2 x 2 tables, such as in this case, a meas-ure of association is in that case phi, which ranges from –1 to +1 in which zero indicates no association between variables. See e.g. Djurfeldt et al. (2003), pp. 225-238. 336 The critical Chi2 value is in this particular test 3.841 at the 5-percent level of significance. The value in the test was 4.97 and therefore exceeded the critical value. 337 In spite of this, results were not particularly impressive. The distribution of events was rather even.
190
Succession, Age, Size Similar tests, but controlling for several independent variables, were carried out. Binary logistic regression with two models was used for the analysis.338 Results are presented in Table 23, and they show statistically significant yet rather weak models. All variables in the models were dichotomous and in-cluded, as a first step, presuccession performance, firm age and firm size, as in the previous analyses. If firms of different size and/or age would exhibit diverging patterns or behavior as concerns postsuccession performance this would hopefully be indicated by the regression. Board tenure was further-more included as an independent variable. This measures the length of board commitment. The median tenure age was seven years, and the tenure vari-able was dichotomized according to this (1 = long tenure, 0 otherwise). Apart from the above mentioned variables was the second model [2] fur-thermore including interaction terms. One term indicated the joint effect of firm age and board tenure (Age x Tenure). A company with a board that is active for only a shorter period of time might possess less firm specific (or industry specific) knowledge and experience compared to a board that is active for a long period of time. For instance, performance in a firm that was 25 years old at a succession event, and in which the board had been active for 15 years, might differ from a business that was in the same age as the first but had a board that was active for only two years. Some previous stud-ies have claimed that performance in companies in which owners have been active for a long period of time exhibit lower performance. On the other hand it can be imagined that a short tenure implies that the boards or owners have not been able to make any significant contributions to the company irrespective of the firm’s age. Observations of shorter tenures in firms – par-ticularly if the firm is fairly old – might also be interpreted as that something more essentially different has occurred compared to a ‘normal’ (for instance planned) succession. Although such assumptions could be reasonable, they are merely speculative since the present empirical material does not provide any information on such relationships. Thus, the age-tenure variable as-sumed in this respect the value 1 if the firm was above median age and if the board at the same time had a long tenure (i.e. 1 times 1), and 0 otherwise.339 The joint effect of firm age and presuccession performance was also in-cluded (Age x Presuccession performance) in order to see if there was a joint effect between firm age and presuccession performance. We know from the Chi2-test that there was a negative relationship between pre- and postsucces-
338 For a description of the method, see Chapter 5. See also Appendix 8 for complete binary logistic regression results. 339 Since all ’main effects’ variables are binary (0,1) are also the interaction variables binary. When multiplying two binary variables are there of course four different combinations, but only two outcomes: zero times zero equals zero; one times zero (and vice versa) equals zero, while one times one equals one.

191
sion performance. This interaction variable would in that case measure any age and presuccession performance effects on postsuccession performance. Finally, the combined effect of firm age and firm size was included (Age x Size), indicating in this particular case if there was an effect of high age and large size. The regressions in both models confirmed the earlier observation of a negative relationship between presuccession and postsuccession perform-ance indicators; the odds ratio was in both models lower than 1, which indi-cates that firms that had shown a positive presuccession performance had a significant probability to display negative performance after succession – here measured as decreasing revenue and/or termination. In Model [1] did no other variables however exhibit significant values. Thus, this showed that firm age, board tenure or firm size was uncorrelated with postsuccession performance and that these variables had no observable effect on the de-pendent variable. Model [2] additionally included interaction terms. As noted, here the gen-eral negative relationship between pre- and postsuccession performance re-mains while the variables that were used in model [1] still showed non-significant values. It did not seem to be any joint effect of firm age and size; large and mature firms did not differ from others. Nonetheless, all other things equal, there was in this second model a strong joint effect from the interaction variable Age x Tenure. Thus, mature firm age and long board tenure increased the probability to display positive postsuccession perform-ance (nearly four times). Furthermore, there was also a combined effect from firm age and presuccession performance: firms with a positive presuccession performance that were of mature age had a significant probability to display positive postsuccession performance. Therefore firms of a mature age with a board that had a longer commitment differed – as did those of mature age with positive presuccession performance – differed from the general (and opposite) pattern of positive performance being followed by negative per-formance after succession and vice versa.
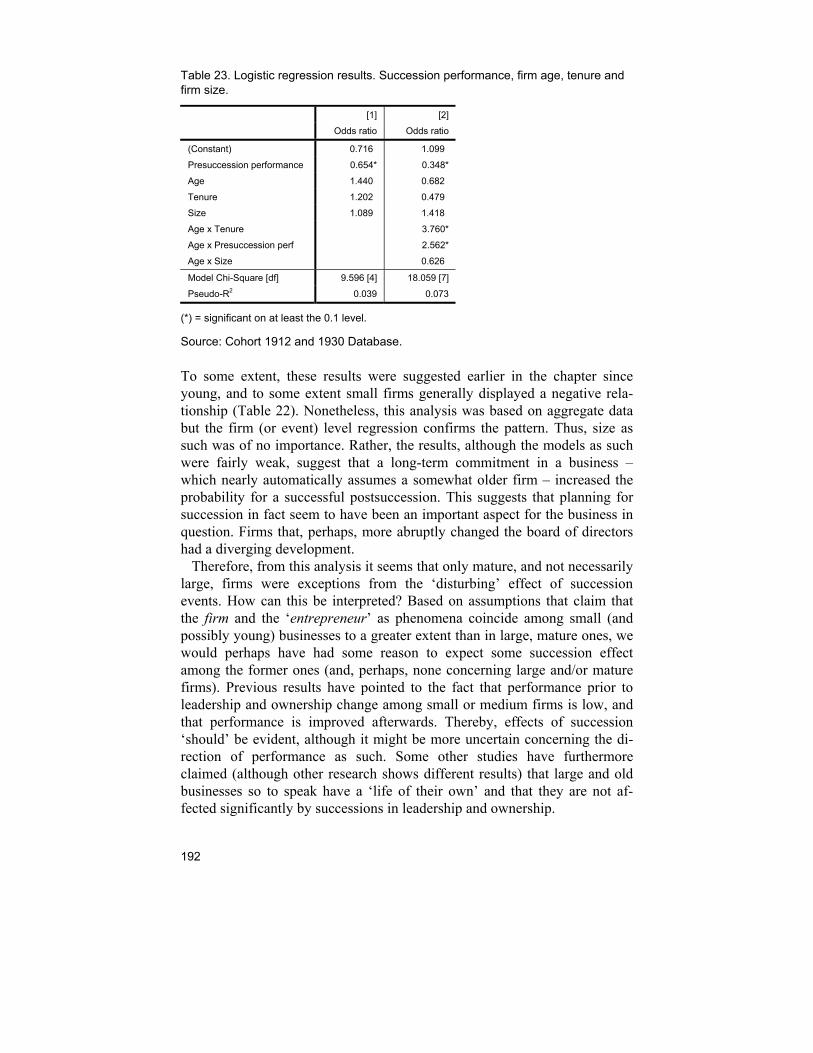
192
Table 23. Logistic regression results. Succession performance, firm age, tenure and firm size.
[1] [2]
Odds ratio Odds ratio
(Constant) 0.716 1.099
Presuccession performance 0.654* 0.348*
Age 1.440 0.682
Tenure 1.202 0.479
Size 1.089 1.418
Age x Tenure 3.760*
Age x Presuccession perf 2.562*
Age x Size 0.626
Model Chi-Square [df] 9.596 [4] 18.059 [7]
Pseudo-R2 0.039 0.073
(*) = significant on at least the 0.1 level.
Source: Cohort 1912 and 1930 Database.
To some extent, these results were suggested earlier in the chapter since young, and to some extent small firms generally displayed a negative rela-tionship (Table 22). Nonetheless, this analysis was based on aggregate data but the firm (or event) level regression confirms the pattern. Thus, size as such was of no importance. Rather, the results, although the models as such were fairly weak, suggest that a long-term commitment in a business – which nearly automatically assumes a somewhat older firm – increased the probability for a successful postsuccession. This suggests that planning for succession in fact seem to have been an important aspect for the business in question. Firms that, perhaps, more abruptly changed the board of directors had a diverging development. Therefore, from this analysis it seems that only mature, and not necessarily large, firms were exceptions from the ‘disturbing’ effect of succession events. How can this be interpreted? Based on assumptions that claim that the firm and the ‘entrepreneur’ as phenomena coincide among small (and possibly young) businesses to a greater extent than in large, mature ones, we would perhaps have had some reason to expect some succession effect among the former ones (and, perhaps, none concerning large and/or mature firms). Previous results have pointed to the fact that performance prior to leadership and ownership change among small or medium firms is low, and that performance is improved afterwards. Thereby, effects of succession ‘should’ be evident, although it might be more uncertain concerning the di-rection of performance as such. Some other studies have furthermore claimed (although other research shows different results) that large and old businesses so to speak have a ‘life of their own’ and that they are not af-fected significantly by successions in leadership and ownership.
193
In my analysis of succession was it recognized that succession had a dis-turbing effect on performance (nonetheless, in cases in which negative per-formance was followed by increased performance a term such as ‘positive transformation effect’ or the equivalent might be more suitable). Business size was of less importance with reference to postsuccession performance measured as revenue increases and/or survival. Therefore it can be claimed that generally there was no consequence as to whether the firm was small or large at succession; the inverted relationship remained. There was addition-ally no combined age-size relationship. Rather, it was age in combination with a longer board tenure that increased the probability of successful suc-cession in the firms. Therefore, even if the firm and the business owner coin-cide to a greater extent in small businesses than in large ones, the size factor was not decisive in this particular case. Even large, yet young, firms exhib-ited the disturbing (or transformation) effect. This deviates from previous research results and assumptions.
Conclusions A summary of the research results in this study shows, firstly, that with an observation period of thirty years fifty percent of the 420 businesses exhib-ited board turnovers – successions – although some firms lived for a consid-erable time while others terminated very early. The number of remaining founder boards in the businesses diminished steadily over time, which was quite expected. There was nonetheless a long continuity of owner-managers in the businesses over time. After thirty years, a fourth of the surviving firms still had the founders as leaders. Yet, it does not correspond to the perhaps general image of small firms as being run by the founder(s), not even in the short run. Successions were common even at an early stage in small as well as large firms. Was then succession on the whole a widespread or for that sake significant phenomenon among the total of 420 joint-stock companies that were ana-lyzed here? Results in a study depend to a great extent on operational defini-tions of variables and measurements. Here – owing to the state of source materials – I have been required to measure succession as (the degree of) board turnover in each business. The sources do not allow for any alternative definitions. Additionally, the measures of firm performance might have been defined in other ways, for instance to measure changes in revenue or ability to survive over e.g. longer periods of time. Performance has here been meas-ured in two ways: Termination/survival, and revenue growth. And as con-cerns the significance of the succession phenomenon I would, for the most part, like to answer the question above with a ‘no’. No, both in the sense of the scope or extent of successions as such, and no (but a more ambiguous
194
one) as regards successions as events and their relationship with firm per-formance. First, the 420 joint-stock companies contributed together with nearly 6,600 firm years. Since 381 succession events were recorded, the figure appears fairly insignificant. As has been demonstrated, half of the firms did not ex-hibit any succession. In that respect, successions were rather uncommon. Second, succession as an event furthermore seems not have been significant or crucial for the survival of firms. Indeed, a relatively higher mortality risk was observed for firms at low age, particularly if they were smaller. But such structural attributes – i.e. low age, small size – are widely acknowledged risks in a general sense in much previous research and theory. Hence, ascrib-ing succession events in this sense as ‘causes’ for termination may merely be a general effect of low age and small size. I am at least partly inclined to believe that this is the case also here: the number of firms terminated after a succession event was relatively speaking negligible. Therefore it does not seem that succession meant a higher risk for termination (negative perform-ance). On the contrary, succession probably was an essential necessity for organ-izational survival – continuation – on the whole, which the rather scarce research on successions in small and/or young firms has emphasized. This does not mean that succession meant survival. An analysis showed that early successions decreased the average life-length of firms. Thus, it is probably so that early ‘turbulence’ affected the course of development for individual business firms in a less desired direction – at least if we accept that organiza-tional survival is a basic goal for any business. In that case, (early) succes-sion events may have shortened the life-length of firms. And, furthermore, this factor may naturally be an important one in research that addresses the often-identified liability of newness and other structural-related phenomena (c.f. chapters 3 and 5). Some previous research results concerning the relationships between pre-succession and postsuccession performance of firms are contradicted in the present study. Previous research has often claimed that succession can be decisive or even a necessary requirement for especially small/smaller (or family owned) businesses, since the characteristics, competency and there-fore ‘behavior’ of owner-managers are widely recognized. Therefore, the owner-manager is here synonymous with the firm to a great extent. It has, among other things, been claimed that particularly mature small firms im-prove performance after (as assumed) a period of deterioration and decline. This was not the case here. I found here no relationship – or combined ef-fects – between firm age and size as concerns successions. Successions had nonetheless effect on firm performance, which shall be discussed in the fol-lowing. For instance neoclassical economic theory and assumptions of asymmetric information would suggest that weak (presuccession) performance induces
195
the owner to search for alternative uses for resources. If so, the business is sold or terminated. Negative presuccession performance could be expected to be followed by negative postsuccession performance, i.e. in this case ter-mination and/or decreasing revenues. A prospective buyer of the firm in question possesses less knowledge and has, perhaps, less experience – par-ticularly if the firm is small (less known) or young. Hence, the firm, it is assumed, exhibits negative performance after succession. However, it seems as if the ‘inflow’ of new boards in the firms that exhibited succession was constituted by individuals that, in a ‘causal’ sense, could just as well im-prove or deteriorate performance since the pattern regarding postsuccession performance was quite random. And this might just as well have been the case: some of the new boards may have affected the firm’s development in a positive direction, some in a negative direction irrespective of its presucces-sion performance. In that case, and with respect to the fact that other definitions and meas-urements could generate other results, new boards (owners) in small firms might be viewed as a random process in which it is difficult to state anything as regards the development of individual businesses after a succession. Therefore, if owner-manager ‘competency’ within (young) small business theoretically would deteriorate over time – since past negative performance would only amplify coming performance because new owners have less information and are less or at least equally capable as their predecessor(s) – this investigation does not support such assumptions.340 Empirical research on successions has suggested relationships similar to such neoclassical as-sumptions (although due to other reasons): prior performance acts as a mod-erator or re-enforcing mechanism – while poorly performing firms will con-tinue to do so even after a succession, high-performers will continue to ex-hibit positive performance. In the first case, negative developments perhaps magnify organizational inertia since there is a lack of resources in the busi-ness, and in the latter case success breeds success due to prior performance’s generation of excess resources. Yet, a correspondence between pre- and postsuccession performance measures was discovered while no relationships relating to firms’ continued negative (positive) performance before and after succession could be identi-fied in the present study. My results show that successions had a disturbing, or transformational, effect, thereby concurring with a body of previous re-search: negative presuccession performances were followed by improved postsuccession performances and vice versa. Succession serves, according to this research, as a medium for improvements when performance has been declining. It is furthermore assumed that it acts as a catalyst for apathy, resis-
340 Which in the other sense would imply that ‘competent’ prospective buyers (i.e. new own-ers) commonly identify well-performing businesses in the economy and, since they possess a high degree of competency, makes the business perform well after succession.
196
tance to change and increased need for internal organizational insecurity when prior performance has been favorable. Mature firms, irrespective of size, with a board that had been active in the business for a longer period of time (tenure) differed from others. These businesses indicated evidence of a re-enforcing effect. The firms in this particular category that had exhibited good presuccession performance – which in fact was more probable for ma-ture firms to do, as the analysis showed – had greater chances to exhibit a positive development after succession. Such assumptions might be in line with other economic theories and re-search, such as management-oriented theories that identify planning and continuity as important factors in explaining performance. Successions in leadership/ownership might interrupt the individual firm’s development. Such theoretical reasoning is principally developed for large(r) businesses. As noticed above, it was among younger firms that succession seemed to have this disruptive role. It is interesting that small young firms did not stand out, or differ, from large young firms. It is generally acknowledged in SME research that lack of time and of resources for planning is greater in small firms than in large ones. Thus, we would perhaps have expected that large firms, although they were young, would have shown, as regards firm per-formance, more continuity or another pattern than the small and young ones. In that case, size did not matter but rather a longer lifetime and longer board tenure. Here, perhaps, planning for succession could also have been a more frequent phenomenon. Furthermore, other explanations are probable. Exter-nal buyers of those particular businesses had possibly more information as regards their past performance. Thus it could have been less asymmetric information for those businesses, and they were probably more known on their markets. Thus, the results generated in this study of successions and performance support as well as contradict earlier research. It has identified and confirmed a de facto, although occasionally weak, relationship between presuccession and postsuccession performance which generally is a negative (disruptive, transformational) one. It has, furthermore, shown that this was not valid when it came to mature firms even though size had no observable effect. Even if larger businesses mostly have been in focus as concerns managerial turnovers and successions, it has been shown here that this may apply to smaller business as well. These have nonetheless been less investigated re-search objects. Here, mature – and not necessarily large – firms stood out from younger ones, irrespective of their size. In that case there was perhaps a stronger age effect than a size effect evident as concerns successions. This brings about several research questions, particularly when we take into consideration the large body of research as well as theory that has viewed conditions for small and young firms along with particularly man-agement practices, behavior, motivation and competency as significant in understanding how and why small firms differ from older larger ones. A

197
more thorough study of the problem of succession (as well as the scope of succession) in particular small and young firms would therefore be of inter-est. In spite of the findings here that assert that mature firms differed from others I would like to point out that the overall relationship(s) may have been quite weak. Other measurements or definitions would, as implied above, perhaps reveal different results. Alternatively, as other researchers have claimed, successions of leaders and owners in firms and the relationship between business performance is rather weak. In that case, other explana-tions to performance (as well as to successions) must be investigated. Thus, not only has this study confirmed as well as challenged some earlier results. It also questions the often-asserted importance of successions as such in business organizations. For the survival and performance of a particular firm a succession might naturally be of utmost significance, while for another individual firm it is of less importance. And, viewed on an aggregate or long-term basis, successions may nonetheless be a less crucial phenomenon.

198
199
9. Concluding Remarks and Summary
This dissertation has had the aim to study the behavior and development of firm populations as concerns aggregate developments and firm survival and growth. In doing so, a long-term perspective has been an important feature, along with a chiefly longitudinal research design as well as an approach that takes into consideration relationships between the behavior of the firm(s) and chiefly external and structural variables. The dissertation has hopefully contributed with new knowledge as regards conditions for and behaviors of businesses. By this, I have in mind not only my use of methods, employed in entrepreneurship and small business economic research, on historical data per se. My hopes are that I not ‘merely’ have confirmed or refuted findings and theories in research that use more present-day empirical material. More specifically, I think that the dissertation in some instances also stand in con-trast to other studies in its general setting and methodology. With any luck, it has contributed with alternative insights and shown that there are comple-mentary ways in researching the growth and survival of business firms.
Scholars in the field of entrepreneurship and small business have called for more longitudinal studies while they also have identified a certain bias as concerns the ‘balance’ between micro and macro/aggregate studies – with the bulk of research leaning towards micro studies – as well as the link or interrelatedness between micro behavior(s) and external or aggregate phe-nomena. And while business historians have often produced substantial sci-entific contributions as regards case studies of large, established businesses, followed over long periods of time under changing environments, these works have nonetheless in most cases dealt with precisely large, established businesses. The aim of this dissertation has indeed not been to write a history of small business in Sweden. Even though I think it would be of importance for economic and business historians to focus on smaller business units in empirical research, it is also probably a more difficult task. Yet, even so, I think that an additional contribution with my dissertation is that it has shed some light on our historical knowledge of small businesses – particularly in establishing new, coherent databases.
A summary of the dissertation’s main empirical results shows the follow-ing. The study of the development of the size distribution of firms in Sweden over more than one hundred years gave evidence of a continuously changing size structure. This is not particularly surprising given the long period stud-ied. But even in the shorter run this size structure was ‘unstable’. I again
200
want to emphasize that changes in statistical reporting and larger reorganiza-tions have been significant over the decades. Comparisons of different statis-tical materials over time may as a consequence result in serious validity problems. Furthermore, aggregate data (cross-sectional), as used in this cir-cumstance, do not take into account e.g. industrial dynamics such as the rise of new and fall of old industries. Thus, behind observed developments of size distributions over time may lay factors that are not related to any ‘real’ societal forces other than statistical (governmental) reorganizations. Fur-thermore, analyses of firm growth and survival can be carried out only to some extent with the use of cross section data: we do not know which indi-vidual business units grow, which are terminated, or which ones are new from one period to another. The problem of cause and effect is even so less discussed in some size distribution research. Nonetheless, it is a quite a seri-ous dilemma, and it deserves more academic attention. However, in the study over the development of the Swedish size distribu-tion I have suggested that its relative development in many respects followed phases or periods in the macroeconomic development. Over the course of time research has suggested different explanations as to why firms of, say, smaller size appear to be more or less dominant under certain periods. Some, such as during the 1950’s and –60’s, maintained that small firms became less important due to concentration tendencies while others claimed an increased division of production. Yet others have spoken about distinct phases in the economic development in which firms of particular sizes have been more or less important while others have seen changes in the size distribution as in-stitutional-driven or caused by unique phases. As for the Swedish develop-ment from the late 1960’s and onwards some scholars have claimed that mainly institutional determinants have shaped the size structure and lead to fewer growing firms. Nonetheless, international comparisons have shown a similar development during the same period that can cast some doubt on this explanation (even though it of course still might be true that Sweden has a relatively larger share of small businesses than do other developed econo-mies; I do however think that heterogeneity in statistical reporting and dis-similar definitions make international comparisons quite difficult). Data from the late 1800’s up to the years prior of World War I show that larger business units increased while smaller ones were reduced. These years were also characterized by macroeconomic growth and expansion. The pic-ture was quite opposite during the interwar years – here smaller business units increased in a relative sense, while at the same time the macroeco-nomic problems were rather severe. It is not unthinkable that a combination of factors – unemployment, downsizing etc. – were prevalent here. The im-mediate postwar years were, again, defined by larger shares of larger units. The postwar period – particularly during the 1960’s – was unique from a macroeconomic viewpoint. Thus, existing businesses could probably expand through organic as well as external growth. Similarly, even if the smallest
201
businesses increased significantly (both in absolute and relative figures) from, roughly, 1970 to 1999 it seems that the same tendency could be identi-fied here just as for earlier periods. The relatively smaller numbers of – or movement towards – small firms during boom years (for instance 1983/86 and 1996/97 and 1998/99) compared to less favorable periods (e.g. 1990/92 or 1993/95) speaks to some extent for this. I proposed that the pattern over one hundred years also suggests some correspondence with phases of mac-roeconomic inbalances/transformations and rationalizations in the economy which, to some extent, have affected the possibilities for firms to grow and expand. Yet, this must be seen as a complementary hypothesis that does not refute other, most plausible ones such as institutional explanations or ‘real-historical’ ones. The size distribution study showed that conditions for firms may be influ-enced by external or environmental factors while, of course, the role of indi-viduals should not be diminished. The empirical material covering longitu-dinal data (birth cohorts) of originally 2,200 joint-stock companies founded in Stockholm 1899, 1909, 1912, 1921, 1930, 1942 and 1950 had the aim to research the growth and survival of business firms from a structural and ex-ternal-oriented viewpoint. Gradually, more joint-stock companies were founded – from around 100 in Stockholm in 1899 to some 500 in 1950. In time, furthermore, a greater number of smaller firms were established – younger firms/cohorts were on average smaller than older ones. Probably this type of enterprise had a crowding out effect on others since it gradually became less costly to found a joint-stock company. The study of survival and selection (Chapter 5) confirmed to some extent previous research findings: insignificant age and small size were variables negatively correlated to sur-vival chances while larger and/or older units had lower hazard rates. The longitudinal design of the study makes it quite unique compared with much other research in the field since it follows the same units prospectively over a long period of time. Additionally, the cohort design of the database – sepa-rating generations of firms from each other – facilitated to a greater extent a ‘separation’ of age, period, cohort (and to that size) effects. Some interesting research results emerged. The study showed that cohorts (generations) founded during less-benign economic periods were more prone to exhibit early termination. Thus, period itself – or the economic environment – inten-sified the risk for termination due to low age and/or small size (as e.g. for Cohort 1921). Tests showed here that macroeconomic (in)stability – in this case represented by macroeconomic growth rates and interest rate conditions – was related to selection rates of firms. Secondly, even if firms from a cohort founded during unfavorable condi-tions managed to survive, increasing age did not necessarily protect them from disbanding. A ‘stable’ cohort with some considerable age – a mature population – could nonetheless exhibit increasing selection due to harsher times. This is the advantage in using longitudinal data. This was for instance
202
evident as concerns the increased selection in cohorts 1899, 1909 and 1912 during the economic crisis in the 1920’s. Furthermore, what was shown re-garding the developments of the cohorts from 1942 and 1950, the often-identified ‘law’ of a liability of newness and of smallness regardless of time and place was questioned. These cohorts did not behave as other ones. Thereby, environmental conditions (Cohort 1942 was initially operating under a heavily regulated economy as did partially the one from 1950; the postwar years were additionally signified by macroeconomic expansion) probably have significant explanatory power. Therefore, this study gave some important research results and cast doubt on the theory of a liability of age of firms and organizations. The ‘aggregate’ or cumulated behavior of newly founded firms may give evidence of an age liability. However, when taking into account generation and period factors, this theory or law may prove to be less valid. However, as economic as well as organization theory suggest, it should not be questioned that firms of larger (start-up) size have some scale advantages relative to smaller firms. There were obvious size effects in the termination patterns. In that case, and alike the cumulated be-havior of the firms in the cohorts, the liabilities of age and size were – as in much other research and theoretical models – confirmed. Still there can be some reservations on earlier theoretical assumptions which include age and size of firms as main or sole explanatory factors. More specifically, we can ask ourselves if not periodic (environmental) conditions interact with for instance firm size. Therefore, in such theoretical circumstances the impor-tance of the liability of size (smallness) can become exaggerated as well as underestimated, depending on empirical material. If, as an example, a theo-retical model is developed from a sample of young firms that experience a severe economic depression, it is not unlikely that size effects may be exag-gerated – especially if the model does not assume any environmental influ-ence. These relationships should be addressed more systematically in future research. A follow-up study of the firms from the seven birth cohorts that survived was also carried out in Chapter 6. It was here investigated how large the individual firms – some 340 firms were traced – had become in the 1990’s. If growth is a prerequisite for survival, then it could have been assumed that the firms would have had to become large business units. Nonetheless, most of the survivors were quite small in spite of the fact that they had had a long time to grow: their size distribution corresponded in a relative sense to any other size distribution in the sense that is was skewed. Yet, the ‘survivor sample’ showed that these firms on average were larger than joint-stock companies on average. Economic theories from classical economics and onwards have often claimed that firms, in order to survive, have to grow. Similarly more contemporary economic theory and entrepreneurship and small business research suggests that firms have to reach some minimum efficient scale or that smaller firms – as also was shown in the previous
203
chapter – have lower chances to survive. It was nonetheless interesting to detect a relationship between the founding size of firms and their size after the passing of several decades. Therefore, even if firms of course may have grown between observations (and the time-span was also quite long between measurements) the relationship was quite surprising. The larger firms – measured as their size at start and as their size in 1990/99 – were also gener-ally older firms, i.e. they were found in older cohorts. For that reason it might be reasonable to partially apply an institutional explanation for this phenomenon: older companies were generally larger than younger ones at founding and this pattern was quite consistent over time as regards the firms’ start-up size and subsequent size since, as the results in the study show, growth does not seem to be a condition for survival – not even in the long run. The subsequent study (Chapter 7) dealt with long-term firm growth at the micro level. Here, the growth of more than 400 firms from cohorts 1912 and 1930 was in focus. For this purpose I had constructed a longitudinal database that followed each firm from its birth to its termination – or, at most, for 30 years – and the database consisted in its original form of nearly 6,600 obser-vations based on data (statements and reports) generated by the firms in question. The two cohorts were founded under different conditions and addi-tionally went through different (and to some extent the same) conditions over time: Cohort 1912 was initially experiencing a favorable time but there-after harsher times – particularly from the last war years in the First World War and the following peace years. The younger cohort was founded during a depression that hit Sweden in the early 1930’s. This particular study’s focus on firms’ long-term growth with respect to external (environmental) and structural variables is in my opinion justified from the dominating body of research and theoretical models in entrepre-neurship and small business literature that has had much focus on individual-oriented factors and, additionally, has had a shorter perspective of time in which external variables are more difficult to take in. It is also justified by the fact that theories – for instance theory on firm growth – mainly have taken into consideration firm age and size (i.e. structural variables) and the effects thereof. For instance, much theoretical debate has been about the relationship between growth, age and size without any consideration as re-gards environmental factors. And, furthermore, it is justified by the fact that social science in general considers the interplay or relation between mi-cro/individual and macro/structural behavior as a fundamental question. As regards firm behavior, its environment is often – at least theoretically – thought of as an important determinant. Nevertheless, research that has taken in environmental factors when it comes to firm growth has often included a variety of factors. In my particu-lar case – and since the cohorts in the present study are heterogeneous – I once again employed ‘general’ or ‘universal’ variables, namely economic
204
growth (GDP) and interest rate indicators. As observed in much previous research, firms were generally growing faster (and unstable) when young. Additionally, smaller firms exhibited higher growth rates than larger ones. This is in line with a vast body of economic theories on the growth of firms and confirmed in many extents previous findings. My study assumed that economic conditions and fluctuations had an influential effect on firm growth. For instance, if there is an economic recession it can be assumed that aggregate demand is falling. Firms, in general, can therefore face diminish-ing markets for their products and services. Similarly, changing interest rates were affecting firms’ growth rates – it was assumed here that increasing interest rates diminished firm growth since it made capital more costly. Here was also, among other things, firm-specific variables (the age and size of firms) included in order to observe any interaction between on the one hand environmental variables and on the other firm variables. The analyses show that increasing age and larger size made firms more sensitive to environmental factors – both regarding macroeconomic growth and interest rate change. As earlier research has suggested, this phenomenon could be explained by the fact that larger firms tend to survive longer than smaller units – particularly under harsher economic conditions, larger firms may contract (diminish in size), and survive, to a greater extent than smaller businesses. But, as discussed, small firms may have no alternative uses for capital and labor. Therefore, economic downturns might affect larger firms more than smaller ones. Thus, the study has included factors that in much research due to data limitations are often difficult or impossible to incorpo-rate. It has also to a great extent met up with requests from scholars in entre-preneurship and small business research that have identified a need for more longitudinal research that investigates micro to macro relationships. As was shown here firms were sensitive to changing environmental conditions when, at the same time, structural factors were influential. The individual-oriented perspective should not be ignored; firms consist of – at most times – humans. Their actions, competence and motives are important factors to consider. Yet, also other phenomena are, as shown in this study, important factors that influence when, why and how much firms grow and shrink in size. These are some significant research results. As discussed above, while previous theoretical models on the micro growth of firms in entrepreneurship and small business research often has used personality based explanatory variables, some theories in economics maintain that firm behavior, such as growth, under some circumstances is determined by environmental conditions. Examples of such circumstances are credit conditions as well as macroeconomic demand shocks (that create uncertainty for firms). Another example is the dynamic theoretical frame-work developed by for instance Erik Dahmén. Here, firms are reactive as well as proactive in their behaviors. Such theoretical models are probably accurate to a great extent and they can be complementary to already existing
205
theories on firm behavior that assume that mainly human behavior and deci-sions affect the development of a business (which in my opinion is correct in many instances). Similarly, they can be complementary to theoretical models that take into account structural variables but leave out other explanations. This empirical and theoretical problem should be investigated more in future research and receive more attention – particularly in the development of research models and theories. Therefore, my findings do not reduce existing theoretical assumptions and empirical findings that have an individ-ual/entrepreneurial focus; rather, they support earlier theories and also in-clude theoretical assumptions from other research fields. In the dissertation’s final empirical chapter (8) the above-mentioned data-base of more than 400 firms from cohorts 1912 and 1930 was one again em-ployed. Here, however, the performance of firms in relation to successions in those very firms was investigated. Leadership and management practices often have been assumed to affect the performance of firms, particularly in management and organization theory. Likewise, successions – discontinuity of leadership and ownership – in organizations and in business firms is a well-studied research area. Yet, governance and successions in small firms has been a less investigated field. The database on the two cohorts from 1912 and 1930 contains data on when and to what extent there were succes-sions in leadership and ownership in the firms in question over time. Most firms were small (and remained small) over their life course. Previous re-search results and theoretical models on management behavior and succes-sion suggest that the relationship between firms’ presuccession performance – i.e. their performance measured in financial or other variables – has a negative relationship with their postsuccession performance (growth or sur-vival). This means that a firm that performs well prior to a succession event will perform poorly (or less well) afterwards and vice versa. This is due to the succession’s disruptive nature. Nonetheless, other results have shown a positive correlation – firms that perform well or grow prior to succession will continue to do so while poor performers will likewise continue to do so after the succession event. In this case the thesis is that presuccession per-formance has a re-enforcing effect (‘success breeds success’ and so on). Other researchers have also identified particularly the first succession event in a firm’s lifetime as crucial for survival. Here, perhaps, organizations and businesses are considered to lead a life of their own to a greater extent. My results in the study show that of nearly 6,600 observation years – com-prising the life spans of over 400 firms – there were 381 succession events measured as board turnovers. Given the large number of observation years this figure was quite insignificant and it therefore could be questioned, at least to some extent, if successions and managerial turbulence are crucial events for firms. Nevertheless, early successions (i.e. at an early stage of a firm’s life time) were related to achieved life-length, which was interpreted as ‘early turbulence’ negatively affecting firms’ probability to continue. And
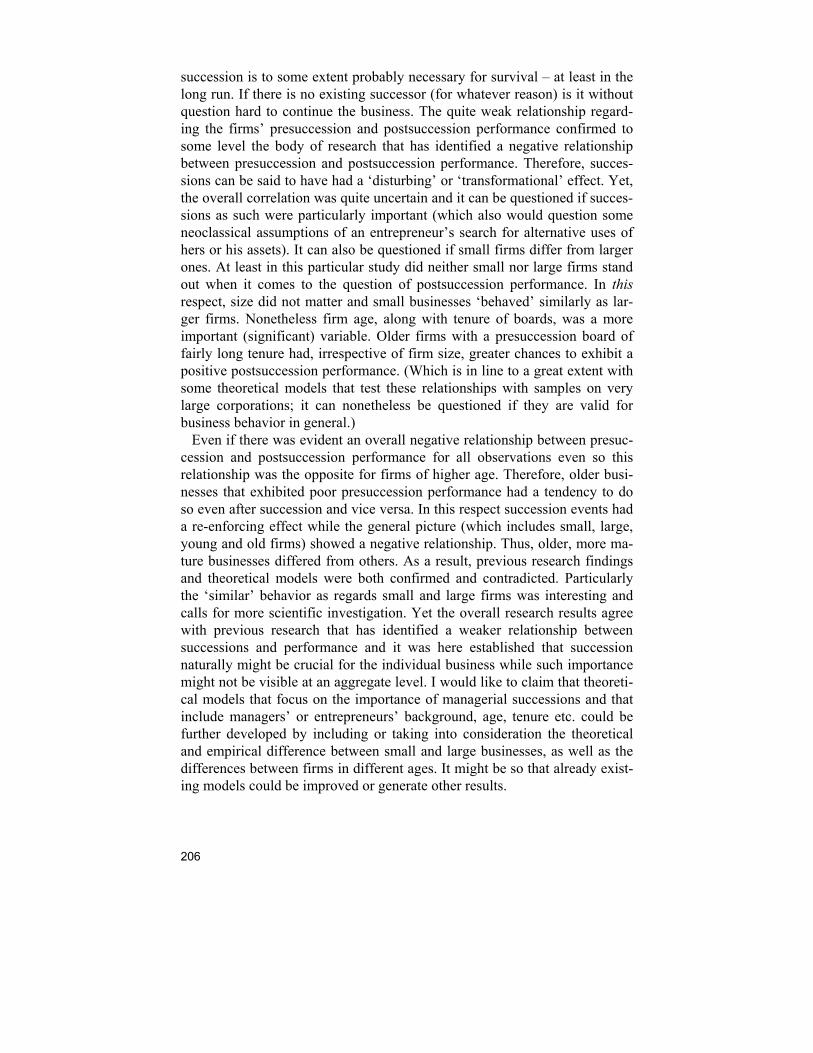
206
succession is to some extent probably necessary for survival – at least in the long run. If there is no existing successor (for whatever reason) is it without question hard to continue the business. The quite weak relationship regard-ing the firms’ presuccession and postsuccession performance confirmed to some level the body of research that has identified a negative relationship between presuccession and postsuccession performance. Therefore, succes-sions can be said to have had a ‘disturbing’ or ‘transformational’ effect. Yet, the overall correlation was quite uncertain and it can be questioned if succes-sions as such were particularly important (which also would question some neoclassical assumptions of an entrepreneur’s search for alternative uses of hers or his assets). It can also be questioned if small firms differ from larger ones. At least in this particular study did neither small nor large firms stand out when it comes to the question of postsuccession performance. In this respect, size did not matter and small businesses ‘behaved’ similarly as lar-ger firms. Nonetheless firm age, along with tenure of boards, was a more important (significant) variable. Older firms with a presuccession board of fairly long tenure had, irrespective of firm size, greater chances to exhibit a positive postsuccession performance. (Which is in line to a great extent with some theoretical models that test these relationships with samples on very large corporations; it can nonetheless be questioned if they are valid for business behavior in general.) Even if there was evident an overall negative relationship between presuc-cession and postsuccession performance for all observations even so this relationship was the opposite for firms of higher age. Therefore, older busi-nesses that exhibited poor presuccession performance had a tendency to do so even after succession and vice versa. In this respect succession events had a re-enforcing effect while the general picture (which includes small, large, young and old firms) showed a negative relationship. Thus, older, more ma-ture businesses differed from others. As a result, previous research findings and theoretical models were both confirmed and contradicted. Particularly the ‘similar’ behavior as regards small and large firms was interesting and calls for more scientific investigation. Yet the overall research results agree with previous research that has identified a weaker relationship between successions and performance and it was here established that succession naturally might be crucial for the individual business while such importance might not be visible at an aggregate level. I would like to claim that theoreti-cal models that focus on the importance of managerial successions and that include managers’ or entrepreneurs’ background, age, tenure etc. could be further developed by including or taking into consideration the theoretical and empirical difference between small and large businesses, as well as the differences between firms in different ages. It might be so that already exist-ing models could be improved or generate other results.

207
This dissertation has moved over different research fields and used both aggregate and micro empirical materials in order to study a phenomenon that in a general sense could be labeled as ‘business behavior’ – in this respect firm growth and survival. Alternative methods or other data could give other and conflicting results. Nonetheless do I think that it is important to stress the influence not only of managerial and entrepreneurial traits but also of structural factors. And, moreover: in the life, growth and death of firms other elements are crucial, for instance macroeconomic conditions and institu-tional as well as policy related factors. They all coincide. In some periods in a firm’s lifetime, or during certain historical periods, one element may be more important than another. I have here tried to incorporate some of them in this dissertation by using longitudinal data and some alternative methods. . .

208

209
Appendices
Appendix 1.
Life tables, seven birth cohorts of joint-stock companies. Remaining population (percent) over 30 observation years.
Cohort 1899
Cohort 1909
Cohort 1912
Cohort 1921
Cohort 1930
Cohort 1942
Cohort 1950
Year 0 100 100 100 100 100 100 100 1 88 86 98 78 86 99 99 2 74 75 91 68 75 96 97 3 65 65 75 61 67 93 95 4 63 59 65 53 65 90 93 5 58 54 59 47 62 88 89 6 56 53 56 46 60 85 86 7 53 51 52 43 59 83 84 8 51 49 49 41 57 81 81 9 49 47 43 40 55 80 79 10 47 43 41 39 54 76 76 11 46 40 37 37 52 74 73 12 46 39 34 35 50 73 70 13 44 38 34 34 49 69 68 14 43 36 33 32 48 68 66 15 42 36 31 31 48 66 63 16 41 35 29 30 47 64 61 17 37 34 27 29 47 62 59 18 34 34 26 29 47 58 56 19 33 34 25 29 46 57 53 20 31 34 23 28 46 56 51 21 30 31 22 28 45 55 48 22 30 31 21 28 44 54 42 23 29 30 21 27 43 52 40 24 27 30 21 27 40 50 40 25 27 29 20 27 39 49 39 26 26 28 20 26 37 47 38 27 26 26 20 25 37 45 37 28 25 26 20 25 36 44 37 29 25 25 19 25 35 41 37 30 25 24 19 25 35 37 37

210
Appendix 2.
Logistic regression. Termination at young age and environment.
[1] [2]
B Wald Sig. Odds ratio B Wald Sig. Odds
ratio
(Constant) -2.004 117.721 0.000 0.135 -1.933 52.854 0.000 0.145
Start-up size -0.035 12.945 0.000 0.706 -0.496 1.874 0.171 0.609
Interest rate -0.008 0.495 0.482 0.992 -0.031 3.855 0.050 0.969
GDP 0.430 128.290 0.000 1.537 0.497 90.847 0.000 1.644
Interest rate x Size 0.058 6.063 0.014 1.060
GDP x Size -0.174 5.137 0.023 0.840 Model Chi-Square [Sig.]
152.092 [0.000]
160,515 [0.000]
Df. 3 5 Pseudo-R2 0.0955 0,1005 N [n = Yes] 2,154
[686]
Appendix 3.
Tests of growth and size among firms controlling for firm age.
Regression coefficients (B). All coefficients significant at the 0.01 level. Size = assets. Logarith-mic values. [1] Start-up size (t 0) and size at t
t +1 t +2 t +3 t +5 t +10 t +15 t +20 t +25 t +30
B 0.867 0.843 0.817 0.791 0.703 0.667 0.683 0.825 0.785
[2] Size a previous year and size at t ,different periods (‘running tests’)
Firm years/age
1-2 2-3 3-4 1-3 2-4 1-5 5-10 10-15 15-20 20-25 25-30
B 0.867 0.968 0.977 0.841 0.943 0.791 0.912 0.949 0.931 0.985 1.036
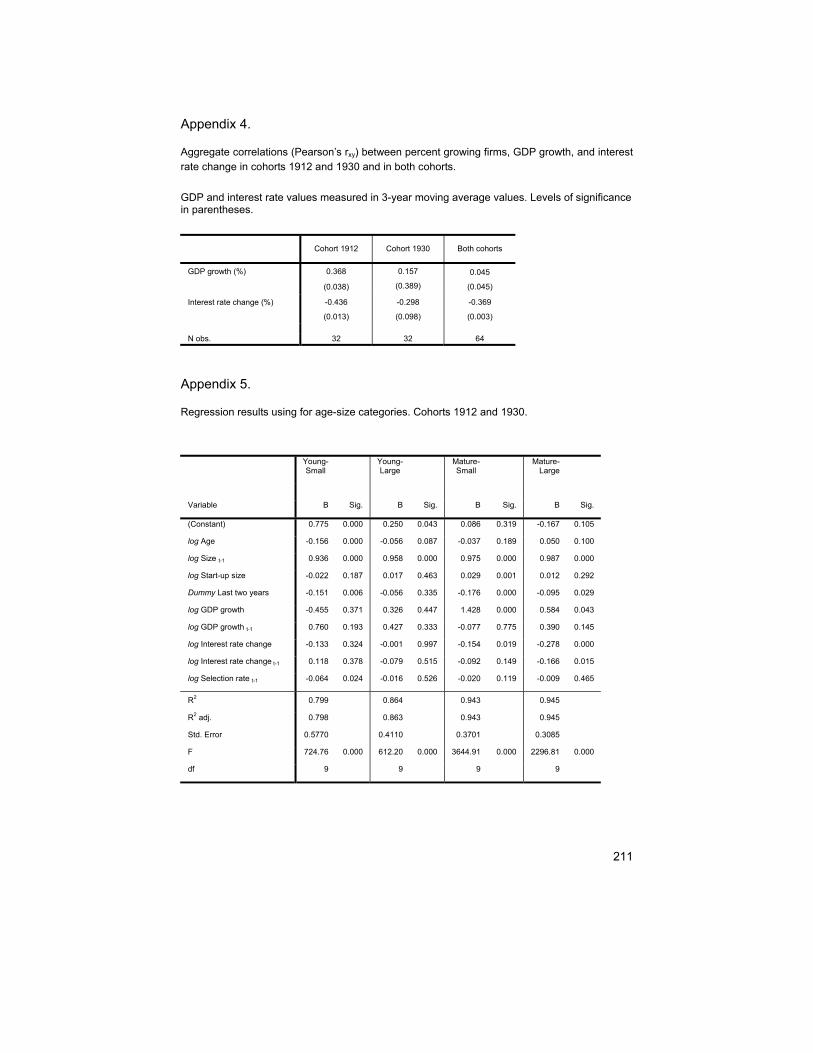
211
Appendix 4.
Aggregate correlations (Pearson’s rxy) between percent growing firms, GDP growth, and interest rate change in cohorts 1912 and 1930 and in both cohorts.
GDP and interest rate values measured in 3-year moving average values. Levels of significance in parentheses.
Cohort 1912 Cohort 1930 Both cohorts
GDP growth (%) 0.368
(0.038)
0.157
(0.389)
0.045
(0.045)
Interest rate change (%) -0.436
(0.013)
-0.298
(0.098)
-0.369
(0.003) N obs. 32 32 64
Appendix 5.
Regression results using for age-size categories. Cohorts 1912 and 1930.
Young-
Small Young-
Large Mature-Small
Mature-Large
Variable B Sig. B Sig. B Sig. B Sig.
(Constant) 0.775 0.000 0.250 0.043 0.086 0.319 -0.167 0.105
log Age -0.156 0.000 -0.056 0.087 -0.037 0.189 0.050 0.100
log Size t-1 0.936 0.000 0.958 0.000 0.975 0.000 0.987 0.000
log Start-up size -0.022 0.187 0.017 0.463 0.029 0.001 0.012 0.292
Dummy Last two years -0.151 0.006 -0.056 0.335 -0.176 0.000 -0.095 0.029
log GDP growth -0.455 0.371 0.326 0.447 1.428 0.000 0.584 0.043
log GDP growth t-1 0.760 0.193 0.427 0.333 -0.077 0.775 0.390 0.145
log Interest rate change -0.133 0.324 -0.001 0.997 -0.154 0.019 -0.278 0.000
log Interest rate change t-1 0.118 0.378 -0.079 0.515 -0.092 0.149 -0.166 0.015
log Selection rate t-1 -0.064 0.024 -0.016 0.526 -0.020 0.119 -0.009 0.465
R2 0.799 0.864 0.943 0.945
R2 adj. 0.798 0.863 0.943 0.945
Std. Error 0.5770 0.4110 0.3701 0.3085
F 724.76 0.000 612.20 0.000 3644.91 0.000 2296.81 0.000
df 9 9 9 9
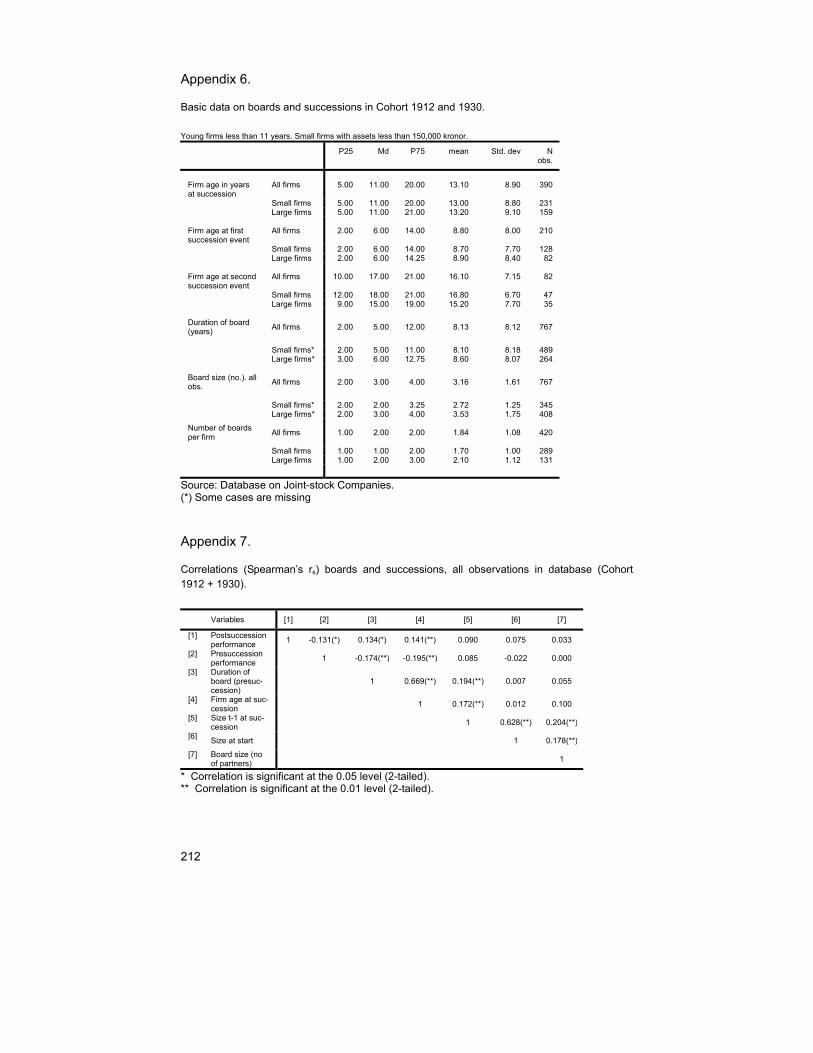
212
Appendix 6.
Basic data on boards and successions in Cohort 1912 and 1930.
Young firms less than 11 years. Small firms with assets less than 150,000 kronor.
P25 Md P75 mean Std. dev N obs.
Firm age in years at succession
All firms 5.00 11.00 20.00 13.10 8.90 390
Small firms 5.00 11.00 20.00 13.00 8.80 231 Large firms 5.00 11.00 21.00 13.20 9.10 159 Firm age at first succession event
All firms 2.00 6.00 14.00 8.80 8.00 210
Small firms 2.00 6.00 14.00 8.70 7.70 128 Large firms 2.00 6.00 14.25 8.90 8.40 82 Firm age at second succession event
All firms 10.00 17.00 21.00 16.10 7.15 82
Small firms 12.00 18.00 21.00 16.80 6.70 47 Large firms 9.00 15.00 19.00 15.20 7.70 35 Duration of board (years)
All firms 2.00 5.00 12.00 8.13 8.12 767
Small firms* 2.00 5.00 11.00 8.10 8.18 489 Large firms* 3.00 6.00 12.75 8.60 8.07 264 Board size (no.). all obs.
All firms 2.00 3.00 4.00 3.16 1.61 767
Small firms* 2.00 2.00 3.25 2.72 1.25 345 Large firms* 2.00 3.00 4.00 3.53 1.75 408
Number of boards per firm
All firms
1.00 2.00 2.00 1.84 1.08 420
Small firms 1.00 1.00 2.00 1.70 1.00 289 Large firms 1.00 2.00 3.00 2.10 1.12 131
Source: Database on Joint-stock Companies. (*) Some cases are missing
Appendix 7.
Correlations (Spearman’s rs) boards and successions, all observations in database (Cohort 1912 + 1930).
Variables [1] [2] [3] [4] [5] [6] [7]
[1] Postsuccession performance 1 -0.131(*) 0.134(*) 0.141(**) 0.090 0.075 0.033
[2] Presuccession performance 1 -0.174(**) -0.195(**) 0.085 -0.022 0.000
[3] Duration of board (presuc-cession)
1 0.669(**) 0.194(**) 0.007 0.055
[4] Firm age at suc-cession 1 0.172(**) 0.012 0.100
[5] Size t-1 at suc-cession 1 0.628(**) 0.204(**)
[6] Size at start 1 0.178(**)
[7] Board size (no of partners) 1
* Correlation is significant at the 0.05 level (2-tailed). ** Correlation is significant at the 0.01 level (2-tailed).
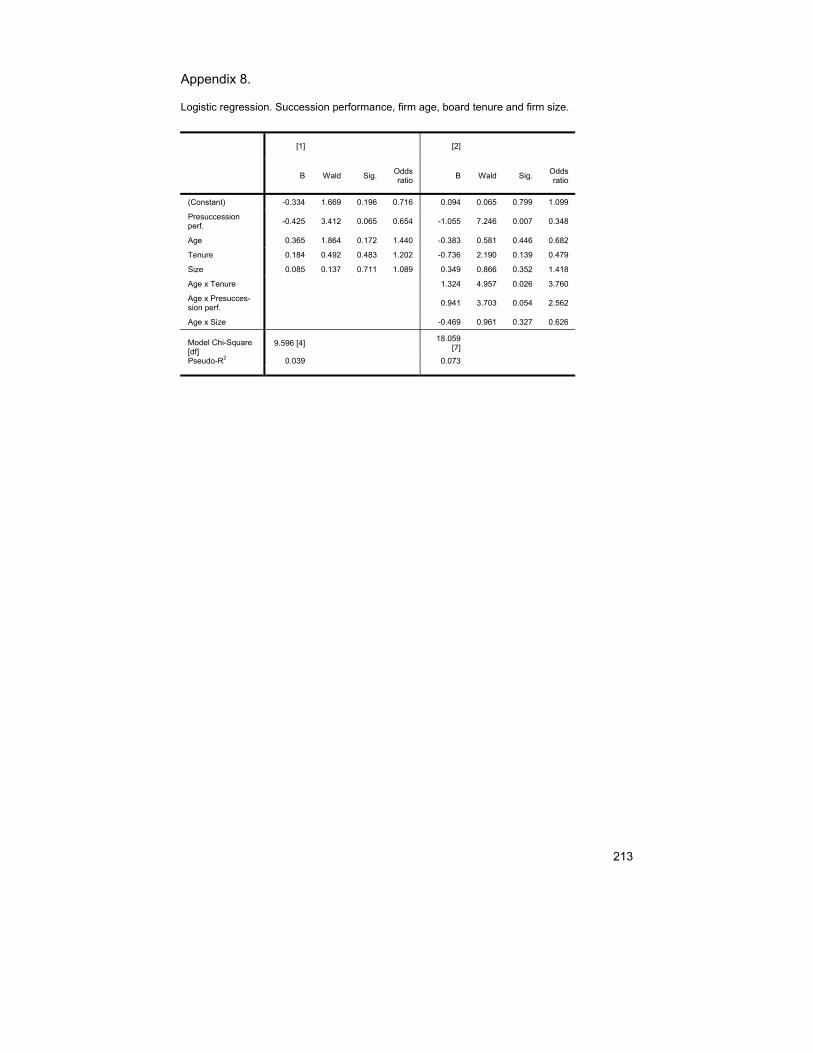
213
Appendix 8.
Logistic regression. Succession performance, firm age, board tenure and firm size.
[1] [2]
B Wald Sig. Odds
ratio B Wald Sig. Odds ratio
(Constant) -0.334 1.669 0.196 0.716 0.094 0.065 0.799 1.099
Presuccession perf. -0.425 3.412 0.065 0.654 -1.055 7.246 0.007 0.348
Age 0.365 1.864 0.172 1.440 -0.383 0.581 0.446 0.682
Tenure 0.184 0.492 0.483 1.202 -0.736 2.190 0.139 0.479
Size 0.085 0.137 0.711 1.089 0.349 0.866 0.352 1.418
Age x Tenure 1.324 4.957 0.026 3.760
Age x Presucces-sion perf. 0.941 3.703 0.054 2.562
Age x Size -0.469 0.961 0.327 0.626
Model Chi-Square [df]
9.596 [4] 18.059 [7]
Pseudo-R2 0.039 0.073

214
215
References
Unprinted sources Riksarkivet (RA)
Patent- och registreringsverket, bolagsbyrån (PRV), 1897-1972 Aktiebolagsregistret, serie D1 AA Alfabetiska aktiebolagsregistret, serie D2 C Registreringshandlingar, signum E3 A Räkenskapshandlingar till aktiebolag, signum E5 A Supplement I-III till aktiebolagsregistret, signum D1 ABA, ABB, ABC
Bolagsverket/Patent- och registreringsverket, Bolagsavdelningen (PRV)
Styrelse- och revisionsberättelser för aktiebolag
Printed sources Adizes, Ichak (1988), Organisationers livscykler. Malmö: Liber. Affärsdata, Databas över aktiebolag (Sveriges företag), [www.affarsdata.se, 2000-
2001; 2003]. Agarwal, Naresh C. (1979), “Research Notes on the Interchangeability of Size Mea-
sures”, Academy of Management Journal, Vol. 22(2). Agarwal, Rajshree – Audretsch, David B (1999), “The Two Views of Small Firms in
Industry Dynamics: A Reconciliation”, Economic Letters, Vol. 62(2). Akerlof, George A. (1970), “The Market for ‘Lemons’: Quality Uncertainty and the
Market Mechanism”, Quarterly Journal of Economics, Vol. 84(3). Aldrich, Howard E. – Martinez, Martha Argelia (2001), “Many are Called but Few
are Chosen: An Evolutionary Perspective for the Study of Entrepreneurship”, Entrepreneurship Theory & Practice, Vol. 25(4).
Allison, Paul D. (1984), Event History Analysis. Regression for Longitudinal Event Data. Beverly Hills: Sage Publications.
Almus, Matthias – Nerlinger, Eric A. (1999), “Growth of New Technology-Based-Firms - Which Factors Matter?”, Small Business Economics, Vol. 13(2).
Almus, Matthias (2004), ”The Shadow of Death – An Empirical Analysis of the Pre-Exit Performance of New German Firms”, Small Business Economics, Vol. 23 (3).
Anderson, Terry L. – Thomas, Robert Paul (1978), “Economic Growth in the Se-venteenth Century Chesapeake”, Explorations in Economic History, Vol. 15(4).
Andersson, Göran (1978), Storlek och småföretag. Växjö: Institutionen för ekonomi och administration.
Anell, Barbro (1993), ”Timing is All: On the Roles of Owners and Managers in Ex-panding and Contracting Corporate Activities”, in Ullenhag, K. (red), Nordic Business in the Long View: On Control and Strategy in Structural Change. London: Frank Cass.
Anheier, Helmut K. (1996), ”Organizational Failures and Bankruptcies”, American Behavioral Scientist, Vol. 39(8).
Audretsch David B. – Acs, Zoltan J. (1994) ”New Firm Startups, Technology, and Macroeconomic Fluctuations”, Small Business Economics, Vol. 6(6).

216
Audretsch, David B. – Mahmood, Talat (1995), "New-Firm Survival: New Results Using a Hazard Function", Review of Economics and Statistics, Vol. 77(1).
Audretsch, David B. – Santarelli, Enrico – Vivarelli, Marco (1999), “Start-up Size and Industrial Dynamics: Some Evidence From Italian Manufacturing”, Interna-tional Journal of Industrial Organization, 17(7).
Audretsch, David B. (1995), “Innovation, Growth and Survival”, International Jour-nal of Industrial Organization, 13(4).
_______ (1997), “Technological Regimes, Industrial Demography and the Evolution of Industrial Structures”, Industrial and Corporate Change, Vol. 6(1).
_______ (2002), “Entrepreneurship: A Survey of the Literature”, Prepared for the European Commission, Enterprise Directorate General. October, 2002.
_______ (2005), “The Entrepreneurial Society”. The FSF-NUTEK Award – 10-Year Anniversary Series.
Baliga, B. Ram – Moyer, R. Charles – Rao, Ramesh S. (1996), “CEO Duality and Firm Performance: What’s the Fuss?”, Strategic Management Journal, Vol. 17(1).
Bartelsman, Eric – Scarpetta, Stefano – Schivardi, Fabiano (2003), “Comparative Analysis of Firm Demographics and Survival: Micro-level Evidence for the OECD Countries. OECD. Economics Department Working Papers No. 348.
Barth, Henrik (2004), Barriers to Growth and Development in Small Firms. Luleå: Luleå University of Technology.
Baumol, Willam (1990), “Entrepreneurship: Productive, Unproductive, and De-structive”, Journal of Political Economy, Vol 98(5).
Beatty, Randolph P. – Zajac, Edward J. (1987), “CEO Change and Firm Perfor-mance in Large Corporations: Succession Effects and Manager Effects”, Strate-gic Management Journal, Vol. 8(4).
Bennet, R.J. – Robson, P.J.A, (2004), “The Role of Boards of Directors in Small and Medium-sized Firms”, Journal of Small Business and Enterprise Development, Vol. 11(1).
Bhattacharjee, Arnab – Higson, C – Holly, S. – Kattuman, P. (2002), “Macro Eco-nomic Instability and Business Exit: Determinants of Failures and Acquisitions of Large UK Firms”, Cambridge Working Papers in Economics.
Binks, Martin – Ennew, Christine (1996), ”Growing Firms and the Credit Constra-int”, Small Business Economics, Vol. 8(1).
Birch, David L. (1979), Job Creation in America: How our Smallest Companies put the Most People to Work. New York: Free Press.
Boeker, Warren – Goodstein, Jerry (1991), “Organizational Performance and Adap-tation: Effects of Environment and Performance on Changes in Board Compo-sitions”, Academy of Management Journal, Vol. 34(4).
Boeker, Warren (1992), “ Power and Managerial Dismissal: Scapegoating at the Top”, Administrative Science Quarterly, Vol. 37(3).
_______ (1997), “Strategic Change: The Influence of Managerial Characteristics and Organizational Growth”, Academy of Management Journal, Vol. 40(1).
Boeri, Tito – Bellmann, Lutz (1995), “Post-entry Behaviour and the Cycle: Evidence from Germany”, International Journal of Industrial Organization, Vol. 13(4).
Bosworth, Derek – Jacobs, Chris (1989), “Management Attitudes, Behaviour, and Abilities as Barriers to Growth”, in Barber, John – Metcalfe, Stanley – Porteous, Mike (eds.), Barriers to Growth in Small Firms. London: Routledge.

217
Box, Marcus (2001), New Venture, Survival and Growth. Development of Six Co-horts of Swedish Business Firms, 1899-1999. Stockholm: Department of Eco-nomic History.
Braunerhjelm, Pontus – Carlsson, Bo (1993), “Entreprenörskap, småföretag och industriell förnyelse 1968-91”, Ekonomisk Debatt, 4.
Braunerhjelm, Pontus (1992), ”Industri- och branschbegreppets förändring”. IUI Working Papers, No. 332.
_______ (1993), “Nyetableringar och småföretag i svensk tillverkningsindustri”. IUI Working Papers, No. 376.
Bridge, Simon – O’Neill, Ken – Cromie, Stan (1998), Understanding Enterprise, Entrepreneurship & Small Business. Basingstoke: Macmillan.
Brito, Paulo – Mello, António S. (1995), “Financial Constraints and Firm Post-Entry Performance”, International Journal of Industrial Organization, Vol. 13(4).
Brockhaus, Robert H. (1994), “Entrepreneurship and Family Business Research: Comparisons, Critique, and Lessons”, Entrepreneurship Theory & Practice, Vol. 19(1).
Bruno, Albert V. – Tyebjee, Tyzoon T. (1988), ”The Environment for Entrepreneur-ship”, in Kent, C.A. – Sexton, D.L. – Vesper, K.H. (eds.), Encyclopedia of Ent-repreneurship. Prentice-Hall: Englewood Cliffs.
Brüderl, Josef – Preisendörfer, Peter – Ziegler, Rolf (1992), “Survival Chances of Newly Founded Business Organizations”, American Sociological Review, Vol. 57(2).
Brüderl, Josef – Schüssler, Rudoph (1990), “Organizational Mortality: The Liabili-ties of Newness and Adolescence”, Administrative Science Quarterly, Vol. 35(3).
Bunting, David – Barbour, Jeffery (1971), “Interlocking Directorates in Large Ame-rican Corporations, 1896-1964”, The Business History Review, Vol. 45(3).
Carlson, Sune (1945), Företagsledning och företagsledare. Stockholm: Handelshög-skolan.
Carlsson, Bo (1992), “The Rise of Small Business: Causes and Consequences”, IUI Working Papers, No. 357.
Carroll, Glenn R – Hannan, Michael T (1995), Organizations in Industry: Strategy, Structure, and Selection. New York: Oxford University Press.
Carroll, Glenn R. – Hannan, Michael T. (2000), The Demography of Corporations and Industries. Princeton: Princeton University Press.
Carroll, Glenn R. (1984), “Dynamics of Publisher Succession in Newspaper Organi-zations”, Administrative Science Quarterly, Vol. 29(1).
Carstedt, Göran – Isaksson Pérez, Birgitta (1974), Företag i strukturomvandlingen. Umeå: Studier i företagsekonomi, Umeå universitet.
Caves, Richard E. (1998), “Industrial Organization and New Findings on the Turno-ver and Mobility of Firms”, Journal of Economic Literature, Vol. 36(4).
Chandler, Alfred D. (1977), The Visible Hand: The Managerial Revolution in Ame-rican Business. Cambrige: Harvard University Press.
_______ (1992), “Organizational Capabilities and the Economic History of the In-dustrial Enterprise”, The Journal of Economic Perspectives, Vol. 6(3).
Chandler, Gaylen N. – Hanks, Steven H. (1994), “Founder Competence, the Envi-ronment, and Venture Performance”, Entrepreneurship Theory & Practice, Vol. 18(3).

218
Chandler, Gaylen N. – Lyon, Douglass, W. (2001), ”Issues of Research Design and Construct Measurement in Entrepreneurship Research: The Past Decade, Entre-preneurship Theory & Practice, Vol. 25(4).
Cheung, Steven N.S. (1983), “The Contractual Nature of the Firm”, Journal of Law and Economics, Vol. XXVI, April.
Coase, Ronald H. (1937), “The Nature of the Firm”, Economica, Vol. 4(16). Cooper, Arnold C. – F. Javier Gimeno-Gascon – Woo, Carolyn Y. (1994), ”Initial
Human and Financial Capital as Predictors of New Venture Performance”, Journal of Business Venturing, Vol. 9(5).
Cooper, Arnold C. – Gimeno Gascón, F Javier. (1992), “Entrepreneurs, Processes of Founding, and New-Firm Performance”, in Sexton, D L. – Kasarda, J D. (eds.), The State of the Art of Entrepreneurship. Boston: PWS-Kent.
Covin Jeffrey D. – Slevin Dennis P. (1989), ”Strategic Management of Small Firms in Hostile and Benign Environments”, Strategic Management Journal, Vol. 10(1).
Cyert, Richard M. – Simon, Herbert A. – Trow, Donald B. (1956), “Observations of a Business Decision”, The Journal of Business, Vol. 29(4).
Dahlqvist, Jonas – Davidsson, Per – Wiklund, Johan (2000), “Initial Conditions as Predictors of New Venture Performance: a Replication and Extension of the Cooper et al. Study”, Enterprise and Innovation Management Studies, Vol. 1(1).
Dahmén, Erik (1950), Svensk industriell företagarverksamhet: Kausalanalys av den industriella utvecklingen 1919-1939 (I-II). Stockholm: IUI.
_______ (1953), Företagsbildningen förr och nu. Stockholm: IUI. _______ (1992), “Företagarverksamheten i den ekonomiska teorien, in Lindgren,
Håkan (red.), Teori, empiri och metod i ekonomisk-historisk analys. Uppsala Papers in Economic History. Basic Readings No 8.
Davidsson, Per – Delmar, Frédéric (1997), ”High-Growth Firms: Characteristics, Job Contribution and Method Observations”. Paper presented at RENT XI Con-ference, Germany.
Davidsson, Per – Delmar, Frédéric (2000), “På jakt efter de nya arbetstillfällena: tillväxtföretagens roll”, Ekonomisk Debatt, 3.
Davidsson, Per – Delmar, Frédéric (2001), “Tillväxtföretag i Sverige: förekomst och utvecklingsmönster”, in Davidsson, Per – Delmar, Frédéric – Wiklund, Johan (eds.), Tillväxtföretagen i Sverige. Stockholm: SNS.
Davidsson, Per – Henrekson, Magnus (2002), ”Determinants of the Prevalence of Start-Ups and High-Growth Firms.” Small Business Economics, Vol. 19(2).
Davidsson, Per – Wiklund, Johan (2000), ”Conceptual and Empirical Challenges in the Study of Firm Growth”, in Sexton, Donald L. – Landström, Hans (eds.), The Blackwell Handbook of Entrepreneurship. Oxford: Blackwell.
Davidsson, Per – Wiklund, Johan (2001), ”Levels of Analysis in Entrepreneurship Research: Current Research Practice and Suggestions for the Future”, Entrepre-neurship Theory & Practice, Vol. 25(4).
Davidsson, Per (1989), Continued Entrepreneurship and Small Firm Growth. Stockholm: EFI.
_______ (2004), Researching Entrepreneurship. Boston: Springer. Davis, Steven J – Haltiwanger, John – Schuh, Scott (1996), ”Small Business and
Job Creation? Dissecting the Myth and Reassessing the Facts”, Small Business Economics, Vol. 8(4).

219
Davis, Steven J. – Henrekson, Magnus (1999), “Explaining National Differences in Size and Industry Distribution of Employment”. Small Business Economics, Vol. 12(1).
Delmar, Frédéric – Davidsson, Per – Gartner, William B. (2003), “Arriving at the high-growth firm”, Journal of Business Venturing, Vol. 18(2).
Delmar, Frédéric – Davidsson, Per (1998), “A Taxonomy of High-Growth Firms”, in Reynolds, Paul D. et al., Frontiers of Entrepreneurship Research 1998: Pro-ceedings of the Eighteenth Annual Entrepreneurship Research Conference. Wellesley, Mass: Boston College.
Delmar, Frédéric (1996), Entrepreneurial Behavior and Business Performance. Stockholm: EFI.
_______ (1997), ”Measuring Growth: Methodological Considerations and Empirical Results”, in Donckels, R. – Miettinen, A. (eds.) Entrepreneurship and SME Research: On its Way to the Next Millennium. Hants: Ashgate.
Djurfeldt, Göran – Larsson, Rolf – Stjärnhagen, Ola (2003), Statistisk verktygslåda – samhällsvetenskaplig orsaksanalys med kvantitativa metoder. Stockholm: Stu-dentlitteratur.
Dobb, Maurice (1963/1973), Studier i kapitalismens utveckling. Stockholm: Rabén & Sjögren.
Du Rietz, Gunnar (1975), Etablering, nedläggning och industriell tillväxt i Sverige 1954-1970. Stockholm: IUI.
_______ (1980), Företagsetableringarna i Sverige under efterkrigstiden. Stock-holm: IUI.
Dunne, Paul – Hughes, Alan (1994), “Age, Size, Growth and Survival: UK Compa-nies in the 1980s”, Journal of Industrial Economics, Vol. 42(2).
Dunne, Timothy – Roberts, Mark J. – Samuelson, Larry (1988), “Patterns of Firm Entry and Exit in U.S. Manufacturing Industries”, RAND Journal of Economics, Vol. 29(4).
Dunne, Timothy – Roberts, Mark J. – Samuelson, Larry (1989), ”The Growth and Failure of U.S. Manufacturing Plants”, The Quarterly Journal of Economics, Vol. 104 (4).
Edling, Christofer – Hedström, Peter (2003), Kvantitativa metoder: grundläggande analysmetoder för samhälls- och beteendevetare. Lund: Studentlitteratur.
Edvinsson, Rodney (2005), Growth, Accumulation, Crisis. With New Macroecono-mic data for Sweden 1800-2000. Stockholm: Department of Economic History.
Eggeby, Eva – Söderberg, Johan (1997), Kvantitativa metoder för ekonomisk och social historia. Stockholm: Ekonomisk-historiska institutionen.
Eisenhart, Kathleen M. – Schoonhoven, Claudia Bird (1990), ”Organizational Frowth: Linking Founding Team, Strategy, Environment, and Growth Among U.S. Semiconductor Ventures, 1978-1988”, Administrative Science Quarterly, Vol. 35(3).
Eliasson, Gunnar, ed. (2005), The Birth, the Death and the Life of Firms. The Role of Entrepreneurship, Creative Destruction and Conservative Institutions in a Growing Experimentally Organized Economy. Stockholm: Ratio.
Engwall, Lars (1970), Size Distribution of Firms. Stockholm: Department of Busi-ness Administration.
_______ (1992), Mercury meets Minerva: Business Studies and Higher Education. The Swedish Case. Oxford: Pergamon.

220
Erixon, Lennart (1998), “The Theory of Transformation Pressure – a New Perspec-tive on Growth and Economic Policy”, Research Papers in Economics, 1998:3. Stockholm: Department of Economics.
_______ (2001), “Transformation Pressure and Growth – A Missing Link in Macro-economics”, Working Papers in Economics, 2001:3. Stockholm: Department of Economics.
European Commission (2003), SMEs in Europe 2003. Observatory of European SMEs 2003/ No. 7.
Evans, David S. (1987a), “Tests of Alternative Theories of Firm Growth”, Journal of Political Economy, Vol. 95(4).
_______ (1987b), ”The Relationship Between Firm Growth, Size, and Age: Esti-mates for 100 Manufacturing Industries”, The Journal of Industrial Economics, Vol. (35)4.
Everett, Jim E. – Watson, John (1998), “Small Business Failure and External Risk Factors”, Small Business Economics, Vol. 11(4).
Fama, Eugene F. – Jensen, Michael C. (1983), “Separation of Ownership and Con-trol”, Journal of Law and Economics, Vol. 26(2).
Filippi, Enrico – Zanetti, Giovanni (1971), “Exogenous and Endogenous Factors in the Growth of Firms”, in Marris, Robin and Wood, Adrian (eds.) The Corporate Economy. Growth, Competition, and Innovative Potential. London: Macmillan.
Foss, Nicolai J. (1995), “The Theory of the Firm: Towards a Rational Reconstruc-tion of Its History”. Working Paper, 95:7. Copenhagen: Institute of Industrial Economics and Strategy.
Friedman, Stewart D. – Singh, Harbir (1989), “CEO Succession and Stockholder Reaction: The Influence of Organizational Context and Event Content”, Aca-demy of Management Journal, Vol. 32(4).
Gabrielsson, Jonas (2003), Boards and Governance in SMEs – An Inquiry into Boards’ Contribution to Firm Performance. Halmstad: SIRE.
Gailbraith, John Kenneth (1967), Den nya industristaten. Stockholm: Wahlström & Widstrand.
Galambos, Louis (1966), “Business History and the Theory of the Growth of the Firm”, Explorations in Entrepreneurial History, 2nd series, 4.
Gandemo, Bertil (1996), “Tillväxt och förändring”, in Johannisson, Bengt – Lind-mark, Leif (eds.), Företag, Företagare, Företagsamhet. Lund: Studentlitteratur.
Garnsey, Elizabeth (1998), “A Theory of the Early Growth of the Firm”, Industrial and Corporate Change, Sep 1998 (7).
Gartner, William B. – Shane, Scott A. (1995), ”Measuring Entrepreneurship Over Time”, Journal of Business Venturing, Vol. 10(4).
Gertler, Mark – Gilchrist, Simon (1994), “Monetary Policy, Business Cycles, and the Behavior of Small Manufacturing Firms”, Quarterly journal of Economics, Vol. 109(2).
Gimeno, Javier – Folta, Timothy B. – Cooper, Arnold C. – Woo, Carolyn, Y. (1997), “Survival of the Fittest? Entrepreneurial Human Capital and the Persis-tence of Underperforming Firms”, Administrative Science Quarterly, Vol. 42(4).
Glenn, Norval D. (1977), Cohort Analysis. Beverly Hills: Sage. Glete, Jan (1987), Ägande och industriell omvandling: ägargrupper, skogsindustri,
verkstadsindustri 1850-1950. Stockholm: SNS _______ (1994), Nätverk i näringslivet. Ägande och industriell omvandling i det
mogna industrisamhället 1920-1990. Stockholm: SNS.

221
_______ (1995), “Regioner, nätverk, storföretag och grupper – något om mesonivån i finans- och företagshistorisk forskning”, in Sjögren, Hans (ed.), Aspekter på näringslivets historia. Forskningsrapport nr 5. Stockholm: EHF.
_______ (1999), “Direktörernas revolution och ägarnas kontrarevolution”, in Lind-gren, Håkan – Olsson, Ulf (eds.), Bevara och beforska. Festskrift till Gert Ny-lander. Stockholm: EHF.
Gnyawali Devi R – Fogel, Daniel S. (1994), ”Environments for Entrepreneurship Development: Key Dimensions and Research Implications”, Entrepreneurship Theory & Practice, Vol. 18(4).
Goudie, Andrew W. – Meeks, Geoff (1991), ”The Exchange Rate and Company Fai-lure in a Macro-micro Model of the UK Company Sector”, Economic Journal, 101(406).
Gratzer, Karl – Box, Marcus (2000), ”Lyckliga dilettanter eller kompetenta affärs-strateger? Metodologiska och empiriska aspekter av företagsnedläggningar med hänsyn till strukturella och externa betingelser”, WP 2000:1. Södertörn Univer-sity College: Centre for Banking and Finance.
Gratzer, Karl – Box, Marcus (2002), “Causes of Selection Amongst Swedish Firms. A Contribution to the Development of a Business Demography, Scandinavian Economic History Review, Vol. 50(1).
Gratzer, Karl – Box, Marcus (2004) “A Longitudinal Analysis of Selection and Failure in Sweden During the 20th Century”, Entrepreneurship, Employment and Beyond 2003: proceedings of the 3rd international conference. Cracow: University of Economics.
Gratzer, Karl (1988), “Mått på företagsstorlek”, occasional paper, Stockholm: De-partment of Economic History.
_______ (1995), ”Forskning om småföretag” in Sjögren, Hans (ed.), Aspekter på näringslivets historia, Forskningsrapport nr 5, Stockholm: EHF.
_______ (1996), Småföretagandets villkor. Automatrestauranger under 1900-talet. Stockholm: Ekonomisk-historiska institutionen.
_______ (1999), “Konkursens orsaker”, in Gratzer, Karl and Sjögren, Hans (eds.), Konkursinstitutets betydelse i svensk ekonomi. Hedemora: Gidlunds förlag.
_______ (2001a), “The Fear of Failure. Reflections on Business Failure and Entre-preneurial Activity”, in Henrekson, Magnus, Larsson, Mats and Sjögren Hans (eds.), Entrepreneurship in Business and Research. Essays in Honour of Håkan Lindgren. Stockholm: EHF.
_______ (2001b) ”Konkurs och kriminalitet i ett jämförande perspekt”, in Ap-pelgren, Leif and Sjögren, Hans (eds.), Ekonomisk brottslighet och nationalsta-tens kontrollmakt. Hedemora: Gidlunds förlag.
Greenwald, Bruce – Stiglitz, Joseph E. (1990), “Asymmetric Information and the New Theory of The Firm: Financial Constraints and Risk Behavior”, American Economic Review, 80(2).
Greiner, Larry E. – Bhambri, Arvind (1989), “New CEO Intervention and Dynamics of Deliberate Strategic Change”, Strategic Management Journal, Vol. 10 (Spe-cial Issue: Strategic Leaders and Leadership).
Greiner, Larry E. (1972), “Evolution and Revolution as Organizations Grow”, Har-vard Business Review (reprint), May-June 1998.
Grosskopf, Göran (1976), Beskattning av fåmansbolag. En inkomstskatterättslig studie av särbehandlingen av fåmansbolag. Stockholm: Norstedt.

222
Grusky, Oscar (1961 a), “Corporate Size, Bureaucratization, and Managerial Suc-cession”, The American Journal of Sociology, Vol. 67(3).
_______ (1961 b), “Managerial Succession and Organizational Effectiveness”, The American Journal of Sociology, Vol. 69(1).
Gårdlund, Torsten – Janelid, Ingvar – Ramström, Dick – Lindblad, Hans (1973), Atlas Copco 1877-1973: Historien om ett världsföretag i tryckluft. Nacka: Atlas Copco AB.
Hagenaars, Jaques A. (1990), Categorical Longitudinal Data: Log-linear Panel, Trend, and Cohort Analysis. Newbury Park: Sage.
Haleblian, Jerayr – Finkelstein, Sydney (1993), “Top Management Team Size, CEO Dominance, and Firm Performance: The Moderating Roles of Environmental Turbulence and Discretion”, Academy of Management Journal, Vol. 36(4).
Hall, Graham (1988), ”Lack of Finance as a Constraint on the Expansion of Innova-tory Small Firms”, in Barber, John – Metcalfe, Stanley – Porteous, Mike (eds), Barriers to Growth in Small Firms. London: Routledge.
_______ (1995), Surviving and Prospering in the Small Firm Sector. London: Routledge.
Hannan, Michael T – Freeman, John (1989), Organizational Ecology. Cambridge: Harvard Univ. Press.
Hannan, Michael T. – Carroll, Glenn R – Dobrev, Stanislav D. – Han, Joon (1998), “Organizational Mortality in European and American Automobile Industries. Part I: Revisiting the Effects of Age and Size,” European Sociological Review, Vol. 14(3).
Hart, P.E. (1962), “The Size and Growth of Firms”, Economica, Vol. 29(113). _______ (2000), “Theories of Firms’ Growth and the Generation of Jobs”, Review of
Industrial Organization, Vol. 17(3). Hassbring, Lars (1978), Svenska Tändsticksaktiebolagets internationella expansion
1917-1924. Uppsala: Ekonomisk-historiska institutionen. Haveman, Heather A. – Khaire, Mukti V. (2004), “Survival Beyond Succession?
The Contingent Impact of Founder Succession on Organizational Failure”, Journal of Business Venturing, Vol. 19(3).
Headd, Brian (2003), “Redefining Business Success: Distinguishing Between Clo-sure and Failure”, Small Business Economics, Vol. 21(1).
Helmich, Donald L. – Brown, Warren B. (1972), “Successor Type and Organizatio-nal Change in the Corporate Enterprise”, Administrative Science Quarterly, Vol. 17(3).
Helmich, Donald L. (1974), “Organizational Growth and Succession Patterns”, The Academy of Management Journal, Vol. 17(4).
Henrekson, Magnus – Johansson, Dan (1997), “På spaning efter de mellanstora fö-retagen”, Ekonomisk Debatt, 4.
Henrekson, Magnus – Johansson, Dan (1998), “Institutional Effects on the Evolu-tion of the Size Distribution of Firms”, Working Paper No. 497. Stockholm: IUI.
Henrekson, Magnus – Johansson, Dan (1999a), “Sysselsättnings- och företags-strukturen: Endast Sverige snapsglas har, eller?”, Ekonomisk Debatt, 3.
Henrekson, Magnus – Johansson, Dan (1999b), “Endast Sverige snapsglas har? Svar till Sven-Olof Lodin”, Ekonomisk Debatt, 6.
Henrekson, Magnus (1996), Företagandets villkor. Spelregler för sysselsättning och tillväxt. Stockholm: SNS.

223
_______ (2001), ”Institutionella förutsättningar för entreprenörskap och företagstillväxt”, in Davidsson, Per – Delmar, Frédéric – Wiklund, Johan (eds.), Tillväxtföretagen i Sverige. Stockholm: SNS.
Hermansson, Carl-Henrik (1959), Koncentration och storföretag. Stockholm: Arbe-tarkultur
Heshmati, Almas (2001), “On the Growth of Micro and Small Firms: Evidence from Sweden”, Small Business Economics, Vol. 17(3).
Highfield Richard – Smiley, Robert (1987), ”New Business Starts and Economic Activity”, International Journal of Industrial Organization, Vol. 5(1).
Higson, Chris – Holly, Sean – Kattuman, Paul – Platis, S. (2004), “The Business Cycle, Macroeconomic Shocks and the Cross-Section: The Growth of UK Qu-oted Companies”, Economica, Vol. 71(282).
Hildebrand, Karl-Gustaf (1989), “Om företagshistoria”, Uppsala Papers in Econo-mic History. Research Report No 23.
Hirschman, Albert O. (1972), Sorti eller protest. En fråga om lojaliteter. Stockholm: Rabén & Sjögren.
Holmes, Thomas J. – Schmitz, James A. (1995), “On the Turnover of Business Firms and Business Managers”, Journal of Political Economy, Vol. 103(5).
Hult, Eva-Britt – Liljeberg, Ulrika – Lundström, Anders – Ramström, Dick (2000), Soloföretag. Soloföretag i teori och praktik, statistik, regelverk och politik. So-loföretag i enkät och intervjuer. Soloföretag i framtidens arbetsliv och forsk-ning. Örebro: Forum för småföretagsforskning.
Huse, Morten (2000), “Boards of Directors in SMEs: A Review and Research Agenda”, Entrepreneurship & Regional Development, Vol. 12(4).
Ijiri, Yuji – Simon, Herbert A. (1964), ´”Business Firm Growth and Size”, The Ame-rican Economic Review, Vol. 54(2).
Ilmakunnas, Pekka – Jukka Topi, Jukka (2000), “Microeconomic and Macroecono-mic Influences on Entry and Exit of Firms”, Review of Industrial Organization, Vol. 15(3).
Iveroth, Axel (1943), Småindustri och hantverk i Sverige. Stockholm: Industriens utredningsinstitut.
Jaccard, James – Turrisi, Robert (2003), Interaction Effects in Multiple Regression. Thousand Oaks: Sage.
Jacobson, Tor – Lindé, Jesper (2000), “Kreditvärdering och konjunkturcykeln: kan konkurser prognosticeras?”, Penning- och valutapolitik. Tidskrift utgiven av Sveriges Riksbank, No. 4.
Jagrén, Lars (1988), ”Företagens tillväxt i ett historiskt perspektiv”, in Örtengren, Johan et.al, Expansion, avveckling och företagsvärdering i svensk industri. Stockholm: Ahlmqvist & Wiksell.
_______ (1992), “Det svenska storföretagsberoendet”, IUI Working papers, No. 360.
Janson, Carl-Gunnar (1978), The Longitudinal Approach: Problems and Possibili-ties in the Social Sciences. Stockholm: Department of Sociology.
_______ (2000), “The Longitudinal Dtudy”, in Janson, Carl-Gunnar (ed.), Seven Swedish Longitudinal Studies in Behavioral Sciences. Report 2000:8. Stock-holm: FRN.
Jayraman, Narayanan – Khorana, Ajay – Nelling, Edward – Covin, Jeffrey (2000), “CEO Founder Status and Firm Financial Performance” (in Research Notes and Commentaries), Strategic Management Journal, Vol. 21(12).
224
Johansson, Dan (1997), The Number and the Size Distribution of Firms in Sweden and Other European Countries. Stockholm: IUI.
_______ (2002), ”Tillväxt och nya och små företag”, Ratio Working Papers, 13. Jonung, Lars (2000), “Från guldmyntfot till inflationsmål – svensk stabiliseringspo-
litik under 20:e seklet”, Ekonomisk Debatt, 1. Jovanovic, Boyan (1982), “Selection and the Evolution of Industry”, Econometrica,
Vol. 50(3). Jörberg, Lennart (1961), Growth and Fluctuations of Swedish Industry 1869-1912:
Studies in the Process of Industrialisation. Lund: Institute of Economic History. Kangasharju, Aki (2000), ”Growth of the Smallest: Determinants of Small Firm
Growth During Strong Macroeconomic Fluctuations”, International Small Busi-ness Journal, Vol. 19(1).
Keats, Barbara W. – Hitt, Michael A. (1988), “A Causual Model of Linkages Among Environmental Dimension, Macro Organizational Characteristics, and Performance”, Academy of Management Journal, Vol. 31(3).
Key-Åberg, Karl, Svenska aktiebolag och enskilda banker: handbok för affärsvärl-den, årgångar, 1900-1933. Stockholm: Norstedt & Söner.
Kimberly, John R. (1976), “Organizational Size and the Structuralist Perspective: A Review, Critique, and Proposal”, Administrative Science Quarterly, 21(4).
Kirchhoff, Bruce A. (1994), Entrepreneurship and Dynamic Capitalism: The Eco-nomics of Business Firm Formation and Growth. Westport: Praeger.
Kommerskollegium (1911-1958), Industri. Stockholm: Statistiska Centralbyrån. _______ (1935), 1931 års företagsräkning. Stockholm: Kommerskollegium. _______ (1955), 1951 års företagsräkning. Stockholm: Kommerskollegium _______ Bidrag till Sveriges officiella statistik. D, Fabriker och handtverk. 1858-
1910. Stockholm: Kommerskollegium. Krantz, Olle (1997), Swedish Historical National Accounts 1800-1990 – Aggregated
Output Series. Mimeo. Umeå: Department of Economic History. Kungliga Biblioteket (KB), Okatalogiserade samlingen (OKAT), Styrelse- och
revisionsberättelser för aktiebolag. Körner, Svante – Ek, Lars – Berg, Sven (1984), Deskriptiv statistik. Lund: Student-
litteratur. Landström, Hans (1987), Utvecklingsförlopp och finansiellt handlande i unga inno-
vationsbaserade företag. Lund: Institutionen för industriell organisation. _______ (2005), Pioneers in Entrepreneurship and Small Business Research. New
York: Springer. Lieberson, Stanley – O’Connor, James F. (1972), “Leadership and Organizational
Performance: A Study of Large Corporations”, American Sociological Review, Vol. 37(2).
Lindgren, Håkan (1979), Corporate Growth: The Swedish Match Industry in its Glo-bal Setting. Stockholm: Liber.
_______ (1988), Bank, investmentbolag, bankirfirma: Stockholms enskilda bank 1924-1945. Stockholm: Almqvist & Wiksell International.
_______ (1998), “Scandinavian Business History at the end of the 1990s: its prior development, present situation and future”. Paper presented at the International Colloquium on Business History, organized by the ASSI Foundation and the In-stitute of Economic History, Bocconi University, Milan, October 15-17, 1998.

225
Lindh, Thomas – Ohlsson, Henry (1997), Egenföretagande och manna från himlen: rapport till Expertgruppen för studier i offentlig ekonomi - [ESO], Ds 1997:71. Stockholm: Fritzes offentliga publikationer
Lindh, Thomas – Ohlsson, Henry (1998), “Self-employment and Wealth Inequality”, Review of Income and Wealth, Series 44(1).
Lindhe, Lena (2000), “Makroindikatorer på kreditrisker vid företagsutlåning”, Pen-ning- och valutapolitik. Tidskrift utgiven av Sveriges Riksbank, No. 1.
Loasby, Brian (2002), “Explaining Firms”, in Foss, Nicolai and Klein, Peter G., Ent-repreneurship and the Firm: Austrian Perspectives on Economic Organization. Cheltenham: Edward Elgar.
Lodin, Sven-Olof (1999), “Bräckligt glas på fast vetenskaplig grund”, Ekonomisk Debatt, 6.
Lotti, Francesca – Santarelli, Enrico – Vivarelli, Marco (2001), “The Relationship Between Size and Growth: The Case of Italian Newborn Firms”, Applied Eco-nomic Letters, Vol. 8(7).
Lucas, Robert E. (1978), “On the Size Distribution of Business Firms”, The Bell Journal of Economics, Vol. 9(2).
Lundström, Anders – Boter, Håkan – Kjellberg, Annelie – Öhman, Christer (1998), Svensk småföretagspolitik: struktur, resultat och internationella jämförelser. Örebro: FSF.
Lundström, Anders (1990), “The Development of Small and Medium-sized Enter-prises – Some Empirical Findings (Sweden)”, Journal of Small Business Man-agement, Vol. 28(1).
Lundström, Ragnhild (1992), ”Banks and Early Swedish Multinationals”, in Lind-gren, Håkan (ed.), Teori, empiri och metod i ekonomisk-historisk analys. Upp-sala Papers in Economic History, Basic Reading No. 8, 1992.
_______ (2001), “Taxes and Corporate Structure in Sweden”, in Henrekson, Mag-nus, Larsson, Mats and Sjögren Hans (eds.), Entrepreneurship in Business and Research. Essays in Honour of Håkan Lindgren. Stockholm: EHF.
Lybeck, Johan A. (1992), Finansiella kriser förr och nu. Stockholm: SNS. Machin, Stephen – Van Reenen, John (1993), “Profit Margins and the Business
Cycle: Evidence from UK Manufacturing Firms”, Journal of Industrial Eco-nomics, Vol. 41(1).
Machlup, Fritz (1967), “Theories of the Firm: Marginalist, Behavioral, Managerial”, American Economic Review, Vol. 57(1).
Manning Hunter, Helen (1982), ”The Role of Business Liquidity During the Great Depression and Afterwards: Differences Between Large and Small Firms”, The Journal of Economic History, Vol. 24(4).
Marris, Robin (1971), “An Introduction to Theories of Corporate Growth”, in Mar-ris, Robin and Wood, Adrian (eds.) The Corporate Economy. Growth, Competi-tion, and Innovative Potential. London: Macmillan.
Matti, Tomas (2003), Industriförbundet och den demokratiska utmaningen. Före-tagsledarnas professionaliseringsprocess, 1900-1940. Uppsala: Ekonomisk-hi-storiska institutionen.
Menard, Scott (1991), Longitudinal Research. Newbury Park: Sage. Miller, Danny – Friesen, Peter H. (1983), ”Strategy-making and Environment: The
Third Link”, Strategic Management Journal, Vol. 4(3).

226
Miller, Danny – Steier, Lloyd – Le Breton-Miller, Isabelle (2003), “Lost in Time: Intergenerational Succession, Change, and Failure in Family Business”, Journal of Business Venturing, Vol. 18(4).
Miller, Danny (1993), “Some Organizational Consequences of CEO Succession”, Academy of Management Journal, Vol. 36(3).
Mutén, Leif (1968), Bolagsbeskattning och kapitalkostnader. Stockholm: Almqvist & Wiksell.
Mårtensson, Torbjörn (1994), Bantågens gång: Järnvägens godstrafik och dess an-passning till näringslivet rumslighet, branschstruktur och transportefterfrågan 1890-1985. Göteborg: Ekonomisk-historiska institutionen.
Nelson, Richard R. – Winter, Sidney G. (1982), An Evolutionary Theory of Econo-mic Change. Cambridge, Mass: Harvard University Press.
Nelson, Richard R. (1991), “Why Do Firms Differ, and how does it Matter?”, Stra-tegic Management Journal, Vol. 12 (Special Issue: Fundamental Research Is-sues in Strategy and Economics).
Newell, Colin (1988), Methods and Models in Demography. New York: Guilford Press.
North, Douglass C. (1990), Institutions, Institutional Change and Economic Perfor-mance. Cambridge: Cambridge University Press.
Norton, Seth W. (1988), “Franchising, Brand Name Capital, and the Entrepreneurial Capacity Problem”, Strategic Management Journal, Vol. 9 (Special Issue: Strat-egy Content Research).
NUTEK (2004), Generationsskiften i företag: problemanalys av vilka effekter som kan förväntas av kommande generationsskiften i företag. Stockholm: NUTEK.
Näslund, Bertil – Wadell, Birgitta (1971), Företagsteorier. Stockholm: Almqvist & Wiksell.
Oppenländer, Karl-Heinrich (1997), Business Cycle Indicators. Aldershot: Avebury. Otani, Kiyoshi (1996), “A Human Capital Approach to Entrepreneurial Capacity”,
Economica, Vol. 63(250). Palmer, Donald (1983), “Interpreting Corporate Interlocks from Broken Ties”, So-
cial Science History, Vol. 7(2). Palmer, Richard (2001), Historical Patterns of Globalization: The Growth of Out-
ward Linkages of Swedish Long-Standing Transnational Corporations, 1890s-1990s. Stockholm: Department of Economic History.
Penrose, Edith T. (1959/1995), The Theory of the Growth of the Firm. Oxford: Uni-versity Press.
Persson, Torsten, Swedish Macro Data from 1861-1988. Stockholm: Institute for International Economic Studies. [http://www.iies.su.se/ ~perssont/sweddat.htm, 2001]
Pettersson, Jan-Erik (1980), Kristidsekonomi och företagsutveckling: Industrin i Uppsala län 1939-49. Uppsala: Ekonomisk-historiska institutionen.
Pettersson, Karl-Henrik (2004), Det exploderande storföretaget: Om företag och politik i 2000-talets samhälle. Stockholm: SNS.
Phillis, Joseph D. (1979), “The Theory of Small Enterprise: Smith, Mill, Marshall and Marx”, Explorations in Economic History, Vol. 16(3).
Pitcher, Patricia – Chreim, Samia – Kisfalvi, Veronika (2000), “CEO Succession Research: Methodological Bridges over Troubled Waters”, Strategic Manage-ment Journal, Vol. 21(6).

227
Reid, Gavin C. (1996), ”Mature Micro-Firms and Their Experience of Funding Shortages”, Small Business Economics, Vol. 8(1).
Reynolds, Paul D. – Hay, Michael – Bygrave, William D. – Camp, S. Michael – Autio, Erkko (2000), Global Entrepreneurship Monitor. 2000 Executive Report. Kansas City: Kauffman Center for Entrepreneurial Leadership.
Reynolds, Paul D. (2005), ”Understanding Entrepreneurship: Achievements and Opportunities – A Personal Assessment”, The FSF-NUTEK Award – 10-Year Anniversary Series.
Rhenman, Eric (1969), Företaget och dess omvärld: organisationsteori för långtids-planering. Stockholm: Bonnier.
Romer, Paul M. (1994), “The Origins of Endogenous Growth”, Journal of Eco-nomic Perspectives, Vol. 8(1).
Rosa, Peter – Scott, Michael (1999), “The Prevalence of Multiple Owners and Di-rectors in the SME Sector: Implications for Our Understanding of Start-up and Growth”, Entrepreneurship and Regional Development, Vol. 11(1).
Rylander, Leif (1995), Tillväxtföretag i startfas: från dimma och mörker till rela-tionslyft. Stockholm: Företagsekonomiska institutionen.
Schreyer, Paul (2000), ”High-Growth Firms and Employment”, STI Working Papers 2000/3. Paris: OECD.
Schwalbach, Joachim (1994), “Small Business Dynamics in Europe”, Small Busi-ness Economics, Vol. 6(1).
Schön, Lennart (1988), Historiska nationalräkenskaper för Sverige: 2, Industri och hantverk 1800-1980. Lund: Ekonomisk-historiska institutionen.
_______ (1995), “Strukturella cykler och handlingsutrymme”, in Sjögren, Hans (ed), Aspekter på näringslivets historia, forskningsrapport nr 5. Stockholm: EHF.
_______ (2000a), En modern svensk ekonomisk historia: tillväxt och omvandling under två sekel. Stockholm: SNS.
_______ (2000b), “Electricity, Technological Change and Productivity in Swedish Industry 1890-1990”, European Review of Economic History, Vol. 4(2).
Shane, Scott – Kolvereid, Lars (1995), ”National Environment, Strategy and New Venture Performance: A Three Country Study”, Journal of Small Business Ma-nagement, Vol. 33(2).
Shane, Scott (2003), A General Theory of Entrepreneurship: The Individual-Op-portunity Nexus. Cheltenham: Edward Elgar.
Shleifer, Andrei – Vishny, Robert W. (1997), “A Survey of Corporate Governance”, The Journal of Finance, Vol. 52(2).
Simon, Herbert A. – Bonini, Charles P. (1958), “The Size Distribution of Business Firms”, The American Economic Review, 48(4).
Simon, Herbert A. (1964), “On the Concept of Organizational Goal”, Administrative Science Quarterly, Vol. 9(1).
_______ (1979), “Rational Decision Making in Business Organizations”, The American Economic Review, Vol. 69(4).
Sjögren, Hans (2003), “Den långsamma kapitalismen – Företagskontroll i teori och praktik”, Working Paper LIU/EKIWPS 0301. Linköping: Dept. of Management and Economics.
Socialiseringsnämnden (1929), Svenska aktiebolags balansräkningar åren 1911-1925. Stockholm: Bokförlagsaktiebolaget Tidens tryckeri.

228
Starbuck, William H. – Mezias, John M. (1996), “Opening Pandora’s Box: Studying the Accuracy of Managers’ Perceptions”, Journal of Organizational Behavior, Vol. 17(2).
Starbuck, William H. (1971), Organizational Growth and Development. Harmonds-worth: Penguin.
_______ (1983), ”Organizations as Action Generators”, American Sociological Review, Vol. 48(1).
Statens offentliga utredningar (SOU), Betänkande angående statligt kreditstöd till hantverk och småindustri m.m. SOU 1959:7.
Statistiska Centralbyrån (1914-), Statistisk årsbok för Sverige. Stockholm: Statis-tiska centralbyrån.
_______ (1951-1964), Företagens intäkter, kostnader och vinster. Stockholm: Statistiska centralbyrån.
_______ (1959-1970), Industri. Stockholm: Statistiska Centralbyrån. _______ (1968-), Företagen: ekonomisk redovisning. Örebro: SCB. _______ (1975/77), Företagsräkningen 1972. Stockholm: LiberFörlag. _______ Centrala företags- och arbetsställeregistret (CFAR)/Företagsdatabasen
(http://www.ssd.scb.se). _______ Levnadskostnadsindex, KPI. Historiska tal (http://www.ssd.scb.se). Stauss, James H. (1944), “The Entrepreneur: The Firm”, The Journal of Political
Economy, Vol. 52(2). Steindl, Joseph (1945), Small and Big Business: Economic Problems of the Size of
Firms. Oxford: Basil Blackwell. Steyaert, Chris – Hjorth, Daniel (2003), New Movements in Entrepreneurship.
Cheltenham: Edward Elgar. Storey, David J. – Keasey, K – Watson, R – Wynarczyk, P (1987), The Performance
of Small Firms: Profits, Jobs and Failures. London: Croom Helm. Storey, David, J. (1990), ”Firm Performance and Size”, i Acs, Zoltan J – Audretsch,
David B, The Economics of Small Firms: A European Challenge. Dordrecht: Kluwer.
_______ Understanding the Small Business Sector. London: International Thomson Business Press.
Strandberg, Christer – Westman, Tommy (1997), Företagsklimat, tillväxt och stra-tegier – en studie av småföretagarna i Sundsvall. Mitthögskolan. Rapport 1997:4..
Sutton, John (1997), “Gibrat’s Legacy”, Journal of Economic Literature, Vol. 35(1). Swaminathan, Anand (1996), "Environmental Conditions at Founding and Organi-
zational Mortality: A Trial-by-Fire Model”, Academy of Management Journal, Vol. 39(5).
Svenska aktiebolag och enskilda banker: aktieägarens uppslagsbok, volumes, 1934-1977. Stockholm: Norstedt.
Sveriges handelskalender, annual volumes. Sveriges industriförbund (1918-), Svensk industrikalender. Stockholm: Industrilitte-
ratur. _______ Sveriges industri: översikt. Stockholm: Esselte. Söderberg, Johan (1995), “Economic History in Sweden: Some Recent Research
Trends”. Nederlandsh Economisch-Historisch Archief-Bulletin, Vol. 9(1). Taris, Toon W. (2000), A Primer in Longitudinal Data Analysis. London: Sage.

229
Thurik, Roy – Wennekers, Sander (2004), ”Entrepreneurship, Small Business and Economic Growth”, Journal of Small Business and Enterprise Development, Vol. 11(1).
Traù, Fabrizio (2000), “The Rise and Fall of the Size of Firms”. WP 156. Camb-ridge: ESRC Centre for Business Research,
_______ (2003), Structural Macroeconomic Change and the Size Pattern of Manu-facturing Firms. Basingstoke: Palgrave Macmillan.
Trow, Donald B. (1961), “Executive Succession in Small Companies”, Administra-tive Science Quarterly, Vol. 6(2).
Ucbasaran, Deniz – Westhead, Paul – Wright, Mike (2001) ”The Focus of Entrepre-neurial Research: Contextual and Process Issues”, Entrepreneurship Theory & Practice, Vol. 25(4).
Ullenhag, Kersti (1970), AB Åtvidabergs förenade industrier med föregångare. Uppsala: Ekonomisk-historiska institutionen.
_______ (1992), “Företag i expansion: en teoretisk modell och dess tillämpning“, in Lindgren, H (ed.) Teori, empiri och metod i ekonomisk-historisk analys. Upp-sala Papers in Economic History, Basic Readings, 8. Uppsala: Department of Economic History.
_______ (1993), ”Introduction”, in Ullenhag, K (ed.), Nordic Business in the Long View: On Control and Strategy in Structural Change. Special Issue, Business History, Vol. 35(2).
UpplysningsCentralen (UC), Databas över aktiva aktiebolag. 2000-2001; 2003. Utterback, James M. – Reitberger, Göran (1982), Technology and Industrial Inno-
vation in Sweden. A Study of New Technology-based Firms. Cambridge, Mass: MIT.
Vaessen, Peter – Keeble David (1995), ”Growth-oriented SMEs in Unfavourable Regional Environments”, Regional Studies, Vol. 29(6).
Wagner, Joachim (1994) “The Post-entry Performance of New Small Firms in Ger-man Manufacturing Industries”, Journal of Industrial Economics, Vol. 42(2)
_______ (1999), “The Life History of Cohorts of Exits from German Ma-nufacturing”, Small Business Economics, Vol. 13(1).
Wagner, W. Gary – Pfeffer, Jeffrey – O’Reilly, III, Charles A., (1984), “Organiza-tional Demography and Turnover in Top-Management Groups”, Administrative Science Quarterly, Vol. 29(1).
Van Gelderen, Marco W – Frese, Michael – Thurik, Roy A. (2000), ”Strategies, Uncertainty and Performance of Small Business Startups”, Small Business Eco-nomics, Vol. 15(3).
Wedervang, Fröystein (1965), Development of a Population of Industrial Firms: The Structure of Manufacturing Industries in Norway 1930-1948. Oslo: Universi-tetsforlaget.
Weiner, Nan – Mahoney, Thomas A. (1981), “A Model of Corporate Performance as a Function of Environmental, Organizational, and Leadership Influences”, Academy of Management Journal, Vol. 24(3).
Weinzimmer, Laurence G. – Nystrom, Paul C. – Freeman, Sarah J. (1998), “Measu-ring Organizational Growth: Issues, Consequences and Guidelines”, Journal of Management, Vol. 24(2).
Venkatraman, N. & Prescott, John E. (1990), “Environment-strategy Coalignment: An Empirical Test of its Performance Implications”, Strategic Management Journal, Vol. 11(1).

230
Westberg, Kalle (2002), Var optimist! AGAs innovativa verksamhet 1904-1959. Stockholm: Ekonomisk-historiska institutionen.
Vesterlund, Caroline – Lundström, Anders – Gandemo, Bertil (1998), Vad har hänt med en grupp medelstora tillverkningsföretag: Tillväxt, stagnation eller död?, FSF 1998:5. Örebro: Forum för småföretagsforskning.
Vianen, Joop (1993), “Small business Developments in the Long Run and Through the Business Cycle: Lessons from the Past in the Netherlands”, in Karlsson, Charlie, Johannisson, Bengt, and Storey, David (eds.), Small Business Dynam-ics: International, National and Regional Perspectives. London: Routledge.
Wikander, Ulla (1977), Ivar Kreugers tändsticksmonopol, 1925-1930: Fem fallstu-dier av marknadskontroll genom statsmonopol. Uppsala: Ekonomisk-historiska institutionen.
Wiklund, Johan – Davidsson, Per – Delmar, Frédéric (2003), What do They Think and Feel About Growth? An Expectancy-Value Approach to Small Business Managers’ Attitudes Toward Growth”, Entrepreneurship Theory & Practice, Vol. 27(3).
Wiklund, Johan – Sheperd, Dean (2005), “Entrepreneurial Orientation and Small Business Performance: A Configurational Approach”, Journal of Business Ven-turing, Vol. 20(1).
Wiklund, Johan (1998), Small Firm Growth and Performance. Entrepreneurship and Beyond. Jönköping: JIBS.
Vikström, Peter (2004), Näringsklimatet i Sverige. Institutet för tillväxtpolitiska stu-dier. ITPS A2005:004.
Wikström, Solveig (1993), “Företagens förnyelse och tillväxt i Sverige – Finns det några snabba recept”, in Ekonomikommissionen, Nya villkor för ekonomi och politik, SOU 1993:16. Stockholm: Allmänna förlaget.
Willard, Gary E. – Kreuger, David A. – Feeser, Henry R. (1992), “In Order to Grow, Must the Founder Go: A Comparison of Performance Between Founder and Non-founder Managed High-growth Manufacturing Firms”, Journal of Business Venturing, Vol. 7(3).
Vinell, Reuben – Hamilton, R.T. (1999), “A Historical Perspective on Small Firm Development”, Entrepreneurship Theory & Practice, Vol. 23(4).
Winter, Sidney G. (1988), “On Coase, Competence, and the Corporation”, Journal of Law, Economics and Organization, Vol. 4(1).
Zahra, Shaker A. (1993) ”Environment, Corporate Entrepreneurship, and Financial Performance: A Taxonomic Approach”, Journal of Business Venturing, Vol. 8(4).
Zarnowitz, Victor (1985), “Recent Work on Business Cycles in Historical Perspec-tive: A Review of Theories and Evidence”, Journal of Economic Literature, Vol. 23(2).


Stockholm Studies in Economic History Published by Stockholm University Editors: Ulf Jonsson, Johan Söderberg & Ulla Wikander 1. Olle Lundsjö, Fattigdomen på den svenska landsbygden under 1800-talet.
(Rural Poverty in Sweden during the Nineteenth Century). 1975. 208 pp. Out of print.
2. Eva M. Hamberg, Studier i internationell migration. (Studies in In-ternational Migration). 1976. X + 119 pp.
3. Sture Martinius, Peasant Destinies. The History of 552 Swedes born 1810-12. 1977. 154 pp.
4. Johan Söderberg, Agrar fattigdom i Sydsverige under 1800-talet. (Agrarian Poverty in Southern Sweden during the Nineteenth Century). 1978. 217 pp.
5. Ulf Jonsson, Jordmagnater landbönder och torpare i sydöstra Södermanland 1800-1880. (Magnates Tenants and Crofters in Southeastern Söderman-land). 1980. 231 pp.
6. Ronny Pettersson, Laga skifte i Hallands län 1827-1876: Förändring mellan regeltvång och handlingsfrihet. (The Third Phase of Enclosure in the Prov-ince of Halland: Change between Coercive Measures and Freedom of Ac-tion). 1983. 386 pp.
7. Anu-Mai Köll, Tradition och reform i västra Södermanlands jordbruk 1810-1890. Agrar teknik i kapitalismens inledningsskede. (Agricultural Tradition and Reform in Western Södermanland 1810-1890). 1983. 252 pp.
8. Arne Jarrick, Psykologisk socialhistoria. (Psychological Social History). 1985. 256 pp.
9. Satya Brata Datta, Capital Accumulation and Workers’ Struggle in Indian Industrialisation: The Case of Tata Iron and Steel Company 1910-1970. 1986. 295 pp.
10. Lars-Erik Bjessmo, Industrin i Södertälje 1920-1970. En ekonomisk-historisk studie av industriell förändring. (Industrial Firms and Manufac-turing in Södertälje 1920-1970: A Study in the Economic History of Indus-trial Change). 1987. 236 pp.
11. Makonen Getu, Socialism, Participation, and Agricultural Development in Post-revolutionary Ethiopia: A Study of Constraints. 1987. 225 pp.
12. Gunilla Peterson, Jordbrukets omvandling i västra Östergötland 1810-1890. (Transformation of Agriculture in Western Östergötland 1810-1890). 1989. XV + 241 pp.
13. Jan-Olov Jansson, Arbetsorganisationen vid Motala verkstad 1822-1843: Den engelska tiden. (Work and Workers in the Early Swedish Mechanical Engineering Industry — the Case of Motala verkstad). 1990. 222 pp.
14. Sven Fritz, Affärsbankernas aktieförvärvsrätt under 1900-talets första de-cennier. 1990. 181 pp.
15. Janken Myrdal & Johan Söderberg, Kontinuitetens dynamik. Agrar eko-nomi i 1500-talets Sverige. (Dynamics of Continuity: the Agrarian Econ-omy of Sixteenth-Century Sweden). 1991. 578 pp.

Stockholm Studies in Economic History (contd.) 16. Eva Hesselgren, Vi äro tusenden. Arbets- och levnadsförhållanden inom
svensk textilindustri med särskilt avseende på Gamlestadens Fabrikers AB 1890-1935. (We in our Thousands... Working and Living Conditions in the Swedish Textile Industry, with Special Reference to Gamlestadens Fabrik-ers AB, 1890-1935). 1992. XII + 223 pp.
17. Christer Persson, Stockholms klädesmanufakturer 1816-1846. (The Cloth Manufacturing Industry in Stockholm 1816-1846). 1993. 186 pp.
18. Johan Söderberg, Civilisering, marknad och våld i Sverige 1750—1870. En regional analys. (The Civilizing Process, Markets, and Violence in Sweden 1750-1870. A Regional Analysis). 1993. 290 pp.
19. Rita Bredefeldt, Tidigmoderna företagarstrategier. Järnbrukens ägar- och finansieringsförhållanden under 1600-talet. (Early Modern Entrepreneurs. Ownership and Financing of Swedish Ironworks in the 17th Century). 1994. 218 pp.
20. Sven Fritz, Louis Fraenckel 1851-1911. Bankman och finansman. (Louis Fraenckel 1851-1911. Banker and financier). 1994. 349 pp.
21. Kirsti Niskanen, Godsägare, småbrukare och jordbrukets modernisering. Södermanlands län 1875-1935. (Large Farmers, Small Farmers and the Modernisation of Agriculture. Södermanland County, Sweden, 1875-1935). 1995. 275 pp.
22. Eva Eggeby, Vandringsman, här ser du en avmålning av världen. Vårdade, vård och ekonomi på Danvikens dårhus 1750-1861. (Wanderer, Here You See a Picture of the World. Institutional Care and Economy at Danviken Lunatic Asylum 1750-1861). 1996. 292 pp.
23. Karl Gratzer, Småföretagandets villkor. Automatrestauranger under 1900-talet. (Conditions for Small Firms. Automatic Restaurants during the Twen-tieth Century). 1996. 326 pp.
24. Stefan Carlén, Staten som marknadens salt. En studie i institutionsbildning, kollektivt handlande och tidig välfärdspolitik på en strategisk varumarknad i övergången från merkantilism till laissez-faire 1720-1862. (The State as the Salt of the Market. A Study of Institutional Formation, Collective Action and Pre-industrial Welfare Policy on a Strategic Commodity Market in the Transition from Mercantilism to Liberalism 1720-1862). 1997. 359 pp.
25. Börje Bergfeldt, Den teokratiska statens död. Sekularisering och civilisering i 1700-talets Stockholm. (The Death of the Theocratic State. Secularization and the Civilizing Process in Eighteenth-Century Stockholm.) 1997. 225 pp.
26. Susanna Hedenborg, Det gåtfulla folket. Barns villkor och uppfattningar av barnet i 1700-talets Stockholm. (The Enigmatic People. The Conditions and Conceptions of Children and Childhood in 18th Century Stockholm). 1997. 321 pp.
27. Christer Franzén, Skuld och tanke. Svensk statsskuldsproblematik i ett in-ternationellt perspektiv före 1930-talet. (Debts and Opinions. Swedish Debt Problems in an International Context prior to the 1930's). 1998. 340 pp.

Stockholm Studies in Economic History (contd.) 28. Hans Andersson, ”Androm till varnagel...”: Det tidigmoderna Stockholms
folkliga rättskultur i ett komparativt perspektiv. 1998. (As a Warning to Others. Popular Legal Culture in Early Modern Stockholm in a Compara-tive Perspective). 210 pp.
29. Bo Franzén, Sturetidens monetära system. Pant eller penningar som infor-mation i köpstaden Arboga. (The Swedish Monetary System in Late Me-dieval Times. Pawn or Money as Information in the Trading Town of Ar-boga 1450-1523). 1998. 309 pp.
30. Arne Jansson, From Swords to Sorrow. Homicide and Suicide in Early Modern Stockholm. 1998. 197 pp.
31. Kirsti Niskanen (red.), Föreställningar om kön. Ett genusperspektiv på jord-brukets modernisering. (Notions of Gender. Agricultural Modernisation in Gender Perspective.) 1998. 131 pp.
32. Camilla Elmhorn, Brussels – A Reflexive World City. 2001. 369 pp. 33. Richard Palmer, Historical Patterns of Globalization. The Growth of Out-
ward Linkages of Swedish Long-standing Transnational Corporations, 1890s-1990s. 2001. 235 pp.
34. Leif Runefelt, Hushållningens dygder. Affektlära, hushållningslära och ekonomiskt tänkande under svensk stormaktstid. (The Virtues of House-holding. Economic Thought and the Theories of Passions and of Household-ing in Seventeenth-Century Sweden.) 2001. 298 pp.
35. Johan Söderberg & Janken Myrdal, The Agrarian Economy of Sixteenth-Century Sweden. 2002. 253 pp.
36. Kenth Hermansson, I persuadörernas verkstad. Marknadsföring i Sverige 1920-1965 – en studie av ord och handling hos marknadens aktörer. (In the Workshop of the Persuaders. Marketing in Sweden 1920-1965. A Study of Word and Action of the Actors at the Market.) 2002. 357 pp.
37. Kalle Westberg, Var optimist! AGAs innovativa verksamhet 1904-1959. (Be An Optimist! Inventive Activity at AGA 1904-1959.) 2002. 163 pp.
38. Per Eriksson, Stadshypoteks plats och bana inom det svenska kredit-väsendet 1909-1970. (The Stadshypotek’s Role and Place in the Swedish Credit System 1909-1970: A Socio-historical Study.) 2004. 272 pp.
39. Karin Åmossa, Du är NK! Konstruktioner av yrkesidentiteter på varuhuset NK ur ett genus och klassperspektiv 1918-1975. (You are NK! Construc-tions of Work Identities at the Department Store NK from a Gender and Class Perspective 1918-1975.) 2004. 213 pp.
40. Per Borg, Systemskifte – en studie av tröghet vid fyra brytpunkter inom svensk välfärdspolitik. (Transformation of Welfare Systems. A Study of Slowness at Four Breaking Points in Swedish Welfare Policy.) 2004. 307 pp.
41. Rodney Edvinsson, Growth, Accumulation, Crisis – With New Macro-economic Data for Sweden 1800-2000. 2005. XX + 433 pp.

Stockholm Studies in Economic History (contd.) 42. Jonathan Metzger, I köttbullslandet. Konstruktionen av svenskt och ut-
ländskt på det kulinariska fältet. (In the Land of Meatballs: The Historical Construction of Swedishness and Foreignness in the Culinary Field.) 2005. 423 pp.
43. Leif Runefelt, Dygden som välståndets grund. Dygd, nytta och egennytta i frihetstidens ekonomiska tänkande. (Virtue as the Foundation of Wealth. Virtue, Utility, and Self-interest in the Economic Ideas of the Age of Lib-erty.) 2005. 216 pp.
44. Per Simonsson, Bidrag till familjens ekonomiska historia. Inflytande över konsumtionen inom svenska hushåll under 1900-talet. (Contributions to an Economic History of the Family. Influence on Consumption Decisions in Swedish Households during the 20th Century.) 2005. 209 pp.
45. Therese Nordlund, Att leda storföretag: en studie av social kompetens och entreprenörskap i näringslivet med fokus på Axel Ax:son Johnson och J. Sigfrid Edström, 1900-1950. (Big Business Leadership: A Study of Social Competence and Entrepreneurship in Swedish Industry with Focus on Axel Ax:son Johnson and J. Sigfrid Edström, 1900-1950) 2005. 420 pp.
46. Lena Molin, Nyttiga bakterier och sjuka djur. En technoscience-resa från nätverksbildning till riskkonstruktion. (Healthy Bacteria and Sick Animals. A Technoscience-journey from Network to Risk.) 2005. 344 pp.
47. Akhil Malaki, Informal Finance and Microfinance in Jamaica and Trinidad & Tobago: An Institutional Study. 2005. 171 pp.
48. Marcus Box, New Venture, Survival, Growth: Continuance, Termination and Growth of Swedish Business Firms and Business Populations During the 20th Century. 2005. XIV + 230 pp.
Subscriptions to the series and orders for single volumes should be addressed to any international bookseller or directly to the publishers: Almqvist & Wiksell International, P.O. Box 7634, S-103 94 Stockholm, Sweden Phone: +46 8 613 61 00 Fax: +46 8 24 25 43 E-mail: [email protected] ISBN 91-85445-20-7
ISSN 0346-8305
