new york city child fatality report - welcome to nyc.gov · pdf file4 | child fatality in new...
TRANSCRIPT
New York CityChild Fatality Report
2007 Report from the Child Fatality Review Team
nyc.gov/health

Annual Report 2007NEW YORK CITY CHILD FATALITY REVIEW TEAM
ChairLorna Thorpe, PhD, Deputy CommissionerNew York City Department of Health and Mental Hygiene
Agency RepresentativesAnn Marie Connell, Commanding Officer, Special Victims UnitOlga Mercado, Detective, Special Victims Unit (alternate)New York Police Department
Joshua Marquez, Citywide Coordinator, Child AbusePrevention ProgramNew York City Department of Education
Elizabeth Roberts, Deputy Commissioner for Family SupportAdministration for Children’s Services
Monica Smiddy, MD, Medical ExaminerOffice of Chief Medical Examiner
AppointeesGary Butts, MD, Associate Professor of Medical Education,Pediatrics and Community Preventive MedicineMount Sinai School of Medicine
Donna Lawrence, Executive DirectorChildren’s Defense Fund-New York
Mary Pulido, PhD, Executive DirectorThe New York Society for the Prevention of Cruelty to Children
CoordinatorPrincess Fortin, MPHNew York City Department of Health and Mental Hygiene
Report WritersPrincess Fortin, MPHNew York City Department of Health and Mental Hygiene
Jenna Mandel-Ricci, MPANew York City Department of Health and Mental Hygiene
AcknowledgmentsWe thank the following individuals at the Departments ofTransportation, Health and Mental Hygiene and NYPD whocontributed to this report:
Solomon AssefaLorraine BoydTsering ChodenAnn Marie DohertyZac FrankChris GoransonJoseph KennedyBeth Linas Cortnie LowePatrick McCarthyLeze NicajSusan ResnickLindsay SenterCatherine StaytonLise StevensDavid WolochRegina Zimmerman
Dear Fellow New Yorkers:
The following report presents major findings from year 1 of the New York City Child Fatality Review Team (CFRT), a multi-disciplinary committee formed in 2006 to review fatal injuries among NYC children aged 1-12.
Injury-related deaths are the leading cause of death in children. The report takes a five-year retrospective look at intentional and unintentional injury deaths among NYC children, with a particular focus on the single largest contributor: motor vehicle-related deaths.
Although child motor vehicle-related deaths in NYC are lower than the national average and have declined during the past decade, rates are still disconcertingly high and each death is preventable. Most motor vehicle-related deaths in NYC were among child pedestrians struck by moving vehicles; nearly 60 children were fatally struck on NYC streets in the past 5 years,many of whom were playing in or near streets, especially during warm weather evening hours.
Based on these findings, the report offers recommendations to reduce motor vehicle and other injury deaths among children. On behalf of the CFRT members, I hope this report helps make NYC a safer place for our children.
Lorna E. Thorpe, Ph.D.Chair, Child Fatality Review TeamDeputy Commissioner, NYC Department of Health and Mental Hygiene

Table of ContentsGlossary of Terms . . . . . . . . . . . . . . . . . . . . . . . . . . . . . . . . . . . . . . . . . . . . . . . . . . . . . . . . . . . . . . . . . . . . . . . . . . . . . . . . . . . . 2
Key Findings . . . . . . . . . . . . . . . . . . . . . . . . . . . . . . . . . . . . . . . . . . . . . . . . . . . . . . . . . . . . . . . . . . . . . . . . . . . . . . . . . . . . . . . . 3
Introduction . . . . . . . . . . . . . . . . . . . . . . . . . . . . . . . . . . . . . . . . . . . . . . . . . . . . . . . . . . . . . . . . . . . . . . . . . . . . . . . . . . . . . . . . 4
Background . . . . . . . . . . . . . . . . . . . . . . . . . . . . . . . . . . . . . . . . . . . . . . . . . . . . . . . . . . . . . . . . . . . . . . . . . . . . . . . . . . . . . . . . . 4History and Purpose of Child Fatality Review Teams . . . . . . . . . . . . . . . . . . . . . . . . . . . . . . . . . . . . . . . . . . . . . . . . . . . . . . . 4New York City’s Child Fatality Review Team . . . . . . . . . . . . . . . . . . . . . . . . . . . . . . . . . . . . . . . . . . . . . . . . . . . . . . . . . . . . . 4Other Fatality Review Groups in New York City . . . . . . . . . . . . . . . . . . . . . . . . . . . . . . . . . . . . . . . . . . . . . . . . . . . . . . . . . . 5
Methods. . . . . . . . . . . . . . . . . . . . . . . . . . . . . . . . . . . . . . . . . . . . . . . . . . . . . . . . . . . . . . . . . . . . . . . . . . . . . . . . . . . . . . . . . . . . 6Injury Deaths . . . . . . . . . . . . . . . . . . . . . . . . . . . . . . . . . . . . . . . . . . . . . . . . . . . . . . . . . . . . . . . . . . . . . . . . . . . . . . . . . . . . . 6In-Depth Case Review of Motor Vehicle-Related Deaths . . . . . . . . . . . . . . . . . . . . . . . . . . . . . . . . . . . . . . . . . . . . . . . . . . . . 6
Results . . . . . . . . . . . . . . . . . . . . . . . . . . . . . . . . . . . . . . . . . . . . . . . . . . . . . . . . . . . . . . . . . . . . . . . . . . . . . . . . . . . . . . . . . . . . 7What Do Children Die From? . . . . . . . . . . . . . . . . . . . . . . . . . . . . . . . . . . . . . . . . . . . . . . . . . . . . . . . . . . . . . . . . . . . . . . . 7Demographic Characteristics of Injury Deaths . . . . . . . . . . . . . . . . . . . . . . . . . . . . . . . . . . . . . . . . . . . . . . . . . . . . . . . . . 8
Age . . . . . . . . . . . . . . . . . . . . . . . . . . . . . . . . . . . . . . . . . . . . . . . . . . . . . . . . . . . . . . . . . . . . . . . . . . . . . . . . . . . . . . . . . 8Gender . . . . . . . . . . . . . . . . . . . . . . . . . . . . . . . . . . . . . . . . . . . . . . . . . . . . . . . . . . . . . . . . . . . . . . . . . . . . . . . . . . . . . . 9Race/Ethnicity . . . . . . . . . . . . . . . . . . . . . . . . . . . . . . . . . . . . . . . . . . . . . . . . . . . . . . . . . . . . . . . . . . . . . . . . . . . . . . . . 10Injury Deaths by Borough . . . . . . . . . . . . . . . . . . . . . . . . . . . . . . . . . . . . . . . . . . . . . . . . . . . . . . . . . . . . . . . . . . . . . . . 11Place of Fatal Injury. . . . . . . . . . . . . . . . . . . . . . . . . . . . . . . . . . . . . . . . . . . . . . . . . . . . . . . . . . . . . . . . . . . . . . . . . . . . 12
Motor Vehicle-Related Deaths . . . . . . . . . . . . . . . . . . . . . . . . . . . . . . . . . . . . . . . . . . . . . . . . . . . . . . . . . . . . . . . . . . . . . . 13Case Reviews . . . . . . . . . . . . . . . . . . . . . . . . . . . . . . . . . . . . . . . . . . . . . . . . . . . . . . . . . . . . . . . . . . . . . . . . . . . . . . . . . 14Age and Position of Child . . . . . . . . . . . . . . . . . . . . . . . . . . . . . . . . . . . . . . . . . . . . . . . . . . . . . . . . . . . . . . . . . . . . . . . 14Gender . . . . . . . . . . . . . . . . . . . . . . . . . . . . . . . . . . . . . . . . . . . . . . . . . . . . . . . . . . . . . . . . . . . . . . . . . . . . . . . . . . . . . 14Race/Ethnicity . . . . . . . . . . . . . . . . . . . . . . . . . . . . . . . . . . . . . . . . . . . . . . . . . . . . . . . . . . . . . . . . . . . . . . . . . . . . . . . . 15Borough of Accident . . . . . . . . . . . . . . . . . . . . . . . . . . . . . . . . . . . . . . . . . . . . . . . . . . . . . . . . . . . . . . . . . . . . . . . . . . . 16Vehicle Type. . . . . . . . . . . . . . . . . . . . . . . . . . . . . . . . . . . . . . . . . . . . . . . . . . . . . . . . . . . . . . . . . . . . . . . . . . . . . . . . . . 16Accident Location and Position of Child (map) . . . . . . . . . . . . . . . . . . . . . . . . . . . . . . . . . . . . . . . . . . . . . . . . . . . . . . . 17Contributing Factors . . . . . . . . . . . . . . . . . . . . . . . . . . . . . . . . . . . . . . . . . . . . . . . . . . . . . . . . . . . . . . . . . . . . . . . . . . . 18Location of Accident . . . . . . . . . . . . . . . . . . . . . . . . . . . . . . . . . . . . . . . . . . . . . . . . . . . . . . . . . . . . . . . . . . . . . . . . . . . 18Type of Road . . . . . . . . . . . . . . . . . . . . . . . . . . . . . . . . . . . . . . . . . . . . . . . . . . . . . . . . . . . . . . . . . . . . . . . . . . . . . . . . . 19Alcohol Involvement . . . . . . . . . . . . . . . . . . . . . . . . . . . . . . . . . . . . . . . . . . . . . . . . . . . . . . . . . . . . . . . . . . . . . . . . . . . 19Day of Week and Time of Day. . . . . . . . . . . . . . . . . . . . . . . . . . . . . . . . . . . . . . . . . . . . . . . . . . . . . . . . . . . . . . . . . . . . 20Location of Fatal Pedestrian Accidents (map) . . . . . . . . . . . . . . . . . . . . . . . . . . . . . . . . . . . . . . . . . . . . . . . . . . . . . . . . 21
Cause and Manner of All Injury Deaths Among NYC Children . . . . . . . . . . . . . . . . . . . . . . . . . . . . . . . . . . . . . . . . . . . 22Overview . . . . . . . . . . . . . . . . . . . . . . . . . . . . . . . . . . . . . . . . . . . . . . . . . . . . . . . . . . . . . . . . . . . . . . . . . . . . . . . . . . . . 22Accident Deaths. . . . . . . . . . . . . . . . . . . . . . . . . . . . . . . . . . . . . . . . . . . . . . . . . . . . . . . . . . . . . . . . . . . . . . . . . . . . . . . 22Homicides . . . . . . . . . . . . . . . . . . . . . . . . . . . . . . . . . . . . . . . . . . . . . . . . . . . . . . . . . . . . . . . . . . . . . . . . . . . . . . . . . . . 24Suicides . . . . . . . . . . . . . . . . . . . . . . . . . . . . . . . . . . . . . . . . . . . . . . . . . . . . . . . . . . . . . . . . . . . . . . . . . . . . . . . . . . . . . 24Undetermined Deaths . . . . . . . . . . . . . . . . . . . . . . . . . . . . . . . . . . . . . . . . . . . . . . . . . . . . . . . . . . . . . . . . . . . . . . . . . . 24
Summary . . . . . . . . . . . . . . . . . . . . . . . . . . . . . . . . . . . . . . . . . . . . . . . . . . . . . . . . . . . . . . . . . . . . . . . . . . . . . . . . . . . . . . . . . . 25
Limitations . . . . . . . . . . . . . . . . . . . . . . . . . . . . . . . . . . . . . . . . . . . . . . . . . . . . . . . . . . . . . . . . . . . . . . . . . . . . . . . . . . . . . . . . 26
Recommendations . . . . . . . . . . . . . . . . . . . . . . . . . . . . . . . . . . . . . . . . . . . . . . . . . . . . . . . . . . . . . . . . . . . . . . . . . . . . . . . . . . 27Key Safety Messages . . . . . . . . . . . . . . . . . . . . . . . . . . . . . . . . . . . . . . . . . . . . . . . . . . . . . . . . . . . . . . . . . . . . . . . . . . . . . . . 28
Ongoing City Initiatives to Improve Child Safety . . . . . . . . . . . . . . . . . . . . . . . . . . . . . . . . . . . . . . . . . . . . . . . . . . . . . . . . 29Technical Appendix . . . . . . . . . . . . . . . . . . . . . . . . . . . . . . . . . . . . . . . . . . . . . . . . . . . . . . . . . . . . . . . . . . . . . . . . . . . . . . . . . 30
Child Fatality in New York City | 1
Glossary of TermsAccident – Fatal injury or poisoning that occurred without intent to harm or cause death, also called unintentional injuries. In this report, accidents are further divided into transportation and non-transportation related.
Arterial road – A high volume main roadway or through corridor with multiple lanes of traffic. Examples of arterial roadwaysinclude Queens Boulevard in Queens, Grand Concourse in the Bronx, Ocean Parkway in Brooklyn, and Hylan Boulevard inStaten Island.
Cause of death – The illness, disease or injury responsible for the death. Examples of natural disease include: heart defects,asthma, and malignancy. Examples of injury include: blunt impact, burns and drowning.
Child Fatality Review Team – A group of individuals representing a variety of agencies, organizations and disciplinescharged with investigating preventable child deaths and making recommendations.
Death certificate – A legal document containing details of an individual’s death. Cause and manner of death are provided aswell as key demographic information.
Homicide – Death resulting from injuries sustained through an act of violence committed by another person aimed at causingfear, harm or death.
Limited access highway – Major, multi-lane roads with traffic moving at high speeds; this road type can only be accessedat limited locations such as entrance and exit ramps with no crossing intersections. Examples of limited access highways are theCross Bronx Expressway and the Long Island Expressway.
Local street – A low volume street which primarily provides access to residences or businesses. Trips are mainly of shortlength or a part of a longer trip where the local street connects with a major street or highway. Local streets comprise a majority of the streets in the city.
Manner of death – Describes the circumstances of the death determined by postmortem examination, death sceneinvestigation, police and fire marshal reports, medical records, or other reports. Manner of death categories include: natural,accident, homicide, suicide, therapeutic complication and undetermined.
Natural death – Death due solely to illness or disease.
New York Police Department Accident Investigation Squad (AIS) – The unit that investigates transportation-related accidents in which a person is killed or seriously injured and likely to die.
Non-transportation accident – A subcategory of accidents that encompasses a variety of injuries not associated with anymode of transportation, such as a fall, drowning and house fire.
Office of Chief Medical Examiner (OCME) – The office that investigates suspicious, violent, unexpected and selectnatural deaths that occur in NYC. OCME is responsible for postmortem examination, death scene investigation and finaldetermination of cause and manner of death.
Postmortem examination – An external examination or autopsy used with other evidence to determine cause and manner of death.
Severe Accident Forensic Evaluation Team (SAFETeam) – A group of investigators housed at the NYCDepartment of Transportation who are dispatched to fatal accident sites to expedite priority regulatory repairs and recommendother corrective measures that may prevent future incidents.
Suicide – Fatal injury or poisoning from an intentional, self-inflicted act committed to kill oneself.
Therapeutic complication – Death resulting from causes associated with a medical or surgical intervention used to treat anillness or disease.
Transportation accident – A subcategory of accidents in which the victim was a passenger in or injured by a transportationvehicle (car, plane, train).
Undetermined – Categorization of a death when all available information is insufficient to point to any one manner of death. In some cases, both cause and manner of death may remain undetermined.
| Child Fatality in New York City2
Key Findings1. In New York City (NYC), there are roughly 40% fewer deaths among children aged 1 to 12 compared to
the national average. Most of this difference is due to fewer motor vehicle-related deaths and homicides.• Between 2001 and 2004, the national death rate among children aged 1-12 years was 21 deaths
per 100,000 children, compared to 15 per 100,000 children in NYC from 2001 through 2005.
• Nationally, the motor vehicle-related death rate among children was more than twice that found in NYC (4.4 deaths per 100,000 compared to 1.8 deaths per 100,000 children).
• The homicide rate among NYC children was 40% lower than the national average (0.9 deaths per 100,000 vs. 1.3 deaths per 100,000 children).
2. Between 2001 and 2005, injury deaths accounted for 28% of all child deaths in New York City. Higher injury death rates were found among younger children, boys, black children and children living in Brooklyn.
• In general, younger children (aged 1-3 years) had higher injury death rates than older children.
• Boys had a higher injury death rate (4.8 deaths per 100,000 male children) than girls (3.8 deaths per 100,000 female children).
• Black children had an injury death rate 1.5 times higher than children of other racial/ethnic groups.
• Brooklyn had the highest rate of child injury deaths (5.7 deaths per 100,000 children) and Manhattan had the lowest rate (2.9 deaths per 100,000 children).
3. Similar to national trends, motor vehicle-related deaths represent the single largest contributor to injury deaths amongchildren aged 1-12. However, unlike national trends, most (84%) child motor vehicle-related deaths in NYC are among pedestrians.
• Child pedestrian death rates in NYC were comparable to national trends (approximately 0.8 deaths per 100,000 children), whereas child passenger death rates were 7 times higher nationally than in NYC.
• Black children had the highest rate of motor vehicle-related deaths among all racial/ethnic groups.
• Boys had a higher motor vehicle-related death rate (1.3 deaths per 100,000 male children) than girls(0.8 deaths per 100,000 female children).
• Unlike most other injuries, the age group with the highest risk for motor vehicle-related deaths in NYC waschildren aged 10-12 years.
• Emerging from between parked cars and entering the street mid-block were the largest contributing factors to child pedestrian deaths on the part of the pedestrian.
• Driver inattention, traveling at unsafe speed, failure to yield, and alcohol involvement were leading contributing factors to child motor vehicle-related death on the part of the driver.
• Light trucks including SUVs, vans, and trucks were disproportionately involved in fatal child motor vehicle accidents (37%); more than half (58%) of the light trucks were SUVs.
4. Nearly half (46%) of all fatal motor vehicle-related accidents involving children occur during spring and summerevenings between 5pm and 11pm.
5. Fatal motor vehicle accidents involving children occur most frequently outside of Manhattan.• The rate of motor vehicle accidents among children was highest in Brooklyn and Queens (1.3 deaths per
100,000 children, compared to less than 0.8 deaths in the Bronx and Staten Island and 0.2 deaths in Manhattan).
• Motor vehicle accidents involving the death of a child passenger occurred predominantly in Eastern Queens and South and Central Brooklyn.
6. Half (50%) of fatal child pedestrian accidents occur within 700 feet of a city elementary, middle or junior high school.
• Only one of these pedestrian accidents occurred during school hours. The majority (71%) occurred during evenings, weekends and during the summer.
• The high frequency of fatal accidents near schools reflects both the amount of time children spend near schools and the high density of schools across the city.
Child Fatality in New York City | 3

| Child Fatality in New York City4
IntroductionInjuries are the leading cause of death of children in the United States. With adequate attention and support, the occurrence ofthese deaths can be reduced. Raising awareness, educating parents and communities, and enacting policies and laws designed toprotect children can influence circumstances that lead to fatal injuries and prevent them from occurring.
Injury deaths are categorized as either 1) unintentional, such as a motor vehicle crash or fall from a building, or 2) intentional,such as inflicted injury from child abuse.
Across the country, state and local government agencies and child advocate experts have established multi-disciplinary coalitionsto investigate how preventable child deaths occur and identify how they might be avoided in the future. The New York CityChild Fatality Review Team (CFRT) was formed in early 2006, as mandated by Local Law 115, to review preventable causes of death among New York City children aged 1 to 12. The CFRT is a multi-disciplinary review committee made up ofrepresentatives from city agencies as well as child welfare and medical experts appointed by the Mayor, the City Council Speaker and the Public Advocate.
This first report produced by the CFRT takes a five-year retrospective look at unintentional and intentional injury deaths from2001 through 2005. Motor vehicle deaths (those in which children were pedestrians, bicyclists or motor vehicle passengers)were selected by committee members for a focused case review, as they are the single largest contributor to injury deaths amongNew York City children.
The report also examines aggregate patterns of all injury deaths among children 1-12 years of age based on cause and manner ofdeath to provide broader context. The goal of reviewing fatal injury deaths is to inform policies, laws, regulations, and preventionactivities that avert future deaths. Based on these findings, committee members present recommendations for health care andsocial service providers, city agencies, educators, drivers, and parents.
BackgroundHistory and Purpose of Child Fatality Review TeamsLocal and state CFRTs have been in operation in the United States for more than a quarter of a century; today there are teams in all 50 states. These teams are designed to identify the circumstances leading to a child’s death, and to provide suggestions for preventing future child deaths. Historically, child death review processes were intended to address suspected child abuse orneglect fatalities. Today, however, NYC and many other state and local teams work under expanded mandates, examining widerissues surrounding preventable child deaths.
The age range of children under review often varies across teams, and CFRTs are chaired by different institutions such as publichealth departments, child welfare agencies or district attorneys’ offices. In all cases, teams are multi-disciplinary in nature, oftenincluding representatives from law enforcement, criminal justice, the medical community, public health, fire department, andagencies that have direct contact with children and families such as local school boards and child protective services.Recommendations made by CFRTs may include addressing systems gaps and opportunities, supporting the development and passage of legislation, and creation of public awareness campaigns.
New York City’s Child Fatality Review TeamThe New York City Child Fatality Review Team is a multi-disciplinary committee with members from numerous city agencies including:
• Department of Health and Mental Hygiene • Administration for Children’s Services • Department of Education • New York Police Department • Office of Chief Medical Examiner• Experts in child advocate and pediatrics are appointed by the Mayor’s Office,
City Council Speaker’s Office and Public Advocate’s Office
The CFRT is chaired by the New York City Department of Health and Mental Hygiene (DOHMH). The goals of the Committee are to:• Examine the significant social, economic, cultural, safety and health systems factors that are associated with child fatality
in order to identify preventable risk factors for child deaths, and • Develop policy and program recommendations to address these associated risk factors.
These goals are accomplished through review of aggregate data and in-depth case reviews at quarterly meetings. Findings andrecommendations are shared through the publication of an annual report. This is the first annual report from this committee.
Other Fatality Review Groups in New York CityThere are several other fatality review teams that operate in New York City; all share the common goal of examining deaths toprevent future tragedies. Current teams include:
The Department of Health and Mental Hygiene Infant Mortality Review Committee (IMRC): Founded in 2002, the InfantMortality Review Committee is a multi-disciplinary team with representatives from city and state agencies, health care institutions andcommunity groups. The Committee reviews and summarizes NYC infant (birth to age 1 year) mortality trends based on detailedcase summaries examining the medical and social conditions surrounding deaths. There is no overlap between this committee and theCFRT due to the fact that the age group under review by CFRT is limited to 1-12 year olds.
The Department of Health and Mental Hygiene Maternal Mortality Review Committee (MMRC): Reactivated in 2004, the Maternal Mortality Review Committee is a multi-disciplinary team with representatives from city and state agencies, health careinstitutions and community groups. Each year, the Committee reviews data on NYC maternal deaths and provides recommendationsregarding surveillance, policies, and practices that may lead to reductions in maternal mortality. There is no overlap between thiscommittee and the CFRT unless a female child age 12 or younger dies as a result of delivering a baby.
The Administration for Children’s Services (ACS) Accountability Review Panel: First formed in 1985, the AccountabilityReview Panel is an independent advisory body that reviews fatalities of children (birth to age 17 years) reported to the State Central Registry of Child Abuse and Maltreatment whose family history was previously known to the child welfare system.The panel evaluates the quality of investigations, assessments, service planning and service delivery, identifies case-specific andsystemic issues, and recommends ways to improve interventions and overall functioning of the ACS and other service systems. For injury deaths that occurred during years 2001 through 2005, ACS reviewed 28 cases of child homicide for children age 1-12 whosefamily history was already known to ACS. Overall, ACS reviewed 47% of child homicides, 10% of child accident deaths, and 6% of childundetermined deaths during the time period examined by the CFRT.
The New York City Domestic Violence Fatality Review Committee (DVFRC): Established in 2005 as mandated by Local Law61, and under the direction of the Mayor’s Office to Combat Domestic Violence, the Domestic Violence Fatality Review Committeeexamines all domestic violence fatalities, defined as “the death of a family or household member resulting from an act or acts ofviolence committed by another family or household member that does not include self-defense.” The DVFRC reviewed 31 cases offamily-related homicides involving NYC children aged 1-12 for years 2002-2005. This represents 72% of child homicide cases during this period.
The majority of homicide cases of children aged 1-12 years in NYC are thus reviewed by either the ACS’s AccountabilityReview Panel or the Domestic Violence Fatality Review Committee. As a result, members of the CFRT chose not toconduct in-depth case reviews of child homicides so as to not duplicate efforts or further compromise any ongoingcriminal investigations.
Child Fatality in New York City | 5
MethodsInjury DeathsDeath certificates maintained by the NYC Office of Vital Statistics were the primary data source used to identify injury-relateddeaths among children 1-12 years of age in New York City for years 2001 through 2005 (World Trade Center deaths were notincluded in this report). Deaths were included if the cause of death listed an International Classification of Disease Code (ICD)consistent with an unintentional or intentional injury (for a listing of these codes, please see the Technical Appendix).
In addition to cause of death, deaths were classified by the manner, or circumstances under which they occurred. Manner of death(MOD) was determined by findings on postmortem examination by the Office of Chief Medical Examiner (OCME), death sceneinvestigation, police and fire marshal reports, medical records, and other reports. Manner of death was classified as follows:
• Accident – Fatal injury or poisoning that occurred without intent to harm or cause death, also called unintentional.• Homicide – Death resulting from injuries sustained through an act of violence committed by another person aimed
at causing fear, harm or death. • Suicide – Fatal injury or poisoning from an intentional, self-inflicted act committed to do self-harm or kill one’s self. • Undetermined – Deaths are identified as undetermined when all available information is insufficient to point to one
manner of death. In some cases, both cause and manner of death may remain undetermined.• Therapeutic complications – Death associated with a medical or surgical intervention to treat an illness or disease
(i.e., allergic reaction following antibiotic use for an infection, or wound infection after surgical repair of a heart defect).• Natural – Deaths due solely or nearly totally to disease and/or the aging process.
In-Depth Case Review of Motor Vehicle-Related DeathsBetween 2001 and 2005, all child transportation deaths in NYC were motor vehicle-related, except for 18 children who died inNovember 2001 as a result of a plane crash in Queens. The CFRT performed extensive case reviews of all motor vehicle-relateddeaths and abstracted data from a number of sources, including:
• OCME files containing autopsy or external examination reports, toxicology and other postmortem special studies, andpolice reports. Abstraction, using a form adapted from the National Center for Child Death Review Case Report, and dataanalysis was conducted by a dedicated CFRT staff person at the DOHMH.
• Severe Accident Forensic Evaluation Team (SAFETeam) reports maintained by the Department of Transportation (DOT). • New York Police Department (NYPD) preliminary Accident Investigation Squad (AIS) reports, and MV-104 police
reports that detail the incident surrounding motor vehicle accidents.
De-identified narrative information and aggregate analysis were shared and discussed with CFRT members at quarterly meetings.Based on suggestions by members, analyses were then refined.
| Child Fatality in New York City6
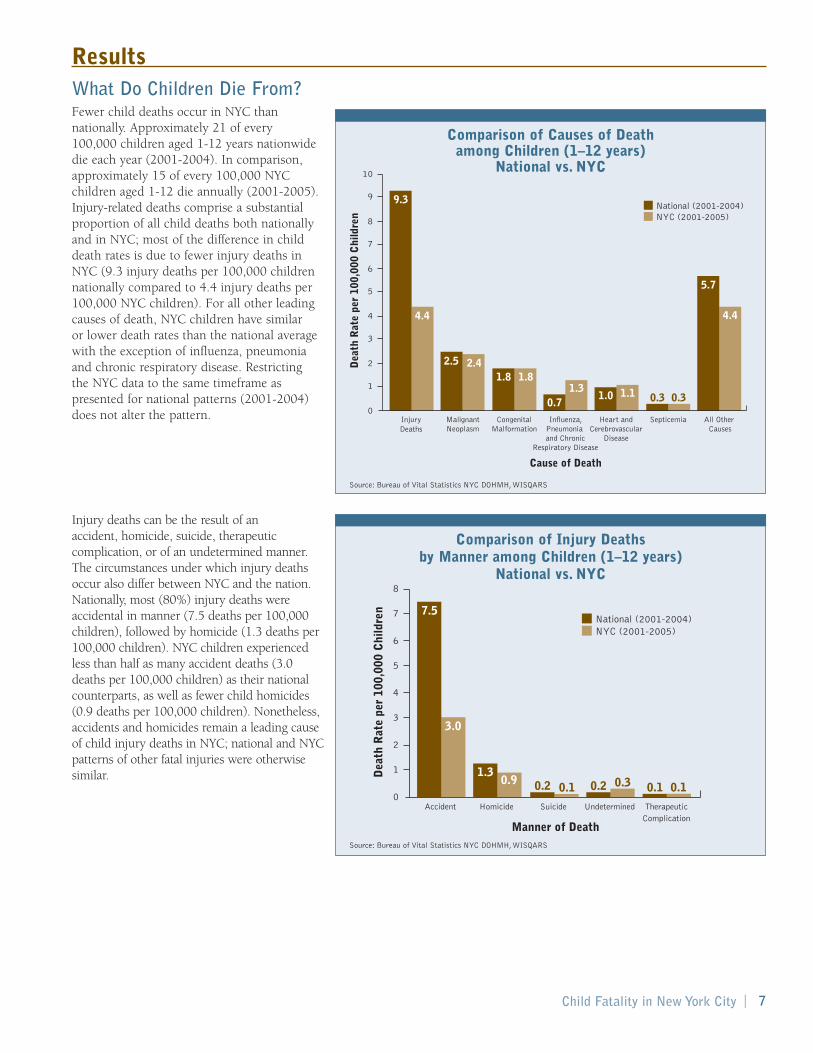
ResultsWhat Do Children Die From?Fewer child deaths occur in NYC thannationally. Approximately 21 of every 100,000 children aged 1-12 years nationwidedie each year (2001-2004). In comparison,approximately 15 of every 100,000 NYCchildren aged 1-12 die annually (2001-2005).Injury-related deaths comprise a substantialproportion of all child deaths both nationallyand in NYC; most of the difference in childdeath rates is due to fewer injury deaths inNYC (9.3 injury deaths per 100,000 childrennationally compared to 4.4 injury deaths per100,000 NYC children). For all other leadingcauses of death, NYC children have similar or lower death rates than the national averagewith the exception of influenza, pneumoniaand chronic respiratory disease. Restricting the NYC data to the same timeframe aspresented for national patterns (2001-2004)does not alter the pattern.
Injury deaths can be the result of an accident, homicide, suicide, therapeuticcomplication, or of an undetermined manner.The circumstances under which injury deathsoccur also differ between NYC and the nation.Nationally, most (80%) injury deaths wereaccidental in manner (7.5 deaths per 100,000children), followed by homicide (1.3 deaths per100,000 children). NYC children experiencedless than half as many accident deaths (3.0deaths per 100,000 children) as their nationalcounterparts, as well as fewer child homicides(0.9 deaths per 100,000 children). Nonetheless,accidents and homicides remain a leading causeof child injury deaths in NYC; national and NYCpatterns of other fatal injuries were otherwisesimilar.
Child Fatality in New York City | 7
National (2001-2004)
Dea
th R
ate
per
100,
000
Chi
ldre
n
4.4 4.4
1.11.01.3
0.7
2.5 2.41.8 1.8
0.3 0.3
NYC (2001-2005)
Cause of Death
InjuryDeaths
MalignantNeoplasm
CongenitalMalformation
Influenza,Pneumonia and Chronic
Respiratory Disease
Heart andCerebrovascular
Disease
Septicemia All Other Causes
0
2
4
6
8
10
1
3
5
7
9 9.3
5.7
National (2001-2004)
Dea
th R
ate
per
100,
000
Chi
ldre
n
3.0
0.1 0.10.30.21.3
0.9 0.2 0.1
NYC (2001-2005)
Manner of Death
Accident Homicide Suicide Undetermined TherapeuticComplication
0
2
4
6
8
1
3
5
7 7.5
Source: Bureau of Vital Statistics NYC DOHMH,WISQARS
Comparison of Causes of Death among Children (1–12 years)
National vs. NYC
National (2001-2004)
Dea
th R
ate
per
100,
000
Chi
ldre
n
4.4 4.4
1.11.01.3
0.7
2.5 2.41.8 1.8
0.3 0.3
NYC (2001-2005)
Cause of Death
InjuryDeaths
MalignantNeoplasm
CongenitalMalformation
Influenza,Pneumonia and Chronic
Respiratory Disease
Heart andCerebrovascular
Disease
Septicemia All Other Causes
0
2
4
6
8
10
1
3
5
7
9 9.3
5.7
National (2001-2004)
Dea
th R
ate
per
100,
000
Chi
ldre
n
3.0
0.1 0.10.30.21.3
0.9 0.2 0.1
NYC (2001-2005)
Manner of Death
Accident Homicide Suicide Undetermined TherapeuticComplication
0
2
4
6
8
1
3
5
7 7.5
Source: Bureau of Vital Statistics NYC DOHMH,WISQARS
Comparison of Injury Deaths by Manner among Children (1–12 years)
National vs. NYC

From 2001 to 2005, there were a total of 286 injury-related deaths among NYC children aged 1-12 years, with an average annual number of 57 (range 47 to 79 injury-related deaths). The number of injury deaths has remained relatively stableover time. Of the 286 child injury deaths in the 5 year time period, most (70%) were accidental in manner (n=200).
Table 1 lists the top five causes of accidental injury deaths nationally and for NYC. The table presents categories as reported by the National Center for Injury Prevention and Control (WISQARS) and the NYC Bureau of Vital Statistics, accounting for theslight differences in groupings. Both nationally and in NYC, motor vehicle and other transportation accidents represent theleading cause of accident deaths; however the national death rate among children was nearly three times higher than in NYC.
Demographic Characteristics of Injury DeathsThe following section presents demographic information on the 286 deaths due to injuries among NYC children during 2001-2005.
AgeAge is an important factor in determining a child’s degree of mobility, independence, andrisk-taking behavior. Fatal injuries vary acrossthe different stages of child development. Ingeneral, younger children had higher injurydeath rates than older ones. Children in the 1-3 age group had the highest fatality rate, with 6.9 deaths per 100,000 NYC children.Children ages 6-9 had the lowest injury deathrate, with 3.0 deaths per 100,000 children.
| Child Fatality in New York City8
Table 1. Leading Causes of Accident Injury Deaths, National vs. NYC Children (1-12 years)
National New York City2001-2004 2001-2005
Rank Rate Rate1 Motor vehicle and other transportation 3.8 Motor vehicle and other transportation 1.32 Drowning 1.4 Fire, burn or smoke inhalation 0.83 Fire or burn 0.9 Fall or crush 0.34 Suffocation 0.5 Suffocation or strangulation 0.35 Falls 0.2 Drowning 0.1
Death Rate per 100,000 NYC Children
Age
Gro
up
Age 1-3
Age 4-5
Age 6-9
Age 10-12
0 1 2 3 4 5 6 7
6.9
4.1
3.0
3.8
Death Rate per 100,000 NYC Children
Gen
der
Male
Female
0 1 2 3 4 5 6
4.8
3.8
Source: Bureau of Vital Statistics NYC DOHMH
Injury Death Rates of Children (1-12 years) by Age Group2001-2005
n=286
Source: WISQARS Injury Mortality Reports CDC, Bureau of Vital Statistics NYC DOHMH
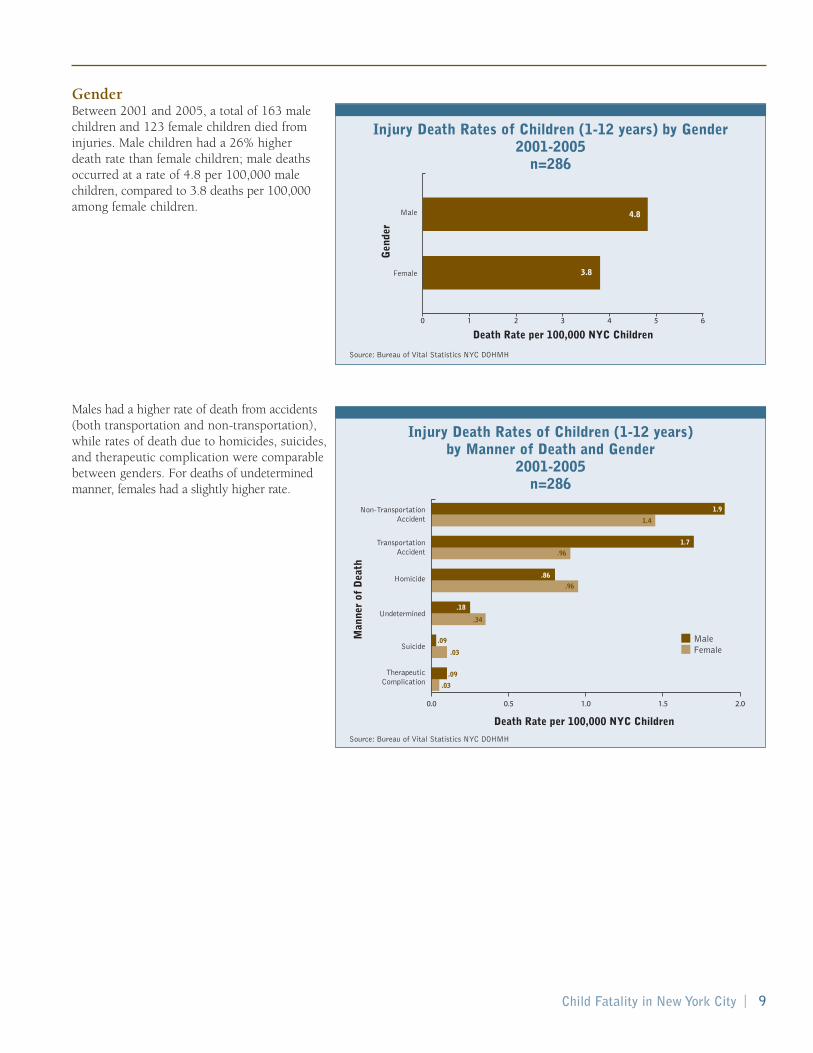
GenderBetween 2001 and 2005, a total of 163 malechildren and 123 female children died frominjuries. Male children had a 26% higher death rate than female children; male deathsoccurred at a rate of 4.8 per 100,000 malechildren, compared to 3.8 deaths per 100,000among female children.
Males had a higher rate of death from accidents(both transportation and non-transportation),while rates of death due to homicides, suicides,and therapeutic complication were comparablebetween genders. For deaths of undeterminedmanner, females had a slightly higher rate.
Child Fatality in New York City | 9
Death Rate per 100,000 NYC Children
Age
Gro
up
Age 1-3
Age 4-5
Age 6-9
Age 10-12
0 1 2 3 4 5 6 7
6.9
4.1
3.0
3.8
Death Rate per 100,000 NYC Children
Gen
der
Male
Female
0 1 2 3 4 5 6
4.8
3.8
Source: Bureau of Vital Statistics NYC DOHMH
Injury Death Rates of Children (1-12 years) by Gender2001-2005
n=286
0.0 0.5 1.0 1.5 2.0
MaleFemale
Death Rate per 100,000 NYC Children
Man
ner
of D
eath
Non-TransportationAccident
TransportationAccident
Suicide
Homicide
Undetermined
TherapeuticComplication
1.9
1.7
.86
.18
1.4
.96
.96
.03
.03
.09
.09
.34
Source: Bureau of Vital Statistics NYC DOHMH
Injury Death Rates of Children (1-12 years) by Manner of Death and Gender
2001-2005n=286

Race/EthnicityIn reporting on race and ethnicity, the CFRT used categories developed from deathcertificate information, including white (Non-Hispanic), black (Non-Hispanic),Hispanic, Asian/Pacific Islander, or other.During 2001-2005, almost half (46%) of theinjury deaths among 1-12 year-olds occurredamong black children, followed by Hispanics(25%), whites (21%), Asian/Pacific Islander(6%), and Other (2%) (not shown). Takingpopulation size into account, black childrenhad injury death rates that were 1.5 timeshigher than white children and more thantwice as high as Asian/Pacific Islander andHispanic children.
Black children had much higher rates of non-transportation accidents and homicidesthan other children. White and black childrenhad equal rates of transportation accidents, bothof which were higher than death rates forAsian/Pacific Islander and Hispanic children. If,however, the 18 deaths due to an airplane crashin 2001 are excluded, black children wouldhave a 50% higher rate of transportation deathsthan whites (as shown later on pg. 15). No starkvariability in death rates by race/ethnicity wasobserved for the less frequent manners of death.
| Child Fatality in New York City10
Death Rate per 100,000 NYC Children
Rac
e/E
thni
city
BlackNon-Hispanic
WhiteNon-Hispanic
Hispanic
Asian andPacific Islander
0 1 2 3 4 5 6 7
6.7
4.0
3.2
2.8
Source: Bureau of Vital Statistics NYC DOHMH
Injury Death Rates of Children (1-12 years) by Race/Ethnicity
2001-2005n=286
0.0 0.5 1.0 2.0 2.51.5
Black Non-HispanicWhite Non-HispanicAsian and Pacific IslanderHispanic
Death Rate per 100,000 NYC Children
Man
ner
of D
eath
Non-TransportationAccident
TransportationAccident
Suicide
Homicide
Undetermined
TherepeuticComplication
Source: Bureau of Vital Statistics NYC DOHMH
Injury Death Rates of Children (1-12 years) by Race/Ethnicity and Manner
2001-2005n=286
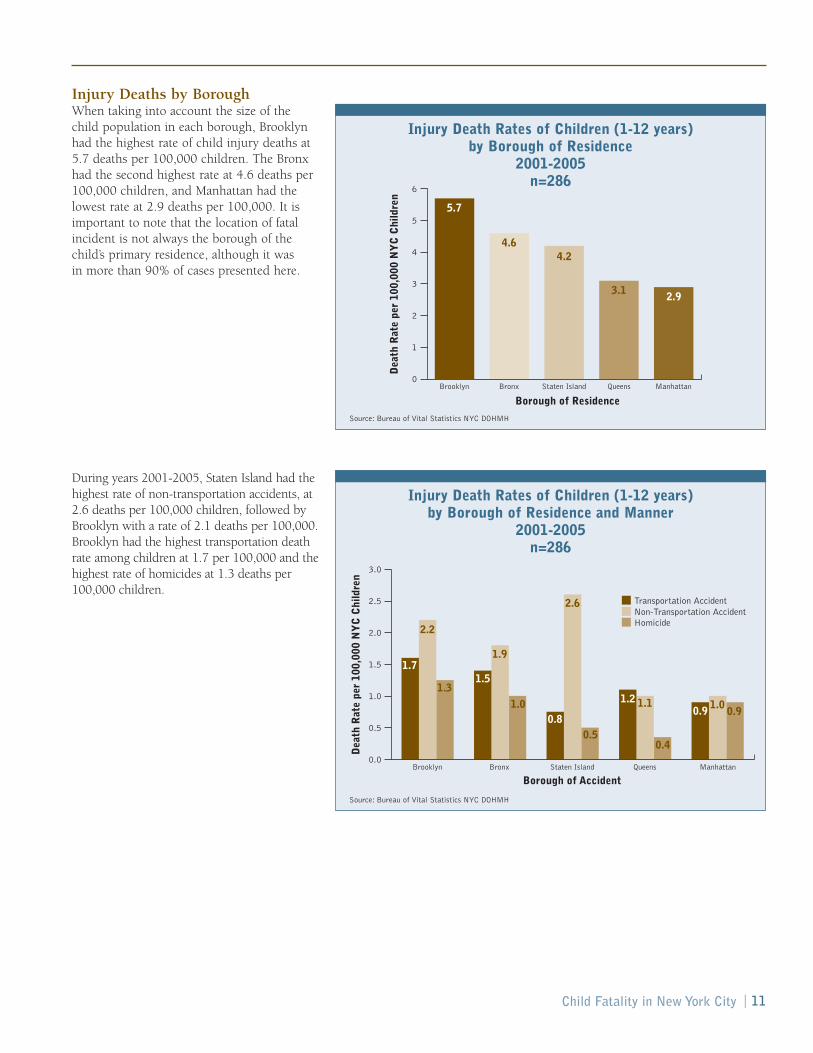
Injury Deaths by BoroughWhen taking into account the size of the child population in each borough, Brooklynhad the highest rate of child injury deaths at5.7 deaths per 100,000 children. The Bronxhad the second highest rate at 4.6 deaths per100,000 children, and Manhattan had thelowest rate at 2.9 deaths per 100,000. It isimportant to note that the location of fatalincident is not always the borough of thechild’s primary residence, although it was in more than 90% of cases presented here.
During years 2001-2005, Staten Island had thehighest rate of non-transportation accidents, at2.6 deaths per 100,000 children, followed byBrooklyn with a rate of 2.1 deaths per 100,000.Brooklyn had the highest transportation deathrate among children at 1.7 per 100,000 and thehighest rate of homicides at 1.3 deaths per100,000 children.
Child Fatality in New York City | 11
Dea
th R
ate
per
100,
000
NY
C C
hild
ren
Brooklyn Bronx Staten Island Queens Manhattan0
1
2
3
4
5
6
4.6
5.7
4.2
3.1 2.9
Transportation AccidentNon-Transportation AccidentHomicide
Borough of Accident
Borough of Residence
Brooklyn Bronx Staten Island Queens Manhattan
Dea
th R
ate
per
100,
000
NY
C C
hild
ren
0.0
0.5
1.0
1.5
2.0
2.5
3.0
2.2
1.3
1.9
1.0
2.6
0.5
1.1
0.4
1.00.9
1.71.5
0.8
1.20.9
Source: Bureau of Vital Statistics NYC DOHMH
Injury Death Rates of Children (1-12 years) by Borough of Residence
2001-2005n=286
Dea
th R
ate
per
100,
000
NY
C C
hild
ren
Brooklyn Bronx Staten Island Queens Manhattan0
1
2
3
4
5
6
4.6
5.7
4.2
3.1 2.9
Transportation AccidentNon-Transportation AccidentHomicide
Borough of Accident
Borough of Residence
Brooklyn Bronx Staten Island Queens Manhattan
Dea
th R
ate
per
100,
000
NY
C C
hild
ren
0.0
0.5
1.0
1.5
2.0
2.5
3.0
2.2
1.3
1.9
1.0
2.6
0.5
1.1
0.4
1.00.9
1.71.5
0.8
1.20.9
Source: Bureau of Vital Statistics NYC DOHMH
Injury Death Rates of Children (1-12 years) by Borough of Residence and Manner
2001-2005n=286
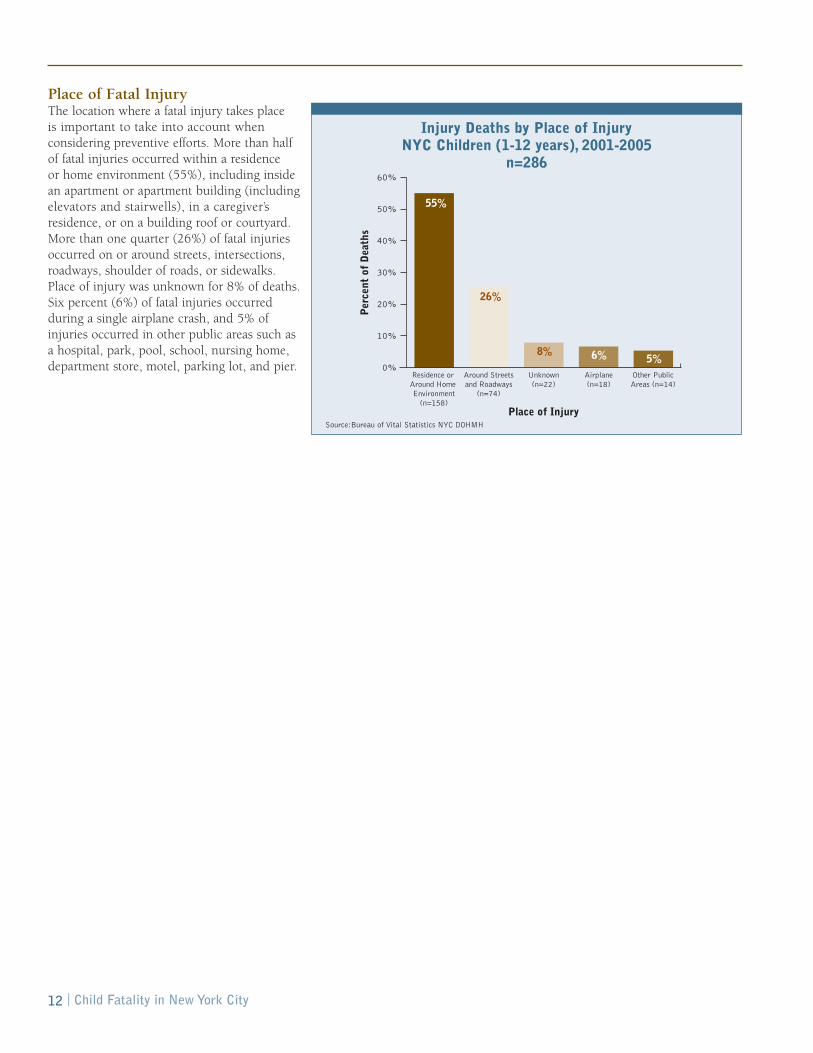
Place of Fatal InjuryThe location where a fatal injury takes place is important to take into account whenconsidering preventive efforts. More than halfof fatal injuries occurred within a residence or home environment (55%), including insidean apartment or apartment building (includingelevators and stairwells), in a caregiver’sresidence, or on a building roof or courtyard.More than one quarter (26%) of fatal injuriesoccurred on or around streets, intersections,roadways, shoulder of roads, or sidewalks.Place of injury was unknown for 8% of deaths.Six percent (6%) of fatal injuries occurredduring a single airplane crash, and 5% ofinjuries occurred in other public areas such asa hospital, park, pool, school, nursing home,department store, motel, parking lot, and pier.
| Child Fatality in New York City12
Per
cent
of
Dea
ths
Place of Injury
Residence or Around Home Environment
(n=158)
Around Streetsand Roadways
(n=74)
Unknown(n=22)
Airplane(n=18)
Other PublicAreas (n=14)
0%
10%
20%
30%
40%
50%
60%
26%
55%
8% 6% 5%
Injury Deaths by Place of Injury NYC Children (1-12 years), 2001-2005
n=286
Source:Bureau of Vital Statistics NYC DOHMH
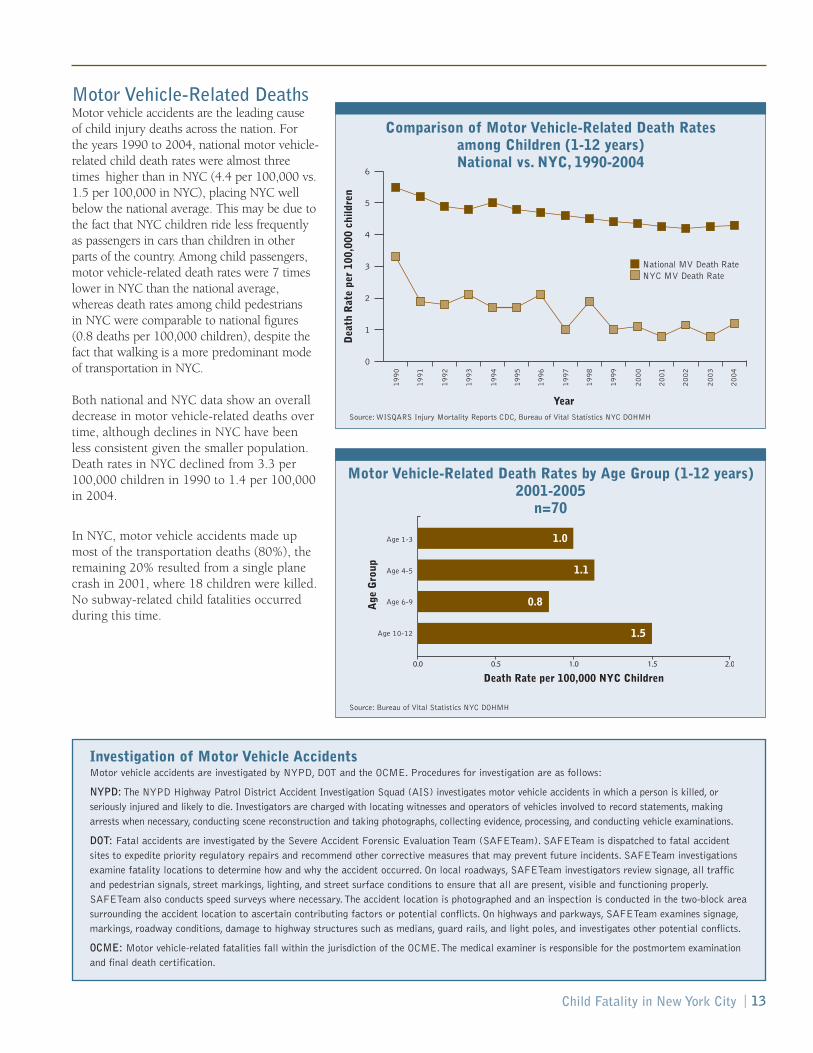
Motor Vehicle-Related DeathsMotor vehicle accidents are the leading cause of child injury deaths across the nation. For the years 1990 to 2004, national motor vehicle-related child death rates were almost threetimes higher than in NYC (4.4 per 100,000 vs.1.5 per 100,000 in NYC), placing NYC wellbelow the national average. This may be due tothe fact that NYC children ride less frequentlyas passengers in cars than children in otherparts of the country. Among child passengers,motor vehicle-related death rates were 7 timeslower in NYC than the national average,whereas death rates among child pedestrians in NYC were comparable to national figures(0.8 deaths per 100,000 children), despite thefact that walking is a more predominant modeof transportation in NYC.
Both national and NYC data show an overalldecrease in motor vehicle-related deaths overtime, although declines in NYC have beenless consistent given the smaller population.Death rates in NYC declined from 3.3 per100,000 children in 1990 to 1.4 per 100,000in 2004.
In NYC, motor vehicle accidents made upmost of the transportation deaths (80%), theremaining 20% resulted from a single planecrash in 2001, where 18 children were killed.No subway-related child fatalities occurredduring this time.
Child Fatality in New York City | 13
Investigation of Motor Vehicle AccidentsMotor vehicle accidents are investigated by NYPD, DOT and the OCME. Procedures for investigation are as follows:
NYPD: The NYPD Highway Patrol District Accident Investigation Squad (AIS) investigates motor vehicle accidents in which a person is killed, orseriously injured and likely to die. Investigators are charged with locating witnesses and operators of vehicles involved to record statements, makingarrests when necessary, conducting scene reconstruction and taking photographs, collecting evidence, processing, and conducting vehicle examinations.
DOT: Fatal accidents are investigated by the Severe Accident Forensic Evaluation Team (SAFETeam). SAFETeam is dispatched to fatal accidentsites to expedite priority regulatory repairs and recommend other corrective measures that may prevent future incidents. SAFETeam investigationsexamine fatality locations to determine how and why the accident occurred. On local roadways, SAFETeam investigators review signage, all trafficand pedestrian signals, street markings, lighting, and street surface conditions to ensure that all are present, visible and functioning properly.SAFETeam also conducts speed surveys where necessary.The accident location is photographed and an inspection is conducted in the two-block areasurrounding the accident location to ascertain contributing factors or potential conflicts. On highways and parkways, SAFETeam examines signage,markings, roadway conditions, damage to highway structures such as medians, guard rails, and light poles, and investigates other potential conflicts.
OCME: Motor vehicle-related fatalities fall within the jurisdiction of the OCME.The medical examiner is responsible for the postmortem examinationand final death certification.
National MV Death RateNYC MV Death Rate
Year
Dea
th R
ate
per
100,
000
child
ren
0
1
2
3
4
5
6
1990
1991
1992
1993
1994
1995
1996
1997
1998
1999
2000
2001
2002
2003
2004
Source: WISQARS Injury Mortality Reports CDC, Bureau of Vital Statistics NYC DOHMH
Comparison of Motor Vehicle-Related Death Ratesamong Children (1-12 years) National vs. NYC, 1990-2004
Death Rate per 100,000 NYC Children
Age
Gro
up
Age 1-3
Age 4-5
Age 6-9
Age 10-12
0.0 0.5 1.0 1.5 2.0
1.0
1.1
0.8
1.5
Source: Bureau of Vital Statistics NYC DOHMH
Motor Vehicle-Related Death Rates by Age Group (1-12 years)2001-2005
n=70

Case ReviewsThe CFRT conducted an in-depth case reviewof the 70 motor vehicle-related deaths thatoccurred in NYC during years 2001 through2005. All involved contact with a movingmotor vehicle, resulting in the death of childpassengers, child pedestrians, child bicyclists or children in strollers. In this next section,findings are presented from the case reviews.
Age and Position of ChildDistributed by age, the 10-12 age groupexperienced the highest motor vehicle-relateddeath rate, with 1.5 per 100,000 NYCchildren. Six to 9-year-olds had the lowestrate of motor vehicle-related death (0.8 per100,000 NYC children).
Of the 70 accidents, only 11 (16%) involved child passengers. Passenger deaths include instances where the child’sdriver either lost control of the vehicle,struck, or was struck by another vehicle.Most of the child motor vehicle deaths (84%) were of child pedestrians. Thispedestrian category includes the deaths of 3 children who were sitting in strollerssupervised by a parent or babysitter, another 3 fatalities among child bicyclists, and 1 fatal accident involving a child on a non-motorized scooter being struck by a motorvehicle. The remaining 52 deaths were childpedestrians on foot who were struck bymotor vehicles.
Pedestrian and passenger findings by age showthat almost all deaths among children 10-12years were of pedestrians. The 6-9 year-oldgroup experienced the largest number ofpassenger deaths.
GenderOf the 70 fatal motor vehicle-related deaths, 45 (64%) involved boys and 25 (36%) involvedgirls. The gender disparity was the least apparentin the 10-12 year-old age group.
| Child Fatality in New York City14
13
Num
ber
of D
eath
s
Age Group
Age 1-3 Age 4-5 Age 6-9 Age 10-12
Age Group
Age 1-3 Age 4-5 Age 6-9 Age 10-12
0
5
10
15
20
25
30
3
92
13
5
25
1PassengerPedestrian
Num
ber
of D
eath
s
MaleFemale
0
4
2
6
8
12
10
14
16
10
8
3
13
5
14
11
6
Source: Bureau of Vital Statistics NYC DOHMH, Office of Chief Medical Examiner
Motor Vehicle-Related Deaths by Age Group and Position of Child
NYC Children (1-12 years), 2001-2005n=70
13
Num
ber
of D
eath
s
Age Group
Age 1-3 Age 4-5 Age 6-9 Age 10-12
Age Group
Age 1-3 Age 4-5 Age 6-9 Age 10-12
0
5
10
15
20
25
30
3
92
13
5
25
1PassengerPedestrian
Num
ber
of D
eath
s
MaleFemale
0
4
2
6
8
12
10
14
16
10
8
3
13
5
14
11
6
Source: Bureau of Vital Statistics NYC DOHMH
Motor Vehicle-Related Deaths by Gender and Age GroupNYC Children (1-12 years), 2001-2005
n=70

Race/EthnicityBlack children experienced 34 (49%) of the fatal motor vehicle accidents; 18(26%) involved white children, 12 (21%)involved Hispanic children, and 2 (3%)involved Asian/Pacific Islander children.Comparing rates of fatal motor vehicleaccidents according to population size andrace/ethnicity, black children experiencedthe highest rate of death at 1.8 per 100,000children. The death rate among whitechildren was 1.2 per 100,000, followed by Hispanic children with 0.9 per 100,000,and Asian and Pacific Islander children with 0.4 deaths per 100,000 children.
The racial/ethnic disparity in motor vehicle deaths exists for both younger and older children. Black children in bothage groups had the highest overall rate ofmotor vehicle-related deaths at 1.8 per100,000 children each.
Child Fatality in New York City | 15
Death Rate per 100,000 NYC ChildrenR
ace/
Eth
nici
ty
BlackNon-Hispanic
WhiteNon-Hispanic
Hispanic
Asian andPacific Islander
0 1.2 1.6 1.8 21 1.40.2 0.6 0.80.4
1.8
1.2
0.7
0.4
Source: Bureau of Vital Statistics NYC DOHMH * 1 death of “other” race excluded from chart.
Motor Vehicle-Related Death Rates of Children (1-12 years) by Race/Ethnicity, 2001-2005
n=69*
Race/Ethnicity
Black Non-Hispanic
WhiteNon-Hispanic
Hispanic Asian and Pacific Islander
Dea
th R
ate
per
100,
000
Chi
ldre
n
Aged 1-6Aged 7-12
0
1
1.6
1.2
1.8
2
1.4
0.6
0.2
0.8
0.4
1.8 1.8
1.3
1.1
0.60.7 0.7
Source: Bureau of Vital Statistics NYC DOHMH * 1 death of “other” race excluded from chart.
Motor Vehicle-Related Death Rates of Children (1-12 years) by Race/Ethnicity and Age
2001-2005n=69*

Borough of AccidentFatal motor vehicle accidents were not evenly distributed throughout the city. The rate of motor vehicle accidents by location washighest in Brooklyn and Queens, with deathrates of 1.3 per 100,000 NYC children in each.The Bronx and Staten Island followed with thenext highest rates at 0.8 per 100,000 children.Manhattan had the lowest child motor vehicledeath rate (0.2 deaths per 100,000).
When examining the breakdown of fatalpedestrian and passenger motor vehicle accidents by borough of accident and positionof child, Brooklyn had the highest rate ofpedestrian deaths, at 1.2 fatal accidents per100,000 children. Queens followed with 0.9pedestrian accidents per 100,000 children, but also showed the highest rate of fatalaccidents among child passengers at 0.4deaths per 100,000 children. There were nofatal accidents among child passengers in the Bronx or Manhattan.
The map on the next page shows the accidentlocations for motor vehicle-related child deathsfor NYC children aged 1-12 during years 2001through 2005. Most of the fatal accidentsoccurred in Central and Southern Brooklyn,Eastern Queens and the South Bronx. One fatalaccident involving a NYC resident occurred justoutside NYC limits. Passenger vs. pedestrianchild deaths are also noted.
Vehicle Type The type of vehicle involved in each fatalaccident was also examined (see chart on page 18). Thirty-seven percent (n=26) ofvehicles were in the light truck category,including SUVs, vans, and trucks. Of the light truck vehicles, 15 were identified asSUVs, 5 as vans, and 6 as trucks.
Cars represented another third (36%, n=25)of the vehicles involved in fatal accidents.Buses were involved in 6% (n=4) of thefatalities (including one identified as a schoolbus) and tractor-trailers in 3%; vehicle typewas unknown in 10% (n=7) of fatalities. In 3cases (4%), no second vehicle was involved inthe fatality – drivers lost control and crashedinto an object. Vehicles in the ‘other’ category(4%) include a motorized scooter, amotorcycle, and an ambulance.
| Child Fatality in New York City16
Death Rate per 100,000 NYC Children
Bor
ough
of
Acc
iden
t
Brooklyn
Queens
Bronx
Manhattan
Staten island
0 0.2 0.4 0.6 0.8 1 1.2 1.4
1.3
1.3
0.8
0.8
0.2
Source: Office of Chief Medical Examiner * 1 death occurring outside of NYC excluded
Motor Vehicle Accidents among Children (1-12 years) by Location,2001-2005
n=69*
Dea
th R
ate
per
100,
000
NY
C C
hild
ren
Borough of AccidentBrooklyn Queens Bronx Staten Island Manhattan
0
0.4
0.6
0.8
1.2
1.6
0.2
1.4
1.01.2
0.1 0.4
0.30.9
0.8
0.5
0.2
PassengerPedestrian
Source: Office of Chief Medical Examiner
Motor Vehicle Accidents among Children (1-12 years)by Borough and Position of Child
NYC Children (1-12 years), 2001-2005n=69*
* 1 death occurring outside of NYC excluded

Child Fatality in New York City | 17
495
F D
R
87
Grand Central
Wes
t Sh
ore
Southern
Hen
ry H
ud
son
Northern
878
Cro
ss Island
95
67
8
295
Leif E r icson
Richmond
278
Inte
rborough
Har
lem
Riv
er
Wes
t
Bro
nx
Riv
er
Cross Bro nx
Will
ow
bro
ok
Laur
elto
n
Shore
Jackson
Sh
erid
an
150th
478
Throg
s Neck
Mo
sh
olu
Triboro
W hitestone
Dye
r
Sunrise
Riv
er
Hu
tch
inso
n R
iver
Outerbridge
Shore
29
5
Hu
tch
inso
n R
iver
Shore
278
Sh o re
495
295
87
R
ive
r
295
Riv
er
678
95
Le
if Er icso
n
95
95
Cro
ss Islan
d
278
Hen
ry H
uds on
678
Cro
ss
Is
lan
d
295
278
278
Sh
ore
678
295
295
Linden
Queens
No rthern
Ja maica
Hillside
Bro
ad
wa
y
Fordham
Rockaway
Beach Channel
We
st
Caton
Prospect
Flatbush
Web
ster
Seagirt
Braddock
Boston
Bro
adw
ay
Flatbush
Wes
t
Bro
adw
ay
Flatbush
Flatbush
Bro
adw
ay
Caton
Seagirt
Child Fatality - Position
Passenger
Pedestrian
Limited Access Highway
Arterial Road
Local Street
Source: NYPD Accident Reports
Fatal Motor Vehicle Accidents among NYC Children (1-12 years) by Accident Location and Position of Child
2001-2005n=70

Contributing FactorsMany of the 70 motor vehicle accidentsinvestigated were assigned multiplecontributing factors, meaning that actions by both the motor vehicle driver and childvictim or child supervisor may havecontributed to the accident. Tables 2 and 3 illustrate the distribution of maincontributing factors as recorded in the DOTfatality database.
Driver error alone was cited most frequently(39%) as the main contributing factor;pedestrian error alone was cited 29% of the time; and in 17% of cases both driver and pedestrian error contributed to theaccident (Table 2). DOT had no police reportinformation to determine contributing factor for 9% of cases and contributing factor wasunknown in 7% of cases. These findingsunderscore the need for greater driverprecautions and additional pedestrian safety education among NYC children.
Table 3 shows the top 5 factors thatcontributed to fatal child motor vehicleaccidents on the part of drivers and childpedestrians. Driver inattention, followed byunsafe speed, failure to yield, and alcoholinvolvement are the highest ranking contributing factors foraccidents involving driver error. Contributing factors on thepart of child pedestrians show accidents occurring mostfrequently as a result of children emerging from between parkedvehicles, crossing against a signal or crossing mid-block.
Location of AccidentOf the 59 fatal child pedestrian accidents that occurred during2001-2005, 37% occurred mid-block with more that half (59%)of fatal mid-block accidents occurring as a result of childrenemerging from between parked or stopped cars. Twenty-ninepercent (29%) occurred at intersections or within a 25 footradius from the center of an intersection, nearly half (41%) ofwhich resulted from driver inattention only. Twelve percent offatal pedestrian accidents occurred in non-traffic areas such as asidewalk, in a parking lot, gas station, or driveway. No policereport was reviewed for 17% of pedestrian fatalities and locationof accident was unspecified in 5% of cases.
| Child Fatality in New York City18
What are Contributing Factors?
In a fatal crash scene investigation, investigators determineapparent contributing factors for the crash. Contributing factorsdo not assign blame.The purpose of assigning contributing factorsto the motor vehicle driver, pedestrian, bicyclist or other involvedparty is to understand the actions that may have played a role inthe crash. Contributing factors are listed on the police accidentreport; crash investigators use their professional judgment toindicate the apparent reasons for the accident.There can bemultiple contributing factors for an accident. Examples ofcontributing factors include traveling at unsafe speed, crossing atmid-block, and disregard for traffic signals.
Table 2. Motor Vehicle-Related Deaths amongChildren (1-12 years) by Contributing Factor,NYC Children, 2001-2005
NumberContributing Factors of Deaths PercentDriver error only 27 39%
Pedestrian error only 20 29%
Pedestrian and Driver error 12 17%
No report 6 9%
Unknown 5 7%
Source: DOT Fatality Database
Pedestrian
Per
cent
of
Dea
ths
1%
1%
1%
3%
3%
30%
6%
6%9%
4%
Passenger
Other Vehicle Type
Light Truck Car Unknown Bus Tractor-trailer No Other Vehicle Involved
Other0
10%
20%
30%
40%
50%
5%
15%
25%
35%
45%
36%
Source: Office of Chief Medical Examiner
Motor Vehicle Accidents by Vehicle Type*NYC Children (1-12 years), 2001-2005
n=70
*Vehicle type refers to motor vehicles involved in fatally injuring a child pedestrian or passenger.Vehicle type presented in the graph does not include the vehicle a child was riding in as apassenger at the time of incident.

Child Fatality in New York City | 19
Case examples of child emerging from between parked vehiclesA driver of a car was looking for a parking spot in Brooklyn on a clear weekend evening in the summer. While playing tag with somefriends, a 12-year-old child emerged from the front of a legally parked car, and ran into the street.The 24-year-old driver of thevehicle struck the child, causing her to suffer head trauma.The child was taken to a nearby hospital where she later died due to her injuries.
On a clear weekday afternoon in the spring, a 3-year-old boy was standing with his mother near their home in Brooklyn. Seeminglyto greet a nearby relative, the child suddenly ran from his mother’s side between two parked cars into the street and into the path of an oncoming car.
Case example of driver inattentionThe driver of a tractor-trailer was traveling in a north-bound direction when he stopped for a traffic signal at an intersection.Three pedestrians were midway across the intersection when the traffic signal changed from red to green.The driver proceededforward not realizing the pedestrians were very close to the vehicle. One of the pedestrians, a 4-year-old boy, was struck by thevehicle’s passenger side, causing him to be run over with the rear wheels of the passenger side of the tractor-trailer. The otherpedestrians were able to make it to the other side of the intersection without being struck.The driver stated that he never realized that he struck someone with his vehicle until he was stopped.
Table 3. Motor Vehicle-Related Deaths among Children (1-12 years), Ranking of Top 5 ContributingFactors, NYC Residents, 2001-2005
RankFrequency Driver Frequency Pedestrian
1 Inattention 14 Emerging from between parked or 11stopped vehicles (intersection or mid-block)
2 Unsafe speed 8 Crossing against signal 6(intersection)
3 Failure to yield 6 Crossing mid-block 5
4 Alcohol involvement 5 Other action in roadway 3
5 Traffic control disregard 3 Playing on roadway 2and unsafe lane change
Source: DOT Fatality Database
Per
cent
by
Roa
d Ty
pe
Road Type
Local Streets Arterial Roads Limited AccessHighways
0
20%
40%
60%
80%
100%
Proportion of road type in NYC
Road type where accident occurred
80%
54%
10% 10% 9%
37%
Source: DOT Fatality Database
Motor Vehicle Accidents by Road TypeNYC Children (1-12 Years), 2001-2005
n=70
Type of RoadLocal streets comprise 80% of New York Cityroadways, with arterial roads and limitedaccess highways each accounting for 10% of roadways. More than half (54%) of fatalmotor vehicle accidents took place on localstreets. Thirty-seven percent (37%) occurredon arterial roads and 9% on limited accesshighways. These results point to adisproportionate percentage of deathsoccurring on arterial roads.
Alcohol InvolvementBased on case reviews, 5 fatal motor vehicleaccidents involved alcohol on the part of thedriver. Collectively, these 5 accidents caused 5child deaths, 2 adult deaths (including that of a pregnant woman), death of one teenager,as well as 2 severe and 4 minor injuries inadults. Two of the alcohol-related accidentsoccurred in Brooklyn, 2 in the Bronx, andone in Queens.
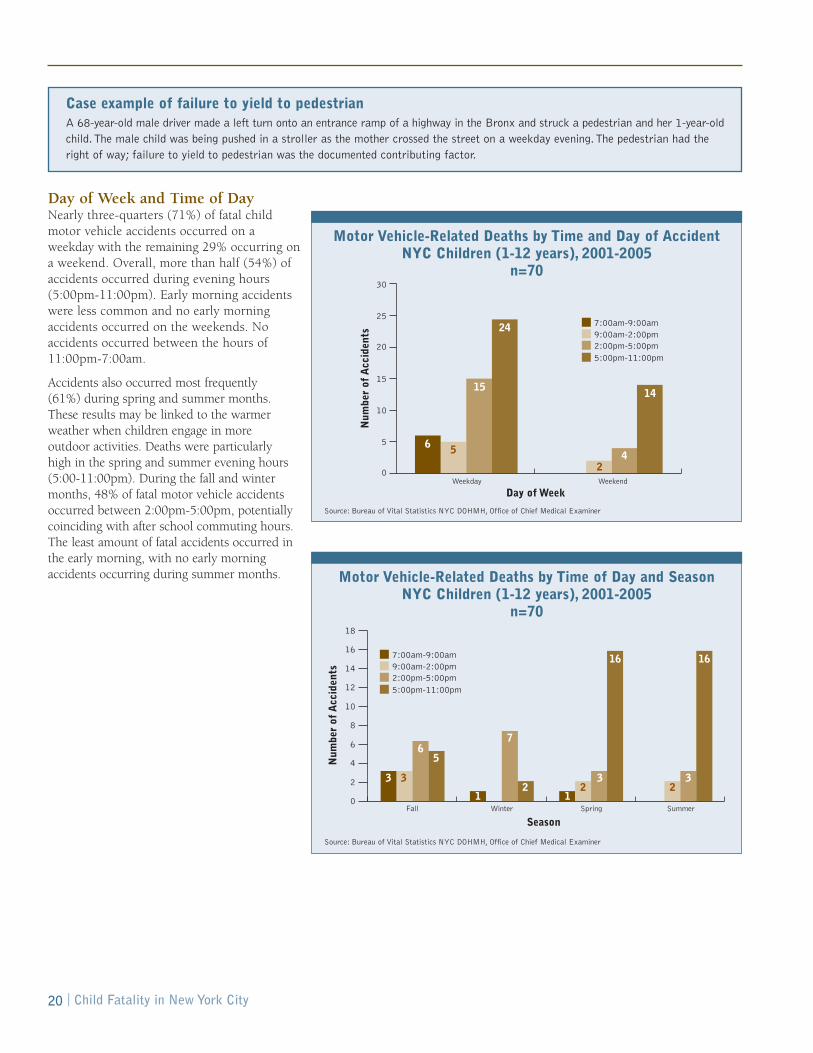
Day of Week and Time of DayNearly three-quarters (71%) of fatal child motor vehicle accidents occurred on aweekday with the remaining 29% occurring ona weekend. Overall, more than half (54%) ofaccidents occurred during evening hours(5:00pm-11:00pm). Early morning accidentswere less common and no early morningaccidents occurred on the weekends. Noaccidents occurred between the hours of11:00pm-7:00am.
Accidents also occurred most frequently (61%) during spring and summer months.These results may be linked to the warmerweather when children engage in more outdoor activities. Deaths were particularly high in the spring and summer evening hours(5:00-11:00pm). During the fall and wintermonths, 48% of fatal motor vehicle accidentsoccurred between 2:00pm-5:00pm, potentiallycoinciding with after school commuting hours.The least amount of fatal accidents occurred inthe early morning, with no early morningaccidents occurring during summer months.
| Child Fatality in New York City20
Case example of failure to yield to pedestrianA 68-year-old male driver made a left turn onto an entrance ramp of a highway in the Bronx and struck a pedestrian and her 1-year-oldchild.The male child was being pushed in a stroller as the mother crossed the street on a weekday evening.The pedestrian had theright of way; failure to yield to pedestrian was the documented contributing factor.
Num
ber
of A
ccid
ents
Day of WeekWeekday Weekend
6 5
3 3
16 16
3
65
1
7
2 23
21
42
1514
24 7:00am-9:00am9:00am-2:00pm2:00pm-5:00pm5:00pm-11:00pm
7:00am-9:00am9:00am-2:00pm2:00pm-5:00pm5:00pm-11:00pm
SeasonFall Winter Spring Summer
Num
ber
of A
ccid
ents
0
5
10
15
20
25
30
0
4
8
12
16
2
6
10
14
18
Source: Bureau of Vital Statistics NYC DOHMH, Office of Chief Medical Examiner
Motor Vehicle-Related Deaths by Time and Day of AccidentNYC Children (1-12 years), 2001-2005
n=70
Num
ber
of A
ccid
ents
Day of WeekWeekday Weekend
6 5
3 3
16 16
3
65
1
7
2 23
21
42
1514
24 7:00am-9:00am9:00am-2:00pm2:00pm-5:00pm5:00pm-11:00pm
7:00am-9:00am9:00am-2:00pm2:00pm-5:00pm5:00pm-11:00pm
SeasonFall Winter Spring Summer
Num
ber
of A
ccid
ents
0
5
10
15
20
25
30
0
4
8
12
16
2
6
10
14
18
Source: Bureau of Vital Statistics NYC DOHMH, Office of Chief Medical Examiner
Motor Vehicle-Related Deaths by Time of Day and SeasonNYC Children (1-12 years), 2001-2005
n=70

Child Fatality in New York City | 21
Location of Fatal Pedestrian Accidents The map below shows the location of the 59 fatal pedestrian accidents that were motor vehicle-related. The colored circlesrepresent fatal accidents that occurred within 700 feet of a school, showing that half (50%, or n=35) of pedestrian fatalitiesoccurred within 700 feet of a NYC elementary, middle or junior/senior high school; black dots represent pedestrian accidents not in close proximity to a school. Each of the 49 small white flags shown on the map represents a school near the fatal accident.Accidents are differentiated by time of occurrence. Of pedestrian accidents occurring near schools, over half (71%) took placeduring the evening, the summer or over the weekend, 25% occurred during morning or afternoon commuting hours, and only 3%(1 accident) occurred during school hours. The high frequency of fatal accidents near schools relates to the amount of timechildren spend near schools and the high density of schools across the city. This points to the importance of prioritizing safetymessages and engineering improvements at and around school locations.
Schools within 700 ft of a fatal accident (49 Total)
Commuting Hours, 7 AM - 9 AM and 2 PM - 5 PM (9)
School Hours, 9 AM - 2 PM (1)
Evening*, Weekend**, Summer*** (25)
Other Pedestrian Fatalities (24)
Limited Access Highway
Arterial Road
Local Street
Borough Boundaries
* 5 PM - 11 PM** Saturday and Sunday*** July and August
Fatal Motor Vehicle-Related Accidents among Child Pedestrians (1-12 years) within 700 feet of NYC Schools
2001-2005n=59
Source: NYPD Accident Reports, Division of Epidemiology NYCDOHMH
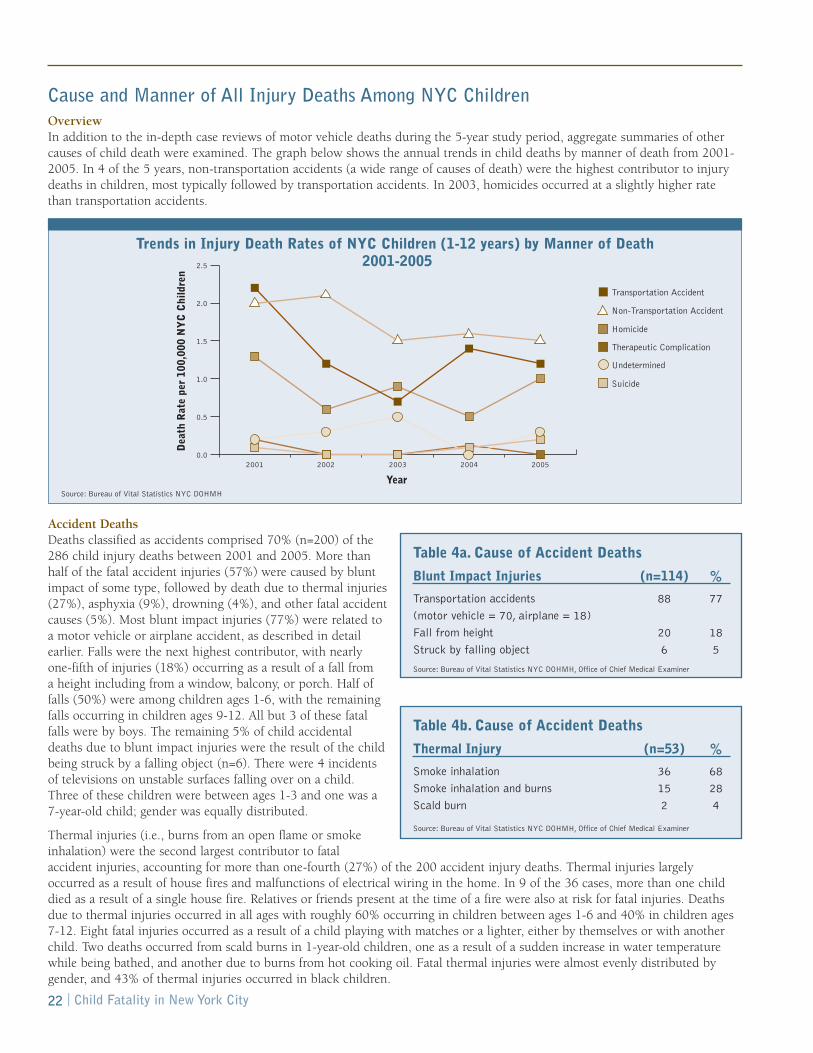
Cause and Manner of All Injury Deaths Among NYC Children Overview In addition to the in-depth case reviews of motor vehicle deaths during the 5-year study period, aggregate summaries of othercauses of child death were examined. The graph below shows the annual trends in child deaths by manner of death from 2001-2005. In 4 of the 5 years, non-transportation accidents (a wide range of causes of death) were the highest contributor to injurydeaths in children, most typically followed by transportation accidents. In 2003, homicides occurred at a slightly higher ratethan transportation accidents.
Accident Deaths Deaths classified as accidents comprised 70% (n=200) of the286 child injury deaths between 2001 and 2005. More thanhalf of the fatal accident injuries (57%) were caused by bluntimpact of some type, followed by death due to thermal injuries(27%), asphyxia (9%), drowning (4%), and other fatal accidentcauses (5%). Most blunt impact injuries (77%) were related toa motor vehicle or airplane accident, as described in detailearlier. Falls were the next highest contributor, with nearlyone-fifth of injuries (18%) occurring as a result of a fall from a height including from a window, balcony, or porch. Half offalls (50%) were among children ages 1-6, with the remainingfalls occurring in children ages 9-12. All but 3 of these fatalfalls were by boys. The remaining 5% of child accidentaldeaths due to blunt impact injuries were the result of the childbeing struck by a falling object (n=6). There were 4 incidentsof televisions on unstable surfaces falling over on a child.Three of these children were between ages 1-3 and one was a7-year-old child; gender was equally distributed.
Thermal injuries (i.e., burns from an open flame or smokeinhalation) were the second largest contributor to fatalaccident injuries, accounting for more than one-fourth (27%) of the 200 accident injury deaths. Thermal injuries largelyoccurred as a result of house fires and malfunctions of electrical wiring in the home. In 9 of the 36 cases, more than one childdied as a result of a single house fire. Relatives or friends present at the time of a fire were also at risk for fatal injuries. Deathsdue to thermal injuries occurred in all ages with roughly 60% occurring in children between ages 1-6 and 40% in children ages7-12. Eight fatal injuries occurred as a result of a child playing with matches or a lighter, either by themselves or with anotherchild. Two deaths occurred from scald burns in 1-year-old children, one as a result of a sudden increase in water temperaturewhile being bathed, and another due to burns from hot cooking oil. Fatal thermal injuries were almost evenly distributed bygender, and 43% of thermal injuries occurred in black children.
| Child Fatality in New York City22
Blunt Impact Injuries (n=114) %
Transportation accidents 88 77
(motor vehicle = 70, airplane = 18)
Fall from height 20 18
Struck by falling object 6 5
Table 4a. Cause of Accident Deaths
Thermal Injury (n=53) %
Smoke inhalation 36 68
Smoke inhalation and burns 15 28
Scald burn 2 4
Table 4b. Cause of Accident Deaths
Transportation Accident
Non-Transportation Accident
Homicide
Therapeutic Complication
Undetermined
Suicide
Year
Dea
th R
ate
per
100,
000
NY
C C
hild
ren
2001 2002 2003 2004 20050.0
0.5
1.0
1.5
2.0
2.5
Source: Bureau of Vital Statistics NYC DOHMH
Source: Bureau of Vital Statistics NYC DOHMH, Office of Chief Medical Examiner
Source: Bureau of Vital Statistics NYC DOHMH, Office of Chief Medical Examiner
Trends in Injury Death Rates of NYC Children (1-12 years) by Manner of Death2001-2005
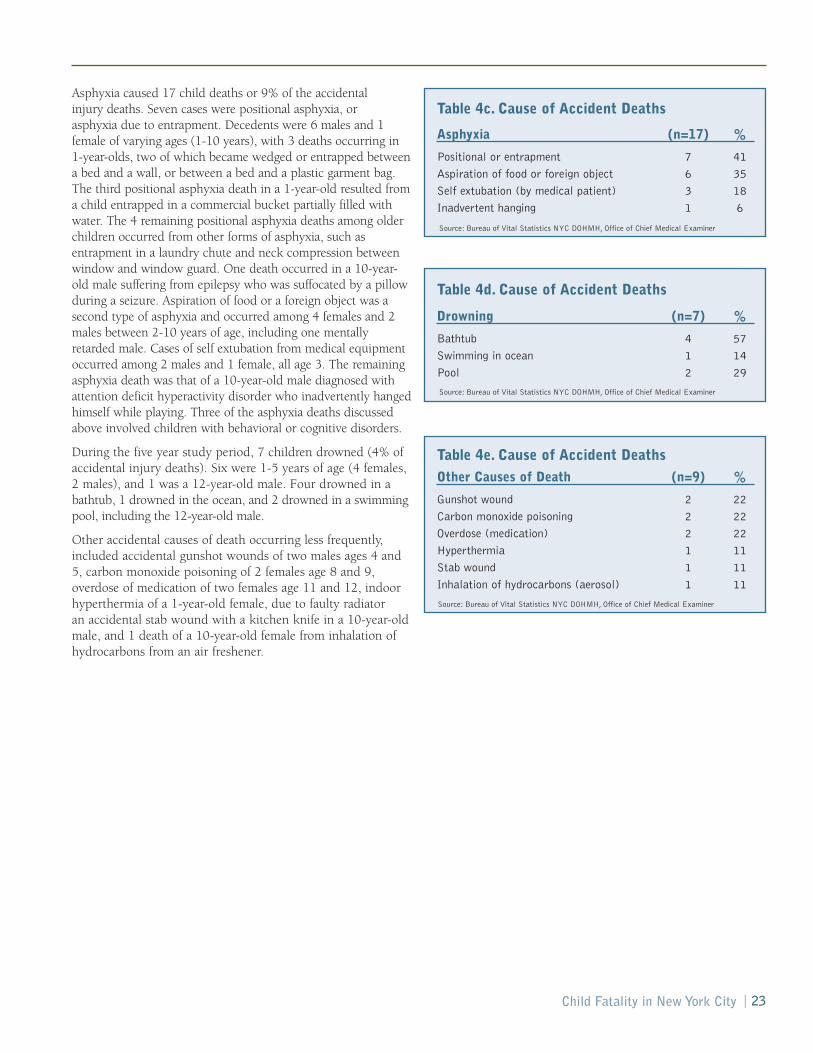
Asphyxia caused 17 child deaths or 9% of the accidental injury deaths. Seven cases were positional asphyxia, or asphyxia due to entrapment. Decedents were 6 males and 1female of varying ages (1-10 years), with 3 deaths occurring in 1-year-olds, two of which became wedged or entrapped betweena bed and a wall, or between a bed and a plastic garment bag.The third positional asphyxia death in a 1-year-old resulted froma child entrapped in a commercial bucket partially filled withwater. The 4 remaining positional asphyxia deaths among olderchildren occurred from other forms of asphyxia, such asentrapment in a laundry chute and neck compression betweenwindow and window guard. One death occurred in a 10-year-old male suffering from epilepsy who was suffocated by a pillowduring a seizure. Aspiration of food or a foreign object was asecond type of asphyxia and occurred among 4 females and 2males between 2-10 years of age, including one mentallyretarded male. Cases of self extubation from medical equipmentoccurred among 2 males and 1 female, all age 3. The remainingasphyxia death was that of a 10-year-old male diagnosed withattention deficit hyperactivity disorder who inadvertently hangedhimself while playing. Three of the asphyxia deaths discussedabove involved children with behavioral or cognitive disorders.
During the five year study period, 7 children drowned (4% ofaccidental injury deaths). Six were 1-5 years of age (4 females, 2 males), and 1 was a 12-year-old male. Four drowned in abathtub, 1 drowned in the ocean, and 2 drowned in a swimmingpool, including the 12-year-old male.
Other accidental causes of death occurring less frequently,included accidental gunshot wounds of two males ages 4 and5, carbon monoxide poisoning of 2 females age 8 and 9,overdose of medication of two females age 11 and 12, indoorhyperthermia of a 1-year-old female, due to faulty radiator an accidental stab wound with a kitchen knife in a 10-year-oldmale, and 1 death of a 10-year-old female from inhalation ofhydrocarbons from an air freshener.
Other Causes of Death (n=9) %
Gunshot wound 2 22
Carbon monoxide poisoning 2 22
Overdose (medication) 2 22
Hyperthermia 1 11
Stab wound 1 11
Inhalation of hydrocarbons (aerosol) 1 11
Table 4e. Cause of Accident Deaths
Source: Bureau of Vital Statistics NYC DOHMH, Office of Chief Medical Examiner
Child Fatality in New York City | 23
Asphyxia (n=17) %
Positional or entrapment 7 41
Aspiration of food or foreign object 6 35
Self extubation (by medical patient) 3 18
Inadvertent hanging 1 6
Table 4c. Cause of Accident Deaths
Drowning (n=7) %
Bathtub 4 57
Swimming in ocean 1 14
Pool 2 29
Table 4d. Cause of Accident Deaths
Source: Bureau of Vital Statistics NYC DOHMH, Office of Chief Medical Examiner
Source: Bureau of Vital Statistics NYC DOHMH, Office of Chief Medical Examiner

Homicides There were 60 child homicide cases between 2001-2005accounting for approximately one-fifth (21%) of all injurydeaths during the 5-year study period. Homicides affectedboys and girls similarly. More than half (55%) of all homicidevictims were ages 1-3 years old. Among racial and ethnicgroups, black children accounted for more than two-thirds(67%) of all homicide victims.
Among homicides, blunt impact injuries continued to be the most common cause of death in young children (n=14,23%). There were 10 child homicide fatalities by gunshotwounds, 7 stab-related deaths and 6 due to fatal child abusesyndrome, meaning that the child showed evidence of beingbattered over time. There were 8 homicide deaths due tosmoke inhalation, with or without burns from residential fires.Three child homicide deaths were due to drowning, 3 tosmothering, 2 due to a combination of shaking, whiplash, andblunt impact and 2 due to scald burns. Hanging, ingestion of atoxic substance (methadone), environmental hyperthermia as aresult of being left unattended in a car, dehydration, and sepsisdue to parental neglect were the cause of 1 child death each.
SuicidesFour child deaths were ruled to be suicides (1.4% of all injurydeaths), 3 females and 1 male. All occurred among the 10-12year age group. Of these, 3 occurred as a result of asphyxia byhanging. The fourth death occurred as a result of ingestion ofprescription medications.
Undetermined DeathsFrom 2001 through 2005, there were 18 deaths (6% of all fatal injuries) certified as undetermined manner of death.These deaths included drowning, blunt impact injuries of thehead, scald burns, and intoxication from medication. In 11 of these 18 cases (61%), the cause of death was also certified as undetermined. Some of these deaths were due to injuries that remained unexplained following postmortem examinationand death scene investigation.
| Child Fatality in New York City24
Suicide (n=4) %
Asphyxia by hanging 3 75
Ingestion (oxycodone and temazepam) 1 25
Table 6. Cause of Suicide Deaths
Undetermined (n=18) %
Drowning 3 17
Blunt impact 2 11
Scald burns 1 5
Intoxication from medication 1 5
Undetermined cause 11 61
Table 7. Cause of Undetermined Deaths
Source: Bureau of Vital Statistics NYC DOHMH, Office of Chief Medical Examiner
Source: Bureau of Vital Statistics NYC DOHMH, Office of Chief Medical Examiner
Homicide (n=60) %
Blunt impact injuries 14 23
Gunshot wounds 10 17
Stab or incised wounds 7 12
Blunt impact injuries and 6 10Fatal Child Abuse Syndrome
Smoke inhalation (arson) 4 6
Smoke inhalation and burns (arson) 4 6
Drowning 3 5
Smothering 3 5
Shaking, whiplash, and blunt impact 2 3
Scald burns 2 3
Hanging 1 2
Ingestion (methadone) 1 2
Environmental hyperthermia 1 2(left unattended in car)
Dehydration (parental neglect) 1 2
Sepsis (parental medical neglect) 1 2
Table 5. Cause of Homicide Deaths
Source: Bureau of Vital Statistics NYC DOHMH, Office of Chief Medical Examiner
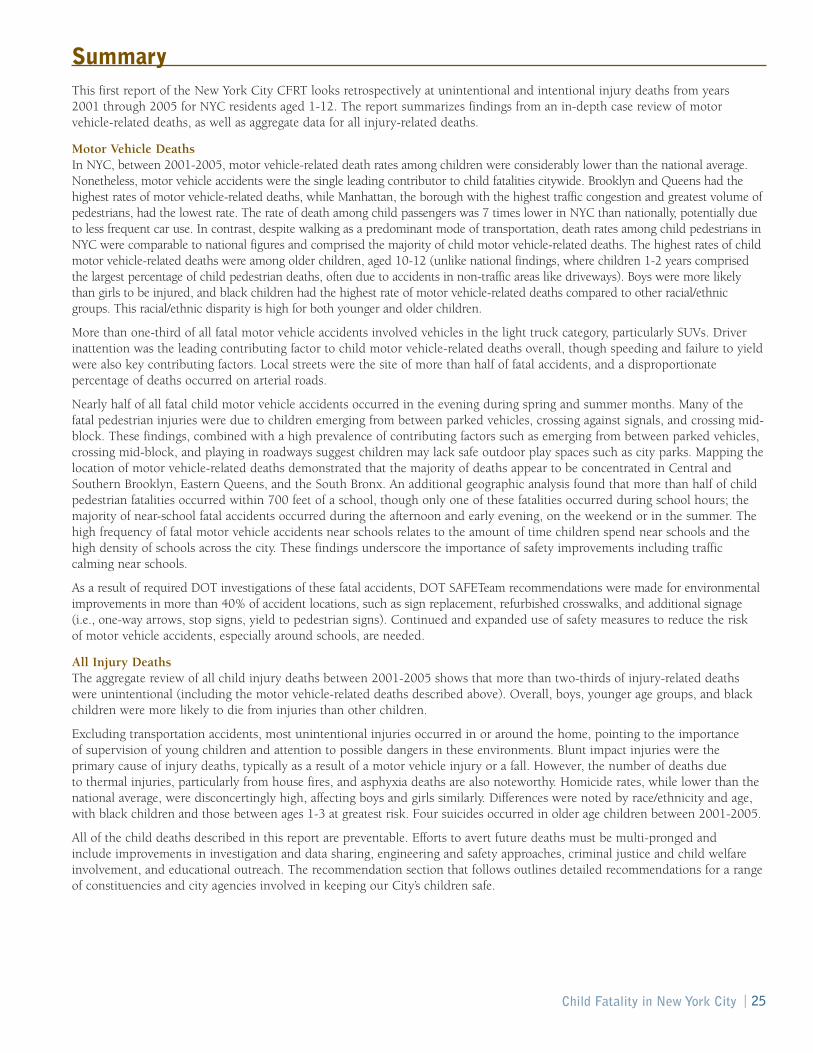
SummaryThis first report of the New York City CFRT looks retrospectively at unintentional and intentional injury deaths from years 2001 through 2005 for NYC residents aged 1-12. The report summarizes findings from an in-depth case review of motor vehicle-related deaths, as well as aggregate data for all injury-related deaths.
Motor Vehicle DeathsIn NYC, between 2001-2005, motor vehicle-related death rates among children were considerably lower than the national average.Nonetheless, motor vehicle accidents were the single leading contributor to child fatalities citywide. Brooklyn and Queens had thehighest rates of motor vehicle-related deaths, while Manhattan, the borough with the highest traffic congestion and greatest volume ofpedestrians, had the lowest rate. The rate of death among child passengers was 7 times lower in NYC than nationally, potentially dueto less frequent car use. In contrast, despite walking as a predominant mode of transportation, death rates among child pedestrians inNYC were comparable to national figures and comprised the majority of child motor vehicle-related deaths. The highest rates of childmotor vehicle-related deaths were among older children, aged 10-12 (unlike national findings, where children 1-2 years comprisedthe largest percentage of child pedestrian deaths, often due to accidents in non-traffic areas like driveways). Boys were more likelythan girls to be injured, and black children had the highest rate of motor vehicle-related deaths compared to other racial/ethnicgroups. This racial/ethnic disparity is high for both younger and older children.
More than one-third of all fatal motor vehicle accidents involved vehicles in the light truck category, particularly SUVs. Driverinattention was the leading contributing factor to child motor vehicle-related deaths overall, though speeding and failure to yieldwere also key contributing factors. Local streets were the site of more than half of fatal accidents, and a disproportionatepercentage of deaths occurred on arterial roads.
Nearly half of all fatal child motor vehicle accidents occurred in the evening during spring and summer months. Many of thefatal pedestrian injuries were due to children emerging from between parked vehicles, crossing against signals, and crossing mid-block. These findings, combined with a high prevalence of contributing factors such as emerging from between parked vehicles,crossing mid-block, and playing in roadways suggest children may lack safe outdoor play spaces such as city parks. Mapping thelocation of motor vehicle-related deaths demonstrated that the majority of deaths appear to be concentrated in Central andSouthern Brooklyn, Eastern Queens, and the South Bronx. An additional geographic analysis found that more than half of childpedestrian fatalities occurred within 700 feet of a school, though only one of these fatalities occurred during school hours; themajority of near-school fatal accidents occurred during the afternoon and early evening, on the weekend or in the summer. Thehigh frequency of fatal motor vehicle accidents near schools relates to the amount of time children spend near schools and thehigh density of schools across the city. These findings underscore the importance of safety improvements including trafficcalming near schools.
As a result of required DOT investigations of these fatal accidents, DOT SAFETeam recommendations were made for environmentalimprovements in more than 40% of accident locations, such as sign replacement, refurbished crosswalks, and additional signage(i.e., one-way arrows, stop signs, yield to pedestrian signs). Continued and expanded use of safety measures to reduce the risk of motor vehicle accidents, especially around schools, are needed.
All Injury DeathsThe aggregate review of all child injury deaths between 2001-2005 shows that more than two-thirds of injury-related deathswere unintentional (including the motor vehicle-related deaths described above). Overall, boys, younger age groups, and blackchildren were more likely to die from injuries than other children.
Excluding transportation accidents, most unintentional injuries occurred in or around the home, pointing to the importance of supervision of young children and attention to possible dangers in these environments. Blunt impact injuries were the primary cause of injury deaths, typically as a result of a motor vehicle injury or a fall. However, the number of deaths due to thermal injuries, particularly from house fires, and asphyxia deaths are also noteworthy. Homicide rates, while lower than thenational average, were disconcertingly high, affecting boys and girls similarly. Differences were noted by race/ethnicity and age,with black children and those between ages 1-3 at greatest risk. Four suicides occurred in older age children between 2001-2005.
All of the child deaths described in this report are preventable. Efforts to avert future deaths must be multi-pronged and include improvements in investigation and data sharing, engineering and safety approaches, criminal justice and child welfareinvolvement, and educational outreach. The recommendation section that follows outlines detailed recommendations for a rangeof constituencies and city agencies involved in keeping our City’s children safe.
Child Fatality in New York City | 25
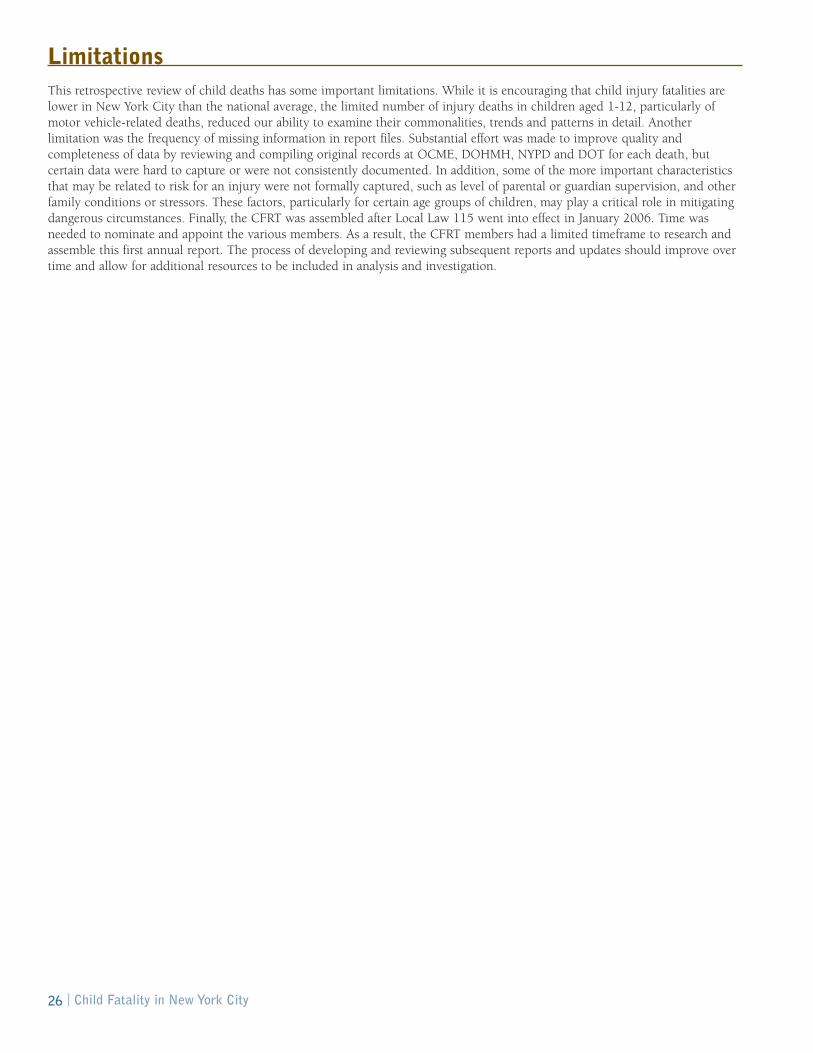
LimitationsThis retrospective review of child deaths has some important limitations. While it is encouraging that child injury fatalities arelower in New York City than the national average, the limited number of injury deaths in children aged 1-12, particularly ofmotor vehicle-related deaths, reduced our ability to examine their commonalities, trends and patterns in detail. Anotherlimitation was the frequency of missing information in report files. Substantial effort was made to improve quality andcompleteness of data by reviewing and compiling original records at OCME, DOHMH, NYPD and DOT for each death, butcertain data were hard to capture or were not consistently documented. In addition, some of the more important characteristicsthat may be related to risk for an injury were not formally captured, such as level of parental or guardian supervision, and otherfamily conditions or stressors. These factors, particularly for certain age groups of children, may play a critical role in mitigatingdangerous circumstances. Finally, the CFRT was assembled after Local Law 115 went into effect in January 2006. Time wasneeded to nominate and appoint the various members. As a result, the CFRT members had a limited timeframe to research andassemble this first annual report. The process of developing and reviewing subsequent reports and updates should improve overtime and allow for additional resources to be included in analysis and investigation.
| Child Fatality in New York City26
RecommendationsPreventing Transportation AccidentsBased on analyses of motor vehicle-related deaths between 2001 and 2005, committee members identified a number ofrecommendations, organized into five key areas. These recommendations are designed to increase child safety and ensurethorough investigation of future child deaths.
1. Infrastructure and Engineering Improvements• Continue implementation, where appropriate and effective, of engineering and traffic measures that enhance pedestrian
safety and calm traffic including: expanding pedestrian crossing areas at intersections; giving pedestrians more time tocross intersections; building out sidewalks at intersections; creating high visibility crosswalks; installing speed reducers;and adding traffic signal enhancements, yield to pedestrian signs and marked medians.
• Use child transportation fatality data presented here to inform selection of the next round of priority schools for DOT’sSafe Routes to School program.
• Work with city, state, and federal funding sources to ensure funding for the Safe Routes to School program.• Support ongoing efforts by multiple city agencies to ensure that every New Yorker lives within a 10-minute walk
of a park or playground.
2. Education and Outreach• Identify best practices related to traffic safety awareness and messaging targeted at motorists, parents and children. • Support the creation of a traffic safety awareness website that would contain information, brochures, games and other
resources appropriate for a wide range of audiences. The website should be easily accessible through the nyc.gov portal.• Seek funding for periodic, city-wide traffic safety awareness campaigns.• Consider developing a traffic safety awareness campaign specifically targeted at children and their parents.• Consider enhancing “midblock crossing” and “parked car crossing” lessons in DOT safety education programs.• Support the expanded use of traffic safety curricula developed by DOT and DOE in additional public and private
school classrooms and other educational settings.• Ensure broader dissemination of existing DOT child traffic safety materials. Venues may include Parent Teacher
Association meetings, after school programs and health clinics. • Continue DOT safety education programs (Safety City, Traffic Safety Education: On the Road, bike helmet fitting
programs, parent safety awareness workshops) and support expansion of those programs.• Make safety materials available at ACS Preventive Services sites across the City.
For health care providers• Increase dialogue with targeted healthcare provider groups (i.e., pediatricians) through vehicles such as Webcasts
and events. • Target prevention messages and materials to members of regional chapters of the American Academy of Pediatrics and
the American Academy of Family Physicians.• Encourage providers to discuss traffic safety with parents and children over five. Providers should underscore
prevention messages by making education and awareness materials available. (Traffic safety resources can be ordered at: http://nyc.gov/html/dot/html/safety/safety_form.html)
3. Legislation• Pursue state legislation requiring that all large commercial trucks in New York City be equipped with cross-over mirrors.
These mirrors, commonly seen on school buses, increase a vehicle operator’s ability to see in front of the vehicle.• Pursue state legislation authorizing use of speed-enforcement cameras and expanded use of red-light enforcement cameras.
4. Data Collection, Analysis and Reporting• Improve data sharing and data reconciliation related to child fatalities among New York State and New York City
Departments of Transportation, New York Police Department and the New York City Department of Health and Mental Hygiene.
• Conduct a more detailed study of child and adult pedestrian fatalities and serious injuries in New York City.
The Child Fatality Review Team also made recommendations for continued efforts of the Team.
• Include an update on above recommendations within the 2008 annual committee report.
• Apply to become a New York State-approved local Child Fatality Review Team.
• Consider future case reviews of non-transportation deaths and undetermined deaths.
• Include content experts as needed to bolster future reviews of specific types of deaths.
Child Fatality in New York City | 27

Key Safety MessagesCertain strategies and safety practices on the part of all road users have been shown to increase child safety in trafficenvironments. Organized into four categories, these strategies and practices are detailed below.
Pedestrian Safety• Tell and show children to always look left, then right, then left again before crossing the street. • Stop, look and listen before crossing any street. • It is best to cross at crosswalks, where drivers expect to see people crossing. Stop, look and listen for traffic
before crossing even if the white walking figure is visible on the pedestrian signal.• Emerging from between parked cars can be especially dangerous. Children should use caution when playing on
streets with large amounts of parked cars. • Talk to children about important traffic signs and signals such as one- and two-way streets, pedestrian signals, stop
signs and stop lights. Help children understand how these signs and signals function for drivers and pedestrians. • Children under 10-years-old should only cross the street with a responsible adult. Young children should hold
an adult’s hand while crossing.• Children need to wear light or bright colored clothing and retro-reflective materials so they can be seen. • Children should never wear headphones or talk on cell phones while walking as these can be dangerous
distractions. • Look at the driver of a turning vehicle before you cross. Make eye contact with the driver before you step off
the curb and pass in front of a car.
Safety on Wheels (Bicycles, Skates, Skateboards and Scooters)• Children should always wear a properly fitted helmet and proper attire such as bright clothing and sneakers. • Vehicles should have safety equipment such as reflectors and bells. • Ensure that bicycles function properly (inflated tires, working brakes and a tight and straight seat). • In New York City, children aged 12 and under can ride their bicycles on the sidewalk. • Children should be encouraged to walk their bicycles across intersections.
Passenger Safety• Children need to be restrained in a car safety seat or booster seat until they are at least 4'9''. Parents and
caregivers should ensure that child safety seats are properly installed. • Children should ride in a rear-facing car seat until they are at least one-year-old and weigh at least 20 lbs.
For the best protection, keep babies in rear-facing car seats as long as possible.• Children and adults should wear a safety belt every time they are a passenger in a car. • It is safest for children to ride in the back seat. • Children and adults should always exit vehicles on the curb side of the street.
Driver Safety • Be attentive at to all road users (pedestrians, bicyclists and other motorists) when driving. • Maintain slower speeds near parks, schools and other locations frequented by children and be especially alert
for sudden dart-outs and mid-block crossings.• If you are driving a larger vehicle with a limited front site line, be especially cautious at intersections as you
may not be able to see small children directly in front of your vehicle.• Give pedestrians enough space to cross. Stop before the crosswalk, not in it.• When making a turn, look for both vehicle traffic and pedestrians.
Source: DOT
| Child Fatality in New York City28

Ongoing City Initiatives to Improve Child Safety Almost every New Yorker must navigate the City’s streets and sidewalks at some point during his or her day. To ensure the safety of its residents, New York City has undertaken a number of measures to make transportation as safe as possible,particularly for children.
Educational InitiativesSchool-Focused ProgramsSafety City: This program provides interactive lessons and hands-on practice to third grade students at one of six Safety City locations. Each location is equipped with a simulated city street intersection where students learn how to make safe choices when walking outside, riding in a car, riding a bicycle, or skating.
Traffic Safety Education: Safety educators visit elementary and intermediate schools and present interactive traffic safety lessons.
Traffic Safety Curriculum: Developed by the NYC Department of Transportation (DOT) and the Department of Education, this curriculum has been used in selected elementary schools in Region 11. The curriculum is currently being expanded.
Targeted Outreach to Schools in High Risk Areas: NYC DOT’s Safety Education division developed a plan to target elementary and intermediate schools within high risk precincts for outreach. All 145 schools selected for the 2005/2006 school year were served.
Theater Programs: Two theatre programs for elementary school children and teenagers present engaging programs thatemphasizing traffic safety.
Community-Focused ProgramsSafe Kids New York City: An award-winning coalition led by DOT’s Safety Education division. Members from hospitals, safetyand health care organizations, government agencies, community organizations, and corporations work together to preventunintentional injuries.
Youth Educating for Safety (YES): Through the YES program, students are trained to educate their peers about traffic safety.
Car Seat Education Program: DOT operates six car seat fitting stations and promotes the use of child safety seats.
Bicycle Helmet Fittings: The City hosts events to distribute and fit free bicycle helmets. DOT also provides free helmets andfittings at the six Safety City locations.
STOP-DWI: Coordinated by DOT, the program focuses on counter-measures to reduce drunken driving.
Educational Materials: A Traffic Safety Calendar, magazines, bookmarks, growth charts, brochures and flyers are prepared byNYC DOT and distributed in conjunction with other City agencies and elected officials.
Engineering InitiativesInfrastructure and Traffic CalmingDOT selects locations for study based on NYS accident data, as well as suggestions from communities, elected officials, and thePolice Department. The DOT develops and implements mitigation measures to improve safety at these locations, if feasible.
Pedestrian and Traffic Safety Improvements: Recent projects have targeted the Grand Concourse in the Bronx, the HenryHudson Parkway at 95th and 96th Streets in Manhattan, Queens Boulevard, the Ocean Parkway corridor in Brooklyn, andintersections across Staten Island. A full report on safety improvements can be found at www.nyc.gov/dot.
Pedestrian Bridges: In 2004, DOT completed a study of all 122 City pedestrian bridges. Slalom fencing and experimentalpedestrian activated traffic signals have been added at locations where the bridge does not terminate on a sidewalk.
School-Focused ProgramsSafe Routes to School: The City has focused on the safety of children where they are most prevalent: in the vicinity of schools.DOT identified 135 schools with the highest accident rates and issued comprehensive reports that provided short and long-termrecommendations for infrastructure improvements. Traffic safety maps were also produced for and distributed to all elementaryand middle schools (available online at www.nyc.gov/saferoutes). DOT is in the process of selecting and targeting an additional135 elementary and middle schools for safety improvements. Staff will also examine accident data around the City’s 400 highschools and select 40 with the highest accident rates for comprehensive study.
Other School Programs: DOT regularly installs speed reducers in the vicinity of schools with 60% of the city’s speed reducersnear schools. Additionally, DOT prioritizes replacement and repair of sidewalks around school facilities.
Child Fatality in New York City | 29
Technical Appendix
Data SourcesInjury deaths: Death certificates of all persons who died in NYC are collected and maintained by the DOHMH Bureau of Vital Statistics. For the years 2001through 2005, injury deaths of children 1-12 years of age were identified by underlying cause of death with International Classification of Disease 10 Codes (ICD-10). Deaths due to injuries and other external causes, such as therapeutic complications and sequelae of complications of medical and surgical care were identifiedusing the following codes: V01-V99, W00-W99, X00-99, Y00-Y89. CFRT staff abstracted de-identified demographic, accident and injury information from deathcertificates for the purpose of aggregate data analysis.
Motor vehicle-related deaths: All fatal accidents of children are examined by the Office of Chief Medical Examiner. (OCME). OCME information was reviewed byCFRT staff for all 70 motor vehicle transportation deaths among NYC children 1-12 years of age between 2001 and 2005. Motor vehicle-related child deaths wereidentified using the following International Classification of Disease 10 Codes: V02-V04, V09.0, V09.2, V12-V14, V19.0-V19.2, V19.4-V19.6, V20-V79, V80.3-V80.5, V81.0-V81.1, V82.0-V82.1, V83-V86, V87.0-V87.8, V88.0-V88.8, V89.0, and V89.2. Based on the Medical Examiner number found on the deathcertificate, OCME files were then reviewed and pertinent information abstracted. A data abstraction form was created using Microsoft Access. Documents examinedin OCME records included autopsy, postmortem examination and toxicology reports; police reports (MV-104, AIS, Supplemental Case Information and precinctreports); hospital reports; and ambulance call reports.
DOT Fatality Database: This database is initially updated from daily logs received from the NYPD Accident Investigation Squad (AIS). The log lists the fatalities bylocation and time of day, as well as the name, sex and age of the victim. Shortly thereafter, the AIS report and MV-104 police report is received. Additional key data(demographic information on person killed, and vehicle, environment and human factors contributing to the accident) from these reports are entered into thedatabase. Approximately once a month, the total fatality numbers, by mode, are reconciled with NYPD to ensure that the numbers agree. Select fields from thedatabase were used to describe the child fatalities studied in this report.
SAFETeam Reports: Fatal accidents are investigated by the DOT Severe Accident Forensic Evaluation Team (SAFETeam). SAFETeam is dispatched to fatal accidentsites to expedite priority regulatory repairs and recommend other corrective measures that may prevent future incidents. SAFETeam investigations examine fatalitylocations to determine how and why the accident occurred. For this report, CFRT staff provided DOT with a list of the fatal accident locations. DOT then did aquery on recommendations made as a result of SAFETeam investigations of these fatalities. Recommendations included addressing environmental improvements atmany of the accident sites.
Police Accident Reports: The NYPD Highway Patrol District Accident Investigation Squad (AIS) investigates vehicle, bicycle, and pedestrian accidents in which aperson is killed or seriously injured and likely to die. Police officers record information about fatal or non-fatal accidents on a two-page Police Accident Report.Fields on this form reflect the State Department of Motor Vehicle accident reporting requirements. Time and date of accident, demographic information on personkilled or injured, and vehicle, environmental and human factors contributing to the accident are key fields on this form. Officers also write evaluative summariesdetailing the accident.
US comparison data: National data on child fatalities come from the CDC’s National Center for Injury Prevention and Control Web-based Injury Statistics Queryand Reporting System (WISQARS) (http://webappa.cdc.gov/sasweb/ncipc/mortrate.html). Data accessed December 2006-April 2007.
Matching Files on Motor Vehicle-Related Child Deaths Cases of motor-related child deaths between 2001 and 2005 identified by DOT and NYPD were matched with those recorded by the DOHMH’s Bureau of VitalStatistics. Motor vehicle-related deaths were identified by underlying Cause of Death with the following International Classification of Disease 10 Codes: V02-V04,V09.0, V09.2, V12-V14, V19.0-V19.2, V19.4-V19.6, V20-V79, V80.3-V80.5, V81.0-V81.1, V82.0-V82.1, V83-V86, V87.0-V87.8, V88.0-V88.8, V89.0, andV89.2. Six deaths identified in the DOT Fatality Database did not have a clear death certificate match to the DOHMH Bureau of Vital Statistics. In these cases theaccidents occurred in NYC but involved a non-NYC child resident; and therefore were not included in the CFRT review. Through these multiple matches, a total of70 motor vehicle-related deaths were included in the final analysis.
Mapping ProceduresLocations of fatalities were geocoded using the NYC Department of City Planning’s Geosupport Desktop Edition Software 9.6.9. Geocoded addresses were thenmapped using ArcGIS 9.1. Fatalities that denoted something other than a geocoded street intersection or street address (i.e. 250’ from corner of Broadway andWorth St.) were first geocoded to the intersection and then offset the approximate distance noted in the table. Buffer distances were calculated at a specified distanceof the location to identify nearby facilities (i.e. schools, parks). Elementary schools, middle schools, and junior and senior high schools located within 700 feet of thesite of a fatal motor vehicle accident were also identified.
Additional Information Data analysis: Rate calculations conducted by the DOHMH Bureau of Vital Statistics were conducted using SAS 9.1. Analysis by dedicated CFRT staff wereperformed with Microsoft Excel 2003. 2000 Census information was used to compute rates.
CRFT meetings: CFRT meetings are closed to the public. All team members must sign a confidentiality statement before participating in the review process. Theconfidentiality statement specifically defines the conditions of participation and assures that members will not divulge information discussed in team meetings. Tofurther maintain confidentiality, identifying information in data and research reports has been omitted.
| Child Fatality in New York City30

